Embed Size (px)
Citation preview
TAKING PRISM ONE STEP FURTHER:THE REFRACTION METHOD TO DECOMPOSE ENERGY SAVINGS
Miriam L~ Goldberg, U.S. Energy Information Administration,and Margaret F@ Fels, Center for Energy and Environmental Studies,
Princeton University
ABSTRACT
A simple "refraction" method is developed to extract energyconservation trends from energy billing data~ With this methodology,energy savings estimated by the Princeton Scorekeeping Method (PRISM)are decomposed into physically meaningful components. In addition,indoor temperature changes are inferred, and the effect of such changeson energy savings is quantified@
The method is demonstrated in two test applications@ The first, toindividual-house billing data for a large number of gas-heated houses inWisconsin, suggests the dominant role of structural retrofitting in theenergy savings achieved by a low-income weatherization program. Thesecond application, to utility aggregate data for nearly one milliongas-heated houses in New Jersey, points to the importance of lowerthermostat settings in the years immediately following the oil embargo,and, since 1980, to a substantial decline in consumption by appliancesincluding water heaters $ More recently, the role of structuralretrofitting seems to be increasing, but a "takeback" effect due to aconcomitant increase in indoor temperatures may be eroding the resulting
While the refraction results must be interpreted with care, theirphysical reasonableness in these test cases reinforces the potential ofenergy data to enhance the understanding of energy conservation$
GOLDBERG AND FELS
TAKING PRISM ONE STEP FURTHER:THE REFRACTION METHOD TO DECOMPOSE ENERGY SAVINGS
Miriam L. Goldberg, UoSe Energy Information Administration,and Margaret F. Fels, Center for Energy and Environmental Studies,
Princeton University
INTRODUCTION
The Princeton Scorekeeping Method (PRISM) has been applied to heatingfuel billing data to evaluate energy conservation programs in a widevariety of contexts (Fels, 1986ab)0 Most of these studies have emphasizedthe usefulness of Normalized Annual Consumption (NAC), whose stabilitymakes it a particularly useful monitoring index. The other PRISMparameters, base level a, heating slope S, and reference temperature T, arecomparatively poorly determined, rendering inferences based on theseparameters somewhat uncertain (Rachlin et al@, 1986)0
It turns out that, when results for large numbers of houses areaveraged in some way, the individual parameters, a, Sand T, can offervaluable insight into the nature of conservation activities@ In thispaper, we describe how physical sources of energy savings can beidentified, and how indoor temperature changes can be inferred, fromchanges in the individual parameters of the PRISM model@ The resultingestimates of savings components must be interpreted with care, withattention to measures of the accuracy of the estimates and to the validityof assumptions required for the savings decomposition0
Extending the "PRISM" metaphor, we use the term nrefraction" for thedecomposition of NAC savings estimates into components attributable todifferent physical changes in the house$ The refraction method is testedhere on two data bases of gas-heated houses~ The first, from a low-incomeweatherization program in Wisconsin, consists of individual-house billingdata for 243 houses; the second, representing average natural gasconsumption for all gas-heated households in New Jersey, consists ofaggregate utility sales datae The analyses summarized here are describedin more detail in an earlier paper (Goldberg and Fels, 1986)$
REFRACTION OF PRISM RESULTS
The NAC index for estimation period k is given by:
( 1)
where Ho(Tk ) is the long-run heating degree-days computed to base lk@
GOLDBERG AND FELS
Taking the difference of Equation 1 between k=1 and k=2 gives the energysavings, NAC 1 - NAC2 , between periods 1 and 2 in terms of changes in theindividual parameters a, 8, and T, as follows:
NAC 1 - NAC2 = 365 (Qr,,-a2 ) + (8 1- 82) Ho + B [Ho (T,)-Ho (T 2)] (2)
- A -+ B + T
where
Ho :: [Ho(T,) -+ Ho (T 2)]/2 (3a)
and B :: (8, + 82 )/2 (3b)
For later use, we also define
( 30)
We use Equation 2 for the components analysis~ If, indeed, there is a dropin NAC, then the decomposition indicates the sources of observed energysavings, in terms of three physical components~ The base-level component(A) represents savings due to reduced temperature-independent consumption,and is simply the difference in the base-level estimate; the heating-ratecomponent* (B), the difference in heating slope multiplied by average longterm annual degree-days, attempts to isolate savings due to a decrease inheating slope; and the temperature component (T), the difference in longterm annual degree-days multipled by the average heating slope, representssavings resulting from a decline in reference temperaturee Formulae forcomputing the standard errors of these components are given in our earlierpaper~
In this study, we assume a, Sand T are derived from PRISM applied tothe heating fuel@ Obviously, the interaction between fuels should not beignored when more than one fuel (e@g&, gas and electricity) is used in ahouse by its furnace and its appliances~ We hope in future work to includethis interaction explicitly; for the time being, we will considerqualitatively the effects of possible changes in electricity consumption onthe refraction results we obtain for gas-heated houses~
Returning to Equation 2, it is tempting in a simplified physical modelof the heating fuel to associate the T-component with lowered thermostatsettings, the B-component with structural retrofits or furnace efficiency
i In previous work, B was termed the "shell componentn~ Since this termactually reflects changes in heating system efficiency as well as in shelltightness, we have adopted the more general term "heating-rate component"o
GOLDBERG AND FELS
improvements, and the A-component with decreased appliance usage orincreased appliance efficiency for appliances fueled by the heating fuel~
To examine the extent to which these associations are valid, we take acloser look at the physical effects likely to induce changes in a, 8 and,especially, To
THE TEMPERATURE COMPONENT
Changes in the reference temperature l are likely to reflect changesin the indoor temperature T.. However, T. is not the only factor whichaffects To In the PRISM ~gdel, l is inte~Breted as the maximum averagedaily outdoor temperature at which the furnace is required 9 Thistemperature is lower than the indoor temperature because some of thehouse's heating requirement is met by intrinsic gains Q, from occupants,appliances, and the sun. The difference between T. and l depends also onthe house's "lossiness" L, which is the product otnthe heating rate Bandthe furnace efficiency, i.e0'
(4)
Differentiating Equation 4, then sUbstituting T.n-T for Q/L in theresulting expression, we obtain the following first-oraer approximation:
Defining ~L = l1-T2' a positive change indicates a drop in T, and thus achange in the direction of conservation$ The first term, ~Tin' indicateshow a thermostat setback might translate directly into a reduction in ToThe terms in ~L and ~Q, respectively, indicate how interventions such ashouse tightening and more efficient appliances might affect To
Conversely, Equation 5 allows us to see what a drop in T implies abouta drop in Tin' depending on how lossiness L and intrinsic gains Q havechanged~ To estimate ATin from PRISM estimates therefore requires not only~l but also information about Land Qo The needed information can beinferred from the parameters ~ and S, provided some additional assumptionsare made~
First, assuming no change in the furnace efficiency, the relativechange in lossiness, ~L/L, is well approximated by ~6/Se Furnaceefficiency improvements and decreased lossiness would both lower B, sothat I~a/SI becomes an overestimate of I~L/LI if furnace efficiency hasincreased@
Second, assuming that appliances represent the main source ofintrinsic gains, and that the change in the energy consumed by appliancesis essentially uniform across fuels (e.g$' for gas and electric appliancesin a gas-heated house), the relative change in intrinsic gains, 6Q/Q, maybe approximated by ~~/~0 If, instead, appliances fueled by the heating
GOLDBERG AND FELS
fuel contribute only a small fraction of Q, with the dominant sources of Qbeing sun, people, and unchanged appliances, this approximation overstates~Q/Q.
With the above assumptions about ~L/L and 8Q/Q, Equation 5 gives:
where 0, the temperature offset, is defined as:
and 8 and a are defined in Equation 30 As a starting point, we useo = 3egOC (7°F). However, the dependence of the temperature offset 0 on Land on Q suggests the importance of exploring the effects of differentassumptions about 0 by applying Equation 6 over a range of o-values~ Thevalidity of the approximations, ~L/L ~ 88/8 and 6Q/Q ~ 8a/a, and the effectof varying these assumptions, should also be considered@
Equation 6 indicates the extent to which energy savings have beeneither augmented or diminished by indoor-temperature changes. To carry theanalysis one step further, the temperature shift ~Tio can be translatedinto a quantifiable energy savings or 10ss0 ThlS translation isaccomplished by comparing the observed NAC for the second period, NAC2 ,with the NAC that would have been realized if the indoor temperature had,not changed~ The latter, hypothetical NAC2 is determined by replacing L2with L2 + ~Tin in Equation 1 (with k=2)@ Thus, the energy impact of ashift in indoor temperature is given by:
(8)
Unlike thechanges inquantity TBtemperature
T in Equation 2, which incorporatesall the factors affecting the reference temperature T, thegiven by Equation 8 isolates the effect of changing indoorTin~
It is well known that a temperature benefit, or positive savings TB,can be obtained simply by turning down the thermostat, even in the absenceof any improvement in the house structure or appliances. On the otherhand, economists have conjectured that a takeback (negative TB) might occurafter a house has been made more energy efficient, analogous to choosing todrive more after buying a more fuel-efficient car$ Equation 8 gives abasis for assessing the extent to which such takeback behavior may beoccurringe
GOLDBERG AND FELS
The refraction approach, in summary, involves three steps:
1) separate the estimated savings for a group of houses intothree physically meaningful components, A, B, and T;
2) estimate the concomitant change in indoor temperature,using Equation 6, and convert this temperature changeinto energy savings (temperature benefit) or loss(takeback), i~e~, TB, using Equation 8;
light ofchangesshell,
3) interpret each estimatepossible conservationaffecting the house'sfurnace, and thermostat~
(A,B,T, and TB) inactions, includingappliances, building
For all components, the estimation errors, and the sensitivity to a rangeof possible assumptions, need to be considered~
APPLICATION TO INDIVIDUAL HOUSES
The refraction method was applied to each house in a group of 243"Good Houses" resulting from the PRISM inalysis of Wisconsin's low-incomeweatherization program (Goldberg, 1986)~ These houses were weatherized in1982 under a program administered by the Wisconsin Department of Health andSocial Services. While the work done varied considerably across houses,the emphasis was on sealing windows and doors, and installing insulationeThe median savings for these houses were 10% of the pre-retrofit NAC, ascompared with 2% for a set of "Good-House" control houses. Only thetreated (weatherized) houses are analyzed here; since the savings in thecontrol group were small, we felt that a decomposition of those savingswould not be very meaningful. The refraction results thus represent adecomposition of the total savings, without regard to whether the savingsare attributable to the program or to external eventse
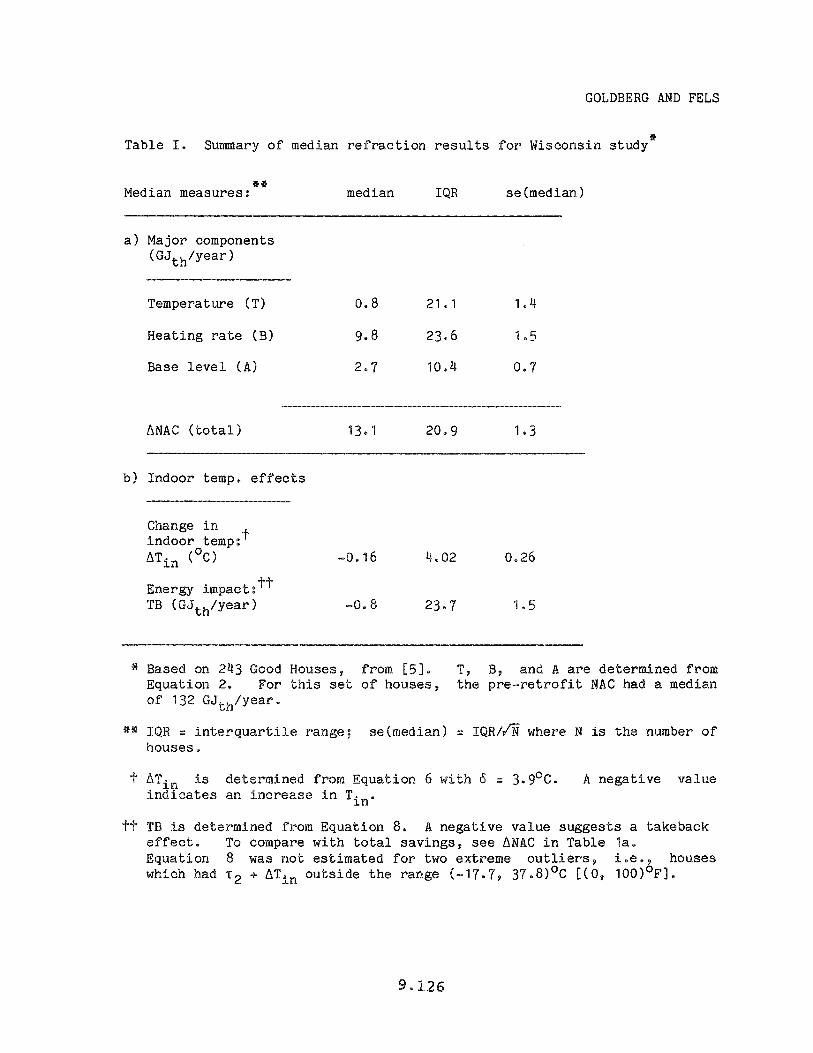
The median results of computing the base-level (A), shell (B), andtemperature (T) components for this set of 243 houses are summarized inTable Ia~ Comparing each median to its standard error indicates whichchanges, averaged over the entire group, are significantly different fromzero~ The interquartile ranges (IQR) show clearly the broad distributionof each component's estimates across these 243 houses, as well as therelative contribution of each component to the total savings~ The medianestimate of total savings is 13~1 GJth/year (124 therms/year), which, asmentioned earlier, represents about 10% of the pre-weatherization
* The Good-House restrictions, that the pre- and post-weatherizationperiods each have at least ten actual meter readings and R2 values fromPRISM fits of the data which are greater than O~90, ensure that therefraction method is applied only to houses for which the individualparameters are likely to be physically meaningful0
GOLDBERG AND FELS
consumption level. The heating-rate component, with a median of 908GJth/year, is by far the dominant contributor to these savings; sincevirtually no heating system work was performed in this group of houses,this component can reasonably be regarded as a shell effect. Changes inbase level, with a median of 2.7 GJth/year, are small but stillsignificant, and temperature effects, with a standard error larger than themedian of 0.8 GJth/year, are not significant. The dominance of the shelleffect is reasonable, since most of the weatherization work done in thesehouses had to do with shell tightening.
The apparent lack of temperature effects can be explored further usingEquations 6 and 8. The resulting estimates of indoor temperature changes(~Tin) and takeback effects (TB) are summarized in Table lb. The median~Tin estimate is -0.20 C, indicating a slight temperature increase. Thischange is small in absolute terms, and also small compared to the standarderror of the median, 0.30C. Overall, then, for this group of 243 houses,no significant change in indoor temperature appears to have occurred, eventhough individual households may have raised or lowered their indoortemperatures appreciably, as indicated by the large range (IQR). When thetemperature changes are converted house by house to energy savings, i.e.,to TB via Equation 8, the resulting median takeback effect appears to benot significant@
These qualitative results were corroborated by re-estimating TB, thetakeback effect, using different assumed temperature offsets 0, and byvarying assumptions about ~Q/Q and ~L/L in Equation 6 for 6Tin (seeGoldberg, 1986)@ None of the resulting median estimates of takeback effectwas nominally significant0 Thus, even though the largest median takebackestimate (2@4 GJth/year) is 18% of the total median savings of 13.1GJth/year, attent10n to the uncertainties of the estimate shows theevidence for a takeback effect to be weak. The overall conclusion fromthis refraction analysis of the set of Wisconsin houses is the dominance ofshell tightening in the total savings achieved, with very little, if any,of the savings being taken back by an increase in indoor temperatures.
Another , at Oak National Laboratory, found similar resultsin a data set of "clean" electrically heated houses analyzed by PRISM aspart of an evaluation of a Bonneville Power Administration (BPA) program(Hirst and White, 1985)@ The estimated mean increase in indoor temperaturewas O~2oC for 97 houses receiving retrofits in 1982 and 0.6oC for 113houses receiving retrofits in 1983. (A value of 8 = 4°C was assumed~)Only the latter change was statistically significant; the associatedtakeback effect amounted to 25% of the total energy saved in the 1983participant group$ The reason for the different results in the two sets ofhouses, which received similar retrofits in two successive years, is notevident, particularly since no significant takeback effect was found ineither year in the 32-house nonparticipant group$
Returning to our Wisconsin data base, the large IQR's in Table I showthe great variability of estimated components and indoor temperatureeffects across the group of houses studied. Much of this variabilityacross houses comes from uncertainty in the original parameter estimates ~,
GOLDBERG AND FELS
B and To Because these parameters and their associated components areinherently less well determined than the total NAC savings, applying therefraction method to individual houses is likely to give some erraticresults. Therefore, the method is considerably more suitable for analysisof large groups of houses than for analysis of a single house or a smallnumber of houses.
While an increase in indoor temperatures is tantalizing in view of itspossible impact on energy conservation, the evidence for the smalltemperature changes discussed thus far is inconclusive, even with a groupof nearly 250 houses. With a more dramatic change, or with a substantiallylarger data set, particularly one that spans more time, a clearer pictureof trends in temperature settings might emerge. To this end, we turn to aPRISM refraction of a very large set of houses, consisting of all gasheated houses in the state of New Jersey~
APPLICATION TO AGGREGATE CONSUMPTION
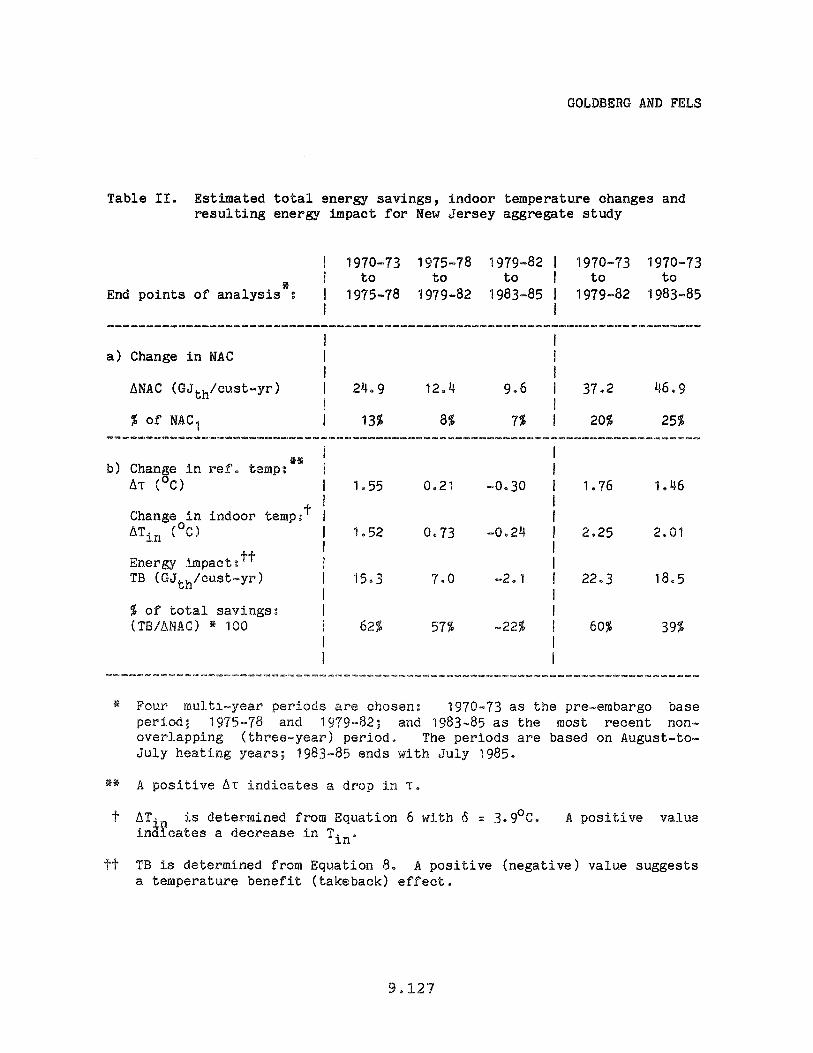
For the refraction analysis of aggregate gas consumption in NewJersey, we start with four-year estimates of NAC and of the model's threeindividual parameters, for 1970-73 through 1982-85 (see Fels and Goldberg,1986)@ Table IIa shows the absolute and percentage change in NAC betweensuccessive periods@ Over the entire period, consumption has declined by atotal of 47 GJth (440 therms) per customer-year, or by 25% when comparedwith the pre-embargo (1970-73) levele
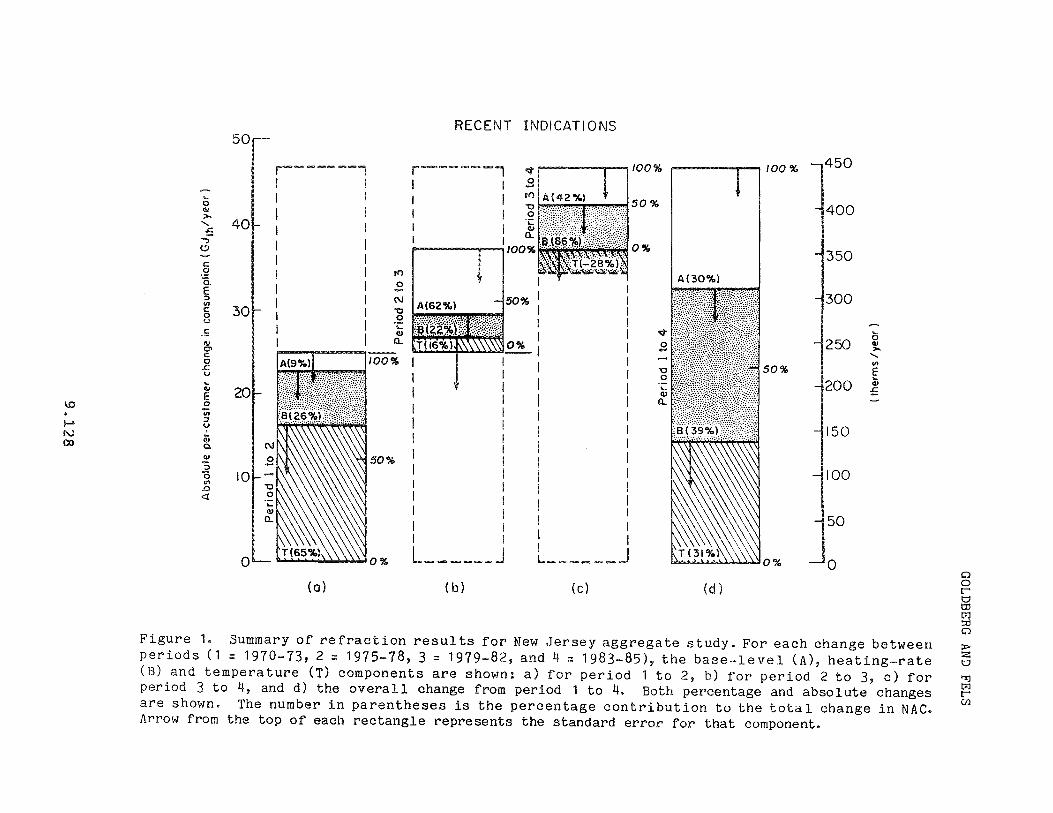
The three components of the energy savings (A, Band T in Equation 2),together with their standard errors, are summarized in Fig. 1@ From 197073 to 1975-78 (Fig. 1a), the temperature component (T) accounts for abouttwo-thirds of the 13% decline in NAC. From 1975-78 to 1979-82 (Fig~ 1b),the base-level component (A) dominates the 8% decline in NAC. For bothperiods, the shell component (B) contributes only about a quarter of thechange in NAC& Over the entire decade, from 1970-73 to 1979-82, about 50%of the total energy savings is thus attributed to the temperature component(T), and about 25% each to the base-level (A) and shell (B) components@
The more recent results indicate a persistence in the decline of baselevel consumption but a shift in the other trendse Figure 1c shows adramatic increase in the role of the shell component (B), reflecting anaccelerated drop in heating slope from 1979-82 to 1983-85. On the otherhand, the temperature component (T) in the most recent period has changedsign due to a slight increase in reference temperature (by 0.30 C). Betweendifferent adjacent periods since the embargo, different components havedominated: first T, then A, and now B, as we progress across Figs. 1a, 1b,and 1c. Over the entire period since the embargo, from 1970-73 to 1983-85(Fig@ 1d), the division of the savings among the three components hasbecome fairly even*
The standard errors shown in Fig~ 1 allow a rough assessment of thesignificance of the components~ Although the standard errors of the totalsavings are small (~ 2 GJth for 6NAC from one four-year period to another),
GOLDBERG AND FELS
the standard errors of the individual components are much larger (~ 6 GJthfor T, and ~ 4 GJth each for B and A). On a relative scale, the standarderror of ~NAC between any two periods is in all cases less than 20% of theestimate of ~NAC, whereas the relative standard error for an individualcomponent is occasionally larger than the estimate itself. In Figs. 1abc,only the largest component of the total change between two adjacent periodsappears significant by itself: T for period 1 to 2, A for period 2 to 3,and B for period 3 to 4. For the longer interval Fig. 1d, all componentsare sufficiently large to be reasonably well determined. Therefore, whileneither the individual parameters a, 8, and l nor the individual componentsA, B, and T are estimated with great precision, it seems possible toidentify, with some degree of certainty, the dominant sources of energysavings from one period to another@
*Perhaps the most interesting trend is in the temperature component T.Table lIb summarizes the resulting aggregate estimates for the change inindoor temperature (~Tin) and its effect on energy savings (TB), betweenthe main multi-year per10dso
In the earlier period from 1970-73 to 1975-78, the aggregate drop inTin of 1.50 C is well estimated by the PRISM estimate, ~T = 1.60 c@ Theassociated temperature benefit (positive TB) is 15 GJth/year, suggestingthat the drop in indoor temperature was responsible for over 60% of thetotal savings achieved by the aggregate in that period$ Not surprisingly,this estimate for TB is similar in magnitude to the temperature componentT, since ~Tin ~ ~T~ In the next period, from 1975-78 to 1979-82, thedecrease in Tin of 0070 C is underestimated by ~T (= 0.2oC); i~eo, due tothe concomitant decline in a, Tin drops by more than just ~T would imply 0
The associated value of TB is .( GJth/year, again giving a temperaturebenefit of about 60% of the aggregate savings& Note that in this period TBis much larger than T, which was only 16% of the total savings@ Therefore,over the entire decade from 1970-73 to 1979-82, a persistent decline inindoor temperature is indicated, with about 60% of the overall savingsattributable to this decline&
In Table lIb, the only increase in indoor temperature, or negative~Tin' is for the most recent period, from 1979-82 to 1983-85@ Theassociated negative estimate for TB indicates a takeback effect of 2.1GJth/year, and thus that the savings in this period would have been about20~ larger in the absence of the temperature increase~ When the entirepost-embargo period is considered, from 1970-73 to 1983-85, this reversalhas little effect on the overall drop in indoor temperature: the estimatesfor ~Tt.n and TB are very similar to what they were for the post-embargodecade "1970-73 to 1975-78)~
The results in Table lIb assume 0 = 3@90C in Equation 6~ We have alsorepeated the calculations with values of 0 from 2.2 to 7.8 °c (4 to 14 OF),and, where warranted, without the ~a/a term in Equation 8 (in order to vary
* Candidate reasons for the large recent base-level component (A) areexplored in Goldberg and Fels (1986)&
GOLDBERG AND FELS
the ~Q/Q assumption). The resulting sensitivity analysis confirms thetentative conclusions drawn from Table lIb (see Goldberg and Fels, 1986)0
We are led to an intriguing hypothesis, that structural and furnaceretrofitting (through a large positive shell component B) is beginning totake hold in New Jersey, but that its potential is being eroded slightly bya takeback effect (through negative TB) resulting from a return to higherindoor temperatures. The overall trend since the embargo may be a gradualshifting of the dominating conservation source from a decline in indoortemperatures to shell tightening. This hypothesis makes sense in view ofthe longer lead times needed for structural retrofitting than forthermostat setbacks.
Albeit with large uncertainties, this decomposition of totalconsumption trends has intriguing policy implications for New Jersey. Thepossible strong role of lower thermostat settings in post-embargoconservation, and the relatively minor, though growing, role of structuralretrofitting, translates into optimism that much greater energy benefitsfrom retrofitting are yet to be achieved. Very recent results, through thesummer of 1985, urge caution, in that some of those benefits alreadyachieved are possibly being reversed by a return to higher indoortemperatures. Continued analysis of New Jersey data and similar analysesof data bases in other states are needed to test the validity of theseinferences $
CONCLUSION
As long as the uncertainties of the estimates are carefully assessed,the PRISM refraction approach seems useful for refining thecharacterization of conservation in large groups of houses 0 Two testapplications, one to individual-house billing data and one to utilityaggregate sales data, demonstrate the added insight available from thiscloser look at PRISM savings estimateso In both cases, a dominant role fora single component is suggested, namely, shell tightening in the former anddeclining indoor temperatures in the latter~
Particularly in view of the far-reaching policy implications that mayresult, more testing is needed. This should be done with the aid ofsupplemental survey data, with which the assumptions required for therefraction method, and the resulting conclusions, can be validatedo Inaddition, the effect of a non-heating fuel on the results needs to beinvestigated 0 If other test applications are successful, the refractionapproach will allow the scorekeeper to take the information extractablefrom energy billing data one step further than was hitherto believedpossible@
M. FespecialSequoia,
GOLDBERG AND FELS
ACKNOWLEDGEMENTS
The development of this methodology, which was initially funded by amatching grant from the Ford Foundation and the New Jersey Department ofEnergy (NJDOE), has been continued by the New Jersey gas and electricutilities and NJDOE, through their establishment of the New Jersey EnergyConservation Laboratory at the Center for Energy and Environmental Studies,Princeton University. The New Jersey data were obtained from the NewJersey Energy Data System of NJDOE. The Wisconsin data were assembled atthe University of Wisconsin Statistical Laboratory under a contract withthe Wisconsin Department of Administration, with supplemental funds fromWisconsin Electric Power Co.; data processing was facilitated by access tothe University of Wisconsin Statistics Department's research computer. Theauthors would like to thank Andrzej Jaworski and Asit Banerjee forassistance in the Wisconsin data analysis, Cathy Reynolds for assiduouslyupdating the New Jersey results, and Michael Burnett, Laurent Hodges, andRobert Socolow for insightful comments throughout the study.
REFERENCES
Fels, ed*, Measuring Energx Savings: the Scorekeepin~ Approach (adouble issue of Eners~ and Buildings, 2, #1-2), Elsevier
Lausanne, Switzerland (1986a) 180 ppe
M~ Fl& Fels, "PRISM: An Introduction", Energy and Buildings, 2" 111 (1986b)PP e 5-18@
M@ F@ Fels and Me L. Goldberg, "Using the scorekeeping approach to monitoraggregate energy conservation", Energl and Buildings, 2, #2 (1986) ppe 161168~
M@ L@ Goldberg, ViA Midwest low-income weatherization program seen throughPRISM", ~nergy and #1 (1986) ppe 37-44$
Me L. and M@ F. Fels, "Refraction of PRISM results into componentsof saved energy", and 2, #2 (1986) pp@ 169-180 •
D@ Halliday and R. Resnick, Physics for Students Science andPart II, John Wiley & Sons, New York (1960), pp. 181-185.
E@ Hirst and D@ White, "Indoor Temperature Changes after Retrofit:Inferences Based on Electricity Billing Data for Nonparticipants andParticipants in the BPA Residential Weatherization Program", Oak RidgeNational Laboratory, Report NOe ORNL/CON-182, Oak Ridge, TN (1985)~
J~ Rachlin, Mi?i Fe Fels and R. H. Socolow, "The stability of PRISMestimatea", Energy and Buildings, 2, 112 (1986) pp ~ 149-157 e
GOLDBERG AND FELS
Table Io Summary of median refraction results for Wisconsin study·
**Median measures:
a) Major components(GJth/year)
Temperature (T)
Heating rate (B)
Base level (A)
median
0.8
IQR se(median)
1.4
T, B, and A are determined fromthe pre-retrofit NAC had a median
l\NAC (total) 1301 20.9 1.3
b) Indoor temp. effects
Change inindoor temp:tl.\Tin (oC) -0016 4*02 0.26
Energy impact: ttTB (GJth/year) -0@8 23~7 1~ 5
* Based on 243 Good Houses, from [5]eEquation 2. For this set of houses,of 132 GJth/year@
** IQR = interquartile range; se(median) = IQR/IN where N is the number ofhousese
t ~T9n is determined from Equation 6 with 0 = 3.90C$inaicates an increase in Tin"
A negative value
TB is determined from Equation 8. A negative value suggests a takebackeffecte To compare with total savings, see ~NAC in Table 1a$Equation 8 was not estimated for two extreme outliers, i.e., houseswhich had l2 + ~Tin outside the range (-1707, 37.8)oC [(0, 100)oF]*
GOLDBERG AND FELS
Table II~ Estimated total energy savings, indoor temperature changes andresulting energy impact for New Jersey aggregate study
*End points of analysis :
a) Change in NAC
6NAC (GJth/cust-yr)
%of NAC,
b) Chan~e in ref. temp:-*61' ( C)
Change in indoor temp~Tin (oe)
Energy impact: ttTB (GJth/cust-yr)
% of total savings:(TB/LiNAC) * 100
1970-73to
1975-78
24.9
13%
1503
62%
1975-78to
1979-82
8%
57%
1979-82to
1983-85
-Oe24
-22%
1970-73to
1979-82
60%
1970-73to
1983-85
2.01
39%
* Four are chosen: 1970-73 as the pre-embargo baseperiod; 1975-78 and 1979-82; and 1983-85 as the most recent nonoverlapping (three-year) period. The periods are based on August-toJuly heating years; 1983-85 ends with July 19850
** A positive indicates a drop in T~
t ~Tip is determined from Equation 6 with 0ind1cates a decrease in Tine
A positive value
TB is determined from Equation 8~ A positive (negative) value suggestsa temperature benefit (takeback) effecte
50RECENT INDICATIONS
Figure 1~ Summary of refraction resul ts for New Jersey aggregate studye For each change betweenperiods (1 = 1970-73,2 = 1975 ..... 78, 3 :: 1979-82, and 4 :: 1983-85), the base-level (A), heating ..... rate(B) and temperature (T) components are shown: a) for period 1 to 2, b) for period 2 to 3, c) forperiod 3 to 4, and d) the overall change from period 1 to 4. Both percentage and absolute changesare shown. The number in parentheses is the percentage contribution to the tota 1 change in NACeArrow from the top of each rectangle represents the standard error for that component$
oocoto~:0Q
:J>Zot-:EJtx:lcUl
400
350
300
-250
0OJ>.
........enE
200 Q;:£-
150
100
50
a
450
A(30%)
lit"""", a, "0%
i • 1/00%
IIIIII II IIL J
Vi i ,100%o...
50%
(b)
IIIIIIIIIIIII I_____ J
r-----IIIII
ft')
.EN"0o'':tV0..
50%
(0)
--~--I
',.", », )'}'O%
iii 1/00""
'W~I!{\'llrlf~(1( ( (i(
N
.s101--
"00~
Q)
I
Q
0
20
30
40
0fJJ>-
.......:5~
C)-c.2a.E::»Vic0u.E~c0.cu
tE0\D -:n:,)
e
Ut
1-£
t~
a.00Q)
"S'0CIt.0«