Embed Size (px)
Citation preview
Loughborough UniversityInstitutional Repository
Talc as a nucleating agentand reinforcing filler in
poly(lactic acid) composites
This item was submitted to Loughborough University's Institutional Repositoryby the/an author.
Citation: SHAKOOR, A. and THOMAS, N.L., 2014. Talc as a nucleatingagent and reinforcing filler in poly(lactic acid) composites. Polymer Engineeringand Science, 54 (1), pp. 64�70.
Additional Information:
• This article was published in the journal, Polymer Engineering and Science[ c© Society of Plastics Engineers] and the definitive version is available at:http://dx.doi.org/10.1002/pen.23543
Metadata Record: https://dspace.lboro.ac.uk/2134/13942
Version: Accepted for publication
Publisher: John Wiley & Sons, Inc c© Society of Plastics Engineers
Please cite the published version.
This item was submitted to Loughborough’s Institutional Repository (https://dspace.lboro.ac.uk/) by the author and is made available under the
following Creative Commons Licence conditions.
For the full text of this licence, please go to: http://creativecommons.org/licenses/by-nc-nd/2.5/
1 | P a g e
Talc as a Nucleating Agent and Reinforcing Filler in Poly Lactic Acid
(PLA) Composites
A. Shakoor and N. L. Thomas,
Department of Materials, Loughborough University, Loughborough, Leicestershire,
LE11 3TU, UK
ABSTRACT
The effect of talc on the crystallinity and mechanical properties of a series of
polylactic acid (PLA) / talc composites has been investigated. The composites were
prepared by melt blending followed by compression moulding. It was found that talc
acted as a nucleating agent and increased the crystallinity of the PLA from 2% to
25%. There was significant improvement in Young’s modulus of the composites with
increasing talc addition and these results were found to fit the Halpin Tsai model.
Thermo-mechanical tests confirmed that the combination of increased crystallinity
and storage modulus leads to improvement in the heat distortion properties.
INTRODUCTION
Due to increased environmental awareness and a growing concern about the disposal
of plastic waste, there has recently been a rising demand from consumers for
biodegradable polymers. Many of these polymers are also derived from renewable
resources, such as plant-based feedstocks or from bacterial fermentation. Hence these
materials meet the requirement of being derived from replacements to fossil fuel
feedstocks in addition to addressing growing concerns about end-of-life disposal
issues and the need to find alternatives to landfill.
One such polymer is poly(lactic acid) (PLA)1,2. It is a versatile, compostable polymer,
produced from lactic acid that is obtained by fermentation of carbohydrate, which is
derived from renewable resources such as corn and sugar beet. PLA is produced
commercially by ring-opening polymerisation of the lactide, which is a cyclic ester
composed of two lactic acid units. Lactic acid contains an asymmetric carbon atom
and therefore exists in two optically active isomers (D and L). Hence three optically
2 | P a g e
isomeric forms of lactide are possible: L-lactide (a dimer of L-lactic acid), D-lactide
(a dimer of D-lactic acid) and meso-lactide (a dimer of L- and D-lactic acid). The
crystallisable content of PLA is determined by the ratio of L-, D- and meso- lactide in
the polymer: higher crystallinities are obtained with the more optically pure polymers
because of their higher chain symmetry. PLA also has a very slow rate of
crystallisation, which allows for a greater control over the crystalline content.
A major issue restricting the use of PLA is its poor technical performance compared
with many conventional polymers, particularly with respect to mechanical properties
and heat distortion temperature (HDT). For this reason a number of different
strategies have been adopted to improve the properties of PLA: these include both
blending PLA with other bioplastics and the incorporation of additives, such as fillers
and nanofillers, to produce composite materials. For example, PLA has been blended
with poly(caprolactone) (PCL) to increase its flexibility3,4 and with
poly(hydroxybutyrate) (PHB) to improve tensile properties and biodegradability5.
There is much interest in PLA nanocomposites because of the potential of
montmorrillonite nanofillers to improve the mechanical, barrier and biodegradation
properties of PLA6,7. More conventional fillers, such as talc, have been used for many
years as reinforcing fillers and nucleating agents in commodity polymers and talc has
the potential to provide significant and cost-effective improvements in PLA
formulations.
Talc is a hydrated magnesium silicate with the formula Mg3SiO10(OH)28. It has a
plate-like structure held together by weak Van der Waal’s forces, so that the talc
platelets can be delaminated at low shear stresses and are easy to disperse. Most
commonly, talc is added as a filler to isotactic poly(propylene) (PP). At low
concentrations (less than 3 weight %) it acts as a nucleating agent, reducing spherulite
size and shortening processing time9. At higher loadings (10 – 40 weight %) it acts as
a reinforcing filler, increasing tensile modulus and stiffness, but reducing strain-to-
break and impact strength10.
Talc has also been added as a filler to PLA. Addition of 2% talc was found to reduce
crystallisation half-times and resulted in a significant increase in crystallinity and
decreased processing time 11. Jain et al 4 investigated adding talc (1 – 5 weight %) to
3 | P a g e
blends of PLA and PCL. It was found that talc improved the miscibility and adhesion
between the PCL bulk phase and the PLA domains. Values of tensile and storage
modulus increased linearly with the talc loading. Fowlks and Narayan12 have
investigated PLA-talc composites compatibilized with maleic anhydride-
functionalized PLA, which acted as an interfacial additive and increased adhesion
between the PLA matrix and the talc filler.
In the current study, talc has been melt processed with PLA at addition levels of 10,
20 and 30 weight %. The morphology, thermal properties and mechanical properties
of these blends have been investigated. The aim of the study is to examine how talc
affects the crystallisability of PLA, to investigate the dispersion of the talc in the PLA
matrix and to model the effect of talc on the tensile modulus (Young’s modulus) of
the composites.
EXPERIMENTAL
Materials
PLA granules (HM1011) were supplied by Hycail BV (now Tate & Lyle, London,
UK). The weight average molecular weight (Mw) of the PLA was found to be 224 x
103 g/mol as determined by gel permeation chromatography (GPC). Its specific
gravity was 1.24 g/cm3.
Talc (JetFine 3CC) was supplied by Luzenac (now Imerys Talc, Toulouse, France).
The talc had a median diameter 0.9 µm, a moisture level of 0.1 % and a specific
gravity of 2.8 g/cm3.
Preparation and Processing of the PLA/Talc Composites
Before processing, the PLA granules were dried at 70°C overnight (16 hrs) in a
vacuum oven to remove excess moisture. Composites of PLA and talc were prepared
with the following PLA/talc concentrations: 100/0, 90/10, 80/20, 70/30 by weight.
Melt blending was carried out in a Haake Polylab torque rheometer at 170°C for 10
minutes with a constant rotor speed of 60 rpm. Samples for differential scanning
calorimetry (DSC), tensile testing and dynamic mechanical analysis were all prepared
4 | P a g e
by compression moulding in a 20 ton hydraulic press. The materials were hot pressed
at 180°C for three minutes at 10~12 tons pressure followed by quenching to room
temperature over a period of three minutes at the same pressure level.
Differential Scanning Calorimetry (DSC)
The melting and crystallization behaviours of the composites were investigated using
DSC. Measurements were performed using a DSC Q200 (TA Instruments, USA)
fitted with an autosampler and mechanical cooler. Samples of approximately 10~16
mg in mass were put into sealed aluminium pans and loaded into the autosampler. The
machine was run on heat-cool-heat mode and data was analysed using the TA
universal analysis software package. The samples were heated from 0°C to 200° C at
10°C/min and left for 1 minute to measure the melting point of the as-formed
samples, then cooled down to 0°C at the same rate to determine the crystallinity. Then
the samples were reheated to 200°C at 10°C/min to study the melting and degradation
behaviour. All the values represent the average of 3 samples. The amount of overall
crystallinity was calculated using Equation 1.
%100**1.93
%
w
HHityCrystallin cm
------------- (1)
In Equation 1, Hm (j/g), is the measured heat of fusion (melting enthalpy), Hc (j/g)
is the enthalpy of cold crystallization and 93.1 (j/g) is the enthalpy of fusion for 100
% crystalline PLA. For composites of PLA, the weight fraction of the PLA (w) needs
to be considered in calculating the percent crystallinity.
Tensile Testing
Tensile testing was carried out using a Tinius Olsen H50 KS testing machine with a
clip-on extensometer to measure the modulus more precisely. The machine was
equipped with a load cell of 5kN. Compression moulded dumbbell–shaped tensile
specimens (width 10mm, thickness 3mm, length 60mm) were extended at a crosshead
speed of 10 mm/min. The Young‘s modulus, tensile strength and strain at break were
measured. All results presented are mean values of five to seven measurements.
5 | P a g e
Dynamic Mechanical Analysis (DMA)
Viscoelastic properties of the PLA/talc composites were investigated using dynamic
mechanical analysis (DMA). DMA Q800 apparatus (TA Instrument Inc, USA) was
used to measure the storage modulus, loss modulus and tan of each composite
sample as a function of temperature. The storage modulus is the elastic component
and the loss modulus is the viscous component in the viscoelastic response of the
polymer to dynamic loading conditions. All samples were tested in the flexure (dual-
cantilever bending) mode. The rectangular specimens (width 12mm, thickness 3mm,
length 64mm) were heated at a constant rate of 3°C/min from room temperature to
140°C and tested at a frequency of 1Hz.
Morphology
The morphology of the talc and the fracture surfaces of the PLA/talc composites were
examined using a scanning electron microscope equipped with a field emission gun
(FEGSEM, LEO 1530 VP). The samples were gold coated before examination. In
addition the distribution of talc in the PLA/talc composites was examined in the
FEGSEM using the back-scattered electron mode.
Transmission electron microscopy (TEM, JEOL 2100 FX) was used to investigate the
aspect ratio of the talc filler in the composites. Samples were prepared by first
encapsulating in epoxy resin. After the resin was cured, thin sections were cut with an
ultra-microtome using a diamond knife. These sections were mounted on copper grids
for mounting into the TEM. The aspect ratio of the talc filler within the PLA matrix
was measured from the TEM micrographs using Image J® software.
RESULTS AND DISCUSSION
Differential Scanning Calorimetry (DSC)
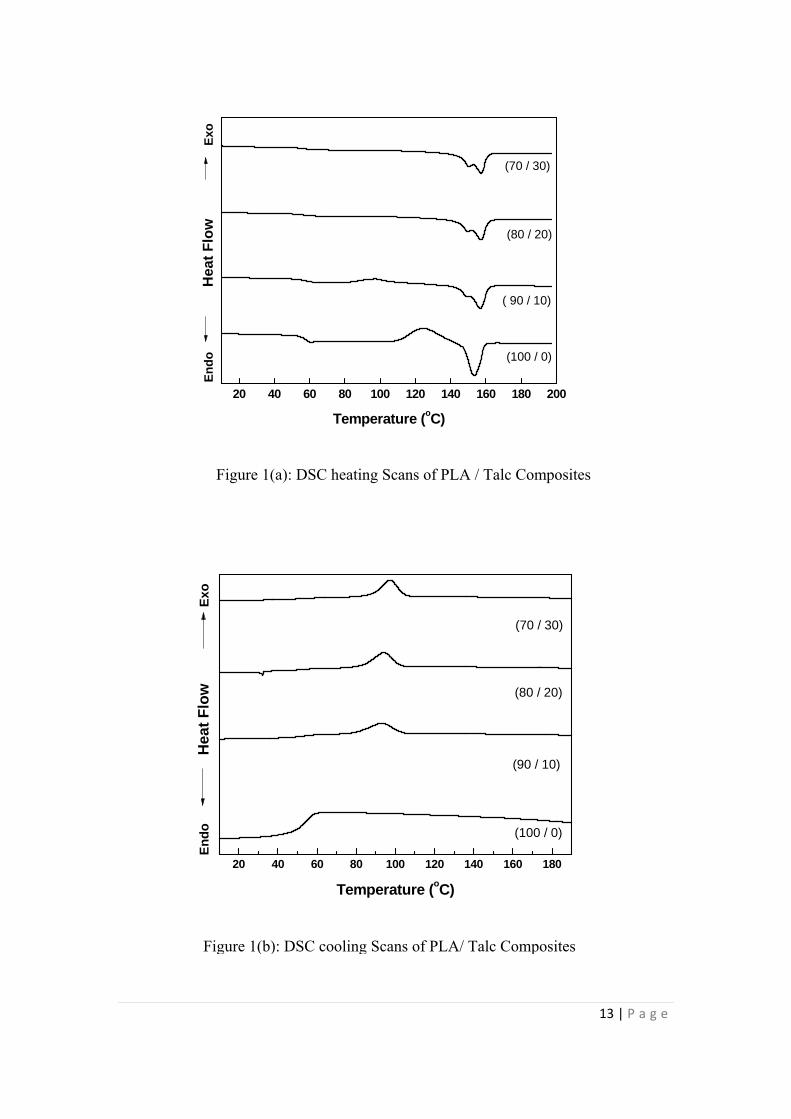
The DSC profiles of the PLA/talc composites are shown in Figure 1. The heating scan
(Figure 1a) shows the glass transition temperature and the exothermic and
endothermic peaks derived from cold crystallization of the amorphous phase and the
6 | P a g e
melting peak respectively. The second heating scans of the various composites are
given in Figure 1a.
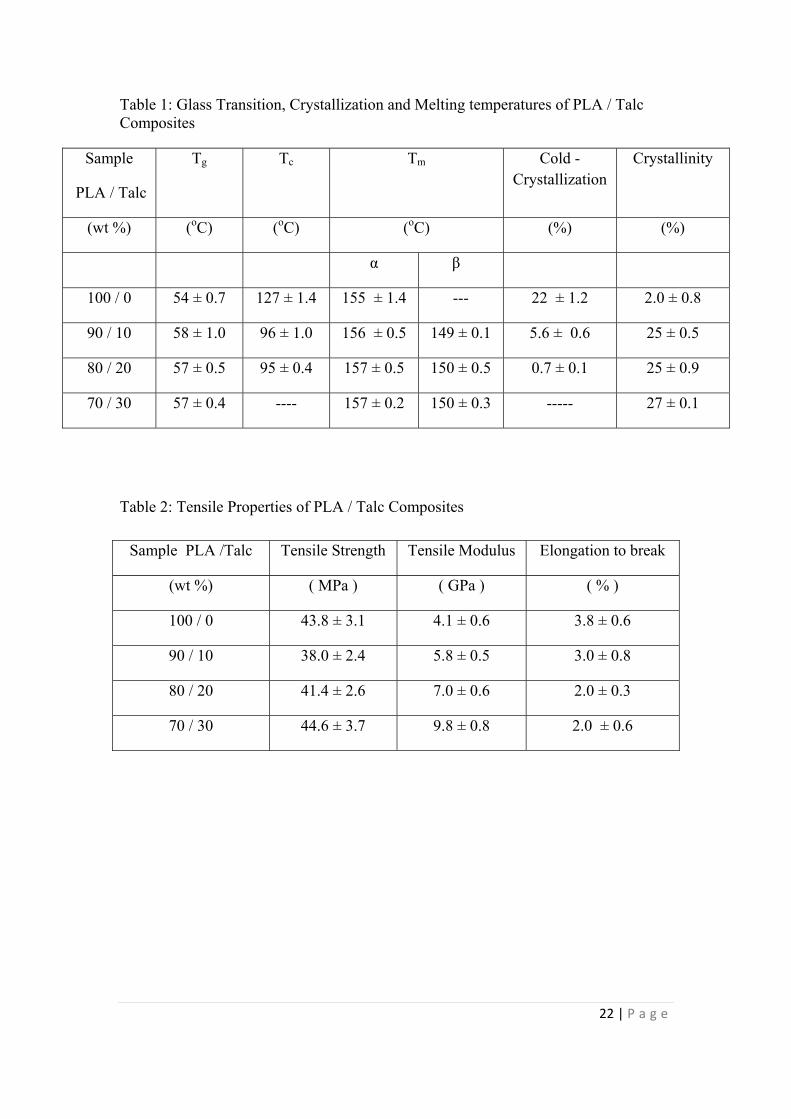
Data from the heating scans are summarised in Table 1. It can be seen that there is a
slight increase in the glass transition temperature (Tg) of the PLA from 54°C to 57°C
on addition of the talc filler, presumably due to a constraint on free volume of the
polymer by the introduction of a platy filler. The cold crystallization temperature (Tc)
is reduced from 127°C for the pure PLA to 96°C for the PLA/talc composites
indicating a nucleating effect by the talc filler. However, the extent of cold
crystallization is greatly reduced – from 22% for pure PLA to 5.6% for the 90/10
composite and then down to 0.7% and 0% for the 80/20 and 70/30 composites
respectively.
The melting temperature (Tm) of the pure PLA is about 155°C, as indicated by the
single peak in Figure 1a. In the presence of the talc filler, the melting of the crystalline
phase is characterised by a double peak, which becomes more pronounced with a
higher concentration of talc. The double peak denotes two different crystalline or
spherulitic forms. The second peak is around 150°C signifying a less thermally stable
phase. Other workers have also reported a double peak in the melting endotherm of
PLA for both pure PLA13 and PLA composites4.
Also included in Table 1 are data on the % crystallinity, as calculated using equation 1
above. It is seen that the pure PLA is essentially amorphous with a crystallinity of
only 2%, whereas addition of 10wt% of talc increases the crystallinity to 25%.
Addition of 30wt% talc gives only a slight further increase in crystallinity up to 27%.
It is clear from these data that talc acts as a nucleating agent for the crystallization of
PLA. Further evidence is provided by the DSC cooling scans shown in Figure 1b.
Here it can be seen that pure PLA is amorphous, with no crystallisation peak, whereas
addition of talc gives rise to an exothermic crystallisation peak in the cooling scan.
Increasing the talc content gives rise to a more pronounced crystallisation exotherm.
It is well known that talc acts as a nucleating agent when added to isotactic
polypropylene homopolymer or copolymer9, where it has been shown to increase the
crystallisation temperature and nucleation density and reduce the spherulite size.
7 | P a g e
Harris and Lee 11 have also reported that talc can act as a nucleating agent to control
the crystallinity of PLA and hence improve mechanical properties. The reason for the
specific role of talc (as opposed to other inorganic fillers) in promoting spherulite
nucleation of polypropylene has been attributed 8 to matching of the (001) talc plane
with a specific crystallographic direction in the isotactic polypropylene and it is
proposed that hexagonal rings on the talc surface form hydrogen bonds with methyl
groupings in the PP. In a similar way, it is likely that crystallographic matching would
account for the role of talc in promoting crystallinity in PLA.
Mechanical Properties
The tensile properties of PLA and PLA/talc composites are shown in Table 2. All
samples exhibited brittle failure. It can be seen from the table that there is no
significant change to the tensile strength of the formulations because the results are
within the experimental variation of the data. There is, however, found to be a
significant reduction in elongation to break of the samples from 3.8% for pure PLA to
2.0% for 70/30 PLA/talc. A reduction in elongation to break implies that the
composites have become more brittle with the talc addition. Other workers have also
reported a drop in % elongation when talc is added to PLA based composites 4,12. The
most likely reason for the drop is that the addition of platy filler to a brittle polymer is
causing stress concentration and crack initiation and therefore reducing toughness.
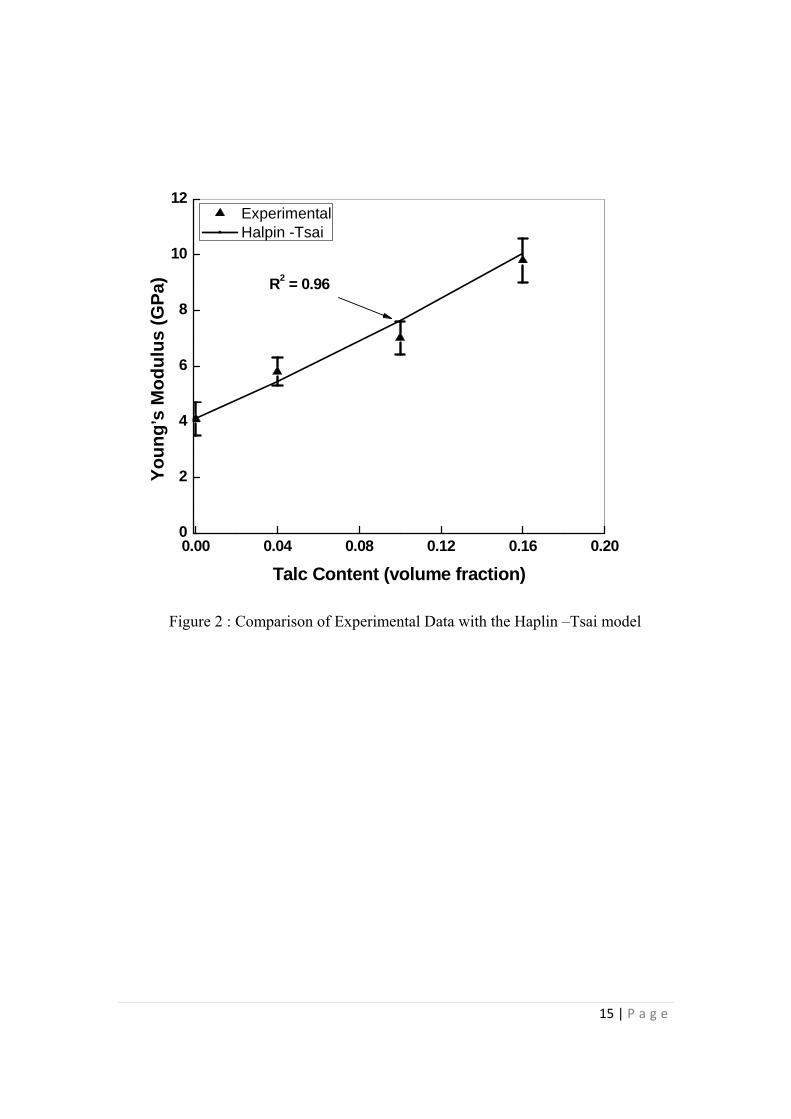
From Table 2 it is seen that there is a very significant increase in Young’s modulus
from a value of 4.1GPa for the pure PLA up to 9.8GPa on addition of 30wt% of talc.
This effect is due to the addition of a high modulus platy filler to a lower modulus
polymer.
Different theoretical models can be applied to predict the reinforcing effect on
Young’s modulus of particulate composites. Due to the platy structure of the filler, the
geometrical parameters of the filler will affect the properties of the composite. Of
particular importance is the aspect ratio (L/D) of the filler, which is the ratio of length
(L) to thickness (D) of the filler particles. The Halpin-Tsai equation 14 takes into
account the effect of filler geometry in predicting the modulus of the composite
materials. The Halpin-Tsai equation is given in equation 2 below.
8 | P a g e
f
f
m
c
B
AB
E
E
1
1--------------------------------(2)
Where, Ec is the Young’s modulus of the composite, Em is the Young’s modulus of
the matrix, Ef is the Young’s modulus of the filler, φf is the volume fraction of the
filler, A=2(L/D) and B=(R-1)/(R+A), where R=Ef/Em. In calculating the predicted
value of the Young’s modulus of the various PLA/talc composites from the Halpin
Tsai equation, the following values have been used: Em is 4.1GPa as measured, Ef is
taken as 70GPa which is the elastic modulus of other silicate fillers (such as glass), φf
is calculated from the weight fraction using the values of the density of PLA of 1.24
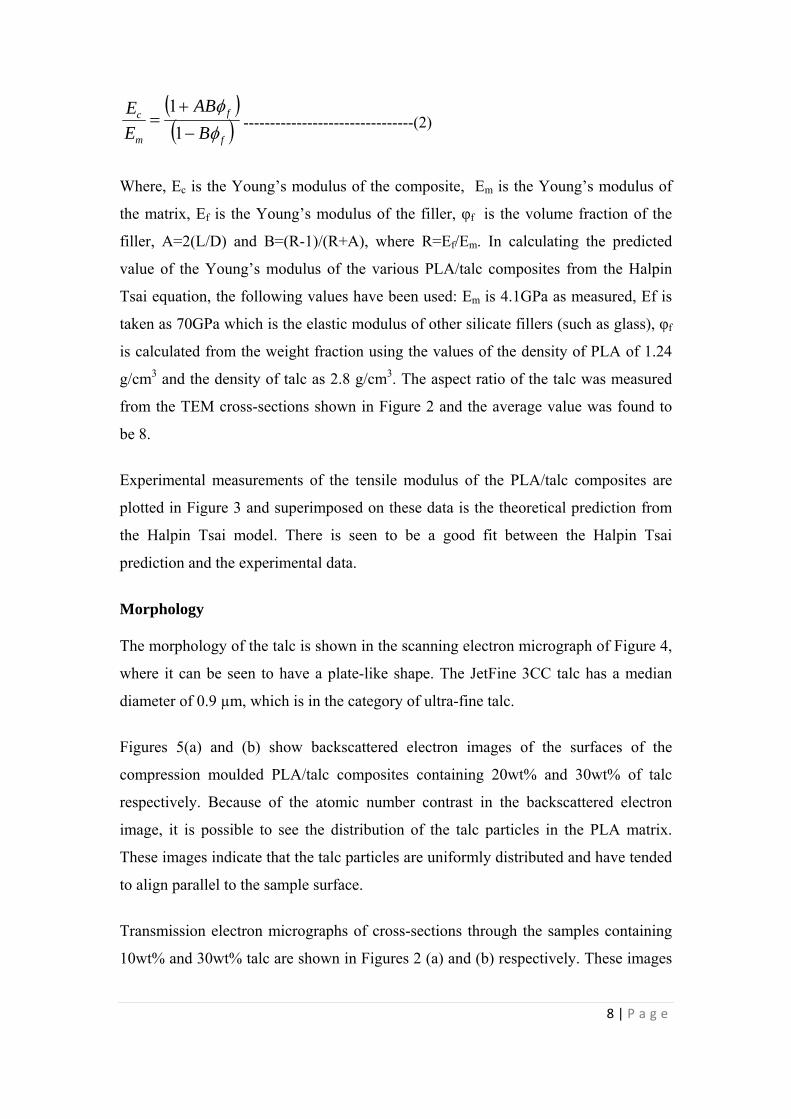
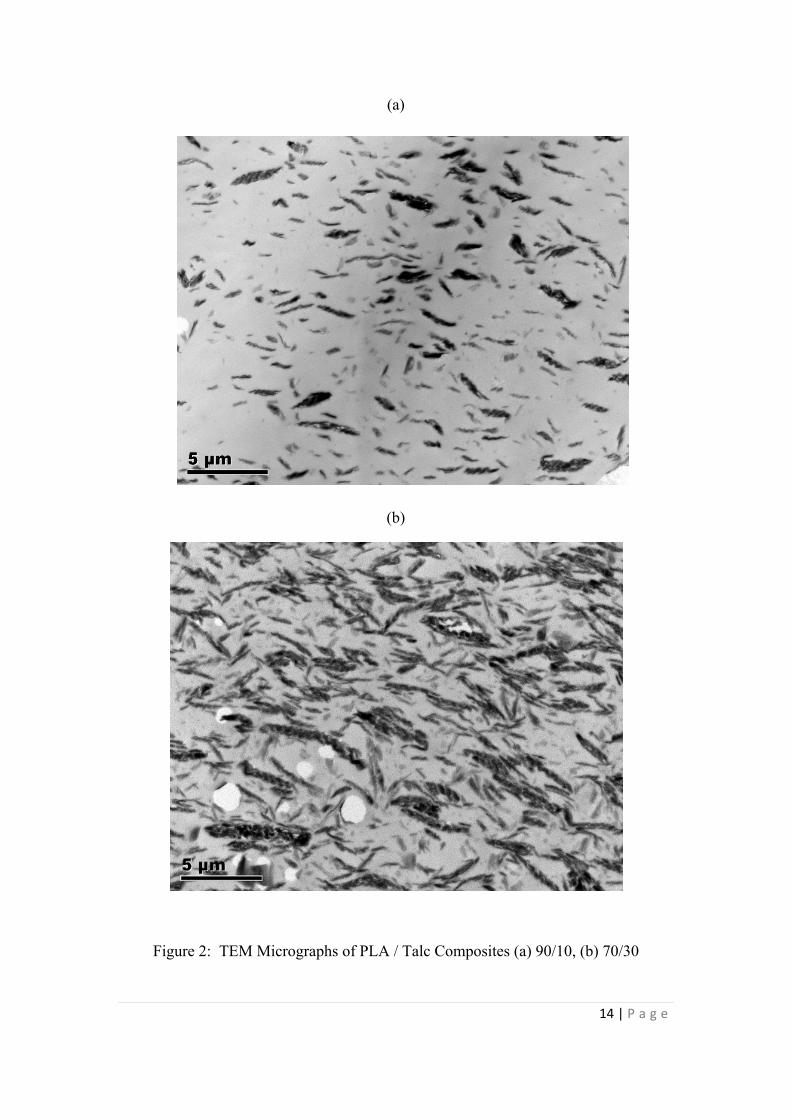
g/cm3 and the density of talc as 2.8 g/cm3. The aspect ratio of the talc was measured
from the TEM cross-sections shown in Figure 2 and the average value was found to
be 8.
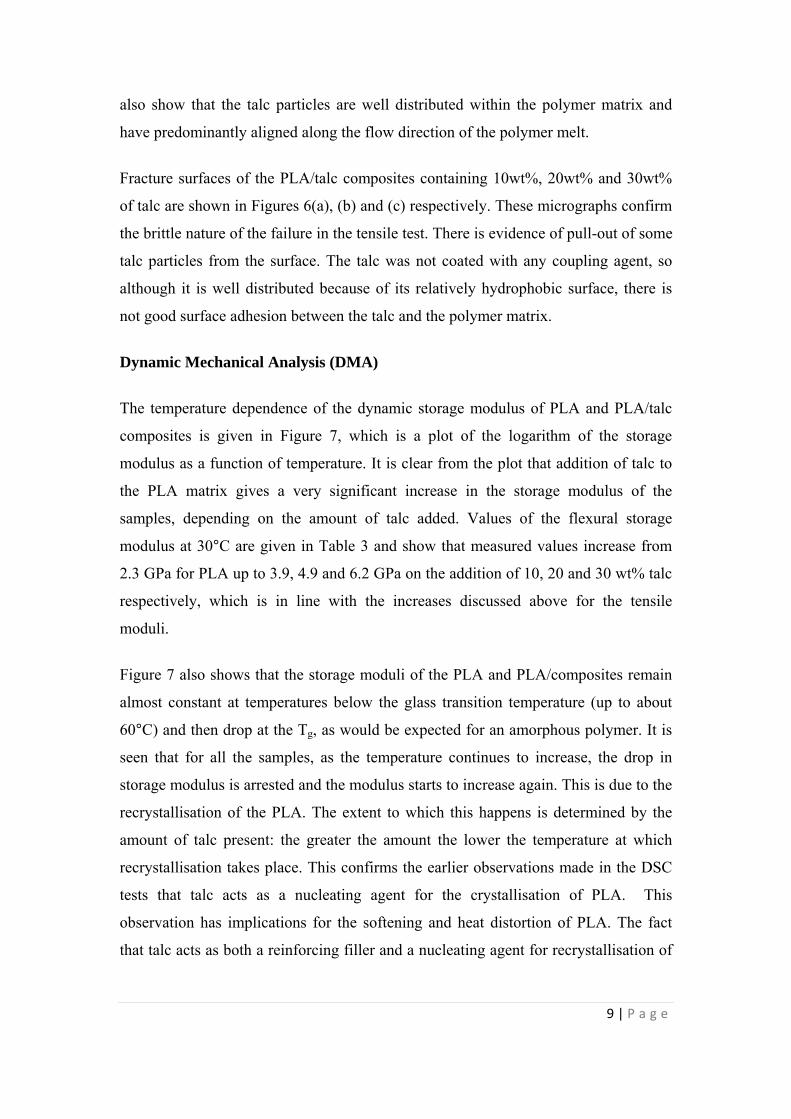
Experimental measurements of the tensile modulus of the PLA/talc composites are
plotted in Figure 3 and superimposed on these data is the theoretical prediction from
the Halpin Tsai model. There is seen to be a good fit between the Halpin Tsai
prediction and the experimental data.
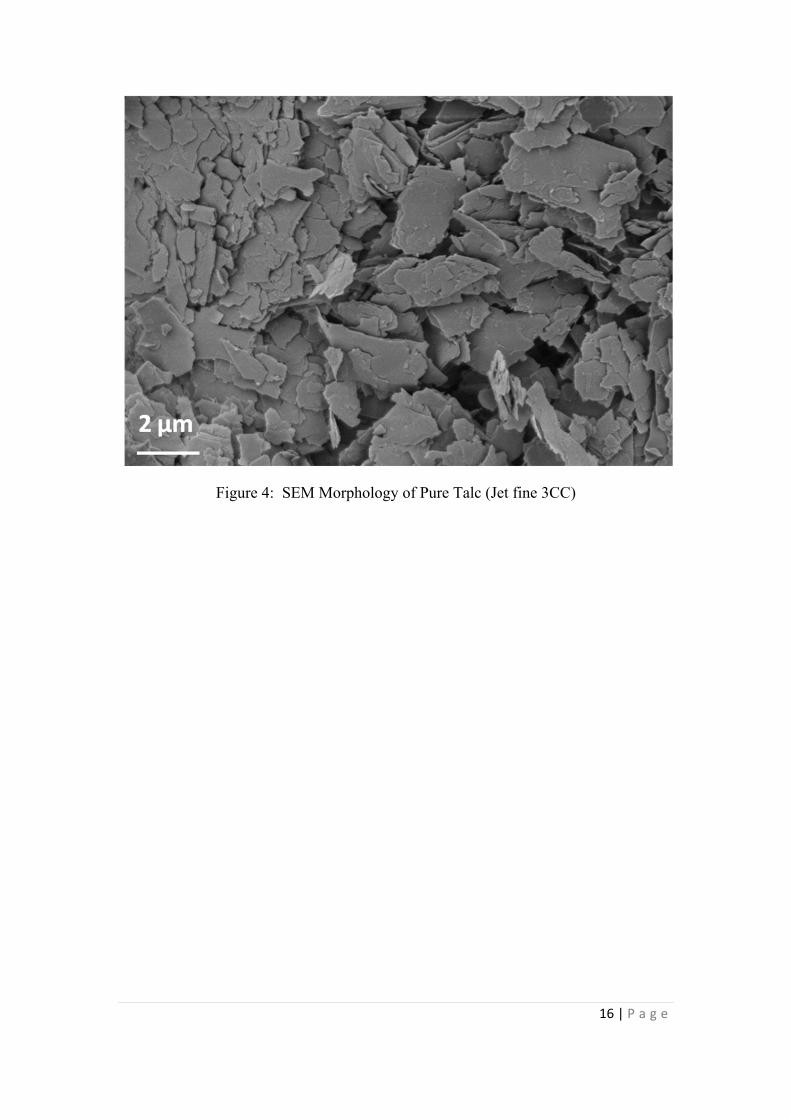
Morphology
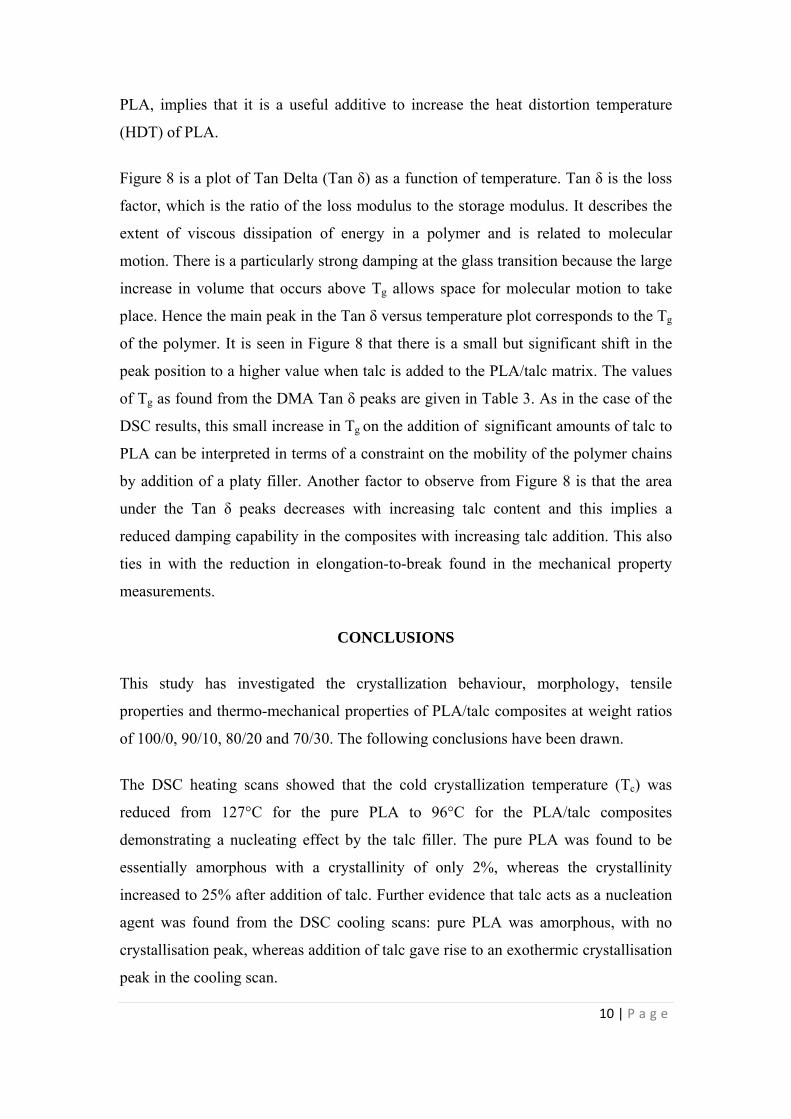
The morphology of the talc is shown in the scanning electron micrograph of Figure 4,
where it can be seen to have a plate-like shape. The JetFine 3CC talc has a median
diameter of 0.9 µm, which is in the category of ultra-fine talc.
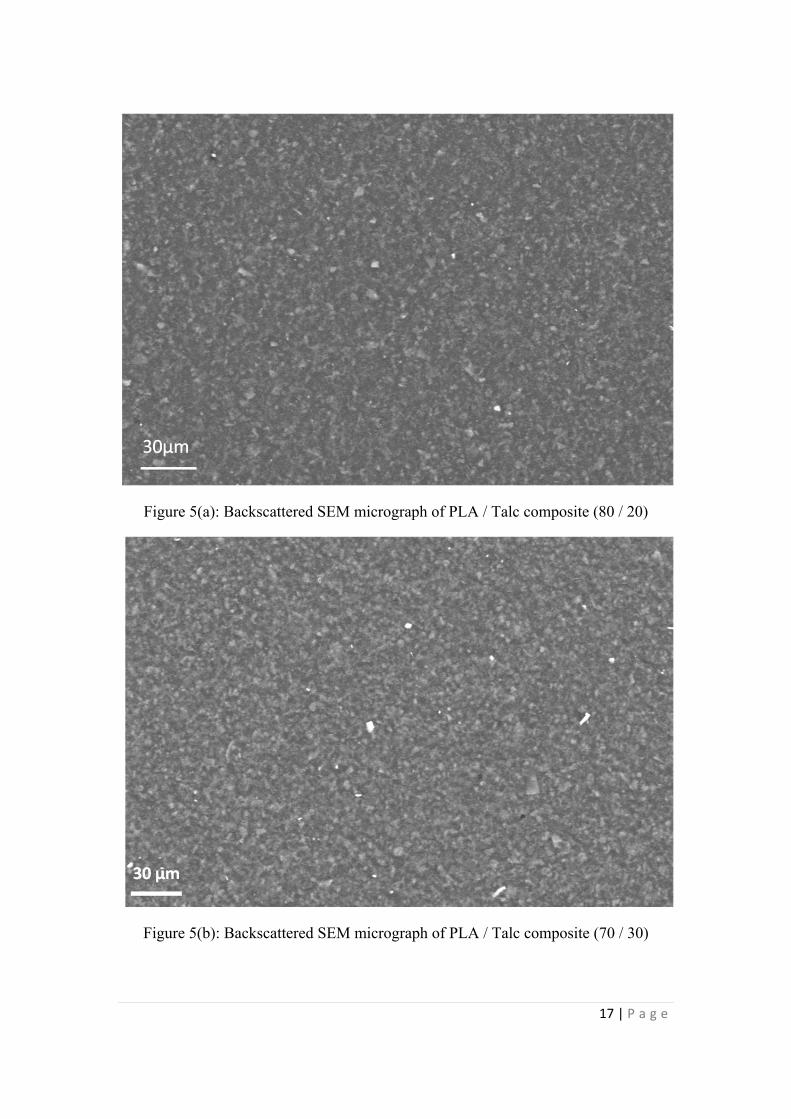
Figures 5(a) and (b) show backscattered electron images of the surfaces of the
compression moulded PLA/talc composites containing 20wt% and 30wt% of talc
respectively. Because of the atomic number contrast in the backscattered electron
image, it is possible to see the distribution of the talc particles in the PLA matrix.
These images indicate that the talc particles are uniformly distributed and have tended
to align parallel to the sample surface.
Transmission electron micrographs of cross-sections through the samples containing
10wt% and 30wt% talc are shown in Figures 2 (a) and (b) respectively. These images
9 | P a g e
also show that the talc particles are well distributed within the polymer matrix and
have predominantly aligned along the flow direction of the polymer melt.
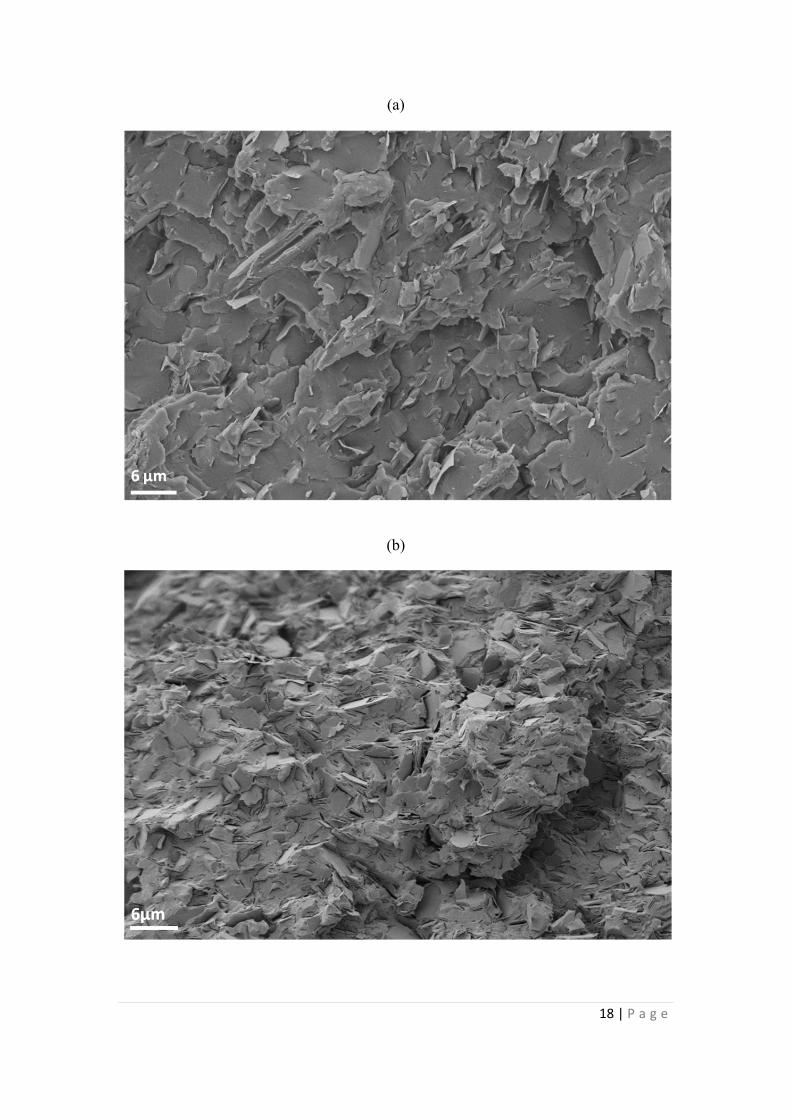
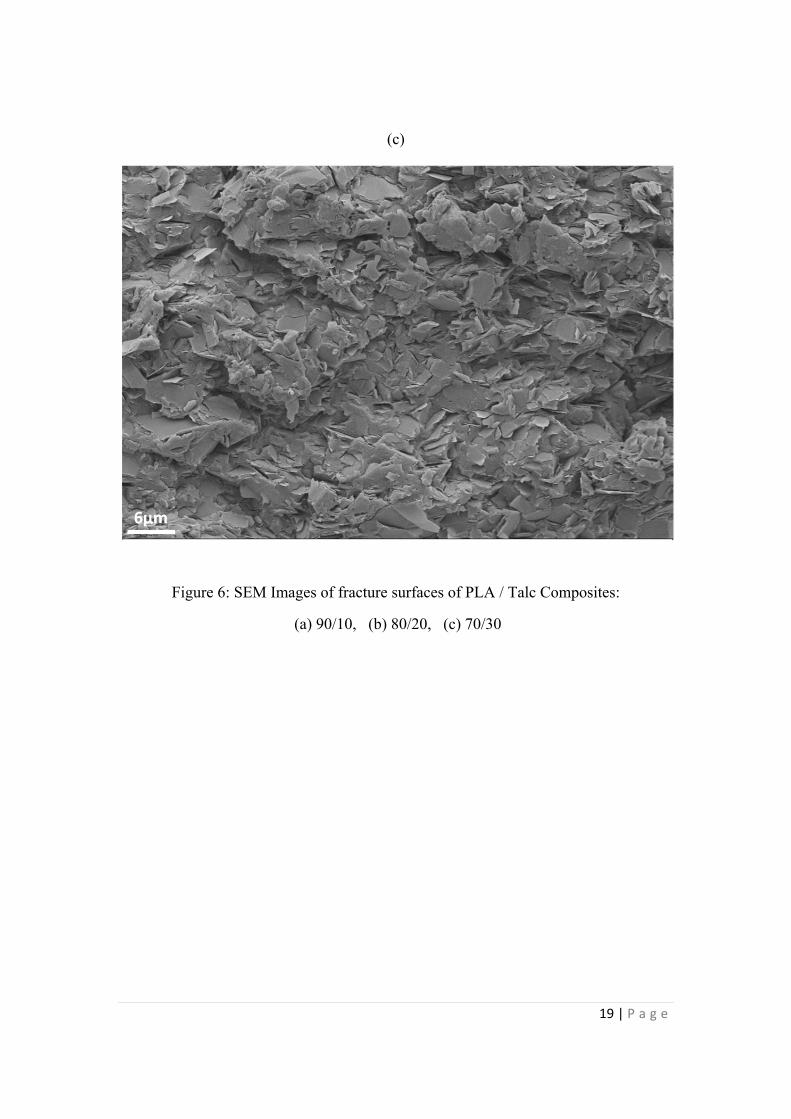
Fracture surfaces of the PLA/talc composites containing 10wt%, 20wt% and 30wt%
of talc are shown in Figures 6(a), (b) and (c) respectively. These micrographs confirm
the brittle nature of the failure in the tensile test. There is evidence of pull-out of some
talc particles from the surface. The talc was not coated with any coupling agent, so
although it is well distributed because of its relatively hydrophobic surface, there is
not good surface adhesion between the talc and the polymer matrix.
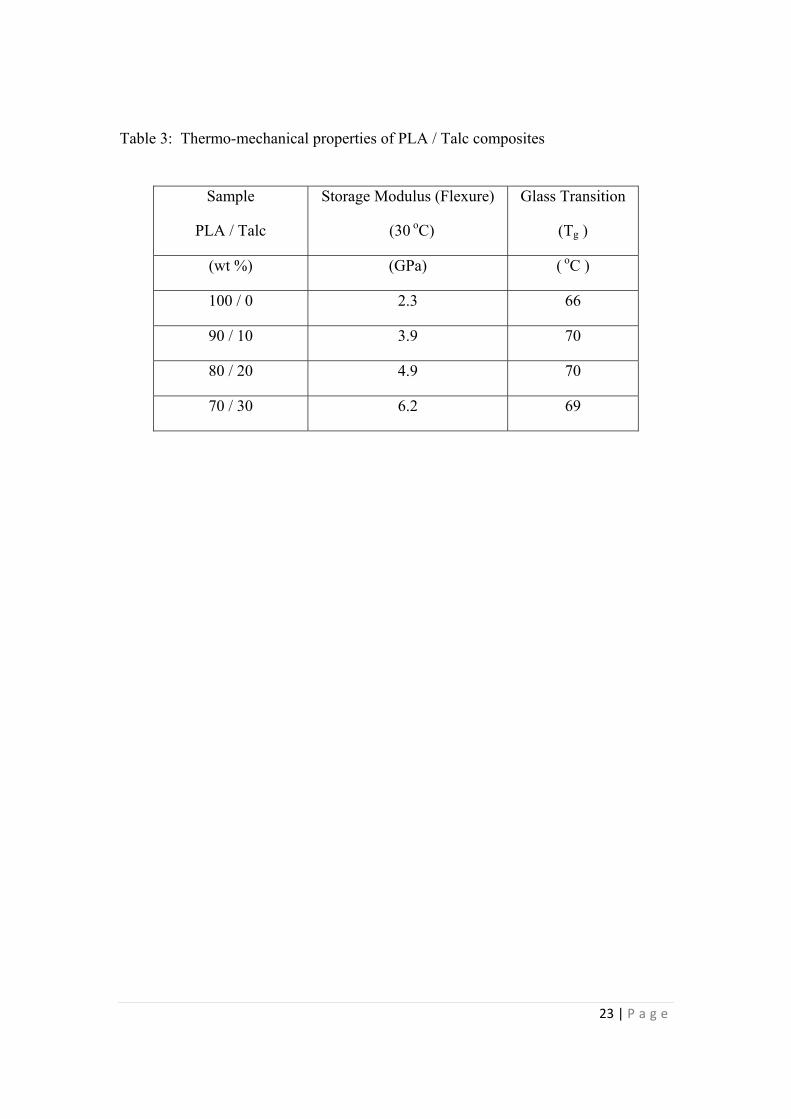
Dynamic Mechanical Analysis (DMA)
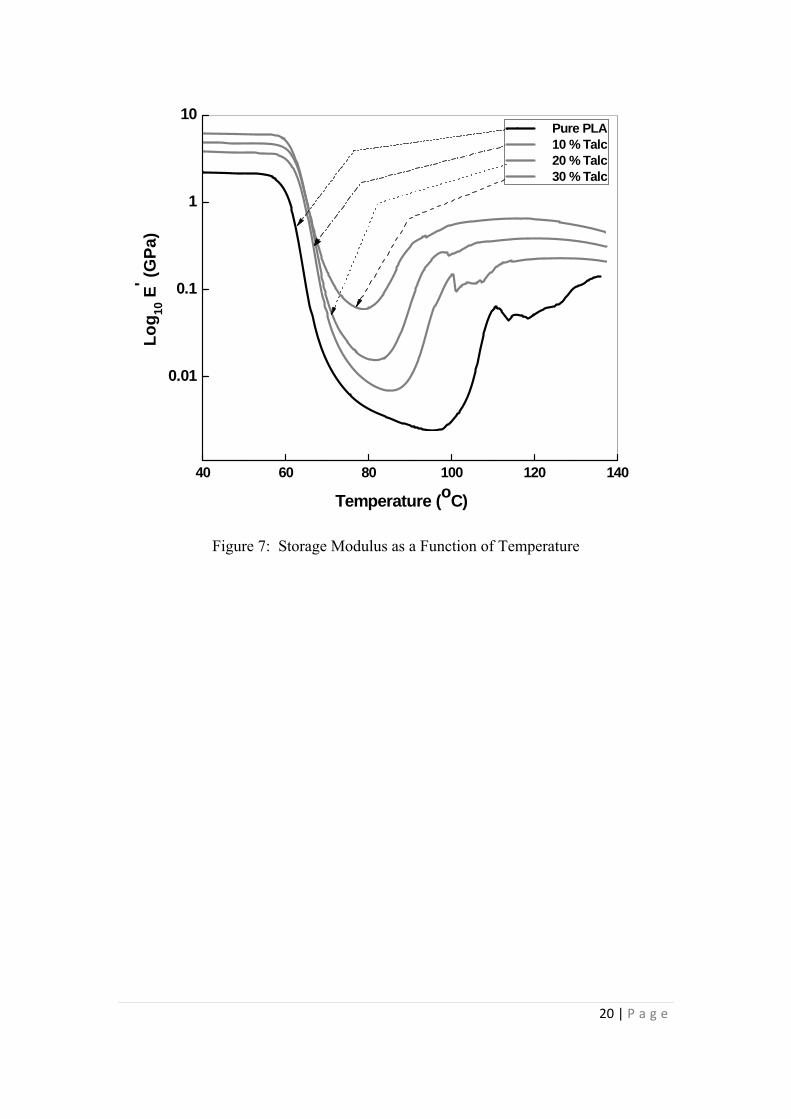
The temperature dependence of the dynamic storage modulus of PLA and PLA/talc
composites is given in Figure 7, which is a plot of the logarithm of the storage
modulus as a function of temperature. It is clear from the plot that addition of talc to
the PLA matrix gives a very significant increase in the storage modulus of the
samples, depending on the amount of talc added. Values of the flexural storage
modulus at 30°C are given in Table 3 and show that measured values increase from
2.3 GPa for PLA up to 3.9, 4.9 and 6.2 GPa on the addition of 10, 20 and 30 wt% talc
respectively, which is in line with the increases discussed above for the tensile
moduli.
Figure 7 also shows that the storage moduli of the PLA and PLA/composites remain
almost constant at temperatures below the glass transition temperature (up to about
60°C) and then drop at the Tg, as would be expected for an amorphous polymer. It is
seen that for all the samples, as the temperature continues to increase, the drop in
storage modulus is arrested and the modulus starts to increase again. This is due to the
recrystallisation of the PLA. The extent to which this happens is determined by the
amount of talc present: the greater the amount the lower the temperature at which
recrystallisation takes place. This confirms the earlier observations made in the DSC
tests that talc acts as a nucleating agent for the crystallisation of PLA. This
observation has implications for the softening and heat distortion of PLA. The fact
that talc acts as both a reinforcing filler and a nucleating agent for recrystallisation of
10 | P a g e
PLA, implies that it is a useful additive to increase the heat distortion temperature
(HDT) of PLA.
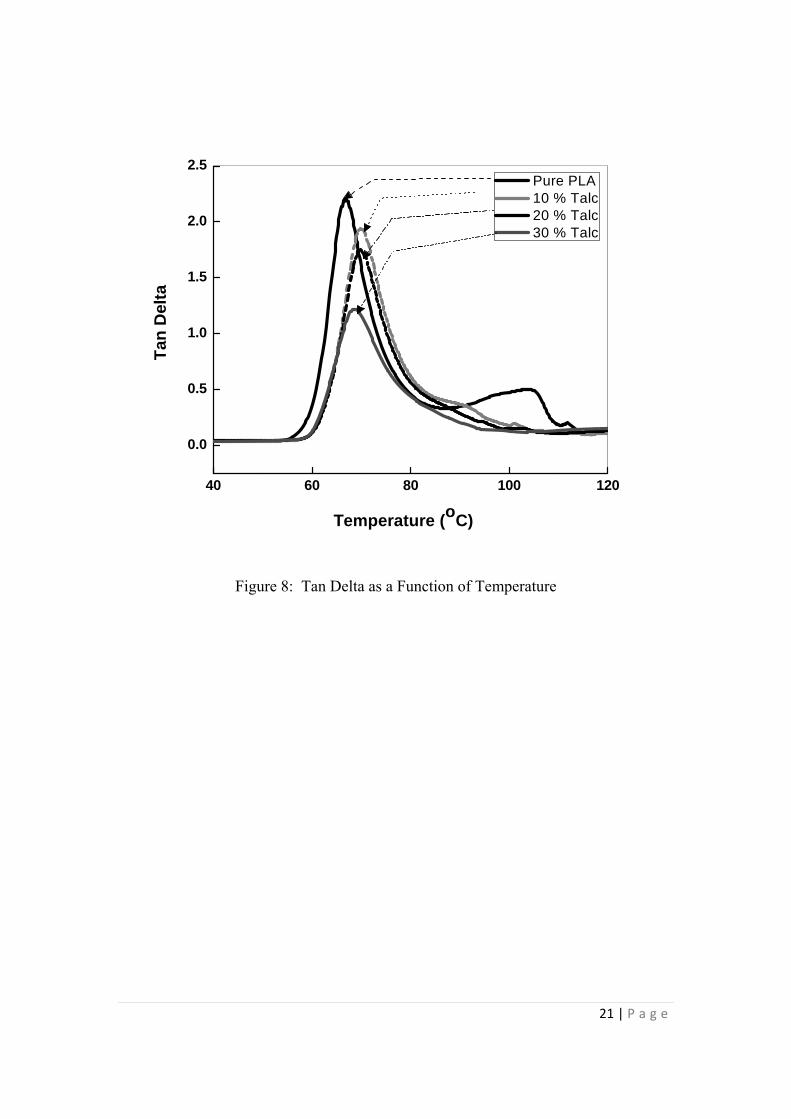
Figure 8 is a plot of Tan Delta (Tan δ) as a function of temperature. Tan δ is the loss
factor, which is the ratio of the loss modulus to the storage modulus. It describes the
extent of viscous dissipation of energy in a polymer and is related to molecular
motion. There is a particularly strong damping at the glass transition because the large
increase in volume that occurs above Tg allows space for molecular motion to take
place. Hence the main peak in the Tan δ versus temperature plot corresponds to the Tg
of the polymer. It is seen in Figure 8 that there is a small but significant shift in the
peak position to a higher value when talc is added to the PLA/talc matrix. The values
of Tg as found from the DMA Tan δ peaks are given in Table 3. As in the case of the
DSC results, this small increase in Tg on the addition of significant amounts of talc to
PLA can be interpreted in terms of a constraint on the mobility of the polymer chains
by addition of a platy filler. Another factor to observe from Figure 8 is that the area
under the Tan δ peaks decreases with increasing talc content and this implies a
reduced damping capability in the composites with increasing talc addition. This also
ties in with the reduction in elongation-to-break found in the mechanical property
measurements.
CONCLUSIONS
This study has investigated the crystallization behaviour, morphology, tensile
properties and thermo-mechanical properties of PLA/talc composites at weight ratios
of 100/0, 90/10, 80/20 and 70/30. The following conclusions have been drawn.
The DSC heating scans showed that the cold crystallization temperature (Tc) was
reduced from 127°C for the pure PLA to 96°C for the PLA/talc composites
demonstrating a nucleating effect by the talc filler. The pure PLA was found to be
essentially amorphous with a crystallinity of only 2%, whereas the crystallinity
increased to 25% after addition of talc. Further evidence that talc acts as a nucleation
agent was found from the DSC cooling scans: pure PLA was amorphous, with no
crystallisation peak, whereas addition of talc gave rise to an exothermic crystallisation
peak in the cooling scan.
11 | P a g e
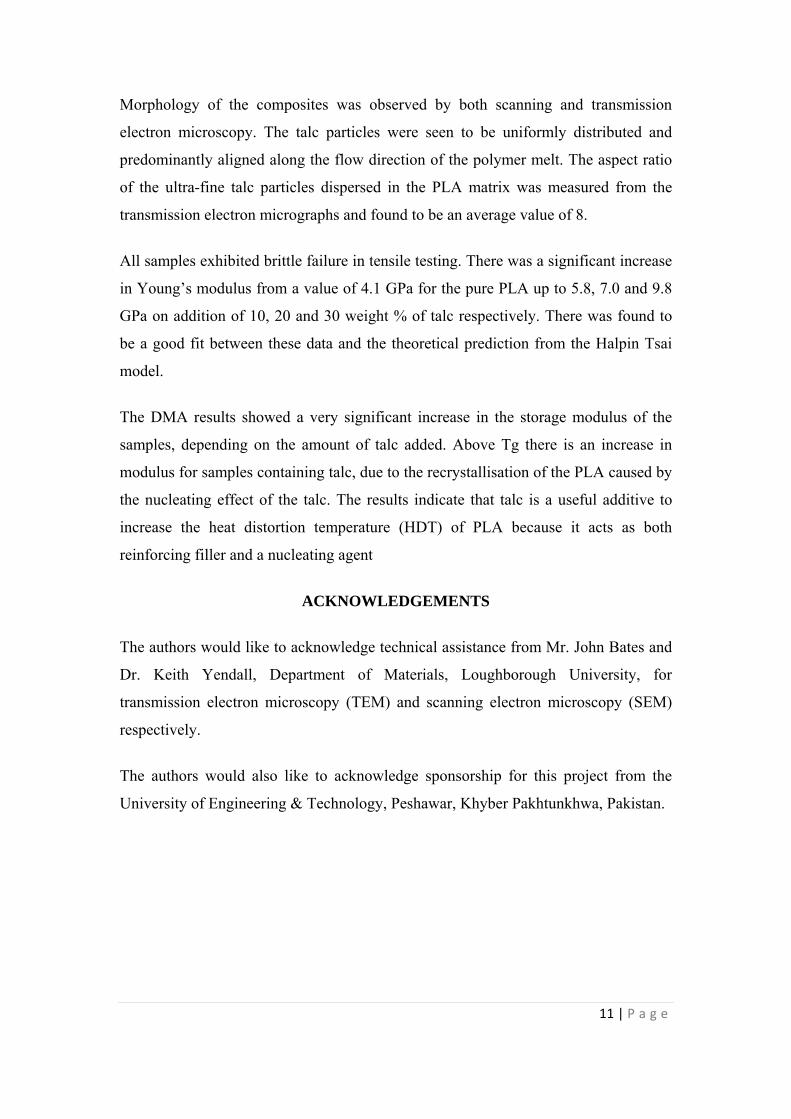
Morphology of the composites was observed by both scanning and transmission
electron microscopy. The talc particles were seen to be uniformly distributed and
predominantly aligned along the flow direction of the polymer melt. The aspect ratio
of the ultra-fine talc particles dispersed in the PLA matrix was measured from the
transmission electron micrographs and found to be an average value of 8.
All samples exhibited brittle failure in tensile testing. There was a significant increase
in Young’s modulus from a value of 4.1 GPa for the pure PLA up to 5.8, 7.0 and 9.8
GPa on addition of 10, 20 and 30 weight % of talc respectively. There was found to
be a good fit between these data and the theoretical prediction from the Halpin Tsai
model.
The DMA results showed a very significant increase in the storage modulus of the
samples, depending on the amount of talc added. Above Tg there is an increase in
modulus for samples containing talc, due to the recrystallisation of the PLA caused by
the nucleating effect of the talc. The results indicate that talc is a useful additive to
increase the heat distortion temperature (HDT) of PLA because it acts as both
reinforcing filler and a nucleating agent
ACKNOWLEDGEMENTS
The authors would like to acknowledge technical assistance from Mr. John Bates and
Dr. Keith Yendall, Department of Materials, Loughborough University, for
transmission electron microscopy (TEM) and scanning electron microscopy (SEM)
respectively.
The authors would also like to acknowledge sponsorship for this project from the
University of Engineering & Technology, Peshawar, Khyber Pakhtunkhwa, Pakistan.
12 | P a g e
REFRENCES
1. R. Auras, B. Harte and S. Selke, Macromol Biosci, 4, 835-864 (2004). 2. D. Garlotta, Journal of Polymers and the Environment, 9, 63 - 84 (2001). 3. C. L. Simões, J. C. Viana and A. M. Cunha, Journal of Applied Polymer
Science, 112, 345-352 (2009). 4. S. Jain, M. M. Reddy, A. K. Mohanty, M. Misra and A. K. Ghosh,
Macromolecular Materials and Engineering, 295, 750-762 (2010). 5. M. Zhang and N. L. Thomas, Advances in Polymer Technology, 30, 67-79
(2011). 6. S. S. Ray, K. Yamada, M. Okamoto and K. Ueda, Nano Letters, 2, 1093 -
1096 (2002). 7. A. R. McLauchlin and N. L. Thomas, Polymer Degradation and Stability, 94,
868-872 (2009). 8. E. Ferrage, F. Martin, A. Boudet, S. Petit, G. Fourty, F. Jouffret, P. Micoud, P.
De Parseval, S. Salvi, C. Bourgerette, J. Ferret, Y. Saint-Gerard, S. Buratto and J. P. Fortune, Journal of Materials Science, 37, 1561-1573 (2002).
9. B. Fillon, A. Thierry, B. Lotz and J. C. Wittmann, Journal of Thermal
Analysis, 42, 721-731 (1994). 10. S. N. Maiti and K. K. Sharma, Journal of Materials Science, 27, 4605-4613
(1992). 11. A. M. Harris and E. C. Lee, Journal of applied polymer science, 107, 2246-
2255 (2008). 12. A. C. Fowlks and R. Narayan, Journal of Applied Polymer Science, 118, 2810-
2820 (2010). 13. T. Tabi, I. E. Sajo, F. Szabo, A. S. Luyt and J. G. Kovacs, Express Polymer
Letters, 4, 659-668 (2010). 14. L. Mascia, Thermoplastics: Materials Engineering, Elsevier Applied Science,
London, 1989, P91.
13 | P a g e
20 40 60 80 100 120 140 160 180 200
Temperature (oC)
(100 / 0)
(80 / 20)
( 90 / 10)
(70 / 30)
En
do
H
eat
Flo
w
E
xo
Figure 1(a): DSC heating Scans of PLA / Talc Composites
20 40 60 80 100 120 140 160 180
En
do
H
eat
Flo
w
E
xo
Temperature (oC)
(100 / 0)
(90 / 10)
(80 / 20)
(70 / 30)
Figure 1(b): DSC cooling Scans of PLA/ Talc Composites
14 | P a g e
(a)
(b)
Figure 2: TEM Micrographs of PLA / Talc Composites (a) 90/10, (b) 70/30
15 | P a g e
0.00 0.04 0.08 0.12 0.16 0.200
2
4
6
8
10
12
Yo
un
g, s
Mo
du
lus
(GP
a)
Talc Content (volume fraction)
Experimental Halpin -Tsai
R2 = 0.96
Figure 2 : Comparison of Experimental Data with the Haplin –Tsai model
16 | P a g e
Figure 4: SEM Morphology of Pure Talc (Jet fine 3CC)
17 | P a g e
Figure 5(a): Backscattered SEM micrograph of PLA / Talc composite (80 / 20)
Figure 5(b): Backscattered SEM micrograph of PLA / Talc composite (70 / 30)
18 | P a g e
(a)
(b)
19 | P a g e
(c)
Figure 6: SEM Images of fracture surfaces of PLA / Talc Composites:
(a) 90/10, (b) 80/20, (c) 70/30
20 | P a g e
Figure 7: Storage Modulus as a Function of Temperature
40 60 80 100 120 140
0.01
0.1
1
10
Temperature (oC)
Lo
g10
E' (
GP
a) Pure PLA 10 % Talc 20 % Talc 30 % Talc
21 | P a g e
Figure 8: Tan Delta as a Function of Temperature
40 60 80 100 120
0.0
0.5
1.0
1.5
2.0
2.5
Temperature (oC)
Ta
n D
elta
Pure PLA 10 % Talc 20 % Talc 30 % Talc
22 | P a g e
Table 1: Glass Transition, Crystallization and Melting temperatures of PLA / Talc Composites
Table 2: Tensile Properties of PLA / Talc Composites
Sample
PLA / Talc
Tg Tc Tm Cold -Crystallization
Crystallinity
(wt %) (oC) (oC) (oC) (%) (%)
α β
100 / 0 54 ± 0.7 127 ± 1.4 155 ± 1.4 --- 22 ± 1.2 2.0 ± 0.8
90 / 10 58 ± 1.0 96 ± 1.0 156 ± 0.5 149 ± 0.1 5.6 ± 0.6 25 ± 0.5
80 / 20 57 ± 0.5 95 ± 0.4 157 ± 0.5 150 ± 0.5 0.7 ± 0.1 25 ± 0.9
70 / 30 57 ± 0.4 ---- 157 ± 0.2 150 ± 0.3 ----- 27 ± 0.1
Sample PLA /Talc Tensile Strength Tensile Modulus Elongation to break
(wt %) ( MPa ) ( GPa ) ( % )
100 / 0 43.8 ± 3.1 4.1 ± 0.6 3.8 ± 0.6
90 / 10 38.0 ± 2.4 5.8 ± 0.5 3.0 ± 0.8
80 / 20 41.4 ± 2.6 7.0 ± 0.6 2.0 ± 0.3
70 / 30 44.6 ± 3.7 9.8 ± 0.8 2.0 ± 0.6
23 | P a g e
Table 3: Thermo-mechanical properties of PLA / Talc composites
Sample
PLA / Talc
Storage Modulus (Flexure)
(30 oC)
Glass Transition
(Tg )
(wt %) (GPa) ( oC )
100 / 0 2.3 66
90 / 10 3.9 70
80 / 20 4.9 70
70 / 30 6.2 69