Embed Size (px)
Citation preview

TA L E N T. I N N O V AT I O N . D I F F E R E N T I AT I O N .
T R A N S F O R M AT I O N
Barnes Group Inc. Annual Report 2014
TTAA LL EE NN TT. II NN NN OO VV AATT II OO NN . DD II FF FF EE RR EE NN TT II AATT II OO NN .
90919_AR_Cover.indd 1 3/4/15 6:10 PM

2014 was an Outstanding Year for our Company …
Barnes Group achieved excellent financial results and continued to execute on its profitable growthstrategy. We put in place a solid strategic foundation, with the Barnes Enterprise System andinnovation as cornerstones, to drive a high performance employee culture, and deliver highly-engineered, differentiated industrial technologies and advanced solutions to the markets and customerswe serve. We made great strides over the last several years, successfully exiting the recession,transforming the portfolio, empowering our workforce, and laying the ground work necessary tosustain performance – all of which allowed 2014 to be one of our best years of performance.
Total sales were up 16% in 2014, with solid organic growth of 6% and a Männer acquisitioncontribution of 10%. Adjusted operating margin increased 250 basis points to 15.4% driven bymeaningful increases in both our Industrial and Aerospace segments. On an adjusted basis, incomefrom continuing operations was $2.34 per diluted share, up 28% from a year ago.(1)
Strategy Execution and Transformation Progress …
These strong financial results have been accompanied by good cash flow generation, allowing us toinvest in our existing businesses, undertake value enhancing acquisitions as opportunities arise, andincrease dividends to our shareholders.
In addition to delivering excellent financial results, we continued to make further progress ontransforming our business and driving our strategy deeper into the organization. To that end, weinstitutionalized the Barnes Global Engineering and Technology Forum, leveraging our worldwideengineering talent and promoting a heightened level of collaboration, innovative thinking, and actionacross all of our businesses. This forum advanced a structured phase gate process for quicklyidentifying and screening great ideas, funding those opportunities, and moving them from inception tolaunch through a disciplined approach. We fully acknowledge the importance of fostering thiscooperative environment, leveraging the knowledge and skills of our employees to ensure that ourpipeline of new products and services remains robust, and that new projects are well positioned forcommercial success.
Investment in our businesses continued at heightened levels in 2014 with approximately $60 million ofcapital expenditures; about half of which was directed at growth programs that should drive futurerevenues and allow us to prosper long-term. Much of the remainder was targeted towards enhancingour manufacturing technology and capabilities, allowing us to be more competitive in the globalmarketplace.
In 2014, the smooth integration of the Männer acquisition into the Barnes Group Industrial familyadded to our capabilities in the plastic injection molding arena and helped to solidify our standing as aleading global provider of hot runner systems.
At Aerospace, we invested in a new component repair program giving us the right to provide overhauland repair services on certain critical components for the highly successful CFM56 commercialaerospace engine program. Coupled with a similar arrangement for the CF6 engine program enteredinto in late 2013, we are confident these programs will generate a meaningful revenue stream, atimproved MRO margins, for many years to come.
We believe our investments support favorable long-term growth prospects for the Company, and weexpect to deliver continuing improvement in our financial performance. In concert with this outlook,we increased our quarterly dividend rate by 9% in October. We remain committed to being goodstewards of capital and believe that we have positioned the Company to deliver enhanced shareholdervalue.
Leadership Changes …
Barnes Group is fortunate to have a distinguished Board of Directors providing guidance andleadership to our Company. During 2014, we saw a few changes to the composition of our Board. Assuch, we would like to recognize our two retiring Board members, Mr. Thomas Albani, a director since2008, and Mr. John Alden, a director since 2000, for their significant counsel and leadership over theyears. In addition, we are extremely pleased to welcome Ms. JoAnna Sohovich to our Board. JoAnnabrings extensive experience in the industrial business-to-business sector along with pertinentexperience in aerospace overhaul and repair. We look forward to her contributions as a director.
Upbeat Outlook for 2015 …
2014 saw tremendous progress in our strategy to provide highly-engineered, differentiated industrialtechnologies and innovative solutions to our end-markets. We are confident we are on the right path oftransforming our Company to meet the current and future needs of our customers.
We expect 2015 to be another successful year where being focused on executing our vison and longterm growth strategy delivers a further increase in financial performance. Internally, we look toimplement the next generation Barnes Enterprise System to drive further operational efficiencies,advance innovation across all of our businesses to secure our future, and continue the development ofour valued global workforce. And, if an acquisition opportunity arises in the upcoming year that isconsistent with our vision and strategy, we believe we are in a great position to execute on it.
We extend our thanks to the 4,500 Barnes Group employees across the globe for their dedication, hardwork and contributions to a very successful 2014. We are excited about, and look forward to meeting,the challenges of the upcoming year with this exceptional team.
Finally, we wish to extend our sincere appreciation to our customers and suppliers, as we realize theirpartnership is critical to our success, and to our shareholders for their continued confidence in BarnesGroup.
Thomas O. Barnes Patrick J. Dempsey
Chairman of the Board President and Chief Executive Officer
(1) References to adjusted financial results for 2014 are non-GAAP measures. You will find a reconciliation table on ourwebsite as part of our fourth quarter and full-year 2014 press release and in the Form 8-K submitted to the SEC.
UNITED STATESSECURITIES AND EXCHANGE COMMISSION
Washington, D.C. 20549
FORM 10-KÈ ANNUAL REPORT PURSUANT TO SECTION 13 OR 15(d) OF THE SECURITIES EXCHANGE
ACT OF 1934
For the fiscal year ended December 31, 2014
‘ TRANSITION REPORT PURSUANT TO SECTION 13 OR 15(d) OF THE SECURITIESEXCHANGE ACT OF 1934
For the transition period from to
Commission file number 1-4801
BARNES GROUP INC.(Exact name of registrant as specified in its charter)
Delaware 06-0247840(State of incorporation) (I.R.S. Employer Identification No.)
123 Main Street, Bristol, Connecticut 06010(Address of Principal Executive Office) (Zip Code)
(860) 583-7070Registrant’s telephone number, including area code
Securities registered pursuant to Section 12(b) of the Act:
Title of each class Name of each exchange on which registered
Common Stock, $0.01 Par Value New York Stock Exchange
Securities registered pursuant to Section 12(g) of the Act:None
Indicate by check mark if the registrant is a well-known seasoned issuer, as defined in Rule 405 of the SecuritiesAct. Yes È No ‘
Indicate by check mark if the registrant is not required to file reports pursuant to Section 13 or Section 15(d) of theAct. Yes ‘ No È
Indicate by check mark whether the registrant: (1) has filed all reports required to be filed by Section 13 or 15(d) of the SecuritiesExchange Act of 1934 during the preceding 12 months (or for such shorter period that the registrant was required to file such reports); and(2) has been subject to such filing requirements for the past 90 days. Yes È No ‘
Indicate by check mark whether the registrant has submitted electronically and posted on its corporate Web site, if any, everyInteractive Data File required to be submitted and posted pursuant to Rule 405 of Regulation S-T (§ 232.405 of this chapter) during thepreceding 12 months (or for such shorter period that the registrant was required to submit and post such files). Yes È No ‘
Indicate by check mark if disclosure of delinquent filers pursuant to Item 405 of Regulation S-K is not contained herein, and will notbe contained, to the best of registrant’s knowledge, in definitive proxy or information statements incorporated by reference in Part III ofthis Form 10-K or any amendment to this Form 10-K. ‘
Indicate by check mark whether the registrant is a large accelerated filer, an accelerated filer, a non-accelerated filer, or a smallerreporting company. See definitions of “large accelerated filer,” “accelerated filer,” and “smaller reporting company” in Rule 12b-2 of theExchange Act. (Check one):
Large accelerated filer È Accelerated filer ‘
Non-accelerated filer ‘ Smaller reporting company ‘
Indicate by check mark whether the registrant is a shell company (as defined in Rule 12b-2 of the Act). Yes ‘ No È
The aggregate market value of the voting stock (Common Stock) held by non-affiliates of the registrant as of the close of business onJune 30, 2014 was approximately $1,968,076,394 based on the closing price of the Common Stock on the New York Stock Exchange onthat date. The registrant does not have any non-voting common equity.
The registrant had outstanding 54,628,975 shares of common stock as of February 18, 2015.
Documents Incorporated by Reference
Portions of the registrant’s definitive proxy statement to be delivered to stockholders in connection with the Annual Meeting ofStockholders to be held May 8, 2015 are incorporated by reference into Part III.
Barnes Group Inc.Index to Form 10-K
Year Ended December 31, 2014
Page
Part IItem 1. Business 1Item 1A. Risk Factors 4Item 1B. Unresolved Staff Comments 13Item 2. Properties 13Item 3. Legal Proceedings 13Item 4. Mine Safety Disclosures 14
Part IIItem 5. Market for Registrant’s Common Equity, Related Stockholder Matters and Issuer Purchases of
Equity Securities 15Item 6. Selected Financial Data 17Item 7. Management’s Discussion and Analysis of Financial Condition and Results of Operations 18Item 7A. Quantitative and Qualitative Disclosures About Market Risk 35Item 8. Financial Statements and Supplementary Data 36Item 9. Changes in and Disagreements with Accountants on Accounting and Financial Disclosure 73Item 9A. Controls and Procedures 73Item 9B. Other Information 74
Part IIIItem 10. Directors, Executive Officers and Corporate Governance 75Item 11. Executive Compensation 76Item 12. Security Ownership of Certain Beneficial Owners and Management and Related Stockholder
Matters 76Item 13. Certain Relationships and Related Transactions, and Director Independence 76Item 14. Principal Accounting Fees and Services 76
Part IVItem 15. Exhibits, Financial Statement Schedules 77
This Annual Report on Form 10-K contains “forward-looking statements” within the meaning of Section 27A ofthe Securities Act of 1933 and Section 21E of the Securities Exchange Act of 1934. See “FORWARD-LOOKING STATEMENTS” under Part I – Item 1 “Business” of this Annual Report on Form 10-K.

PART I
Item 1. Business
BARNES GROUP INC. (1)
Founded in 1857, Barnes Group Inc. (the “Company”) is an international industrial and aerospace manufacturer andservice provider, serving a wide range of end markets and customers. The highly engineered products, differentiatedindustrial technologies, and innovative solutions delivered by the Company are used in far-reaching applications that providetransportation, manufacturing, healthcare products, and technology to the world. The Company’s approximately 4,500 skilledand dedicated employees, at more than 60 locations worldwide, are committed to achieving consistent and sustainableprofitable growth. We operate under two global business segments: Industrial and Aerospace.
In the second quarter of 2013, the Company completed the sale of its Barnes Distribution North America business(“BDNA”) to MSC Industrial Direct Co., Inc. (“MSC”) pursuant to the terms of the Asset Purchase Agreement datedFebruary 22, 2013 (the “APA”) between the Company and MSC. See Note 2 of the Consolidated Financial Statements.
In the first quarter of 2013, the Company realigned its reportable business segments by transferring the AssociatedSpring Raymond business (“Raymond”), its remaining business within the former Distribution segment, to the Industrialsegment. Raymond sells, among other products, springs that are manufactured by one of the Industrial businesses.
In the fourth quarter of 2011, the Company completed the sale of its Barnes Distribution Europe businesses (the “BDE”business). The BDE business was comprised of the Company’s European KENT, Toolcom and BD France distributionbusinesses that were reported within the Company’s former Distribution segment. See Note 2 of the Consolidated FinancialStatements.
All previously reported financial information has been adjusted on a retrospective basis to reflect the segmentrealignment and the discontinued operations for all years presented.
INDUSTRIAL
Industrial is a global manufacturer of highly-engineered, high-quality precision parts, products and systems for criticalapplications serving a diverse customer base in end-markets such as transportation, industrial equipment, consumer products,packaging, electronics, medical devices, and energy. Focused on innovative custom solutions, Industrial participates in thedesign phase of components and assemblies whereby customers receive the benefits of application and systems engineering,new product development, testing and evaluation, and the manufacturing of final products. Products are sold primarilythrough its direct sales force and global distribution channels. Industrial designs and manufactures customized hot runnersystems and precision mold assemblies – the enabling technologies for many complex injection molding applications. It is aleading manufacturer and supplier of precision mechanical products, including mechanical springs and nitrogen gas products.Industrial manufactures high-precision punched and fine-blanked components used in transportation and industrialapplications, nitrogen gas springs and manifold systems used to precisely control stamping presses, and retention rings thatposition parts on a shaft or other axis. Industrial is equipped to produce virtually every type of precision spring, from finehairsprings for electronics and instruments to large heavy-duty springs for machinery.
In the fourth quarter of 2013, the Company and two of its subsidiaries (collectively with the Company, the “Purchaser”)completed the acquisition of the Männer Business (defined below) pursuant to the terms of the Share Purchase andAssignment Agreement dated September 30, 2013 (“Share Purchase Agreement”) among the Purchaser, Otto MännerHolding AG, a German company based in Bahlingen, Germany (the “Seller”), and the three shareholders of the Seller(“the Männer Business”). The acquisition has been integrated into the Industrial segment. The Männer Business serves as aleader in the development and manufacture of high precision molds, valve gate hot runner systems, and system solutions forthe medical/ pharmaceutical, packaging, and personal care/health care industries. The Männer Business includesmanufacturing locations in Germany, Switzerland and the United States, and sales and service offices in Europe, theUnited States, Hong Kong/China and Japan. See Note 3 of the Consolidated Financial Statements.
During the third quarter of 2012, the Company completed the acquisition of Synventive Molding Solutions(“Synventive”), a leading designer and manufacturer of highly engineered and customized hot runner systems andcomponents. See Note 3 of the Consolidated Financial Statements.
(1) As used in this annual report, “Company,” “Barnes Group,” “we” and “ours” refer to the registrant and its consolidated subsidiaries except where thecontext requires otherwise, and “Industrial” and “Aerospace” refer to the registrant’s segments, not to separate corporate entities.
1

Industrial competes with a broad base of large and small companies engaged in the manufacture and sale of custommetal components and assemblies, precision molds, and hot runner systems. Industrial competes on the basis of quality,service, reliability of supply, engineering and technical capability, geographic reach, product breadth, innovation, design, andprice. Industrial has manufacturing, distribution and assembly operations in the United States, Brazil, China, Germany,Mexico, Singapore, Sweden and Switzerland. Industrial also has sales and service operations in the United States, Brazil,Canada, China/Hong Kong, France, India, Italy, Japan, Mexico, the Netherlands, Portugal, Singapore, Slovakia, South Korea,Spain, Thailand and the United Kingdom. Sales by Industrial to its three largest customers accounted for approximately 10%of its sales in 2014.
AEROSPACE
Aerospace is a global provider of precision-machined and fabricated components and assemblies for original equipmentmanufacturer (“OEM”) turbine engine, airframe and industrial gas turbine builders, and the military. The Aerospaceaftermarket business provides jet engine component maintenance overhaul and repair (“MRO”) services, including ourComponent Repair Programs (“CRPs”), for many of the world’s major turbine engine manufacturers, commercial airlinesand the military. The Aerospace aftermarket activities also include the manufacture and delivery of aerospace aftermarketspare parts, including the revenue sharing programs (“RSPs”) under which the Company receives an exclusive right tosupply designated aftermarket parts over the life of the related aircraft engine program.
Aerospace’s OEM business supplements the leading jet engine OEM capabilities and competes with a large number ofmachining and fabrication companies. Competition is based mainly on quality, engineering and technical capability, productbreadth, new product introduction, timeliness, service and price. Aerospace’s machining and fabrication operations, withfacilities in Arizona, Connecticut, Michigan, Ohio, Utah and Singapore, produce critical engine and airframe componentsthrough technically advanced manufacturing processes.
The Aerospace aftermarket business supplements jet engine OEMs’ maintenance, repair and overhaul capabilities, andcompetes with the service centers of major commercial airlines and other independent service companies for the repair andoverhaul of turbine engine components. The manufacture and supply of aerospace aftermarket spare parts, including thoserelated to the RSPs, are dependent upon the reliable and timely delivery of high-quality components. Aerospace’saftermarket facilities, located in Connecticut, Ohio and Singapore, specialize in the repair and refurbishment of highlyengineered components and assemblies such as cases, rotating life limited parts, rotating air seals, turbine shrouds, vanes andhoneycomb air seals. Sales by Aerospace to its largest customer, General Electric, accounted for approximately 54% of itssales in 2014. Sales to its next two largest customers in 2014 collectively accounted for approximately 16% of its total sales.
FINANCIAL INFORMATION
The backlog of the Company’s orders believed to be firm at the end of 2014 was $729 million as compared with $758million at the end of 2013. Of the 2014 year-end backlog, $523 million was attributable to Aerospace and $206 million wasattributable to Industrial. Approximately 41% of the Company’s year-end backlog is scheduled to be shipped after 2015. Theremainder of the Company’s backlog is scheduled to be shipped during 2015.
We have a global manufacturing footprint to service our worldwide customer base. The global economies have asignificant impact on the financial results of the business as we have significant operations outside of the United States. Foran analysis of our revenue from sales to external customers, operating profit and assets by business segment, as well asrevenues from sales to external customers and long-lived assets by geographic area, see Note 20 of the ConsolidatedFinancial Statements. For a discussion of risks attendant to the global nature of our operations and assets, see Item 1A. RiskFactors.
RAW MATERIALS
The principal raw materials used to manufacture our products are various grades and forms of steel, from rolled steelbars, plates and sheets to high-grade valve steel wires and sheets, various grades and forms (bars, sheets, forgings andcastings) of stainless steels, aluminum alloys, titanium alloys, copper alloys, graphite, and iron-based, nickel-based(Inconels) and cobalt-based (Hastelloys) superalloys for complex aerospace applications. Prices for steel, titanium, Inconel,Hastelloys as well as other specialty materials have periodically increased due to higher demand and, in some cases,reduction of the availability of materials. If this occurs, the availability of certain raw materials used by us or in products soldby us may be negatively impacted.
2
RESEARCH AND DEVELOPMENT
Many of the products manufactured by us are custom parts made to customers’ specifications. We are also engaged incontinuing efforts aimed at discovering and implementing new knowledge that is critical to developing new products,processes and services, significantly improving existing products and services, and developing new applications for existingproducts and services. Investments in research and development are important to our long-term growth, enabling us to keeppace with changing customer and marketplace needs. We spent approximately $16 million, $15 million and $9 million in2014, 2013 and 2012, respectively, on research and development activities.
PATENTS AND TRADEMARKS
The Company is a party to certain licenses of intellectual property and holds numerous patents, trademarks, and tradenames which are important to certain business units and enhance our competitive position. The Company does not believe,however, that any of these licenses, patents, trademarks or trade names is individually significant to the Company or either ofour segments. We maintain procedures to protect our intellectual property (including patents and trademarks) bothdomestically and internationally. Risk factors associated with our intellectual property are discussed in Item 1A. RiskFactors.
EXECUTIVE OFFICERS OF THE COMPANY
For information regarding the Executive Officers of the Company, see Part III, Item 10 of this Annual Report.
ENVIRONMENTAL
Compliance with federal, state, and local laws, as well as those of other countries, which have been enacted or adoptedregulating the discharge of materials into the environment or otherwise relating to the protection of the environment has nothad a material effect, and is not expected to have a material effect, upon our capital expenditures, earnings, or competitiveposition.
AVAILABLE INFORMATION
Our Internet address is www.BGInc.com. Our annual report on Form 10-K, quarterly reports on Form 10-Q, currentreports on Form 8-K, and amendments to those reports are available without charge on our website as soon as reasonablypracticable after they are filed with, or furnished to, the U.S. Securities and Exchange Commission (“SEC”). In addition, wehave posted on our website, and will make available in print to any stockholder who makes a request, our CorporateGovernance Guidelines, our Code of Business Ethics and Conduct and the charters of the Audit Committee, Compensationand Management Development Committee and Corporate Governance Committee (the responsibilities of which includeserving as the nominating committee) of the Company’s Board of Directors. References to our website addressed in thisAnnual Report are provided as a convenience and do not constitute, and should not be viewed as, an incorporation byreference of the information contained on, or available through, the website. Therefore, such information should not beconsidered part of this Annual Report.
FORWARD-LOOKING STATEMENTS
Certain of the statements in this Annual Report may contain forward-looking statements as defined in the PrivateSecurities Litigation Reform Act of 1995. Forward-looking statements often address our expected future operating andfinancial performance and financial condition, and often contain words such as “anticipate,” “believe,” “expect,” “plan,”“strategy,” “estimate,” “project,” and similar terms. These forward-looking statements do not constitute guarantees of futureperformance and are subject to a variety of risks and uncertainties that may cause actual results to differ materially fromthose expressed in the forward-looking statements. These include, among others: difficulty maintaining relationships withemployees, including unionized employees, customers, distributors, suppliers, business partners or governmental entities;failure to successfully negotiate collective bargaining agreements or potential strikes, work stoppages or other similar events;difficulties leveraging market opportunities; changes in market demand for our products and services; rapid technologicaland market change; the ability to protect intellectual property rights; introduction or development of new products or transferof work; higher risks in international operations and markets; the impact of intense competition; and other risks anduncertainties described in this Annual Report including, among others, uncertainties relating to conditions in financialmarkets; currency fluctuations and foreign currency exposure; future financial performance of the industries or customersthat we serve; our dependence upon revenues and earnings from a small number of significant customers; a major loss ofcustomers; inability to realize expected sales or profits from existing backlog due to a range of factors, including insourcing
3

decisions, material changes, production schedules and volumes of specific programs; the impact of government budget andfunding decisions; changes in raw material or product prices and availability; integration of acquired businesses;restructuring costs or savings; the continuing impact of prior acquisitions and divestitures and any other future strategicactions, including acquisitions, joint ventures, divestitures, restructurings, or strategic business realignments, and our abilityto achieve the financial and operational targets set in connection with any such actions; the outcome of pending and futurelegal, governmental, or regulatory proceedings and contingencies and uninsured claims; future repurchases of common stock;future levels of indebtedness; and numerous other matters of a global, regional or national scale, including those of apolitical, economic, business, competitive, environmental, regulatory and public health nature. The Company assumes noobligation to update its forward-looking statements.
Item 1A. Risk Factors
Our business, financial condition or results of operations could be materially adversely affected by any of the followingrisks. Please note that additional risks not presently known to us may also materially impact our business and operations.
RISKS RELATED TO OUR BUSINESS
We depend on revenues and earnings from a small number of significant customers. Any bankruptcy of or loss,cancellation, reduction or delay in purchases by these customers could harm our business. In 2014, our net sales toGeneral Electric and its subsidiaries accounted for 19% of our total sales and approximately 54% of Aerospace’s net sales.Additionally, approximately 16% of Aerospace’s sales in 2014 were to its next two largest customers. Approximately 10% ofIndustrial’s sales in 2014 were to its three largest customers. Some of our success will depend on the business strength andviability of those customers. We cannot assure you that we will be able to retain our largest customers. A tightening in thecredit markets may affect our customers’ ability to raise debt or equity capital. This may reduce the amount of liquidityavailable to our customers which may limit their ability to purchase products. Some of our customers may in the futurereduce their purchases due to economic conditions or shift their purchases from us to our competitors, in-house or to othersources. Some of our long-term sales agreements provide that until a firm order is placed by a customer for a particularproduct, the customer may unilaterally reduce or discontinue its projected purchases without penalty, or terminate forconvenience. The loss of one or more of our largest customers, any reduction, cancellation or delay in sales to thesecustomers (including a reduction in aftermarket volume in our RSPs), our inability to successfully develop relationships withnew customers, or future price concessions we make to retain customers could significantly reduce our sales and profitability.
We have significant indebtedness that could affect our operations and financial condition. At December 31, 2014,we had consolidated debt obligations of $504.7 million, representing approximately 31% of our total capital (indebtednessplus stockholders’ equity) as of that date. Our level of indebtedness, proportion of variable rate debt obligations and thesignificant debt servicing costs associated with that indebtedness may adversely affect our operations and financial condition.For example, our indebtedness could require us to dedicate a substantial portion of our cash flows from operations topayments on our debt, thereby reducing the amount of our cash flows available for working capital, capital expenditures,investments in technology and research and development, acquisitions, dividends and other general corporate purposes; limitour flexibility in planning for, or reacting to, changes in the industries in which we compete; place us at a competitivedisadvantage compared to our competitors, some of whom have lower debt service obligations and greater financialresources than we do; limit our ability to borrow additional funds; or increase our vulnerability to general adverse economicand industry conditions. In addition, conditions in the worldwide credit markets may limit our ability to expand our creditlines beyond current bank commitments.
Economic weakness and uncertainty could adversely affect our operations and financial condition. Prolongedslow growth or a downturn, worsening or broadening of adverse conditions in the worldwide and domestic economies couldaffect purchases of our products, and create or exacerbate credit issues, cash flow issues and other financial hardships for usand for our suppliers and customers. Depending upon their severity and duration, these conditions could have a materialadverse impact on our business, liquidity, financial condition and results of operations.
Our failure to meet certain financial covenants required by our debt agreements may materially and adverselyaffect our assets, financial position and cash flows. A majority of our debt arrangements require us to maintain certain debtand interest coverage ratios and limit our ability to incur debt, make investments or undertake certain other businessactivities. These requirements could limit our ability to obtain future financing and may prevent us from taking advantage ofattractive business opportunities. Our ability to meet the financial covenants or requirements in our debt arrangements maybe affected by events beyond our control, and we cannot assure you that we will satisfy such covenants and requirements. Abreach of these covenants or our inability to comply with the restrictions could result in an event of default under our debt
4
arrangements which, in turn, could result in an event of default under the terms of our other indebtedness. Upon theoccurrence of an event of default under our debt arrangements, after the expiration of any grace periods, our lenders couldelect to declare all amounts outstanding under our debt arrangements, together with accrued interest, to be immediately dueand payable. If this were to happen, we cannot assure you that our assets would be sufficient to repay in full the paymentsdue under those arrangements or our other indebtedness or that we could find alternative financing to replace thatindebtedness.
Our operations depend on our manufacturing, sales, and service facilities and information systems in variousparts of the world which are subject to physical, financial, regulatory, environmental, operational and other risks thatcould disrupt our operations. We have a significant number of manufacturing facilities and technical service, and salescenters both within and outside the U.S. The international scope of our business subjects us to increased risks anduncertainties such as threats of war, terrorism and instability of governments; compliance with U.S. laws affecting operationsoutside of the U.S., such as the Foreign Corrupt Practices Act; and economic, regulatory and legal systems in countries inwhich we or our customers conduct business.
Some of our facilities are located in areas that may be affected by natural disasters, including earthquakes or tsunamis,which could cause significant damage and disruption to the operations of those facilities and, in turn, could have a materialadverse effect on our business, financial condition, results of operations and cash flows. Additionally, some of ourmanufacturing equipment and tooling is custom-made and is not readily replaceable. Loss of such equipment or tooling couldhave a negative impact on our manufacturing business, financial condition, results of operations and cash flows.
Although we have obtained property damage and business interruption insurance, a major catastrophe such as anearthquake, hurricane, flood, tsunami or other natural disaster at any of our sites, or significant labor strikes, work stoppages,political unrest, or any of the events described above, in any of the areas where we conduct operations could result in aprolonged interruption of our business. Any disruption resulting from these events could cause significant delays in themanufacture or shipment of products or the provision of repair and other services that may result in our loss of sales andcustomers. Our insurance will not cover all potential risks, and we cannot assure you that we will have adequate insurance tocompensate us for all losses that result from any insured risks. Any material loss not covered by insurance could have amaterial adverse effect on our financial condition, results of operations and cash flows. We cannot assure you that insurancewill be available in the future at a cost acceptable to us or at a cost that will not have a material adverse effect on ourprofitability, net income and cash flows.
Any disruption or failure in the operation of our information systems, including from conversions or integrationsof information technology or reporting systems, could have a material adverse effect on our business, financialcondition, results of operations and cash flows. Our information technology (IT) systems are an integral part of ourbusiness. We depend upon our IT systems to help process orders, manage inventory and collect accounts receivable. Our ITsystems also allow us to purchase, sell and ship products efficiently and on a timely basis, to maintain cost-effectiveoperations, and to help provide superior service to our customers. We are currently in the process of implementing enterpriseresource planning (ERP) platforms across certain of our businesses, and we expect that we will need to continue to improveand further integrate our IT systems, on an ongoing basis in order to effectively run our business. If we fail to successfullymanage and integrate our IT systems, including these ERP platforms, it could adversely affect our business or operatingresults.
Further, in the ordinary course of our business, we store sensitive data, including intellectual property, our proprietarybusiness information and that of our customers, suppliers and business partners, and personally identifiable information ofour employees, in our data centers and on our networks. The secure maintenance and transmission of this information iscritical to our business operations. Despite our security measures, our information technology and infrastructure may bevulnerable to attacks by hackers or breached due to employee error, malfeasance or other disruptions. Any such breach couldcompromise our networks and the information stored there could be accessed, publicly disclosed, lost or stolen. Any suchaccess, disclosure or other loss of information could result in legal claims or proceedings, liability under laws that protect theprivacy of personal information, and regulatory penalties, disrupt our operations, and damage our reputation, which couldadversely affect our business, revenues and competitive position.
The global nature of our business exposes us to foreign currency fluctuations that may affect our future revenues,debt levels and profitability. We have manufacturing facilities and technical service, sales and distribution centers aroundthe world, and the majority of our foreign operations use the local currency as their functional currency. These include,among others, the Brazilian real, British pound sterling, Canadian dollar, Chinese yuan, Euro, Japanese yen, Korean won,Mexican peso, Singapore dollar, Swedish krona, Swiss franc and Thai baht. Since our financial statements are denominated
5
in U.S. dollars, changes in currency exchange rates between the U.S. dollar and other currencies expose us to translation riskwhen the local currency financial statements are translated to U.S. dollars. Changes in currency exchange rates may alsoexpose us to transaction risk. We may buy protecting or offsetting positions or hedges in certain currencies to reduce ourexposure to currency exchange fluctuations; however, these transactions may not be adequate or effective to protect us fromthe exposure for which they are purchased. We have not engaged in any speculative hedging activities. Currency fluctuationsmay impact our revenues and profitability in the future.
The global nature of our operations and assets subject us to additional financial and regulatory risks. We haveoperations and assets in various parts of the world. In addition, we sell or may in the future sell our products and services tothe U.S. and foreign governments and in foreign countries. As a global business, we are subject to complex laws andregulations in the U.S. and other countries in which we operate, and associated risks, including: U.S. imposed embargoes ofsales to specific countries; foreign import controls (which may be arbitrarily imposed or enforced); import regulations andduties; export regulations (which require us to comply with stringent licensing regimes); anti-dumping regulations;unclaimed property regulations; price and currency controls; exchange rate fluctuations; dividend remittance restrictions;expropriation of assets; war, civil uprisings and riots; government instability; government contracting requirements includingcost accounting standards, including various procurement, security, and audit requirements, as well as requirements to certifyto the government compliance with these requirements; the necessity of obtaining governmental approval for new andcontinuing products and operations; and legal systems or decrees, laws, taxes, regulations, interpretations and court decisionsthat are not always fully developed and that may be retroactively or arbitrarily applied. We have experienced inadvertentviolations of some of these regulations, including export regulations, safety and environmental regulations, regulationsprohibiting sales of certain products and product labeling regulations, in the past, none of which has had or, we believe, willhave a material adverse effect on our business. However, any significant violations of these or other regulations in the futurecould result in civil or criminal sanctions, and the loss of export or other licenses which could have a material adverse effecton our business. We may also be subject to unanticipated income taxes, excise duties, import taxes, export taxes, value addedtaxes, or other governmental assessments, and taxes may be impacted by changes in legislation in the tax jurisdictions inwhich we operate. In addition, our organizational and capital structure may limit our ability to transfer funds betweencountries, particularly into the U.S., without incurring adverse tax consequences. Any of these events could result in a loss ofbusiness or other unexpected costs that could reduce sales or profits and have a material adverse effect on our financialcondition, results of operations and cash flows.
Our ability to recover deferred tax assets depends on future income. From time to time, we may have significantdeferred tax assets. The realization of these assets is dependent on our ability to generate future taxable income. In the eventwe do not generate sufficient taxable income, there could be a material adverse effect on our financial condition and resultsof operations.
Changes in the availability or price of materials, products and energy resources could adversely affect our costsand profitability. We may be adversely affected by the availability or price of raw materials, products and energy resources,particularly related to certain manufacturing operations that utilize steel, stainless steel, titanium, Inconel, Hastelloys andother specialty materials. The availability and price of raw materials and energy resources may be subject to curtailment orchange due to, among other things, new laws or regulations, global economic or political events including strikes, terroristattacks and war, suppliers’ allocations to other purchasers, interruptions in production by suppliers, changes in exchangerates and prevailing price levels. In some instances there are limited sources for raw materials and a limited number ofprimary suppliers for some of our products for resale. Although we are not dependent upon any single source for any of ourprincipal raw materials or products for resale, and such materials and products have, historically, been readily available, wecannot assure you that such raw materials and products will continue to be readily available. Disruption in the supply of rawmaterials, products or energy resources or our inability to come to favorable agreements with our suppliers could impair ourability to manufacture, sell and deliver our products and require us to pay higher prices. Any increase in prices for such rawmaterials, products or energy resources could materially adversely affect our costs and our profitability.
Under the Dodd-Frank Wall Street Reform and Consumer Protection Act, the SEC established disclosure and reportingrequirements regarding the use of “conflict minerals” mined from the Democratic Republic of Congo and adjoiningcountries. These requirements could adversely affect the sourcing and availability of minerals used in the manufacture ofcertain of our products. As a result, we may not be able to obtain certain materials or products at competitive prices. We haveand expect to continue to incur costs to comply with these new requirements, including for due diligence to identify thesources of any conflict minerals used in our products. Further, we may face reputational risk and other challenges with ourcustomers and suppliers if we are unable to verify sufficiently that the minerals used in our products are conflict free.
We maintain pension and other postretirement benefit plans in the U.S. and certain international locations. Ourcosts of providing defined benefit plans are dependent upon a number of factors, such as the rates of return on the plans’
6

assets, exchange rate fluctuations, future governmental regulation, global equity prices, and our required and/or voluntarycontributions to the plans. Declines in the stock market, prevailing interest rates, declines in discount rates, improvements inmortality rates and rising medical costs may cause an increase in our pension and other postretirement benefit expenses in thefuture and result in reductions in our pension fund asset values and increases in our pension and other postretirement benefitobligations. These changes have caused and may continue to cause a significant reduction in our net worth and withoutsustained growth in the pension investments over time to increase the value of the plans’ assets, and depending upon theother factors listed above, we could be required to increase funding for some or all of these pension and postretirement plans.
Our cash is highly concentrated with certain financial institutions. At various times we have a concentration of cashin accounts with financial institutions in the U.S. and around the globe. Our holdings in certain of these institutionssignificantly exceeded the insured limits of the Federal Deposit Insurance Corporation or their equivalent outside the U.S. atDecember 31, 2014.
We carry significant inventories and a loss in net realizable value could cause a decline in our net worth. AtDecember 31, 2014, our inventories totaled $212.0 million. Inventories are valued at the lower of cost or market based onmanagement’s judgments and estimates concerning future sales levels, quantities and prices at which such inventories will besold in the normal course of business. Accelerating the disposal process or incorrect estimates of future sales potential maynecessitate future reduction to inventory values. The Company’s inventories include certain parts related to specific engineswithin the aftermarket repair and overhaul business. The demand for these parts and our ability to utilize these parts dependson the frequency and scope of repair and maintenance of aircraft engines and our ability to effectively access that market, anda decline in demand could require us to write off a portion of our inventory. See “Part II – Item 7 – Management’sDiscussion and Analysis of Financial Condition and Results of Operations – Critical Accounting Policies”.
We have significant goodwill and an impairment of our goodwill could cause a decline in our net worth. Our totalassets include substantial goodwill. At December 31, 2014, our goodwill totaled $594.9 million. The goodwill results fromour prior acquisitions, representing the excess of the purchase price we paid over the net assets of the companies acquired.We assess whether there has been an impairment in the value of our goodwill during each calendar year or sooner iftriggering events warrant. If future operating performance at one or more of our reporting units does not meet expectations orfair values fall due to significant stock market declines, we may be required to reflect a non-cash charge to operating resultsfor goodwill impairment. The recognition of an impairment of a significant portion of goodwill would negatively affect ourresults of operations and total capitalization, the effect of which could be material. See “Part II – Item 7 – Management’sDiscussion and Analysis of Financial Condition and Results of Operations – Critical Accounting Policies”.
We could be adversely affected by changes in interest rates. Our profitability may be adversely affected as a result ofincreases in interest rates. At December 31, 2014, we and our subsidiaries had approximately $504.7 million aggregateprincipal amount of consolidated debt obligations outstanding, of which approximately 60% had interest rates that float withthe market (not hedged against interest rate fluctuations). A 100 basis point increase in the interest rate on the floating ratedebt in effect at December 31, 2014 would result in an approximate $3.0 million annualized increase in interest expense.
We may not realize all of the sales expected from our existing backlog or anticipated orders. At December 31,2014, we had $728.6 million of order backlog, the majority of which related to aerospace OEM customers. There can be noassurances that the revenues projected in our backlog will be realized or, if realized, will result in profits. We considerbacklog to be firm customer orders for future delivery. From time to time, OEM customers provide projections ofcomponents and assemblies that they anticipate purchasing in the future under new and existing programs. Such projectionsare not included in our backlog unless we have received a firm order from our customers. Our customers may have the rightunder certain circumstances or with certain penalties or consequences to terminate, reduce or defer firm orders that we havein backlog. If our customers terminate, reduce or defer firm orders, we may be protected from certain costs and losses, butour sales will nevertheless be adversely affected. Although we strive to maintain ongoing relationships with our customers,there is an ongoing risk that orders may be cancelled or rescheduled due to fluctuations in our customers’ business needs orpurchasing budgets.
Also, our realization of sales from new and existing programs is inherently subject to a number of important risks anduncertainties, including whether our customers execute the launch of product programs on time, or at all, the number of unitsthat our customers actually produce, the timing of production and manufacturing insourcing decisions made by ourcustomers. In addition, until firm orders are placed, our customers generally have the right to discontinue a program orreplace us with another supplier at any time without penalty. Our failure to realize sales from new and existing programscould have a material adverse effect on our net sales, results of operations and cash flows.
7
We may not recover all of our up-front costs related to new or existing programs. New programs may requiresignificant up-front investments for capital equipment, engineering, inventory, design and tooling. As OEMs in thetransportation and aerospace industries have looked to suppliers to bear increasing responsibility for the design, engineeringand manufacture of systems and components, they have increasingly shifted the financial risk associated with thoseresponsibilities to the suppliers as well. This trend may continue and is most evident in the area of engineering costreimbursement. We cannot assure you that we will have adequate funds to make such up-front investments or to recover suchcosts from our customers as part of our product pricing. In the event that we are unable to make such investments, or torecover them through sales or direct reimbursement from our customers, our profitability, liquidity and cash flows may beadversely affected. In addition, we incur costs and make capital expenditures for new program awards based upon certainestimates of production volumes and production complexity. While we attempt to recover such costs and capital expendituresby appropriately pricing our products, the prices of our products are based in part upon planned production volumes. If theactual production is significantly less than planned or significantly more complex than anticipated, we may be unable torecover such costs. In addition, because a significant portion of our overall costs is fixed, declines in our customers’production levels can adversely affect the level of our reported profits even if our up-front investments are recovered.
We may not realize all of the intangible assets related to the Aerospace aftermarket businesses. Our totalinvestments in participation fees under our Revenue Sharing Programs (RSPs) as of December 31, 2014 equaled$293.7 million, all of which have been paid. At December 31, 2014, the remaining unamortized balance of these participationfees was $220.7 million. We participate in aftermarket RSPs under which we receive an exclusive right to supply designatedaftermarket parts over the life of the related aircraft engine program to our customer, General Electric. As consideration, wepay participation fees, which are recorded as intangible assets and are recognized as a reduction of sales over the estimateduseful life of the related engine programs which range up to 30 years.
We entered into Component Repair Programs (“CRPs”), also with General Electric, during the fourth quarter of 2013(“CRP 1”) and the second quarter of 2014 (“CRP 2”). The CRPs provide for, among other items, the right to sell certainaftermarket component repair services for CFM56, CF6 and LM engines directly to other customers as one of a few GElicensed suppliers. In addition, the CRPs extend certain existing contracts under which the Company currently provides theseservices directly to GE.
We agreed to pay $26.6 million as consideration for the rights related to CRP 1. Of this balance, we paid $16.6 millionin the fourth quarter of 2013 and $9.1 million in the fourth quarter of 2014. The remaining payment of $0.9 million has beenincluded within accrued liabilities in the Consolidated Financial Statements. We agreed to pay $80.0 million as considerationfor the rights related to CRP 2. We paid $41.0 million in the second quarter of 2014, $20.0 million in the fourth quarter of2014 and the remaining payment of $19.0 million, also included within accrued liabilities, will be paid in the second quarterof 2015. We recorded the CRP payments as an intangible asset which is recognized as a reduction of sales over the remaininguseful life of these engine programs.
The realizability of each asset is dependent upon future revenues related to the programs’ aftermarket parts and servicesand is subject to impairment testing if circumstances indicate that its carrying amount may not be recoverable. The potentialexists that actual revenues will not meet expectations due to a change in market conditions, including, for example, thereplacement of older engines with new, more fuel-efficient engines or our ability to capture additional market share withinthe aftermarket business. A shortfall in future revenues may result in the failure to realize the net amount of the investments,which could adversely affect our financial condition and results of operations. In addition, future growth and profitabilitycould be impacted by the amortization of the participation fees and licenses, and the expiration of the international taxincentives on these programs.
We face risks of cost overruns and losses on fixed-price contracts. We sell certain of our products under firm, fixed-price contracts providing for a fixed price for the products regardless of the production or purchase costs incurred by us. Thecost of producing products may be adversely affected by increases in the cost of labor, materials, fuel, outside processing,overhead and other factors, including manufacturing inefficiencies. Increased production costs may result in cost overrunsand losses on contracts.
The departure of existing management and key personnel, a shortage of skilled employees or a lack of qualifiedsales professionals could materially affect our business, operations and prospects. Our executive officers are importantto the management and direction of our business. Our future success depends, in large part, on our ability to retain or replacethese officers and other capable management personnel. Although we believe we will be able to attract and retain talentedpersonnel and replace key personnel should the need arise, our inability to do so could have a material adverse effect on ourbusiness, financial condition, results of operations or cash flows. Because of the complex nature of many of our products and
8
services, we are generally dependent on an educated and highly skilled workforce, including, for example, our engineeringtalent. In addition, there are significant costs associated with the hiring and training of sales professionals. We could beadversely affected by a shortage of available skilled employees or the loss of a significant number of our sales professionals.
If we are unable to protect our intellectual property rights effectively, our financial condition and results ofoperations could be adversely affected. We own or are licensed under various intellectual property rights, includingpatents, trademarks and trade secrets. Our intellectual property rights may not be sufficiently broad or otherwise may notprovide us a significant competitive advantage, and patents may not be issued for pending or future patent applicationsowned by or licensed to us. In addition, the steps that we have taken to maintain and protect our intellectual property may notprevent it from being challenged, invalidated, circumvented or designed-around, particularly in countries where intellectualproperty rights are not highly developed or protected. In some circumstances, enforcement may not be available to usbecause an infringer has a dominant intellectual property position or for other business reasons, or countries may requirecompulsory licensing of our intellectual property. We also rely on nondisclosure and noncompetition agreements withemployees, consultants and other parties to protect, in part, confidential information, trade secrets and other proprietaryrights. There can be no assurance that these agreements will adequately protect these intangible assets and will not bebreached, that we will have adequate remedies for any breach, or that others will not independently develop substantiallyequivalent proprietary information. Our failure to obtain or maintain intellectual property rights that convey competitiveadvantage, adequately protect our intellectual property or detect or prevent circumvention or unauthorized use of suchproperty and the cost of enforcing our intellectual property rights could adversely impact our competitive position, financialcondition and results of operations.
Any product liability, warranty, contractual or other claims in excess of insurance may adversely affect ourfinancial condition. Our operations expose us to potential product liability risks that are inherent in the design, manufactureand sale of our products and the products we buy from third parties and sell to our customers, or to potential warranty,contractual or other claims. For example, we may be exposed to potential liability for personal injury, property damage ordeath as a result of the failure of an aircraft component designed, manufactured or sold by us, or the failure of an aircraftcomponent that has been serviced by us or of the components themselves. While we have liability insurance for certain risks,our insurance may not cover all liabilities. Additionally, insurance coverage may not be available in the future at a costacceptable to us. Any material liability not covered by insurance or for which third-party indemnification is not available forthe full amount of the loss could have a material adverse effect on our financial condition, results of operations and cashflows.
From time to time, we receive product warranty claims, under which we may be required to bear costs of repair orreplacement of certain of our products. Warranty claims may range from individual customer claims to full recalls of allproducts in the field. We vigorously defend ourselves in connection with these matters. We cannot, however, assure you thatthe costs, charges and liabilities associated with these matters will not be material, or that those costs, charges and liabilitieswill not exceed any amounts reserved for them in our consolidated financial statements.
Our business, financial condition, results of operations and cash flows could be adversely impacted by strikes orwork stoppages. Approximately 15% of our U.S. employees are covered by collective bargaining agreements and more than32% of our non-U.S. employees are covered by collective bargaining agreements or statutory trade union agreements. TheCompany is currently in the process of negotiating a collective bargaining agreement (“CBA”) with certain unionizedemployees at the Bristol, Connecticut and Corry, Pennsylvania facilities, which are located within the Associated Springbusiness unit, and which covers approximately 233 employees. The current CBA expired on November 30, 2014, and wecontinue to negotiate a successor agreement. In 2015, we are also scheduled to conduct local negotiations with our unionizedemployees at our Corry, Pennsylvania facility, which covers approximately 130 employees. In addition, we have annualnegotiations in Brazil and Mexico and, collectively, these negotiations cover approximately 329 employees in those twocountries. We also expect to have negotiations in 2015 with two of our German locations, a Singapore location, and ourSweden location, which collectively cover over 500 employees. Although we believe that our relations with our employeesare good, we cannot assure you that we will be successful in negotiating new collective bargaining agreements or that suchnegotiations will not result in significant increases in the cost of labor, including healthcare, pensions or other benefits. Anypotential strikes or work stoppages, and the resulting adverse impact on our relationships with customers, could have amaterial adverse effect on our business, financial condition, results of operations or cash flows. Similarly, a protracted strikeor work stoppage at any of our major customers, suppliers or other vendors could materially adversely affect our business.
Changes in accounting guidance and taxation requirements could affect our financial results. New accountingguidance that may become applicable to us from time to time, or changes in the interpretations of existing guidance, couldhave a significant effect on our reported results for the affected periods. For example, the Financial Accounting Standards
9
Board issued a new accounting standard for revenue recognition in May 2014—Accounting Standards Update (ASU) 2014-09, “Revenue from Contracts with Customers (Topic 606)”. Although we are currently in the process of evaluating theimpact of ASU 2014-09 on our consolidated financial statements, it could change the way we account for certain of our salestransactions. Adoption of the standard could have a significant impact on our financial statements and may retroactivelyaffect the accounting treatment of transactions completed before adoption. In addition, our products are subject to import andexcise duties and/or sales or value-added taxes in many jurisdictions in which we operate. Increases in indirect taxes couldaffect our products’ affordability and therefore reduce our sales. We are also subject to income tax in numerous jurisdictionsin which we generate revenues. Changes in tax laws, tax rates or tax rulings may have a significant adverse impact on oureffective tax rate. Among other things, our tax liabilities are affected by the mix of pretax income or loss among the taxjurisdictions in which we operate and the repatriation of foreign earnings to the U.S. We must exercise judgment indetermining our worldwide provision for income taxes, interest and penalties; accordingly, future events could changemanagement’s assessment of these amounts.
RISKS RELATED TO THE INDUSTRIES IN WHICH WE OPERATE
A general economic downturn could adversely affect our business and financial results. All of our businesses areimpacted by the health of the economies in which they operate. A decline in economies in which we operate could reducedemand for our products and services or increase pricing pressures, thereby having an adverse impact on our business,financial condition, results of operations and cash flows. We derive a large portion of our sales from the transportationindustry. The operation of our business within that industry subjects us to the pressures applicable to all companies operatingin it, including unfavorable pricing pressures. While the precise effects of instability in the transportation industry aredifficult to determine, they may negatively impact our business, financial condition, results of operations and cash flows.
We operate in very competitive markets. We may not be able to compete effectively with our competitors, andcompetitive pressures could adversely affect our business, financial condition and results of operations. Our two globalbusiness segments compete with a number of larger and smaller companies in the markets we serve. Some of our competitorshave greater financial, production, research and development, or other resources than we do. Within Aerospace, certain ofour OEM customers compete with our repair and overhaul business. Some of our OEM customers in the aerospace industryalso compete with us where they have the ability to manufacture the components and assemblies that we supply to them buthave chosen, for capacity limitations, cost considerations or other reasons, to outsource the manufacturing to us. Our twobusiness segments compete on the basis of price, service, quality, reliability of supply, technology, innovation and design.We must continue to make investments to maintain and improve our competitive position. We cannot assure you that we willhave sufficient resources to continue to make such investments or that we will be successful in maintaining our competitiveposition. Our competitors may develop products or services, or methods of delivering those products or services that aresuperior to our products, services or methods. Our competitors may also adapt more quickly than us to new technologies orevolving customer requirements. Pricing pressures could cause us to adjust the prices of certain of our products to staycompetitive. We cannot assure you that we will be able to compete successfully with our existing or future competitors. Also,if consolidation of our existing competitors occurs, we would expect the competitive pressures we face to increase. Ourfailure to compete successfully could adversely affect our business, financial condition, results of operations and cash flows.
Our customers’ businesses are generally cyclical. Weaknesses in the industries in which our customers operatecould impact our revenues and profitability. The industries to which we sell tend to decline in response to overall declinesin industrial production. Aerospace is heavily dependent on the commercial aerospace industry, which is cyclical and a longcycle industry. Industrial is dependent on the transportation industry, and general industrial and tooling markets, all of whichare also cyclical. Many of our customers have historically experienced periodic downturns, which often have had a negativeeffect on demand for our products.
Original equipment manufacturers in the aerospace and transportation industries have significant pricingleverage over suppliers and may be able to achieve price reductions over time. Additionally, we may not be successfulin our efforts to raise prices on our customers. There is substantial and continuing pressure from OEMs in thetransportation industries, including automotive and aerospace, to reduce the prices they pay to suppliers. We attempt tomanage such downward pricing pressure, while trying to preserve our business relationships with our customers, by seekingto reduce our production costs through various measures, including purchasing raw materials and components at lower pricesand implementing cost-effective process improvements. Our suppliers have periodically resisted, and in the future may resist,pressure to lower their prices and may seek to impose price increases. If we are unable to offset OEM price reductions, ourprofitability and cash flows could be adversely affected. In addition, OEMs have substantial leverage in setting purchasingand payment terms, including the terms of accelerated payment programs under which payments are made prior to theaccount due date in return for an early payment discount. OEMs can unexpectedly change their purchasing policies orpayment practices, which could have a negative impact on our short-term working capital.
10
Demand for our defense-related products depends on government spending. A portion of Aerospace’s sales isderived from the military market, including single-sourced and dual-sourced sales. The military market is largely dependentupon government budgets and is subject to governmental appropriations. Although multi-year contracts may be authorized inconnection with major procurements, funds are generally appropriated on a fiscal year basis even though a program may beexpected to continue for several years. Consequently, programs are often only partially funded and additional funds arecommitted only as further appropriations are made. We cannot assure you that maintenance of or increases in defensespending will be allocated to programs that would benefit our business. Moreover, we cannot assure you that new militaryaircraft programs in which we participate will enter full-scale production as expected. A decrease in levels of defensespending or the government’s termination of, or failure to fully fund, one or more of the contracts for the programs in whichwe participate could have a material adverse effect on our financial position and results of operations.
The consolidation occurring in the industries in which we operate could adversely affect our business andfinancial results. The industries in which we operate have been experiencing consolidation. There has been consolidation ofboth suppliers and the customers we serve. Supplier consolidation is in part attributable to OEMs more frequently awardinglong-term sole source or preferred supplier contracts to the most capable suppliers in an effort to reduce the total number ofsuppliers from whom components and systems are purchased. We cannot assure you that our business, financial condition,results of operations or cash flows will not be adversely impacted as a result of consolidation by our competitors orcustomers.
The aerospace industry is highly regulated. Complications related to aerospace regulations may adversely affectthe Company. A substantial portion of our income is derived from our aerospace businesses. The aerospace industry ishighly regulated in the U.S. by the Federal Aviation Administration, or FAA, and in other countries by similar regulatoryagencies. We must be certified by these agencies and, in some cases, by individual OEMs in order to engineer and servicesystems and components used in specific aircraft models. If material authorizations or approvals were delayed, revoked orsuspended, our business could be adversely affected. New or more stringent governmental regulations may be adopted, orindustry oversight heightened, in the future, and we may incur significant expenses to comply with any new regulations orany heightened industry oversight.
Environmental regulations impose costs and regulatory requirements on our operations. Environmentalcompliance may be more costly than we expect, and we may be subject to material environmental-based claims in thefuture. Our past and present business operations and past and present ownership and operations of real property and the use,sale, storage and handling of chemicals and hazardous products subject us to extensive and changing U.S. federal, state and localenvironmental laws and regulations, as well as those of other countries, pertaining to the discharge of materials into theenvironment, enforcement, disposition of wastes (including hazardous wastes), the use, shipping, labeling, and storage ofchemicals and hazardous materials, building requirements, or otherwise relating to protection of the environment. We haveexperienced, and expect to continue to experience, costs to comply with environmental laws and regulations. In addition, newlaws and regulations, stricter enforcement of existing laws and regulations, the discovery of previously unknown contaminationor the imposition of new clean-up requirements could require us to incur costs or become subject to new or increased liabilitiesthat could have a material adverse effect on our business, financial condition, results of operations and cash flows.
We use and generate hazardous substances and wastes in our operations. In addition, many of our current and formerproperties are or have been used for industrial purposes. Accordingly, we monitor hazardous waste management andapplicable environmental permitting and reporting for compliance with applicable laws at our locations in the ordinarycourse of our business. We may be subject to potential material liabilities relating to any investigation and clean-up of ourlocations or properties where we delivered hazardous waste for handling or disposal that may be contaminated or which mayhave been contaminated prior to our purchase, and to claims alleging personal injury.
Fluctuations in jet fuel and other energy prices may impact our operating results. Fuel costs constitute a significantportion of operating expenses for companies in the aerospace industry. Fluctuations in fuel costs could impact levels andfrequency of aircraft maintenance and overhaul activities, and airlines’ decisions on maintaining, deferring or canceling newaircraft purchases, in part based on the value associated with new fuel efficient technologies. Widespread disruption to oilproduction, refinery operations and pipeline capacity in certain areas of the U.S. can impact the price of jet fuel significantly.Conflicts in the Middle East, an important source of oil for the U.S. and other countries where we do business, cause pricesfor fuel to be volatile. Because we and many of our customers are in the aerospace industry, these fluctuations could have amaterial adverse effect on our financial condition or results of operations.
Our products and services may be rendered obsolete by new products, technologies and processes. Ourmanufacturing operations focus on highly engineered components which require extensive engineering and research anddevelopment time. Our competitive advantage may be adversely impacted if we cannot continue to introduce new products
11
ahead of our competition, or if our products are rendered obsolete by other products or by new, different technologies andprocesses. The success of our new products will depend on a number of factors, including innovation, customer acceptance,the efficiency of our suppliers in providing materials and component parts, and the performance and quality of our productsrelative to those of our competitors. We cannot predict the level of market acceptance or the amount of market share our newproducts will achieve. Additionally, we may face increased or unexpected costs associated with new product introductionincluding the use of additional resources such as personnel. We cannot assure that we will not experience new productintroduction delays in the future.
RISKS RELATED TO RESTRUCTURING, ACQUISITIONS, DIVESTITURES AND JOINT VENTURES
Our acquisition and divestiture strategies and our restructuring activities may not be successful. We have made anumber of acquisitions in the past and we anticipate that we may, from time to time, acquire additional businesses, assets orsecurities of companies that we believe would provide a strategic fit with our businesses. Acquisitions expose the Companyto a number of risks and uncertainties, the occurrence of any of which could materially adversely affect our business, cashflows, financial condition and results of operations. A portion of the industries that we serve are mature industries. As aresult, our future growth may depend in part on the successful acquisition and integration of acquired businesses into ourexisting operations. We may not be able to identify and successfully negotiate suitable acquisitions, obtain financing forfuture acquisitions on satisfactory terms, obtain regulatory approvals or otherwise complete acquisitions in the future.
We could have difficulties integrating acquired businesses with our existing operations. Difficulties of integration caninclude coordinating and consolidating separate systems, integrating the management of the acquired business, retainingmarket acceptance of acquired products and services, maintaining employee morale and retaining key employees, andimplementing our enterprise resource planning systems and operational procedures and disciplines. Any such difficulties maymake it more difficult to maintain relationships with employees, customers, business partners and suppliers. In addition, evenif integration is successful, the financial performance of acquired business may not be as expected and there can be noassurance we will realize anticipated benefits from our acquisitions. We cannot assure you that we will effectively assimilatethe business or product offerings of acquired companies into our business or product offerings or realize anticipatedoperational synergies. In connection with the integration of acquired operations or the conduct of our overall businessstrategies, we may periodically restructure our businesses and/or sell assets or portions of our business. Integrating theoperations and personnel of acquired companies into our existing operations may result in difficulties, significant expenseand accounting charges, disrupt our business or divert management’s time and attention.
Acquisitions involve numerous other risks, including potential exposure to unknown liabilities of acquired companiesand the possible loss of key employees and customers of the acquired business. In connection with acquisitions or jointventure investments outside the U.S., we may enter into derivative contracts to purchase foreign currency in order to hedgeagainst the risk of foreign currency fluctuations in connection with such acquisitions or joint venture investments, whichsubjects us to the risk of foreign currency fluctuations associated with such derivative contracts. Additionally, our finaldeterminations and appraisals of the fair value of assets acquired and liabilities assumed in our acquisitions may varymaterially from earlier estimates. We cannot assure you that the fair value of acquired businesses will remain constant.
We have also in the past divested assets and businesses and we may in the future seek to sell certain of our assetsor businesses in order to meet our strategic objectives, and we cannot be certain that our business, operating resultsand financial condition will not be materially and adversely affected. A successful divestiture depends on various factors,including our ability to effectively transfer liabilities, contracts, facilities and employees to any purchaser, identify andseparate the intellectual property to be divested from the intellectual property that we wish to retain, reduce fixed costspreviously associated with the divested assets or business, and collect the proceeds from any divestitures. In addition, ifcustomers of the divested business do not receive the same level of service from the new owners, this may adversely affectour other businesses to the extent that these customers also purchase other products offered by us. All of these efforts requirevarying levels of management resources, which may divert our attention from other business operations. If we do not realizethe expected benefits or synergies of any divestiture transaction, our consolidated financial position, results of operations andcash flows could be negatively impacted. In addition, divestitures of businesses involve a number of risks, including thediversion of management and employee attention, significant costs and expenses, the loss of customer relationships, and adecrease in revenues and earnings associated with the divested business. Furthermore, divestitures potentially involvesignificant post-closing separation activities, which could involve the expenditure of material financial resources andsignificant employee resources. Any divestiture may result in a dilutive impact to our future earnings if we are unable tooffset the dilutive impact from the loss of revenue associated with the divestiture, as well as significant write-offs, includingthose related to goodwill and other intangible assets, which could have a material adverse effect on our results of operationsand financial condition.
12

We may not achieve expected cost savings from restructuring activities and actual charges, costs and adjustments due torestructuring activities may vary materially from our estimates. Our ability to realize anticipated cost savings, synergies andrevenue enhancements may be affected by a number of factors, including the following: our ability to effectively eliminateduplicative back office overhead and overlapping sales personnel, rationalize manufacturing capacity, synchronizeinformation technology systems, consolidate warehousing and distribution facilities and shift production to more economicalfacilities; significant cash and non-cash integration and implementation costs or charges in order to achieve those costsavings, which could offset any such savings and other synergies resulting from our acquisitions or divestitures; and ourability to avoid labor disruption in connection with integration efforts or divestitures.
Any joint ventures or teaming arrangements we enter into may not be successful. We may enter into joint venturesor teaming arrangements. Partners with whom we share control may at any time have economic, business or legal interests orgoals that are inconsistent with our goals or the goals of the joint venture or arrangement. Our joint venture or teamingarrangements may require us to pay certain costs or to make certain capital investments and we may have little control overthe amount or the timing of these payments and investments. In addition, our joint venture or teaming partners may be unableto meet their economic or other obligations and we may be required to fulfill those obligations alone. Our failure or thefailure of an entity in which we have a joint venture interest or teaming arrangement to adequately manage the risksassociated with any acquisitions, joint ventures or teaming arrangements could have a material adverse effect on our financialcondition or results of operations. We cannot assure you that any of our joint ventures or teaming arrangements will beprofitable or that forecasts regarding joint venture or teaming activities will be accurate. In particular, risks and uncertaintiesassociated with our joint ventures and teaming arrangements include, among others, the joint venture’s or teaming partner’sability to operate its business successfully, to develop appropriate standards, controls, procedures and policies for the growthand management of the joint venture or teaming arrangement and the strength of their relationships with employees,suppliers and customers.
Item 1B. Unresolved Staff Comments
None.
Item 2. Properties
We operate 32 manufacturing facilities throughout the world, 21 of which are part of the Industrial segment and 11 ofwhich are part of the Aerospace segment. Fifteen of the facilities are in the United States; the balance are located in Asia,Brazil, Europe and Mexico. Nineteen of the facilities are owned; the balance are leased.
In addition to its manufacturing facilities, Industrial has 37 facilities engaged in activities related to its manufacturingoperations, including sales, assembly, development and distribution, all but one of which are leased. Three of these facilitiesare located in the United States; the balance are located in Asia, Brazil, Canada, Europe and Mexico. Aerospace also leases awarehouse in Canada.
The Company’s corporate office in Bristol, Connecticut is owned.
Item 3. Legal Proceedings
The Company was named in a lawsuit arising out of an alleged breach of contract and implied warranty by a customerof Toolcom Suppliers Limited (“Toolcom”), a business previously included within the former Logistics and ManufacturingServices segment, related to the sale of certain products prior to the Company’s 2005 acquisition of Toolcom. In 2006, theplaintiff filed the lawsuit in civil court in Scotland and asserted that certain products sold were not fit for a particular use. TheCompany settled the lawsuit during the first quarter of 2013 with an outcome that did not have a material effect on theconsolidated financial statements. The final settlement expense was included within the loss from operations of discontinuedbusinesses in the consolidated statements of income for the year ended December 31, 2013.
On April 16, 2013, the United States Tax Court rendered an unfavorable decision in the matter Barnes Group Inc. andSubsidiaries v. Commissioner of Internal Revenue (“Tax Court Decision”). The Tax Court rejected the Company’sobjections and imposed penalties. The case involved IRS proposed adjustments of approximately $16.5 million, plus a 20%penalty and interest for the tax years 1998, 2000 and 2001.
The case arose out of an Internal Revenue Service (“IRS”) audit for the tax years 2000 through 2002. The adjustmentrelates to the federal taxation of foreign income of certain foreign subsidiaries. The Company filed an administrative protestof these adjustments. In the third quarter of 2009, the Company was informed that its protest was denied and a tax assessment
13
was received from the Appeals Office of the IRS. Subsequently, in November 2009, the Company filed a petition against theIRS in the United States Tax Court, contesting the tax assessment. A trial was held and all briefs were filed in 2012. InApril 2013 the Tax Court Decision was then issued rendering an unfavorable decision against the Company and imposingpenalties. As a result of the unfavorable Tax Court Decision, the Company recorded an additional tax charge during 2013 for$16.4 million.
In November 2013, the Company made a cash payment of approximately $12.7 million related to tax, interest andpenalties and utilized a portion of its net operating losses. The Company also submitted a notice of appeal of the Tax CourtDecision to the United States Court of Appeals for the Second Circuit. The Company filed its opening brief with the UnitedStates Court of Appeals for the Second Circuit on February 13, 2014 and presented its oral arguments on October 1, 2014.
On November 5, 2014, the Second Circuit upheld the Tax Court Decision. The Company has decided not to litigate thismatter further.
In addition, we are subject to litigation from time to time in the ordinary course of business and various other suits,proceedings and claims are pending against us and our subsidiaries. While it is not possible to determine the ultimatedisposition of each of these proceedings and whether they will be resolved consistent with our beliefs, we expect that theoutcome of such proceedings, individually or in the aggregate, will not have a material adverse effect on our financialcondition or results of operations.
Item 4. Mine Safety Disclosures
Not applicable.
14
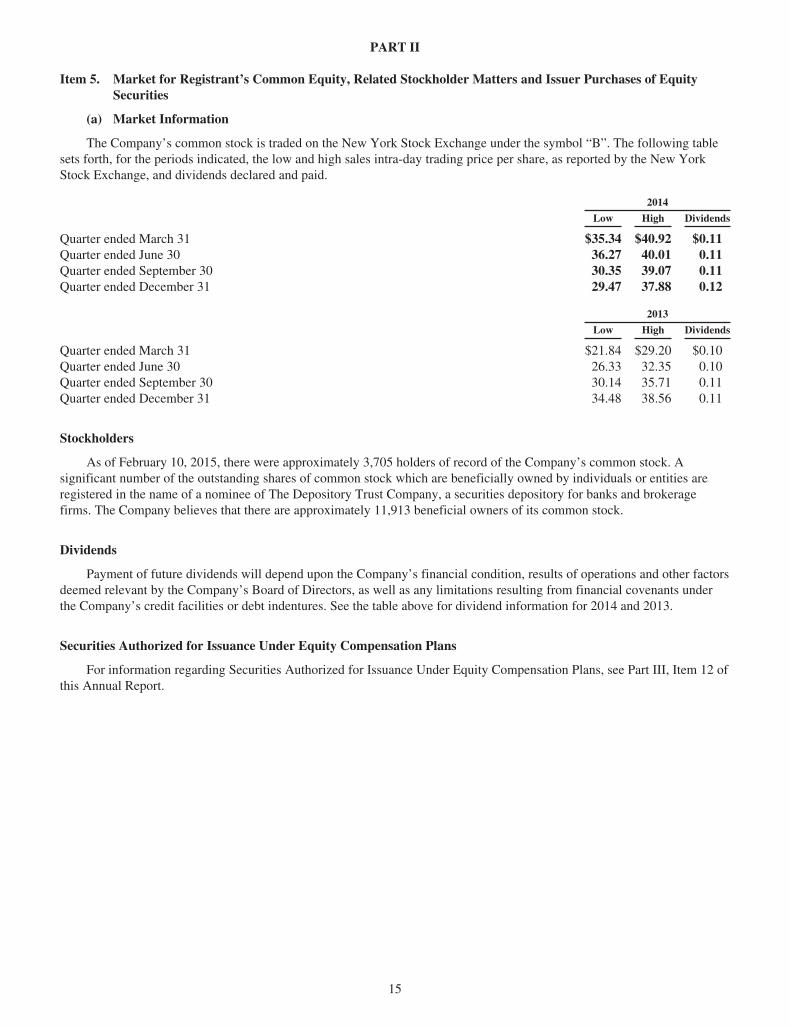
PART II
Item 5. Market for Registrant’s Common Equity, Related Stockholder Matters and Issuer Purchases of EquitySecurities
(a) Market Information
The Company’s common stock is traded on the New York Stock Exchange under the symbol “B”. The following tablesets forth, for the periods indicated, the low and high sales intra-day trading price per share, as reported by the New YorkStock Exchange, and dividends declared and paid.
2014
Low High Dividends
Quarter ended March 31 $35.34 $40.92 $0.11Quarter ended June 30 36.27 40.01 0.11Quarter ended September 30 30.35 39.07 0.11Quarter ended December 31 29.47 37.88 0.12
2013
Low High Dividends
Quarter ended March 31 $21.84 $29.20 $0.10Quarter ended June 30 26.33 32.35 0.10Quarter ended September 30 30.14 35.71 0.11Quarter ended December 31 34.48 38.56 0.11
Stockholders
As of February 10, 2015, there were approximately 3,705 holders of record of the Company’s common stock. Asignificant number of the outstanding shares of common stock which are beneficially owned by individuals or entities areregistered in the name of a nominee of The Depository Trust Company, a securities depository for banks and brokeragefirms. The Company believes that there are approximately 11,913 beneficial owners of its common stock.
Dividends
Payment of future dividends will depend upon the Company’s financial condition, results of operations and other factorsdeemed relevant by the Company’s Board of Directors, as well as any limitations resulting from financial covenants underthe Company’s credit facilities or debt indentures. See the table above for dividend information for 2014 and 2013.
Securities Authorized for Issuance Under Equity Compensation Plans
For information regarding Securities Authorized for Issuance Under Equity Compensation Plans, see Part III, Item 12 ofthis Annual Report.
15
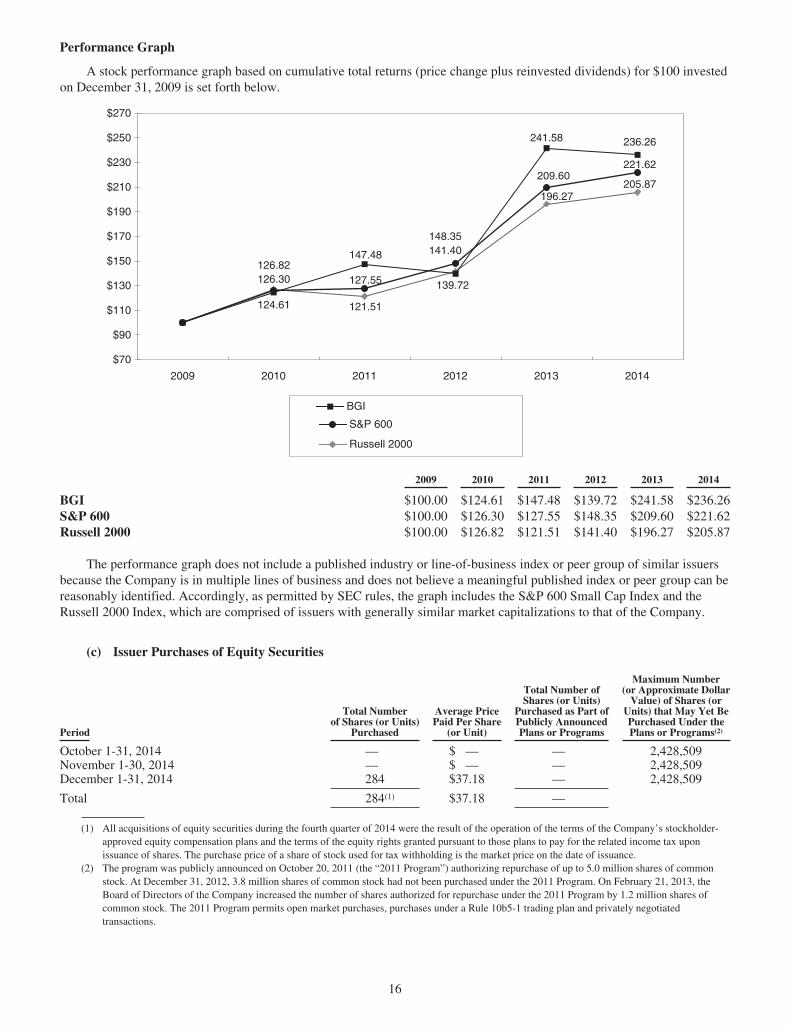
Performance Graph
A stock performance graph based on cumulative total returns (price change plus reinvested dividends) for $100 investedon December 31, 2009 is set forth below.
BGI
S&P 600
Russell 2000
2009 2010 2011 2012 2013 2014
$70
$270
$250
$230
$210
$190
$170
$150
$130
$110
$90
124.61
126.82126.30
121.51
127.55
147.48
139.72
141.40148.35
196.27
209.60
241.58
205.87
221.62
236.26
2009 2010 2011 2012 2013 2014
BGI $100.00 $124.61 $147.48 $139.72 $241.58 $236.26S&P 600 $100.00 $126.30 $127.55 $148.35 $209.60 $221.62Russell 2000 $100.00 $126.82 $121.51 $141.40 $196.27 $205.87
The performance graph does not include a published industry or line-of-business index or peer group of similar issuersbecause the Company is in multiple lines of business and does not believe a meaningful published index or peer group can bereasonably identified. Accordingly, as permitted by SEC rules, the graph includes the S&P 600 Small Cap Index and theRussell 2000 Index, which are comprised of issuers with generally similar market capitalizations to that of the Company.
(c) Issuer Purchases of Equity Securities
Period
Total Numberof Shares (or Units)
Purchased
Average PricePaid Per Share
(or Unit)
Total Number ofShares (or Units)
Purchased as Part ofPublicly AnnouncedPlans or Programs
Maximum Number(or Approximate Dollar
Value) of Shares (orUnits) that May Yet BePurchased Under thePlans or Programs(2)
October 1-31, 2014 — $ — — 2,428,509November 1-30, 2014 — $ — — 2,428,509December 1-31, 2014 284 $37.18 — 2,428,509
Total 284(1) $37.18 —
(1) All acquisitions of equity securities during the fourth quarter of 2014 were the result of the operation of the terms of the Company’s stockholder-approved equity compensation plans and the terms of the equity rights granted pursuant to those plans to pay for the related income tax uponissuance of shares. The purchase price of a share of stock used for tax withholding is the market price on the date of issuance.
(2) The program was publicly announced on October 20, 2011 (the “2011 Program”) authorizing repurchase of up to 5.0 million shares of commonstock. At December 31, 2012, 3.8 million shares of common stock had not been purchased under the 2011 Program. On February 21, 2013, theBoard of Directors of the Company increased the number of shares authorized for repurchase under the 2011 Program by 1.2 million shares ofcommon stock. The 2011 Program permits open market purchases, purchases under a Rule 10b5-1 trading plan and privately negotiatedtransactions.
16
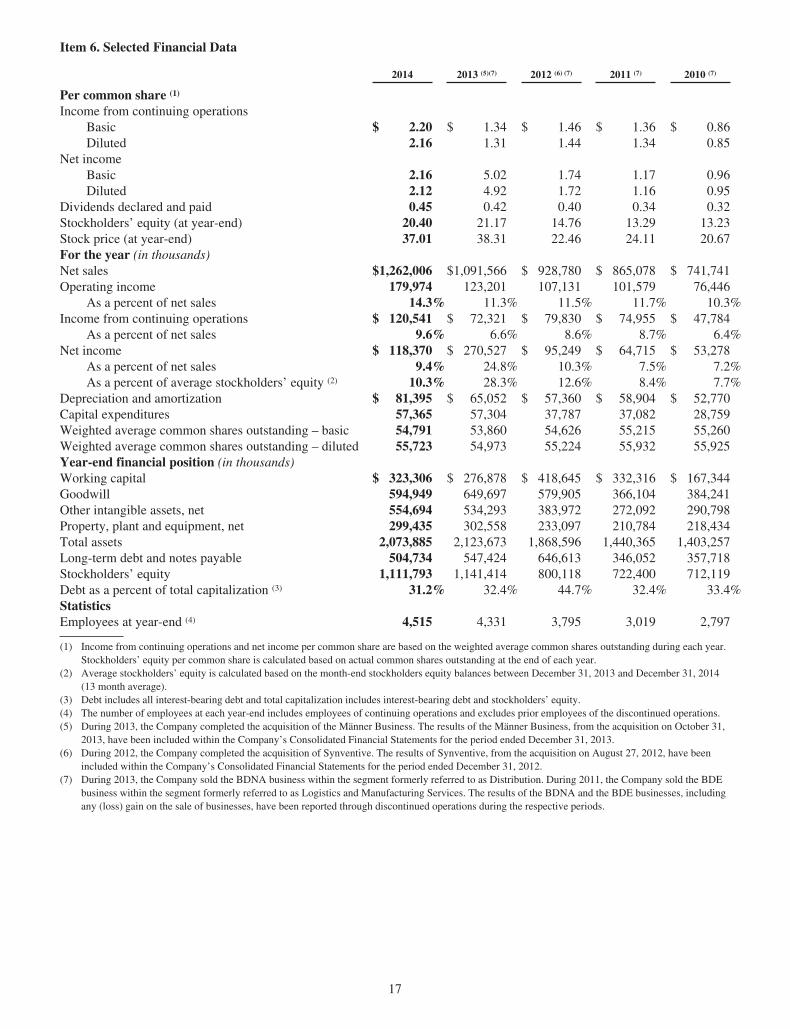
Item 6. Selected Financial Data
2014 2013 (5)(7) 2012 (6) (7) 2011 (7) 2010 (7)
Per common share (1)
Income from continuing operationsBasic $ 2.20 $ 1.34 $ 1.46 $ 1.36 $ 0.86Diluted 2.16 1.31 1.44 1.34 0.85
Net incomeBasic 2.16 5.02 1.74 1.17 0.96Diluted 2.12 4.92 1.72 1.16 0.95
Dividends declared and paid 0.45 0.42 0.40 0.34 0.32Stockholders’ equity (at year-end) 20.40 21.17 14.76 13.29 13.23Stock price (at year-end) 37.01 38.31 22.46 24.11 20.67For the year (in thousands)Net sales $1,262,006 $1,091,566 $ 928,780 $ 865,078 $ 741,741Operating income 179,974 123,201 107,131 101,579 76,446
As a percent of net sales 14.3% 11.3% 11.5% 11.7% 10.3%Income from continuing operations $ 120,541 $ 72,321 $ 79,830 $ 74,955 $ 47,784
As a percent of net sales 9.6% 6.6% 8.6% 8.7% 6.4%Net income $ 118,370 $ 270,527 $ 95,249 $ 64,715 $ 53,278
As a percent of net sales 9.4% 24.8% 10.3% 7.5% 7.2%As a percent of average stockholders’ equity (2) 10.3% 28.3% 12.6% 8.4% 7.7%
Depreciation and amortization $ 81,395 $ 65,052 $ 57,360 $ 58,904 $ 52,770Capital expenditures 57,365 57,304 37,787 37,082 28,759Weighted average common shares outstanding – basic 54,791 53,860 54,626 55,215 55,260Weighted average common shares outstanding – diluted 55,723 54,973 55,224 55,932 55,925Year-end financial position (in thousands)Working capital $ 323,306 $ 276,878 $ 418,645 $ 332,316 $ 167,344Goodwill 594,949 649,697 579,905 366,104 384,241Other intangible assets, net 554,694 534,293 383,972 272,092 290,798Property, plant and equipment, net 299,435 302,558 233,097 210,784 218,434Total assets 2,073,885 2,123,673 1,868,596 1,440,365 1,403,257Long-term debt and notes payable 504,734 547,424 646,613 346,052 357,718Stockholders’ equity 1,111,793 1,141,414 800,118 722,400 712,119Debt as a percent of total capitalization (3) 31.2% 32.4% 44.7% 32.4% 33.4%StatisticsEmployees at year-end (4) 4,515 4,331 3,795 3,019 2,797
(1) Income from continuing operations and net income per common share are based on the weighted average common shares outstanding during each year.Stockholders’ equity per common share is calculated based on actual common shares outstanding at the end of each year.
(2) Average stockholders’ equity is calculated based on the month-end stockholders equity balances between December 31, 2013 and December 31, 2014(13 month average).
(3) Debt includes all interest-bearing debt and total capitalization includes interest-bearing debt and stockholders’ equity.(4) The number of employees at each year-end includes employees of continuing operations and excludes prior employees of the discontinued operations.(5) During 2013, the Company completed the acquisition of the Männer Business. The results of the Männer Business, from the acquisition on October 31,
2013, have been included within the Company’s Consolidated Financial Statements for the period ended December 31, 2013.(6) During 2012, the Company completed the acquisition of Synventive. The results of Synventive, from the acquisition on August 27, 2012, have been
included within the Company’s Consolidated Financial Statements for the period ended December 31, 2012.(7) During 2013, the Company sold the BDNA business within the segment formerly referred to as Distribution. During 2011, the Company sold the BDE
business within the segment formerly referred to as Logistics and Manufacturing Services. The results of the BDNA and the BDE businesses, includingany (loss) gain on the sale of businesses, have been reported through discontinued operations during the respective periods.
17

Item 7. Management’s Discussion and Analysis of Financial Condition and Results of Operations
You should read the following discussion in conjunction with our consolidated financial statements and related notes inthis Annual Report on Form 10-K. In addition to historical information, this discussion contains forward-looking statementsthat involve risks, uncertainties, and assumptions that could cause actual results to differ materially from ourexpectations. Factors that could cause such differences include those described in the section titled “Risk Factors” andelsewhere in this report. We undertake no obligation to update any of the forward-looking statements.
OVERVIEW
2014 Highlights
Barnes Group Inc. (the “Company”) achieved sales of $1,262.0 million in 2014, an increase of $170.4 million, or15.6%, from 2013. In Industrial, the acquisition of the Männer Business on October 31, 2013 provided sales of$113.7 million during the January through October 2014 period. In Aerospace, sales increased as a result of growth in theOEM manufacturing business, whereas sales within the aftermarket business remained flat. Organic sales increased by $64.1million, or 5.9%, with growth in both the Industrial and Aerospace segments.
Operating income increased 46.1% from $123.2 million in 2013 to $180.0 million in 2014 and operating marginimproved from 11.3% in 2013 to 14.3% in 2014. Operating income primarily benefited from the profit contribution of theacquired Männer business and increased organic sales, partially offset by $8.5 million of short-term purchase accountingadjustments related to the acquisition of the Männer business and charges of $6.0 million related to the closure of productionoperations at its Associated Spring facility located in Saline, Michigan (the “Closure”). Operating income during 2013included a $8.6 million pre-tax inventory valuation charge related to a specific family of spare parts within the AerospaceMRO business, $10.5 million of non-recurring stock compensation expenses related to the modification of outstanding equityawards granted to the former Chief Executive Officer (“CEO Transition Costs”) and $7.3 million in short-term purchaseaccounting adjustments and transaction costs related to the acquisition of the Männer business.
In the second quarter of 2014, the Company entered into a Component Repair Program (“CRP”) with its customer,General Electric (“GE”). This CRP provides for, among other items, the right to sell certain aftermarket component repairservices for CFM56 engines directly to other customers as one of a few GE licensed suppliers. In addition, this CRP extendsexisting contracts under which the Company currently provides these services directly to GE. As consideration for theserights, the Company agreed to pay $80.0 million. The Company has paid $41.0 million in the second quarter of 2014,$20.0 million in the fourth quarter of 2014 and the remaining payment of $19.0 million will be paid in the second quarter of2015.
The Company focused on profitable sales growth both organically and through acquisition, in addition to productivityimprovements, as key strategic objectives in 2014. Management continued its focus on cash flow and working capitalmanagement in 2014 and generated $186.9 million in cash flow from operations. The Company continued to makesignificant investments in working capital during 2014 to support sales growth, primarily as a result of improving businessconditions in certain end-markets.
Business Transformation
In the fourth quarter of 2013, the Company and two of its subsidiaries (collectively with the Company, the “Purchaser”)completed the acquisition of the Männer Business (defined below) pursuant to the terms of the Share Purchase andAssignment Agreement dated September 30, 2013 (“Share Purchase Agreement”) among the Purchaser, Otto MännerHolding AG, a German company based in Bahlingen, Germany (the “Seller”), and the three shareholders of the Seller(the “Männer Business”). The Männer Business is a leader in the development and manufacture of high precision molds,valve gate hot runner systems, and system solutions for the medical/pharmaceutical, packaging, and personal care/health careindustries. The Männer Business includes manufacturing locations in Germany, Switzerland and the United States, and salesand service offices in Europe, the United States, Hong Kong/China and Japan. Pursuant to the terms of the Share PurchaseAgreement, the Company acquired all the shares of capital stock of the Männer Business for an aggregate purchase price of€280.7 million ($380.7 million). The acquisition has been integrated into the Industrial segment. See Note 3 of theConsolidated Financial Statements.
In the second quarter of 2013, the Company completed the sale of its Barnes Distribution North America business(“BDNA”) to MSC Industrial Direct Co., Inc. (“MSC”) pursuant to the terms of the Asset Purchase Agreement datedFebruary 22, 2013 (the “APA”) between the Company and MSC. The total cash consideration received for BDNA was$537.8 million, net of transaction costs and closing adjustments paid. See Note 2 of the Consolidated Financial Statements.
18
In the first quarter of 2013, the Company realigned its reportable business segments by transferring the AssociatedSpring Raymond business (“Raymond”), its remaining business within the former Distribution segment, to the Industrialsegment. Raymond sells, among other products, springs that are manufactured by one of the Industrial businesses.Accordingly, the Company reports under two global business segments: Industrial and Aerospace. See Note 20 of theConsolidated Financial Statements.
During the third quarter of 2012, the Company completed its acquisition of Synventive Molding Solutions(“Synventive”) for an aggregate purchase price of $351.5 million. Synventive is a leading designer and manufacturer ofhighly engineered and customized hot runner systems and components and provides related services. The acquisition hasbeen integrated into the Industrial segment. See Note 3 of the Consolidated Financial Statements.
All previously reported financial information has been adjusted on a retrospective basis to reflect the segmentrealignment and the discontinued operations for all years presented.
Management Objectives
Management continues to focus on three key areas of development: employees, processes and results which, incombination, are expected to generate long-term value for the Company’s stockholders and our customers. The Company’sstrategies for growth include both organic growth from new products, services, markets and customers, and growth fromacquisitions. The Company’s strategies for profitability include employee engagement and empowerment to driveproductivity and process initiatives, such as the application of new technologies, automation and innovation, intensified focuson intellectual property as a core differentiator, and efficiency and cost-saving measures. A key component of the Company’sculture is the Barnes Enterprise System (BES), the Company’s operating system which drives alignment and fosterscontinuous improvement, collaboration and innovation throughout the global organization.
Acquisitions and strategic relationships with our customers have been a key growth driver for the Company, and itcontinues to seek alliances which foster long-term business relationships. In addition, the Company looks to grow fromexpanding its geographic reach, commercializing new products and services, and extending into new or adjacent markets.The Company continually evaluates its existing portfolio to optimize product offerings and maximize value.
Our Business
The Company consists of two operating segments: Industrial and Aerospace. In both of these businesses, the Companyis among the leaders in the market niches served.
Key Performance Indicators
Management evaluates the performance of its reportable segments based on the sales, operating profit and operatingmargins of the respective businesses, which includes net sales, cost of sales, selling and administrative expenses and certaincomponents of other income and other expenses, as well as the allocation of corporate overhead expenses. All segments havestandard key performance indicators (“KPIs”), a number of which are focused on customer metrics (on-time-delivery andquality), internal effectiveness and efficiency metrics (sales per employee, productivity, cost of quality, days working capitaland controllable expenses), employee safety-related metrics (total recordable incident rate and lost time incident rate), andspecific KPIs on profitable growth.
Key Industry Data
In both segments, management tracks a variety of economic and industry data as indicators of the health of a particularsector.
At Industrial, key data for the manufacturing operations include the Institute for Supply Management’s manufacturingPMI Composite Index (and similar indices for European and Asian-based businesses); the Federal Reserve’s IndustrialProduction Index (“the IPI”); the production of light vehicles, both in the U.S. and globally; worldwide light vehicle newmodel introductions and existing model refreshes; North American medium and heavy duty vehicle production; compressorbuild forecasts; and global GDP growth forecasts.
At Aerospace, management of the aftermarket aerospace operations monitors the number of aircraft in the active fleet,the number of planes temporarily or permanently taken out of service, aircraft utilization rates for the major airlines, engine
19
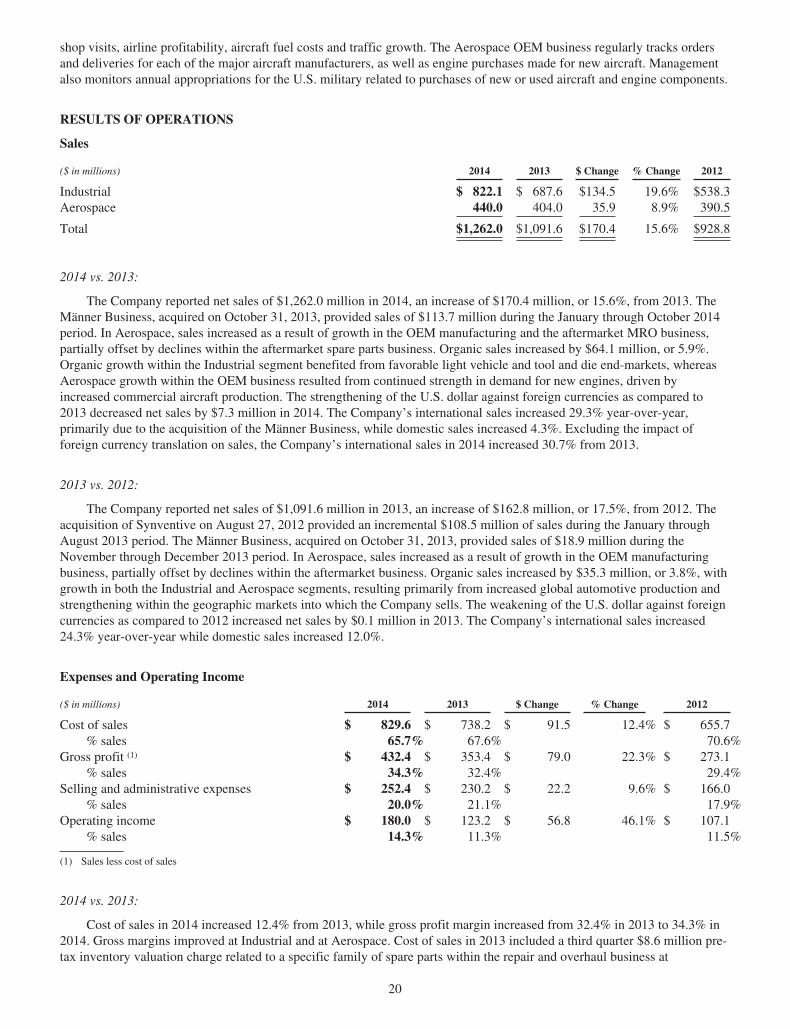
shop visits, airline profitability, aircraft fuel costs and traffic growth. The Aerospace OEM business regularly tracks ordersand deliveries for each of the major aircraft manufacturers, as well as engine purchases made for new aircraft. Managementalso monitors annual appropriations for the U.S. military related to purchases of new or used aircraft and engine components.
RESULTS OF OPERATIONS
Sales
($ in millions) 2014 2013 $ Change % Change 2012
Industrial $ 822.1 $ 687.6 $134.5 19.6% $538.3Aerospace 440.0 404.0 35.9 8.9% 390.5
Total $1,262.0 $1,091.6 $170.4 15.6% $928.8
2014 vs. 2013:
The Company reported net sales of $1,262.0 million in 2014, an increase of $170.4 million, or 15.6%, from 2013. TheMänner Business, acquired on October 31, 2013, provided sales of $113.7 million during the January through October 2014period. In Aerospace, sales increased as a result of growth in the OEM manufacturing and the aftermarket MRO business,partially offset by declines within the aftermarket spare parts business. Organic sales increased by $64.1 million, or 5.9%.Organic growth within the Industrial segment benefited from favorable light vehicle and tool and die end-markets, whereasAerospace growth within the OEM business resulted from continued strength in demand for new engines, driven byincreased commercial aircraft production. The strengthening of the U.S. dollar against foreign currencies as compared to2013 decreased net sales by $7.3 million in 2014. The Company’s international sales increased 29.3% year-over-year,primarily due to the acquisition of the Männer Business, while domestic sales increased 4.3%. Excluding the impact offoreign currency translation on sales, the Company’s international sales in 2014 increased 30.7% from 2013.
2013 vs. 2012:
The Company reported net sales of $1,091.6 million in 2013, an increase of $162.8 million, or 17.5%, from 2012. Theacquisition of Synventive on August 27, 2012 provided an incremental $108.5 million of sales during the January throughAugust 2013 period. The Männer Business, acquired on October 31, 2013, provided sales of $18.9 million during theNovember through December 2013 period. In Aerospace, sales increased as a result of growth in the OEM manufacturingbusiness, partially offset by declines within the aftermarket business. Organic sales increased by $35.3 million, or 3.8%, withgrowth in both the Industrial and Aerospace segments, resulting primarily from increased global automotive production andstrengthening within the geographic markets into which the Company sells. The weakening of the U.S. dollar against foreigncurrencies as compared to 2012 increased net sales by $0.1 million in 2013. The Company’s international sales increased24.3% year-over-year while domestic sales increased 12.0%.
Expenses and Operating Income
($ in millions) 2014 2013 $ Change % Change 2012
Cost of sales $ 829.6 $ 738.2 $ 91.5 12.4% $ 655.7% sales 65.7% 67.6% 70.6%
Gross profit (1) $ 432.4 $ 353.4 $ 79.0 22.3% $ 273.1% sales 34.3% 32.4% 29.4%
Selling and administrative expenses $ 252.4 $ 230.2 $ 22.2 9.6% $ 166.0% sales 20.0% 21.1% 17.9%
Operating income $ 180.0 $ 123.2 $ 56.8 46.1% $ 107.1% sales 14.3% 11.3% 11.5%
(1) Sales less cost of sales
2014 vs. 2013:
Cost of sales in 2014 increased 12.4% from 2013, while gross profit margin increased from 32.4% in 2013 to 34.3% in2014. Gross margins improved at Industrial and at Aerospace. Cost of sales in 2013 included a third quarter $8.6 million pre-tax inventory valuation charge related to a specific family of spare parts within the repair and overhaul business at
20
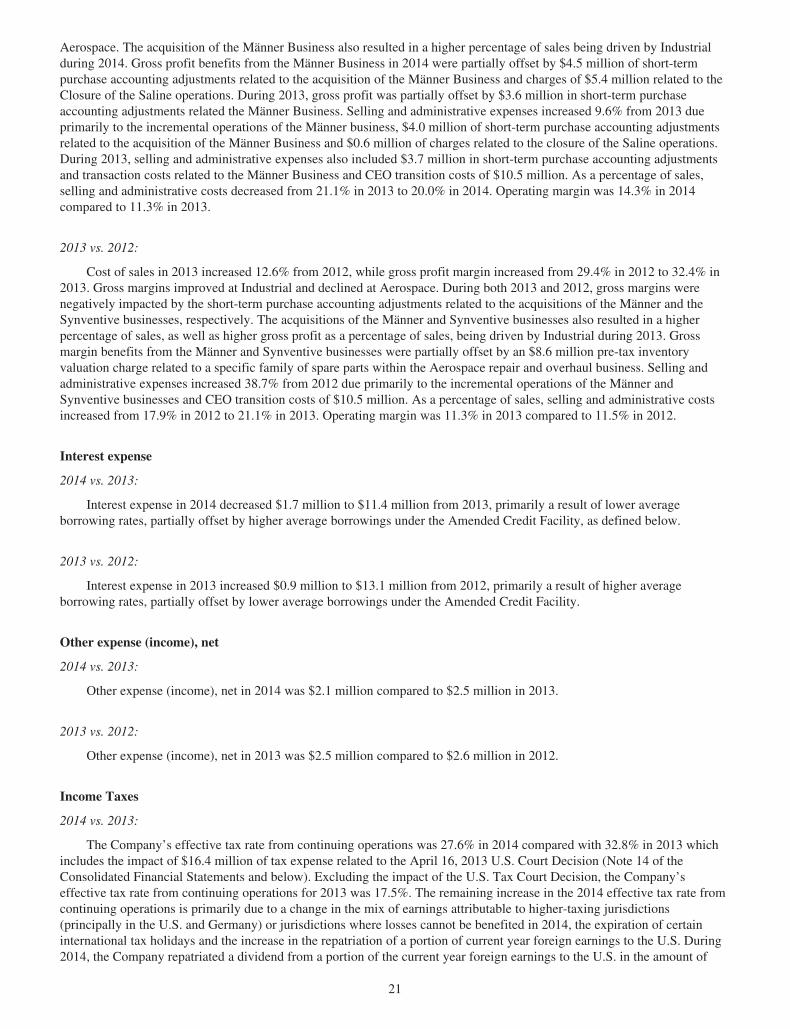
Aerospace. The acquisition of the Männer Business also resulted in a higher percentage of sales being driven by Industrialduring 2014. Gross profit benefits from the Männer Business in 2014 were partially offset by $4.5 million of short-termpurchase accounting adjustments related to the acquisition of the Männer Business and charges of $5.4 million related to theClosure of the Saline operations. During 2013, gross profit was partially offset by $3.6 million in short-term purchaseaccounting adjustments related the Männer Business. Selling and administrative expenses increased 9.6% from 2013 dueprimarily to the incremental operations of the Männer business, $4.0 million of short-term purchase accounting adjustmentsrelated to the acquisition of the Männer Business and $0.6 million of charges related to the closure of the Saline operations.During 2013, selling and administrative expenses also included $3.7 million in short-term purchase accounting adjustmentsand transaction costs related to the Männer Business and CEO transition costs of $10.5 million. As a percentage of sales,selling and administrative costs decreased from 21.1% in 2013 to 20.0% in 2014. Operating margin was 14.3% in 2014compared to 11.3% in 2013.
2013 vs. 2012:
Cost of sales in 2013 increased 12.6% from 2012, while gross profit margin increased from 29.4% in 2012 to 32.4% in2013. Gross margins improved at Industrial and declined at Aerospace. During both 2013 and 2012, gross margins werenegatively impacted by the short-term purchase accounting adjustments related to the acquisitions of the Männer and theSynventive businesses, respectively. The acquisitions of the Männer and Synventive businesses also resulted in a higherpercentage of sales, as well as higher gross profit as a percentage of sales, being driven by Industrial during 2013. Grossmargin benefits from the Männer and Synventive businesses were partially offset by an $8.6 million pre-tax inventoryvaluation charge related to a specific family of spare parts within the Aerospace repair and overhaul business. Selling andadministrative expenses increased 38.7% from 2012 due primarily to the incremental operations of the Männer andSynventive businesses and CEO transition costs of $10.5 million. As a percentage of sales, selling and administrative costsincreased from 17.9% in 2012 to 21.1% in 2013. Operating margin was 11.3% in 2013 compared to 11.5% in 2012.
Interest expense
2014 vs. 2013:
Interest expense in 2014 decreased $1.7 million to $11.4 million from 2013, primarily a result of lower averageborrowing rates, partially offset by higher average borrowings under the Amended Credit Facility, as defined below.
2013 vs. 2012:
Interest expense in 2013 increased $0.9 million to $13.1 million from 2012, primarily a result of higher averageborrowing rates, partially offset by lower average borrowings under the Amended Credit Facility.
Other expense (income), net
2014 vs. 2013:
Other expense (income), net in 2014 was $2.1 million compared to $2.5 million in 2013.
2013 vs. 2012:
Other expense (income), net in 2013 was $2.5 million compared to $2.6 million in 2012.
Income Taxes
2014 vs. 2013:
The Company’s effective tax rate from continuing operations was 27.6% in 2014 compared with 32.8% in 2013 whichincludes the impact of $16.4 million of tax expense related to the April 16, 2013 U.S. Court Decision (Note 14 of theConsolidated Financial Statements and below). Excluding the impact of the U.S. Tax Court Decision, the Company’seffective tax rate from continuing operations for 2013 was 17.5%. The remaining increase in the 2014 effective tax rate fromcontinuing operations is primarily due to a change in the mix of earnings attributable to higher-taxing jurisdictions(principally in the U.S. and Germany) or jurisdictions where losses cannot be benefited in 2014, the expiration of certaininternational tax holidays and the increase in the repatriation of a portion of current year foreign earnings to the U.S. During2014, the Company repatriated a dividend from a portion of the current year foreign earnings to the U.S. in the amount of
21
$12.5 million compared to $5.0 million in 2013. This increase in the dividend increased tax expense by $3.2 million andincreased the annual effective tax rate by 1.9 percentage points compared to 2013.
In 2015, the Company expects the effective tax rate from continuing operations to increase to approximately 30%primarily due the expiration of a portion of its international tax holidays.
2013 vs. 2012:
The Company’s effective tax rate from continuing operations was 32.8% in 2013 compared with 13.5% in 2012 andincludes the impact of $16.4 million of tax expense related to the April 16, 2013 U.S. Tax Court Decision (Note 14 of theConsolidated Financial Statements and below). Excluding the impact of the Tax Court Decision, the Company’s effective taxrate from continuing operations for 2013 was 17.5%. The remaining increase in the 2013 effective tax rate from continuingoperations is due to the absence of the 2012 reversal of certain foreign valuation allowances and tax rate decreases in certainforeign jurisdictions, an increase in the Company’s Swedish effective tax rate and the change in the mix of earningsattributable to higher-taxing jurisdictions or jurisdictions where losses cannot be benefited in 2013. During 2013, theCompany repatriated a dividend from a portion of the current year foreign earnings to the U.S. in the amount of $5.0 millioncompared to $8.0 million in 2012. This decrease in the dividend reduced tax expense by $0.9 million and decreased theannual effective tax rate by 0.8 percentage points compared to 2012.
See Note 14 of the Consolidated Financial Statements for a reconciliation of the U.S. federal statutory income tax rate tothe consolidated effective income tax rate.
On April 16, 2013, the United States Tax Court rendered an unfavorable decision in the matter Barnes Group Inc. andSubsidiaries v. Commissioner of Internal Revenue (“Tax Court Decision”). The Tax Court rejected the Company’sobjections and imposed penalties. The case involved IRS proposed adjustments of approximately $16.5 million, plus a 20%penalty and interest for the tax years 1998, 2000 and 2001.
The case arose out of an Internal Revenue Service (“IRS”) audit for the tax years 2000 through 2002. The adjustmentrelates to the federal taxation of foreign income of certain foreign subsidiaries. The Company filed an administrative protestof these adjustments. In the third quarter of 2009, the Company was informed that its protest was denied and a tax assessmentwas received from the Appeals Office of the IRS. Subsequently, in November 2009, the Company filed a petition against theIRS in the United States Tax Court, contesting the tax assessment. A trial was held and all briefs were filed in 2012. In April2013 the Tax Court Decision was then issued rendering an unfavorable decision against the Company and imposingpenalties. As a result of the unfavorable Tax Court Decision, the Company recorded an additional tax charge during 2013 for$16.4 million.
In November 2013, the Company made a cash payment of approximately $12.7 million related to tax, interest andpenalties and utilized a portion of its net operating losses. The Company also submitted a notice of appeal of the Tax CourtDecision to the United States Court of Appeals for the Second Circuit. The Company filed its opening brief with the UnitedStates Court of Appeals for the Second Circuit on February 13, 2014 and presented its oral arguments on October 1, 2014.
On November 5, 2014, the Second Circuit upheld the Tax Court Decision. The Company has decided not to litigate thismatter further.
Discontinued Operations
In April 2013, the Company completed the sale of BDNA to MSC pursuant to the terms of the APA between theCompany and MSC. The total cash consideration received for BDNA was $537.8 million, net of transaction costs and closingadjustments paid. The net after-tax proceeds were $419.1 million after consideration of certain post closing adjustments,transaction costs and income taxes. The Company made estimated income tax payments of $130.0 million related to the gainon sale during 2013 and recorded an income tax receivable of $12.6 million in the Consolidated Balance Sheet as ofDecember 31, 2013. The Company has since elected to apply the income tax receivable to future tax filings.
In December 2011, the Company completed the sale of its BDE business to Berner SE (the “Purchaser”), headquarteredin Kunzelsau, Germany, in a cash transaction pursuant to a Share and Asset Purchase Agreement (“SPA”). The Companyreceived gross proceeds of $33.4 million, which represented the initial stated purchase price, and which yielded net cashproceeds of $22.5 million after transaction costs, employee transaction related costs, closing adjustments and net cash sold,of which €9.0 million was placed in escrow. The funds would be released from escrow on August 31, 2012 unless there wereany then pending claims. Cash related to a pending claim would remain in escrow until a final determination of the claim hadbeen made.
22
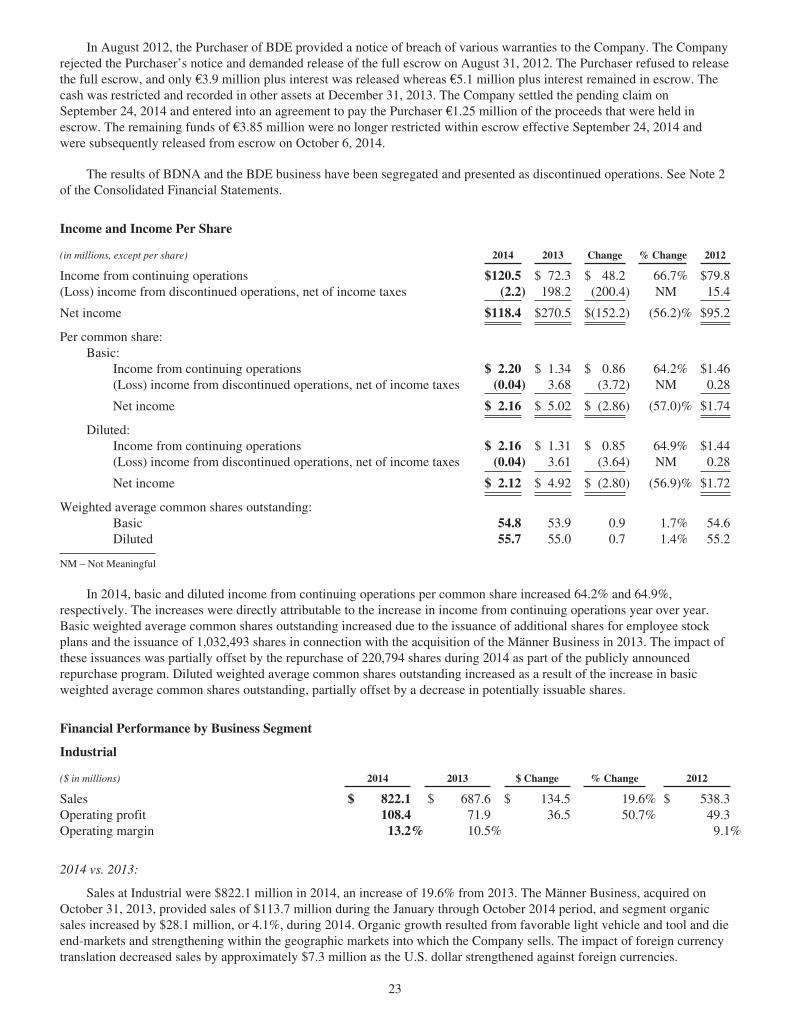
In August 2012, the Purchaser of BDE provided a notice of breach of various warranties to the Company. The Companyrejected the Purchaser’s notice and demanded release of the full escrow on August 31, 2012. The Purchaser refused to releasethe full escrow, and only €3.9 million plus interest was released whereas €5.1 million plus interest remained in escrow. Thecash was restricted and recorded in other assets at December 31, 2013. The Company settled the pending claim onSeptember 24, 2014 and entered into an agreement to pay the Purchaser €1.25 million of the proceeds that were held inescrow. The remaining funds of €3.85 million were no longer restricted within escrow effective September 24, 2014 andwere subsequently released from escrow on October 6, 2014.
The results of BDNA and the BDE business have been segregated and presented as discontinued operations. See Note 2of the Consolidated Financial Statements.
Income and Income Per Share
(in millions, except per share) 2014 2013 Change % Change 2012
Income from continuing operations $120.5 $ 72.3 $ 48.2 66.7% $79.8(Loss) income from discontinued operations, net of income taxes (2.2) 198.2 (200.4) NM 15.4
Net income $118.4 $270.5 $(152.2) (56.2)% $95.2
Per common share:Basic:
Income from continuing operations $ 2.20 $ 1.34 $ 0.86 64.2% $1.46(Loss) income from discontinued operations, net of income taxes (0.04) 3.68 (3.72) NM 0.28
Net income $ 2.16 $ 5.02 $ (2.86) (57.0)% $1.74
Diluted:Income from continuing operations $ 2.16 $ 1.31 $ 0.85 64.9% $1.44(Loss) income from discontinued operations, net of income taxes (0.04) 3.61 (3.64) NM 0.28
Net income $ 2.12 $ 4.92 $ (2.80) (56.9)% $1.72
Weighted average common shares outstanding:Basic 54.8 53.9 0.9 1.7% 54.6Diluted 55.7 55.0 0.7 1.4% 55.2
NM – Not Meaningful
In 2014, basic and diluted income from continuing operations per common share increased 64.2% and 64.9%,respectively. The increases were directly attributable to the increase in income from continuing operations year over year.Basic weighted average common shares outstanding increased due to the issuance of additional shares for employee stockplans and the issuance of 1,032,493 shares in connection with the acquisition of the Männer Business in 2013. The impact ofthese issuances was partially offset by the repurchase of 220,794 shares during 2014 as part of the publicly announcedrepurchase program. Diluted weighted average common shares outstanding increased as a result of the increase in basicweighted average common shares outstanding, partially offset by a decrease in potentially issuable shares.
Financial Performance by Business Segment
Industrial
($ in millions) 2014 2013 $ Change % Change 2012
Sales $ 822.1 $ 687.6 $ 134.5 19.6% $ 538.3Operating profit 108.4 71.9 36.5 50.7% 49.3Operating margin 13.2% 10.5% 9.1%
2014 vs. 2013:
Sales at Industrial were $822.1 million in 2014, an increase of 19.6% from 2013. The Männer Business, acquired onOctober 31, 2013, provided sales of $113.7 million during the January through October 2014 period, and segment organicsales increased by $28.1 million, or 4.1%, during 2014. Organic growth resulted from favorable light vehicle and tool and dieend-markets and strengthening within the geographic markets into which the Company sells. The impact of foreign currencytranslation decreased sales by approximately $7.3 million as the U.S. dollar strengthened against foreign currencies.
23
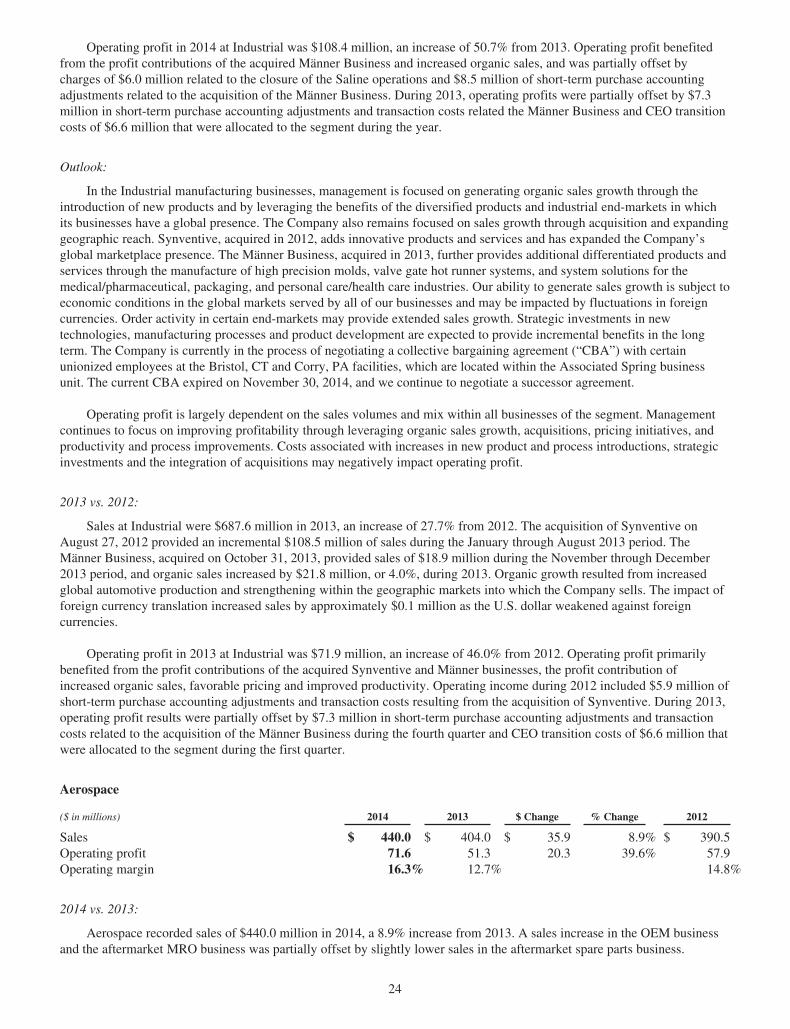
Operating profit in 2014 at Industrial was $108.4 million, an increase of 50.7% from 2013. Operating profit benefitedfrom the profit contributions of the acquired Männer Business and increased organic sales, and was partially offset bycharges of $6.0 million related to the closure of the Saline operations and $8.5 million of short-term purchase accountingadjustments related to the acquisition of the Männer Business. During 2013, operating profits were partially offset by $7.3million in short-term purchase accounting adjustments and transaction costs related the Männer Business and CEO transitioncosts of $6.6 million that were allocated to the segment during the year.
Outlook:
In the Industrial manufacturing businesses, management is focused on generating organic sales growth through theintroduction of new products and by leveraging the benefits of the diversified products and industrial end-markets in whichits businesses have a global presence. The Company also remains focused on sales growth through acquisition and expandinggeographic reach. Synventive, acquired in 2012, adds innovative products and services and has expanded the Company’sglobal marketplace presence. The Männer Business, acquired in 2013, further provides additional differentiated products andservices through the manufacture of high precision molds, valve gate hot runner systems, and system solutions for themedical/pharmaceutical, packaging, and personal care/health care industries. Our ability to generate sales growth is subject toeconomic conditions in the global markets served by all of our businesses and may be impacted by fluctuations in foreigncurrencies. Order activity in certain end-markets may provide extended sales growth. Strategic investments in newtechnologies, manufacturing processes and product development are expected to provide incremental benefits in the longterm. The Company is currently in the process of negotiating a collective bargaining agreement (“CBA”) with certainunionized employees at the Bristol, CT and Corry, PA facilities, which are located within the Associated Spring businessunit. The current CBA expired on November 30, 2014, and we continue to negotiate a successor agreement.
Operating profit is largely dependent on the sales volumes and mix within all businesses of the segment. Managementcontinues to focus on improving profitability through leveraging organic sales growth, acquisitions, pricing initiatives, andproductivity and process improvements. Costs associated with increases in new product and process introductions, strategicinvestments and the integration of acquisitions may negatively impact operating profit.
2013 vs. 2012:
Sales at Industrial were $687.6 million in 2013, an increase of 27.7% from 2012. The acquisition of Synventive onAugust 27, 2012 provided an incremental $108.5 million of sales during the January through August 2013 period. TheMänner Business, acquired on October 31, 2013, provided sales of $18.9 million during the November through December2013 period, and organic sales increased by $21.8 million, or 4.0%, during 2013. Organic growth resulted from increasedglobal automotive production and strengthening within the geographic markets into which the Company sells. The impact offoreign currency translation increased sales by approximately $0.1 million as the U.S. dollar weakened against foreigncurrencies.
Operating profit in 2013 at Industrial was $71.9 million, an increase of 46.0% from 2012. Operating profit primarilybenefited from the profit contributions of the acquired Synventive and Männer businesses, the profit contribution ofincreased organic sales, favorable pricing and improved productivity. Operating income during 2012 included $5.9 million ofshort-term purchase accounting adjustments and transaction costs resulting from the acquisition of Synventive. During 2013,operating profit results were partially offset by $7.3 million in short-term purchase accounting adjustments and transactioncosts related to the acquisition of the Männer Business during the fourth quarter and CEO transition costs of $6.6 million thatwere allocated to the segment during the first quarter.
Aerospace
($ in millions) 2014 2013 $ Change % Change 2012
Sales $ 440.0 $ 404.0 $ 35.9 8.9% $ 390.5Operating profit 71.6 51.3 20.3 39.6% 57.9Operating margin 16.3% 12.7% 14.8%
2014 vs. 2013:
Aerospace recorded sales of $440.0 million in 2014, a 8.9% increase from 2013. A sales increase in the OEM businessand the aftermarket MRO business was partially offset by slightly lower sales in the aftermarket spare parts business.
24
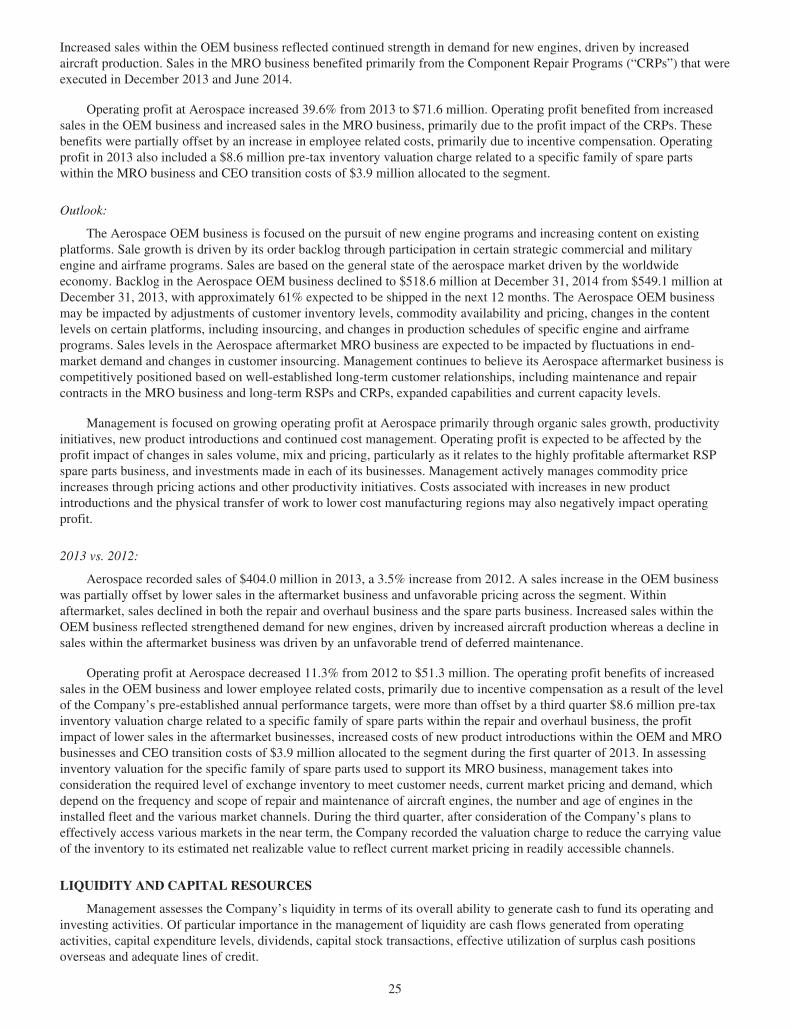
Increased sales within the OEM business reflected continued strength in demand for new engines, driven by increasedaircraft production. Sales in the MRO business benefited primarily from the Component Repair Programs (“CRPs”) that wereexecuted in December 2013 and June 2014.
Operating profit at Aerospace increased 39.6% from 2013 to $71.6 million. Operating profit benefited from increasedsales in the OEM business and increased sales in the MRO business, primarily due to the profit impact of the CRPs. Thesebenefits were partially offset by an increase in employee related costs, primarily due to incentive compensation. Operatingprofit in 2013 also included a $8.6 million pre-tax inventory valuation charge related to a specific family of spare partswithin the MRO business and CEO transition costs of $3.9 million allocated to the segment.
Outlook:
The Aerospace OEM business is focused on the pursuit of new engine programs and increasing content on existingplatforms. Sale growth is driven by its order backlog through participation in certain strategic commercial and militaryengine and airframe programs. Sales are based on the general state of the aerospace market driven by the worldwideeconomy. Backlog in the Aerospace OEM business declined to $518.6 million at December 31, 2014 from $549.1 million atDecember 31, 2013, with approximately 61% expected to be shipped in the next 12 months. The Aerospace OEM businessmay be impacted by adjustments of customer inventory levels, commodity availability and pricing, changes in the contentlevels on certain platforms, including insourcing, and changes in production schedules of specific engine and airframeprograms. Sales levels in the Aerospace aftermarket MRO business are expected to be impacted by fluctuations in end-market demand and changes in customer insourcing. Management continues to believe its Aerospace aftermarket business iscompetitively positioned based on well-established long-term customer relationships, including maintenance and repaircontracts in the MRO business and long-term RSPs and CRPs, expanded capabilities and current capacity levels.
Management is focused on growing operating profit at Aerospace primarily through organic sales growth, productivityinitiatives, new product introductions and continued cost management. Operating profit is expected to be affected by theprofit impact of changes in sales volume, mix and pricing, particularly as it relates to the highly profitable aftermarket RSPspare parts business, and investments made in each of its businesses. Management actively manages commodity priceincreases through pricing actions and other productivity initiatives. Costs associated with increases in new productintroductions and the physical transfer of work to lower cost manufacturing regions may also negatively impact operatingprofit.
2013 vs. 2012:
Aerospace recorded sales of $404.0 million in 2013, a 3.5% increase from 2012. A sales increase in the OEM businesswas partially offset by lower sales in the aftermarket business and unfavorable pricing across the segment. Withinaftermarket, sales declined in both the repair and overhaul business and the spare parts business. Increased sales within theOEM business reflected strengthened demand for new engines, driven by increased aircraft production whereas a decline insales within the aftermarket business was driven by an unfavorable trend of deferred maintenance.
Operating profit at Aerospace decreased 11.3% from 2012 to $51.3 million. The operating profit benefits of increasedsales in the OEM business and lower employee related costs, primarily due to incentive compensation as a result of the levelof the Company’s pre-established annual performance targets, were more than offset by a third quarter $8.6 million pre-taxinventory valuation charge related to a specific family of spare parts within the repair and overhaul business, the profitimpact of lower sales in the aftermarket businesses, increased costs of new product introductions within the OEM and MRObusinesses and CEO transition costs of $3.9 million allocated to the segment during the first quarter of 2013. In assessinginventory valuation for the specific family of spare parts used to support its MRO business, management takes intoconsideration the required level of exchange inventory to meet customer needs, current market pricing and demand, whichdepend on the frequency and scope of repair and maintenance of aircraft engines, the number and age of engines in theinstalled fleet and the various market channels. During the third quarter, after consideration of the Company’s plans toeffectively access various markets in the near term, the Company recorded the valuation charge to reduce the carrying valueof the inventory to its estimated net realizable value to reflect current market pricing in readily accessible channels.
LIQUIDITY AND CAPITAL RESOURCES
Management assesses the Company’s liquidity in terms of its overall ability to generate cash to fund its operating andinvesting activities. Of particular importance in the management of liquidity are cash flows generated from operatingactivities, capital expenditure levels, dividends, capital stock transactions, effective utilization of surplus cash positionsoverseas and adequate lines of credit.
25
The Company’s ability to generate cash from operations in excess of its internal operating needs is one of its financialstrengths. Management continues to focus on cash flow and working capital management, and anticipates that operatingactivities in 2015 will generate sufficient cash to fund operations. The Company closely monitors its cash generation, usageand preservation including the management of working capital to generate cash.
On October 15, 2014, the Company entered into a Note Purchase Agreement (“Note Purchase Agreement”), among theCompany and New York Life Insurance Company, New York Life Insurance and Annuity Corporation and New York LifeInsurance and Annuity Corporation Institutionally Owned Life Insurance Separate Account (BOLI 30C), as purchasers, forthe issuance of $100.0 million aggregate principal amount of 3.97% Senior Notes due October 17, 2024 (the “3.97% SeniorNotes”). The Company completed funding of the transaction and issued the 3.97% Senior Notes on October 17, 2014. The3.97% Senior Notes are senior unsecured obligations of the Company and will pay interest semi-annually on April 17 andOctober 17 of each year at an annual rate of 3.97%. The 3.97% Senior Notes will mature on October 17, 2024 unless earlierprepaid in accordance with their terms. Subject to certain conditions, the Company may, at its option, prepay all or any partof the 3.97% Senior Notes in an amount equal to 100% of the principal amount of the 3.97% Senior Notes so prepaid, plusany accrued and unpaid interest to the date of prepayment, plus the Make-Whole Amount, as defined in the Note PurchaseAgreement, with respect to such principal amount being prepaid. The Note Purchase Agreement contains customaryaffirmative and negative covenants that are similar to the covenants required under the Amended Credit Agreement, asdiscussed below. At December 31, 2014, the Company was in compliance with all covenants under the Note PurchaseAgreement.
During the second quarter of 2014, the 3.375% Convertible Notes (the “3.375% Notes”) were eligible for conversiondue to meeting their conversion price eligibility requirement. On June 16, 2014, $0.2 million of the 3.375% Notes (par value)were surrendered for conversion. On June 24, 2014, the Company exercised its right to redeem the remaining $55.4 millionprincipal amount of the 3.375% Notes, effective July 31, 2014. The Company elected to pay cash to holders of the 3.375%Notes surrendered for conversion, including the value of any residual value shares of common stock that might be payable tothe holders electing to convert their 3.375% Notes into an equivalent share value. Under the terms of the indenture, theconversion value was measured based upon a 20-day valuation period of the Company’s stock price. The Company usedborrowings under its Amended Credit Facility to finance the redemption and conversion of the 3.375% Notes. The 3.375%Notes were rendered for conversion during the third quarter of 2014 and the Company paid $70.5 million in cash to theholders, which included a premium of $14.9 million.
In September 2011, the Company entered into an amended and restated revolving credit agreement (the “AmendedCredit Agreement” or “Amended Credit Facility”) with Bank of America, N.A. as the administrative agent. The AmendedCredit Agreement increased the borrowing availability of the Amended Credit Facility from $400,000 to $500,000 andextended the expiration date of the Amended Credit Facility by four years from September 2012 to September 2016. InJuly 2012, the Company executed a $250,000 accordion feature that was available under the Amended Credit Agreementincreasing the available amount under the Amended Credit Facility to $750,000. On September 27, 2013, the Companyentered into a second amendment to the Amended Credit Agreement (the “Second Amendment”) and retained Bank ofAmerica, N.A. as administrative agent for the lenders. The Second Amendment extends the maturity date of the debt facilityby two years from September 2016 to September 2018 and includes an option to extend the maturity date for an additionalyear, subject to certain conditions. The Second Amendment also adds a new foreign subsidiary borrower in Germany, BarnesGroup Acquisition GmbH, maintains the borrowing availability of the Company at $750.0 million and adds an accordionfeature to increase this amount to $1,000.0 million. The borrowing availability of $750.0 million, pursuant to the terms of theSecond Amendment, allows for Euro-denominated borrowings equivalent to $500.0 million. The Company may exercise theaccordion feature upon request to the Administrative Agent as long as an event of default has not occurred or is continuing.Borrowings under the Second Amendment continue to bear interest at LIBOR plus a spread ranging from 1.10% to 1.70%.The Company paid fees and expenses of $1.3 million in conjunction with executing the Second Amendment; such fees weredeferred and are being amortized into interest expense on the accompanying Consolidated Statements of Income through itsmaturity.
The Company’s borrowing capacity may be limited by various debt covenants in the Amended Credit Agreement andthe Note Purchase Agreement, certain of which have been amended in September 2013. The Second Amendment requires theCompany to maintain a ratio of Consolidated Senior Debt, as defined in the Second Amendment, to Consolidated EBITDA,as defined, of not more than 3.25 times at the end of each fiscal quarter (“Senior Debt Ratio”), a ratio of Consolidated TotalDebt, as defined, to Consolidated EBITDA of not more than 4.00 times at the end of each fiscal quarter, and a ratio ofConsolidated EBITDA to Consolidated Cash Interest Expense, as defined, of not less than 4.25 times at the end of each fiscalquarter. The Second Amendment also provides that in connection with certain permitted acquisitions with aggregateconsideration in excess of $150.0 million, the Consolidated Senior Debt to EBITDA ratio and the Consolidated Total Debt to
26
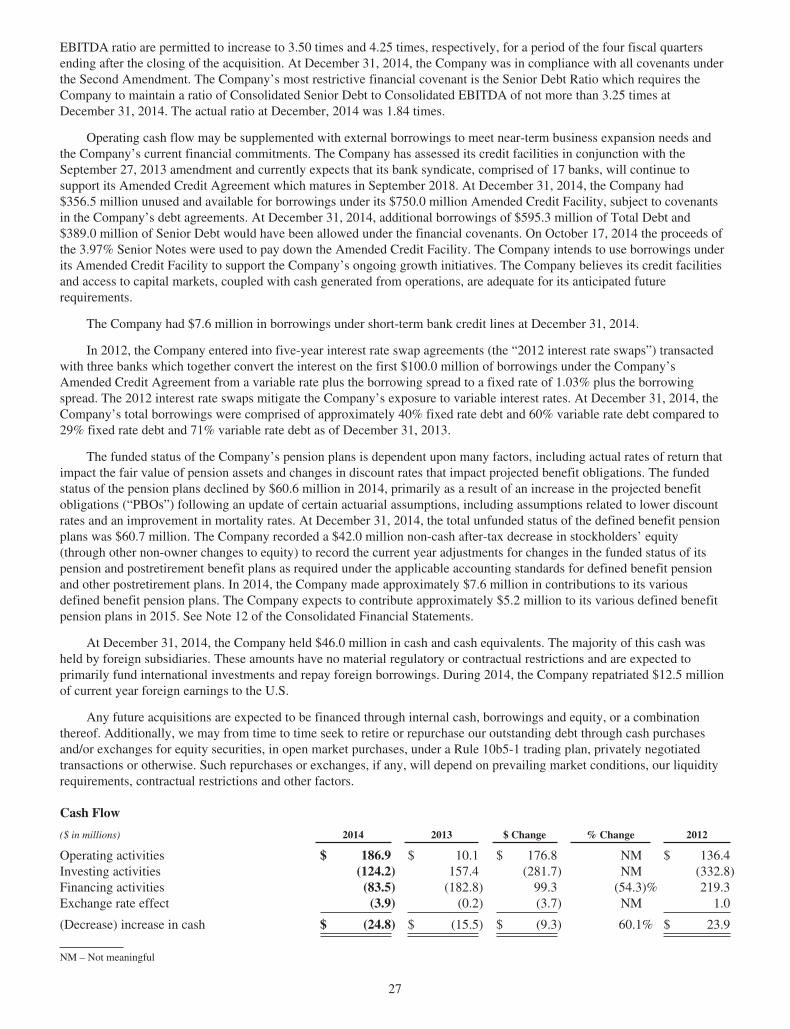
EBITDA ratio are permitted to increase to 3.50 times and 4.25 times, respectively, for a period of the four fiscal quartersending after the closing of the acquisition. At December 31, 2014, the Company was in compliance with all covenants underthe Second Amendment. The Company’s most restrictive financial covenant is the Senior Debt Ratio which requires theCompany to maintain a ratio of Consolidated Senior Debt to Consolidated EBITDA of not more than 3.25 times atDecember 31, 2014. The actual ratio at December, 2014 was 1.84 times.
Operating cash flow may be supplemented with external borrowings to meet near-term business expansion needs andthe Company’s current financial commitments. The Company has assessed its credit facilities in conjunction with theSeptember 27, 2013 amendment and currently expects that its bank syndicate, comprised of 17 banks, will continue tosupport its Amended Credit Agreement which matures in September 2018. At December 31, 2014, the Company had$356.5 million unused and available for borrowings under its $750.0 million Amended Credit Facility, subject to covenantsin the Company’s debt agreements. At December 31, 2014, additional borrowings of $595.3 million of Total Debt and$389.0 million of Senior Debt would have been allowed under the financial covenants. On October 17, 2014 the proceeds ofthe 3.97% Senior Notes were used to pay down the Amended Credit Facility. The Company intends to use borrowings underits Amended Credit Facility to support the Company’s ongoing growth initiatives. The Company believes its credit facilitiesand access to capital markets, coupled with cash generated from operations, are adequate for its anticipated futurerequirements.
The Company had $7.6 million in borrowings under short-term bank credit lines at December 31, 2014.
In 2012, the Company entered into five-year interest rate swap agreements (the “2012 interest rate swaps”) transactedwith three banks which together convert the interest on the first $100.0 million of borrowings under the Company’sAmended Credit Agreement from a variable rate plus the borrowing spread to a fixed rate of 1.03% plus the borrowingspread. The 2012 interest rate swaps mitigate the Company’s exposure to variable interest rates. At December 31, 2014, theCompany’s total borrowings were comprised of approximately 40% fixed rate debt and 60% variable rate debt compared to29% fixed rate debt and 71% variable rate debt as of December 31, 2013.
The funded status of the Company’s pension plans is dependent upon many factors, including actual rates of return thatimpact the fair value of pension assets and changes in discount rates that impact projected benefit obligations. The fundedstatus of the pension plans declined by $60.6 million in 2014, primarily as a result of an increase in the projected benefitobligations (“PBOs”) following an update of certain actuarial assumptions, including assumptions related to lower discountrates and an improvement in mortality rates. At December 31, 2014, the total unfunded status of the defined benefit pensionplans was $60.7 million. The Company recorded a $42.0 million non-cash after-tax decrease in stockholders’ equity(through other non-owner changes to equity) to record the current year adjustments for changes in the funded status of itspension and postretirement benefit plans as required under the applicable accounting standards for defined benefit pensionand other postretirement plans. In 2014, the Company made approximately $7.6 million in contributions to its variousdefined benefit pension plans. The Company expects to contribute approximately $5.2 million to its various defined benefitpension plans in 2015. See Note 12 of the Consolidated Financial Statements.
At December 31, 2014, the Company held $46.0 million in cash and cash equivalents. The majority of this cash washeld by foreign subsidiaries. These amounts have no material regulatory or contractual restrictions and are expected toprimarily fund international investments and repay foreign borrowings. During 2014, the Company repatriated $12.5 millionof current year foreign earnings to the U.S.
Any future acquisitions are expected to be financed through internal cash, borrowings and equity, or a combinationthereof. Additionally, we may from time to time seek to retire or repurchase our outstanding debt through cash purchasesand/or exchanges for equity securities, in open market purchases, under a Rule 10b5-1 trading plan, privately negotiatedtransactions or otherwise. Such repurchases or exchanges, if any, will depend on prevailing market conditions, our liquidityrequirements, contractual restrictions and other factors.
Cash Flow
($ in millions) 2014 2013 $ Change % Change 2012
Operating activities $ 186.9 $ 10.1 $ 176.8 NM $ 136.4Investing activities (124.2) 157.4 (281.7) NM (332.8)Financing activities (83.5) (182.8) 99.3 (54.3)% 219.3Exchange rate effect (3.9) (0.2) (3.7) NM 1.0
(Decrease) increase in cash $ (24.8) $ (15.5) $ (9.3) 60.1% $ 23.9
NM – Not meaningful
27
Operating activities provided $186.9 million in cash in 2014 compared to $10.1 million in 2013. Operating cash flows inthe 2013 period were negatively impacted by $130.0 million of income tax payments related to the gain on the sale ofBDNA. The cash proceeds from the sale are reflected in investing activities in the 2013 period. Operating cash flows in the2013 period were also negatively impacted by a cash payment of approximately $12.7 million for tax, interest and penaltiesrelated to the Tax Court Decision. In the 2014 period, operating cash flows were positively impacted by improved operatingperformance as well as an increase in accrued liabilities, as compared to the 2013 period, due in part to an increase inaccruals for employee incentive compensation.
Investing activities used $124.2 million in cash in 2014 and provided $157.4 million in 2013. Cash provided byinvesting activities in 2013 includes proceeds of $538.9 million from the sale of BDNA, net of transaction costs and closingadjustments (see Note 2 of the Consolidated Financial Statements), which were partially offset by a cash outflow of$307.3 million to fund the acquisition of the Männer Business (see Note 3 of the Consolidated Financial Statements).Investing activities in 2014 include the release of $4.9 million of escrow funds related to the 2011 sale of the BDE business(see Note 2 of the Consolidated Financial Statements). Investing activities in 2014 and 2013 also include cash outflows of$70.1 million and $16.6 million, respectively, related to the Component Repair Programs (“CRPs”). See Note 6 of theConsolidated Financial Statements. Capital expenditures in 2014 were $57.4 million compared to $57.3 million in 2013. TheCompany expects capital spending in 2015 to approximate $60 million.
Cash used by financing activities in 2014 included a net decrease in borrowings of $32.0 million compared to$107.7 million in 2013. Financing activities in the 2014 period include the redemption of the convertible debt which isreflected within payments on long-term debt ($55.6 million par value) and premium paid on convertible debt redemption($14.9 million) which were financed through borrowings under the Amended Credit Facility. Financing activities in the 2014period also include the payment of an assumed liability to the seller in connection with the acquisition of the MännerBusiness. In the 2013 period, the reduction of debt reflects the use of proceeds from the BDNA sale to reduce borrowings.Incremental borrowings of €148.9 million ($202.3 million) were used to fund a portion of the Männer Business acquisition inOctober 2013.
Proceeds from the issuance of common stock decreased $2.0 million in the 2014 period from the 2013 period primarilyas a result of lower stock option exercises in the 2014 period. During the 2014 period, the Company repurchased 0.2 millionshares of the Company’s stock at a cost of $8.4 million. Stock repurchases of 2.4 million shares during the 2013 period cost$68.6 million. Total cash used to pay dividends increased to $24.5 million in 2014 compared to $22.4 million in 2013primarily due to dividend rate increases. Cash used by financing activities in the 2014 and 2013 periods was partially offsetby $4.9 million and $3.9 million, respectively, in excess tax benefits recorded for current year tax deductions related toemployee stock plan activity. Cash used by financing activities in the 2014 and 2013 periods also includes $0.1 million and$1.3 million, respectively, of deferred financing fees paid in connection with the issuance of the 3.97% Senior Notes in 2014and the Amended Credit Agreement in 2013.
Debt Covenants
Borrowing capacity is limited by various debt covenants in the Company’s debt agreements. As of December 31, 2014,the most restrictive financial covenant is included within the Amended Credit Agreement and requires the Company tomaintain a maximum ratio of Consolidated Senior Debt, as defined, to Consolidated EBITDA, as defined, of not more than3.25 times for the four fiscal quarters then ending. The Company’s Amended Credit Agreement also contains other financialcovenants that require the maintenance of a certain other debt ratio, Consolidated Total Debt, as defined, to ConsolidatedEBITDA of not more than 4.00 times and a certain interest coverage ratio, Consolidated EBITDA to Consolidated CashInterest Expense, as defined, of at least 4.25 times, at December 31, 2014. The Amended Credit Agreement also provides thatin connection with certain permitted acquisitions with aggregate consideration in excess of $150.0 million, the ConsolidatedSenior Debt to EBITDA ratio and the Consolidated Total Debt to EBITDA ratio are permitted to increase to 3.50 times and
28
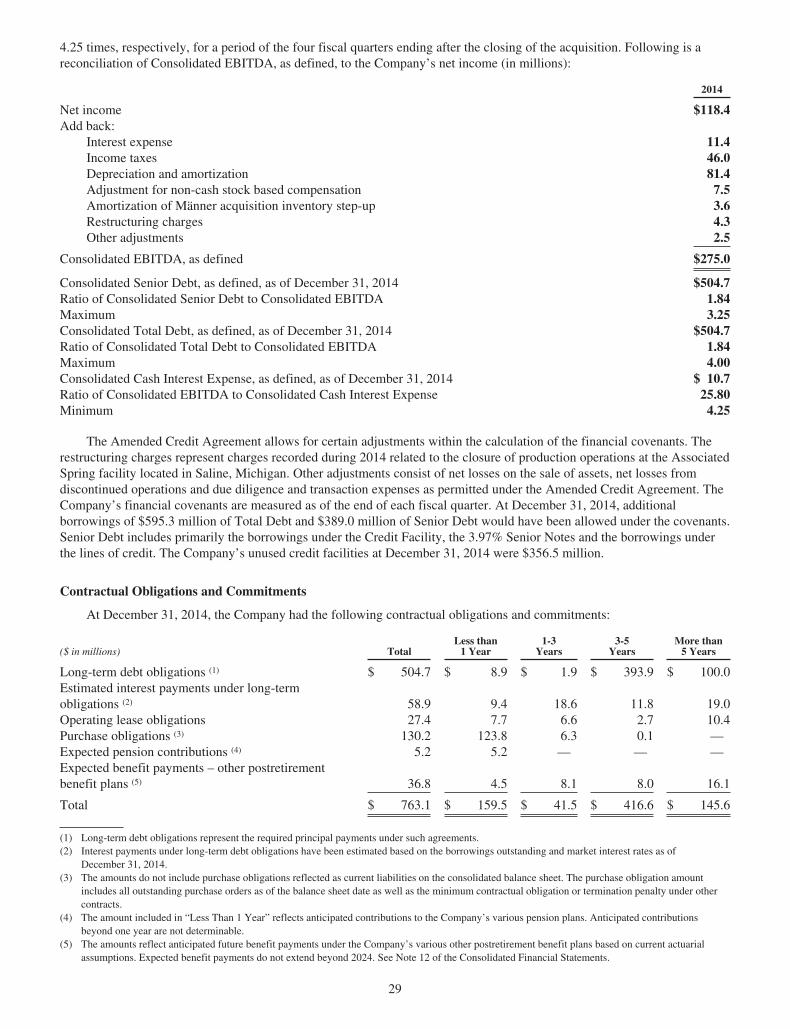
4.25 times, respectively, for a period of the four fiscal quarters ending after the closing of the acquisition. Following is areconciliation of Consolidated EBITDA, as defined, to the Company’s net income (in millions):
2014
Net income $118.4Add back:
Interest expense 11.4Income taxes 46.0Depreciation and amortization 81.4Adjustment for non-cash stock based compensation 7.5Amortization of Männer acquisition inventory step-up 3.6Restructuring charges 4.3Other adjustments 2.5
Consolidated EBITDA, as defined $275.0
Consolidated Senior Debt, as defined, as of December 31, 2014 $504.7Ratio of Consolidated Senior Debt to Consolidated EBITDA 1.84Maximum 3.25Consolidated Total Debt, as defined, as of December 31, 2014 $504.7Ratio of Consolidated Total Debt to Consolidated EBITDA 1.84Maximum 4.00Consolidated Cash Interest Expense, as defined, as of December 31, 2014 $ 10.7Ratio of Consolidated EBITDA to Consolidated Cash Interest Expense 25.80Minimum 4.25
The Amended Credit Agreement allows for certain adjustments within the calculation of the financial covenants. Therestructuring charges represent charges recorded during 2014 related to the closure of production operations at the AssociatedSpring facility located in Saline, Michigan. Other adjustments consist of net losses on the sale of assets, net losses fromdiscontinued operations and due diligence and transaction expenses as permitted under the Amended Credit Agreement. TheCompany’s financial covenants are measured as of the end of each fiscal quarter. At December 31, 2014, additionalborrowings of $595.3 million of Total Debt and $389.0 million of Senior Debt would have been allowed under the covenants.Senior Debt includes primarily the borrowings under the Credit Facility, the 3.97% Senior Notes and the borrowings underthe lines of credit. The Company’s unused credit facilities at December 31, 2014 were $356.5 million.
Contractual Obligations and Commitments
At December 31, 2014, the Company had the following contractual obligations and commitments:
($ in millions) TotalLess than
1 Year1-3
Years3-5
YearsMore than
5 Years
Long-term debt obligations (1) $ 504.7 $ 8.9 $ 1.9 $ 393.9 $ 100.0Estimated interest payments under long-termobligations (2) 58.9 9.4 18.6 11.8 19.0Operating lease obligations 27.4 7.7 6.6 2.7 10.4Purchase obligations (3) 130.2 123.8 6.3 0.1 —Expected pension contributions (4) 5.2 5.2 — — —Expected benefit payments – other postretirementbenefit plans (5) 36.8 4.5 8.1 8.0 16.1
Total $ 763.1 $ 159.5 $ 41.5 $ 416.6 $ 145.6
(1) Long-term debt obligations represent the required principal payments under such agreements.(2) Interest payments under long-term debt obligations have been estimated based on the borrowings outstanding and market interest rates as of
December 31, 2014.(3) The amounts do not include purchase obligations reflected as current liabilities on the consolidated balance sheet. The purchase obligation amount
includes all outstanding purchase orders as of the balance sheet date as well as the minimum contractual obligation or termination penalty under othercontracts.
(4) The amount included in “Less Than 1 Year” reflects anticipated contributions to the Company’s various pension plans. Anticipated contributionsbeyond one year are not determinable.
(5) The amounts reflect anticipated future benefit payments under the Company’s various other postretirement benefit plans based on current actuarialassumptions. Expected benefit payments do not extend beyond 2024. See Note 12 of the Consolidated Financial Statements.
29

The above table does not reflect unrecognized tax benefits as the timing of the potential payments of these amounts cannot be determined. See Note 13of the Consolidated Financial Statements.
OTHER MATTERS
Inflation
Inflation generally affects the Company through its costs of labor, equipment and raw materials. Increases in the costs ofthese items have historically been offset by price increases, commodity price escalator provisions, operating improvements,and other cost-saving initiatives.
Critical Accounting Policies
The preparation of financial statements requires management to make estimates and assumptions that affect the reportedamounts of assets and liabilities at the date of the financial statements and the reported amounts of revenues and expensesduring the reporting period. Significant accounting policies are disclosed in Note 1 of the Consolidated Financial Statements.The most significant areas involving management judgments and estimates are described below. Actual results could differfrom such estimates.
Inventory Valuation: Inventories are valued at the lower of cost, determined on a first-in, first-out basis, or market.Provisions are made to reduce excess or obsolete inventories to their estimated net realizable value. Loss provisions, if any,on aerospace contracts are established when estimable. Loss provisions are based on the projected excess of manufacturingcosts over the net revenues of the products or group of related products under contract or purchase order. The Companycarries a certain amount of inventory which includes certain parts related to specific engines within the Aftermarket MRObusiness. The process for evaluating the value of excess and obsolete inventory often requires the Company to makesubjective judgments and estimates concerning future sales levels, access to applicable markets, quantities and prices atwhich such inventory will be sold in the normal course of business. Accelerating the disposal process or incorrect estimatesof future sales potential may necessitate future adjustments to these provisions.
Business Acquisitions, Indefinite-Lived Intangible Assets and Goodwill: Assets and liabilities acquired in a businesscombination are recorded at their estimated fair values at the acquisition date. At December 31, 2014, the Company had$594.9 million and $36.9 million of goodwill and indefinite-lived intangible assets, respectively. Goodwill represents the costof acquisitions in excess of fair values assigned to the underlying net assets of acquired companies. Goodwill and intangibleassets deemed to have indefinite lives are not amortized but are subject to impairment testing annually or earlier if an eventor change in circumstances indicates that the fair value of a reporting unit may have been reduced below its carrying value.Management completes its annual impairment assessments for goodwill and indefinite-lived intangible assets during thesecond and third quarters of each year, respectively. The Company uses the option to first assess qualitative factors todetermine whether it is necessary to perform the two-step quantitative impairment tests in accordance with applicableaccounting standards.
Under the qualitative goodwill assessment, management considers relevant events and circumstances including but notlimited to macroeconomic conditions, industry and market considerations, overall unit performance and events directlyaffecting a unit. If the Company determines that the two-step quantitative impairment test is required, management estimatesthe fair value of the reporting unit primarily using the income approach, which reflects management’s cash flow projections,and also evaluates the fair value using the market approach. Inherent in management’s development of cash flow projectionsare assumptions and estimates, including those related to future earnings and growth and the weighted average cost ofcapital. Based on the second quarter 2014 assessment, the estimated fair values of the Synventive and Männer reportingunits, which were acquired in August 2012 and October 2013, respectively, exceeded their carrying values and the estimatedfair value of the remaining reporting units significantly exceeded their carrying values. There was no goodwill impairment atany reporting units through June 30, 2014. Many of the factors used in assessing fair value are outside the control ofmanagement, and these assumptions and estimates can change in future periods as a result of both Company-specific andoverall economic conditions. Management’s quantitative assessment during the second quarter of 2014 included a review ofthe potential impacts of current and projected market conditions from a market participant’s perspective on reporting units’projected cash flows, growth rates and cost of capital to assess the likelihood of whether the fair value would be less than thecarrying value. While management expects future operating improvements at certain reporting units to result from improvingend-market conditions, new product introductions and further market penetration, there can be no assurance that suchexpectations will be met or that the fair value of the reporting units will continue to exceed their carrying values. If the fairvalues were to fall below the carrying values, a non-cash impairment charge to income from operations could result.Management also performed its annual impairment testing of its trade names, indefinite-lived intangible assets, during thethird quarter of 2014. Based on this assessment, there was no trade name impairment recognized.
30

Aerospace Aftermarket Programs: The Company participates in aftermarket RSPs under which the Companyreceives an exclusive right to supply designated aftermarket parts over the life of the related aircraft engine program. Asconsideration, the Company has paid participation fees, which are recorded as intangible assets. The carrying value of theseintangible assets was $220.7 million at December 31, 2014. The Company records amortization of the related asset as salesdollars are being earned based on a proportional sales dollar method. Specifically, this method amortizes each asset as areduction to revenue based on the proportion of sales under a program in a given period to the estimated aggregate salesdollars over the life of that program which reflects the pattern in which economic benefits are realized.
The Company entered into Component Repair Programs (“CRPs”) with General Electric during the fourth quarter of2013 (“CRP 1”) and the second quarter of 2014 (“CRP 2”). The CRPs provide for, among other items, the right to sell certainaftermarket component repair services for CFM56, CF6 and LM engines directly to other customers as one of a fewGE licensed suppliers. In addition, the CRPs extend certain existing contracts under which the Company currently providesthese services directly to GE. The Company agreed to pay $26.6 million and $80.0 million as consideration for the rightsrelated CRP1 and CRP 2, respectively. The Company recorded the CRP payments as an intangible asset which is recognizedas a reduction of sales over the remaining useful life of these engine programs. This method reflects the pattern in which theeconomic benefits of the CRPs are realized.
The recoverability of each asset is subject to significant estimates about future revenues related to the program’saftermarket parts and services. The Company evaluates these intangible assets for recoverability and updates amortizationrates on an agreement by agreement basis for the RSPs and on an individual asset basis for the CRPs. The assets are reviewedfor recoverability periodically including whenever events or changes in circumstances indicate that their carrying amountmay not be recoverable. Annually, the Company evaluates the remaining useful life of these assets to determine whetherevents and circumstances warrant a revision to the remaining periods of amortization. Management updates revenueprojections, which includes comparing actual experience against projected revenue and industry projections. The potentialexists that actual revenues will not meet expectations due to a change in market conditions, including, for example, thereplacement of older engines with new, more fuel-efficient engines or the Company’s ability to capture additional marketshare within the aftermarket business. A shortfall in future revenues may indicate a triggering event requiring a write downor further evaluation of the recoverability of the assets or require the Company to accelerate amortization expenseprospectively dependent on the level of the shortfall. The Company has not identified any impairment of these assets. SeeNote 6 of the Consolidated Financial Statements.
Pension and Other Postretirement Benefits: Accounting policies and significant assumptions related to pension andother postretirement benefits are disclosed in Note 12 of the Consolidated Financial Statements. As discussed further below,the significant assumptions that impact pension and other postretirement benefits include discount rates, mortality rates andexpected long-term rates of return on invested pension assets.
The following table provides a breakout of the current targeted mix of investments, by asset classification, along withthe historical rates of return for each asset class and the long-term projected rates of return for the U.S. plans.
TargetAsset
Mix %
Annual Return %
Historical (1)
Long-Term
Projection
Asset classU.S. large cap growth equity 6 10.1 8.2U.S. large cap value equity 5 11.1 8.2U.S. mid cap equity 4 12.5 8.5U.S. small cap – growth equity 2 8.8 9.1U.S. small cap – value equity 2 11.8 9.1Global equity 13 7.9 9.3International Developed market equity 20 5.3 9.7Emerging market equity 13 11.4 12.4Fixed income – long government credit 15 8.9 5.6Fixed income – long credit 15 8.9 5.9Cash 5 3.6 3.0Weighted average 9.1 8.25
(1) Historical returns based on the life of the respective index, or approximately 30 years.
31
The historical rates of return for the Company’s defined benefit plans were calculated based upon compounded averagerates of return of published indices. During the fourth quarter of 2014, the Company approved a change in the targeted mix ofassets. The revised target mix reflects a 65% equity investment target and a 35% aggregate target for fixed income and cashinvestments (in aggregate). This represents a strategic investment shift from a 75% equity investment target and 25%aggregate target for fixed income and cash investments (in aggregate). Within the equity investment of 65%, the Companyhas changed its targeted sub-class asset mix from 15% international investments to 45% international equityinvestments. Based on the historical and projected rates of return of the revised target asset mix, management selected along-term expected rate of return on its U.S. pension assets of 8.25%. The long-term rates of return for non-U.S. plans wereselected based on actual historical rates of return of published indices that were used to measure the plans’ target assetallocations. Historical rates were then discounted to consider fluctuations in the historical rates as well as potential changesin the investment environment.
The discount rate used for the Company’s U.S. pension plans reflects the rate at which the pension benefits could beeffectively settled. At December 31, 2014, the Company selected a discount rate of 4.25% based on a bond matching modelfor its U.S. pension plans. Market interest rates have decreased in 2014 as compared with 2013 and, as a result, the discountrate used to measure pension liabilities decreased from 5.20% at December 31, 2013. The discount rates for non-U.S. planswere selected based on bond matching models or on indices of high-quality bonds using criteria applicable to the respectivecountries.
A one-quarter percentage point change in the assumed long-term rate of return on the Company’s U.S. pension plans asof December 31, 2014 would impact the Company’s 2015 pre-tax income by approximately $1.0 million annually. A one-quarter percentage point decrease in the discount rate on the Company’s U.S. pension plans as of December 31, 2014 woulddecrease the Company’s 2015 pre-tax income by approximately $1.1 million annually. The Company reviews these and otherassumptions at least annually.
The Company recorded a $42.0 million non-cash after-tax decrease in stockholders equity (through other non-ownerchanges to equity) to record the current year adjustments for changes in the funded status of its pension and postretirementbenefit plans as required under accounting for defined benefit and other postretirement plans. This decrease in stockholdersequity resulted primarily from losses related to changes in actuarial assumptions, combined with unfavorable variancesbetween expected and actual returns on pension plan assets. During 2014, the fair value of the Company’s pension planassets decreased by $0.9 million and the projected benefit obligation increased $59.7 million. The change in the projectedbenefit obligation included a $68.6 million (pre-tax) increase due to actuarial losses that resulted primarily from decreases inthe discount rates and improvements in mortality rates used to measure pension liabilities. Prior to December 31, 2014 theCompany utilized the 2000 Retired Pensioners Mortality Table projected to 2020 to determine benefit obligations for itsU.S. pension plans. At December 31, 2014, the Company updated its mortality table assumptions to the Mercer IndustryLongevity Experience Studies base table for the “Automotive, Industrial Goods and Transportation” industry and the Mercermodified MP-2014 projection table as the Company believes these tables are expected to more accurately reflect currenttrends in mortality. Changes to other actuarial assumptions in 2014 did not have a material impact on our stockholders equityor projected benefit obligation. Actual pre-tax return on total pension plan assets was $26.8 million compared with anexpected pre-tax return on pension assets of $34.2 million. Approximately $4.9 million of pension plan asset and projectedbenefit obligation decreases relate to settlements that occurred during 2014. Pension expense for 2015 is expected to increasefrom $3.4 million in 2014, of which $1.8 million relates to settlements, curtailments and special termination charges, to $8.2million in 2015, primarily as a result of an increase in the amortization of actuarial losses resulting from changes in certainactuarial assumptions, primarily lower discount rates and expected rates of return on assets, combined with improvements inmortality rates.
Income Taxes: As of December 31, 2014, the Company had recognized $41.9 million of deferred tax assets, net ofvaluation reserves. The realization of these benefits is dependent in part on the amount and timing of future taxable income inthe jurisdictions where deferred tax assets reside. For those jurisdictions where the expiration date of tax loss carryforwardsor the projected operating results indicate that realization is not likely, a valuation allowance is provided. Managementbelieves that sufficient taxable income should be earned in the future to realize deferred income tax assets, net of valuationallowances recorded.
The valuation of deferred tax assets requires significant judgment. Management’s assessment that these deferred taxassets will be realized represents its estimate of future results; however, there can be no assurance that such expectations willbe met. Changes in management’s assessment of achieving sufficient future taxable income could materially increase theCompany’s tax expense and could have a material adverse impact on the Company’s financial condition and results ofoperations.
32
Additionally, the Company is exposed to certain tax contingencies in the ordinary course of business and, accordingly,records those tax liabilities in accordance with the guidance for accounting for uncertainty in income taxes. For those taxpositions where it is more likely than not that a tax benefit will be sustained, the Company has recorded the largest amount oftax benefit with a greater than 50% likelihood of being realized. For those income tax positions where it is more likely thannot that a tax benefit will not be sustained, no tax benefit has been recognized in the financial statements. See Note 14 of theConsolidated Financial Statements.
Stock-Based Compensation: The Company accounts for its stock-based employee compensation plans at fair value onthe grant date and recognizes the related cost in its consolidated statement of income in accordance with accountingstandards related to share-based payments. The fair values of stock options are estimated using the Black-Scholes option-pricing model based on certain assumptions. The fair values of service and performance based share awards are estimatedbased on the fair market value of the Company’s stock price on the grant date. The fair value of market based performanceshare awards are estimated using the Monte Carlo valuation method. See Note 13 of the Consolidated Financial Statements.
Recent Accounting Changes
In April 2014, the Financial Accounting Standards Board (FASB) amended its guidance related to reportingdiscontinued operations. The amended guidance changes the criteria for determining which disposals can be presented asdiscontinued operations and modifies the related disclosure requirements. Under the amended guidance, a disposal of acomponent of an entity or a group of components of an entity is required to be reported in discontinued operations if thedisposal represents a strategic shift that has (or will have) a major effect on an entity’s operations and financial results and isdisposed of or classified as held for sale. The guidance also requires several new disclosures. The guidance appliesprospectively to new disposals and new classifications of disposal groups as held for sale after the effective date and iseffective for annual and interim periods beginning after December 15, 2014, with early adoption permitted. The Company isevaluating this guidance and will apply the guidance in the event that the Company has a future disposal that qualifies as adiscontinued operation or is classified as held for sale.
In May 2014, the FASB amended its guidance related to revenue recognition. The amended guidance establishes asingle comprehensive model for companies to use in accounting for revenue arising from contracts with customers and willsupersede most of the existing revenue recognition guidance, including industry-specific guidance. The amended guidanceclarifies that an entity recognizes revenue to depict the transfer of promised goods or services to customers in an amount thatreflects the consideration to which the entity expects to be entitled in exchange for those goods or services. In applying theamended guidance, an entity will (1) identify the contract(s) with a customer; (2) identify the performance obligations in thecontract; (3) determine the transaction price; (4) allocate the transaction price to the contract’s performance obligations; and(5) recognize revenue when (or as) the entity satisfies a performance obligation. The amended guidance applies to allcontracts with customers except those that are within the scope of other topics in the FASB Accounting StandardsCodification. The amended guidance is effective for annual reporting periods (including interim periods within those periods)beginning after December 15, 2016 for public companies. Early adoption is not permitted. Entities have the option of usingeither a full retrospective or modified approach to the amended guidance. The Company is evaluating this guidance and hasnot determined the impact that it may have on its financial statements nor decided upon the method of adoption.
EBITDA
Earnings before interest expense, income taxes, and depreciation and amortization (“EBITDA”) for 2014 was$257.4 million compared to $504.7 million in 2013. EBITDA is a measurement not in accordance with generally acceptedaccounting principles (“GAAP”). The Company defines EBITDA as net income plus interest expense, income taxes, anddepreciation and amortization which the Company incurs in the normal course of business and in 2013 included a pre-taxgain of $313.7 million on the sale of BDNA. The Company does not intend EBITDA to represent cash flows from operationsas defined by GAAP, and the reader should not consider it as an alternative to net income, net cash provided by operatingactivities or any other items calculated in accordance with GAAP, or as an indicator of the Company’s operatingperformance. The Company’s definition of EBITDA may not be comparable with EBITDA as defined by other companies.The Company believes EBITDA is commonly used by financial analysts and others in the industries in which the Companyoperates and, thus, provides useful information to investors. Accordingly, the calculation has limitations depending on itsuse.
33
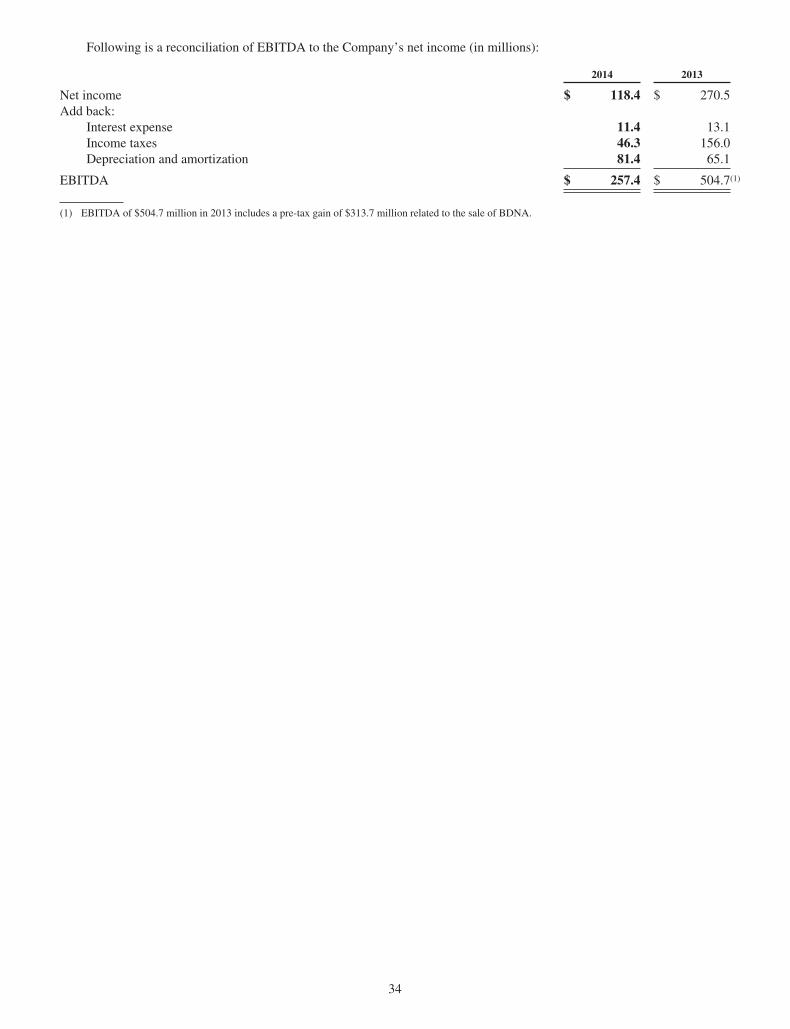
Following is a reconciliation of EBITDA to the Company’s net income (in millions):
2014 2013
Net income $ 118.4 $ 270.5Add back:
Interest expense 11.4 13.1Income taxes 46.3 156.0Depreciation and amortization 81.4 65.1
EBITDA $ 257.4 $ 504.7(1)
(1) EBITDA of $504.7 million in 2013 includes a pre-tax gain of $313.7 million related to the sale of BDNA.
34
Item 7A. Quantitative and Qualitative Disclosures About Market Risk
Market risk is the potential economic loss that may result from adverse changes in the fair value of financialinstruments. The Company’s financial results could be impacted by changes in interest rates and foreign currency exchangerates, and commodity price changes. The Company uses financial instruments to hedge its exposure to fluctuations in interestrates and foreign currency exchange rates. The Company does not use derivatives for speculative or trading purposes.
The Company’s long-term debt portfolio consists of fixed-rate and variable-rate instruments and is managed to reducethe overall cost of borrowing while also minimizing the effect of changes in interest rates on near-term earnings. TheCompany’s primary interest rate risk is derived from its outstanding variable-rate debt obligations. Financial instrumentshave been used by the Company to hedge its exposures to fluctuations in interest rates. In April 2012, the Company enteredinto five-year interest rate swap agreements transacted with three banks which together convert the interest on the first$100.0 million of borrowings under the Company’s Amended Credit Agreement from a variable rate plus the borrowingspread to a fixed rate of 1.03% plus the borrowing spread for the purpose of mitigating its exposure to variable interest rates.At December 31, 2014, the result of a hypothetical 100 basis point increase in the average cost of the Company’s variable-rate debt would have reduced annual pretax profit by $3.8 million.
At December 31, 2014, the fair value of the Company’s fixed-rate debt was $106.3 million, compared with its carryingamount of $103.2 million. The Company estimates that a 100 basis point decrease in market interest rates at December 31,2014 would have increased the fair value of the Company’s fixed rate debt to $115.0 million.
The Company has manufacturing, sales and distribution facilities around the world and thus makes investments andconducts business transactions denominated in various currencies. The Company is exposed primarily to financialinstruments denominated in currencies other than the functional currency at its international locations. A 10% adverse changein foreign currencies relative to the U.S dollar at December 31, 2014 would have resulted in a $1.6 million loss in the fairvalue of those financial instruments. At December 31, 2014, the Company held $46.0 million of cash and cash equivalents,the majority of which is held by foreign subsidiaries.
Foreign currency commitments and transaction exposures are managed at the operating units as an integral part of theirbusinesses in accordance with a corporate policy that addresses acceptable levels of foreign currency exposures. AtDecember 31, 2014, the Company did not hedge its foreign currency net investment exposures.
Additionally, to reduce foreign currency exposure, management generally maintains the majority of foreign cash andshort-term investments in functional currency and uses forward currency contracts for non-functional currency denominatedmonetary assets and liabilities and anticipated transactions in an effort to reduce the effect of the volatility of changes inforeign exchange rates on the income statement. In historically weaker currency countries, such as Brazil and Mexico,management assesses the strength of these currencies relative to the U.S. dollar and may elect during periods of localcurrency weakness to invest excess cash in U.S. dollar-denominated instruments.
The Company’s exposure to commodity price changes relates to certain manufacturing operations that utilize high-gradesteel spring wire, stainless steel, titanium, Inconel, Hastelloys and other specialty metals. The Company attempts to manageits exposure to price increases through its procurement and sales practices.
35
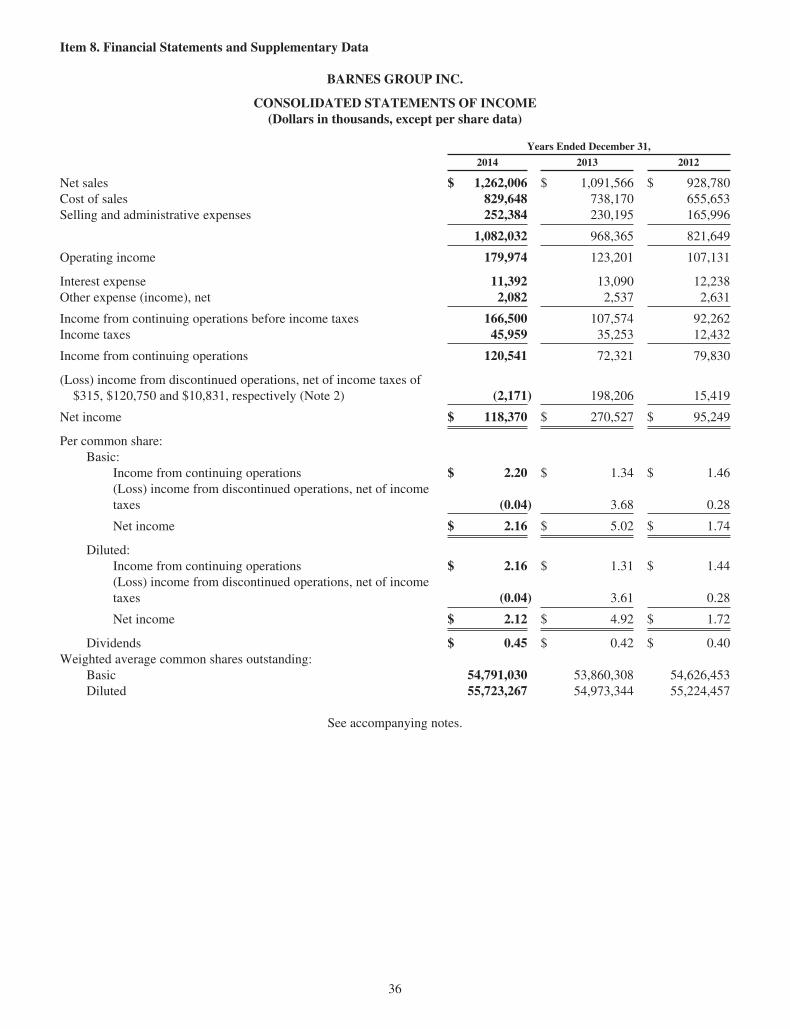
Item 8. Financial Statements and Supplementary Data
BARNES GROUP INC.
CONSOLIDATED STATEMENTS OF INCOME(Dollars in thousands, except per share data)
Years Ended December 31,
2014 2013 2012
Net sales $ 1,262,006 $ 1,091,566 $ 928,780Cost of sales 829,648 738,170 655,653Selling and administrative expenses 252,384 230,195 165,996
1,082,032 968,365 821,649
Operating income 179,974 123,201 107,131
Interest expense 11,392 13,090 12,238Other expense (income), net 2,082 2,537 2,631
Income from continuing operations before income taxes 166,500 107,574 92,262Income taxes 45,959 35,253 12,432
Income from continuing operations 120,541 72,321 79,830
(Loss) income from discontinued operations, net of income taxes of$315, $120,750 and $10,831, respectively (Note 2) (2,171) 198,206 15,419
Net income $ 118,370 $ 270,527 $ 95,249
Per common share:Basic:
Income from continuing operations $ 2.20 $ 1.34 $ 1.46(Loss) income from discontinued operations, net of incometaxes (0.04) 3.68 0.28
Net income $ 2.16 $ 5.02 $ 1.74
Diluted:Income from continuing operations $ 2.16 $ 1.31 $ 1.44(Loss) income from discontinued operations, net of incometaxes (0.04) 3.61 0.28
Net income $ 2.12 $ 4.92 $ 1.72
Dividends $ 0.45 $ 0.42 $ 0.40Weighted average common shares outstanding:
Basic 54,791,030 53,860,308 54,626,453Diluted 55,723,267 54,973,344 55,224,457
See accompanying notes.
36

BARNES GROUP INC.
CONSOLIDATED STATEMENTS OF COMPREHENSIVE INCOME(Dollars in thousands)
Years Ended December 31,
2014 2013 2012
Net income $ 118,370 $ 270,527 $ 95,249Other comprehensive (loss) income, net of tax
Unrealized loss on hedging activities, net of tax (1) (213) (87) (635)Foreign currency translation adjustments, net of tax (2) (83,168) 19,615 24,678Defined benefit pension and other postretirement benefits, netof tax (3) (42,016) 73,168 (15,741)
Total other comprehensive (loss) income, net of tax (125,397) 92,696 8,302
Total comprehensive income $ (7,027) $ 363,223 $ 103,551
(1) Net of tax of $(45), $272 and $(513) for the years ended December 31, 2014, 2013 and 2012, respectively.(2) Net of tax of $(3,292), $439 and $1,262 for the years ended December 31, 2014, 2013 and 2012, respectively.(3) Net of tax of $(24,799), $43,109 and $(7,994) for the years ended December 31, 2014, 2013 and 2012, respectively.
See accompanying notes.
37
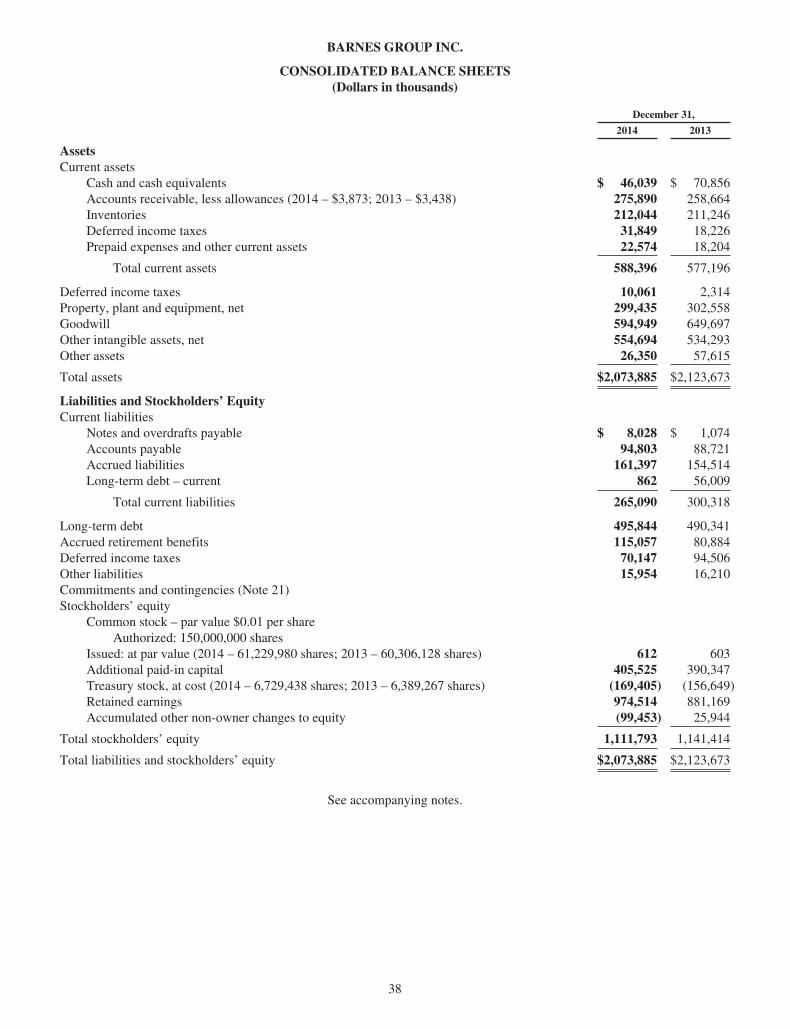
BARNES GROUP INC.
CONSOLIDATED BALANCE SHEETS(Dollars in thousands)
December 31,
2014 2013
AssetsCurrent assets
Cash and cash equivalents $ 46,039 $ 70,856Accounts receivable, less allowances (2014 – $3,873; 2013 – $3,438) 275,890 258,664Inventories 212,044 211,246Deferred income taxes 31,849 18,226Prepaid expenses and other current assets 22,574 18,204
Total current assets 588,396 577,196
Deferred income taxes 10,061 2,314Property, plant and equipment, net 299,435 302,558Goodwill 594,949 649,697Other intangible assets, net 554,694 534,293Other assets 26,350 57,615
Total assets $2,073,885 $2,123,673
Liabilities and Stockholders’ EquityCurrent liabilities
Notes and overdrafts payable $ 8,028 $ 1,074Accounts payable 94,803 88,721Accrued liabilities 161,397 154,514Long-term debt – current 862 56,009
Total current liabilities 265,090 300,318
Long-term debt 495,844 490,341Accrued retirement benefits 115,057 80,884Deferred income taxes 70,147 94,506Other liabilities 15,954 16,210Commitments and contingencies (Note 21)Stockholders’ equity
Common stock – par value $0.01 per shareAuthorized: 150,000,000 shares
Issued: at par value (2014 – 61,229,980 shares; 2013 – 60,306,128 shares) 612 603Additional paid-in capital 405,525 390,347Treasury stock, at cost (2014 – 6,729,438 shares; 2013 – 6,389,267 shares) (169,405) (156,649)Retained earnings 974,514 881,169Accumulated other non-owner changes to equity (99,453) 25,944
Total stockholders’ equity 1,111,793 1,141,414
Total liabilities and stockholders’ equity $2,073,885 $2,123,673
See accompanying notes.
38

BARNES GROUP INC.
CONSOLIDATED STATEMENTS OF CASH FLOWS(Dollars in thousands)
Years Ended December 31,
2014 2013 2012
Operating activities:Net income $ 118,370 $ 270,527 $ 95,249Adjustments to reconcile net income to net cash provided by operatingactivities:
Depreciation and amortization 81,395 65,052 57,360Amortization of convertible debt discount 731 2,391 2,211Loss (gain) on disposition of property, plant and equipment 143 (887) (178)Stock compensation expense 7,603 18,128 8,819Withholding taxes paid on stock issuances (4,367) (2,090) (1,150)Loss (gain) on the sale of businesses 1,586 (313,708) 886Changes in assets and liabilities, net of the effects of acquisitions/divestitures:
Accounts receivable (21,367) (23,764) (4,160)Inventories (10,092) 2,079 5,404Prepaid expenses and other current assets (7,137) (2,172) (4,341)Accounts payable 8,123 2,384 (5,493)Accrued liabilities 24,402 (9,891) (9,746)Deferred income taxes (9,841) 3,412 9,446Long-term retirement benefits (7,584) (642) (16,438)Other 4,933 (729) (1,492)
Net cash provided by operating activities 186,898 10,090 136,377
Investing activities:Proceeds from disposition of property, plant and equipment 849 1,767 854(Payments for) proceeds from the sale of businesses (1,181) 538,942 (438)Change in restricted cash 4,886 — 4,900Capital expenditures (57,365) (57,304) (37,787)Business acquisitions, net of cash acquired — (307,264) (296,560)Component Repair Program payments (70,100) (16,639) —Other (1,338) (2,058) (3,776)
Net cash (used) provided by investing activities (124,249) 157,444 (332,807)
Financing activities:Net change in other borrowings 7,009 (2,753) (8,852)Payments on long-term debt (332,336) (555,195) (114,411)Proceeds from the issuance of long-term debt 293,291 450,253 376,000Payment of assumed liability to Otto Männer Holding AG (19,796) — —Premium paid on convertible debt redemption (14,868) — —Proceeds from the issuance of common stock 11,460 13,491 7,061Common stock repurchases (8,389) (68,608) (19,037)Dividends paid (24,464) (22,422) (21,662)Excess tax benefit on stock awards 4,888 3,899 1,438Other (338) (1,472) (1,261)
Net cash (used) provided by financing activities (83,543) (182,807) 219,276Effect of exchange rate changes on cash flows (3,923) (227) 1,005
(Decrease) increase in cash and cash equivalents (24,817) (15,500) 23,851Cash and cash equivalents at beginning of year 70,856 86,356 62,505
Cash and cash equivalents at end of year $ 46,039 $ 70,856 $ 86,356
Supplemental Disclosure of Cash Flow Information:
Non-cash investing activities in 2014 and 2013 included the acquisition of $19,000 and $10,000, respectively, ofintangible assets, and the recognition of the corresponding liabilities, in connection with the Component Repair Programs.Non-cash financing activities in 2013 included the issuance of 1,032,493 treasury shares ($36,695) in connection with theacquisition of the Männer Business. Non-cash investing activities in 2012 included the assumption of $45,537 of debt inconnection with the acquisition of Synventive Molding Solutions.
See accompanying notes.
39
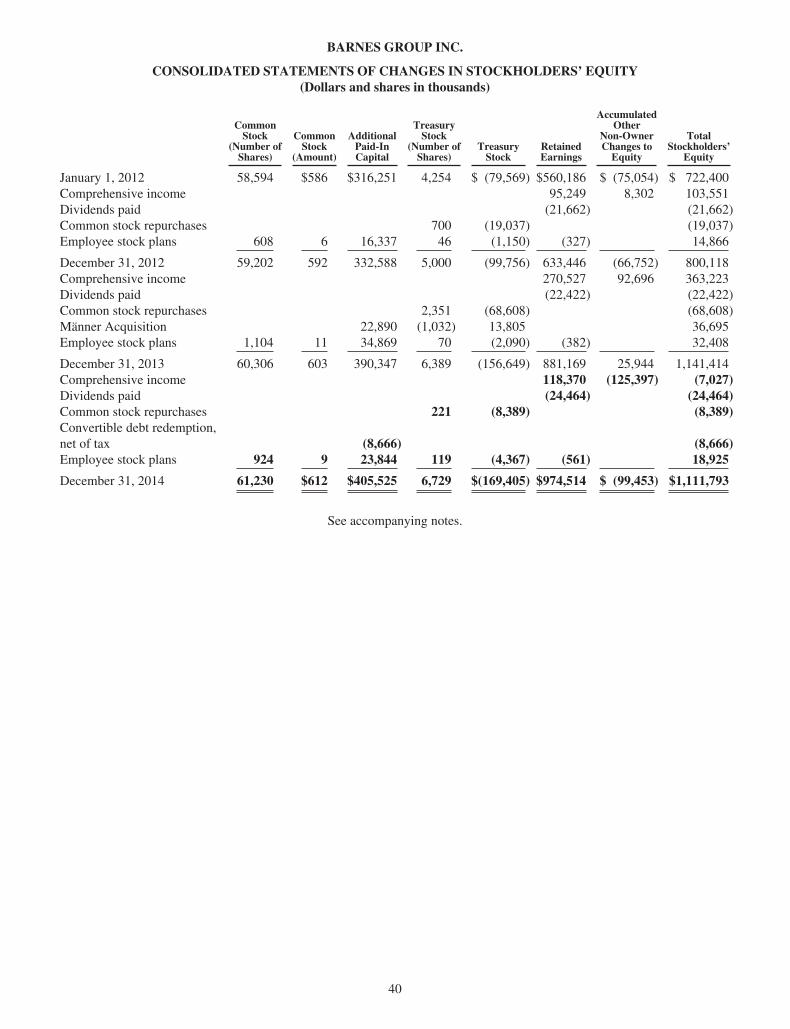
BARNES GROUP INC.
CONSOLIDATED STATEMENTS OF CHANGES IN STOCKHOLDERS’ EQUITY(Dollars and shares in thousands)
CommonStock
(Number ofShares)
CommonStock
(Amount)
AdditionalPaid-InCapital
TreasuryStock
(Number ofShares)
TreasuryStock
RetainedEarnings
AccumulatedOther
Non-OwnerChanges to
Equity
TotalStockholders’
Equity
January 1, 2012 58,594 $586 $316,251 4,254 $ (79,569) $560,186 $ (75,054) $ 722,400Comprehensive income 95,249 8,302 103,551Dividends paid (21,662) (21,662)Common stock repurchases 700 (19,037) (19,037)Employee stock plans 608 6 16,337 46 (1,150) (327) 14,866
December 31, 2012 59,202 592 332,588 5,000 (99,756) 633,446 (66,752) 800,118Comprehensive income 270,527 92,696 363,223Dividends paid (22,422) (22,422)Common stock repurchases 2,351 (68,608) (68,608)Männer Acquisition 22,890 (1,032) 13,805 36,695Employee stock plans 1,104 11 34,869 70 (2,090) (382) 32,408
December 31, 2013 60,306 603 390,347 6,389 (156,649) 881,169 25,944 1,141,414Comprehensive income 118,370 (125,397) (7,027)Dividends paid (24,464) (24,464)Common stock repurchases 221 (8,389) (8,389)Convertible debt redemption,net of tax (8,666) (8,666)Employee stock plans 924 9 23,844 119 (4,367) (561) 18,925
December 31, 2014 61,230 $612 $405,525 6,729 $(169,405) $974,514 $ (99,453) $1,111,793
See accompanying notes.
40

BARNES GROUP INC.
NOTES TO CONSOLIDATED FINANCIAL STATEMENTS
(All dollar amounts included in the notes are stated in thousands except per share dataand the tables in Note 20)
1. Summary of Significant Accounting Policies
General: The preparation of consolidated financial statements requires management to make estimates and assumptionsthat affect the reported amounts of assets and liabilities at the date of the financial statements and the reported amounts ofrevenues and expenses during the reporting period. Actual results could differ from those estimates.
Consolidation: The accompanying consolidated financial statements include the accounts of the Company and all of itssubsidiaries. Intercompany transactions and account balances have been eliminated.
In the fourth quarter of 2013, the Company and two of its subsidiaries (collectively with the Company, the “Purchaser”)completed the acquisition of the Männer Business (defined below) pursuant to the terms of the Share Purchase andAssignment Agreement dated September 30, 2013 (“Share Purchase Agreement”) among the Purchaser, Otto MännerHolding AG, a German company based in Bahlingen, Germany (the “Seller”), and the three shareholders of the Seller(“the Männer Business”). The acquisition has been integrated into the Industrial segment. The results of the MännerBusiness, from the date of the acquisition on October 31, 2013, are included within the Company’s Consolidated FinancialStatements for the year ended December 31, 2013. See Note 3 of the Consolidated Financial Statements.
In the second quarter of 2013, the Company completed the sale of its Barnes Distribution North America business(“BDNA”) to MSC Industrial Direct Co., Inc. (“MSC”). The results of these operations are segregated and presented asdiscontinued operations in the Consolidated Financial Statements. See Note 2 of the Consolidated Financial Statements.
In the first quarter of 2013, the Company realigned its organizational structure by aligning its strategic business unitsinto two reportable segments: Industrial and Aerospace. See Note 20 of the Consolidated Financial Statements.
In the third quarter of 2012, the Company completed its acquisition of Synventive Molding Solutions (“Synventive”).The acquisition has been integrated into the Industrial segment. The results of Synventive, from the date of the acquisition onAugust 27, 2012, are included within the Company’s Consolidated Financial Statements for the year ended December 31,2012. See Note 3 of the Consolidated Financial Statements.
All previously reported financial information has been adjusted on a retrospective basis to reflect the discontinuedoperations of BDNA and the segment realignment for all years presented.
Revenue recognition: Sales and related cost of sales are recognized when products are shipped or delivered tocustomers depending upon when title and risk of loss have passed. Service revenue is recognized when the related servicesare performed. In the aerospace manufacturing businesses, the Company recognizes revenue based on the units-of-deliverymethod in accordance with accounting standards related to accounting for performance of construction-type and certainproduction-type contracts. Management fees related to the aerospace aftermarket Revenue Sharing Programs (“RSPs”) aresatisfied through an agreed upon reduction from the sales price of each of the related spare parts. These fees recognize ourcustomer’s necessary performance of engine program support activities, such as spare parts administration, warehousing andinventory management, and customer support, and are not separable from our sale of products, and accordingly, they arereflected as a reduction to sales, rather than as costs incurred, when revenues are recognized.
Operating expenses: The Company includes manufacturing labor, material, manufacturing overhead and costs of itsdistribution network within cost of sales. Other costs, including selling personnel costs and commissions, and other generaland administrative costs of the Company are included within selling and administrative expenses. Depreciation andamortization expense is allocated between cost of sales and selling and administrative expenses.
Cash and cash equivalents: Cash in excess of operating requirements is invested in short-term, highly liquid, income-producing investments. All highly liquid investments purchased with an original maturity of three months or less areconsidered cash equivalents. Cash equivalents are carried at cost which approximates fair value.
Inventories: Inventories are valued at the lower of cost, determined on a first-in, first-out basis, or market. Lossprovisions, if any, on aerospace contracts are established when estimable. Loss provisions are based on the projected excessof manufacturing costs over the net revenues of the products or group of related products under contract or purchase order.
41
BARNES GROUP INC.
NOTES TO CONSOLIDATED FINANCIAL STATEMENTS—(Continued)
Property, plant and equipment: Property, plant and equipment is stated at cost. Depreciation is recorded overestimated useful lives, ranging from 20 to 50 years for buildings, three to five years for computer equipment, four to 12 yearsfor machinery and equipment and 12 to 17 years for furnaces and boilers. The straight-line method of depreciation wasadopted for all property, plant and equipment placed in service after March 31, 1999. For property, plant and equipmentplaced into service prior to April 1, 1999, depreciation is calculated using accelerated methods. The Company assesses theimpairment of property, plant and equipment subject to depreciation whenever events or changes in circumstances indicatethe carrying value may not be recoverable.
Goodwill: Goodwill represents the excess purchase cost over the fair value of net assets of companies acquired inbusiness combinations. Goodwill is considered an indefinite-lived asset. Goodwill is subject to impairment testing inaccordance with accounting standards governing such on an annual basis, in the second quarter, or more frequently if anevent or change in circumstances indicates that the fair value of a reporting unit has been reduced below its carrying value.Based on the assessments performed during 2014, there was no goodwill impairment.
Aerospace Aftermarket Programs: The Company participates in aftermarket RSPs under which the Companyreceives an exclusive right to supply designated aftermarket parts over the life of the related aircraft engine program. Asconsideration, the Company has paid participation fees, which are recorded as long-lived intangible assets. The Companyrecords amortization of the related intangible asset as sales dollars are being earned based on a proportional sales dollarmethod. Specifically, this method amortizes each asset as a reduction to revenue based on the proportion of sales under aprogram in a given period to the estimated aggregate sales dollars over the life of that program.
The Company also entered into Component Repair Programs (“CRPs”) that provide for, among other items, the right tosell certain aftermarket component repair services for CFM56, CF6 and LM engines directly to other customers as one of afew GE licensed suppliers. In addition, the CRPs extend certain existing contracts under which the Company currentlyprovides these services directly to GE. The Company has recorded the consideration for these rights as an intangible assetthat will be amortized as a reduction to sales over the remaining life of these engine programs. This method reflects thepattern in which the economic benefits of the RSPs and the CRP are realized.
The recoverability of each asset is subject to significant estimates about future revenues related to the program’saftermarket parts and services. The Company evaluates these intangible assets for recoverability and updates amortizationrates on an agreement by agreement basis for the RSP’s and on an individual asset basis for the CRPS. The assets arereviewed for recoverability periodically including whenever events or changes in circumstances indicate that their carryingamount may not be recoverable. Annually, the Company evaluates the remaining useful life of these assets to determinewhether events and circumstances warrant a revision to the remaining periods of amortization. Management updates revenueprojections, which includes comparing actual experience against projected revenue and industry projections. The potentialexists that actual revenues will not meet expectations due to a change in market conditions including, for example, thereplacement of older engines with new, more fuel-efficient engines or the Company’s ability to capture additional marketshare within the Aftermarket business. A shortfall in future revenues may indicate a triggering event requiring a write downor further evaluation of the recoverability of the assets or require the Company to accelerate amortization expenseprospectively dependent on the level of the shortfall. The Company has not identified any impairment of these assets.
Other Intangible Assets: Other intangible assets consist primarily of the Aerospace Aftermarket Programs, asdiscussed above, customer relationships, tradenames, patents and proprietary technology. These intangible assets, with theexception of tradenames, have finite lives and are amortized over the periods in which they provide benefit. The Companyassesses the impairment of long-lived assets, including identifiable intangible assets subject to amortization, wheneversignificant events or significant changes in circumstances indicate the carrying value may not be recoverable. Tradenames,intangible assets with indefinite lives, are subject to impairment testing in accordance with accounting standards governingsuch on an annual basis, in the third quarter, or more frequently if an event or change in circumstances indicates that the fairvalue of a reporting unit has been reduced below its carrying value. Based on the assessment performed during 2014, therewere no impairments of other intangible assets. See Note 6 of the Consolidated Financial Statements.
Derivatives: Accounting standards related to the accounting for derivative instruments and hedging activities requirethat all derivative instruments be recorded on the balance sheet at fair value. Foreign currency contracts may qualify as fairvalue hedges of unrecognized firm commitments, cash flow hedges of recognized assets and liabilities or anticipatedtransactions, or a hedge of a net investment. Changes in the fair market value of derivatives that qualify as fair value hedges
42

BARNES GROUP INC.
NOTES TO CONSOLIDATED FINANCIAL STATEMENTS—(Continued)
or cash flow hedges are recorded directly to earnings or accumulated other non-owner changes to equity, depending on thedesignation. Amounts recorded to accumulated other non-owner changes to equity are reclassified to earnings in a mannerthat matches the earnings impact of the hedged transaction. Any ineffective portion, or amounts related to contracts that arenot designated as hedges, are recorded directly to earnings. The Company’s policy for classifying cash flows fromderivatives is to report the cash flows consistent with the underlying hedged item.
Foreign currency: Assets and liabilities of international operations are translated at year-end rates of exchange;revenues and expenses are translated at average rates of exchange. The resulting translation gains or losses are reflected inaccumulated other non-owner changes to equity within stockholders’ equity. A net foreign currency transaction loss of$1,466 in 2014, a gain of $945 in 2013 and a loss $2,144 in 2012 were included in other expense (income), net in theConsolidated Statements of Income.
Research and Development: Costs are incurred in connection with efforts aimed at discovering and implementing newknowledge that is critical to developing new products, processes or services, significantly improving existing products orservices, and developing new applications for existing products and services. Research and development expenses for thecreation of new and improved products and services were $15,782, $14,707 and $8,696, for the years 2014, 2013 and 2012,respectively, and are included in selling, general and administrative expense.
2. Discontinued Operations
Barnes Distribution North America
In April 2013, the Company completed the sale of BDNA to MSC pursuant to the terms of the Asset PurchaseAgreement between the Company and MSC. The total cash consideration received for BDNA was $537,761, net oftransaction costs and closing adjustments paid. The net after-tax proceeds were $419,136 after consideration of certain postclosing adjustments, transaction costs and income taxes. The Company made estimated income tax payments of $130,004related to the gain on sale during 2013 and recorded an income tax receivable of $12,608 in the Consolidated Balance Sheetas of December 31, 2013. The Company has since elected to apply the income tax receivable to future tax filings.
Barnes Distribution Europe
In December 2011, the Company sold substantially all of the assets of its BDE business to Berner SE (the “Purchaser”)in a cash transaction pursuant to the terms of a Share and Asset Purchase Agreement (“SPA”) among the Company, thePurchaser, and their respective relevant subsidiaries dated November 17, 2011. The Company received gross proceeds of$33,358, which represents the initial stated purchase price, and yielded net cash proceeds of $22,492 after consideration ofcash sold, transaction costs paid and closing adjustments. The final amount of proceeds from the sale of the BDE businesswas subject to post-closing adjustments that were reflected in discontinued operations in periods subsequent to thedisposition. The income from operations of discontinued businesses for 2013 includes a final settlement of a retained liabilityrelated to BDE.
As required by the terms of the SPA, the Company was required to place €9,000 of the proceeds in escrow to be used forany settlement of general representation and warranty claims. Absent a breach of warranty claim, the funds would be releasedfrom escrow on August 31, 2012 unless there were any then pending claims. Cash related to a pending claim would remain inescrow until a final determination of the claim had been made. On August 17, 2012, the Purchaser provided a notice of breach ofvarious warranties to the Company. The Company rejected the Purchaser’s notice and demanded release of the full escroweffective August 31, 2012. The Purchaser refused to release the full escrow, and only €3,900 plus interest was released whereas€5,100 plus interest remained in escrow. The cash was restricted and recorded in other assets at December 31, 2013. TheCompany settled the pending claim on September 24, 2014 and entered into an agreement to pay the Purchaser €1,250 of theproceeds that were held in escrow. The losses from discontinued operations for the year ended December 31, 2014 include this€1,250 ($1,586) reduction in proceeds from the sale of the business. The remaining funds of €3,850 were no longer restrictedwithin escrow effective September 24, 2014 and were subsequently released from escrow on October 6, 2014.
The below amounts related to BDNA and the BDE business were derived from historical financial information. Theamounts have been segregated from continuing operations and reported as discontinued operations within the consolidatedfinancial statements. In 2014, the Company recorded a net after-tax loss on the sale of businesses of $1,987 resultingprimarily from the reduction to the BDE escrow proceeds of €1,250, as discussed above. In 2013, the Company recorded a
43
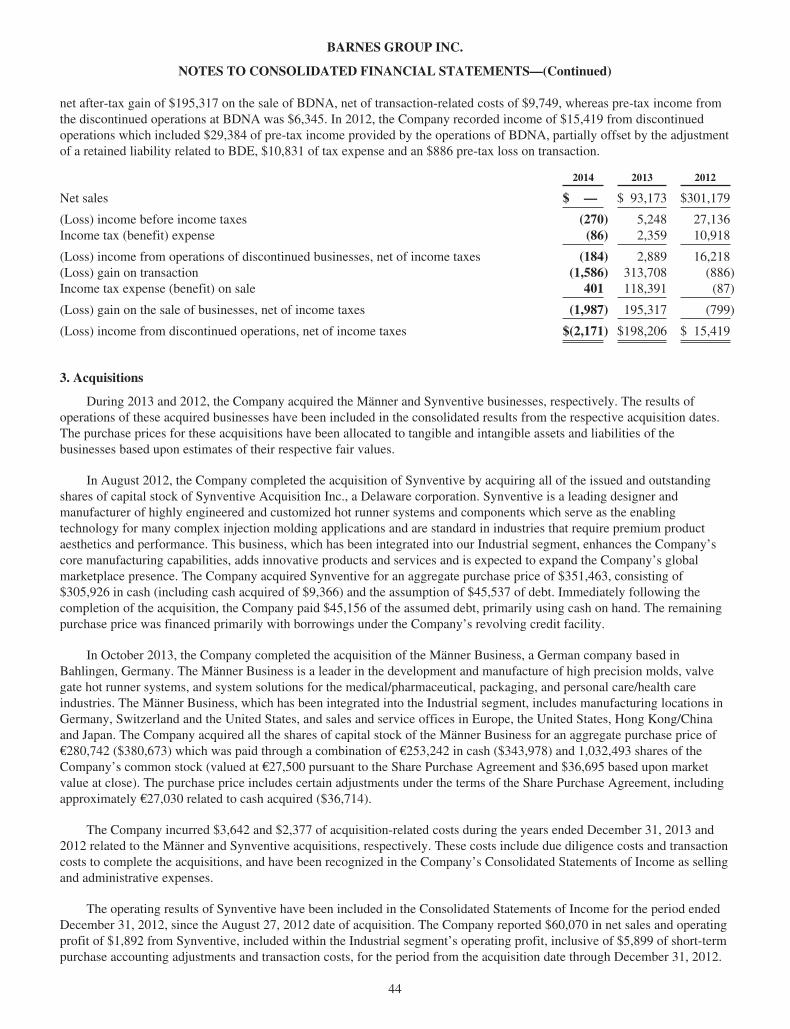
BARNES GROUP INC.
NOTES TO CONSOLIDATED FINANCIAL STATEMENTS—(Continued)
net after-tax gain of $195,317 on the sale of BDNA, net of transaction-related costs of $9,749, whereas pre-tax income fromthe discontinued operations at BDNA was $6,345. In 2012, the Company recorded income of $15,419 from discontinuedoperations which included $29,384 of pre-tax income provided by the operations of BDNA, partially offset by the adjustmentof a retained liability related to BDE, $10,831 of tax expense and an $886 pre-tax loss on transaction.
2014 2013 2012
Net sales $ — $ 93,173 $301,179
(Loss) income before income taxes (270) 5,248 27,136Income tax (benefit) expense (86) 2,359 10,918
(Loss) income from operations of discontinued businesses, net of income taxes (184) 2,889 16,218(Loss) gain on transaction (1,586) 313,708 (886)Income tax expense (benefit) on sale 401 118,391 (87)
(Loss) gain on the sale of businesses, net of income taxes (1,987) 195,317 (799)
(Loss) income from discontinued operations, net of income taxes $(2,171) $198,206 $ 15,419
3. Acquisitions
During 2013 and 2012, the Company acquired the Männer and Synventive businesses, respectively. The results ofoperations of these acquired businesses have been included in the consolidated results from the respective acquisition dates.The purchase prices for these acquisitions have been allocated to tangible and intangible assets and liabilities of thebusinesses based upon estimates of their respective fair values.
In August 2012, the Company completed the acquisition of Synventive by acquiring all of the issued and outstandingshares of capital stock of Synventive Acquisition Inc., a Delaware corporation. Synventive is a leading designer andmanufacturer of highly engineered and customized hot runner systems and components which serve as the enablingtechnology for many complex injection molding applications and are standard in industries that require premium productaesthetics and performance. This business, which has been integrated into our Industrial segment, enhances the Company’score manufacturing capabilities, adds innovative products and services and is expected to expand the Company’s globalmarketplace presence. The Company acquired Synventive for an aggregate purchase price of $351,463, consisting of$305,926 in cash (including cash acquired of $9,366) and the assumption of $45,537 of debt. Immediately following thecompletion of the acquisition, the Company paid $45,156 of the assumed debt, primarily using cash on hand. The remainingpurchase price was financed primarily with borrowings under the Company’s revolving credit facility.
In October 2013, the Company completed the acquisition of the Männer Business, a German company based inBahlingen, Germany. The Männer Business is a leader in the development and manufacture of high precision molds, valvegate hot runner systems, and system solutions for the medical/pharmaceutical, packaging, and personal care/health careindustries. The Männer Business, which has been integrated into the Industrial segment, includes manufacturing locations inGermany, Switzerland and the United States, and sales and service offices in Europe, the United States, Hong Kong/Chinaand Japan. The Company acquired all the shares of capital stock of the Männer Business for an aggregate purchase price of€280,742 ($380,673) which was paid through a combination of €253,242 in cash ($343,978) and 1,032,493 shares of theCompany’s common stock (valued at €27,500 pursuant to the Share Purchase Agreement and $36,695 based upon marketvalue at close). The purchase price includes certain adjustments under the terms of the Share Purchase Agreement, includingapproximately €27,030 related to cash acquired ($36,714).
The Company incurred $3,642 and $2,377 of acquisition-related costs during the years ended December 31, 2013 and2012 related to the Männer and Synventive acquisitions, respectively. These costs include due diligence costs and transactioncosts to complete the acquisitions, and have been recognized in the Company’s Consolidated Statements of Income as sellingand administrative expenses.
The operating results of Synventive have been included in the Consolidated Statements of Income for the period endedDecember 31, 2012, since the August 27, 2012 date of acquisition. The Company reported $60,070 in net sales and operatingprofit of $1,892 from Synventive, included within the Industrial segment’s operating profit, inclusive of $5,899 of short-termpurchase accounting adjustments and transaction costs, for the period from the acquisition date through December 31, 2012.
44

BARNES GROUP INC.
NOTES TO CONSOLIDATED FINANCIAL STATEMENTS—(Continued)
The operating results of Synventive during 2013 and 2014 have been included in the Consolidated Statements of Income forthe years ended December 31, 2013 and 2014.
The operating results of the Männer Business have been included in the Consolidated Statements of Income for theperiod ended December 31, 2013, since the October 31, 2013 date of acquisition. The Company reported $18,894 in net salesand an operating loss of $2,817 from the Männer Business, included within the Industrial segment’s operating profit,inclusive of $7,279 of short-term purchase accounting adjustments and transaction costs, for the year ended December 31,2013. The operating results of the Männer Business during 2014 have been included in the Consolidated Statements ofIncome for the years ended December 31, 2014.
The following table summarizes the fair values of the assets acquired, net of cash acquired, and liabilities assumed at theOctober 31, 2013 date of acquisition for the Männer Business and the August 27, 2012 acquisition date for Synventive. Fairvalues are inclusive of purchase price adjustments that were made subsequent to the respective acquisition dates:
Synventive Männer Business
Accounts Receivable $ 43,270 $ 15,329Inventories 13,392 32,908Other current assets 3,988 423Property, plant and equipment 16,000 63,411Other noncurrent assets 2,841 —Other intangible assets (Note 6) 126,600 146,600Goodwill (Note 6) 203,656 189,486
Total assets acquired 409,747 448,157
Current liabilities (25,230) (57,943)Other liabilities (4,130) (566)Deferred income taxes (38,290) (42,495)Debt assumed (45,537) (3,194)
Total liabilities assumed (113,187) (104,198)
Net assets acquired $ 296,560 $ 343,959
The final purchase price allocations related to the Männer Business and Synventive reflect post-closing adjustmentspursuant to the terms of the respective Stock Purchase Agreements.
The following table reflects the unaudited pro forma operating results of the Company for the years ended December 31,2013 and 2012, which give effect to the acquisition of the Männer Business as if it had occurred on January 1, 2012 and theacquisition of Synventive as if it had occurred on January 1, 2011. The pro forma results are based on assumptions that theCompany believes are reasonable under the circumstances. The pro forma results are not necessarily indicative of the operatingresults that would have occurred had the acquisitions been effective on January 1, 2012 and 2011, nor are they intended to beindicative of results that may occur in the future. The underlying pro forma information includes the historical financial resultsof the Company and the two acquired businesses adjusted for certain items including depreciation and amortization expenseassociated with the assets acquired and the Company’s expense related to financing arrangements, with the related tax effects.The pro forma information does not include the effects of any synergies or cost reduction initiatives related to the acquisitions.
(Unaudited Pro Forma)
2013 2012
Net sales $1,191,109 $1,137,437Income from continuing operations 92,343 88,023Net income $ 290,549 $ 103,442Per common share:Basic:
Income from continuing operations $ 1.69 $ 1.58Net income $ 5.31 $ 1.86
Diluted:Income from continuing operations $ 1.65 $ 1.56Net income $ 5.20 $ 1.84
45
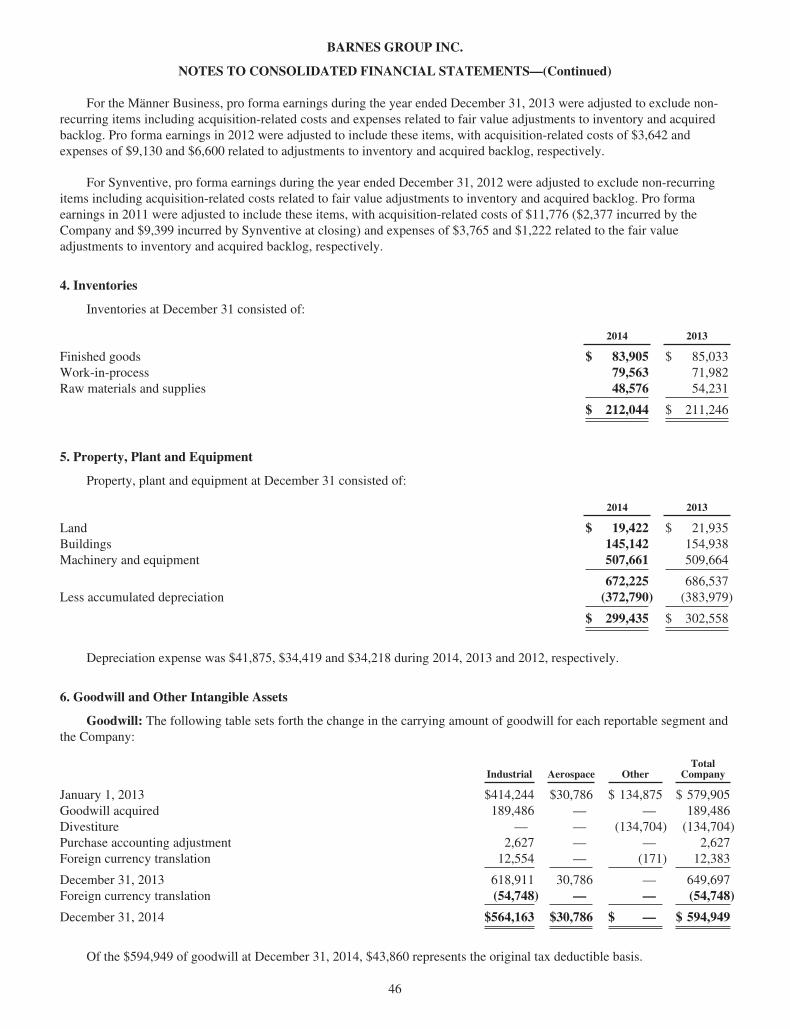
BARNES GROUP INC.
NOTES TO CONSOLIDATED FINANCIAL STATEMENTS—(Continued)
For the Männer Business, pro forma earnings during the year ended December 31, 2013 were adjusted to exclude non-recurring items including acquisition-related costs and expenses related to fair value adjustments to inventory and acquiredbacklog. Pro forma earnings in 2012 were adjusted to include these items, with acquisition-related costs of $3,642 andexpenses of $9,130 and $6,600 related to adjustments to inventory and acquired backlog, respectively.
For Synventive, pro forma earnings during the year ended December 31, 2012 were adjusted to exclude non-recurringitems including acquisition-related costs related to fair value adjustments to inventory and acquired backlog. Pro formaearnings in 2011 were adjusted to include these items, with acquisition-related costs of $11,776 ($2,377 incurred by theCompany and $9,399 incurred by Synventive at closing) and expenses of $3,765 and $1,222 related to the fair valueadjustments to inventory and acquired backlog, respectively.
4. Inventories
Inventories at December 31 consisted of:
2014 2013
Finished goods $ 83,905 $ 85,033Work-in-process 79,563 71,982Raw materials and supplies 48,576 54,231
$ 212,044 $ 211,246
5. Property, Plant and Equipment
Property, plant and equipment at December 31 consisted of:
2014 2013
Land $ 19,422 $ 21,935Buildings 145,142 154,938Machinery and equipment 507,661 509,664
672,225 686,537Less accumulated depreciation (372,790) (383,979)
$ 299,435 $ 302,558
Depreciation expense was $41,875, $34,419 and $34,218 during 2014, 2013 and 2012, respectively.
6. Goodwill and Other Intangible Assets
Goodwill: The following table sets forth the change in the carrying amount of goodwill for each reportable segment andthe Company:
Industrial Aerospace OtherTotal
Company
January 1, 2013 $414,244 $30,786 $ 134,875 $ 579,905Goodwill acquired 189,486 — — 189,486Divestiture — — (134,704) (134,704)Purchase accounting adjustment 2,627 — — 2,627Foreign currency translation 12,554 — (171) 12,383
December 31, 2013 618,911 30,786 — 649,697Foreign currency translation (54,748) — — (54,748)
December 31, 2014 $564,163 $30,786 $ — $ 594,949
Of the $594,949 of goodwill at December 31, 2014, $43,860 represents the original tax deductible basis.
46

BARNES GROUP INC.
NOTES TO CONSOLIDATED FINANCIAL STATEMENTS—(Continued)
In 2013, the changes recorded at Industrial include $2,627 of final purchase accounting adjustments from the acquisitionof Synventive and $189,486 of goodwill resulting from the acquisition of the Männer Business. The amount allocated togoodwill reflects the benefits that the Company expects to realize from increased global market access and the assembledworkforce of the Männer Business. None of the recognized goodwill from the Männer Business is expected to be deductiblefor income tax purposes.
In the first quarter of 2013, the Company realigned its reportable business segments by transferring the AssociatedSpring Raymond business (“Raymond”), its remaining business within the former Distribution segment, to the Industrialsegment. The goodwill related to BDNA (“BDNA goodwill”), also a business within the former Distribution segment, was$134,875 at December 31, 2012. BDNA was sold on April 22, 2013. See Note 2.
Other Intangible Assets: Other intangible assets at December 31 consisted of:
2014 2013
Range ofLife-Years
GrossAmount
AccumulatedAmortization
GrossAmount
AccumulatedAmortization
Amortized intangible assets:Revenue Sharing Programs Up to 30 $293,700 $ (72,958) $293,700 $ (64,220)Component Repair Program Up to 15 106,639 (1,941) 26,639 —Customer lists/relationships 10-16 183,406 (30,731) 183,406 (18,293)Patents and technology 7-14 62,972 (22,356) 62,972 (14,210)Trademarks/trade names 5-30 11,950 (8,552) 11,950 (7,628)Other Up to 15 19,292 (14,806) 19,292 (9,868)
677,959 (151,344) 597,959 (114,219)Unamortized intangible assetTrade names 36,900 — 36,900 —Foreign currency translation (8,821) — 13,653 —
Other intangible assets $706,038 $(151,344) $648,512 $(114,219)
The Company entered into Component Repair Programs (“CRPs”) with General Electric during the fourth quarter of2013 (“CRP 1”) and the second quarter of 2014 (“CRP 2”). The CRPs provide for, among other items, the right to sell certainaftermarket component repair services for CFM56, CF6 and LM engines directly to other customers as one of a few GElicensed suppliers. In addition, the CRPs extend certain existing contracts under which the Company currently provides theseservices directly to GE.
The Company agreed to pay $26,639 as consideration for the rights related to CRP 1. Of this balance, the Company paid$16,639 in the fourth quarter of 2013 and $9,100 in the fourth quarter of 2014. The remaining payment of $900 has beenincluded within accrued liabilities in the Consolidated Financial Statements. The Company agreed to pay $80,000 asconsideration for the rights related to CRP 2. The Company paid $41,000 in the second quarter of 2014, $20,000 in the fourthquarter of 2014 and the remaining payment of $19,000, also included within accrued liabilities, will be paid in the secondquarter of 2015. The Company recorded the CRP payments as an intangible asset which is recognized as a reduction of salesover the remaining useful life of these engine programs.
In connection with the acquisition of the Männer Business in October 2013, the Company recorded intangible assets of$146,600, which includes $92,100 of customer relationships, $21,000 of patents and technology, $6,600 of customer backlogand $26,900 of an indefinite life Männer Business trade name. The weighted-average useful lives of the acquired assets were16 years, 10 years, and less than one year, respectively.
Amortization of intangible assets for the years ended December 31, 2014, 2013 and 2012 was $37,125, $27,973 and$18,605, respectively. Estimated amortization of intangible assets for future periods is as follows: 2015 – $38,000;2016 – $35,000; 2017 – $35,000; 2018 – $36,000 and 2019 – $34,000.
47
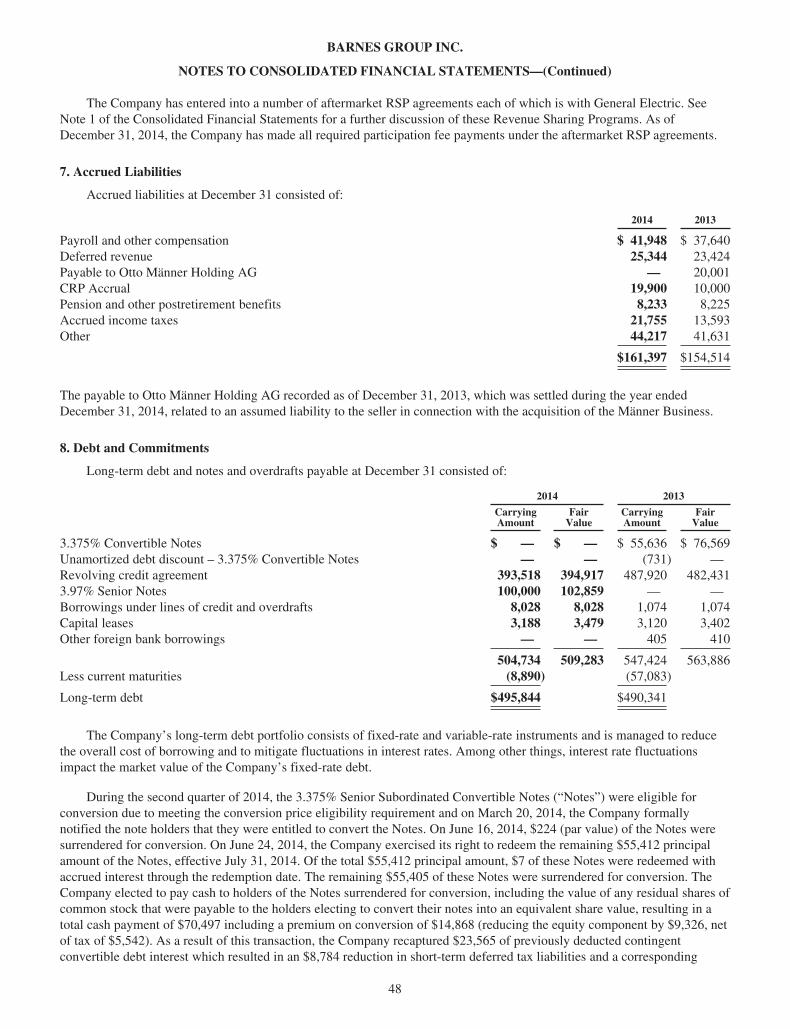
BARNES GROUP INC.
NOTES TO CONSOLIDATED FINANCIAL STATEMENTS—(Continued)
The Company has entered into a number of aftermarket RSP agreements each of which is with General Electric. SeeNote 1 of the Consolidated Financial Statements for a further discussion of these Revenue Sharing Programs. As ofDecember 31, 2014, the Company has made all required participation fee payments under the aftermarket RSP agreements.
7. Accrued Liabilities
Accrued liabilities at December 31 consisted of:
2014 2013
Payroll and other compensation $ 41,948 $ 37,640Deferred revenue 25,344 23,424Payable to Otto Männer Holding AG — 20,001CRP Accrual 19,900 10,000Pension and other postretirement benefits 8,233 8,225Accrued income taxes 21,755 13,593Other 44,217 41,631
$161,397 $154,514
The payable to Otto Männer Holding AG recorded as of December 31, 2013, which was settled during the year endedDecember 31, 2014, related to an assumed liability to the seller in connection with the acquisition of the Männer Business.
8. Debt and Commitments
Long-term debt and notes and overdrafts payable at December 31 consisted of:
2014 2013
CarryingAmount
FairValue
CarryingAmount
FairValue
3.375% Convertible Notes $ — $ — $ 55,636 $ 76,569Unamortized debt discount – 3.375% Convertible Notes — — (731) —Revolving credit agreement 393,518 394,917 487,920 482,4313.97% Senior Notes 100,000 102,859 — —Borrowings under lines of credit and overdrafts 8,028 8,028 1,074 1,074Capital leases 3,188 3,479 3,120 3,402Other foreign bank borrowings — — 405 410
504,734 509,283 547,424 563,886Less current maturities (8,890) (57,083)
Long-term debt $495,844 $490,341
The Company’s long-term debt portfolio consists of fixed-rate and variable-rate instruments and is managed to reducethe overall cost of borrowing and to mitigate fluctuations in interest rates. Among other things, interest rate fluctuationsimpact the market value of the Company’s fixed-rate debt.
During the second quarter of 2014, the 3.375% Senior Subordinated Convertible Notes (“Notes”) were eligible forconversion due to meeting the conversion price eligibility requirement and on March 20, 2014, the Company formallynotified the note holders that they were entitled to convert the Notes. On June 16, 2014, $224 (par value) of the Notes weresurrendered for conversion. On June 24, 2014, the Company exercised its right to redeem the remaining $55,412 principalamount of the Notes, effective July 31, 2014. Of the total $55,412 principal amount, $7 of these Notes were redeemed withaccrued interest through the redemption date. The remaining $55,405 of these Notes were surrendered for conversion. TheCompany elected to pay cash to holders of the Notes surrendered for conversion, including the value of any residual shares ofcommon stock that were payable to the holders electing to convert their notes into an equivalent share value, resulting in atotal cash payment of $70,497 including a premium on conversion of $14,868 (reducing the equity component by $9,326, netof tax of $5,542). As a result of this transaction, the Company recaptured $23,565 of previously deducted contingentconvertible debt interest which resulted in an $8,784 reduction in short-term deferred tax liabilities and a corresponding
48

BARNES GROUP INC.
NOTES TO CONSOLIDATED FINANCIAL STATEMENTS—(Continued)
increase in current taxes payable included within accrued liabilities. The Company used borrowings under its AmendedCredit Facility to finance the conversion of the Notes. The fair value of the Notes was previously determined using quotedmarket prices that represent Level 2 observable inputs.
The following table sets forth balance sheet information regarding the Company’s convertible notes at December 31:
2014 2013
3.375% Convertible Notes:Carrying value of equity component, net of tax $ — $10,772
Principal value of liability component $ — $55,636Unamortized debt discount — (731)
Net carrying value of liability component $ — $54,905
The following table sets forth the components of interest expense for the Notes for the years ended December 31, 2014,2013 and 2012. The effective interest rate on the liability component of the Notes was 8.00% (life of the Notes).
2014 2013 2012
Interest expense – 3.375% coupon $1,046 $1,878 $1,878Interest expense – 3.375% debt discount amortization 731 2,391 2,211
$1,777 $4,269 $4,089
In September 2011, the Company entered into an amended and restated revolving credit agreement (the “AmendedCredit Agreement” or “Amended Credit Facility”) with Bank of America, N.A. as the administrative agent. The AmendedCredit Agreement increased the borrowing availability of the Amended Credit Facility from $400,000 to $500,000 andextended the expiration date of the Amended Credit Facility by four years from September 2012 to September 2016. In July2012, the Company executed a $250,000 accordion feature that was available under the Amended Credit Agreementincreasing the available amount under the Amended Credit Facility to $750,000. In September 2013, the Company enteredinto a Second Amendment to its revolving credit agreement (“Second Amendment”) and retained Bank of America, N.A. asAdministrative Agent for the lenders. The Second Amendment extended the maturity date of the debt facility by two yearsfrom September 2016 to September 2018 and includes an option to extend the maturity date for an additional year, subject tocertain conditions. The Second Amendment also added a new foreign subsidiary borrower in Germany, Barnes GroupAcquisition GmbH, maintained the borrowing availability of the Company at $750,000 and added an accordion feature toincrease this amount to $1,000,000. The Company may exercise the accordion feature upon request to the AdministrativeAgent as long as an event of default has not occurred or is continuing. The borrowing availability of $750,000, pursuant tothe terms of the Second Amendment, allows for Euro-denominated borrowings equivalent to $500,000. Borrowings under theAmended Credit Agreement continue to bear interest at LIBOR plus a spread ranging from 1.10% to 1.70% depending on theCompany’s leverage ratio at the time of the borrowing. The Company paid fees and expenses of $1,261 and $1,030 inconjunction with executing the Second Amendment in 2013 and the execution of the accordion feature in 2012, respectively.Such fees were deferred and amortized into interest expense on the accompanying Consolidated Statements of Incomethrough its maturity.
Borrowings and availability under the Amended Credit Agreement were $393,518 and $356,482, respectively, atDecember 31, 2014 and $487,920 and $262,080, respectively, at December 31, 2013. Borrowings included Euro-denominated borrowings of €30,945 ($37,618) at December 31, 2014 and €114,000 ($157,320) at December 31, 2013. Theinterest rate on these borrowings was 1.33% and 1.36% on December 31, 2014 and 2013, respectively. The fair value of theborrowings is based on observable Level 2 inputs. The borrowings are valued using discounted cash flows based upon theCompany’s estimated interest costs for similar types of borrowings.
The Company’s borrowing capacity remains limited by various debt covenants in the Amended Credit Agreement,certain of which were amended in September 2013. The Amended Credit Agreement requires the Company to maintain aratio of Consolidated Senior Debt, as defined in the Second Amendment, to Consolidated EBITDA, as defined, of not morethan 3.25 times at the end of each fiscal quarter, a ratio of Consolidated Total Debt, as defined, to Consolidated EBITDA ofnot more than 4.00 times at the end of each fiscal quarter, and a ratio of Consolidated EBITDA to Consolidated Cash Interest
49
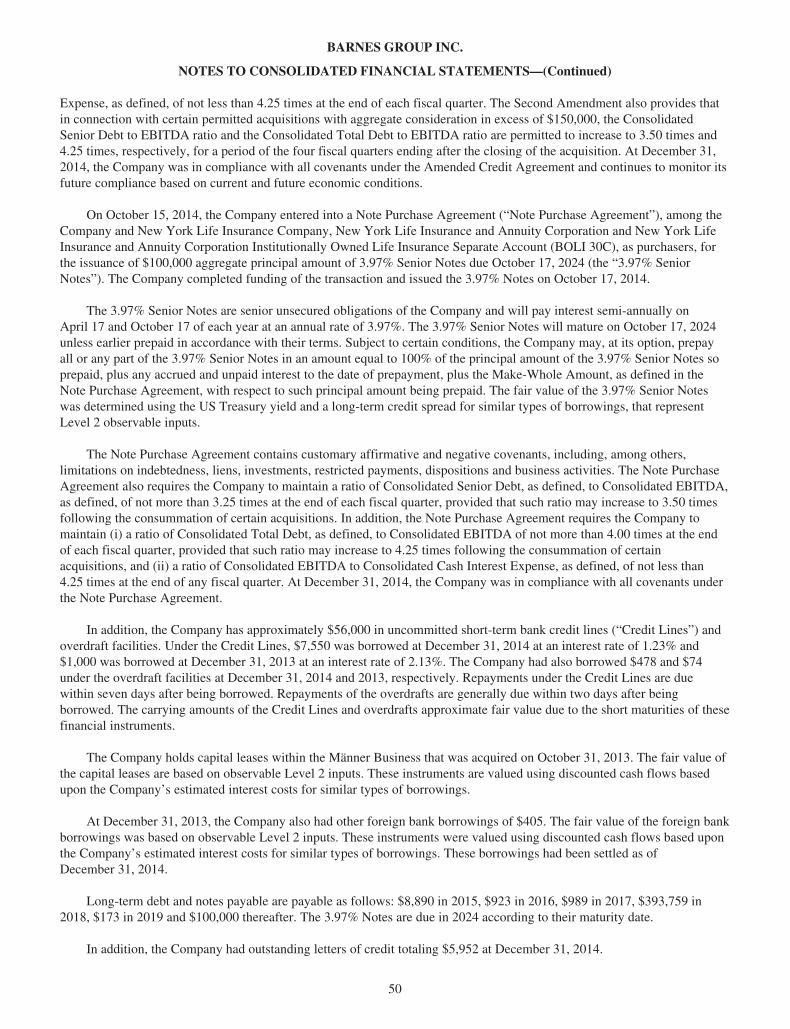
BARNES GROUP INC.
NOTES TO CONSOLIDATED FINANCIAL STATEMENTS—(Continued)
Expense, as defined, of not less than 4.25 times at the end of each fiscal quarter. The Second Amendment also provides thatin connection with certain permitted acquisitions with aggregate consideration in excess of $150,000, the ConsolidatedSenior Debt to EBITDA ratio and the Consolidated Total Debt to EBITDA ratio are permitted to increase to 3.50 times and4.25 times, respectively, for a period of the four fiscal quarters ending after the closing of the acquisition. At December 31,2014, the Company was in compliance with all covenants under the Amended Credit Agreement and continues to monitor itsfuture compliance based on current and future economic conditions.
On October 15, 2014, the Company entered into a Note Purchase Agreement (“Note Purchase Agreement”), among theCompany and New York Life Insurance Company, New York Life Insurance and Annuity Corporation and New York LifeInsurance and Annuity Corporation Institutionally Owned Life Insurance Separate Account (BOLI 30C), as purchasers, forthe issuance of $100,000 aggregate principal amount of 3.97% Senior Notes due October 17, 2024 (the “3.97% SeniorNotes”). The Company completed funding of the transaction and issued the 3.97% Notes on October 17, 2014.
The 3.97% Senior Notes are senior unsecured obligations of the Company and will pay interest semi-annually onApril 17 and October 17 of each year at an annual rate of 3.97%. The 3.97% Senior Notes will mature on October 17, 2024unless earlier prepaid in accordance with their terms. Subject to certain conditions, the Company may, at its option, prepayall or any part of the 3.97% Senior Notes in an amount equal to 100% of the principal amount of the 3.97% Senior Notes soprepaid, plus any accrued and unpaid interest to the date of prepayment, plus the Make-Whole Amount, as defined in theNote Purchase Agreement, with respect to such principal amount being prepaid. The fair value of the 3.97% Senior Noteswas determined using the US Treasury yield and a long-term credit spread for similar types of borrowings, that representLevel 2 observable inputs.
The Note Purchase Agreement contains customary affirmative and negative covenants, including, among others,limitations on indebtedness, liens, investments, restricted payments, dispositions and business activities. The Note PurchaseAgreement also requires the Company to maintain a ratio of Consolidated Senior Debt, as defined, to Consolidated EBITDA,as defined, of not more than 3.25 times at the end of each fiscal quarter, provided that such ratio may increase to 3.50 timesfollowing the consummation of certain acquisitions. In addition, the Note Purchase Agreement requires the Company tomaintain (i) a ratio of Consolidated Total Debt, as defined, to Consolidated EBITDA of not more than 4.00 times at the endof each fiscal quarter, provided that such ratio may increase to 4.25 times following the consummation of certainacquisitions, and (ii) a ratio of Consolidated EBITDA to Consolidated Cash Interest Expense, as defined, of not less than4.25 times at the end of any fiscal quarter. At December 31, 2014, the Company was in compliance with all covenants underthe Note Purchase Agreement.
In addition, the Company has approximately $56,000 in uncommitted short-term bank credit lines (“Credit Lines”) andoverdraft facilities. Under the Credit Lines, $7,550 was borrowed at December 31, 2014 at an interest rate of 1.23% and$1,000 was borrowed at December 31, 2013 at an interest rate of 2.13%. The Company had also borrowed $478 and $74under the overdraft facilities at December 31, 2014 and 2013, respectively. Repayments under the Credit Lines are duewithin seven days after being borrowed. Repayments of the overdrafts are generally due within two days after beingborrowed. The carrying amounts of the Credit Lines and overdrafts approximate fair value due to the short maturities of thesefinancial instruments.
The Company holds capital leases within the Männer Business that was acquired on October 31, 2013. The fair value ofthe capital leases are based on observable Level 2 inputs. These instruments are valued using discounted cash flows basedupon the Company’s estimated interest costs for similar types of borrowings.
At December 31, 2013, the Company also had other foreign bank borrowings of $405. The fair value of the foreign bankborrowings was based on observable Level 2 inputs. These instruments were valued using discounted cash flows based uponthe Company’s estimated interest costs for similar types of borrowings. These borrowings had been settled as ofDecember 31, 2014.
Long-term debt and notes payable are payable as follows: $8,890 in 2015, $923 in 2016, $989 in 2017, $393,759 in2018, $173 in 2019 and $100,000 thereafter. The 3.97% Notes are due in 2024 according to their maturity date.
In addition, the Company had outstanding letters of credit totaling $5,952 at December 31, 2014.
50
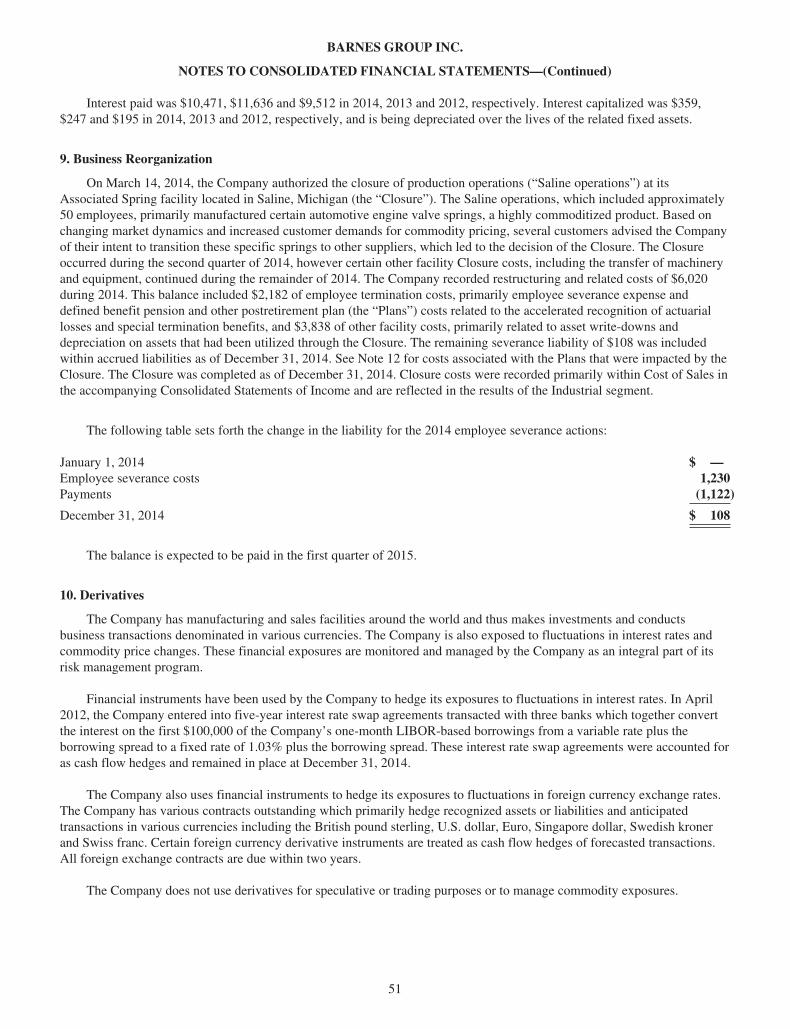
BARNES GROUP INC.
NOTES TO CONSOLIDATED FINANCIAL STATEMENTS—(Continued)
Interest paid was $10,471, $11,636 and $9,512 in 2014, 2013 and 2012, respectively. Interest capitalized was $359,$247 and $195 in 2014, 2013 and 2012, respectively, and is being depreciated over the lives of the related fixed assets.
9. Business Reorganization
On March 14, 2014, the Company authorized the closure of production operations (“Saline operations”) at itsAssociated Spring facility located in Saline, Michigan (the “Closure”). The Saline operations, which included approximately50 employees, primarily manufactured certain automotive engine valve springs, a highly commoditized product. Based onchanging market dynamics and increased customer demands for commodity pricing, several customers advised the Companyof their intent to transition these specific springs to other suppliers, which led to the decision of the Closure. The Closureoccurred during the second quarter of 2014, however certain other facility Closure costs, including the transfer of machineryand equipment, continued during the remainder of 2014. The Company recorded restructuring and related costs of $6,020during 2014. This balance included $2,182 of employee termination costs, primarily employee severance expense anddefined benefit pension and other postretirement plan (the “Plans”) costs related to the accelerated recognition of actuariallosses and special termination benefits, and $3,838 of other facility costs, primarily related to asset write-downs anddepreciation on assets that had been utilized through the Closure. The remaining severance liability of $108 was includedwithin accrued liabilities as of December 31, 2014. See Note 12 for costs associated with the Plans that were impacted by theClosure. The Closure was completed as of December 31, 2014. Closure costs were recorded primarily within Cost of Sales inthe accompanying Consolidated Statements of Income and are reflected in the results of the Industrial segment.
The following table sets forth the change in the liability for the 2014 employee severance actions:
January 1, 2014 $ —Employee severance costs 1,230Payments (1,122)
December 31, 2014 $ 108
The balance is expected to be paid in the first quarter of 2015.
10. Derivatives
The Company has manufacturing and sales facilities around the world and thus makes investments and conductsbusiness transactions denominated in various currencies. The Company is also exposed to fluctuations in interest rates andcommodity price changes. These financial exposures are monitored and managed by the Company as an integral part of itsrisk management program.
Financial instruments have been used by the Company to hedge its exposures to fluctuations in interest rates. In April2012, the Company entered into five-year interest rate swap agreements transacted with three banks which together convertthe interest on the first $100,000 of the Company’s one-month LIBOR-based borrowings from a variable rate plus theborrowing spread to a fixed rate of 1.03% plus the borrowing spread. These interest rate swap agreements were accounted foras cash flow hedges and remained in place at December 31, 2014.
The Company also uses financial instruments to hedge its exposures to fluctuations in foreign currency exchange rates.The Company has various contracts outstanding which primarily hedge recognized assets or liabilities and anticipatedtransactions in various currencies including the British pound sterling, U.S. dollar, Euro, Singapore dollar, Swedish kronerand Swiss franc. Certain foreign currency derivative instruments are treated as cash flow hedges of forecasted transactions.All foreign exchange contracts are due within two years.
The Company does not use derivatives for speculative or trading purposes or to manage commodity exposures.
51

BARNES GROUP INC.
NOTES TO CONSOLIDATED FINANCIAL STATEMENTS—(Continued)
The following table sets forth the fair value amounts of derivative instruments held by the Company as of December 31.
2014 2013
AssetDerivatives
LiabilityDerivatives
AssetDerivatives
LiabilityDerivatives
Derivatives designated as hedginginstruments:Interest rate contracts $ — $ (295) $ — $ (370)Foreign exchange contracts — (652) — (318)
— (947) — (688)
Derivatives not designated ashedging instruments:Foreign exchange contracts 460 (699) 543 (67)
Total derivatives $ 460 $ (1,646) $ 543 $ (755)
Asset derivatives are recorded in prepaid expenses and other current assets in the accompanying consolidated balancesheets. Liability derivatives related to interest rate contracts and foreign exchange contracts are recorded in other liabilitiesand accrued liabilities, respectively, in the accompanying consolidated balance sheets.
The following table sets forth the gain (loss) recorded in accumulated other comprehensive income (loss), net of tax, forthe years ended December 31, 2014 and 2013 for derivatives held by the Company and designated as hedging instruments.
2014 2013
Cash flow hedges:Interest rate contracts $ 48 $ 898Foreign exchange contracts (261) (985)
$ (213) $ (87)
Amounts included within accumulated other comprehensive income (loss) that were reclassified to expense during theyear ended December 31, 2014 and 2013 related to the interest rate swaps resulted in a fixed rate of interest of 1.03% plus theborrowing spread for the first $100,000 of one-month LIBOR borrowings. The amounts reclassified for the foreign exchangecontracts were not material. Additionally, there were no amounts recognized in income for hedge ineffectiveness during theyears ended December 31, 2014 and 2013.
The following table sets forth the losses recorded in other expense (income), net in the consolidated statements ofincome for the years ended December 31, 2014 and 2013 for non-designated derivatives held by the Company. Such losseswere substantially offset by gains recorded on the underlying hedged asset or liability.
2014 2013
Foreign exchange contracts $ (810) $ (739)
11. Fair Value Measurements
The provisions of the accounting standard for fair value define fair value as the price that would be received to sell anasset or paid to transfer a liability in an orderly transaction between market participants at the measurement date. Thisstandard classifies the inputs used to measure fair value into the following hierarchy:
Level 1 Unadjusted quoted prices in active markets for identical assets or liabilities.
Level 2 Unadjusted quoted prices in active markets for similar assets or liabilities, or unadjusted quoted prices foridentical or similar assets or liabilities in markets that are not active, or inputs other than quoted prices that areobservable for the asset or liability.
Level 3 Unobservable inputs for the asset or liability.
52
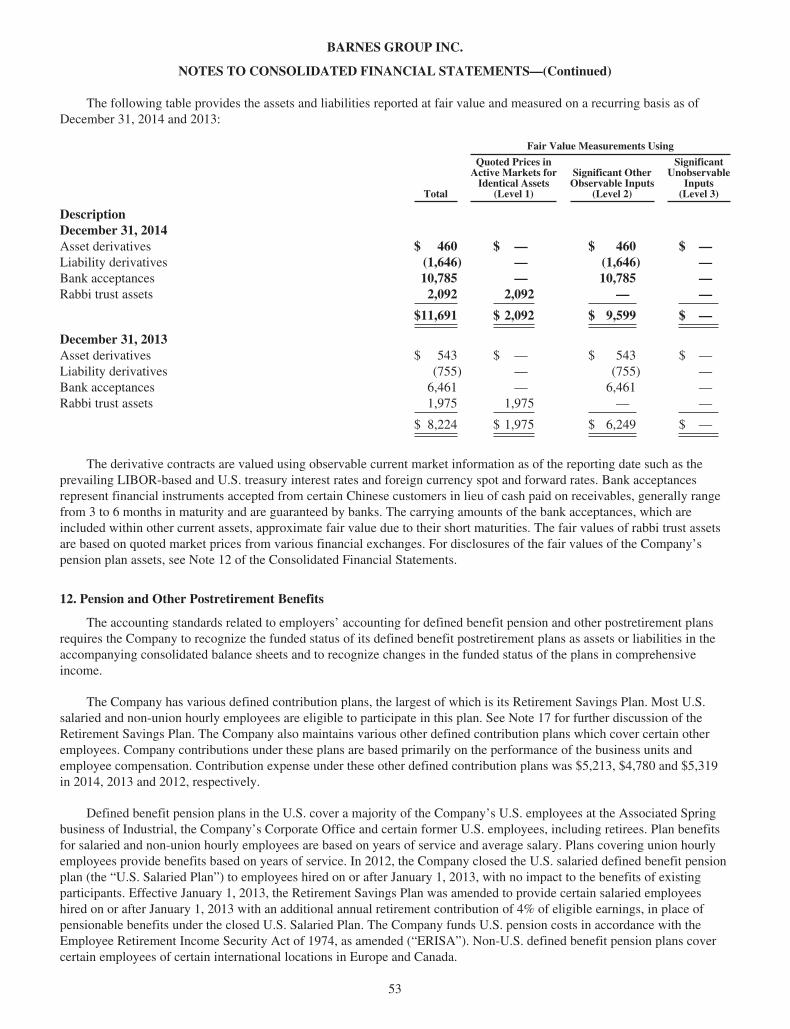
BARNES GROUP INC.
NOTES TO CONSOLIDATED FINANCIAL STATEMENTS—(Continued)
The following table provides the assets and liabilities reported at fair value and measured on a recurring basis as ofDecember 31, 2014 and 2013:
Fair Value Measurements Using
Total
Quoted Prices inActive Markets for
Identical Assets(Level 1)
Significant OtherObservable Inputs
(Level 2)
SignificantUnobservable
Inputs(Level 3)
DescriptionDecember 31, 2014Asset derivatives $ 460 $ — $ 460 $ —Liability derivatives (1,646) — (1,646) —Bank acceptances 10,785 — 10,785 —Rabbi trust assets 2,092 2,092 — —
$11,691 $ 2,092 $ 9,599 $ —
December 31, 2013Asset derivatives $ 543 $ — $ 543 $ —Liability derivatives (755) — (755) —Bank acceptances 6,461 — 6,461 —Rabbi trust assets 1,975 1,975 — —
$ 8,224 $ 1,975 $ 6,249 $ —
The derivative contracts are valued using observable current market information as of the reporting date such as theprevailing LIBOR-based and U.S. treasury interest rates and foreign currency spot and forward rates. Bank acceptancesrepresent financial instruments accepted from certain Chinese customers in lieu of cash paid on receivables, generally rangefrom 3 to 6 months in maturity and are guaranteed by banks. The carrying amounts of the bank acceptances, which areincluded within other current assets, approximate fair value due to their short maturities. The fair values of rabbi trust assetsare based on quoted market prices from various financial exchanges. For disclosures of the fair values of the Company’spension plan assets, see Note 12 of the Consolidated Financial Statements.
12. Pension and Other Postretirement Benefits
The accounting standards related to employers’ accounting for defined benefit pension and other postretirement plansrequires the Company to recognize the funded status of its defined benefit postretirement plans as assets or liabilities in theaccompanying consolidated balance sheets and to recognize changes in the funded status of the plans in comprehensiveincome.
The Company has various defined contribution plans, the largest of which is its Retirement Savings Plan. Most U.S.salaried and non-union hourly employees are eligible to participate in this plan. See Note 17 for further discussion of theRetirement Savings Plan. The Company also maintains various other defined contribution plans which cover certain otheremployees. Company contributions under these plans are based primarily on the performance of the business units andemployee compensation. Contribution expense under these other defined contribution plans was $5,213, $4,780 and $5,319in 2014, 2013 and 2012, respectively.
Defined benefit pension plans in the U.S. cover a majority of the Company’s U.S. employees at the Associated Springbusiness of Industrial, the Company’s Corporate Office and certain former U.S. employees, including retirees. Plan benefitsfor salaried and non-union hourly employees are based on years of service and average salary. Plans covering union hourlyemployees provide benefits based on years of service. In 2012, the Company closed the U.S. salaried defined benefit pensionplan (the “U.S. Salaried Plan”) to employees hired on or after January 1, 2013, with no impact to the benefits of existingparticipants. Effective January 1, 2013, the Retirement Savings Plan was amended to provide certain salaried employeeshired on or after January 1, 2013 with an additional annual retirement contribution of 4% of eligible earnings, in place ofpensionable benefits under the closed U.S. Salaried Plan. The Company funds U.S. pension costs in accordance with theEmployee Retirement Income Security Act of 1974, as amended (“ERISA”). Non-U.S. defined benefit pension plans covercertain employees of certain international locations in Europe and Canada.
53

BARNES GROUP INC.
NOTES TO CONSOLIDATED FINANCIAL STATEMENTS—(Continued)
The Company provides other medical, dental and life insurance postretirement benefits for certain of its retiredemployees in the U.S. and Canada. It is the Company’s practice to fund these benefits as incurred.
The accompanying balance sheets reflect the funded status of the Company’s defined benefit pension plans atDecember 31, 2014 and 2013, respectively. Reconciliations of the obligations and funded status of the plans follow:
2014 2013
U.S. Non-U.S. Total U.S. Non-U.S. Total
Benefit obligation, January 1 $374,740 $78,982 $453,722 $423,547 $72,769 $496,316Service cost 3,549 997 4,546 5,403 778 6,181Interest cost 19,129 2,897 22,026 17,571 2,541 20,112Actuarial (gain) loss 58,906 9,728 68,634 (40,734) 31 (40,703)Benefits paid (23,960) (3,405) (27,365) (23,348) (4,712) (28,060)Transfers in — 1,929 1,929 — 6,786 6,786Plan curtailments — — — (8,715) — (8,715)Plan settlements — (4,949) (4,949) — — —Special termination benefit 715 — 715 1,016 — 1,016Participant contributions — 906 906 — 545 545Foreign exchange rate changes — (6,780) (6,780) — 244 244
Benefit obligation, December 31 433,079 80,305 513,384 374,740 78,982 453,722
Fair value of plan assets, January 1 379,059 74,519 453,578 323,711 63,842 387,553Actual return on plan assets 20,436 6,349 26,785 74,622 6,357 80,979Company contributions 5,402 2,219 7,621 4,074 1,910 5,984Participant contributions — 906 906 — 545 545Benefits paid (23,960) (3,405) (27,365) (23,348) (4,712) (28,060)Plan settlements — (4,949) (4,949) — — —Transfers in — 1,929 1,929 — 6,627 6,627Foreign exchange rate changes — (5,818) (5,818) — (50) (50)
Fair value of plan assets, December 31 380,937 71,750 452,687 379,059 74,519 453,578
Funded/(underfunded) status, December 31 $ (52,142) $ (8,555) $ (60,697) $ 4,319 $ (4,463) $ (144)
In 2013, “transfers in” relate primarily to the defined benefit pension plans associated with the acquisition of the MännerBusiness. See Note 3 of the Consolidated Financial Statements. In 2013, plan curtailments and special termination benefitsrelate to the sale of BDNA. See Note 2 of the Consolidated Financial Statements.
Projected benefit obligations related to pension plans with benefit obligations in excess of plan assets follow:
2014 2013
U.S. Non-U.S. Total U.S. Non-U.S. Total
Projected benefit obligation $297,067 $29,971 $327,038 $31,231 $27,415 $58,646Fair value of plan assets 234,305 17,660 251,965 — 19,353 19,353
Information related to pension plans with accumulated benefit obligations in excess of plan assets follows:
2014 2013
U.S. Non-U.S. Total U.S. Non-U.S. Total
Projected benefit obligation $297,067 $23,496 $320,563 $31,231 $9,421 $40,652Accumulated benefit obligation 286,217 20,446 306,663 30,913 8,994 39,907Fair value of plan assets 234,305 12,552 246,857 — 1,779 1,779
The accumulated benefit obligation for all defined benefit pension plans was $497,453 and $444,096 at December 31,2014 and 2013, respectively.
54

BARNES GROUP INC.
NOTES TO CONSOLIDATED FINANCIAL STATEMENTS—(Continued)
Amounts related to pensions recognized in the accompanying balance sheets consist of:
2014 2013
U.S. Non-U.S. Total U.S. Non-U.S. Total
Other assets $ 10,620 $ 3,882 $ 14,502 $ 35,550 $ 3,599 $ 39,149Accrued liabilities 2,810 376 3,186 2,707 627 3,334Accrued retirement benefits 59,952 12,061 72,013 28,524 7,435 35,959Accumulated other non-owner changes to equity, net (86,925) (20,689) (107,614) (48,564) (18,858) (67,422)
Amounts related to pensions recognized in accumulated other non-owner changes to equity, net of tax, at December 31,2014 and 2013, respectively, consist of:
2014 2013
U.S. Non-U.S. Total U.S. Non-U.S. Total
Net actuarial loss $(86,399) $(20,406) $(106,805) $(47,538) $(18,477) $(66,015)Prior service costs (526) (283) (809) (1,026) (381) (1,407)
$(86,925) $(20,689) $(107,614) $(48,564) $(18,858) $(67,422)
The accompanying balance sheets reflect the underfunded status of the Company’s other postretirement benefit plans atDecember 31, 2014 and 2013. Reconciliations of the obligations and underfunded status of the plans follow:
2014 2013
Benefit obligation, January 1 $ 46,243 $ 53,988Service cost 139 233Interest cost 2,179 2,061Actuarial (gain) loss 3,049 (2,328)Benefits paid (7,568) (9,133)Curtailment gain — (1,675)Participant contributions 2,833 3,039Foreign exchange rate changes (61) 58
Benefit obligation, December 31 46,814 46,243
Fair value of plan assets, January 1 — —Company contributions 4,735 6,094Participant contributions 2,833 3,039Benefits paid (7,568) (9,133)
Fair value of plan assets, December 31 — —
Underfunded status, December 31 $ 46,814 $ 46,243
Amounts related to other postretirement benefits recognized in the accompanying balance sheets consist of:
2014 2013
Accrued liabilities $ 5,047 $ 4,891Accrued retirement benefits 41,767 41,352Accumulated other non-owner changes to equity, net (7,675) (5,804)
Amounts related to other postretirement benefits recognized in accumulated other non-owner changes to equity, net oftax, at December 31, 2014 and 2013 consist of:
2014 2013
Net actuarial loss $ (8,212) $ (6,885)Prior service credits 537 1,081
$ (7,675) $ (5,804)
55
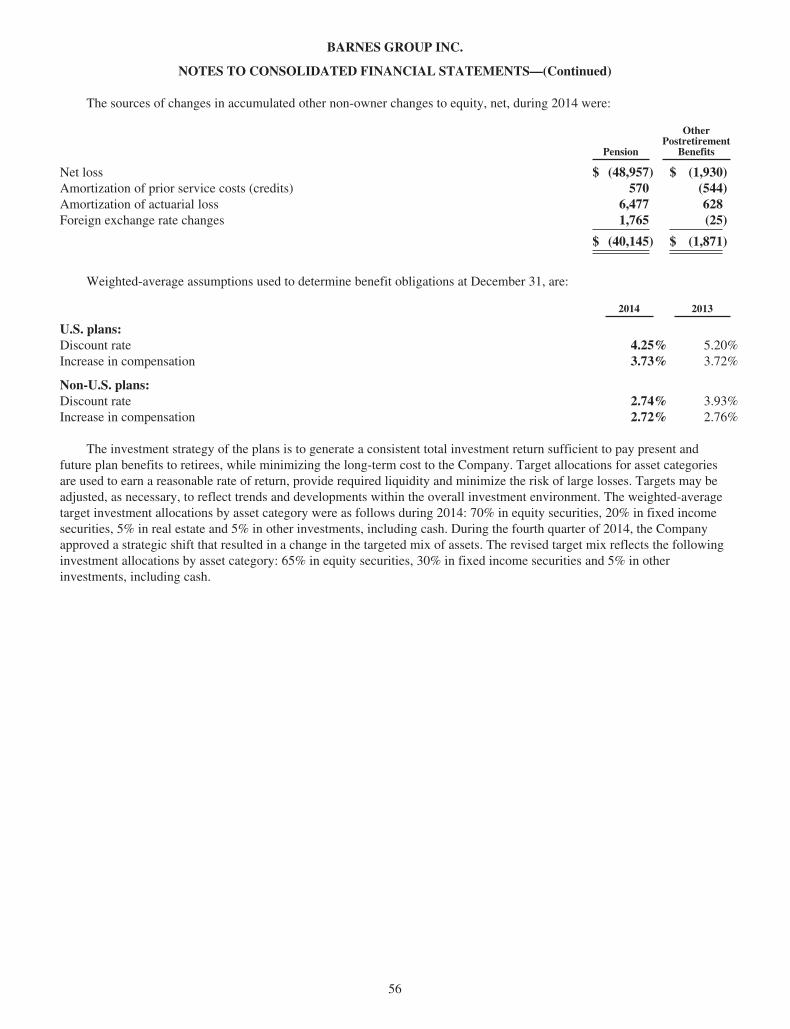
BARNES GROUP INC.
NOTES TO CONSOLIDATED FINANCIAL STATEMENTS—(Continued)
The sources of changes in accumulated other non-owner changes to equity, net, during 2014 were:
Pension
OtherPostretirement
Benefits
Net loss $ (48,957) $ (1,930)Amortization of prior service costs (credits) 570 (544)Amortization of actuarial loss 6,477 628Foreign exchange rate changes 1,765 (25)
$ (40,145) $ (1,871)
Weighted-average assumptions used to determine benefit obligations at December 31, are:
2014 2013
U.S. plans:Discount rate 4.25% 5.20%Increase in compensation 3.73% 3.72%
Non-U.S. plans:Discount rate 2.74% 3.93%Increase in compensation 2.72% 2.76%
The investment strategy of the plans is to generate a consistent total investment return sufficient to pay present andfuture plan benefits to retirees, while minimizing the long-term cost to the Company. Target allocations for asset categoriesare used to earn a reasonable rate of return, provide required liquidity and minimize the risk of large losses. Targets may beadjusted, as necessary, to reflect trends and developments within the overall investment environment. The weighted-averagetarget investment allocations by asset category were as follows during 2014: 70% in equity securities, 20% in fixed incomesecurities, 5% in real estate and 5% in other investments, including cash. During the fourth quarter of 2014, the Companyapproved a strategic shift that resulted in a change in the targeted mix of assets. The revised target mix reflects the followinginvestment allocations by asset category: 65% in equity securities, 30% in fixed income securities and 5% in otherinvestments, including cash.
56

BARNES GROUP INC.
NOTES TO CONSOLIDATED FINANCIAL STATEMENTS—(Continued)
The fair values of the Company’s pension plan assets at December 31, 2014 and 2013, by asset category are as follows:
Fair Value Measurements Using
Asset Category Total
Quoted Prices inActive Markets for
Identical Assets(Level 1)
Significant OtherObservable Inputs
(Level 2)
SignificantUnobservable
Inputs(Level 3)
December 31, 2014Cash and short-term investments $ 10,805 $ 10,805 $ — $ —
Equity securities:U.S. large-cap 137,051 65,484 71,567 —U.S. mid-cap 48,614 48,614 — —U.S. small-cap 47,972 47,972 — —International equities 71,451 — 71,451 —
Fixed income securities:U.S. bond funds 79,810 — 79,810 —International bonds 35,949 — 35,949 —
Real estate securities 18,915 — 18,915 —Other 2,120 — — 2,120
$452,687 $172,875 $277,692 $2,120
December 31, 2013Cash and short-term investments $ 18,885 $ 18,885 $ — $ —
Equity securities:U.S. large-cap 131,749 61,257 70,492 —U.S. mid-cap 47,276 47,276 — —U.S. small-cap 53,627 53,627 — —International equities 80,479 — 80,479 —
Fixed income securities:U.S. bond funds 65,740 — 65,740 —International bonds 37,357 — 37,357 —
Real estate securities 16,686 — 16,686 —Other 1,779 — — 1,779
$453,578 $181,045 $270,754 $1,779
The fair values of the Level 1 assets are based on quoted market prices from various financial exchanges. The fairvalues of the Level 2 assets are based primarily on quoted prices in active markets for similar assets or liabilities. TheLevel 2 assets are comprised primarily of commingled funds and fixed income securities. Commingled equity funds arevalued at their net asset values based on quoted market prices of the underlying assets. Fixed income securities are valuedusing a market approach which considers observable market data for the underlying asset or securities. The Level 3 assetsrelate to the defined benefit pension plan of the Synventive business and were transferred to the Company in the August 2012acquisition. These pension assets are fully insured and have been estimated based on accrued pension rights and actuarialrates. These pension assets are limited to fulfilling the Company’s pension obligations.
The Company expects to contribute approximately $5,169 to the pension plans in 2015.
57

BARNES GROUP INC.
NOTES TO CONSOLIDATED FINANCIAL STATEMENTS—(Continued)
The following are the estimated future net benefit payments, which include future service, over the next 10 years:
Pensions
OtherPostretirement
Benefits
2015 $ 29,161 $ 4,5472016 29,319 4,1772017 29,471 3,9712018 29,745 4,1082019 30,570 3,846Years 2020-2024 151,904 16,112
Total $ 300,170 $ 36,761
Pension and other postretirement benefit expenses consist of the following:
PensionsOther
Postretirement Benefits
2014 2013 2012 2014 2013 2012
Service cost $ 4,546 $ 6,181 $ 6,530 $ 139 $ 233 $ 273Interest cost 22,026 20,112 21,624 2,179 2,061 2,532Expected return on plan assets (34,232) (33,144) (32,827) — — —Amortization of prior service cost (credit) 648 752 845 (871) (1,006) (1,585)Recognized losses 8,617 16,365 12,048 1,017 1,004 1,082Curtailment loss (gain) 219 199 — 4 (3,081) —Settlement loss 871 637 92 — — —Special termination benefits 715 1,016 — — — —
Net periodic benefit cost $ 3,410 $ 12,118 $ 8,312 $2,468 $ (789) $ 2,302
The estimated net actuarial loss and prior service cost for the defined benefit pension plans that will be amortized fromaccumulated other non-owner changes to equity into net periodic benefit cost in 2015 are $14,640 and $313, respectively.The estimated net actuarial loss and prior service credit for other defined benefit postretirement plans that will be amortizedfrom accumulated other non-owner changes to equity into net periodic benefit cost in 2015 are $1,043 and $(564),respectively.
Weighted-average assumptions used to determine net benefit expense for years ended December 31, are:
2014 2013 2012
U.S. plans:Discount rate 5.20% 4.25% 5.05%Long-term rate of return 9.00% 9.00% 9.00%Increase in compensation 3.72% 3.71% 3.71%
Non-U.S. plans:Discount rate 3.93% 3.73% 4.46%Long-term rate of return 5.07% 5.33% 5.79%Increase in compensation 2.76% 2.69% 2.76%
The expected long-term rate of return is based on projected rates of return and the historical rates of return of publishedindices that are used to measure the plans’ target asset allocation. The historical rates are then discounted to considerfluctuations in the historical rates as well as potential changes in the investment environment.
The Company’s accumulated postretirement benefit obligations, exclusive of pensions, take into account certain cost-sharing provisions. The annual rate of increase in the cost of covered benefits (i.e., health care cost trend rate) is assumed to
58
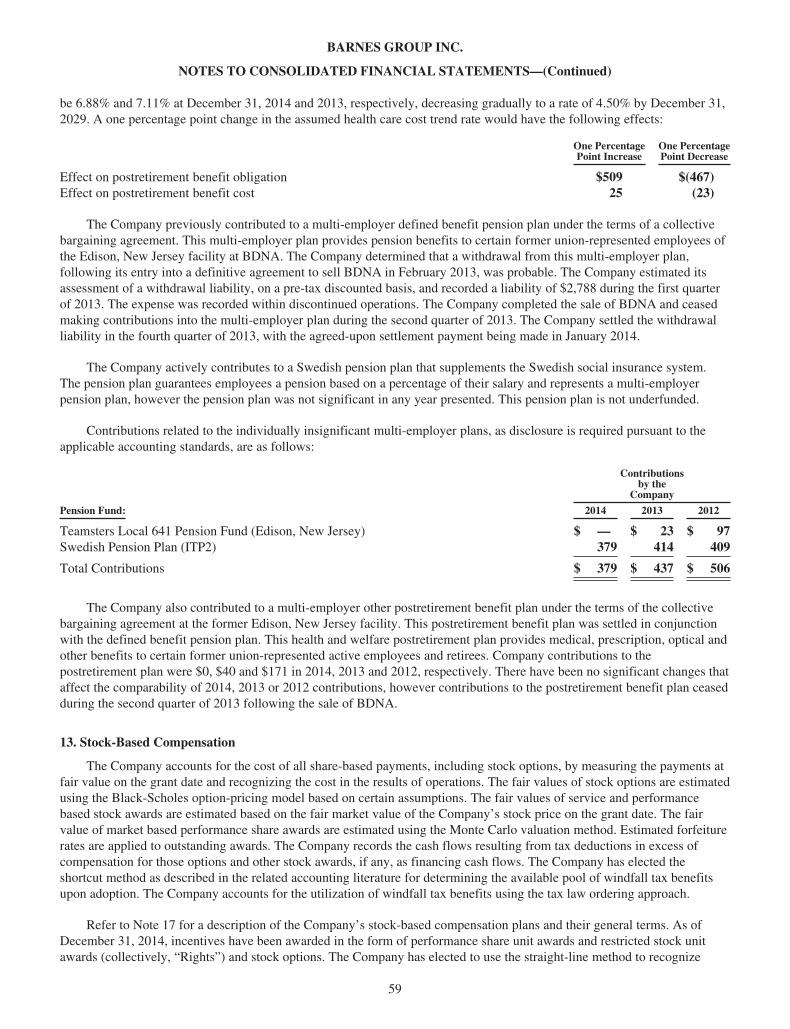
BARNES GROUP INC.
NOTES TO CONSOLIDATED FINANCIAL STATEMENTS—(Continued)
be 6.88% and 7.11% at December 31, 2014 and 2013, respectively, decreasing gradually to a rate of 4.50% by December 31,2029. A one percentage point change in the assumed health care cost trend rate would have the following effects:
One PercentagePoint Increase
One PercentagePoint Decrease
Effect on postretirement benefit obligation $509 $(467)Effect on postretirement benefit cost 25 (23)
The Company previously contributed to a multi-employer defined benefit pension plan under the terms of a collectivebargaining agreement. This multi-employer plan provides pension benefits to certain former union-represented employees ofthe Edison, New Jersey facility at BDNA. The Company determined that a withdrawal from this multi-employer plan,following its entry into a definitive agreement to sell BDNA in February 2013, was probable. The Company estimated itsassessment of a withdrawal liability, on a pre-tax discounted basis, and recorded a liability of $2,788 during the first quarterof 2013. The expense was recorded within discontinued operations. The Company completed the sale of BDNA and ceasedmaking contributions into the multi-employer plan during the second quarter of 2013. The Company settled the withdrawalliability in the fourth quarter of 2013, with the agreed-upon settlement payment being made in January 2014.
The Company actively contributes to a Swedish pension plan that supplements the Swedish social insurance system.The pension plan guarantees employees a pension based on a percentage of their salary and represents a multi-employerpension plan, however the pension plan was not significant in any year presented. This pension plan is not underfunded.
Contributions related to the individually insignificant multi-employer plans, as disclosure is required pursuant to theapplicable accounting standards, are as follows:
Contributionsby the
Company
Pension Fund: 2014 2013 2012
Teamsters Local 641 Pension Fund (Edison, New Jersey) $ — $ 23 $ 97Swedish Pension Plan (ITP2) 379 414 409
Total Contributions $ 379 $ 437 $ 506
The Company also contributed to a multi-employer other postretirement benefit plan under the terms of the collectivebargaining agreement at the former Edison, New Jersey facility. This postretirement benefit plan was settled in conjunctionwith the defined benefit pension plan. This health and welfare postretirement plan provides medical, prescription, optical andother benefits to certain former union-represented active employees and retirees. Company contributions to thepostretirement plan were $0, $40 and $171 in 2014, 2013 and 2012, respectively. There have been no significant changes thataffect the comparability of 2014, 2013 or 2012 contributions, however contributions to the postretirement benefit plan ceasedduring the second quarter of 2013 following the sale of BDNA.
13. Stock-Based Compensation
The Company accounts for the cost of all share-based payments, including stock options, by measuring the payments atfair value on the grant date and recognizing the cost in the results of operations. The fair values of stock options are estimatedusing the Black-Scholes option-pricing model based on certain assumptions. The fair values of service and performancebased stock awards are estimated based on the fair market value of the Company’s stock price on the grant date. The fairvalue of market based performance share awards are estimated using the Monte Carlo valuation method. Estimated forfeiturerates are applied to outstanding awards. The Company records the cash flows resulting from tax deductions in excess ofcompensation for those options and other stock awards, if any, as financing cash flows. The Company has elected theshortcut method as described in the related accounting literature for determining the available pool of windfall tax benefitsupon adoption. The Company accounts for the utilization of windfall tax benefits using the tax law ordering approach.
Refer to Note 17 for a description of the Company’s stock-based compensation plans and their general terms. As ofDecember 31, 2014, incentives have been awarded in the form of performance share unit awards and restricted stock unitawards (collectively, “Rights”) and stock options. The Company has elected to use the straight-line method to recognize
59
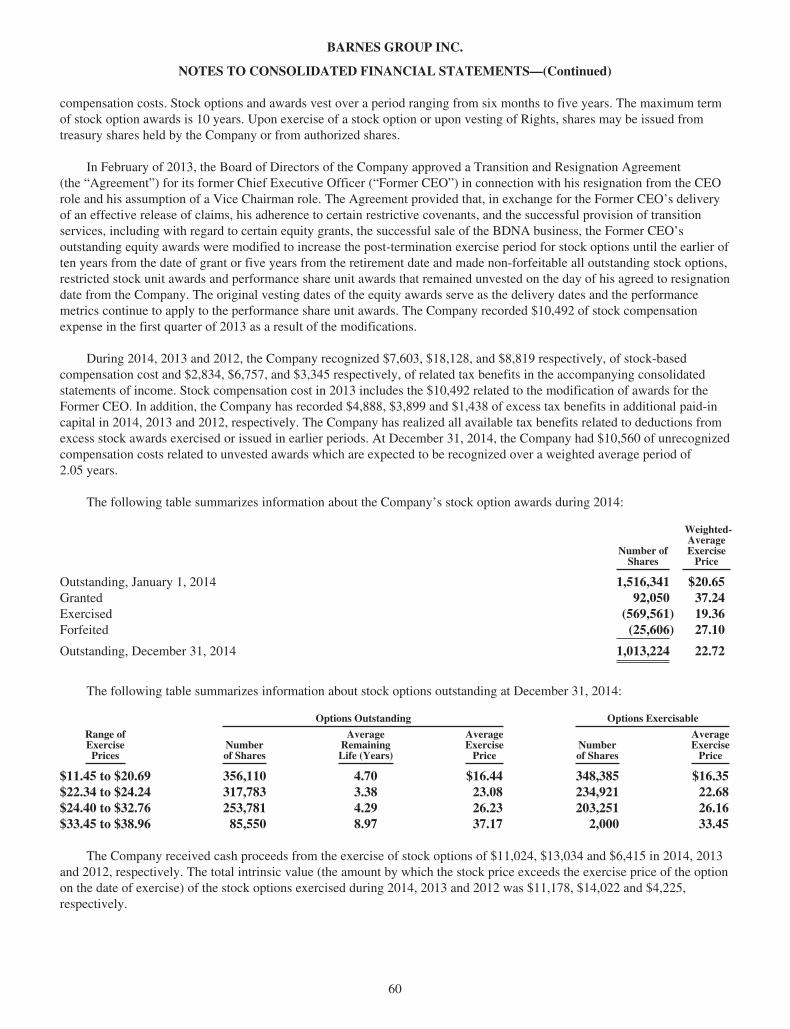
BARNES GROUP INC.
NOTES TO CONSOLIDATED FINANCIAL STATEMENTS—(Continued)
compensation costs. Stock options and awards vest over a period ranging from six months to five years. The maximum termof stock option awards is 10 years. Upon exercise of a stock option or upon vesting of Rights, shares may be issued fromtreasury shares held by the Company or from authorized shares.
In February of 2013, the Board of Directors of the Company approved a Transition and Resignation Agreement(the “Agreement”) for its former Chief Executive Officer (“Former CEO”) in connection with his resignation from the CEOrole and his assumption of a Vice Chairman role. The Agreement provided that, in exchange for the Former CEO’s deliveryof an effective release of claims, his adherence to certain restrictive covenants, and the successful provision of transitionservices, including with regard to certain equity grants, the successful sale of the BDNA business, the Former CEO’soutstanding equity awards were modified to increase the post-termination exercise period for stock options until the earlier often years from the date of grant or five years from the retirement date and made non-forfeitable all outstanding stock options,restricted stock unit awards and performance share unit awards that remained unvested on the day of his agreed to resignationdate from the Company. The original vesting dates of the equity awards serve as the delivery dates and the performancemetrics continue to apply to the performance share unit awards. The Company recorded $10,492 of stock compensationexpense in the first quarter of 2013 as a result of the modifications.
During 2014, 2013 and 2012, the Company recognized $7,603, $18,128, and $8,819 respectively, of stock-basedcompensation cost and $2,834, $6,757, and $3,345 respectively, of related tax benefits in the accompanying consolidatedstatements of income. Stock compensation cost in 2013 includes the $10,492 related to the modification of awards for theFormer CEO. In addition, the Company has recorded $4,888, $3,899 and $1,438 of excess tax benefits in additional paid-incapital in 2014, 2013 and 2012, respectively. The Company has realized all available tax benefits related to deductions fromexcess stock awards exercised or issued in earlier periods. At December 31, 2014, the Company had $10,560 of unrecognizedcompensation costs related to unvested awards which are expected to be recognized over a weighted average period of2.05 years.
The following table summarizes information about the Company’s stock option awards during 2014:
Number ofShares
Weighted-AverageExercise
Price
Outstanding, January 1, 2014 1,516,341 $20.65Granted 92,050 37.24Exercised (569,561) 19.36Forfeited (25,606) 27.10
Outstanding, December 31, 2014 1,013,224 22.72
The following table summarizes information about stock options outstanding at December 31, 2014:
Options Outstanding Options Exercisable
Range ofExercisePrices
Numberof Shares
AverageRemainingLife (Years)
AverageExercise
PriceNumberof Shares
AverageExercise
Price
$11.45 to $20.69 356,110 4.70 $16.44 348,385 $16.35$22.34 to $24.24 317,783 3.38 23.08 234,921 22.68$24.40 to $32.76 253,781 4.29 26.23 203,251 26.16$33.45 to $38.96 85,550 8.97 37.17 2,000 33.45
The Company received cash proceeds from the exercise of stock options of $11,024, $13,034 and $6,415 in 2014, 2013and 2012, respectively. The total intrinsic value (the amount by which the stock price exceeds the exercise price of the optionon the date of exercise) of the stock options exercised during 2014, 2013 and 2012 was $11,178, $14,022 and $4,225,respectively.
60
BARNES GROUP INC.
NOTES TO CONSOLIDATED FINANCIAL STATEMENTS—(Continued)
The weighted-average grant date fair value of stock options granted in 2014, 2013 and 2012 was $12.14, $8.77 and$9.49, respectively. The fair value of each stock option grant on the date of grant was estimated using the Black-Scholesoption-pricing model based on the following weighted average assumptions:
2014 2013 2012
Risk-free interest rate 1.68% 0.96% 0.98%Expected life (years) 5.3 5.3 5.3Expected volatility 42.6% 48.9% 50.2%Expected dividend yield 2.24% 2.38% 2.56%
The risk-free interest rate is based on the term structure of interest rates at the time of the option grant. The expected liferepresents an estimate of the period of time that options are expected to remain outstanding. Assumptions of expectedvolatility of the Company’s common stock and expected dividend yield are estimates of future volatility and dividend yieldsbased on historical trends.
The following table summarizes information about stock options outstanding that are expected to vest and stock optionsoutstanding that are exercisable at December 31, 2014:
Options Outstanding, Expected to Vest Options Outstanding, Exercisable
Shares
Weighted-AverageExercise
Price
AggregateIntrinsic
Value
Weighted-Average
RemainingTerm (Years) Shares
Weighted-Average
Exercise PriceAggregate
Intrinsic Value
Weighted-Average
RemainingTerm (Years)
995,945 $22.72 $14,248 4.54 788,557 $20.81 $12,778 3.88
The following table summarizes information about the Company’s Rights during 2014:
Service Based RightsService and Performance
Based RightsService and Market Based
Rights
Numberof Units
Weighted-Average Grant
Date FairValue
Numberof Units
Weighted-Average Grant
Date FairValue
Numberof Units
Weighted-Average Grant
Date FairValue
Outstanding, January 1, 2014 558,576 $20.60 224,544 $24.42 112,272 $35.87Granted 132,794 36.93 65,437 37.34 32,718 58.16Forfeited (45,531) 28.82 (17,429) 35.13 (8,715) 44.70Additional Earned — — 37,173 23.13 19,483 34.87Issued (216,633) 34.09 (82,661) 23.13 (42,227) 34.87
Outstanding, December 31, 2014 429,206 26.76 227,064 28.11 113,531 41.82
The Company granted 132,794 restricted stock unit awards and 98,155 performance share unit awards in 2014. All of therestricted stock unit awards vest upon meeting certain service conditions. “Additional Earned” reflects performance share unitawards earned above target that have been issued. The performance share unit awards are part of the long-term RelativeMeasure Program, which is designed to assess the long-term Company performance relative to the performance of companiesincluded in the Russell 2000 Index. The performance goals are independent of each other and based on three metrics, theCompany’s total shareholder return (“TSR”), basic or diluted earnings per share growth and operating income beforedepreciation and amortization growth (weighted equally). The participants can earn from zero to 250% of the target award andthe award includes a forfeitable right to dividend equivalents, which are not included in the aggregate target award numbers.Compensation expense for the awards is recognized over the three year service period based upon the value determined underthe intrinsic value method for the basic or diluted earnings per share growth and operating income before depreciation andamortization growth portions of the award and the Monte Carlo simulation valuation model for the TSR portion of the awardsince it contains a market condition. The weighted-average assumptions used to determine the weighted-average fair values ofthe market based portion of the 2014 awards include a 0.69% risk-free interest rate and a 32.9% expected volatility rate.
Compensation expense for the TSR portion of the awards is fixed at the date of grant and will not be adjusted in futureperiods based upon the achievement of the TSR performance goal. Compensation expense for the basic earnings per sharegrowth and operating income before depreciation and amortization growth portions of the awards is recorded each period
61
BARNES GROUP INC.
NOTES TO CONSOLIDATED FINANCIAL STATEMENTS—(Continued)
based upon a probability assessment of achieving the goals with a final adjustment at the end of the service period basedupon the actual achievement of those performance goals.
14. Income Taxes
The components of Income from continuing operations before income taxes and Income taxes follow:
2014 2013 2012
Income from continuing operations before income taxes:U.S. $ 33,070 $ 10,343 $ 8,853International 133,430 97,231 83,409
Income from continuing operations before income taxes $166,500 $107,574 $92,262
Income tax provision:Current:U.S. – federal $ 22,673 $ 8,356 $ 579U.S. – state 1,236 539 24International 35,954 16,933 13,418
59,863 25,828 14,021
Deferred:U.S. – federal (6,737) 13,792 4,610U.S. – state 1,279 (110) 566International (8,446) (4,257) (6,765)
(13,904) 9,425 (1,589)
Income taxes $ 45,959 $ 35,253 $12,432
Deferred income tax assets and liabilities at December 31 consist of the tax effects of temporary differences related tothe following:
Assets Liabilities
2014 2013 2014 2013
Allowance for doubtful accounts $ 494 $ 520 $ 86 $ 88Depreciation and amortization (19,338) 1,886 59,271 96,305Inventory valuation 17,072 17,292 1,981 4,241Other postretirement/postemployment costs 17,549 3,065 (247) (14,536)Tax loss carryforwards 13,977 15,363 (56) (1,445)Pension 21,968 1,631 (1,005) (1,049)Accrued compensation 15,418 5,949 — (9,381)Goodwill (13,772) — 57 12,805Swedish tax incentive — — 4,255 4,590Contingent convertible debt interest — (12,848) — —Unrealized foreign currency gain — — 1,999 2,948Other 4,398 6,555 5,763 3,735
57,766 39,413 72,104 98,301Valuation allowance (15,856) (18,873) — —
$ 41,910 $ 20,540 $72,104 $ 98,301
Current deferred income taxes $ 31,849 $ 18,226 $ 1,957 $ 3,795Non-current deferred income taxes 10,061 2,314 70,147 94,506
$ 41,910 $ 20,540 $72,104 $ 98,301
The standards related to accounting for income taxes require that deferred tax assets be reduced by a valuationallowance if, based on all available evidence, it is more likely than not that the deferred tax asset will not be realized.
62

BARNES GROUP INC.
NOTES TO CONSOLIDATED FINANCIAL STATEMENTS—(Continued)
Available evidence includes the reversal of existing taxable temporary differences, future taxable income exclusive oftemporary differences, taxable income in carryback years and tax planning strategies.
Management believes that sufficient taxable income should be earned in the future to realize the net deferred tax assetsprincipally in the United States. The realization of these assets is dependent in part on the amount and timing of futuretaxable income in the jurisdictions where deferred tax assets reside. The Company has tax loss carryforwards of $51,416;$865 of which relates to state tax loss carryforwards; $46,690 of which relates to international tax loss carryforwards withcarryforward periods ranging from one to 15 years; and $3,861 of which relates to international tax loss carryforwards withunlimited carryforward periods. In addition, the Company has tax credit carryforwards of $216 with remaining carryforwardperiods ranging from one year to 5 years. As the ultimate realization of the remaining net deferred tax assets is dependentupon future taxable income, if such future taxable income is not earned and it becomes necessary to recognize a valuationallowance, it could result in a material increase in the Company’s tax expense which could have a material adverse effect onthe Company’s financial condition and results of operations.
The Company has not recognized deferred income taxes on $862,082 of undistributed earnings of its internationalsubsidiaries, since such earnings are considered to be reinvested indefinitely. If the earnings were distributed in the form ofdividends, the Company would be subject, in certain cases, to both U.S. income taxes and foreign income and withholdingtaxes. Determination of the amount of this unrecognized deferred income tax liability is not practicable. During 2014, theCompany repatriated a dividend from a portion of current year foreign earnings to the U.S. in the amount of $12,500. As aresult of the dividend, tax expense increased by $4,391 and the 2014 annual consolidated effective income tax rate increasedby 2.6 percentage points.
A reconciliation of the U.S. federal statutory income tax rate to the consolidated effective income tax rate fromcontinuing operations follows:
2014 2013 2012
U.S. federal statutory income tax rate 35.0% 35.0% 35.0%State taxes (net of federal benefit) 0.5 0.3 0.3Foreign losses without tax benefit 1.1 0.8 0.8U.S. Tax Court Decision — 15.3 —Foreign operations taxed at lower rates (12.6) (20.6) (23.7)Repatriation from current year foreign earnings 2.6 1.1 2.3Other 1.0 0.9 (1.2)
Consolidated effective income tax rate 27.6% 32.8% 13.5%
The Aerospace and Industrial Segments were previously awarded a number of multi-year tax holidays in both Singaporeand China. Tax benefits of $4,513 ($0.08 per diluted share), $6,746 ($0.12 per diluted share) and $6,026 ($0.11 per dilutedshare) were realized in 2014, 2013 and 2012, respectively. These holidays are subject to the Company meeting certaincommitments in the respective jurisdictions. The tax holidays are due to expire in 2015 and 2016.
Income taxes paid globally, net of refunds, were $33,146, $158,092 and $15,876 in 2014, 2013 and 2012, respectively.
As of December 31, 2014, 2013 and 2012, the total amount of unrecognized tax benefits recorded in the consolidatedbalance sheet was $8,560, $8,027 and $9,321, respectively, which, if recognized, would have reduced the effective tax rate inprior years, with the exception of amounts related to acquisitions. A reconciliation of the unrecognized tax benefits for 2014,2013 and 2012 follows:
2014 2013 2012
Balance at January 1 $8,027 $ 9,321 $6,965Increase (decrease) in unrecognized tax benefits due to:
Tax positions taken during prior periods 533 9,944 —Tax positions taken during the current period — 3,350 —Acquisition — 556 2,528Settlements — (15,144) (172)
Balance at December 31 $8,560 $ 8,027 $9,321
63
BARNES GROUP INC.
NOTES TO CONSOLIDATED FINANCIAL STATEMENTS—(Continued)
The Company recognizes interest and penalties, if any, related to unrecognized tax benefits in income tax expense. TheCompany recognized interest and penalties as a component of income taxes of $0, $9,614, and $0 in the years 2014, 2013,and 2012 respectively. The liability for unrecognized tax benefits include gross accrued interest and penalties of $1,031,$1,031 and $0 at December 31, 2014, 2013 and 2012, respectively.
The Company or its subsidiaries file income tax returns in the U.S. federal jurisdiction, and various state and foreignjurisdictions. In the normal course of business, the Company is subject to examination by various taxing authorities,including the IRS in the U.S. and the taxing authorities in other major jurisdictions such as Brazil, Canada, China, France,Germany, Mexico, Singapore, Sweden, Switzerland and the United Kingdom. With few exceptions, the Company is nolonger subject to U.S. federal, state and local, or non-U.S. income tax examinations by tax authorities for years before 2003.See Note 21 of the Consolidated Financial Statements for a discussion of current IRS matters.
15. Common Stock
In 2014 and 2012, no shares of common stock were issued from Treasury. In 2013, 1,032,493 shares of common stockwere issued from treasury and used to fund the acquisition of the Männer Business. In 2014, 2013 and 2012, the Companyacquired 220,794 shares, 2,350,697 shares and 700,000 shares, respectively, of the Company’s common stock at a cost of$8,389, $68,608 and $19,037, respectively. These amounts exclude shares reacquired to pay for the related income tax uponissuance of shares in accordance with the terms of the Company’s stockholder-approved equity compensation plans and theequity rights granted under those plans (“Reacquired Shares”). These Reacquired Shares were placed in treasury.
In 2014, 2013 and 2012, 923,852 shares, 1,104,099 shares and 608,227 shares of common stock, respectively, wereissued from authorized shares for the exercise of stock options, various other incentive awards and purchases by theCompany’s Employee Stock Purchase Plan.
16. Preferred Stock
At December 31, 2014 and 2013, the Company had 3,000,000 shares of preferred stock authorized, none of which wereoutstanding.
17. Stock Plans
Most U.S. salaried and non-union hourly employees are eligible to participate in the Company’s 401(k) plan (the“Retirement Savings Plan”). The Retirement Savings Plan provides for the investment of employer and employeecontributions in various investment alternatives including the Company’s common stock, at the employee’s direction. TheCompany contributes an amount equal to 50% of employee contributions up to 6% of eligible compensation. The Companyexpenses all contributions made to the Retirement Savings Plan. Effective January 1, 2013, the Retirement Savings Plan wasamended to provide certain salaried employees hired on or after January 1, 2013 with an additional annual retirementcontribution of 4% of eligible earnings. The Company recognized expense of $3,278, $2,815 and $3,504 in 2014, 2013 and2012, respectively. As of December 31, 2014, the Retirement Savings Plan held 1,807,534 shares of the Company’s commonstock.
The Company has an Employee Stock Purchase Plan (“ESPP”) under which eligible employees may elect to have up tothe lesser of $25 or 10% of base compensation deducted from their payroll checks for the purchase of the Company’scommon stock at 95% of the average market value on the date of purchase. The maximum number of shares which may bepurchased under the ESPP is 4,550,000. The number of shares purchased under the ESPP was 12,770, 14,979 and 27,949 in2014, 2013 and 2012, respectively. The Company received cash proceeds from the purchase of these shares of $436, $457and $646 in 2014, 2013 and 2012, respectively. As of December 31, 2014, 308,455 additional shares may be purchased.
The 1991 Barnes Group Stock Incentive Plan (the “1991 Plan”) authorized the granting of incentives to executiveofficers, directors and key employees in the form of stock options, stock appreciation rights, incentive stock rights andperformance unit awards. On May 9, 2014, the 1991 Plan was merged into the 2014 Plan.
The Barnes Group Inc. Employee Stock and Ownership Program (the “2000 Plan”) was approved on April 12, 2000,and subsequently amended on April 10, 2002 by the Company’s stockholders. The 2000 Plan permitted the granting of
64
BARNES GROUP INC.
NOTES TO CONSOLIDATED FINANCIAL STATEMENTS—(Continued)
incentive stock options, nonqualified stock options, restricted stock awards, performance share or cash unit awards and stockappreciation rights, or any combination of the foregoing, to eligible employees to purchase up to 6,900,000 shares of theCompany’s common stock. Such shares were authorized and reserved. On May 9, 2014, the 2000 Plan was merged into the2014 Plan.
The Barnes Group Stock and Incentive Award Plan (the “2004 Plan”) was approved on April 14, 2004, andsubsequently amended on April 20, 2006 and May 7, 2010 by the Company’s stockholders. The 2004 Plan permits theissuance of incentive awards, stock option grants and stock appreciation rights to eligible participants to purchase up to5,700,000 shares of common stock. Of this amount as of December 31, 2013 there were 1,541,914 shares available for futuregrants under the 2004 Plan. On May 9, 2014, the 2004 Plan was merged into the 2014 Plan.
The 2014 Barnes Group Stock and Incentive Award Plan (the “2014 Plan”) was approved on May 9, 2014 by theCompany’s stockholders. The 2014 Plan permits the issuance of incentive awards, stock option grants and stock appreciationrights to eligible participants to purchase up to 6,913,978 shares of common stock. The amount includes shares available forpurchase under the 1991, 2000, and 2004 Plans which were merged into the 2014 Plan. The 2014 Plan allows for stockoptions and stock appreciation rights to be issued at a ratio of 1:1 and other types of incentive awards at a ratio of 2.84:1 fromthe shares available for future grants. As of December 31, 2014, there were 7,371,279 shares available for future grants underthe 2014 Plan, inclusive of Shares Reacquired and shares made available through 2014 forfeitures. As of December 31, 2014,there were 1,812,815 shares of common stock outstanding to be issued upon the exercise of stock options and the vesting ofRights.
Rights under the 2014 Plan entitle the holder to receive, without payment, one share of the Company’s common stockafter the expiration of the vesting period. Certain of these Rights are also subject to the satisfaction of establishedperformance goals. Additionally, holders of certain Rights are credited with dividend equivalents, which are converted intoadditional Rights, and holders of certain restricted stock units are paid dividend equivalents in cash when dividends are paidto other stockholders. All Rights have a vesting period of up to five years.
Under the Non-Employee Director Deferred Stock Plan, as amended, each non-employee director who joined the Boardof Directors prior to December 15, 2005 was granted the right to receive 12,000 shares of the Company’s common stockupon retirement. In 2014 and 2013, $28 and $30, respectively, of dividend equivalents were paid in cash related to theseshares. Compensation cost related to this plan was $16, $16 and $19 in 2014, 2013 and 2012, respectively. There are 55,200shares reserved for issuance under this plan. Each non-employee director who joined the Board of Directors subsequent toDecember 15, 2005 received restricted stock units under the respective 2004 or 2014 Plans and have a value of $50 that vestthree years after the date of grant.
Total maximum shares reserved for issuance under all stock plans aggregated 9,547,749 at December 31, 2014.
18. Weighted Average Shares Outstanding
Income from continuing operations and net income per common share is computed in accordance with accountingstandards related to earnings per share. Basic earnings per share is calculated using the weighted-average number of commonshares outstanding during the year. Share-based payment awards that entitle their holders to receive nonforfeitable dividendsbefore vesting should be considered participating securities and, as such, should be included in the calculation of basic earningsper share. The Company’s restricted stock unit awards which contain nonforfeitable rights to dividends are consideredparticipating securities. Diluted earnings per share reflects the assumed exercise and conversion of all dilutive securities. Sharesheld by the Retirement Savings Plan are considered outstanding for both basic and diluted earnings per share. There are nosignificant adjustments to income from continuing operations and net income for purposes of computing income available to
65
BARNES GROUP INC.
NOTES TO CONSOLIDATED FINANCIAL STATEMENTS—(Continued)
common stockholders for the years ended December 31, 2014, 2013 and 2012. A reconciliation of the weighted-average numberof common shares outstanding used in the calculation of basic and diluted earnings per share follows:
Weighted-Average Common Shares Outstanding
2014 2013 2012
Basic 54,791,030 53,860,308 54,626,453Dilutive effect of:
Stock options 355,595 575,202 478,462Restricted stock units 319,704 280,488 70,554Convertible senior subordinated debt 245,230 209,321 —Non-Employee Director Deferred Stock Plan 11,708 48,025 48,988
Diluted 55,723,267 54,973,344 55,224,457
The calculation of weighted-average diluted shares outstanding excludes all anti-dilutive shares. During 2014, 2013 and2012, the Company excluded 89,924, 133,162 and 336,892 stock options, respectively, from the calculation of dilutedweighted-average shares outstanding as the stock options were considered anti-dilutive.
On June 16, 2014, $224 (par value) of the 3.375% Convertible Senior Subordinated Notes due in March 2027 (the“3.375% Convertible Notes”) were surrendered for conversion. On June 24, 2014, the Company exercised its right to redeemthe remaining $55,412 principal amount of the Notes, effective July 31, 2014, and elected to pay cash to holders of the Notessurrendered for conversion, including the value of any residual shares of common stock that were payable to the holderselecting to convert their notes into an equivalent share value. Accordingly, the potential shares issuable for the 3.375%Convertible Notes were included in diluted average common shares outstanding for the period prior to the June 24, 2014notification date. Under the net share settlement method, there were 245,230 and 209,321 potential shares issuable under theNotes that were considered dilutive in 2014 and 2013, respectively. There were no potential shares issuable in 2012 as theNotes would have been anti-dilutive.
19. Changes in Accumulated Other Comprehensive Income by Component
The following tables set forth the changes in accumulated other comprehensive income by component for the yearsended December 31, 2014 and December 31, 2013:
Gains andLosses on Cash
Flow Hedges
Pension andOther
PostretirementBenefit Items
ForeignCurrency
Items Total
January 1, 2014 $ (519) $ (73,273) $ 99,736 $ 25,944Other comprehensive loss before reclassifications to consolidatedstatements of income (1,074) (49,144) (83,168) (133,386)Amounts reclassified from accumulated other comprehensive incometo the consolidated statements of income 861 7,128 — 7,989
Net current-period other comprehensive loss (213) (42,016) (83,168) (125,397)
December 31, 2014 $ (732) $(115,289) $ 16,568 $ (99,453)
Gains andLosses on Cash
Flow Hedges
Pension andOther
PostretirementBenefit Items
ForeignCurrency
Items Total
January 1, 2013 $ (432) $(146,441) $ 80,121 $ (66,752)Other comprehensive (loss) income before reclassifications toconsolidated statements of income (48) 63,315 15,472 78,739Amounts reclassified from accumulated other comprehensive (loss)income to the consolidated statements of income (39) 9,853 4,143 13,957
Net current-period other comprehensive (loss) income (87) 73,168 19,615 92,696
December 31, 2013 $ (519) $ (73,273) $ 99,736 $ 25,944
66
BARNES GROUP INC.
NOTES TO CONSOLIDATED FINANCIAL STATEMENTS—(Continued)
The following table sets forth the reclassifications out of accumulated other comprehensive income by component forthe years ended December 31, 2014 and December 31, 2013:
Details about Accumulated Other Comprehensive Income Components
Amount Reclassifiedfrom Accumulated
OtherComprehensive
Income
Affected Line Item in theConsolidated
Statements of Income
2014 2013
Gains and losses on cash flow hedgesInterest rate contracts $ (886) $ (850) Interest expenseForeign exchange contracts (391) 733 Net sales
(1,277) (117) Total before tax416 156 Tax benefit
(861) 39 Net of tax
Pension and other postretirement benefit itemsAmortization of prior-service credits, net $ 223 $ 254 (A)Amortization of actuarial losses (9,634) (17,369) (A)Curtailment (loss) gain (net) (223) 2,882 (A)Settlement loss (871) (637) (A)
(10,505) (14,870) Total before tax3,377 5,017 Tax benefit
(7,128) (9,853) Net of tax
Foreign currency itemsCharge to cumulative translation adjustment (sale of BDNA)
$ — $ (4,143)Income fromdiscontinued operations
— — Tax benefit
— (4,143) Net of tax
Total reclassifications in the period $ (7,989) $(13,957)
(A) These accumulated other comprehensive income components are included within the computation of net periodic pension cost. See Note 12.
20. Information on Business Segments
In the first quarter of 2013, the Company realigned its reportable business segments by transferring the AssociatedSpring Raymond business (“Raymond”), its remaining business within the former Distribution segment, to the Industrialsegment. Raymond sells, among other products, springs that are manufactured by one of the Industrial businesses.Accordingly, the Company reports under two global business segments: Industrial and Aerospace. The Company’s tworeportable segments offer different products and services and are managed separately as each business has different corefunctional and delivery capabilities. All segment information presented below has been adjusted on a retrospective basis forthe impact of the segment realignment.
Industrial is a global manufacturer of highly-engineered, high-quality precision parts, products and systems for criticalapplications serving a diverse customer base in end-markets such as transportation, industrial equipment, consumer products,packaging, electronics, medical devices, and energy. Focused on innovative custom solutions, Industrial participates in thedesign phase of components and assemblies whereby the customers receive the benefits of application and systems engineering,new product development, testing and evaluation, and the manufacturing of final products. Industrial designs and manufacturescustomized hot runner systems and precision mold assemblies – the enabling technologies for many complex injection moldingapplications. It is a leading manufacturer and supplier of precision mechanical products, including mechanical springs andnitrogen gas products. Industrial manufactures high-precision punched and fine-blanked components used in transportation andindustrial applications, nitrogen gas springs and manifold systems used to precisely control stamping presses, and retention ringsthat position parts on a shaft or other axis. Industrial is equipped to produce virtually every type of precision spring, from finehairsprings for electronics and instruments to large heavy-duty springs for machinery.
67
BARNES GROUP INC.
NOTES TO CONSOLIDATED FINANCIAL STATEMENTS—(Continued)
In the fourth quarter of 2013, the Company completed the acquisition of the Männer Business, a leader in thedevelopment and manufacture of high precision molds, valve gate hot runner systems, and system solutions for the medical/pharmaceutical, packaging, and personal care/health care industries. The Männer Business includes manufacturing locationsin Germany, Switzerland and the United States, and sales and service offices in Europe, the United States, Hong Kong/Chinaand Japan and has been integrated into the Industrial segment.
Industrial has a diverse customer base with products purchased by durable goods manufacturers located around theworld in industries including transportation, consumer products, packaging, farm equipment, telecommunications, medicaldevices, home appliances and electronics.
Industrial competes with a broad base of large and small companies engaged in the manufacture and sale of custommetal components and assemblies, precision molds, and hot runner systems. Industrial competes on the basis of quality,service, reliability of supply, engineering and technical capability, geographic reach, product breadth, innovation, design, andprice. Products are sold primarily through its direct sales force and a network of global distribution channels. Industrial hasmanufacturing, distribution and assembly operations in the United States, Brazil, China, Germany, Mexico, Singapore,Sweden and Switzerland. Industrial also has sales and service operations in the United States, Brazil, Canada, China/HongKong, France, India, Italy, Japan, Mexico, the Netherlands, Portugal, Singapore, Slovakia, South Korea, Spain, Thailand andthe United Kingdom.
Aerospace produces precision-machined and fabricated components and assemblies for OEM turbine engine, airframeand industrial gas turbine builders throughout the world, and the military. Aerospace also provides jet engine componentoverhaul and repair services for many of the world’s major turbine engine manufacturers, commercial airlines and themilitary. MRO activities include the manufacture and delivery of aerospace aftermarket spare parts, including the RSPsunder which the Company receives an exclusive right to supply designated aftermarket parts over the life of the relatedaircraft engine program, and component repairs.
Aerospace entered into Component Repair Programs (“CRPs”) during the fourth quarter of 2013 and the second quarterof 2014. The CRPs provide for, among other items, the right to sell certain aftermarket component repair services forCFM56, CF6 and LM engines directly to other customers as one of a few General Electric licensed suppliers. In addition, theCRPs extend certain existing contracts under which the Company currently provides these services directly to GE.
Aerospace’s OEM business supplements the leading jet engine OEM capabilities and competes with a large number ofmachining and fabrication companies. Competition is based mainly on quality, engineering and technical capability, productbreadth, new product introduction, manufacturing timeliness, service and price. Aerospace’s machining and fabricationoperations, with facilities in Arizona, Connecticut, Michigan, Ohio, Utah and Singapore, produce critical engine and airframecomponents through technically advanced processes.
The Aerospace aftermarket business supplements jet engine OEMs’ maintenance, repair and overhaul capabilities, andcompetes with the service centers of major commercial airlines and other independent service companies for the repair andoverhaul of turbine engine components. The manufacturing and supply of aerospace aftermarket spare parts, including thoserelated to the RSPs, are dependent upon the reliable and timely delivery of high-quality components. Aerospace’saftermarket facilities, located in Connecticut, Ohio and Singapore, specialize in the repair and refurbishment of highlyengineered components and assemblies such as cases, rotating life limited parts, rotating air seals, turbine shrouds, vanes andhoneycomb air seals.
The Company evaluates the performance of its reportable segments based on the operating profit of the respectivebusinesses, which includes net sales, cost of sales, selling and administrative expenses and certain components of otherexpense (income), net, as well as the allocation of corporate overhead expenses.
Sales between the business segments and between the geographic areas in which the businesses operate are accountedfor on the same basis as sales to unaffiliated customers. Additionally, revenues are attributed to countries based on thelocation of facilities.
68
BARNES GROUP INC.
NOTES TO CONSOLIDATED FINANCIAL STATEMENTS—(Continued)
The following tables (dollars shown in millions) set forth information about the Company’s operations by its reportablebusiness segments and by geographic area.
Operations by Reportable Business Segment
Industrial Aerospace OtherTotal
Company
Sales2014 $ 822.1 $ 440.0 $ — $ 1,262.02013 687.6 404.0 — 1,091.62012 538.3 390.5 — 928.8
Operating profit2014 $ 108.4 $ 71.6 $ — $ 180.02013 71.9 51.3 — 123.22012 49.3 57.9 — 107.1
Assets2014 $ 1,282.0 $ 655.0 $ 136.9 $ 2,073.92013 1,410.4 567.1 146.2 2,123.72012 907.1 533.5 428.0 1,868.6
Depreciation and amortization2014 $ 54.7 $ 24.9 $ 1.8 $ 81.42013 38.4 23.2 3.5 65.12012 24.4 21.2 11.8 57.4
Capital expenditures2014 $ 36.1 $ 20.9 $ 0.4 $ 57.42013 31.3 23.8 2.2 57.32012 24.3 8.6 4.9 37.8
Notes:One customer, General Electric, accounted for 19%, 21% and 23% of the Company’s total revenues in 2014, 2013 and 2012, respectively.“Other” assets include corporate-controlled assets, the majority of which are cash and deferred tax assets. “Other” assets as of December 31, 2012 alsoinclude the assets of BDNA, which was sold on April 22, 2013. “Other” Depreciation and Amortization and “Other” Capital Expenditures in 2012 also relateto transactions that occurred at BDNA, prior to its sale. See Note 2.
A reconciliation of the total reportable segments’ operating profit to income from continuing operations before incometaxes follows:
2014 2013 2012
Operating profit $ 180.0 $ 123.2 $ 107.1Interest expense 11.4 13.1 12.2Other expense (income), net 2.1 2.5 2.6
Income from continuing operations before income taxes $ 166.5 $ 107.6 $ 92.3
69
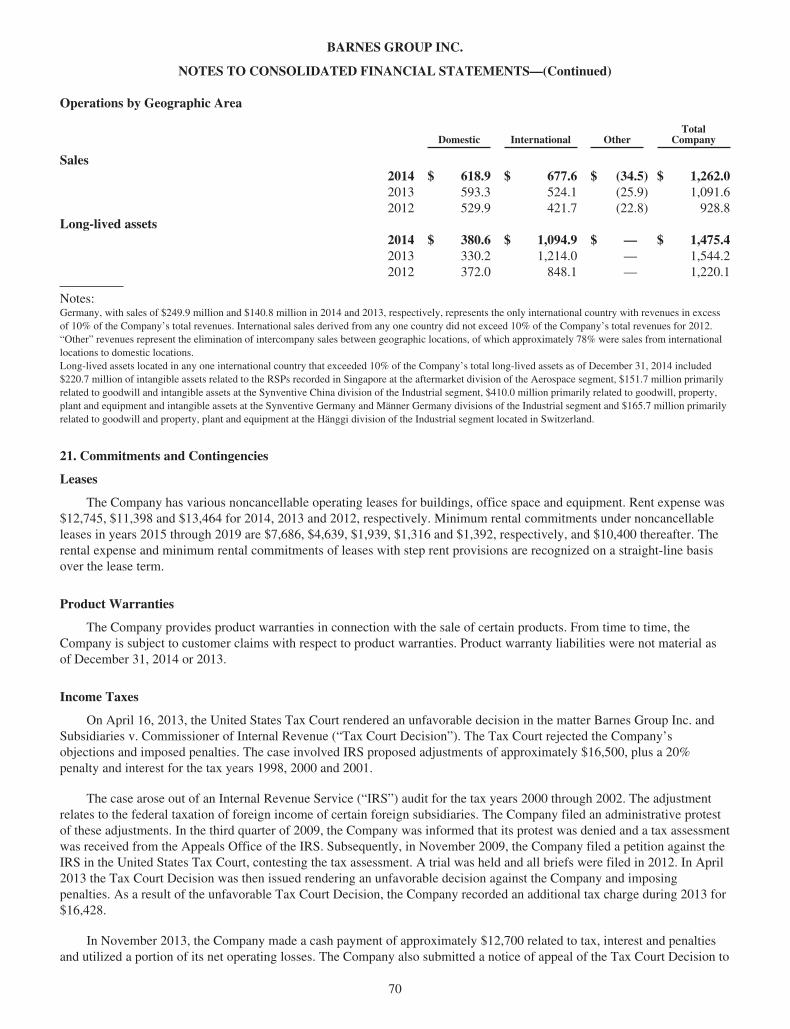
BARNES GROUP INC.
NOTES TO CONSOLIDATED FINANCIAL STATEMENTS—(Continued)
Operations by Geographic Area
Domestic International OtherTotal
Company
Sales2014 $ 618.9 $ 677.6 $ (34.5) $ 1,262.02013 593.3 524.1 (25.9) 1,091.62012 529.9 421.7 (22.8) 928.8
Long-lived assets2014 $ 380.6 $ 1,094.9 $ — $ 1,475.42013 330.2 1,214.0 — 1,544.22012 372.0 848.1 — 1,220.1
Notes:Germany, with sales of $249.9 million and $140.8 million in 2014 and 2013, respectively, represents the only international country with revenues in excessof 10% of the Company’s total revenues. International sales derived from any one country did not exceed 10% of the Company’s total revenues for 2012.“Other” revenues represent the elimination of intercompany sales between geographic locations, of which approximately 78% were sales from internationallocations to domestic locations.Long-lived assets located in any one international country that exceeded 10% of the Company’s total long-lived assets as of December 31, 2014 included$220.7 million of intangible assets related to the RSPs recorded in Singapore at the aftermarket division of the Aerospace segment, $151.7 million primarilyrelated to goodwill and intangible assets at the Synventive China division of the Industrial segment, $410.0 million primarily related to goodwill, property,plant and equipment and intangible assets at the Synventive Germany and Männer Germany divisions of the Industrial segment and $165.7 million primarilyrelated to goodwill and property, plant and equipment at the Hänggi division of the Industrial segment located in Switzerland.
21. Commitments and Contingencies
Leases
The Company has various noncancellable operating leases for buildings, office space and equipment. Rent expense was$12,745, $11,398 and $13,464 for 2014, 2013 and 2012, respectively. Minimum rental commitments under noncancellableleases in years 2015 through 2019 are $7,686, $4,639, $1,939, $1,316 and $1,392, respectively, and $10,400 thereafter. Therental expense and minimum rental commitments of leases with step rent provisions are recognized on a straight-line basisover the lease term.
Product Warranties
The Company provides product warranties in connection with the sale of certain products. From time to time, theCompany is subject to customer claims with respect to product warranties. Product warranty liabilities were not material asof December 31, 2014 or 2013.
Income Taxes
On April 16, 2013, the United States Tax Court rendered an unfavorable decision in the matter Barnes Group Inc. andSubsidiaries v. Commissioner of Internal Revenue (“Tax Court Decision”). The Tax Court rejected the Company’sobjections and imposed penalties. The case involved IRS proposed adjustments of approximately $16,500, plus a 20%penalty and interest for the tax years 1998, 2000 and 2001.
The case arose out of an Internal Revenue Service (“IRS”) audit for the tax years 2000 through 2002. The adjustmentrelates to the federal taxation of foreign income of certain foreign subsidiaries. The Company filed an administrative protestof these adjustments. In the third quarter of 2009, the Company was informed that its protest was denied and a tax assessmentwas received from the Appeals Office of the IRS. Subsequently, in November 2009, the Company filed a petition against theIRS in the United States Tax Court, contesting the tax assessment. A trial was held and all briefs were filed in 2012. In April2013 the Tax Court Decision was then issued rendering an unfavorable decision against the Company and imposingpenalties. As a result of the unfavorable Tax Court Decision, the Company recorded an additional tax charge during 2013 for$16,428.
In November 2013, the Company made a cash payment of approximately $12,700 related to tax, interest and penaltiesand utilized a portion of its net operating losses. The Company also submitted a notice of appeal of the Tax Court Decision to
70
BARNES GROUP INC.
NOTES TO CONSOLIDATED FINANCIAL STATEMENTS—(Continued)
the United States Court of Appeals for the Second Circuit. The Company filed its opening brief with the United States Courtof Appeals for the Second Circuit on February 13, 2014 and presented its oral arguments on October 1, 2014.
On November 5, 2014, the Second Circuit upheld the Tax Court Decision. The Company has decided not to litigate thismatter further.
22. Accounting Changes
In July 2013, the Financial Accounting Standards Board (“FASB”) issued guidance related to the financial statementpresentation of an unrecognized tax benefit when certain tax losses or tax credit carryforwards exist. This guidance requiresthat companies present an unrecognized tax benefit, or a portion of an unrecognized tax benefit, as a reduction to a deferredtax asset for a net operating loss carryforward, a similar tax loss, or a tax credit carryforward. The provisions of the amendedguidance were effective for the Company, and adopted, in the first quarter of 2014. The provisions did not have a materialimpact on the presentation of the Company’s Consolidated Financial Statements.
71
Report of Independent Registered Public Accounting Firm
To the Board of Directors and Stockholders of Barnes Group Inc.:
In our opinion, the accompanying consolidated balance sheets and the related consolidated statements of income, ofcomprehensive income, of changes in stockholders’ equity and of cash flows present fairly, in all material respects, thefinancial position of Barnes Group Inc. and its subsidiaries (the “Company”) at December 31, 2013 and 2014, and the resultsof their operations and their cash flows for each of the three years in the period ended December 31, 2014 in conformity withaccounting principles generally accepted in the United States of America. In addition, in our opinion, the financial statementschedule listed in the accompanying index appearing under item 15(a)(2) presents fairly, in all material respects, theinformation set forth therein when read in conjunction with the related consolidated financial statements. Also in our opinion,the Company maintained, in all material respects, effective internal control over financial reporting as of December 31, 2014,based on criteria established in Internal Control – Integrated Framework 2013 issued by the Committee of SponsoringOrganizations of the Treadway Commission (COSO). The Company’s management is responsible for these financialstatements, for maintaining effective internal control over financial reporting and for its assessment of the effectiveness ofinternal control over financial reporting, included in Management’s Report on Internal Control over Financial Reportingappearing under Item 9A. Our responsibility is to express opinions on these financial statements, on the financial statementschedule, and on the Company’s internal control over financial reporting based on our integrated audits. We conducted ouraudits in accordance with the standards of the Public Company Accounting Oversight Board (United States). Those standardsrequire that we plan and perform the audits to obtain reasonable assurance about whether the financial statements are free ofmaterial misstatement and whether effective internal control over financial reporting was maintained in all material respects.Our audits of the financial statements included examining, on a test basis, evidence supporting the amounts and disclosuresin the financial statements, assessing the accounting principles used and significant estimates made by management, andevaluating the overall financial statement presentation. Our audit of internal control over financial reporting includedobtaining an understanding of internal control over financial reporting, assessing the risk that a material weakness exists, andtesting and evaluating the design and operating effectiveness of internal control based on the assessed risk. Our audits alsoincluded performing such other procedures as we considered necessary in the circumstances. We believe that our auditsprovide a reasonable basis for our opinions.
A company’s internal control over financial reporting is a process designed to provide reasonable assurance regardingthe reliability of financial reporting and the preparation of financial statements for external purposes in accordance withgenerally accepted accounting principles. A company’s internal control over financial reporting includes those policies andprocedures that (i) pertain to the maintenance of records that, in reasonable detail, accurately and fairly reflect thetransactions and dispositions of the assets of the company; (ii) provide reasonable assurance that transactions are recorded asnecessary to permit preparation of financial statements in accordance with generally accepted accounting principles, and thatreceipts and expenditures of the company are being made only in accordance with authorizations of management anddirectors of the company; and (iii) provide reasonable assurance regarding prevention or timely detection of unauthorizedacquisition, use, or disposition of the company’s assets that could have a material effect on the financial statements.
Because of its inherent limitations, internal control over financial reporting may not prevent or detect misstatements.Also, projections of any evaluation of effectiveness to future periods are subject to the risk that controls may becomeinadequate because of changes in conditions, or that the degree of compliance with the policies or procedures maydeteriorate.
/s/ PRICEWATERHOUSECOOPERS LLPPricewaterhouseCoopers LLPHartford, ConnecticutFebruary 23, 2015
72

QUARTERLY DATA (UNAUDITED)
(Dollars in millions, except per share data)
FirstQuarter
SecondQuarter
ThirdQuarter
FourthQuarter
FullYear
2014Net sales $ 312.1 $ 322.1 $ 317.7 $ 310.2 $ 1,262.0Gross profit (1) 97.5 110.4 111.2 113.2 432.4Operating income 35.1 45.4 50.9 48.6 180.0Income from continuing operations 22.8 30.2 34.3 33.3 120.5Net income 22.8 30.2 33.9 31.5 118.4Per common share:Income from continuing operations:
Basic $ 0.42 $ 0.55 $ 0.63 $ 0.60 $ 2.20Diluted 0.41 0.54 0.62 0.60 2.16
Net income:Basic 0.42 0.55 0.62 0.57 2.16Diluted 0.41 0.54 0.61 0.57 2.12
Dividends 0.11 0.11 0.11 0.12 0.45Market prices (high - low) $40.92-35.34 $40.01-36.27 $39.07-30.35 $37.88-29.47 $40.92-29.47
2013Net sales $ 263.5 $ 267.4 $ 269.5 $ 291.1 $ 1,091.6Gross profit (1) 85.8 90.0 80.0 97.6 353.4Operating income 25.0 36.1 28.0 34.1 123.2Income from continuing operations 15.4 9.2 21.4 26.3 72.3Net income 13.5 209.3 20.9 26.8 270.5Per common share:Income from continuing operations:
Basic $ 0.29 $ 0.18 $ 0.40 $ 0.49 $ 1.34Diluted 0.28 0.17 0.39 0.47 1.31
Net income:Basic 0.25 3.90 0.39 0.50 5.02Diluted 0.24 3.82 0.38 0.48 4.92
Dividends 0.10 0.10 0.11 0.11 0.42Market prices (high - low) $29.20-21.84 $32.35-26.33 $35.71-30.14 $38.56-34.48 $38.56-21.84
(1) Sales less cost of sales.
Item 9. Changes in and Disagreements with Accountants on Accounting and Financial Disclosure
None.
Item 9A. Controls and Procedures
Disclosure Controls and Procedures
Management, including the Company’s President and Chief Executive Officer and Chief Financial Officer, hasevaluated the effectiveness of the design and operation of the Company’s disclosure controls and procedures as of the end ofthe period covered by this report. Based upon, and as of the date of, that evaluation, the President and Chief ExecutiveOfficer and Chief Financial Officer concluded that the disclosure controls and procedures were effective, in all materialrespects, and designed to provide reasonable assurance that the information required to be disclosed in the reports theCompany files and submits under the Securities Exchange Act of 1934 (the “Exchange Act”), as amended, is (i) recorded,processed, summarized and reported as and when required and (ii) is accumulated and communicated to the Company’smanagement, including the President and Chief Executive Officer and Chief Financial Officer, as appropriate to allow timelydecisions regarding required disclosure.
73
Management’s Report on Internal Control Over Financial Reporting
Management is responsible for establishing and maintaining adequate internal control over financial reporting, as suchterm is defined in Exchange Act Rule 13a-15(f). Under the supervision and with the participation of management, includingthe principal executive officer and principal financial officer, the Company conducted an assessment of the effectiveness ofits internal control over financial reporting based on the framework in the “Internal Control—Integrated Framework 2013”issued by the Committee of Sponsoring Organizations of the Treadway Commission. Based on the assessment under thisframework, management concluded that the Company’s internal control over financial reporting was effective as ofDecember 31, 2014.
PricewaterhouseCoopers LLP, the independent registered public accounting firm that audited the financial statementsincluded in this Annual Report, has issued an attestation report on the Company’s internal control over financial reporting asof December 31, 2014, which appears on page 72 of this Annual Report on Form 10-K.
Changes in Internal Control Over Financial Reporting
There has been no change to our internal control over financial reporting during the Company’s fourth fiscal quarter thathas materially affected, or is reasonably likely to materially affect, our internal control over financial reporting.
Item 9B. Other Information
None.
74
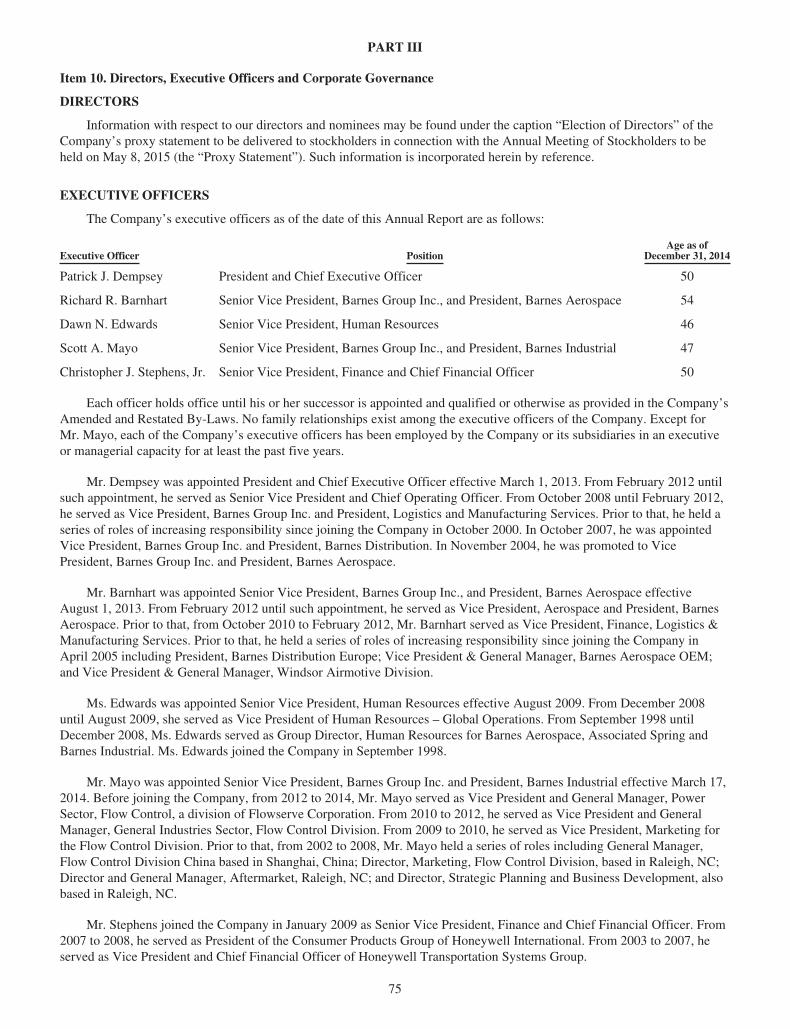
PART III
Item 10. Directors, Executive Officers and Corporate Governance
DIRECTORS
Information with respect to our directors and nominees may be found under the caption “Election of Directors” of theCompany’s proxy statement to be delivered to stockholders in connection with the Annual Meeting of Stockholders to beheld on May 8, 2015 (the “Proxy Statement”). Such information is incorporated herein by reference.
EXECUTIVE OFFICERS
The Company’s executive officers as of the date of this Annual Report are as follows:
Executive Officer PositionAge as of
December 31, 2014
Patrick J. Dempsey President and Chief Executive Officer 50
Richard R. Barnhart Senior Vice President, Barnes Group Inc., and President, Barnes Aerospace 54
Dawn N. Edwards Senior Vice President, Human Resources 46
Scott A. Mayo Senior Vice President, Barnes Group Inc., and President, Barnes Industrial 47
Christopher J. Stephens, Jr. Senior Vice President, Finance and Chief Financial Officer 50
Each officer holds office until his or her successor is appointed and qualified or otherwise as provided in the Company’sAmended and Restated By-Laws. No family relationships exist among the executive officers of the Company. Except forMr. Mayo, each of the Company’s executive officers has been employed by the Company or its subsidiaries in an executiveor managerial capacity for at least the past five years.
Mr. Dempsey was appointed President and Chief Executive Officer effective March 1, 2013. From February 2012 untilsuch appointment, he served as Senior Vice President and Chief Operating Officer. From October 2008 until February 2012,he served as Vice President, Barnes Group Inc. and President, Logistics and Manufacturing Services. Prior to that, he held aseries of roles of increasing responsibility since joining the Company in October 2000. In October 2007, he was appointedVice President, Barnes Group Inc. and President, Barnes Distribution. In November 2004, he was promoted to VicePresident, Barnes Group Inc. and President, Barnes Aerospace.
Mr. Barnhart was appointed Senior Vice President, Barnes Group Inc., and President, Barnes Aerospace effectiveAugust 1, 2013. From February 2012 until such appointment, he served as Vice President, Aerospace and President, BarnesAerospace. Prior to that, from October 2010 to February 2012, Mr. Barnhart served as Vice President, Finance, Logistics &Manufacturing Services. Prior to that, he held a series of roles of increasing responsibility since joining the Company inApril 2005 including President, Barnes Distribution Europe; Vice President & General Manager, Barnes Aerospace OEM;and Vice President & General Manager, Windsor Airmotive Division.
Ms. Edwards was appointed Senior Vice President, Human Resources effective August 2009. From December 2008until August 2009, she served as Vice President of Human Resources – Global Operations. From September 1998 untilDecember 2008, Ms. Edwards served as Group Director, Human Resources for Barnes Aerospace, Associated Spring andBarnes Industrial. Ms. Edwards joined the Company in September 1998.
Mr. Mayo was appointed Senior Vice President, Barnes Group Inc. and President, Barnes Industrial effective March 17,2014. Before joining the Company, from 2012 to 2014, Mr. Mayo served as Vice President and General Manager, PowerSector, Flow Control, a division of Flowserve Corporation. From 2010 to 2012, he served as Vice President and GeneralManager, General Industries Sector, Flow Control Division. From 2009 to 2010, he served as Vice President, Marketing forthe Flow Control Division. Prior to that, from 2002 to 2008, Mr. Mayo held a series of roles including General Manager,Flow Control Division China based in Shanghai, China; Director, Marketing, Flow Control Division, based in Raleigh, NC;Director and General Manager, Aftermarket, Raleigh, NC; and Director, Strategic Planning and Business Development, alsobased in Raleigh, NC.
Mr. Stephens joined the Company in January 2009 as Senior Vice President, Finance and Chief Financial Officer. From2007 to 2008, he served as President of the Consumer Products Group of Honeywell International. From 2003 to 2007, heserved as Vice President and Chief Financial Officer of Honeywell Transportation Systems Group.
75
AUDIT COMMITTEE
Ms. Sohovich and Messrs. Bristow, McClellan and Morgan are the members of the Company’s Audit Committee whichis a separately designated standing committee of the Board of Directors of the Company established in accordance withSection 3(a)(58)(A) of the Exchange Act.
The Company’s Board of Directors has determined that Mr. Morgan, who qualifies as an independent director under theNew York Stock Exchange corporate governance listing standards and the Company’s Corporate Governance Guidelines, isan “audit committee financial expert,” as such term is defined by the SEC.
COMPLIANCE WITH SECTION 16(A) OF THE EXCHANGE ACT
The information in the Proxy Statement under the caption “Section 16(a) Beneficial Ownership Reporting Compliance”is incorporated herein by reference.
CODE OF ETHICS
We have adopted a Code of Ethics Applicable to Senior Executives (the “Executive Code of Ethics”) which isapplicable to our Chief Executive Officer, Chief Financial Officer and Principal Accounting Officer and any personsperforming similar functions. The Executive Code of Ethics is available on our website at www.BGInc.com. We willpromptly disclose any material waivers of or substantive amendments to the Executive Code of Ethics on our website or in areport on Form 8-K.
Item 11. Executive Compensation
The information in the Proxy Statement under the captions “Executive Compensation” and “Director Compensation in2014” is incorporated herein by reference.
Item 12. Security Ownership of Certain Beneficial Owners and Management and Related Stockholder Matters
The information in the Proxy Statement under “Security Ownership of Certain Beneficial Owners and Management”and “Securities Authorized for Issuance Under Equity Compensation Plans” is incorporated herein by reference.
Item 13. Certain Relationships and Related Transactions, and Director Independence
The information in the Proxy Statement under “Related Person Transactions” and “Governance – DirectorIndependence” is incorporated herein by reference.
Item 14. Principal Accountant Fees and Services
The information in the Proxy Statement under “Principal Accountant Fees and Services” is incorporated herein byreference.
76
PART IV
Item 15. Exhibits, Financial Statement Schedules
(a)(1) The following Financial Statements and Supplementary Data of the Company are set forth herein under Item 8of this Annual Report:
Consolidated Statements of Income for the years ended December 31, 2014, 2013 and 2012Consolidated Balance Sheets as of December 31, 2014 and 2013Consolidated Statements of Comprehensive Income for the years ended December 31, 2014, 2013 and 2012Consolidated Statements of Cash Flows for the years ended December 31, 2014, 2013 and 2012Consolidated Statements of Changes in Stockholders’ Equity for the years ended December 31, 2014, 2013and 2012Notes to Consolidated Financial StatementsReport of Independent Registered Public Accounting Firm
(a)(2) See Financial Statement Schedule under Item 15(c).
(a)(3) See Item 15(b) below.
(b) The Exhibits required by Item 601 of Regulation S-K are filed as Exhibits to this Annual Report and indexedat pages 82 through 87 of this Annual Report, which index is incorporated herein by reference.
(c) Financial Statement Schedules.
77
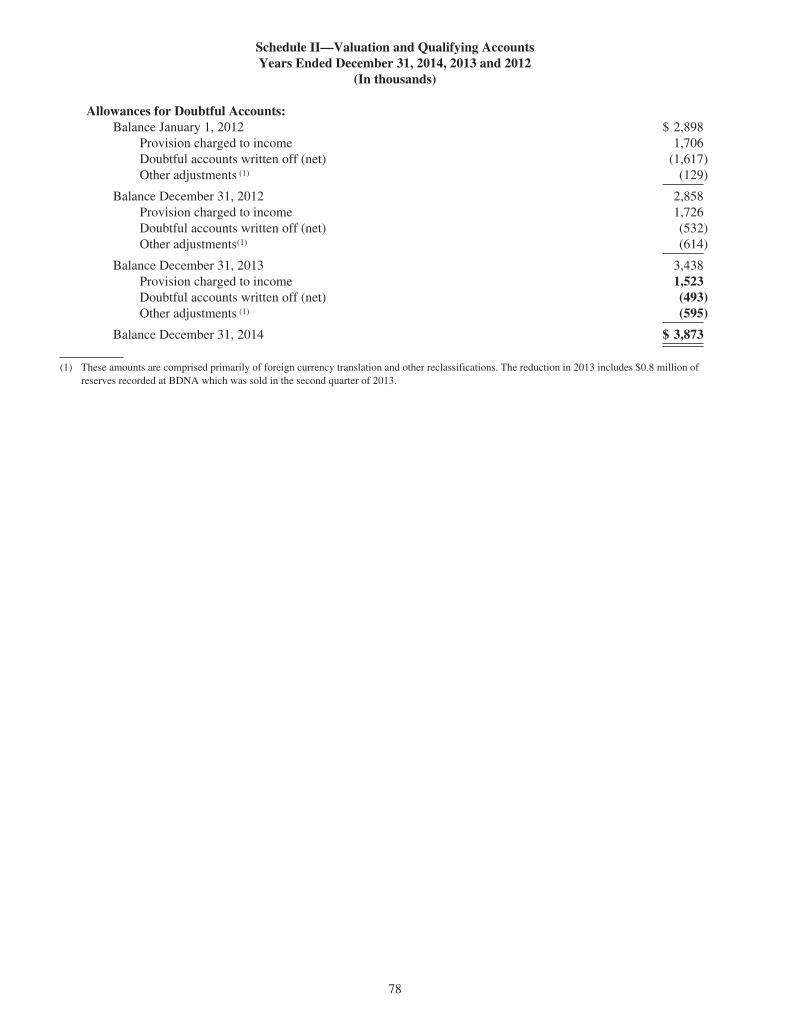
Schedule II—Valuation and Qualifying AccountsYears Ended December 31, 2014, 2013 and 2012
(In thousands)
Allowances for Doubtful Accounts:Balance January 1, 2012 $ 2,898
Provision charged to income 1,706Doubtful accounts written off (net) (1,617)Other adjustments (1) (129)
Balance December 31, 2012 2,858Provision charged to income 1,726Doubtful accounts written off (net) (532)Other adjustments(1) (614)
Balance December 31, 2013 3,438Provision charged to income 1,523Doubtful accounts written off (net) (493)Other adjustments (1) (595)
Balance December 31, 2014 $ 3,873
(1) These amounts are comprised primarily of foreign currency translation and other reclassifications. The reduction in 2013 includes $0.8 million ofreserves recorded at BDNA which was sold in the second quarter of 2013.
78
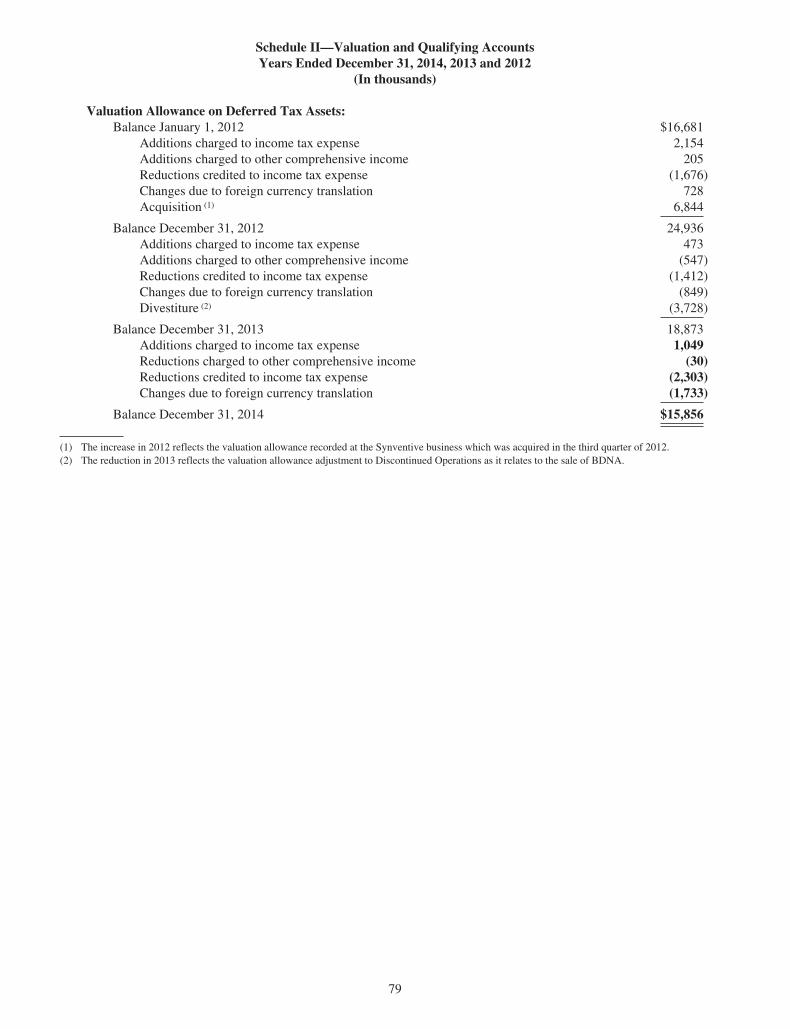
Schedule II—Valuation and Qualifying AccountsYears Ended December 31, 2014, 2013 and 2012
(In thousands)
Valuation Allowance on Deferred Tax Assets:Balance January 1, 2012 $16,681
Additions charged to income tax expense 2,154Additions charged to other comprehensive income 205Reductions credited to income tax expense (1,676)Changes due to foreign currency translation 728Acquisition (1) 6,844
Balance December 31, 2012 24,936Additions charged to income tax expense 473Additions charged to other comprehensive income (547)Reductions credited to income tax expense (1,412)Changes due to foreign currency translation (849)Divestiture (2) (3,728)
Balance December 31, 2013 18,873Additions charged to income tax expense 1,049Reductions charged to other comprehensive income (30)Reductions credited to income tax expense (2,303)Changes due to foreign currency translation (1,733)
Balance December 31, 2014 $15,856
(1) The increase in 2012 reflects the valuation allowance recorded at the Synventive business which was acquired in the third quarter of 2012.(2) The reduction in 2013 reflects the valuation allowance adjustment to Discontinued Operations as it relates to the sale of BDNA.
79
SIGNATURES
Pursuant to the requirements of Section 13 or 15(d) of the Securities Exchange Act of 1934, the Company has dulycaused this report to be signed on its behalf by the undersigned, thereunto duly authorized.
Date: February 23, 2015
BARNES GROUP INC.
By /S/ PATRICK J. DEMPSEY
Patrick J. DempseyPresident and Chief Executive Officer
Pursuant to the requirements of the Securities Exchange Act of 1934, this report has been signed below as of the abovedate by the following persons on behalf of the Company in the capacities indicated.
/S/ PATRICK J. DEMPSEY
Patrick J. DempseyPresident and Chief Executive Officer
(Principal Executive Officer), and Director
/S/ CHRISTOPHER J. STEPHENS, JR.Christopher J. Stephens, Jr.
Senior Vice President, FinanceChief Financial Officer
(Principal Financial Officer)
/S/ MARIAN ACKER
Marian AckerVice President, Controller
(Principal Accounting Officer)
/S/ THOMAS O. BARNES
Thomas O. BarnesDirector
/S/ GARY G. BENANAV
Gary G. BenanavDirector
/S/ WILLIAM S. BRISTOW, JR.William S. Bristow, Jr.
Director
/S/ FRANCIS J. KRAMER
Francis J. KramerDirector
/S/ MYLLE H. MANGUM
Mylle H. MangumDirector
80

/S/ HASSELL H. MCCLELLAN
Hassell H. McClellanDirector
/S/ WILLIAM J. MORGAN
William J. MorganDirector
/S/ JOANNA L. SOHOVICH
JoAnna L. SohovichDirector
81

EXHIBIT INDEX
Barnes Group Inc.
Annual Report on Form 10-Kfor the Year ended December 31, 2014
Exhibit No. Description Reference
2.1* Stock Purchase Agreement dated as of July 16, 2012among the Company, Synventive Acquisition Inc.(“Synventive”), the stock and option holders ofSynventive, and Cetus Capital, LLC.
Incorporated by reference to Exhibit 2.1 to Form 8-Kfiled by the Company on July 17, 2012.
2.2* Asset Purchase Agreement dated February 22, 2013between the Company and MSC Industrial DirectCo., Inc.
Incorporated by reference to Exhibit 2.1 to theCompany’s report on Form 10-Q for the quarterended March 31, 2013.
2.3* Share Purchase and Assignment Agreement datedSeptember 30, 2013 among the Company, two of itssubsidiaries, Otto Männer Holding AG (the “Seller”),and the three shareholders of Seller.
Incorporated by reference to Exhibit 2.1 to Form 8-Kfiled by the Company on October 4, 2013.
3.1 Restated Certificate of Incorporation; Certificate ofDesignation, Preferences and Rights of Series AJunior Participating Preferred Stock; Certificate ofChange of Location of registered office and ofregistered agent, dated December 13, 2002;Certificate of Merger of domestic limited liabilitycompany into a domestic company, dated May 19,2004; Certificate of Amendment of RestatedCertificate of Incorporation, dated April 20, 2006;and Certificate of Amendment of Restated Certificateof Incorporation, dated as of May 3, 2013.
Incorporated by reference to Exhibit 3.1 to theCompany’s report on Form 10-Q for the quarterended June 30, 2013.
3.2 Amended and Restated By-Laws. Incorporated by reference to Exhibit 3.2 to Form 8-Kfiled by the Company on May 6, 2013.
4.1 (i) Purchase Agreement among the Company andseveral initial purchasers named therein, datedMarch 6, 2007, relating to the Company’s 3.375%Convertible Senior Subordinated Notes due 2027.
Incorporated by reference to Exhibit 4.1 to Form 8-Kfiled by the Company on March 7, 2007.
(ii) Indenture between the Company and The Bank ofNew York Trust Company, N.A., as Trustee under theIndenture, dated as of March 12, 2007, relating to theCompany’s 3.375% Convertible Senior SubordinatedNotes due 2027.
Incorporated by reference to Exhibit 4.3 to Form 8-Kfiled by the Company on March 12, 2007.
(iii) Resale Registration Rights Agreement betweenthe Company and Banc of America Securities LLC,as Representative of the Initial Purchasers, dated as ofMarch 12, 2007, relating to the Company’s 3.375%Convertible Senior Subordinated Notes due 2027.
Incorporated by reference to Exhibit 4.4 to Form 8-Kfiled by the Company on March 12, 2007.
10.1 (i) Fifth Amended and Restated Senior UnsecuredRevolving Credit Agreement, dated September 27,2011.
Incorporated by reference to Exhibit 4.1 to theCompany’s report on Form 10-Q for the quarterended June 30, 2013.
(ii) Amendment No. 2 and Joinder to CreditAgreement dated as of September 27, 2013(amending Fifth Amended and Restated SeniorUnsecured Revolving Credit Agreement, dated as ofSeptember 27, 2011).
Incorporated by reference to Exhibit 4.1 to theCompany’s report on Form 10-Q for the quarterended September 30, 2013.
82

Exhibit No. Description Reference
(iii) Amendment No. 3 to Credit Agreement dated asof October 15, 2014.
Filed with this report.
10.2 Note Purchase Agreement, dated as of October 15,2014, among the Company and New York LifeInsurance Company, New York Life Insurance andAnnuity Corporation and New York Life Insuranceand Annuity Corporation Institutionally Owned LifeInsurance Separate Account (BOLI 30C).
Incorporated by reference to Exhibit 10.1 toForm 8-K filed by the Company on October 17, 2014.
10.3** Barnes Group Inc. Management IncentiveCompensation Plan, amended October 22, 2008.
Incorporated by reference to Exhibit 10.1 to theCompany’s report on Form 10-K for the year endedDecember 31, 2008.
10.4** Barnes Group Inc. Performance-Linked Bonus Planfor Selected Executive Officers, as amended February8, 2011.
Incorporated by reference to Annex 1 to theCompany’s definitive proxy statement filed with theSecurities and Exchange Commission on April 5,2011.
10.5** (i) Employment Agreement by and between theCompany and Gregory F. Milzcik, as amended andrestated as of December 31, 2008.
Incorporated by reference to Exhibit 10.1 toForm 8-K/A filed by the Company on January 20,2009.
(ii) Transition and Resignation Agreement betweenthe Company and Gregory F. Milzcik, datedFebruary 22, 2013.
Incorporated by reference to Exhibit 10.2 to theCompany’s report on Form 10-Q for the quarterended March 31, 2013.
(iii) Release by Gregory F. Milzcik, dated May 3,2013.
Incorporated by reference to Exhibit 10.1 to theCompany’s report on Form 10-Q for the quarterended June 30, 2013.
10.6** (i) Offer Letter between the Company and PatrickDempsey, dated February 22, 2013.
Incorporated by reference to Exhibit 10.3 to theCompany’s report on Form 10-Q for the quarterended March 31, 2013.
(ii) Amendment to Offer Letter to Patrick Dempsey,dated January 6, 2015.
Filed with this report.
(iii) Employee Non-Disclosure, Non-Competition,Non-Solicitation and Non-Disparagement Agreementbetween the Company and Patrick J. Dempsey, datedFebruary 27, 2013.
Incorporated by reference to Exhibit 10.4 to theCompany’s report on Form 10-Q for the quarterended March 31, 2013.
10.7** (i) Amendment to Offer Letter to Christopher J.Stephens, Jr., dated June 7, 2013.
Incorporated by reference to Exhibit 10.2 to theCompany’s report on Form 10-Q for the quarterended June 30, 2013.
(ii) Amendment to Amended Offer Letter toChristopher J. Stephens, Jr., dated February 12, 2014.
Incorporated by reference to Exhibit 10.6(ii) to theCompany’s report on Form 10-K for the year endedDecember 31, 2013.
10.8** Offer Letter to Scott A. Mayo, dated January 28,2014.
Incorporated by reference to Exhibit 10.2 to theCompany’s report on Form 10-Q for the quarterended March 31, 2014.
10.9** (i) Barnes Group Inc. Retirement BenefitEqualization Plan, as amended and restated effectiveJanuary 1, 2013.
Incorporated by reference to Exhibit 10.39(ii) to theCompany’s report on Form 10-K for the year endedDecember 31, 2012.
(ii) First Amendment to the Barnes Group Inc.Retirement Benefit Equalization Plan datedDecember 12, 2014.
Filed with this report.
83
Exhibit No. Description Reference
10.10** (i) Barnes Group Inc. Supplemental Senior OfficerRetirement Plan, as amended and restated effectiveJanuary 1, 2009.
Incorporated by reference to Exhibit 10.3 to theCompany’s report on Form 10-K for the year endedDecember 31, 2008.
(ii) Amendment to the Barnes Group Inc.Supplemental Senior Officer Retirement Plan datedDecember 30, 2009.
Incorporated by reference to Exhibit 10.3(ii) to theCompany’s report on Form 10-K for the year endedDecember 31, 2009.
(iii) Second Amendment to the Barnes Group Inc.Supplemental Senior Officer Retirement Plan datedDecember 12, 2014.
Filed with this report.
10.11** (i) Amended and Restated Supplemental ExecutiveRetirement Plan effective April 1, 2012.
Incorporated by reference to Exhibit 10.6(ii) to theCompany’s report on Form 10-K for the year endedDecember 31, 2011.
(ii) Amendment 2013-1 to the Barnes Group Inc.Supplemental Executive Retirement Plan datedJuly 23, 2013.
Incorporated by reference to Exhibit 10.3 to theCompany’s report on Form 10-Q for the quarterended June 30, 2013.
(iii) Amendment 2014-1 to the Barnes Group Inc.Supplemental Executive Retirement Plan datedDecember 12, 2014.
Filed with this report.
10.12** Barnes Group Inc. Senior Executive Enhanced LifeInsurance Program, as amended and restated effectiveApril 1, 2011.
Incorporated by reference to Exhibit 10.1 to theCompany’s report on Form 10-Q for the quarterended June 30, 2011.
10.13** Barnes Group Inc. Enhanced Life Insurance Program,as amended and restated effective April 1, 2011.
Incorporated by reference to Exhibit 10.6 to theCompany’s report on Form 10-Q for the quarterended March 30, 2011.
10.14** Barnes Group Inc. Executive Group Term LifeInsurance Program effective April 1, 2011.
Incorporated by reference to Exhibit 10.1 toForm 8-K filed by the Company on June 19, 2012.
10.15** Form of Barnes Group Inc. Executive OfficerSeverance Agreement, as amended March 31, 2010.
Incorporated by reference to Exhibit 10.20 to theCompany’s Form 10-K for the year endedDecember 31, 2010.
10.16** Form of Barnes Group Inc. Executive OfficerSeverance Agreement, effective February 19, 2014.
Incorporated by reference to Exhibit 10.1 to theCompany’s report on Form 10-Q for the quarterended March 31, 2014.
10.17** Barnes Group Inc. Executive Separation Pay Plan, asamended and restated effective January 1, 2012.
Incorporated by reference to Exhibit 10.11(ii) to theCompany’s report on Form 10-K for the year endedDecember 31, 2011.
10.18** (i) Trust Agreement between the Company andFidelity Management Trust Company (Barnes Group2009 Deferred Compensation Plan) datedSeptember 1, 2009.
Incorporated by reference to Exhibit 10.2 to theCompany’s Form 10-Q for the quarter endedSeptember 30, 2009.
(ii) Amended and Restated Barnes Group 2009Deferred Compensation Plan effective as of April 1,2012.
Incorporated by reference to Exhibit 10.12(iv) to theCompany’s report on Form 10-K for the year endedDecember 31, 2011.
(iii) First Amendment to the Barnes Group 2009Deferred Compensation Plan dated December 12,2014.
Filed with this report.
10.19** Barnes Group Inc. Non-Employee Director DeferredStock Plan, as amended and restated December 31,2008.
Incorporated by reference to Exhibit 10.5 to theCompany’s report on Form 10-K for the year endedDecember 31, 2008.
84

Exhibit No. Description Reference
10.20** Barnes Group Inc. Directors’ Deferred CompensationPlan, as amended and restated December 31, 2008.
Incorporated by reference to Exhibit 10.6 to theCompany’s report on Form 10-K for the year endedDecember 31, 2008.
10.21** Form of Amended and Restated Contingent DividendEquivalent Rights Agreement for officers.
Incorporated by reference to Exhibit 10.29 to theCompany’s Form 10-K for the year ended December31, 2008.
10.22** Barnes Group Inc. Trust Agreement for SpecifiedPlans.
Incorporated by reference to Exhibit 10.3 to theCompany’s Form 10-Q for the quarter ended June 30,2010.
10.23** Form of Incentive Compensation ReimbursementAgreement between the Company and certainOfficers.
Incorporated by reference to Exhibit 10.19 to theCompany’s Form 10-K for the year endedDecember 31, 2010.
10.24** Form of Indemnification Agreement between theCompany and its Officers and Directors.
Incorporated by reference to Exhibit 10.2 to theCompany’s Form 10-Q for the quarter ended June 30,2010.
10.25** Barnes Group Inc. Amended Employee Stock andOwnership Program as further amended.
Incorporated by reference to Exhibit 10.2 to theCompany’s report on Form 10-Q for the quarterended March 31, 2003.
10.26** (i) Barnes Group Inc. Stock and Incentive AwardPlan, as amended December 31, 2008.
Incorporated by reference to Exhibit 10.15 to theCompany’s report on Form 10-K for the year endedDecember 31, 2008.
(ii) Barnes Group Inc. Stock and Incentive AwardPlan, as amended March 15, 2010.
Incorporated by reference to Annex 1 to theCompany’s definitive Proxy Statement filed with theSecurities and Exchange Commission on April 5,2010.
(iii) Exercise of Authority Relating to the Stock andIncentive Award Plan, dated March 3, 2009.
Incorporated by reference to Exhibit 10.1 to theCompany’s report on Form 10-Q for the quarterended March 31, 2009.
(iv) Amendment 2010-1 approved on December 9,2010 to the Barnes Group Inc. Stock and IncentiveAward Plan as amended March 15, 2010.
Incorporated by reference to Exhibit 10.15 to theCompany’s Form 10-K for the year endedDecember 31, 2010.
10.27** 2014 Barnes Group Inc. Stock and Incentive AwardPlan.
Incorporated by reference to Annex A to theCompany’s definitive proxy statement filed with theSecurities and Exchange Commission on March 25,2014.
10.28** Form of Barnes Group Inc. Stock and IncentiveAward Plan Restricted Stock Unit Summary of Grantand Restricted Stock Unit Agreement for Directorsdated February 8, 2012 (for non-managementdirectors).
Incorporated by reference to Exhibit 10.38 to theCompany’s report on Form 10-K for the year endedDecember 31, 2011.
10.29** Form of Barnes Group Inc. Stock and IncentiveAward Plan Restricted Stock Unit Summary of Grantand Restricted Stock Unit Agreement for Directorsdated May 9, 2014 (for non-management directors).
Incorporated by reference to Exhibit 10.2 to theCompany’s report on Form 10-Q for the quarterended June 30, 2014.
10.30** Form of Non-Qualified Stock Option Agreement foremployees grade 21 and up.
Incorporated by reference to Exhibit 10.25 to theCompany’s Form 10-K for the year endedDecember 31, 2008.
85

Exhibit No. Description Reference
10.31** Form of Barnes Group Inc. Stock and IncentiveAward Plan Stock Option Summary of Grant andStock Option Agreement for employees in grade 21and up dated as of February 8, 2011.
Incorporated by reference to Exhibit 10.1 to theCompany’s report on Form 10-Q for the quarterended March 31, 2011.
10.32** Form of Barnes Group Inc. Stock and IncentiveAward Plan Stock Option Summary of Grant andStock Option Agreement for Employees in Grade 21and up dated May 9, 2014.
Incorporated by reference to Exhibit 10.4 to theCompany’s report on Form 10-Q for the quarterended June 30, 2014.
10.33** Form of Barnes Group Inc. Stock and IncentiveAward Plan Restricted Stock Unit Summary of Grantand Restricted Stock Unit Agreement for employeesgrade 21 and up dated as of February 8, 2011.
Incorporated by reference to Exhibit 10.1 to theCompany’s report on Form 10-Q for the quarterended March 31, 2011.
10.34** Form of Barnes Group Inc. Stock and IncentiveAward Plan Restricted Stock Unit Summary of Grantfor Employees and Restricted Stock Unit Agreementdated February 8, 2012.
Incorporated by reference to Exhibit 10.37 to theCompany’s report on Form 10-K for the year endedDecember 31, 2011.
10.35** Form of Barnes Group Inc. Stock and IncentiveAward Plan Restricted Stock Unit Summary of Grantfor Employees and Restricted Stock Unit Agreementdated May 9, 2014.
Incorporated by reference to Exhibit 10.3 to theCompany’s report on Form 10-Q for the quarterended June 30, 2014.
10.36** Form of Barnes Group Inc. Stock and IncentiveAward Plan Performance Share Award Summary ofGrant and Performance Share Award Agreement forOfficers and Other Individuals as Designated by theCompensation and Management DevelopmentCommittee dated as of February 8, 2011.
Incorporated by reference to Exhibit 10.1 to theCompany’s report on Form 10-Q for the quarterended March 31, 2011.
10.37** Form of Barnes Group Inc. Stock and IncentiveAward Plan Performance Share Award Summary ofGrant and Performance Share Award Agreement forOfficers and Other Individuals as Designated by theCompensation and Management DevelopmentCommittee dated as of February 8, 2012.
Incorporated by reference to Exhibit 10.36 to theCompany’s report on Form 10-K for the year endedDecember 31, 2011.
10.38** Form of Barnes Group Inc. Stock and IncentiveAward Plan Performance Share Award Summary ofGrant and Performance Share Award Agreement forOfficers and Other Individuals as Designated by theCompensation and Management DevelopmentCommittee dated as of February 11, 2014.
Incorporated by reference to Exhibit 10.36 to theCompany’s report on Form 10-K for the year endedDecember 31, 2013.
10.39** Form of Barnes Group Inc. Stock and IncentiveAward Plan Performance Share Award Summary ofGrant and Performance Share Award Agreement forOfficers and Other Individuals as Designated by theCompensation and Management DevelopmentCommittee dated July 21, 2014.
Incorporated by reference to Exhibit 10.5 to theCompany’s report on Form 10-Q for the quarterended June 30, 2014.
10.40* Form of Barnes Group Inc. Stock and IncentiveAward Plan Performance Share Award Summary ofGrant and Performance Share Award Agreement forOfficers and Other Individuals as Designated by theCompensation and Management DevelopmentCommittee dated as of February 11, 2015.
Filed with this report.
86
Exhibit No. Description Reference
10.41** Form of Non-Qualified Stock Option Agreement forCEO (Gregory Milzcik).
Incorporated by reference to Exhibit 10.24 to theCompany’s Form 10-K for the year endedDecember 31, 2008.
10.42** Form of Amended and Restated Restricted Stock UnitAward Agreement for CEO (Gregory Milzcik).
Incorporated by reference to Exhibit 10.26 to theCompany’s Form 10-K for the year endedDecember 31, 2008.
10.43** Form of Amended and Restated Performance ShareAward Agreement for CEO (Gregory Milzcik).
Incorporated by reference to Exhibit 10.30 to theCompany’s Form 10-K for the year endedDecember 31, 2008.
10.44** Form of Amended and Restated Contingent DividendEquivalent Rights Agreement for CEO (GregoryMilzcik).
Incorporated by reference to Exhibit 10.31 to theCompany’s Form 10-K for the year endedDecember 31, 2008.
21 List of Subsidiaries. Filed with this report.
23 Consent of Independent Registered PublicAccounting Firm.
Filed with this report.
31.1 Certification pursuant to Section 302 of the Sarbanes-Oxley Act of 2002.
Filed with this report.
31.2 Certification pursuant to Section 302 of the Sarbanes-Oxley Act of 2002.
Filed with this report.
32 Certification pursuant to 18 U.S.C. Section 1350 asadopted pursuant to Section 906 of the Sarbanes-Oxley Act of 2002.
Furnished with this report.
101.INS XBRL Instance Document. Filed with this report.
101.SCH XBRL Taxonomy Extension Schema Document. Filed with this report.
101.CAL XBRL Taxonomy Extension Calculation LinkbaseDocument.
Filed with this report.
101.DEF XBRL Taxonomy Extension Definition LinkbaseDocument.
Filed with this report.
101.LAB XBRL Taxonomy Extension Label LinkbaseDocument.
Filed with this report.
101.PRE XBRL Taxonomy Extension Presentation LinkbaseDocument.
Filed with this report.
* The Company hereby agrees to provide the Commission upon request copies of any omitted exhibits or schedules to this exhibit required byItem 601(b)(2) of Regulation S-K.
** Management contract or compensatory plan or arrangement.
The Company agrees to furnish to the Commission, upon request, a copy of each instrument with respect to which thereare outstanding issues of unregistered long-term debt of the Company and its subsidiaries, the authorized principal amount ofwhich does not exceed 10% of the total assets of the Company and its subsidiaries on a consolidated basis.
87

[THIS PAGE INTENTIONALLY LEFT BLANK]
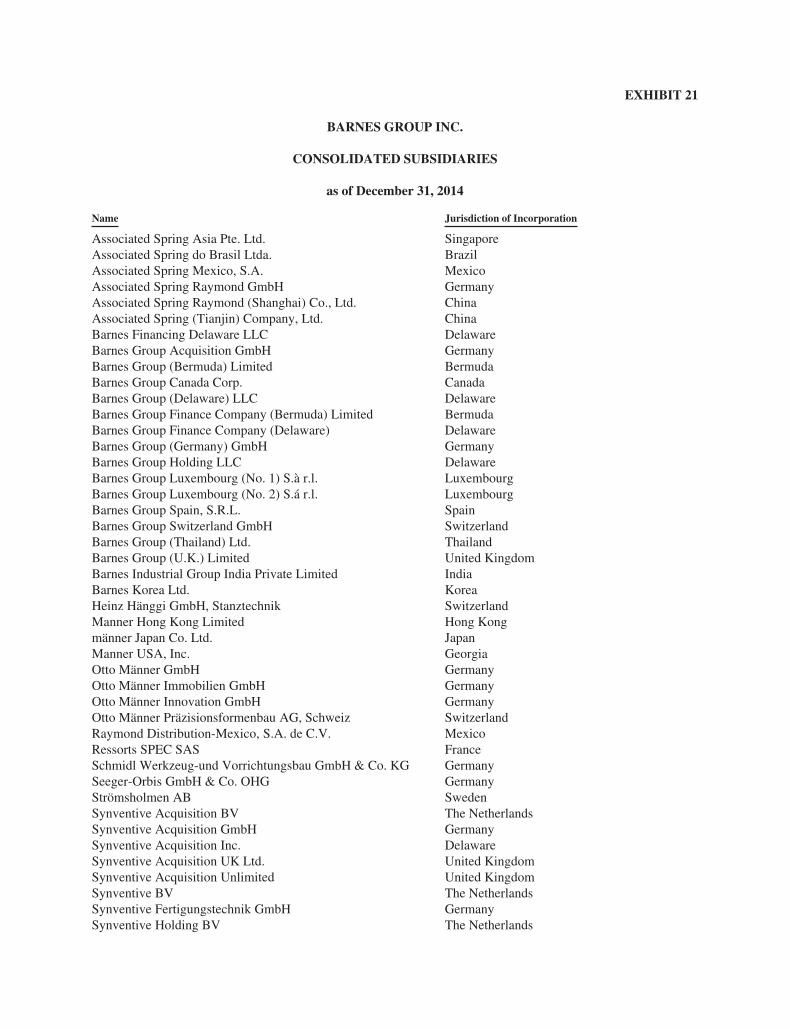
EXHIBIT 21
BARNES GROUP INC.
CONSOLIDATED SUBSIDIARIES
as of December 31, 2014
Name Jurisdiction of Incorporation
Associated Spring Asia Pte. Ltd. SingaporeAssociated Spring do Brasil Ltda. BrazilAssociated Spring Mexico, S.A. MexicoAssociated Spring Raymond GmbH GermanyAssociated Spring Raymond (Shanghai) Co., Ltd. ChinaAssociated Spring (Tianjin) Company, Ltd. ChinaBarnes Financing Delaware LLC DelawareBarnes Group Acquisition GmbH GermanyBarnes Group (Bermuda) Limited BermudaBarnes Group Canada Corp. CanadaBarnes Group (Delaware) LLC DelawareBarnes Group Finance Company (Bermuda) Limited BermudaBarnes Group Finance Company (Delaware) DelawareBarnes Group (Germany) GmbH GermanyBarnes Group Holding LLC DelawareBarnes Group Luxembourg (No. 1) S.à r.l. LuxembourgBarnes Group Luxembourg (No. 2) S.á r.l. LuxembourgBarnes Group Spain, S.R.L. SpainBarnes Group Switzerland GmbH SwitzerlandBarnes Group (Thailand) Ltd. ThailandBarnes Group (U.K.) Limited United KingdomBarnes Industrial Group India Private Limited IndiaBarnes Korea Ltd. KoreaHeinz Hänggi GmbH, Stanztechnik SwitzerlandManner Hong Kong Limited Hong Kongmänner Japan Co. Ltd. JapanManner USA, Inc. GeorgiaOtto Männer GmbH GermanyOtto Männer Immobilien GmbH GermanyOtto Männer Innovation GmbH GermanyOtto Männer Präzisionsformenbau AG, Schweiz SwitzerlandRaymond Distribution-Mexico, S.A. de C.V. MexicoRessorts SPEC SAS FranceSchmidl Werkzeug-und Vorrichtungsbau GmbH & Co. KG GermanySeeger-Orbis GmbH & Co. OHG GermanyStrömsholmen AB SwedenSynventive Acquisition BV The NetherlandsSynventive Acquisition GmbH GermanySynventive Acquisition Inc. DelawareSynventive Acquisition UK Ltd. United KingdomSynventive Acquisition Unlimited United KingdomSynventive BV The NetherlandsSynventive Fertigungstechnik GmbH GermanySynventive Holding BV The Netherlands
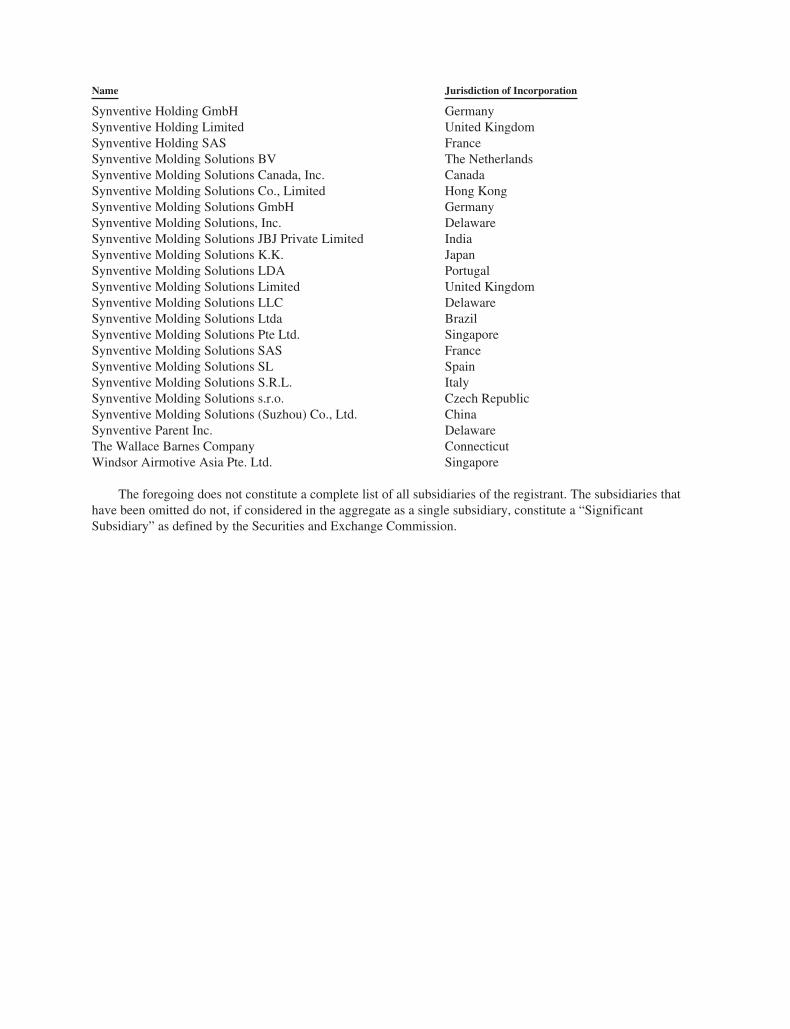
Name Jurisdiction of Incorporation
Synventive Holding GmbH GermanySynventive Holding Limited United KingdomSynventive Holding SAS FranceSynventive Molding Solutions BV The NetherlandsSynventive Molding Solutions Canada, Inc. CanadaSynventive Molding Solutions Co., Limited Hong KongSynventive Molding Solutions GmbH GermanySynventive Molding Solutions, Inc. DelawareSynventive Molding Solutions JBJ Private Limited IndiaSynventive Molding Solutions K.K. JapanSynventive Molding Solutions LDA PortugalSynventive Molding Solutions Limited United KingdomSynventive Molding Solutions LLC DelawareSynventive Molding Solutions Ltda BrazilSynventive Molding Solutions Pte Ltd. SingaporeSynventive Molding Solutions SAS FranceSynventive Molding Solutions SL SpainSynventive Molding Solutions S.R.L. ItalySynventive Molding Solutions s.r.o. Czech RepublicSynventive Molding Solutions (Suzhou) Co., Ltd. ChinaSynventive Parent Inc. DelawareThe Wallace Barnes Company ConnecticutWindsor Airmotive Asia Pte. Ltd. Singapore
The foregoing does not constitute a complete list of all subsidiaries of the registrant. The subsidiaries thathave been omitted do not, if considered in the aggregate as a single subsidiary, constitute a “SignificantSubsidiary” as defined by the Securities and Exchange Commission.
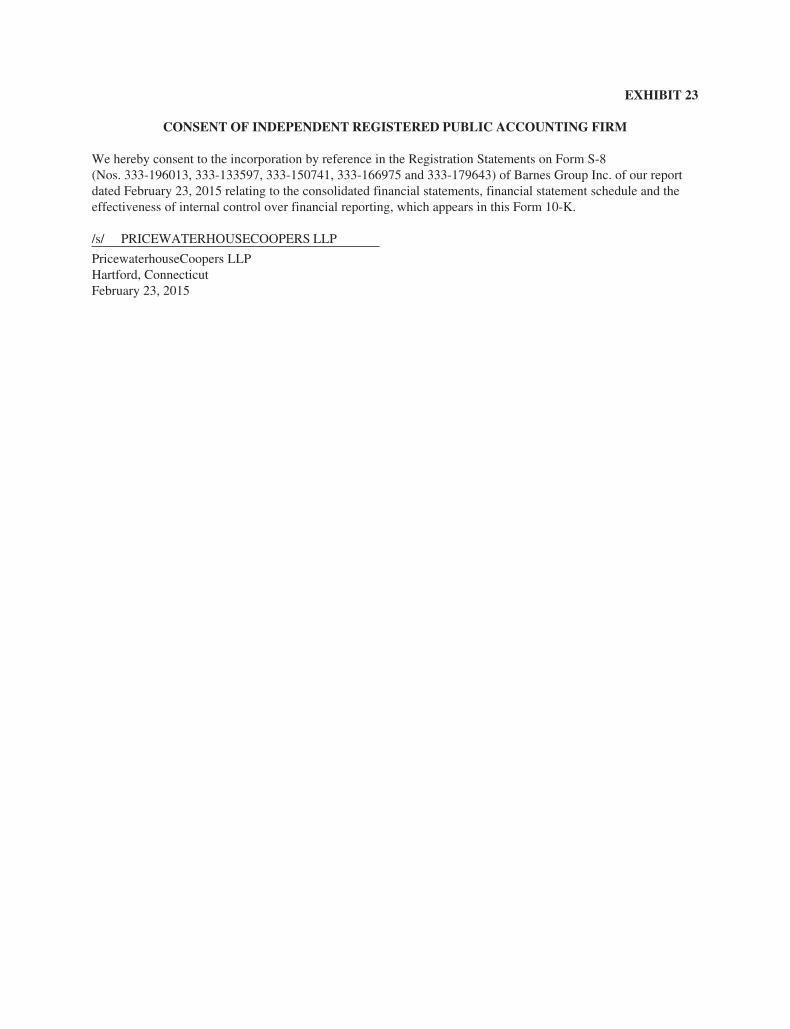
EXHIBIT 23
CONSENT OF INDEPENDENT REGISTERED PUBLIC ACCOUNTING FIRM
We hereby consent to the incorporation by reference in the Registration Statements on Form S-8(Nos. 333-196013, 333-133597, 333-150741, 333-166975 and 333-179643) of Barnes Group Inc. of our reportdated February 23, 2015 relating to the consolidated financial statements, financial statement schedule and theeffectiveness of internal control over financial reporting, which appears in this Form 10-K.
/s/ PRICEWATERHOUSECOOPERS LLP
PricewaterhouseCoopers LLPHartford, ConnecticutFebruary 23, 2015

ABOUT THE COMPANYBOARD OF DIRECTORSThomas O. BarnesChairman of the Board,Barnes Group Inc.
Gary G. BenanavFormer Chairman and ChiefExecutive Officer, New York LifeInternational, LLCFormer Vice Chairman, New YorkLife Insurance Company, LLC
William S. Bristow, Jr.President, W.S. Bristow &Associates, Inc.
Patrick J. DempseyPresident and Chief ExecutiveOfficer, Barnes Group Inc.
Francis J. KramerPresident and Chief ExecutiveOfficer, II-VI Incorporated
Mylle H. MagnumChief Executive Officer, IBTEnterprises, LLC
Hassell H. McClellanFormer Associate Professor ofFinance and Policy, BostonCollege’s Wallace E. CarrollSchool of Management
William J. MorganFormer Partner, KPMG LLP
JoAnna L. SohovichGlobal President, StanleyEngineered Fastening, Stanley Black& Decker, Inc.
OFFICERSPatrick J. DempseyPresident and Chief ExecutiveOfficer
Marian AckerVice President, Controller
Richard R. BarnhartSenior Vice President,Barnes Group Inc. and President,Barnes Aerospace
Dawn N. EdwardsSenior Vice President,Human Resources
Kenneth R. HopsonVice President, Treasurer
Lukas HovorkaVice President, CorporateDevelopment
Gregory A. MarshallVice President, Tax
Scott A. MayoSenior Vice President,Barnes Group Inc. and President,Barnes Industrial
Christopher J. Stephens, Jr.Senior Vice President, Finance andChief Financial Officer
CORPORATE INFORMATIONTransfer Agent and RegistrarComputershareP.O. Box 30170College Station, TX 77842-3170Phone: 1-800-801-9519
(Continental U.S. only)Phone: 1-201-680-6578
(Outside U.S.)For the hearing impaired: 1-800-231-5469
(Continental U.S. only)1-201-680-6610 (Outside U.S.)www.computershare.com/investor
Use the above address, phone numbers andInternet address for information about thefollowing services:Direct Deposit of Dividends, StockholdersInquiries, Change of Name or Address,Consolidations, Lost Certificates, Replacement.
Direct Stock Purchase Plan/Dividend ReinvestmentInitial purchases of Barnes Group commonstock can be made through the Direct StockPurchase Plan. Dividends on Barnes Groupcommon stock may be automatically investedin additional shares.
Stock ExchangeNew York Stock ExchangeStock Trading Symbol: B
Independent Registered PublicAccounting FirmPricewaterhouseCoopers LLP185 Asylum Street, Hartford, CT 06103
CommunicationsFor press releases and other information aboutthe Company, go to our Internet address atwww.BGInc.com or contact:William E. Pitts (Investor Relations)/Monique B. Marchetti (Stockholder Relations)/Frederica K. Crea (Corporate Communications)
Barnes Group Inc.123 Main StreetBristol, CT 06010-6376 USAPhone: 1-860-583-7070
ANNUAL MEETINGThe Barnes Group Inc. Annual Meeting of Stockholders will be held at 11:00 a.m., Friday, May 8, 2015, at the HartfordMarriott Downtown, Hartford, Connecticut.


Corporate Office123 Main StreetBristol, CT 06010-6376USABGInc.com
90919_AR_Cover.indd 1 3/4/15 6:10 PM