Embed Size (px)
Citation preview

Talking Points Volcanoes and Volcanic Ash Part 1
Slide 1 - Title Page and intro to authors.
Jeff Braun – Research Associate Cooperative Institute for Research in the Atmosphere (CIRA)
Jeff Osiensky - Deputy Chief, Environmental & Scientific Services Division (ESSD), NWS Alaska Region
Bernie Connell – CIRA/SHyMet – SHyMet Program Leader
Kristine Nelson – NWS Alaska Region (AR) – MIC Anchorage Center Weather Service Unit (CWSU)
Tony Hall – NWS AR – MIC Alaskan Aviation Weather Unit
Slide 2 (6) – WHY?
Slide 2, Page 2 - Volcanic Ash and Aviation Safety: Proceedings of the First International Symposium on
Volcanic Ash and Aviation Safety – 1991 - Introductory Remarks by Donald D. Engen
(Vice Admiral) Donald D. Engen – a legend in aviation, aviation education, and aviation history. U.S.
Navy from 1942 (as a Seaman Second Class) - retiring in 1978 as a Vice Admiral. Also, – General
Manager of the Piper Aircraft Corporation – a member of the National Transportation Board; appointed
Administrator of the Federal Aviation Administration by President Ronald Reagan, and was also
appointed Director of the Smithsonian Air and Space Museum, where he served until his death (1999 –
glider accident).
Slide 2, Page 3 – What to call this volcano? Eyjafjallajökull - phonetically “Eye a Fyat la yu goot”
However, this volcano is also known as “Eyjafjöll” which is pronounced “Eva logue” And finally, this
volcano is, thankfully, also known as “E15.” (or the basic “Iceland Volcano”).
Some statistics concerning Eyjafjallajökull volcano. The volcano in Iceland erupts explosively April 14
after a two day hiatus (originally beginning rather benignly March 20, 2010).
Point 1: That translates to nearly $200 million loss per day
Point 2: That represents 10 percent of the entire global air traffic system!
Point 3: (65,000 in the ten day period mentioned above) throughout Europe
Point 5: In locations far from the erupting volcano, (ie the United States, India, and southeast Asia),
travel was significantly affected.
Slide 2, Page 4 – From USGS. Relatively large area affected - Mount St. Helens Ash Distribution from
(just) the May 18th Eruption.
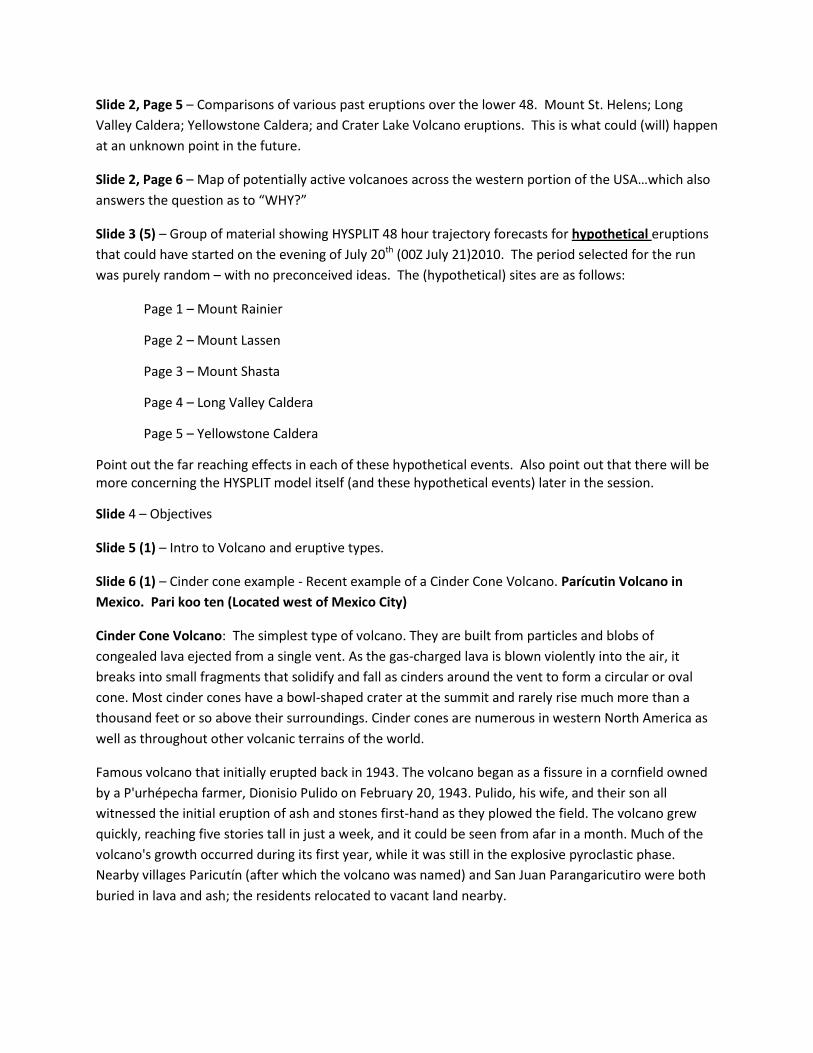
Slide 2, Page 5 – Comparisons of various past eruptions over the lower 48. Mount St. Helens; Long
Valley Caldera; Yellowstone Caldera; and Crater Lake Volcano eruptions. This is what could (will) happen
at an unknown point in the future.
Slide 2, Page 6 – Map of potentially active volcanoes across the western portion of the USA…which also
answers the question as to “WHY?”
Slide 3 (5) – Group of material showing HYSPLIT 48 hour trajectory forecasts for hypothetical eruptions
that could have started on the evening of July 20th (00Z July 21)2010. The period selected for the run
was purely random – with no preconceived ideas. The (hypothetical) sites are as follows:
Page 1 – Mount Rainier
Page 2 – Mount Lassen
Page 3 – Mount Shasta
Page 4 – Long Valley Caldera
Page 5 – Yellowstone Caldera
Point out the far reaching effects in each of these hypothetical events. Also point out that there will be more concerning the HYSPLIT model itself (and these hypothetical events) later in the session.
Slide 4 – Objectives
Slide 5 (1) – Intro to Volcano and eruptive types.
Slide 6 (1) – Cinder cone example - Recent example of a Cinder Cone Volcano. Parícutin Volcano in
Mexico. Pari koo ten (Located west of Mexico City)
Cinder Cone Volcano: The simplest type of volcano. They are built from particles and blobs of
congealed lava ejected from a single vent. As the gas-charged lava is blown violently into the air, it
breaks into small fragments that solidify and fall as cinders around the vent to form a circular or oval
cone. Most cinder cones have a bowl-shaped crater at the summit and rarely rise much more than a
thousand feet or so above their surroundings. Cinder cones are numerous in western North America as
well as throughout other volcanic terrains of the world.
Famous volcano that initially erupted back in 1943. The volcano began as a fissure in a cornfield owned
by a P'urhépecha farmer, Dionisio Pulido on February 20, 1943. Pulido, his wife, and their son all
witnessed the initial eruption of ash and stones first-hand as they plowed the field. The volcano grew
quickly, reaching five stories tall in just a week, and it could be seen from afar in a month. Much of the
volcano's growth occurred during its first year, while it was still in the explosive pyroclastic phase.
Nearby villages Paricutín (after which the volcano was named) and San Juan Parangaricutiro were both
buried in lava and ash; the residents relocated to vacant land nearby.
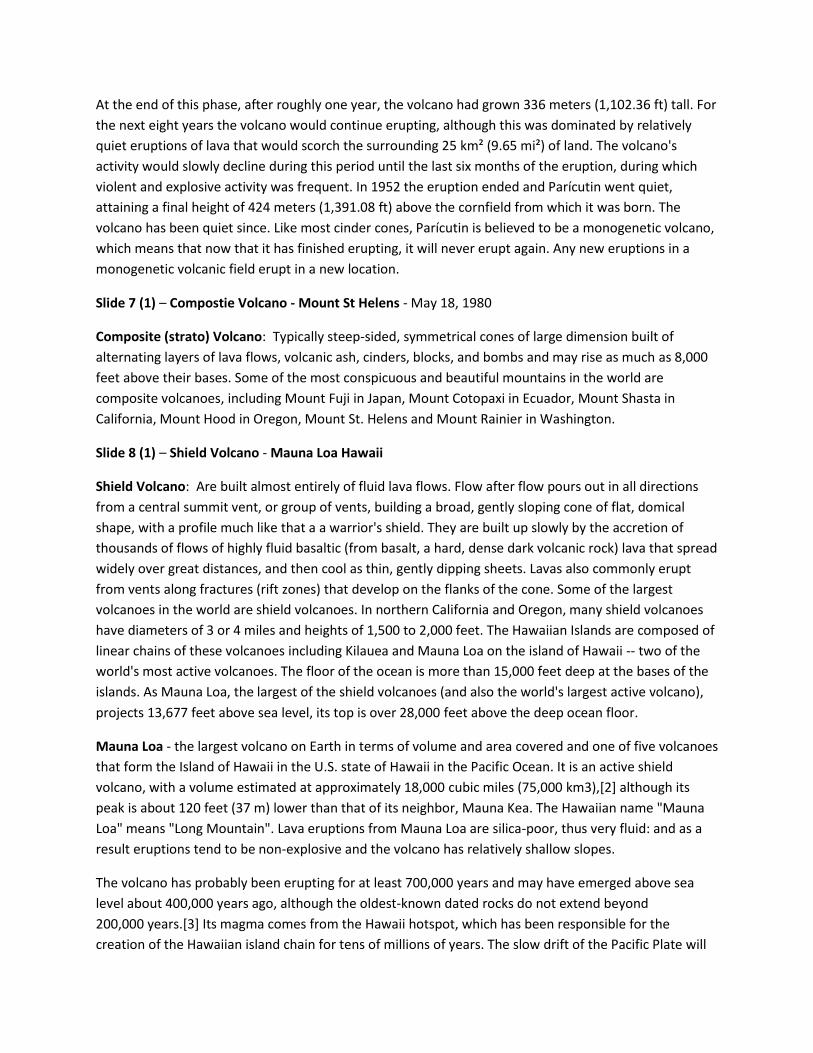
At the end of this phase, after roughly one year, the volcano had grown 336 meters (1,102.36 ft) tall. For
the next eight years the volcano would continue erupting, although this was dominated by relatively
quiet eruptions of lava that would scorch the surrounding 25 km² (9.65 mi²) of land. The volcano's
activity would slowly decline during this period until the last six months of the eruption, during which
violent and explosive activity was frequent. In 1952 the eruption ended and Parícutin went quiet,
attaining a final height of 424 meters (1,391.08 ft) above the cornfield from which it was born. The
volcano has been quiet since. Like most cinder cones, Parícutin is believed to be a monogenetic volcano,
which means that now that it has finished erupting, it will never erupt again. Any new eruptions in a
monogenetic volcanic field erupt in a new location.
Slide 7 (1) – Compostie Volcano - Mount St Helens - May 18, 1980
Composite (strato) Volcano: Typically steep-sided, symmetrical cones of large dimension built of
alternating layers of lava flows, volcanic ash, cinders, blocks, and bombs and may rise as much as 8,000
feet above their bases. Some of the most conspicuous and beautiful mountains in the world are
composite volcanoes, including Mount Fuji in Japan, Mount Cotopaxi in Ecuador, Mount Shasta in
California, Mount Hood in Oregon, Mount St. Helens and Mount Rainier in Washington.
Slide 8 (1) – Shield Volcano - Mauna Loa Hawaii
Shield Volcano: Are built almost entirely of fluid lava flows. Flow after flow pours out in all directions
from a central summit vent, or group of vents, building a broad, gently sloping cone of flat, domical
shape, with a profile much like that a a warrior's shield. They are built up slowly by the accretion of
thousands of flows of highly fluid basaltic (from basalt, a hard, dense dark volcanic rock) lava that spread
widely over great distances, and then cool as thin, gently dipping sheets. Lavas also commonly erupt
from vents along fractures (rift zones) that develop on the flanks of the cone. Some of the largest
volcanoes in the world are shield volcanoes. In northern California and Oregon, many shield volcanoes
have diameters of 3 or 4 miles and heights of 1,500 to 2,000 feet. The Hawaiian Islands are composed of
linear chains of these volcanoes including Kilauea and Mauna Loa on the island of Hawaii -- two of the
world's most active volcanoes. The floor of the ocean is more than 15,000 feet deep at the bases of the
islands. As Mauna Loa, the largest of the shield volcanoes (and also the world's largest active volcano),
projects 13,677 feet above sea level, its top is over 28,000 feet above the deep ocean floor.
Mauna Loa - the largest volcano on Earth in terms of volume and area covered and one of five volcanoes
that form the Island of Hawaii in the U.S. state of Hawaii in the Pacific Ocean. It is an active shield
volcano, with a volume estimated at approximately 18,000 cubic miles (75,000 km3),[2] although its
peak is about 120 feet (37 m) lower than that of its neighbor, Mauna Kea. The Hawaiian name "Mauna
Loa" means "Long Mountain". Lava eruptions from Mauna Loa are silica-poor, thus very fluid: and as a
result eruptions tend to be non-explosive and the volcano has relatively shallow slopes.
The volcano has probably been erupting for at least 700,000 years and may have emerged above sea
level about 400,000 years ago, although the oldest-known dated rocks do not extend beyond
200,000 years.[3] Its magma comes from the Hawaii hotspot, which has been responsible for the
creation of the Hawaiian island chain for tens of millions of years. The slow drift of the Pacific Plate will
eventually carry the volcano away from the hotspot, and the volcano will then become extinct within
500,000 to one million years from now.
Slide 9 (1) –Eruption Types:
Definitions:
Info from “Volcanoes” by Peter Francis and Clive Oppenheimer
Large volume basaltic eruptions are almost exclusively effusive (these types of eruptions are the ones
you can walk up to and observe on your vacation, Poas volcano in Costa Rica, etc. Large volume silicate
eruptions are almost exclusively explosive. (the ones that come to mind are recent the Okmok and
Kasatochi volcanoes in Alaska, the Chaiten volcano in Chile, and of course, the eruption of Mt. Saint
Helens in 1980). For the most part, we are primarily concerned with volcanic eruptions that exhibit
explosive activity.
Slide 10 (1) – Eruption Mechanisms:
Phreatic eruption (explosion): An explosive volcanic eruption caused when water and heated volcanic
rocks interact to produce a violent expulsion of steam and pulverized rocks. Magma is not involved.
Example: Mount Saint Helens.
Phreatomagmatic eruptions: are defined by the interaction between water and magma, providing for
explosive thermal contraction of magmatic particles under rapid cooling from contact with water.
Example: Mount Okmok.
Magmatic eruptions: eruptions caused by rapid decompression of the magma - therefore releasing
dissoved gases quickly (explosively) causing familiar fountains and flowing associated with shield
volcanoes. Example: Mauna Loa.
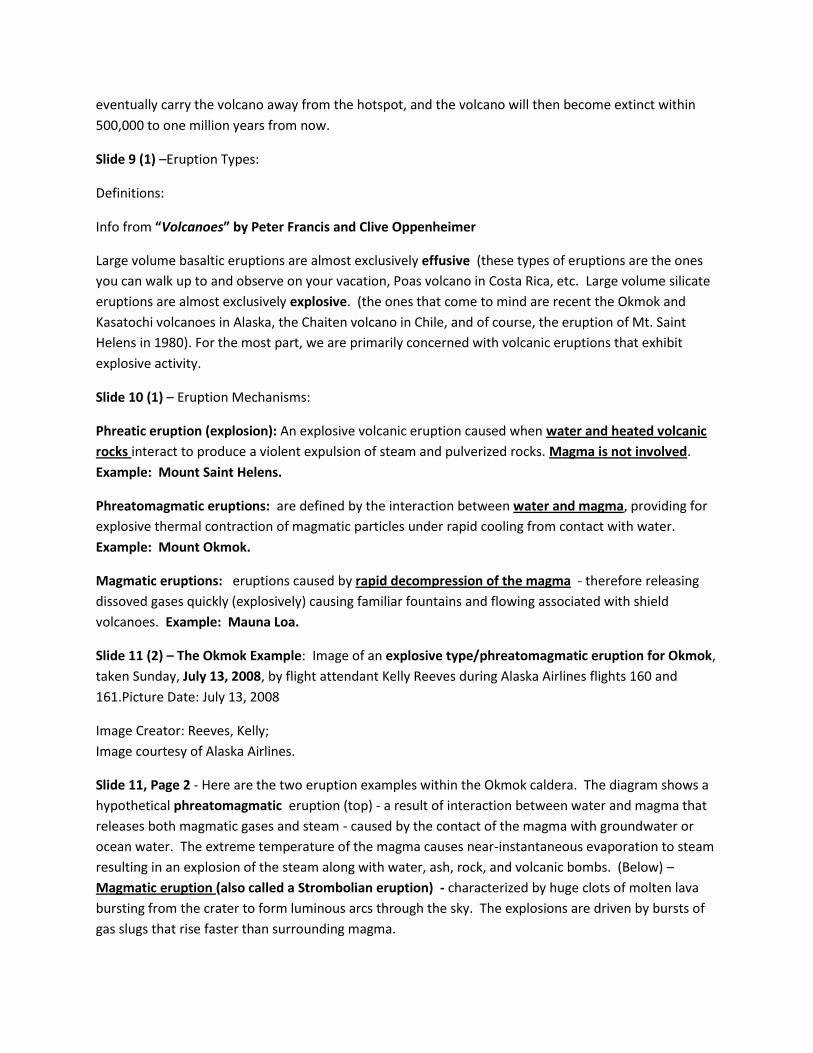
Slide 11 (2) – The Okmok Example: Image of an explosive type/phreatomagmatic eruption for Okmok,
taken Sunday, July 13, 2008, by flight attendant Kelly Reeves during Alaska Airlines flights 160 and
161.Picture Date: July 13, 2008
Image Creator: Reeves, Kelly;
Image courtesy of Alaska Airlines.
Slide 11, Page 2 - Here are the two eruption examples within the Okmok caldera. The diagram shows a
hypothetical phreatomagmatic eruption (top) - a result of interaction between water and magma that
releases both magmatic gases and steam - caused by the contact of the magma with groundwater or
ocean water. The extreme temperature of the magma causes near-instantaneous evaporation to steam
resulting in an explosion of the steam along with water, ash, rock, and volcanic bombs. (Below) –
Magmatic eruption (also called a Strombolian eruption) - characterized by huge clots of molten lava
bursting from the crater to form luminous arcs through the sky. The explosions are driven by bursts of
gas slugs that rise faster than surrounding magma.
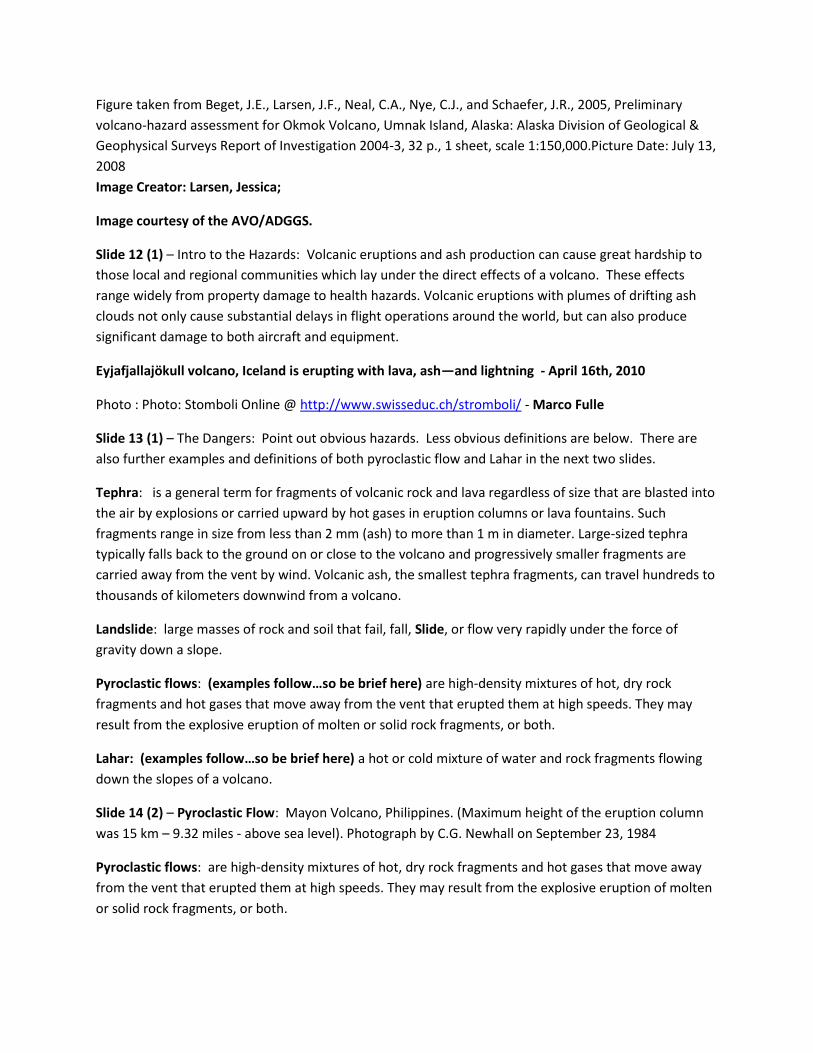
Figure taken from Beget, J.E., Larsen, J.F., Neal, C.A., Nye, C.J., and Schaefer, J.R., 2005, Preliminary
volcano-hazard assessment for Okmok Volcano, Umnak Island, Alaska: Alaska Division of Geological &
Geophysical Surveys Report of Investigation 2004-3, 32 p., 1 sheet, scale 1:150,000.Picture Date: July 13,
2008
Image Creator: Larsen, Jessica;
Image courtesy of the AVO/ADGGS.
Slide 12 (1) – Intro to the Hazards: Volcanic eruptions and ash production can cause great hardship to
those local and regional communities which lay under the direct effects of a volcano. These effects
range widely from property damage to health hazards. Volcanic eruptions with plumes of drifting ash
clouds not only cause substantial delays in flight operations around the world, but can also produce
significant damage to both aircraft and equipment.
Eyjafjallajökull volcano, Iceland is erupting with lava, ash—and lightning - April 16th, 2010
Photo : Photo: Stomboli Online @ http://www.swisseduc.ch/stromboli/ - Marco Fulle
Slide 13 (1) – The Dangers: Point out obvious hazards. Less obvious definitions are below. There are
also further examples and definitions of both pyroclastic flow and Lahar in the next two slides.
Tephra: is a general term for fragments of volcanic rock and lava regardless of size that are blasted into
the air by explosions or carried upward by hot gases in eruption columns or lava fountains. Such
fragments range in size from less than 2 mm (ash) to more than 1 m in diameter. Large-sized tephra
typically falls back to the ground on or close to the volcano and progressively smaller fragments are
carried away from the vent by wind. Volcanic ash, the smallest tephra fragments, can travel hundreds to
thousands of kilometers downwind from a volcano.
Landslide: large masses of rock and soil that fail, fall, Slide, or flow very rapidly under the force of
gravity down a slope.
Pyroclastic flows: (examples follow…so be brief here) are high-density mixtures of hot, dry rock
fragments and hot gases that move away from the vent that erupted them at high speeds. They may
result from the explosive eruption of molten or solid rock fragments, or both.
Lahar: (examples follow…so be brief here) a hot or cold mixture of water and rock fragments flowing
down the slopes of a volcano.
Slide 14 (2) – Pyroclastic Flow: Mayon Volcano, Philippines. (Maximum height of the eruption column
was 15 km – 9.32 miles - above sea level). Photograph by C.G. Newhall on September 23, 1984
Pyroclastic flows: are high-density mixtures of hot, dry rock fragments and hot gases that move away
from the vent that erupted them at high speeds. They may result from the explosive eruption of molten
or solid rock fragments, or both.
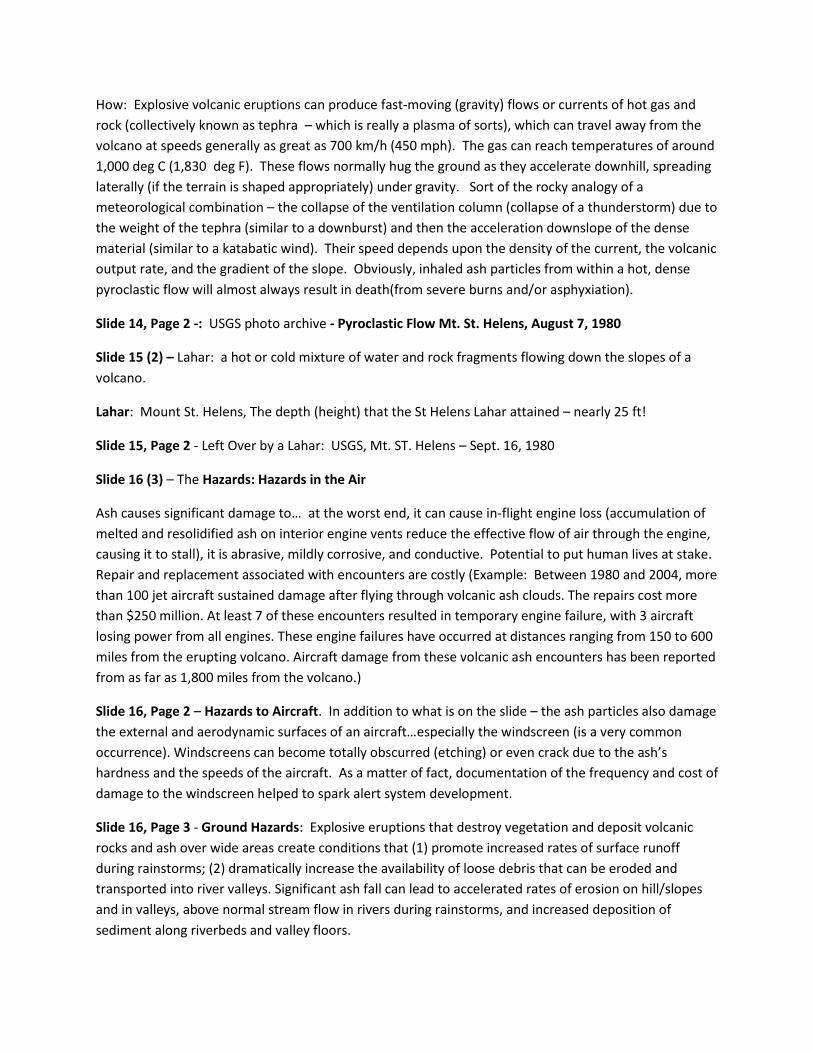
How: Explosive volcanic eruptions can produce fast-moving (gravity) flows or currents of hot gas and
rock (collectively known as tephra – which is really a plasma of sorts), which can travel away from the
volcano at speeds generally as great as 700 km/h (450 mph). The gas can reach temperatures of around
1,000 deg C (1,830 deg F). These flows normally hug the ground as they accelerate downhill, spreading
laterally (if the terrain is shaped appropriately) under gravity. Sort of the rocky analogy of a
meteorological combination – the collapse of the ventilation column (collapse of a thunderstorm) due to
the weight of the tephra (similar to a downburst) and then the acceleration downslope of the dense
material (similar to a katabatic wind). Their speed depends upon the density of the current, the volcanic
output rate, and the gradient of the slope. Obviously, inhaled ash particles from within a hot, dense
pyroclastic flow will almost always result in death(from severe burns and/or asphyxiation).
Slide 14, Page 2 -: USGS photo archive - Pyroclastic Flow Mt. St. Helens, August 7, 1980
Slide 15 (2) – Lahar: a hot or cold mixture of water and rock fragments flowing down the slopes of a
volcano.
Lahar: Mount St. Helens, The depth (height) that the St Helens Lahar attained – nearly 25 ft!
Slide 15, Page 2 - Left Over by a Lahar: USGS, Mt. ST. Helens – Sept. 16, 1980
Slide 16 (3) – The Hazards: Hazards in the Air
Ash causes significant damage to… at the worst end, it can cause in-flight engine loss (accumulation of
melted and resolidified ash on interior engine vents reduce the effective flow of air through the engine,
causing it to stall), it is abrasive, mildly corrosive, and conductive. Potential to put human lives at stake.
Repair and replacement associated with encounters are costly (Example: Between 1980 and 2004, more
than 100 jet aircraft sustained damage after flying through volcanic ash clouds. The repairs cost more
than $250 million. At least 7 of these encounters resulted in temporary engine failure, with 3 aircraft
losing power from all engines. These engine failures have occurred at distances ranging from 150 to 600
miles from the erupting volcano. Aircraft damage from these volcanic ash encounters has been reported
from as far as 1,800 miles from the volcano.)
Slide 16, Page 2 – Hazards to Aircraft. In addition to what is on the slide – the ash particles also damage
the external and aerodynamic surfaces of an aircraft…especially the windscreen (is a very common
occurrence). Windscreens can become totally obscurred (etching) or even crack due to the ash’s
hardness and the speeds of the aircraft. As a matter of fact, documentation of the frequency and cost of
damage to the windscreen helped to spark alert system development.
Slide 16, Page 3 - Ground Hazards: Explosive eruptions that destroy vegetation and deposit volcanic
rocks and ash over wide areas create conditions that (1) promote increased rates of surface runoff
during rainstorms; (2) dramatically increase the availability of loose debris that can be eroded and
transported into river valleys. Significant ash fall can lead to accelerated rates of erosion on hill/slopes
and in valleys, above normal stream flow in rivers during rainstorms, and increased deposition of
sediment along riverbeds and valley floors.
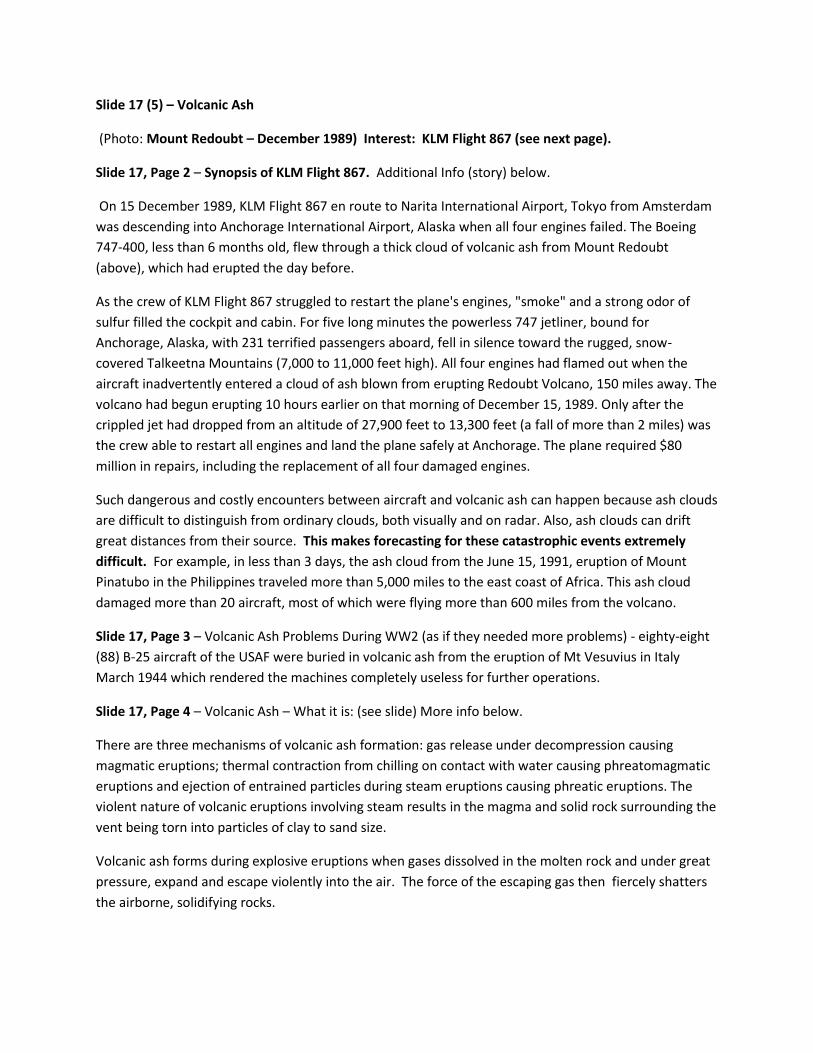
Slide 17 (5) – Volcanic Ash
(Photo: Mount Redoubt – December 1989) Interest: KLM Flight 867 (see next page).
Slide 17, Page 2 – Synopsis of KLM Flight 867. Additional Info (story) below.
On 15 December 1989, KLM Flight 867 en route to Narita International Airport, Tokyo from Amsterdam
was descending into Anchorage International Airport, Alaska when all four engines failed. The Boeing
747-400, less than 6 months old, flew through a thick cloud of volcanic ash from Mount Redoubt
(above), which had erupted the day before.
As the crew of KLM Flight 867 struggled to restart the plane's engines, "smoke" and a strong odor of
sulfur filled the cockpit and cabin. For five long minutes the powerless 747 jetliner, bound for
Anchorage, Alaska, with 231 terrified passengers aboard, fell in silence toward the rugged, snow-
covered Talkeetna Mountains (7,000 to 11,000 feet high). All four engines had flamed out when the
aircraft inadvertently entered a cloud of ash blown from erupting Redoubt Volcano, 150 miles away. The
volcano had begun erupting 10 hours earlier on that morning of December 15, 1989. Only after the
crippled jet had dropped from an altitude of 27,900 feet to 13,300 feet (a fall of more than 2 miles) was
the crew able to restart all engines and land the plane safely at Anchorage. The plane required $80
million in repairs, including the replacement of all four damaged engines.
Such dangerous and costly encounters between aircraft and volcanic ash can happen because ash clouds
are difficult to distinguish from ordinary clouds, both visually and on radar. Also, ash clouds can drift
great distances from their source. This makes forecasting for these catastrophic events extremely
difficult. For example, in less than 3 days, the ash cloud from the June 15, 1991, eruption of Mount
Pinatubo in the Philippines traveled more than 5,000 miles to the east coast of Africa. This ash cloud
damaged more than 20 aircraft, most of which were flying more than 600 miles from the volcano.
Slide 17, Page 3 – Volcanic Ash Problems During WW2 (as if they needed more problems) - eighty-eight
(88) B-25 aircraft of the USAF were buried in volcanic ash from the eruption of Mt Vesuvius in Italy
March 1944 which rendered the machines completely useless for further operations.
Slide 17, Page 4 – Volcanic Ash – What it is: (see slide) More info below.
There are three mechanisms of volcanic ash formation: gas release under decompression causing
magmatic eruptions; thermal contraction from chilling on contact with water causing phreatomagmatic
eruptions and ejection of entrained particles during steam eruptions causing phreatic eruptions. The
violent nature of volcanic eruptions involving steam results in the magma and solid rock surrounding the
vent being torn into particles of clay to sand size.
Volcanic ash forms during explosive eruptions when gases dissolved in the molten rock and under great
pressure, expand and escape violently into the air. The force of the escaping gas then fiercely shatters
the airborne, solidifying rocks.
Once in the air, and due to acquired momentum along with buoyancy effects, the hot ash (and other
escaping gases) quickly rises and forms an eruption column that often reaches to more than 30,000 feet
in elevation.
Listed as “mostly” insoluble because although silica and other silica rich minerals will not dissolve in
water, many times the ejecta of volcanoes are coated in sulfide salts which will, through oxidation, form
corrosive sulfuric acid solutions. Also, in the atmosphere, sulfur dioxide will oxidize in the presence of
water to form falling acidic solutions…aka “acid rain.” These acidic solutions, along with the hard ash
itself (traveling at over 500 mph) can easily etch the cockpit windscreen…resulting in near total
obscuration.
Slide 17, Page 5 - Mount St. Helens’ ash cloud reached nearly 90,000 ft in about 30 minutes…well above
the trop/strat cap. Ash made its way around the world in about two weeks, with over 1000 commercial
flights cancelled (compared to over 60,000 flights in europe during the recent Eyjafjallajökull eruption).
While this was a much more violent eruption than that of Eyjafjallajökull, it happened in an area that
was rather remote (and with favorable weather patterns) to major airports – and allowed for relatively
easy re-routing of flights.
Slide 18 (1) – Volcanic Ash Hazards: see slide.
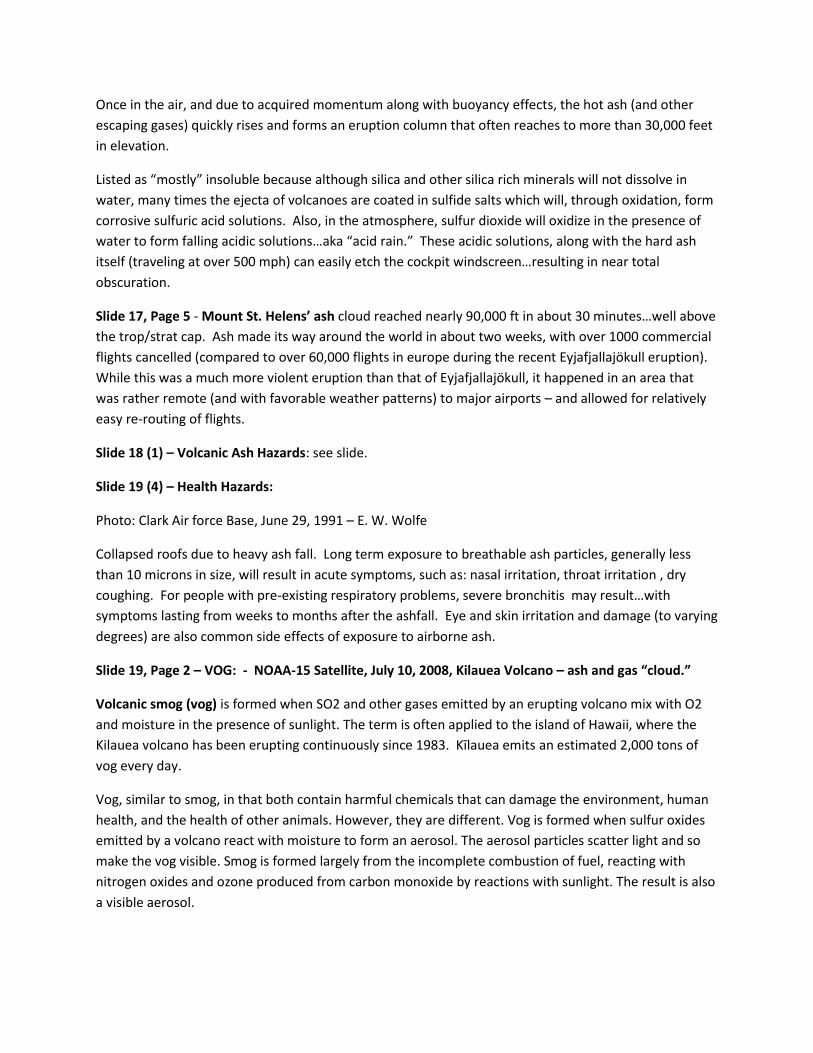
Slide 19 (4) – Health Hazards:
Photo: Clark Air force Base, June 29, 1991 – E. W. Wolfe
Collapsed roofs due to heavy ash fall. Long term exposure to breathable ash particles, generally less
than 10 microns in size, will result in acute symptoms, such as: nasal irritation, throat irritation , dry
coughing. For people with pre-existing respiratory problems, severe bronchitis may result…with
symptoms lasting from weeks to months after the ashfall. Eye and skin irritation and damage (to varying
degrees) are also common side effects of exposure to airborne ash.
Slide 19, Page 2 – VOG: - NOAA-15 Satellite, July 10, 2008, Kilauea Volcano – ash and gas “cloud.”
Volcanic smog (vog) is formed when SO2 and other gases emitted by an erupting volcano mix with O2
and moisture in the presence of sunlight. The term is often applied to the island of Hawaii, where the
Kilauea volcano has been erupting continuously since 1983. Kīlauea emits an estimated 2,000 tons of
vog every day.
Vog, similar to smog, in that both contain harmful chemicals that can damage the environment, human
health, and the health of other animals. However, they are different. Vog is formed when sulfur oxides
emitted by a volcano react with moisture to form an aerosol. The aerosol particles scatter light and so
make the vog visible. Smog is formed largely from the incomplete combustion of fuel, reacting with
nitrogen oxides and ozone produced from carbon monoxide by reactions with sunlight. The result is also
a visible aerosol.
Slide 19, Page 3 – Pyroclastic Flow - Inhaled ash particles from within a hot, dense pyroclastic flow will
almost always results in death from burns or asphyxiation.
Close-up view of Pyroclastic Flow from the Mayon Volcano, Philippines (September 23, 1984)
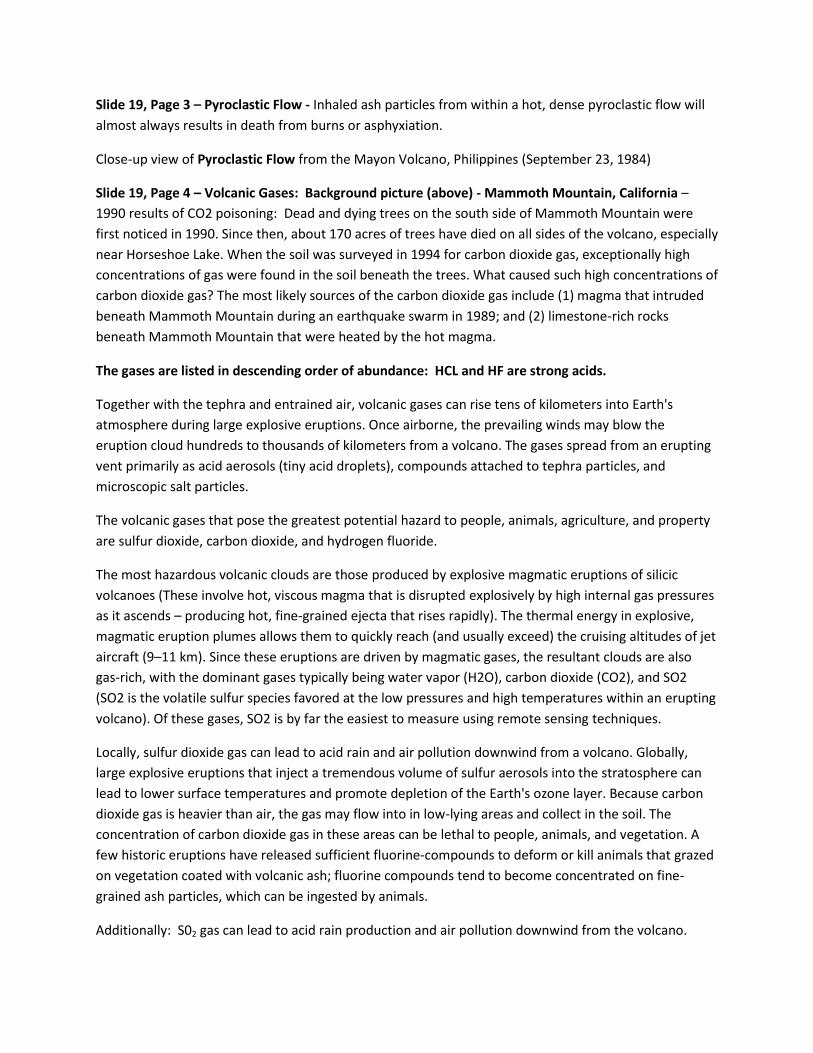
Slide 19, Page 4 – Volcanic Gases: Background picture (above) - Mammoth Mountain, California –
1990 results of CO2 poisoning: Dead and dying trees on the south side of Mammoth Mountain were
first noticed in 1990. Since then, about 170 acres of trees have died on all sides of the volcano, especially
near Horseshoe Lake. When the soil was surveyed in 1994 for carbon dioxide gas, exceptionally high
concentrations of gas were found in the soil beneath the trees. What caused such high concentrations of
carbon dioxide gas? The most likely sources of the carbon dioxide gas include (1) magma that intruded
beneath Mammoth Mountain during an earthquake swarm in 1989; and (2) limestone-rich rocks
beneath Mammoth Mountain that were heated by the hot magma.
The gases are listed in descending order of abundance: HCL and HF are strong acids.
Together with the tephra and entrained air, volcanic gases can rise tens of kilometers into Earth's
atmosphere during large explosive eruptions. Once airborne, the prevailing winds may blow the
eruption cloud hundreds to thousands of kilometers from a volcano. The gases spread from an erupting
vent primarily as acid aerosols (tiny acid droplets), compounds attached to tephra particles, and
microscopic salt particles.
The volcanic gases that pose the greatest potential hazard to people, animals, agriculture, and property
are sulfur dioxide, carbon dioxide, and hydrogen fluoride.
The most hazardous volcanic clouds are those produced by explosive magmatic eruptions of silicic
volcanoes (These involve hot, viscous magma that is disrupted explosively by high internal gas pressures
as it ascends – producing hot, fine-grained ejecta that rises rapidly). The thermal energy in explosive,
magmatic eruption plumes allows them to quickly reach (and usually exceed) the cruising altitudes of jet
aircraft (9–11 km). Since these eruptions are driven by magmatic gases, the resultant clouds are also
gas-rich, with the dominant gases typically being water vapor (H2O), carbon dioxide (CO2), and SO2
(SO2 is the volatile sulfur species favored at the low pressures and high temperatures within an erupting
volcano). Of these gases, SO2 is by far the easiest to measure using remote sensing techniques.
Locally, sulfur dioxide gas can lead to acid rain and air pollution downwind from a volcano. Globally,
large explosive eruptions that inject a tremendous volume of sulfur aerosols into the stratosphere can
lead to lower surface temperatures and promote depletion of the Earth's ozone layer. Because carbon
dioxide gas is heavier than air, the gas may flow into in low-lying areas and collect in the soil. The
concentration of carbon dioxide gas in these areas can be lethal to people, animals, and vegetation. A
few historic eruptions have released sufficient fluorine-compounds to deform or kill animals that grazed
on vegetation coated with volcanic ash; fluorine compounds tend to become concentrated on fine-
grained ash particles, which can be ingested by animals.
Additionally: S02 gas can lead to acid rain production and air pollution downwind from the volcano.
C02 gas, being heavier than air, may flow like a river into in adjacent low-lying areas and accumulate in
the soil. If sufficient in depth (low mixing) and concentration, the C02 gas can be lethal to all living
matter.
A few notable eruptions in the past have released enough hydrogen fluoride (HF), carried on the wind
and bound to ash particles, to kill or maim animals that ate any food coated in the ash.
Slide 20 (2) – Volcanic Ash Hazards to Aircraft and Aviation: Photo: Mt. Cleveland eruption, May 23,
2006 - Jeff Williams, NASA.
Slide 20, Page 2 - Damage to leading edge surfaces of aircraft. • Ash ingested into jet engines results in
loss of performance, and possibly complete shutdown.
Again…significant hazards to aircraft both in the air and on the ground. Volcanic ash damages
windscreens, windows, and external probes that tell pilots their airspeed and altitude, and can ruin
antennae for communication and navigation radios. Ash can almost instantly contaminate onboard
electronic equipment, air conditioning, equipment cooling systems, the fuel system, and hydraulic
systems that move flight controls and extend landing gear.
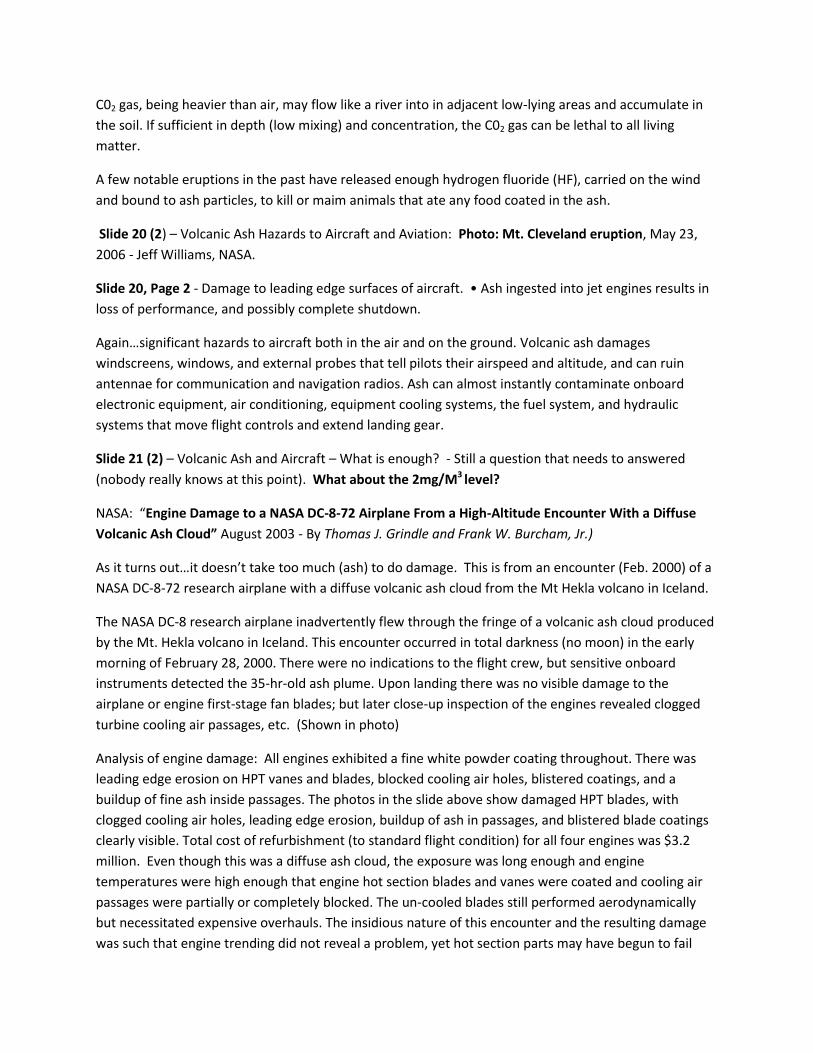
Slide 21 (2) – Volcanic Ash and Aircraft – What is enough? - Still a question that needs to answered
(nobody really knows at this point). What about the 2mg/M3 level?
NASA: “Engine Damage to a NASA DC-8-72 Airplane From a High-Altitude Encounter With a Diffuse
Volcanic Ash Cloud” August 2003 - By Thomas J. Grindle and Frank W. Burcham, Jr.)
As it turns out…it doesn’t take too much (ash) to do damage. This is from an encounter (Feb. 2000) of a
NASA DC-8-72 research airplane with a diffuse volcanic ash cloud from the Mt Hekla volcano in Iceland.
The NASA DC-8 research airplane inadvertently flew through the fringe of a volcanic ash cloud produced
by the Mt. Hekla volcano in Iceland. This encounter occurred in total darkness (no moon) in the early
morning of February 28, 2000. There were no indications to the flight crew, but sensitive onboard
instruments detected the 35-hr-old ash plume. Upon landing there was no visible damage to the
airplane or engine first-stage fan blades; but later close-up inspection of the engines revealed clogged
turbine cooling air passages, etc. (Shown in photo)
Analysis of engine damage: All engines exhibited a fine white powder coating throughout. There was
leading edge erosion on HPT vanes and blades, blocked cooling air holes, blistered coatings, and a
buildup of fine ash inside passages. The photos in the slide above show damaged HPT blades, with
clogged cooling air holes, leading edge erosion, buildup of ash in passages, and blistered blade coatings
clearly visible. Total cost of refurbishment (to standard flight condition) for all four engines was $3.2
million. Even though this was a diffuse ash cloud, the exposure was long enough and engine
temperatures were high enough that engine hot section blades and vanes were coated and cooling air
passages were partially or completely blocked. The un-cooled blades still performed aerodynamically
but necessitated expensive overhauls. The insidious nature of this encounter and the resulting damage
was such that engine trending did not reveal a problem, yet hot section parts may have begun to fail
(through blade erosion) if flown another 100 hr. Normally, failure would have not been an issue for at
least another 1000 hours.
Later satellite data analysis of the volcanic ash plume trajectory indicated the ash plume had been
transported further north than predicted by atmospheric effects. Analysis of the ash particles collected
in cabin air heat exchanger filters showed strong evidence of volcanic ash, most of which may have been
ice-coated (and therefore less damaging to the airplane) at the time of the encounter. Engine operating
temperatures at the time of the encounter were sufficiently high to cause melting and fusing of ash on
and inside high-pressure turbine blade cooling passages. There was no evidence of engine damage in the
engine trending results, but some of the turbine blades had been operating in an overheated condition
and may have had a remaining lifetime of as little as 100 hr. There are currently no fully reliable
methods available to flight crews to detect the presence of a diffuse, yet potentially damaging volcanic
ash cloud.
Slide 21, Page 2 - Ingestion of volcanic ash by engines may cause serious deterioration of engine
performance due to erosion of moving parts and/or partial or complete blocking of fuel nozzles.
Volcanic ash contains particles, whose melting point is below engine internal temperature. In-flight,
these particles will immediately melt if they go through an engine. Going through the turbine, the
melted materials are rapidly cooled down, stick on the turbine vanes, and disturb the flow of high-
pressure combustion gases.
This disorder of the flow may stall the engine, in worst cases.
Slide 22 (3) – Volcanic Ash Plumes: Photo: USGS – Joyce Warren, Dec 15, 1989 – Redoubt.
The explosive characteristics are manifested from the fragmentation of the magma and the high speed
jet that issues from the vent. The first distinct feature is a nearly lithostatic pressure distribution, which
results from the increase of the height of the fragmentation surface. The second one is the atmospheric
pressure at the vent; the flow is not choked. The third one is that the relative velocity between the gas
and the ash is large at the vent despite the large interaction force between the two phases. The large
relative velocity is established in the fractured-turbulent regime, and is maintained in the subsequent
gas–ash flow regime. Sometimes the smaller plumes can be just as problematic if close to airports.
Slide 22, Page 2 - GOAL: determine eruption height to successfully monitor and forecast volcanic ash
dispersion:
1. Plume (volcanic cloud) height, like meteorological convection, is affected by wind shear and
atmospheric instability. 2. Relatively weak eruptions in moist tropics can trigger deep convection
columns (15-20 km) due to the extreme instability. 3. Given the same eruptive intensity – relatively
dry/stable polar/subpolar environments will (generally) produce lower eruptive heights than in the
moist/unstable tropics (up 8 - 10 km difference at times). 4. A higher proportion of volcanic clouds will
reach aircraft cruising levels in the moist tropics than from the drier, more stable, poleward
environments. 5. Eruptions in higher latitudes in dryer atmospheres are less likely to rise to cruising
altitudes as they gain their energy mainly from the volcanic source (not as much from the atmosphere).
Clouds at cruising altitudes will however be richer in ash and more dangerous because ash scavenging is
less significant.
Volcanic ash cloud risks for aircraft flying at cruising altitudes (10–12 km) in different environments:
1. An aircraft flying above a polar winter tropopause would expect to have a reduced chance of
encountering an ash cloud, but (if) one was encountered – you would expect it to be ash-rich and highly
dangerous. 2. Conversely, an aircraft in the moist tropics would have a relatively high risk of flying into
or underneath a volcanic cloud, but if the eruption was relatively weak you might only smell some SO2
and not notice any fine ash (i.e. the risk that many of these clouds pose to aviation traffic will be
relatively small because of the lower ash content).
Additional Points- Eruptions into moist atmospheres cause clouds that are higher but significantly
poorer in ash than eruptions into dry atmospheres. Volcanic clouds in moist atmospheres have a
proportionally lower ash loading and are (generally) relatively less of a risk to aviation to eruption clouds
at the same heights in dry environments. In the moist tropics, because of the relatively higher ice and
SO2 Content than fine ash loading, the clouds are often more difficult to detect as being volcanic using
remote sensing ash detection techniques.
Material gathered from:Tupper, A., C. Textor, M. Herzog, H-F Graf, and M. Richards, 2009. Tall clouds
from small eruptions: the sensitivity of eruption height and fine ash content to tropospheric
instability. Nat Hazards 51:375–401
Slide 22, Page 3 - Vertical growth of the ash plume vs. Lateral Expansion of the ash plume (Mt. St Helens
example). This is exactly why there is a “need for speed” when it comes to observation/detection,
verification, and warning! In this example of a Mt St Helens type eruption (data analysis from Boeing
Industries)…it only took between 6 and 8 minutes fro the ash plume to reach between 30 and 40 kft in
elevation and to extend horizontally away from the volcano by nearly 50 km (27 miles).
Slide 23 (3) - Worldwide, nearly 500 airports lie within 100 km (62 miles) of active volcanoes. Active
Volcanoes in red. Map : Topinka, USGS 1997
Slide 23, Page 2 - Next two Slides together -
There are over a hundred active volcanoes in the North Pacific region (about 20% of the world’s active
volcanoes). Along North Pacific air routes, some of the busiest in the world, at least 15 aircraft (including
KLM Flight 867) have been damaged since 1980 by flying through volcanic ash clouds. In the same
period, there have been 80 such encounters worldwide, causing hundreds of millions of dollars in
damage and lost revenue. Fortunately, no fatalities have yet occurred, but the growth in air traffic over
volcanically active regions, such as the North Pacific, is increasing the chance of a deadly encounter.
Slide 23, Page 3 - Common flight routes near or over this highly active volcanic region. One can easily
see the need for advanced observations and forecasting of volcanic plume movement.
More than 10,000 passengers and millions of dollars in cargo fly across the North Pacific region each
day, and the area's aviation traffic is increasing about ten percent a year. This region also contains one
of the most active parts of the "Ring of Fire," a belt of active volcanoes that borders much of the Pacific
Ocean. About 100 potentially dangerous volcanoes lie under air routes in the North Pacific. Along the
Alaska Peninsula and the Aleutian Islands there are more than 40 historically active volcanoes. Even
greater numbers of active volcanoes are found to the west of Alaska on the Russian Kamchatka
Peninsula and in the Kurile Islands.
Each year about 5 eruptions occur along the 2,400-nautical-mile arc from Alaska to the Kuriles. Ash
clouds from volcanoes in this segment of the "Ring of Fire" are usually carried to the east and northeast,
directly across busy air routes. On an average of 4 days a year in the North Pacific region, volcanic ash is
present above an altitude of 30,000 feet, where most large jet aircraft fly.
Slide 24 (2) – Hazards to Airports: In addition to posing a hazard to in-flight aircraft, volcanic ash can
disrupt airport operations with local to global consequences for both life and commerce. Worldwide,
nearly 500 airports lie within 100 km (62 miles) of active volcanoes. The primary volcanic hazard to
airports is ashfall, which causes not only loss of visibility and slippery runways, but structural damage
and contamination to ground systems and stored aircraft along with slippery runways. Ash in airspace
around airports has damaged in-flight aircraft and caused airport closures that can involve loss of
alternate landing sites.
Recently: An American Airlines jet is parked in the tarmac covered with ash from the eruption of the
Central American - Pacaya Volcano at the international airport in Guatemala City, Friday May 28, 2010.
The volcano started erupting lava and rocks on Thursday afternoon, blanketing Guatemala City with ash
and forcing the closure of the international airport. One television reporter has been killed and
thousands of residents from villages closest to the volcano have been evacuated to shelters.
A television reporter was killed by a shower of burning rocks when he got too close to the volcano,
about 15 miles (25 kilometers) south of Guatemala City. In Guatemala, the ash billowing from Pacaya
has been thick and falls quickly to the ground, unlike the lighter ash that spewed from the volcano in
Iceland and swept over much of Europe, disrupting global air travel. The ash here stretched for “only”
hundreds of kilometers, while the plume of ash from the volcano in Iceland covered nearly all of Europe
for thousands of kilometers. The original report had the ash plume at around 3,000 feet (1,000) meters
high that trailed more than 12 miles (20 kilometers) to the northwest. In Guatemala City, bulldozers
scraped blackened streets while residents used shovels to clean cars and roofs. The blanket of ash was
three inches (7.5 centimeters) thick in some southern parts of the city.
Slide 24, Page 2 - Primary hazard: Ashfall - which can cause loss of visibility, create slippery runways,
infiltrate communication and electrical systems, interrupt ground services, and damage buildings and
parked airplanes (engines, surfaces and electronics). (Other airport hazards: ash in airspace around
airports, lava flows, pyroclastic flows, gas emission, and phreatic explosion).
Accumulating ash - Ash does not simply disappear (like melting snow) or blow away but must be
disposed of in a manner that prevents it from being remobilized by wind and aircraft and during the
clean-up process itself. On average, five airports per year are impacted by volcanic activity.
Info from : “Volcanic hazards to airports” - Marianne Guffanti Æ Gari C. Mayberry Æ Thomas J.
Casadevall Æ Richard Wunderman, Nat Hazards (2009) 51:287–302, 4 June 2008
Slide 25 (1) – Intro to Remote Sensing. Ash from Mt. Pinatubo blankets the region like snow –
11/27/1991. It can take many hours for eruptions occurring in remote regions to be recognized and
assessed…while some relatively mild eruptions occurring in remote areas can even go undetected.
Volcanic ash can reach commercial flight levels (30,000 ft or above) in 5 to 10 minutes and remain
airborne for several days. Weak eruptions, spreading (optical thinning) of the plume, or background
non-volcanic clouds can significantly reduce the visible satellite signature, making it quite difficult to
correctly discern the ash cloud. Wide variability in composition and structure of ash can also cause
various detection problems. Ash cloud height can be a particularly tricky problem, especially when the
plume is optically thin. Aircraft radar is ineffective in locating ash clouds.
Slide 26 (1) – Volcano Monitoring: “STATUS AND CHALLENGES OF VOLCANO MONITORING
WORLDWIDE “ - John W. Ewert, U.S. Geological Survey, Vancouver, WA 98683, USA ([email protected])
Christopher G. Newhall, U.S. Geological Survey, Seattle, WA 98195 USA – 2004. USGS
Here is a look at a map of major flight routes of the world together with a plot of the active volcanoes of
the world. The black triangles represent volcanoes with some form of monitoring going on, while the
blue stared areas represent volcanoes without any structured monitoring program.
Slide 27 (1) – Real-time detection: See slide for detail of the many methods for observation and
detection. We are going to (briefly) cover ash and aerosol detection as many eruptions have both ash
and aerosol. There are examples in the research arena that show cases where the ash plume and
aerosol plume split, but there are far too few studies that have in-situ observations to confirm that there
is no ash where an SO2 signature is found and no SO2 where an ash signature is found. There is also the
ever haunting question of just how much ash/aerosol poses a problem.
Slide 28 (1) - Image: Artist’s depiction of GOES N(13) – Allan Kung, for NASA NOAA – from: GOES N Fact
Sheet (2006)
Slide 29 (1) - Global coverage. Allows for tracking of the plume both during the day and at night.
Provides information in remote locations and can be used in conjunction with other information to
determine plume height and probable plume movement.
Also Important: Quick and efficient detection of an eruption (ash) plume. Monitoring of the thermal
energy emitted from the volcano. Mapping of the surface deformation of a volcano, including
topography and topographic change aid in producing temporal and spatial distribution of ash and gases
produced a volcanic eruption. Contributing to a “baseline” data set for quantifying future changes with
a given volcano. Contributing to a “model” data set that can produce future movement of ash or gases.
Slide 30 (1) – Satellite products used – see slide. Also, for more info: GOES and POES CIRA products,
including - Tropical RAMSDIS online; RMTC Real-time Satellite Imagery. Many experimental GOES and
POES products @: (http://www.cira.colostate.edu/cira/RAMM/Rmsdsol/ROLEX.html)
Slide 31 (4) – Observational Examples: Visible RGB product - RGB Image From: Operational Significant
Event Imagery (OSEI) – MODIS AQUA RGB (Band 1, 4, 3) – 4/19/2010@13Z - Eyjafjallajokull volcano.
Slide 31, Page 2 - Visible Image View from Meteosat-9 (MSG) – Eyjafjallajokull Volcano - May 7, 2010;
Image data from: EUMETSAT Data Processed by NESDIS.
Slide 31, Page 3 - Close-up Visible Image View from Meteosat-9 (MSG) – Eyjafjallajokull Volcano - May 7,
2010 , Image data from: EUMETSAT Data Processed by NESDIS.
Slide 31, Page 4 - A “false color” RGB image taken 2 hours after the initial eruption of Mount St Helens
May 18, 1980. From GOES-3…some 30 years ago!!
Slide 32 (5) – St. Helens May 18, 1980. Showing ash flow for first 30 hours. First page – Initial eruption
plus 6 minutes. From NOAA and the University of Washington – Special Collection. (GOES-3)
Slide 32, Page 2 – Initial eruption plus 1 hour
Slide 32, Page 3 – Initial eruption plus 3 hours
Slide 32, Page 4 – Initial eruption plus 6 hours
Slide 32, Page 5 – Initial eruption plus 30 hours.
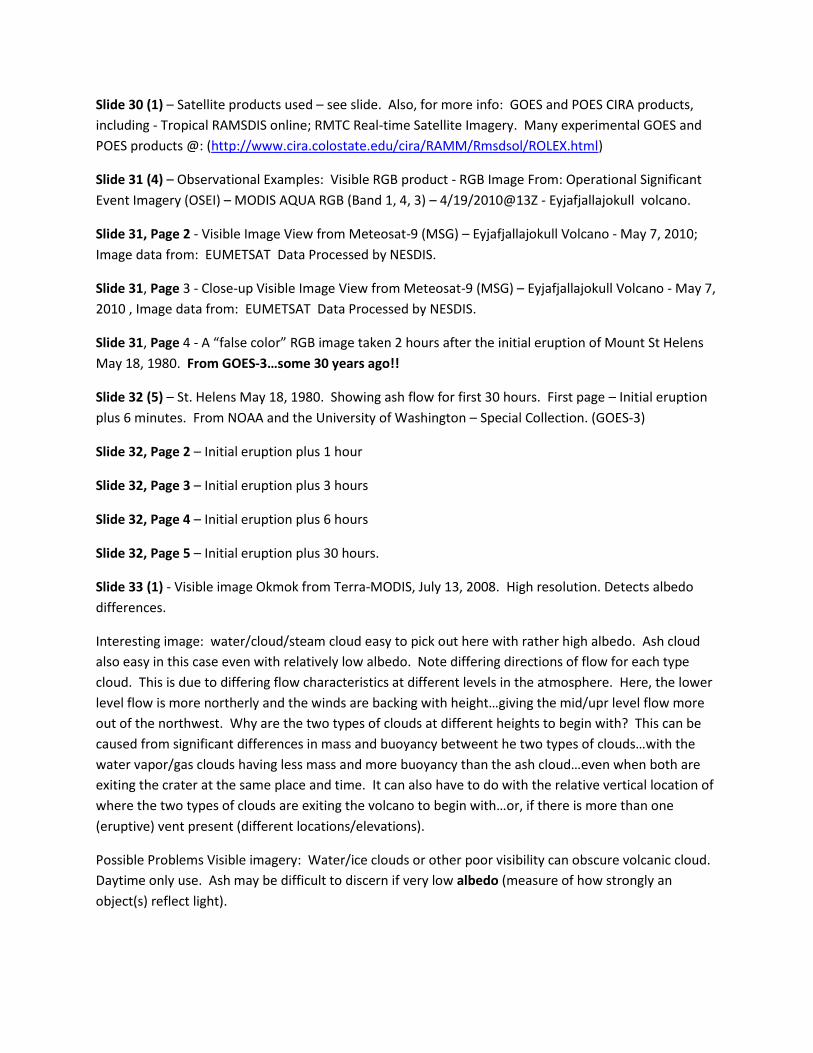
Slide 33 (1) - Visible image Okmok from Terra-MODIS, July 13, 2008. High resolution. Detects albedo
differences.
Interesting image: water/cloud/steam cloud easy to pick out here with rather high albedo. Ash cloud
also easy in this case even with relatively low albedo. Note differing directions of flow for each type
cloud. This is due to differing flow characteristics at different levels in the atmosphere. Here, the lower
level flow is more northerly and the winds are backing with height…giving the mid/upr level flow more
out of the northwest. Why are the two types of clouds at different heights to begin with? This can be
caused from significant differences in mass and buoyancy betweent he two types of clouds…with the
water vapor/gas clouds having less mass and more buoyancy than the ash cloud…even when both are
exiting the crater at the same place and time. It can also have to do with the relative vertical location of
where the two types of clouds are exiting the volcano to begin with…or, if there is more than one
(eruptive) vent present (different locations/elevations).
Possible Problems Visible imagery: Water/ice clouds or other poor visibility can obscure volcanic cloud.
Daytime only use. Ash may be difficult to discern if very low albedo (measure of how strongly an
object(s) reflect light).
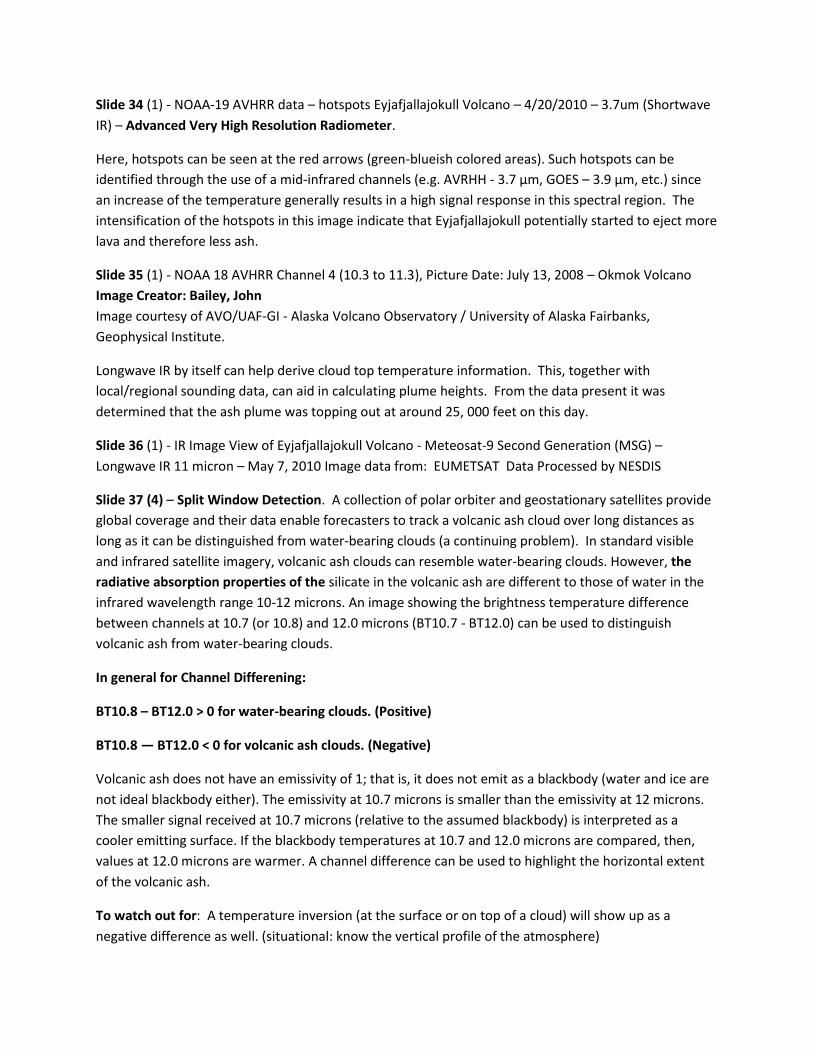
Slide 34 (1) - NOAA-19 AVHRR data – hotspots Eyjafjallajokull Volcano – 4/20/2010 – 3.7um (Shortwave
IR) – Advanced Very High Resolution Radiometer.
Here, hotspots can be seen at the red arrows (green-blueish colored areas). Such hotspots can be
identified through the use of a mid-infrared channels (e.g. AVRHH - 3.7 µm, GOES – 3.9 µm, etc.) since
an increase of the temperature generally results in a high signal response in this spectral region. The
intensification of the hotspots in this image indicate that Eyjafjallajokull potentially started to eject more
lava and therefore less ash.
Slide 35 (1) - NOAA 18 AVHRR Channel 4 (10.3 to 11.3), Picture Date: July 13, 2008 – Okmok Volcano
Image Creator: Bailey, John
Image courtesy of AVO/UAF-GI - Alaska Volcano Observatory / University of Alaska Fairbanks,
Geophysical Institute.
Longwave IR by itself can help derive cloud top temperature information. This, together with
local/regional sounding data, can aid in calculating plume heights. From the data present it was
determined that the ash plume was topping out at around 25, 000 feet on this day.
Slide 36 (1) - IR Image View of Eyjafjallajokull Volcano - Meteosat-9 Second Generation (MSG) –
Longwave IR 11 micron – May 7, 2010 Image data from: EUMETSAT Data Processed by NESDIS
Slide 37 (4) – Split Window Detection. A collection of polar orbiter and geostationary satellites provide
global coverage and their data enable forecasters to track a volcanic ash cloud over long distances as
long as it can be distinguished from water-bearing clouds (a continuing problem). In standard visible
and infrared satellite imagery, volcanic ash clouds can resemble water-bearing clouds. However, the
radiative absorption properties of the silicate in the volcanic ash are different to those of water in the
infrared wavelength range 10-12 microns. An image showing the brightness temperature difference
between channels at 10.7 (or 10.8) and 12.0 microns (BT10.7 - BT12.0) can be used to distinguish
volcanic ash from water-bearing clouds.
In general for Channel Differening:
BT10.8 – BT12.0 > 0 for water-bearing clouds. (Positive)
BT10.8 — BT12.0 < 0 for volcanic ash clouds. (Negative)
Volcanic ash does not have an emissivity of 1; that is, it does not emit as a blackbody (water and ice are
not ideal blackbody either). The emissivity at 10.7 microns is smaller than the emissivity at 12 microns.
The smaller signal received at 10.7 microns (relative to the assumed blackbody) is interpreted as a
cooler emitting surface. If the blackbody temperatures at 10.7 and 12.0 microns are compared, then,
values at 12.0 microns are warmer. A channel difference can be used to highlight the horizontal extent
of the volcanic ash.
To watch out for: A temperature inversion (at the surface or on top of a cloud) will show up as a
negative difference as well. (situational: know the vertical profile of the atmosphere)
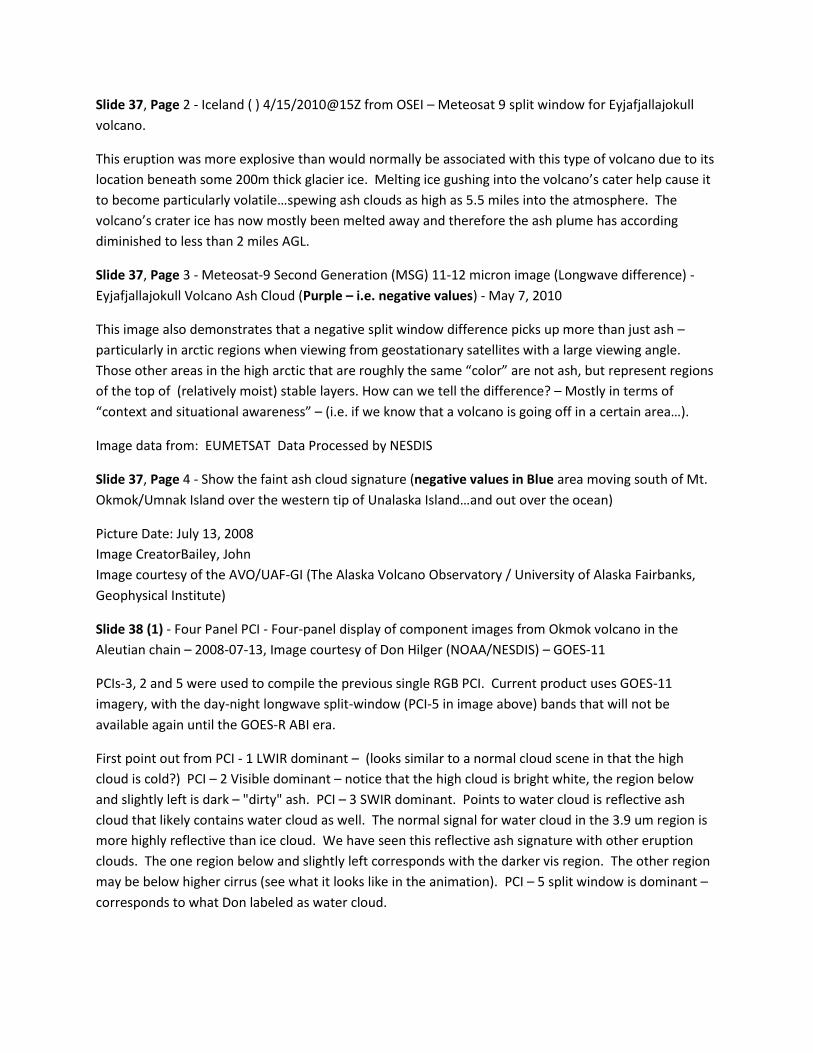
Slide 37, Page 2 - Iceland ( ) 4/15/2010@15Z from OSEI – Meteosat 9 split window for Eyjafjallajokull
volcano.
This eruption was more explosive than would normally be associated with this type of volcano due to its
location beneath some 200m thick glacier ice. Melting ice gushing into the volcano’s cater help cause it
to become particularly volatile…spewing ash clouds as high as 5.5 miles into the atmosphere. The
volcano’s crater ice has now mostly been melted away and therefore the ash plume has according
diminished to less than 2 miles AGL.
Slide 37, Page 3 - Meteosat-9 Second Generation (MSG) 11-12 micron image (Longwave difference) -
Eyjafjallajokull Volcano Ash Cloud (Purple – i.e. negative values) - May 7, 2010
This image also demonstrates that a negative split window difference picks up more than just ash –
particularly in arctic regions when viewing from geostationary satellites with a large viewing angle.
Those other areas in the high arctic that are roughly the same “color” are not ash, but represent regions
of the top of (relatively moist) stable layers. How can we tell the difference? – Mostly in terms of
“context and situational awareness” – (i.e. if we know that a volcano is going off in a certain area…).
Image data from: EUMETSAT Data Processed by NESDIS
Slide 37, Page 4 - Show the faint ash cloud signature (negative values in Blue area moving south of Mt.
Okmok/Umnak Island over the western tip of Unalaska Island…and out over the ocean)
Picture Date: July 13, 2008
Image CreatorBailey, John
Image courtesy of the AVO/UAF-GI (The Alaska Volcano Observatory / University of Alaska Fairbanks,
Geophysical Institute)
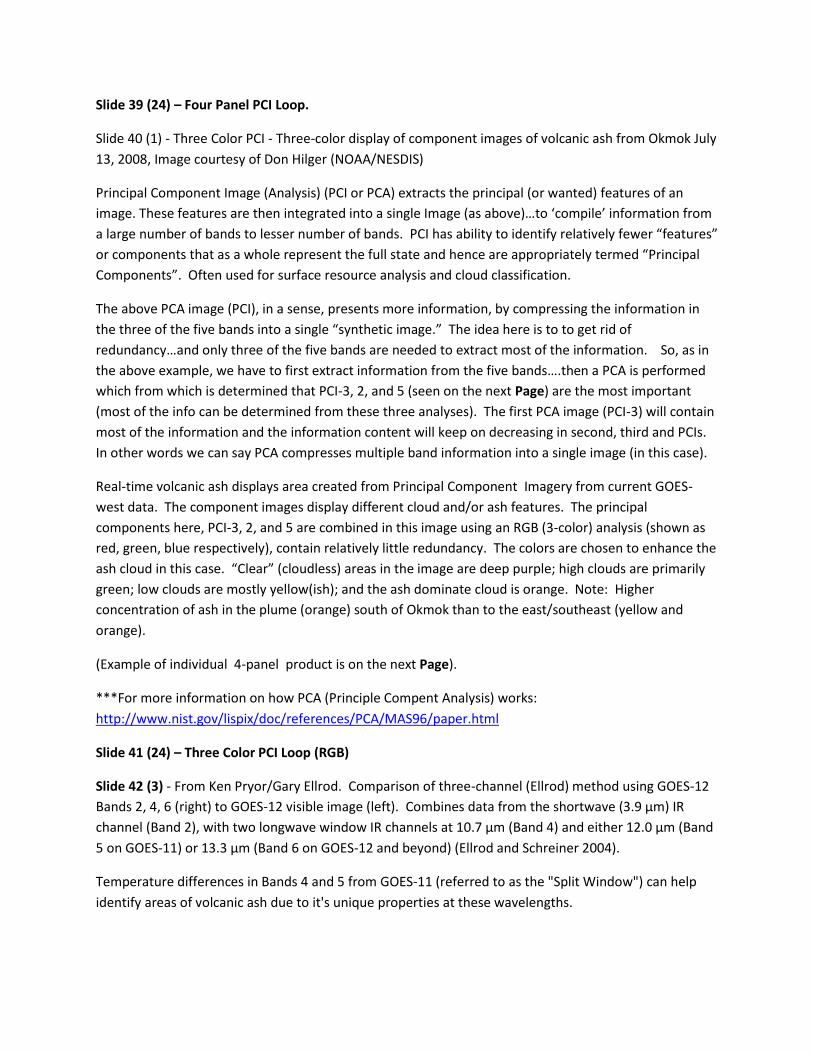
Slide 38 (1) - Four Panel PCI - Four-panel display of component images from Okmok volcano in the
Aleutian chain – 2008-07-13, Image courtesy of Don Hilger (NOAA/NESDIS) – GOES-11
PCIs-3, 2 and 5 were used to compile the previous single RGB PCI. Current product uses GOES-11
imagery, with the day-night longwave split-window (PCI-5 in image above) bands that will not be
available again until the GOES-R ABI era.
First point out from PCI - 1 LWIR dominant – (looks similar to a normal cloud scene in that the high
cloud is cold?) PCI – 2 Visible dominant – notice that the high cloud is bright white, the region below
and slightly left is dark – "dirty" ash. PCI – 3 SWIR dominant. Points to water cloud is reflective ash
cloud that likely contains water cloud as well. The normal signal for water cloud in the 3.9 um region is
more highly reflective than ice cloud. We have seen this reflective ash signature with other eruption
clouds. The one region below and slightly left corresponds with the darker vis region. The other region
may be below higher cirrus (see what it looks like in the animation). PCI – 5 split window is dominant –
corresponds to what Don labeled as water cloud.
Slide 39 (24) – Four Panel PCI Loop.
Slide 40 (1) - Three Color PCI - Three-color display of component images of volcanic ash from Okmok July
13, 2008, Image courtesy of Don Hilger (NOAA/NESDIS)
Principal Component Image (Analysis) (PCI or PCA) extracts the principal (or wanted) features of an
image. These features are then integrated into a single Image (as above)…to ‘compile’ information from
a large number of bands to lesser number of bands. PCI has ability to identify relatively fewer “features”
or components that as a whole represent the full state and hence are appropriately termed “Principal
Components”. Often used for surface resource analysis and cloud classification.
The above PCA image (PCI), in a sense, presents more information, by compressing the information in
the three of the five bands into a single “synthetic image.” The idea here is to to get rid of
redundancy…and only three of the five bands are needed to extract most of the information. So, as in
the above example, we have to first extract information from the five bands….then a PCA is performed
which from which is determined that PCI-3, 2, and 5 (seen on the next Page) are the most important
(most of the info can be determined from these three analyses). The first PCA image (PCI-3) will contain
most of the information and the information content will keep on decreasing in second, third and PCIs.
In other words we can say PCA compresses multiple band information into a single image (in this case).
Real-time volcanic ash displays area created from Principal Component Imagery from current GOES-
west data. The component images display different cloud and/or ash features. The principal
components here, PCI-3, 2, and 5 are combined in this image using an RGB (3-color) analysis (shown as
red, green, blue respectively), contain relatively little redundancy. The colors are chosen to enhance the
ash cloud in this case. “Clear” (cloudless) areas in the image are deep purple; high clouds are primarily
green; low clouds are mostly yellow(ish); and the ash dominate cloud is orange. Note: Higher
concentration of ash in the plume (orange) south of Okmok than to the east/southeast (yellow and
orange).
(Example of individual 4-panel product is on the next Page).
***For more information on how PCA (Principle Compent Analysis) works:
http://www.nist.gov/lispix/doc/references/PCA/MAS96/paper.html
Slide 41 (24) – Three Color PCI Loop (RGB)
Slide 42 (3) - From Ken Pryor/Gary Ellrod. Comparison of three-channel (Ellrod) method using GOES-12
Bands 2, 4, 6 (right) to GOES-12 visible image (left). Combines data from the shortwave (3.9 μm) IR
channel (Band 2), with two longwave window IR channels at 10.7 μm (Band 4) and either 12.0 μm (Band
5 on GOES-11) or 13.3 μm (Band 6 on GOES-12 and beyond) (Ellrod and Schreiner 2004).
Temperature differences in Bands 4 and 5 from GOES-11 (referred to as the "Split Window") can help
identify areas of volcanic ash due to it's unique properties at these wavelengths.
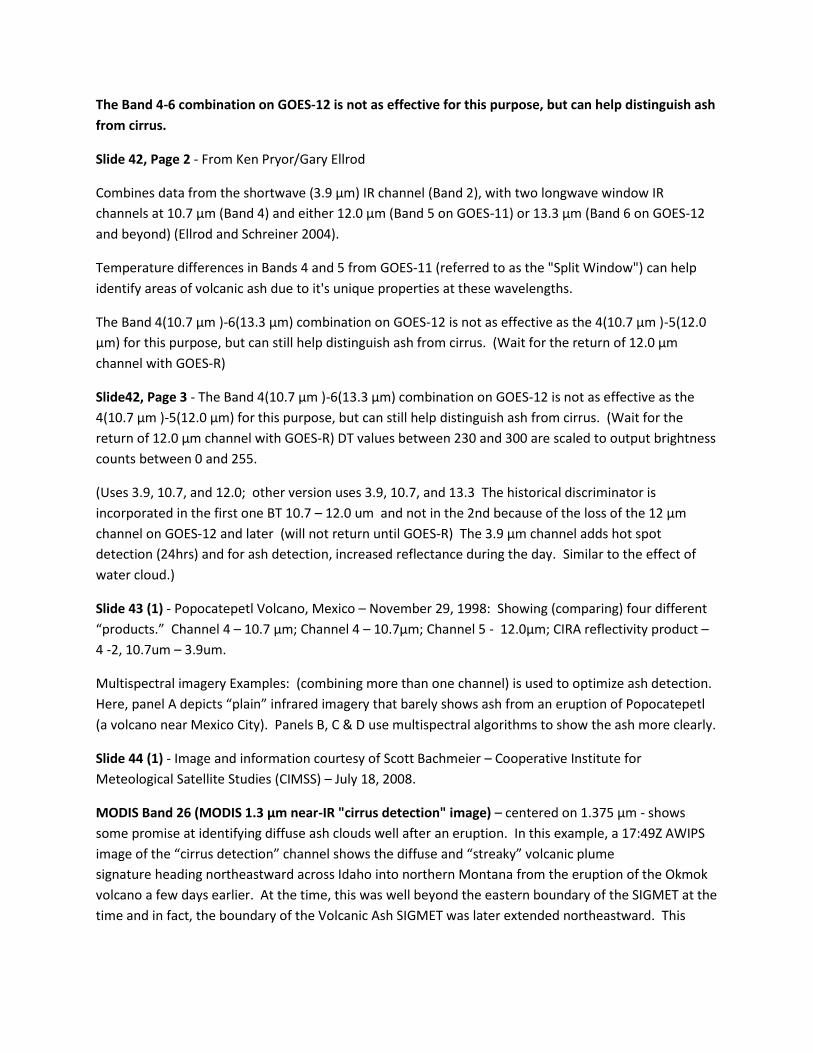
The Band 4-6 combination on GOES-12 is not as effective for this purpose, but can help distinguish ash
from cirrus.
Slide 42, Page 2 - From Ken Pryor/Gary Ellrod
Combines data from the shortwave (3.9 μm) IR channel (Band 2), with two longwave window IR
channels at 10.7 μm (Band 4) and either 12.0 μm (Band 5 on GOES-11) or 13.3 μm (Band 6 on GOES-12
and beyond) (Ellrod and Schreiner 2004).
Temperature differences in Bands 4 and 5 from GOES-11 (referred to as the "Split Window") can help
identify areas of volcanic ash due to it's unique properties at these wavelengths.
The Band 4(10.7 μm )-6(13.3 μm) combination on GOES-12 is not as effective as the 4(10.7 μm )-5(12.0
μm) for this purpose, but can still help distinguish ash from cirrus. (Wait for the return of 12.0 μm
channel with GOES-R)
Slide42, Page 3 - The Band 4(10.7 μm )-6(13.3 μm) combination on GOES-12 is not as effective as the
4(10.7 μm )-5(12.0 μm) for this purpose, but can still help distinguish ash from cirrus. (Wait for the
return of 12.0 μm channel with GOES-R) DT values between 230 and 300 are scaled to output brightness
counts between 0 and 255.
(Uses 3.9, 10.7, and 12.0; other version uses 3.9, 10.7, and 13.3 The historical discriminator is
incorporated in the first one BT 10.7 – 12.0 um and not in the 2nd because of the loss of the 12 µm
channel on GOES-12 and later (will not return until GOES-R) The 3.9 µm channel adds hot spot
detection (24hrs) and for ash detection, increased reflectance during the day. Similar to the effect of
water cloud.)
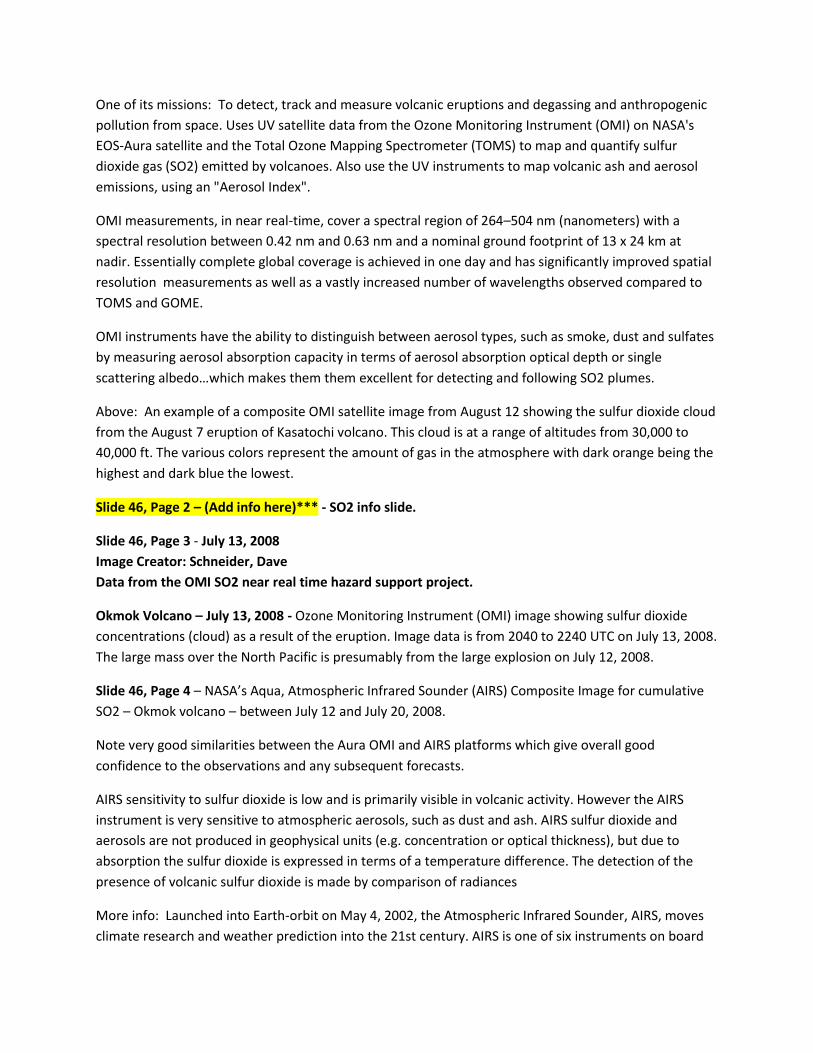
Slide 43 (1) - Popocatepetl Volcano, Mexico – November 29, 1998: Showing (comparing) four different
“products.” Channel 4 – 10.7 μm; Channel 4 – 10.7μm; Channel 5 - 12.0μm; CIRA reflectivity product –
4 -2, 10.7um – 3.9um.
Multispectral imagery Examples: (combining more than one channel) is used to optimize ash detection.
Here, panel A depicts “plain” infrared imagery that barely shows ash from an eruption of Popocatepetl
(a volcano near Mexico City). Panels B, C & D use multispectral algorithms to show the ash more clearly.
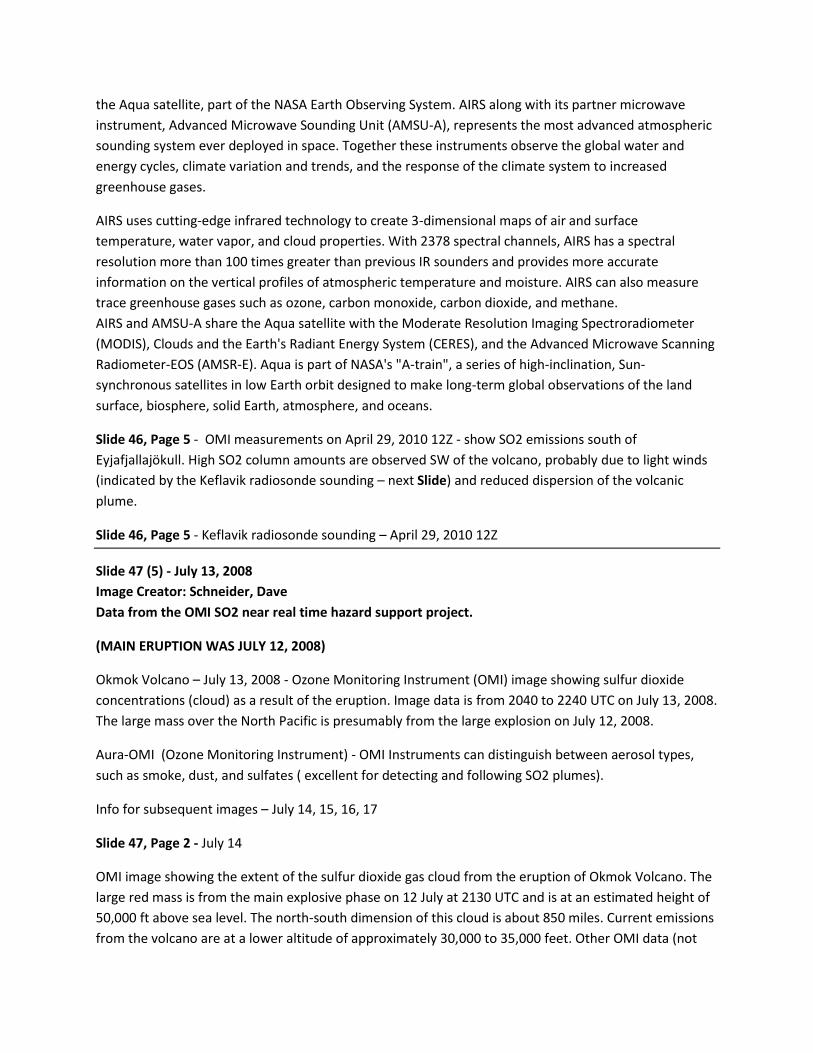
Slide 44 (1) - Image and information courtesy of Scott Bachmeier – Cooperative Institute for
Meteological Satellite Studies (CIMSS) – July 18, 2008.
MODIS Band 26 (MODIS 1.3 µm near-IR "cirrus detection" image) – centered on 1.375 μm - shows
some promise at identifying diffuse ash clouds well after an eruption. In this example, a 17:49Z AWIPS
image of the “cirrus detection” channel shows the diffuse and “streaky” volcanic plume
signature heading northeastward across Idaho into northern Montana from the eruption of the Okmok
volcano a few days earlier. At the time, this was well beyond the eastern boundary of the SIGMET at the
time and in fact, the boundary of the Volcanic Ash SIGMET was later extended northeastward. This

additional remote sensing band (which will be available on GOES-R in the future) suggests an additional
way that volcanic ash may be monitored and for use in adding value to the forecast.
Additional info follows from An Introduction to Ocean Remote Sensing by Seelye Martin, Cambridge
University Press 2004: MODIS channel 26 (1.375 μm) is located in the middle of a strong water vapor
absorption band and much of the time the surface and near surface radiances are completely
attenuated. However, because cirrus and ash clouds occur in the upper troposphere and lower
stratosphere, they appear bright in contrast to the completely attenuated to the surface and to clouds
in the lower troposphere whose reflectance is partially attenuated by water vapor.
Slide 45 (2) – Product Limitations – see slide
Slide 45, Page 2 – Reference Info for last two Slides (not to read…except for perhaps names) from:
Casadevall, T. J., 1992: Volcanic hazards and aviation safety: Lessons of the past decade. Aviation Safety
Journal, Vol. 2, No. 3, Federal Aviation Administration, Washington, DC
Davies, M. A., and W. I. Rose, 1998: Evaluating GOES imagery for volcanic cloud observations at the
Soufriere Hills volcano, Montserrat. Amer. Geophys. Union Proc., in press.
Dean, K., S. Bowling, G. Shaw, and H. Tanaka, 1994: Satellite analysis of movement and characteristics of
the Redoubt Volcano plume, January 8, 1990. J. of Volcanology and Geothermal Research, 62, 339-352.
Ellrod, G.P. and B. Connell, 1999: Improvements in Volcanic Ash Detection Using GOES Multi-spectral
Image Data. Preprints, Conf. on Aviation, Range and Aerospace Meteorology, 10-15 January, 1999,
Dallas, Texas, Amer. Meteor. Soc., Boston.
Ellrod, G.P. and A.J. Schreiner, 2004: Volcanic ash detection and cloud top height estimates from the
GOES-12 imager: Coping without a 12 micrometer infrared band. Geophys. Res. Letters, 31, L15110, 11
August 2004.
Volz, F. E., 1973: Infrared optical constants of ammonium sulfate, Sahara dust, volcanic pumice and
flyash. Applied Optics, 12, 564-568.
Additional Note: While the loss of the 12 μm IR band is likely to degrade the overall volcanic ash
detection capability somewhat, some case studies have shown that imagery from GOES-12 and its
successors will continue to prove to be a somewhat effective means of warning pilots of hazardous ash
clouds in many situations.
Slide 46 (5) – Ozone Monitoring Intrument (OMI) is a nadir-viewing near-UV/Visible CCD (Charge Coule
Device) spectrometer aboard NASA’s Earth Observing System’s (EOS) Aura satellite. Aura flies in
formation about 15 minutes behind Aqua (AIRS), both of which orbit the earth in a polar Sun-
synchronous pattern. Aura was launched on July 15, 2004, and OMI has collected data since August 9,
2004.
One of its missions: To detect, track and measure volcanic eruptions and degassing and anthropogenic
pollution from space. Uses UV satellite data from the Ozone Monitoring Instrument (OMI) on NASA's
EOS-Aura satellite and the Total Ozone Mapping Spectrometer (TOMS) to map and quantify sulfur
dioxide gas (SO2) emitted by volcanoes. Also use the UV instruments to map volcanic ash and aerosol
emissions, using an "Aerosol Index".
OMI measurements, in near real-time, cover a spectral region of 264–504 nm (nanometers) with a
spectral resolution between 0.42 nm and 0.63 nm and a nominal ground footprint of 13 x 24 km at
nadir. Essentially complete global coverage is achieved in one day and has significantly improved spatial
resolution measurements as well as a vastly increased number of wavelengths observed compared to
TOMS and GOME.
OMI instruments have the ability to distinguish between aerosol types, such as smoke, dust and sulfates
by measuring aerosol absorption capacity in terms of aerosol absorption optical depth or single
scattering albedo…which makes them them excellent for detecting and following SO2 plumes.
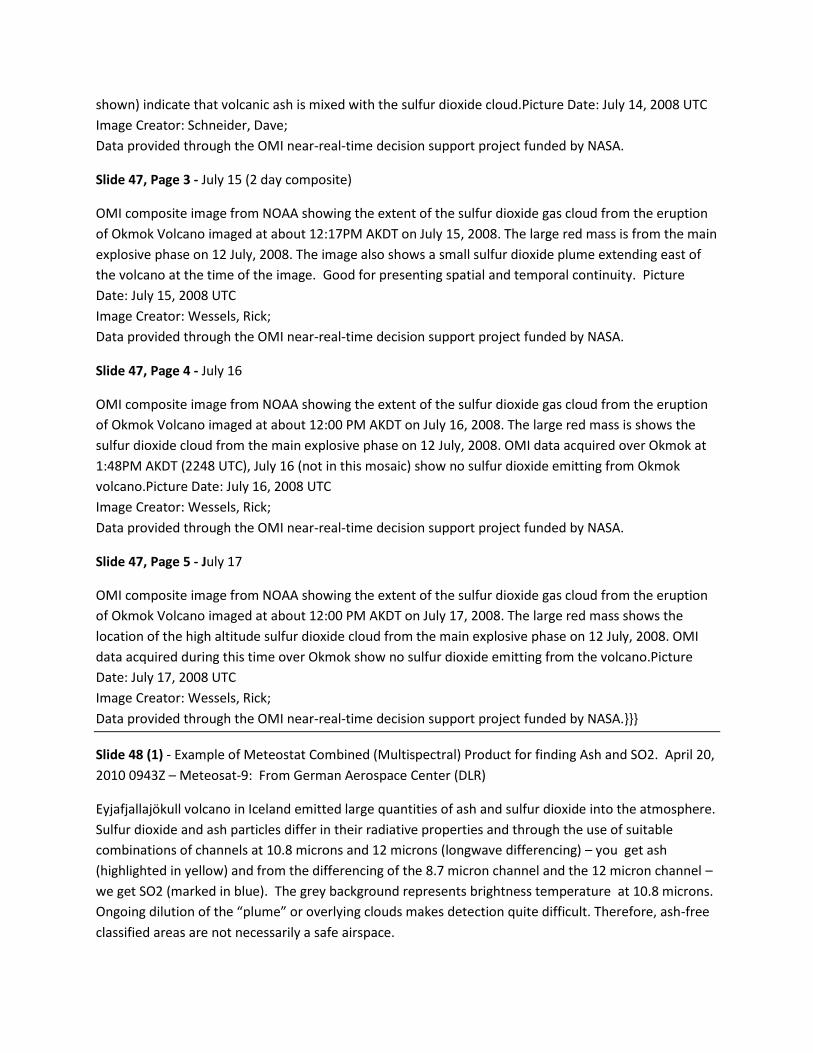
Above: An example of a composite OMI satellite image from August 12 showing the sulfur dioxide cloud
from the August 7 eruption of Kasatochi volcano. This cloud is at a range of altitudes from 30,000 to
40,000 ft. The various colors represent the amount of gas in the atmosphere with dark orange being the
highest and dark blue the lowest.
Slide 46, Page 2 – (Add info here)*** - SO2 info slide.
Slide 46, Page 3 - July 13, 2008
Image Creator: Schneider, Dave
Data from the OMI SO2 near real time hazard support project.
Okmok Volcano – July 13, 2008 - Ozone Monitoring Instrument (OMI) image showing sulfur dioxide
concentrations (cloud) as a result of the eruption. Image data is from 2040 to 2240 UTC on July 13, 2008.
The large mass over the North Pacific is presumably from the large explosion on July 12, 2008.
Slide 46, Page 4 – NASA’s Aqua, Atmospheric Infrared Sounder (AIRS) Composite Image for cumulative
SO2 – Okmok volcano – between July 12 and July 20, 2008.
Note very good similarities between the Aura OMI and AIRS platforms which give overall good
confidence to the observations and any subsequent forecasts.
AIRS sensitivity to sulfur dioxide is low and is primarily visible in volcanic activity. However the AIRS
instrument is very sensitive to atmospheric aerosols, such as dust and ash. AIRS sulfur dioxide and
aerosols are not produced in geophysical units (e.g. concentration or optical thickness), but due to
absorption the sulfur dioxide is expressed in terms of a temperature difference. The detection of the
presence of volcanic sulfur dioxide is made by comparison of radiances
More info: Launched into Earth-orbit on May 4, 2002, the Atmospheric Infrared Sounder, AIRS, moves
climate research and weather prediction into the 21st century. AIRS is one of six instruments on board
the Aqua satellite, part of the NASA Earth Observing System. AIRS along with its partner microwave
instrument, Advanced Microwave Sounding Unit (AMSU-A), represents the most advanced atmospheric
sounding system ever deployed in space. Together these instruments observe the global water and
energy cycles, climate variation and trends, and the response of the climate system to increased
greenhouse gases.
AIRS uses cutting-edge infrared technology to create 3-dimensional maps of air and surface
temperature, water vapor, and cloud properties. With 2378 spectral channels, AIRS has a spectral
resolution more than 100 times greater than previous IR sounders and provides more accurate
information on the vertical profiles of atmospheric temperature and moisture. AIRS can also measure
trace greenhouse gases such as ozone, carbon monoxide, carbon dioxide, and methane.
AIRS and AMSU-A share the Aqua satellite with the Moderate Resolution Imaging Spectroradiometer
(MODIS), Clouds and the Earth's Radiant Energy System (CERES), and the Advanced Microwave Scanning
Radiometer-EOS (AMSR-E). Aqua is part of NASA's "A-train", a series of high-inclination, Sun-
synchronous satellites in low Earth orbit designed to make long-term global observations of the land
surface, biosphere, solid Earth, atmosphere, and oceans.
Slide 46, Page 5 - OMI measurements on April 29, 2010 12Z - show SO2 emissions south of
Eyjafjallajökull. High SO2 column amounts are observed SW of the volcano, probably due to light winds
(indicated by the Keflavik radiosonde sounding – next Slide) and reduced dispersion of the volcanic
plume.
Slide 46, Page 5 - Keflavik radiosonde sounding – April 29, 2010 12Z
Slide 47 (5) - July 13, 2008
Image Creator: Schneider, Dave
Data from the OMI SO2 near real time hazard support project.
(MAIN ERUPTION WAS JULY 12, 2008)
Okmok Volcano – July 13, 2008 - Ozone Monitoring Instrument (OMI) image showing sulfur dioxide
concentrations (cloud) as a result of the eruption. Image data is from 2040 to 2240 UTC on July 13, 2008.
The large mass over the North Pacific is presumably from the large explosion on July 12, 2008.
Aura-OMI (Ozone Monitoring Instrument) - OMI Instruments can distinguish between aerosol types,
such as smoke, dust, and sulfates ( excellent for detecting and following SO2 plumes).
Info for subsequent images – July 14, 15, 16, 17
Slide 47, Page 2 - July 14
OMI image showing the extent of the sulfur dioxide gas cloud from the eruption of Okmok Volcano. The
large red mass is from the main explosive phase on 12 July at 2130 UTC and is at an estimated height of
50,000 ft above sea level. The north-south dimension of this cloud is about 850 miles. Current emissions
from the volcano are at a lower altitude of approximately 30,000 to 35,000 feet. Other OMI data (not
shown) indicate that volcanic ash is mixed with the sulfur dioxide cloud.Picture Date: July 14, 2008 UTC
Image Creator: Schneider, Dave;
Data provided through the OMI near-real-time decision support project funded by NASA.
Slide 47, Page 3 - July 15 (2 day composite)
OMI composite image from NOAA showing the extent of the sulfur dioxide gas cloud from the eruption
of Okmok Volcano imaged at about 12:17PM AKDT on July 15, 2008. The large red mass is from the main
explosive phase on 12 July, 2008. The image also shows a small sulfur dioxide plume extending east of
the volcano at the time of the image. Good for presenting spatial and temporal continuity. Picture
Date: July 15, 2008 UTC
Image Creator: Wessels, Rick;
Data provided through the OMI near-real-time decision support project funded by NASA.
Slide 47, Page 4 - July 16
OMI composite image from NOAA showing the extent of the sulfur dioxide gas cloud from the eruption
of Okmok Volcano imaged at about 12:00 PM AKDT on July 16, 2008. The large red mass is shows the
sulfur dioxide cloud from the main explosive phase on 12 July, 2008. OMI data acquired over Okmok at
1:48PM AKDT (2248 UTC), July 16 (not in this mosaic) show no sulfur dioxide emitting from Okmok
volcano.Picture Date: July 16, 2008 UTC
Image Creator: Wessels, Rick;
Data provided through the OMI near-real-time decision support project funded by NASA.
Slide 47, Page 5 - July 17
OMI composite image from NOAA showing the extent of the sulfur dioxide gas cloud from the eruption
of Okmok Volcano imaged at about 12:00 PM AKDT on July 17, 2008. The large red mass shows the
location of the high altitude sulfur dioxide cloud from the main explosive phase on 12 July, 2008. OMI
data acquired during this time over Okmok show no sulfur dioxide emitting from the volcano.Picture
Date: July 17, 2008 UTC
Image Creator: Wessels, Rick;
Data provided through the OMI near-real-time decision support project funded by NASA.}}}
Slide 48 (1) - Example of Meteostat Combined (Multispectral) Product for finding Ash and SO2. April 20,
2010 0943Z – Meteosat-9: From German Aerospace Center (DLR)
Eyjafjallajökull volcano in Iceland emitted large quantities of ash and sulfur dioxide into the atmosphere.
Sulfur dioxide and ash particles differ in their radiative properties and through the use of suitable
combinations of channels at 10.8 microns and 12 microns (longwave differencing) – you get ash
(highlighted in yellow) and from the differencing of the 8.7 micron channel and the 12 micron channel –
we get SO2 (marked in blue). The grey background represents brightness temperature at 10.8 microns.
Ongoing dilution of the “plume” or overlying clouds makes detection quite difficult. Therefore, ash-free
classified areas are not necessarily a safe airspace.
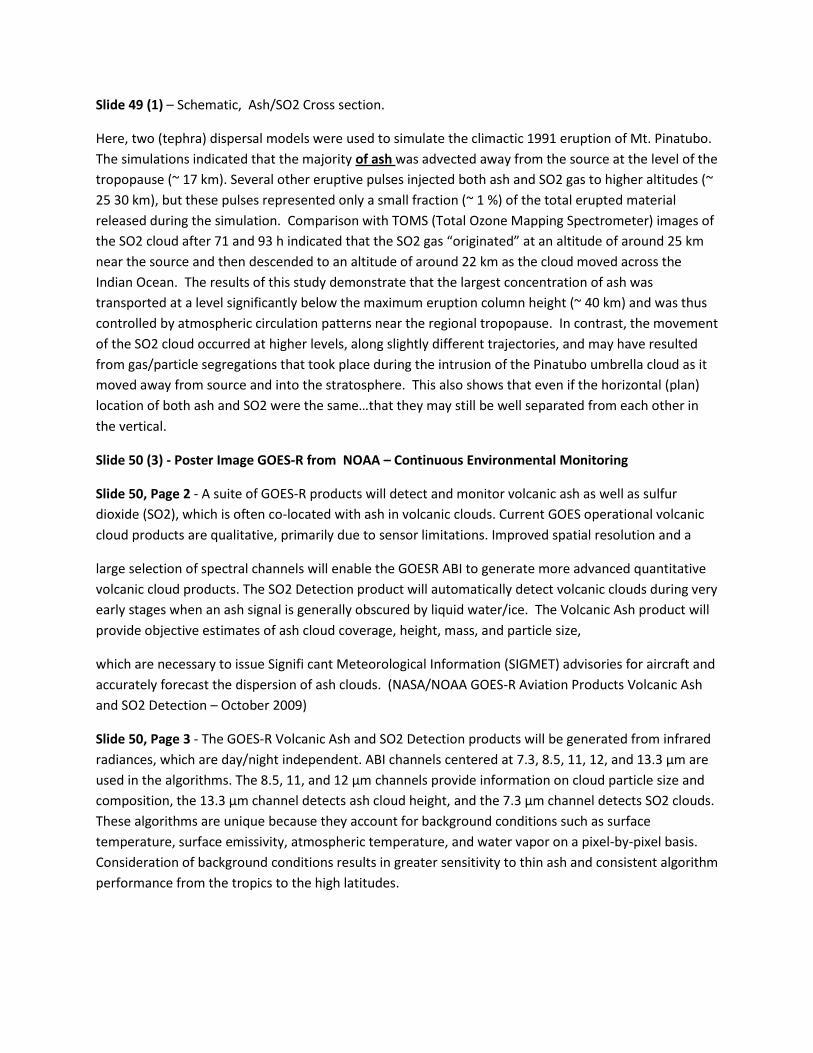
Slide 49 (1) – Schematic, Ash/SO2 Cross section.
Here, two (tephra) dispersal models were used to simulate the climactic 1991 eruption of Mt. Pinatubo.
The simulations indicated that the majority of ash was advected away from the source at the level of the
tropopause (~ 17 km). Several other eruptive pulses injected both ash and SO2 gas to higher altitudes (~
25 30 km), but these pulses represented only a small fraction (~ 1 %) of the total erupted material
released during the simulation. Comparison with TOMS (Total Ozone Mapping Spectrometer) images of
the SO2 cloud after 71 and 93 h indicated that the SO2 gas “originated” at an altitude of around 25 km
near the source and then descended to an altitude of around 22 km as the cloud moved across the
Indian Ocean. The results of this study demonstrate that the largest concentration of ash was
transported at a level significantly below the maximum eruption column height (~ 40 km) and was thus
controlled by atmospheric circulation patterns near the regional tropopause. In contrast, the movement
of the SO2 cloud occurred at higher levels, along slightly different trajectories, and may have resulted
from gas/particle segregations that took place during the intrusion of the Pinatubo umbrella cloud as it
moved away from source and into the stratosphere. This also shows that even if the horizontal (plan)
location of both ash and SO2 were the same…that they may still be well separated from each other in
the vertical.
Slide 50 (3) - Poster Image GOES-R from NOAA – Continuous Environmental Monitoring
Slide 50, Page 2 - A suite of GOES-R products will detect and monitor volcanic ash as well as sulfur
dioxide (SO2), which is often co-located with ash in volcanic clouds. Current GOES operational volcanic
cloud products are qualitative, primarily due to sensor limitations. Improved spatial resolution and a
large selection of spectral channels will enable the GOESR ABI to generate more advanced quantitative
volcanic cloud products. The SO2 Detection product will automatically detect volcanic clouds during very
early stages when an ash signal is generally obscured by liquid water/ice. The Volcanic Ash product will
provide objective estimates of ash cloud coverage, height, mass, and particle size,
which are necessary to issue Signifi cant Meteorological Information (SIGMET) advisories for aircraft and
accurately forecast the dispersion of ash clouds. (NASA/NOAA GOES-R Aviation Products Volcanic Ash
and SO2 Detection – October 2009)
Slide 50, Page 3 - The GOES-R Volcanic Ash and SO2 Detection products will be generated from infrared
radiances, which are day/night independent. ABI channels centered at 7.3, 8.5, 11, 12, and 13.3 μm are
used in the algorithms. The 8.5, 11, and 12 μm channels provide information on cloud particle size and
composition, the 13.3 μm channel detects ash cloud height, and the 7.3 μm channel detects SO2 clouds.
These algorithms are unique because they account for background conditions such as surface
temperature, surface emissivity, atmospheric temperature, and water vapor on a pixel-by-pixel basis.
Consideration of background conditions results in greater sensitivity to thin ash and consistent algorithm
performance from the tropics to the high latitudes.
Slide 51 (1) - GOES-R benefits. (in a nutshell)
The advanced spectral, spatial, and temporal resolution of the GOES-R ABI will be utilized to generate a
complete set of volcanic cloud detection and monitoring products, resulting in improved air and ground
safety as well as economic savings.
The GOES-R products will also be used to improve the modeling of volcanic ash clouds, which will allow
for more accurate ash cloud dispersion and ash fall forecasts.
Slide 52 (1) - Example Ash Products:
From NASA/NOAA GOES-R Aviation Products Volcanic Ash and SO2 Detection – March 23, 2009 – (Jim
Gurka, Steve Goodman, Mike Pavolonis and Gary Hufford) – Redoubt Eruption.
Slide 53 (1) – Aircraft Obs – Photo: Okmok 08/03/2008
View of Mount Saint Helens, initial eruption May 18, 1980.
Excellent airborne perspective. Great viewing distance and aspect. Can also use cameras.
However, there is limited nighttime use. Also, water/ice cloud or other poor visibility can obscure
volcanic cloud. Requires some local infrastructure and reliable communications. Limited nighttime use.
***Pilot weather radar is not sensitive to volcanic ash.
Slide 54 (3) – Ground Obs – Photo: View of the eruption (Okmok) plume as seen from Fort Glenn (ranch
building in foreground) on 8-03-2008. The small peak to the left is Tulik, an extra-caldera stratocone.
Picture Date: August 03, 2008 by Jessica Larsen.
Image courtesy of the Jessica Larsen, Alaska Volcano Observatory / University of Alaska Fairbanks,
Geophysical Institute.
On the plus side – can be a source of “remote access” for direct observations (direct or by video
camera). In addition, this technology is on the lower side and much cheaper. You also have the power of
local/subjective interpretation. Nighttime observations are also available in the form of thermal
infrared Heat/night-time measurements – however, this technology is much more expensive.
On the down side: Water/ice cloud or other poor visibility can obscure volcanic cloud. Requires locally
developed infrastructure and reliable communications. Automated systems are prone to vandalism or
theft. In areas without thermal infrared capability - daytime use only. Water/ice cloud or other poor
visibility can obscure volcanic cloud.
Slide 54, Page 2 – Ash laden turbulent “mammatus” ash clouds from Mount St. Helens volcano move
over Ephrata airport in Washington on the day following the initial eruption (May 18, 1980) - Monday,
May 19, 1980.
Slide 54, Page 3 - Of course, if you were (un)lucky enough to observe the St Helens eruption from the
wrong location, it could be hazardous to your health. This shot was taken from the streets of Yakima,
Washington at around 3:00 PM on May 18, 1980. Light gray volcanic ash covered the streets and
passersby wore masks to avoid breathing the ash.
Slide55 (1) – Radar Obs – Image: Mount Augustine 01/13/2006
From: 14th Symposium on Meteorological Observation and Instrumentation, WSR-88D OBSERVATIONS
OF VOLCANIC ASH, by Jefferson Wood* and Carven Scott (NOAA/National Weather Service) and David
Schneider (U.S. Geological Survey-Alaska Volcano Observatory) January 2007.
– From same paper, “The ability of the radar to provide near real-time updates on the position and
altitude of volcanic ash clouds can be vital in providing timely and accurate forecasts and warnings. One
of the most significant contributions made by the radar data is in short term aviation forecasting. Radar
cross sections were also routinely used for diagnosing the vertical disposition of ash clouds during
events. These observations, in tandem with pilot reports, were used to ascertain the vertical extent of
the ash clouds and issue timely advisories to the aviation community. The ability to track the volcanic
ash in the short-term was also vital to issuing timely and location-specific volcanic ashfall advisories.”
Strength - Can measure height and position (and help forecast projection and timing of ash plume) of
larger particles in ash cloud. However, you need relatively expensive ground radar stations (in the right
place) and even these have limited range. Portable radar units are also expensive to purchase and can
be quite hard to get to a good “viewing” location. Will not detect smaller particles well (unless
sufficiently dense). Observations can be obscured by heavy rain. Requires advanced local infrastructure/
communications and must be well staffed.
Slide 56 (3) - From: “Early Detection of the 5 April 2005 Anatahan Volcano Eruption using the Guam
WSR-88D” - Timothy P. Hendricks, National Weather Service Forecast Office, Guam
PGUA 0.5 degree reflectivity image for 1726 UTC 5 April 2005 - 50 to 55 dBZ observed at 9 km (30,000 ft)
over Anatahan.
NEXRAD WSR88D Radar is especially good (if within 250nm) at early detection of volcanic eruptions –
particularly in remote regions and at night. It also excels at getting good echo top measurement for
plume height estimates. At the time of the image here…plume height was already above 30kt ft…with
the 1.5 degree scan (next frame) showing echoes to over 50kt ft!
Anatahan erupted at approximately 1610 UTC. Within minutes, the PGUA WSR-88D signaled the onset
of another major eruption. Since Anatahan is located within the range of the PGUA WSR-88D, early
detection of major eruptions of the volcano is not only possible, but is likely. The PGUA 0.5 degree
reflectivity at 1616 UTC (six minutes after eruption began) shows a faint echo directly over Anatahan
between 20 and 30 dBZ. – with the plume tops already at least 9 km (30,000 ft) AGL. Less than an 1.5
hrs later, echoes were being pick up by the 1.5 deg tilt, showing plume tops over 50,000 ft (next Slide).
Slide 56, Page 2 - As in previous Slide: except at 1.5 deg tilt.
PGUA 1.5 degree reflectivity image for 1732 UTC 5 April 2005. At the peak of the eruption, 40 to 45 dBZ
echo to 15 km (50,000 ft) over
Anatahan.
Slide 56, Page 3 - As previous 2 Slides: Except combination image.
GOES-9 10.7um image and PGUA 0.5 degree reflectivity image for 1725 UTC 5 April 2005. The low level
plume can be seen trailing off to the southwest under influence of northeast trade winds. Northerly
winds aloft are steering the high level plume toward Tinian and Saipan.
Overlaying both satellite imagery with radar (AWIPS) imagery, gives much more confidence to analyzing
the event and figuring out what the observations are telling us. As in this example, in the tropical
western Pacific, volcanic clouds can contain or entrain moisture easily, making them difficult to
distinguish from meteorological clouds. However, the combination of PGUA WSR-88D and GOES-9
infrared (IR) imagery can be beneficial in tracking the extent and migration of the ash plume. The 1725
UTC PGUA-RADAR/GOES-9 IR combination shows the low level plume trailing off the southwest,
essentially trapped underneath the trade-wind inversion. However, a southward drift was discerned at
the higher levels. The low level plume is typically not a problem for commercial jets arriving from Japan,
Korea, Taiwan or Southeast Asia, as flight levels at descent are commonly near 6 km (20,000 ft) at that
range from Guam and Saipan International airports. However, the high level plume is a serious hazard,
which was relayed in Washington VAAC advisories and WFO Honolulu SIGMETS.
Slide 57 (2) - Lidar: The cross polarized signal on April16, 2010 above Paliseau France showing the main
part of the ash cloud from Eyjafjallajökull volcano as irregular particles originally at 6km at 16UTC
descending and thinning out to 3km by the end of the day.
Lidar (Light Detection And Ranging) is the visible light analog of radar. Very short laser pulses of light are
sent into the atmosphere, are scattered back to the lidar by gases and aerosols in the air, and from the
time out to these scatterers and the time to return back to the lidar, the position, concentration and
some information on the properties of the scatters are determined. In the most common configuration
of lidars in Europe in the EARLINET component of GALION, light at 355, 532 and 1064 nm (ultraviolet,
green and infrared) wavelengths is emitted vertically. Lidars can also be carried by satellites.
Currently there is a lot of interest in the transport of volcanic emissions. Layers of the volcanic ash
plume over Europe are detected as a function of time from 22 fixed stations by the Europe lidar network
EARLINET (see web Page for details) and several in Russia. The two figures show the backscatter for
parallel and cross-polarized light at 1064nm from the Paliseau, France, station of GALION. The cross-
polarized signal allows discrimination between normal pollution which tends to be small spherical
particles and the ash which, though small, is irregular in shape.
The aerosol properties observed include the identification of aerosol layers, profiles of optical properties
with known and specified precision (backscatter and extinction coefficients at selected wavelengths,
lidar ratio, Ångström coefficients), aerosol type (e.g. dust, maritime, fire smoke, urban haze), and

microphysical properties (e.g., volume and surface concentrations, size distribution parameters,
refractive index). Observations are planned to be made with sufficient coverage, resolution, and
accuracy to establish comprehensive aerosol climatology, to evaluate model performance, to assist and
complement space-borne observations, and to provide input to forecast models of "chemical weather".
Slide 57, Page 2 - The ash layers above Paliseau France the next day (on April17) showing descending
layers from 3 to 2km and a more diffuse layer of dust up to 7km. The features at 9-10km are cirrus
clouds.
Slide 58 (3)- Observational Strengths and weaknesses.
IR Weaknesses: Observed temperature can be misleading - Has to do with the same problem as that
with which you have in the detection of (optically) thin clouds. Thin clouds may have warmer brightness
temperatures than the actual physical temperature of the clouds. This effect occurs because the satellite
is "seeing through" the thin clouds to warmer clouds or to the warmer surface below. (Thus, a thin
clouds tend to have calculated heights that are “too low,” because the temperature matching technique
(algorithm) matches them with a temperature that is higher (lower height) than the physical cloud
temperature.
Slide58, Page 2 - More Strengths and weaknesses.
Slide 58, Page 3 - More Strengths and weaknesses.
Slide59 (1) – See Slide (Also, Ambiguity in atmospheric data due to the regional conditions of the
Earth’s surface below – i.e. very hard to tell differences between the two levels…low contrast, similar
apparent temperatures, etc.)
Slide 60 (2) – MODELING. Puff model run valid for May 5, 2010 08Z - WebPuff Version 2.2 – Run at
University of Alaska.
Numerical models of ash-cloud movement can forecast locations of ash-clouds and, in principle, can
forecast ash concentrations in a quantitative manner that is not possible through most remote sensing
or other observational means. However, the accuracy of such models hinges in large part to their input
data (what goes in determines what comes out…i.e crap in, crap out), which historically has not been
well understood during eruptions.
Slide 60, Page 2 – The PUFF and HYSPLIT Models.
(FYI - Dr. Craig Searcy developed and rewrote Dr. Tanaka’s version of PUFF as part of his PhD program.
An updated version is currently used by the National Weather Service (NWS), the Alaskan Volcano
Observatory, and the Volcanic Ash Advisory Center to track volcanic ash clouds. There are also two
other North American models used to predict ash movement – the HYSPLIT and the CANERM, or
Canadian Emergency Response Model.)
***POINTS TO REMEMBER: regardless of the particular model used, several types of input related to the volcanic source must be known or estimated during an eruption: — Height of the volcanic plume. This is the most important volcanic input, as it determines whether ash exists at typical jet cruise altitudes and in what wind fields and weather systems it disperses. Plume heights can range from less than a kilometer to nearly 50 km. They can be estimated from several satellite techniques, radar, or observations by ground observers or pilots. All these observations have uncertainties. Where multiple estimates of plume height are available, they commonly vary by several kilometers. Mass eruption rate, or rate at which ash is pumped into the atmosphere. Ash concentration in volcanic clouds is directly related to this rate, which ranges over more than five orders of magnitude for historical events. The mass eruption rate cannot be determined directly during an eruption; it can only be estimated by correlation with plume height. There is considerable scatter in the relationship of mass eruption rate and plume height, which reflects both real variance and measurement error. A plume height of 10 km correlates best with an eruption rate of about 1.8 million kg/s; but within the 1 standard-deviation error it could range from ~0.7 million kg/s to 8 million kg/s—more than an order of magnitude. Deviations from this trend are especially common among small eruptions in tropical regions, where plume height is boosted by the latent heat of rising moist air. Mass distribution of material in the plume by elevation. . Volcanic plumes are driven upward by buoyancy of hot gas and air. Large eruptions pump out so much heat that ash columns can ascend over 100 km per hour to an elevation at which their density equals that of the surrounding atmosphere. These rapidly rising columns are unlikely to be bent over by wind, thus forming a straight or “strong” plume that spreads laterally near its top to form an umbrella cloud. Most mass is concentrated at this elevation. In contrast, small eruptions rise slowly and are easily affected by wind to form a bent or “weak plume”. Weak plumes distribute mass over a wider range of elevation in the atmosphere. Sometimes it is possible to distinguish these plume types during an eruption and adjust model input. Fragment size and rate of fallout. Erupted fragments, which are known as tephra, range in size from meters to less than a micrometer (micron); ash is tephra that is less than 2 mm (2000 microns) in diameter. Individual fragments may rise to many kilometers and then fall out as they travel downwind. Fragments larger than several tens of microns can fall at a meter per second or faster, reaching the ground within several hours and usually within a few hundred kilometers of the volcano. Micron-sized fragments would theoretically fall at centimeters per second or less, staying in the atmosphere for days. The fraction of the erupted mass that consists of these small particles is not well understood because most of our knowledge comes from deposits that fall from the ash cloud—not the cloud itself. Slide 61 (1) – The PUFF Model. Puff simulates the transport, dispersion and sedimentation of volcanic
ash. It requires horizontal wind field data as a function of height on a regular grid covering the area of
interest. Puff output includes the location (in 3 dimensions), size, and age-since-eruption of
representative ash particles. It can also produce gridded data of relative and absolute ash concentration
in the air and on the ground. Puff is a fast and efficient research and operational tool for predicting the
trajectories of ash particles, and is considered an essential tool for hazard assessment.
As an aid to monitoring techniques, the PUFF ash tracking model has been developed for predicting ash
movement. These forecasts provide information on the location and extent of the ash cloud when
observations are not available. Results are also used to alert concerned parties in near-real time of
potential ash cloud location usually, in less than an hour after an eruption.
The PUFF model is mainly concerned with the tracking of "young" eruption clouds. Young clouds are
defined here as less than 48-60 hours old. These are especially dangerous to aircraft since
concentrations are highest during this period. The North Pacific region includes some of the heaviest air
traffic in the world, mostly in the form of cargo flights. Young eruption clouds offer great potential for
loss of life, equipment, productivity and commerce during an eruption.
Lagrangian: Describe changes which occur as you follow a fluid particle along its trajectory.
Eulerian: Describe changes as they occur at a fixed point in the “fluid.”
More info (Than you probably need): PUFF is a dynamic pollutant tracer model developed to simulate
the behavior of young ash clouds. For emergency-response applications, it requires near real-time
forecast wind data to predict the movement of the ash cloud. The model is based on the three-
dimensional Lagrangian formulation of pollutant dispersion. PUFF initializes a collection of discrete ash
particles representing a sample of the eruption cloud and calculates transport, turbulent dispersion and
fallout for each particle.
In Lagrangian form, given a time step Dt, the position vector for each particle is updated from time t to
time t + Dt by the equation:
Ri(t + Dt) = Ri(t) + W(t)Dt + Z(t)Dt + Si(t)Dt
(1) where Ri is the position vector of the ith ash particle at time t, W is the local wind velocity, Z is a
vector representing turbulent dispersion and Si is the terminal gravitational fallout vector, dependent on
the ith particle's size. The particles are driven by subsampling wind from a four-dimensional mesoscale
model at a particle's position and calculating its next position according to the above formulation.
Lagrangian random walk formulations have been used successfully in a variety of numerical applications.
Subsampling wind data in a Lagrangian formulation as in the PUFF model allows a higher resolution for
tracking ash clouds during the first critical few hours. The Lagrangian method also requires no estimate
of the mass distribution of the cloud which would not be available in real-time during an eruption.
For more on the PUFF model: http://pafc.arh.noaa.gov/puff/jvgr/puffpaper.html
Slide 62 (6) Pages 2 thru 6 – Example of hypothetical Okmok eruption valid for May 4-5, 2010.
Generated from PuffWeb v2.2, NOAA/NWS Alaska Region Headquarters, Anchorage Alaska.
Slide 63 (1) – Characteristics of the HYSPLIT Model
The transport and dispersion of a pollutant is calculated by assuming the release of a single puff with
either a Gaussian or top-hat horizontal distribution or from the dispersal of an initial fixed number of
particles. A single released puff will expand until its size exceeds the meteorological grid cell spacing and
then it will split into several puffs. The Hysplit_4 approach is to combine both puff and particle methods
by assuming a puff distribution in the horizontal and particle dispersion in the vertical direction. The
resulting calculation may be started with a single particle. In this way, the greater accuracy of the
vertical dispersion parameterization of the particle model is combined with the advantage of having an
expanding number of puffs represent the pollutant distribution as the spatial coverage of the pollutant
increases. Air concentrations are calculated at a specific grid point for puffs and as cell-average
concentrations for particles. A concentration grid is defined by latitude-longitude intersections. The
HYSPLIT model is also useful in predicting ash plume concentrations as they forward in time.
However - Dispersion models used operationally have a number of set parameters that can produce
over or under estimates of the amount of ash in the atmosphere. It is a standard practice for the US
VAACs to compare the model’s output to what we can see or infer from satellite interpretation. This
quality control often times produces the best combination of forecast tools with observed VA. This
assessment is done qualitatively and on-the-fly as time is critical for the issuance of the VAA and VAG
(graphical VAA)
*On January 25, 2005, NOAA NCEP began running HYSPLIT for volcanic ash dispersion modeling.
HYSPLIT replaced the VAFTAD operationally in 2007*
***More, in depth - http://www.epa.gov/scram001/9thmodconf/draxler.pdf***
Slide 64 (1) - Example of HYSPLIT Trajectory (Ensemble).
Hypothetical HYSPLIT Ensemble Trajectory forecast for the lower 48 – if the Super-volcano were to erupt
from Yellowstone (May 5, 2010). This is a 48 hour forcast. Model run above was run using the WRF
12km run initialized on May 5, 2010@12Z.
Trajectory Ensemble option starts multiple trajectories from the first selected starting location
(Yellowstone in this case). Each member of the trajectory ensemble is calculated by offsetting the
meteorological data by a fixed grid factor. This results in 27 members for all-possible offsets in 3
dimensions.
Advantage to ensemble: Give a decent approximation of the plume using a group of trajectories. Since
a single trajectory cannot properly represent the growth of a pollutant cloud when the windfield varies
in space and height, this simulation is, instead, conducted using many volcanic ash particles (separate
trajectories).
Slide 65 (2) - Examples of HYSPLIT Layer Dispersion Forecast 18Z April 26, 2010 through 12Z April 27.
Eyjafjallajokull Volcano – 18 hour forecast.
Read across from left to right.
Slide 65, Page 2 - Examples of HYSPLIT Layer Dispersion Forecast 18Z April 27, 2010 through 12Z April
28. Eyjafjallajokull Volcano
Read across from left to right.
Slide 66 (1) - Example of HYSPLIT Mass Dispersion Forecast
Slide 67 (9) – 9 forcast Slides - HYSPLIT Mass Dispersion Forecast valid for 00Z April 26, 2010 to 12Z April
27, 2010. Eyjafjallajokull Volcano
Slide 68 (1) - Example of HYSPLIT Particle Dispersion Forecast
Slide 69 (9) – Forecast slides - HYSPLIT Particle Dispersion Forecast valid for 00Z April 26, 2010 to 12Z
April 27, 2010. Eyjafjallajokull Volcano
Slide 70 (2) - The CANERM - Above is an example of Eyjafjallajokull (ay-yah-FYAH'-plah-yer-kuh-duhl)
run for possible effect to Europe April 26-27, 2010.
The Canadian Emergency Response Model (CANERM) is a 3-dimensional numerical transport and
dispersion model that calculates advection and diffusion, but also simulates wet and dry depositional
processes. CANERM was initially designed to model the transport of radioactive contaminants in the
atmosphere. However, it has been adapted for volcanic ash and is now used as an emergency forecast
tool for predicting the movement of volcanic ash clouds that may threaten Canadian air space.
CANERM is a fully operational model at the Montreal Volcanic Ash Advisory Center (VAAC) which
operates as part of the Canadian Meteorological Center (CMC). Daily forecasts are produced for active
or potentially active volcanoes and are ready to be administered to proper aviation weather forecasting
authorities if needed. The model can also be executed by the on-duty meteorologist at the CMC on a 24-
hour basis. A simulation can be produced for any volcano in the world.
Slide 70, Page 2 - Hysplit model run – Starting April 26, 2010 00Z and run to April 27, 2010 12Z (36hrs)
for Eyjafjallajokull (ay-yah-FYAH'-plah-yer-kuh-duhl) Volcano for same time period as CANERM.
Slides 71 through 78 - Use if time allows…or with recorded audio version…otherwise skip to Slide 78.
Slide 71 - May 7th Visible (Meteosat 9)
Slide 72 – Loop of Visible
Slide 73 - May 7th Close-up Visible (Meteosat 9)
Slide 74 – Loop of Close-up visible
Slide 75 - May 7th Longwave IR (Meteosat 9)
Slide 76 – Loop of Longwave IR
Slide 77 - May 7th example Split Window Longwave Difference.
Slide 78 – Loop of Split Window Longwave Diffrerence
Slide 79 – Model Runs (Particle Dispersion) over CONUS July 21, 2010 00Z to July 23, 2010 00Z.
Slide 80 – Mount Lassen Title Page – Last erupted May 22, 1915
Slide 81 HYSPLIT Model – Particle Dispersion for Mt Lassen starting July 21, 2010 (48hrs).
Slide 82 – Mt. Shasta Title Page
Slide 83 - HYSPLIT Model – Particle Dispersion for Mt Shasta starting July 21, 2010 (48hrs).
Slide 84 – Long Valley Caldera Title Page
Slide 85 - HYSPLIT Model – Particle Dispersion for Long Valley Caldera starting July 21, 2010 (48hrs).
Slide 86 – Mount Rainier Title Page
Slide 87 - HYSPLIT Model – Particle Dispersion for Mt Rainier starting July 21, 2010 (48hrs).
Slide 88 – Yellowstone caldera Title Page
Slide 89 - HYSPLIT Model – Particle Dispersion for Yellowstone Caldera starting July 21, 2010 (48hrs).
Slide 90 (1) – What’s coming in part 2 of Volcanoes and Volcanic Ash.
Slide 91 (1) – End Part 1.
Contacts:
CIRA/VISIT/SHyMet contact: Jeff Braun: [email protected]
NWS Alaska Region ESSD contact: Jeff Osiensky: [email protected]
NWS Anchorage CWSU contact: Kristine Nelson: [email protected]
Slide 92 (14) – Eyjafjallajökull Image Montage – (use as time allows )
14 Image montage to show while delivering the following info (or other). Optional at end of recorded
session.
The Eyjafjallajökull volcano in Iceland last began erupting during the winter of 1821-1822 – an eruption
that lasted for more than a year. 188 years later (March 20, 2010) the eruption began again with widely
varying results (and ironic twists) to the economies and populations in and near the European continent.
The first eruptive cycle, which began on March 20th 2010 and Lasted until April 12th of the same year,
was a boon (tourist boom) for recession-weary Iceland, whose banking system collapsed 18 months
earlier, capsizing the economy and sending unemployment soaring. As Eyjafjallajokull volcano began
erupting – threatening floods and earthquakes all along - thousands of adventurous tourists clamored
to the region bringing desperately needed cash. Icelandic tour companies and other service industries
made a small fortune during this period as drivers, hikers and other gawkers caused unprecedented
traffic jams in what is normally a sparsely populated rural area. Even airlines were making out well as
charter airline - Iceland Express – showed as its business rose by some 20 percent since the eruption
began. The Icelandic Tourist Board said that 26,000 overseas visitors came to the country in March, a
record for a usually quiet month (when Iceland is still in its winter hibernation). But, as they say, all
good things must come to an end. And it did.
By April 12th the main magma chamber of the volcano became blocked – which killed the first eruption,
but which caused intense pressure to build. Then, less than two days later the second eruption began –
this time with a vengeance. This new eruption had been thought to have been about 10 times stronger
than the first – melting glacier ice in and around the crater much quicker than before which helped in
causing this eruption to be much more explosive than the first (phreatomagmatic). Through at least the
first week after the second eruption began, billions of tons of ash (a rate of around 750 tons per second)
from the eruption had been shot into the atmosphere – disrupting air travel all over northern Europe,
with flights that were grounded or diverted (over 90,000 flights total) due to the risk of engine damage
from sucking in particles of ash from the volcanic cloud. As of April 24th (first 10 days after) the total
loss of revenue to only the airline industry was around 3.0 billion dollars! Of course, the toll to stranded
passengers (worldwide) as well as all the various cargo importations – (and loss of revenue to many
businesses) has since climbed into the 5 to 6 billion dollar range. Quite ironic in the difference between
the two eruptions over a month’s time. And – another very scary repercussion of all this still awaits on
the horizon – that this eruption could help trigger Mt Katla, a much more powerful volcano nearby – and
one that covered by a much thicker ice sheet – AND, one that is overdue - for an eruption!!!