Embed Size (px)
Citation preview

Talks & Statistics (wrapping up)
Psych 231: Research Methods in Psychology

Announcements
Class experiment final draft papers due today Please make sure that your GA’s name is on it

Your posters (our checklist)
Content Introduction
• Problem of interest• Very brief summary of
past research• Basic purpose of
experiment(s)• Hypotheses
Method• Brief but clear• Design• Materials• Procedure (brief)
Results• Descriptive statistics• Inferential results
Tables and figures• Useful info to reader• Easy to understand
Discussion• Hypothesis rejected or
supported• Implication of results• A few take home points
References

Your posters (our checklist)
Format Overall clarity Organization Font size Figure/text balance Title Authors

Different kinds of talks
Research Presentations (typically 10 to 30 mins)
Paper with respondent Panel Presentation Workshop

Talk Content
Create a logical progression to the talk Hourglass shape Work on the transitions between slides
Be brief, but include enough details so that the audience can follow the arguments Use slides to help simplify/clarify points
• Include tables, graphs, pictures, etc. • Don’t just read the slides• but do “walk through” those that need it (e.g. graphs of
results) Be careful of jargon, explain terms (if in fact you
really need them)

Presentation of the talk
Make it smooth (lots of practice will help) Watch your speaking rate (again, practice) Maintain eye contact with whole audience Emphasize the key points, make sure that the
audience can identify these Point to the slides if it helps Beware jokes, can be a double-edged sword Don’t go over your time

Dealing with questions
Repeat the question in your own words so that the rest of the audience can hear it to make sure that you understood the question to buy yourself some time to think about the answer
Try not to be nervous you know your study better than anyone else
When preparing, try to think of likely questions and
prepare answers
Checklist for the talk
Preparation Analyze the audience Choose your main points
etc.
Prepare the Final Outline fix any problems/loose ends
Construct your “speaking” outline e.g., the note cards that you’ll read
Rehearse, rehearse, rehearse

Some inferential statistical tests
1 factor with two groups T-tests
• Between groups: 2-independent samples
• Within groups: Repeated measures samples (matched, related)
1 factor with more than two groups Analysis of Variance (ANOVA) (either between groups or
repeated measures)
Multi-factorial Factorial ANOVA
Analysis of Variance
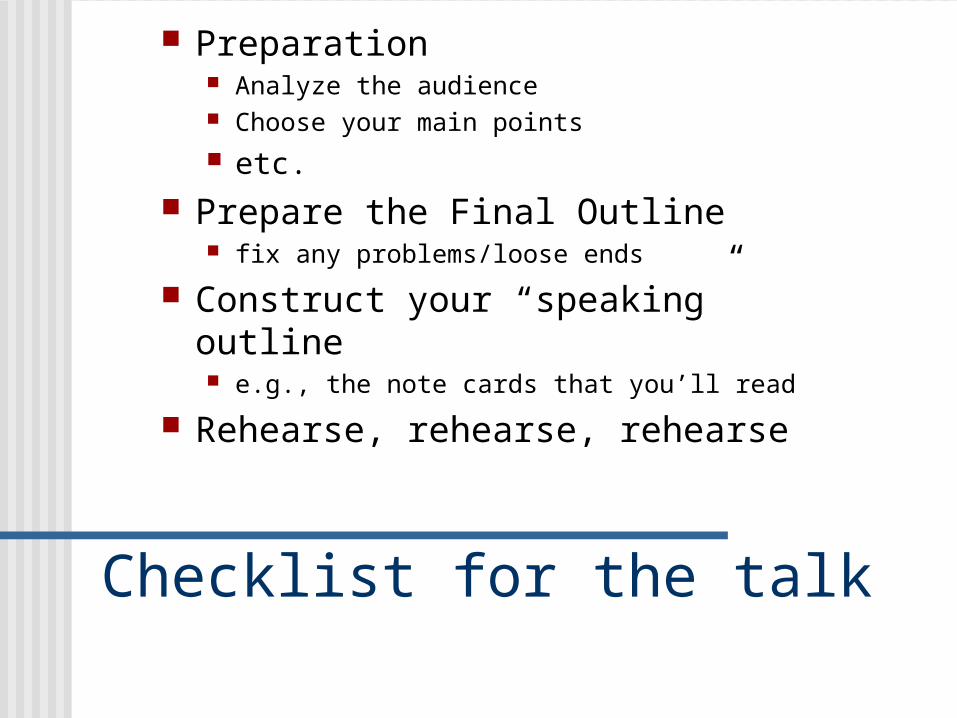
More than two groups Now we can’t just compute a simple difference score since
there are more than one difference
So we use variance instead of simply the difference• Variance is essentially an average difference
Observed variance
Variance from chanceF-ratio =
Lot’s of degree’s of freedom to keep track of• Overall df, df for numerator, df for denominator

1 factor ANOVA
1 Factor, with more than two levels Now we can’t just compute a simple difference score since
there are more than one difference• A - B, B - C, & A - C
XBXA XC

1 factor ANOVA
Null hypothesis: H0: all the groups are equal
XA = XB = XC
Alternative hypotheses
HA: not all the groups are equal
XA ≠ XB ≠ XC XA ≠ XB = XC
XA = XB ≠ XC XA = XC ≠ XB
The ANOVA tests this one!!
Do further tests to pick between these
XBXA XC

1 factor ANOVA
Planned contrasts and post-hoc tests:
- Further tests used to rule out the different Alternative
hypothesesXA ≠ XB ≠ XC
XA ≠ XB = XC
XA = XB ≠ XC
XA = XC ≠ XB
Test 1: A ≠ B
Test 2: A ≠ C
Test 3: B = C

Reporting your results The observed differences Kind of test Computed F-ratio Degrees of freedom for the test The “p-value” of the test Any post-hoc or planned comparison results
“The mean score of Group A was 12, Group B was 25, and Group C was 27. A 1-way ANOVA was conducted and the results yielded a significant difference, F(2,25) = 5.67, p < 0.05. Post hoc tests revealed that the differences between groups A and B and A and C were statistically reliable (respectively t(1) = 5.67, p < 0.05 & t(1) = 6.02, p <0.05). Groups B and C did not differ significantly from one another”
1 factor ANOVA

Factorial ANOVAs
We covered much of this in our experimental design lecture More than one factor
Factors may be within or between Overall design may be entirely within, entirely between, or mixed
Many F-ratios may be computed An F-ratio is computed to test the main effect of each factor An F-ratio is computed to test each of the potential interactions
between the factors

Factorial ANOVAs
Reporting your results The observed differences
• Because there may be a lot of these, may present them in a table instead of directly in the text
Kind of design• e.g. “2 x 2 completely between factorial design”
Computed F-ratios• May see separate paragraphs for each factor, and for interactions
Degrees of freedom for the test• Each F-ratio will have its own set of df’s
The “p-value” of the test• May want to just say “all tests were tested with an alpha level of
0.05” Any post-hoc or planned comparison results
• Typically only the theoretically interesting comparisons are presented