Embed Size (px)
Citation preview
STUDIES ON THE PROPERTIES OF PMMA-BASED POLYMER ELECTROLYTE FOR LITHIUM
RECHARGEABLE BATTERY
TAN KIA WUI
MASTER OF ENGINEERING SCIENCE
FALCULTY OF ENGINEERING AND SCIENCE UNIVERSITI TUNKU ABDUL RAHMAN
JANUARY 2013


STUDIES ON THE PROPERTIES OF PMMA-BASED POLYMER ELECTROLYTE FOR LITHIUM RECHARGEABLE BATTERY
By
TAN KIA WUI
A thesis submitted to the Department of Electrical and Electronic Engineering,
UniversitiTunku Abdul Rahman, In partial fulfillment of the requirement for the degree of
Master of Engineering Science January 2013

ii
ABSTRACT
STUDIES ON THE PROPERTIES OF PMMA-BASED POLYMER ELECTROLYTE FOR LITHIUM RECHARGEABLE BATTERY
Tan Kia Wui
In this study, four poly(methyl methacrylate) (PMMA) hosted solid polymer
electrolyte systems were prepared by a solution cast technique. A fixed amount
of ethylene carbonate and propylene carbonate (EC/PC) (70/30) mixture was
set as plasticiser; aluminum oxide (Al2O3) and fumed silica (SiO2) were
implemented as ceramic filler and lithium perchlorate (LiClO4) as dopant salt.
The study was carried out using Electrochemical Impedance Spectroscopy
(EIS), Fourier Transform Infrared Spectroscopy (FTIR), X-ray Diffraction
(XRD) and Scanning Electron Microscope (SEM). The integrating 30 wt% of
EC/PC into PMMA enhanced the ionic conductivity from 3.19 x 10⁻¹¹ Scm-1 to
7.57 x 10⁻¹⁰ Scm-1.With another addition of 25 wt% of LiClO4, the ionic
conductivity is increased to 3.95 x 10⁻⁵ Scm-1. This has inferred the
enhancement of charge carrier density in the polymer electrolyte. A further
addition of ceramic fillers with 12 wt% of Al2O3 and SiO2, boosted the ionic
conductivity to 1.02 x 10⁻⁴ Scm-1and 2.48 x 10⁻⁴S cm-1,respectively. This
enhancement is attributed to the Lewis acid-base interaction and the formation
of three dimensional networks for ionic conduction. In the temperature vs
conductivity studies, the entire polymer electrolytes showed the Arrhenius
behaviour. Through the XRD studies the enhancement of amorphous region is

iii
confirmed. The result is further proven by FTIR studies indicating the
occurrence of complexation between host polymer and the additives. The SEM
images showed the formation of three dimensional networks with dispersion of
ceramic fillers. It can be concluded that appropriate amount of lithium salt (25
wt% of LiClO4) and ceramic filler (12 wt% ofAl2O3 and 12 wt% of SiO2)
enhances the ionic conductivity of the PMMA-based solid polymer electrolyte.

iv
ACKNOWLEDGEMENTS
Firstly, I would like to take this opportunity to express my deepest
appreciation and gratitude to my supervisor, Dr. Chew KuewWai and co-
supervisor, Dr. Yong ThianKhok for their assistance and guidance throughout
this project stint. The supervision and support that they gave truly help the
progression and smoothness of this research. I really appreciate all their effort
and guidance during this research period.
My grateful thanks also go to UTAR as this work was supported by
UTAR Research Fund (UTARRF). It also provides the venue for education and
research instruments, apparatus and facilities. In addition, it provides a good
working environment for the completion of this research. I also wish to express
my appreciation to all the laboratory officers for their assistance and patience
throughout this lab work.
Finally, I would like to thank my family members and course mates for
their support, encouragement and suggestions in this research.
v
APROVAL SHEET
This dissertation/ thesis entitled “STUDIES ON THE PROPERTIES OF
PMMA-BASED POLYMER ELECTROLYTE FOR LITHIUM
RECHARGEABLE BATTERY” was prepared by TAN KIA WUI and
submitted as partial fulfillment of the requirements for the degree of Master of
Engineering Science at UniversitiTunku Abdul Rahman.
Approved by:
____________________ (Dr. Chew KuewWai Date:___________ Supervisor Department of Electrical and Electronic Engineering Faculty of Engineering and Science UniversitiTunku Abdul Rahman ____________________ (Dr. Yong ThianKhok) Date:___________ Co-supervisor Department of Electrical and Electronic Engineering Faculty of Engineering and Science UniversitiTunku Abdul Rahman

vi
FACULTY OF ENGINEERING AND SCIENCE
UNIVERSITI TUNKU ABDUL RAHMAN
Date: _28/1/2013___
SUBMISSION OF THESIS
It is hereby certified that TAN KIA WUI (ID No: 10UEM07420) has completed
this thesis entitled “STUDIES ON THE PROPERTIES OF PMMA-BASED
POLYMER ELECTROLYTE FOR LITHIUM RECHARGEABLE
BATTERY” under the supervision of Dr. CHEW KUEW WAI (Supervisor)
from the Department of Electrical and Electronic Engineering, Faculty of
Engineering and Science, and Dr. YONG THIAN KHOK (Co-Supervisor) from
the Department of Elecrical and Electronic Engineering, Faculty of Engineering
and Science.
I understand that University will upload softcopy of my thesis in pdf format into
UTAR Institutional Repository, which may be made accessible to UTAR
community and public.
Yours truly,
____________________
(TAN KIA WUI)

vii
DECLARATION
I hereby declare that this dissertation is based on my original work except for
quotations and citations which have been duly acknowledged. I also declare
that it has not been previously or concurrently submitted for any other degree
at UTAR or other institutions.
Name :_TAN KIA WUI_______
Date :__28/1/2013___________

viii
TABLE OF CONTENTS
Page ABSTRACT ii ACKNOWLEDGEMENTS iv APROVAL SHEET v SUBMISSION OF THESIS vi DECLARATION vii TABLE OF CONTENT viii LIST OF TABLES xi LIST OF FIGURES xii LIST OF ABBREVIATIONS xvi CHAPTERS 1.0 INTRODUCTION 1 1.1 Background of Studies 1 1.2 Justification of Studies 3 1.3 Aim and Objectives of Research 4 1.5 Organisation of Thesis 5 2.0 LITERATURE REVIEW 7 2.1 Types of Battery 7 2.2 The Development of Lithium ion Polymer Battery 9 2.2.1 Main Components of a Rechargeable Battery 11 2.2.2 Discharging and Recharging Mechanism of
Lithium onRechargeable Battery 12 2.2.3 Lithium Ion Polymer Battery 14 2.3 The Development of Polymer Electrolyte 17 2.4 Development of PMMA-Based Polymer Electrolyte 19 2.5 Electrolytes for Li-Ion Battery 21 2.5.1 Solid Polymer Electrolyte (SPE) 22 2.5.2 Gelled Polymer Electrolyte (GPE) 24 2.5.3 Composite Solid Polymer Electrolyte (CSPE) 26 2.6 Ionic Conductivity of Polymer Electrolyte 28 2.6.1 The Effect of Plasticizer to the Ionic
Conductivity in Polymer Electrolyte 30 2.6.2 The Effect of Lithium Salt to the Ionic
Conductivity in Polymer Electrolyte 32 2.6.3 The Effect of Inorganic Filler to the Ionic
Conductivityin Polymer Electrolyte 33 2.6.4 The Effect of Temperature towards the Ionic Conductivity 35

ix
3.0 RESEARCH METHODOLOGY 37 3.1 Materials 37 3.1.1 Poly(methylmethacrylate) (PMMA) 37 3.1.2 Lithium Perchlorate (LiClO4) 40 3.1.3 Ethylene Carbonate (EC) 42 3.1.4 Propylene Carbonate (PC) 44 3.1.5 Aluminum Oxide (Al2O3) 46 3.1.6 Silicon Dioxide (SiO2) 48 3.1.7 Tetrahydrofuran THF 50 3.2 Solution-Cast Technique 51 3.3 Characterisations 53 3.3.1 Electrochemical Impedance Spectroscopy (EIS) 54 3.3.2 Fourier Transform Infrared Spectroscopy (FTIR) 58 3.3.3 X-Ray Diffraction (XRD) 60 3.3.4 Scanning Electron Microscope (SEM) 64 4.0 RESULT AND DISCUSSION 68 4.1 Electrochemical Impedance Spectroscopy (EIS) Studies 68 4.1.1 Ionic Conductivity at ambient temperature 70
4.1.1.1 Ionic Conductivity for determining the optimumECand PC mixture ratio 70
4.1.1.2 Ionic Conductivity Results for PMMA -EC/PCsystem 71
4.1.1.3 Ionic Conductivity Results for PMMA -EC/PC-LiClO4 system 73
4.1.1.4 Ionic Conductivity Results for PMMA -EC/PC-LiClO4-Al2O3 system 76
4.1.1.5 Ionic Conductivity Results for PMMA -EC/PC-LiClO4-SiO2 system 79
4.1.1.6 Summary of Ionic Conductivity Result at ambient Temperature 82
4.1.2 Temperature Dependence– Ionic Conductivity of Polymer Electrolytes 84
4.1.3 Dielectric Relaxation Studies 87 4.1.3.1 Dielectric Relaxation Studies on Polymer
Electrolytesat Room Temperature 88 4.1.3.2 Dielectric Relaxation Studies on Polymer
Electrolytesin the Temperature Range of 298 K to 373 95
4.2 X-ray Diffraction (XRD) Studies 100 4.2.1 PMMA-EC/PC samples XRD Result 101 4.2.2 PMMA-EC/PC-LiClO4samples XRD Result 104 4.2.3 PMMA-EC/PC-LiClO4-Al2O3samples XRD
Result 108 4.2.4 PMMA-EC/PC-LiClO4-SiO2 samples XRD Result 111 4.2.5 Summary of XRD characterization 113
4.3 Fourier Transform Infrared (FTIR) Studies 116 4.3.1 FTIR for PMMA-EC/PC samples 116 4.3.2 FTIR for PMMA-EC/PC-LiClO4samples 124 4.3.3 FTIR for PMMA-EC/PC-LiClO4–Al2O3 samples 131

x
4.3.4 FTIR for PMMA-EC/PC-LiClO4–SiO2 samples 135 4.3.5 Summary of FTIR Spectroscopy 140
4.4 Scanning Electron Microscopy (SEM) Studies 144 4.4.1 PMMA-EC/PC SEM 144 4.4.2 PMMA-EC/PC-LiClO4SEM 147 4.4.3 PMMA-EC/PC-LiClO4-Al2O3SEM 150 4.4.4 PMMA-EC/PC-LiClO4-SiO2SEM 154 4.4.5 SEM images for Highest Ionic Conductivity
Samples in each system 157 4.5 Mechanical Properties 159
5.0 CONCLUSION 167 5.1 Summary 167 5.2 Suggestion for Future Work 170 LIST OF REFERENCES 172
xi
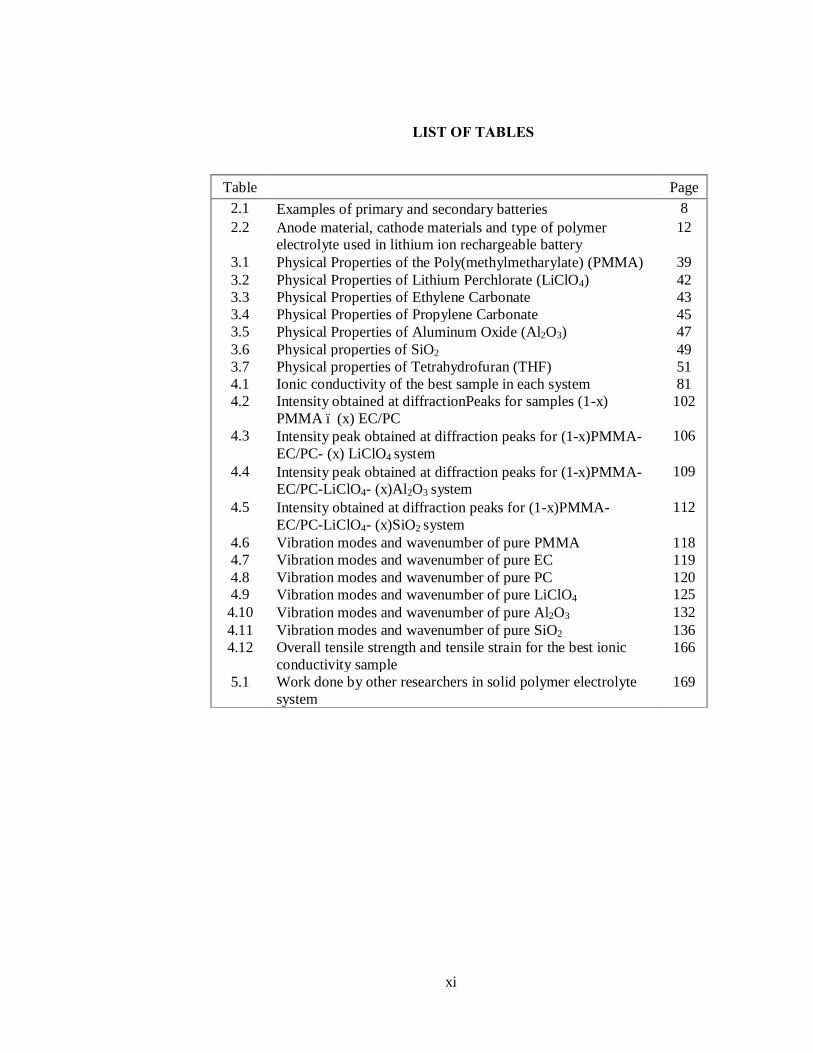
LIST OF TABLES
Table Page 2.1 Examples of primary and secondary batteries 8 2.2 Anode material, cathode materials and type of polymer
electrolyte used in lithium ion rechargeable battery 12
3.1 Physical Properties of the Poly(methylmetharylate) (PMMA) 39 3.2 Physical Properties of Lithium Perchlorate (LiClO4) 42 3.3 Physical Properties of Ethylene Carbonate 43 3.4 Physical Properties of Propylene Carbonate 45 3.5 Physical Properties of Aluminum Oxide (Al2O3) 47 3.6 Physical properties of SiO2 49 3.7 Physical properties of Tetrahydrofuran (THF) 51 4.1 Ionic conductivity of the best sample in each system 81 4.2 Intensity obtained at diffractionPeaks for samples (1-x)
PMMA – (x) EC/PC 102
4.3 Intensity peak obtained at diffraction peaks for (1-x)PMMA-EC/PC- (x) LiClO4 system
106
4.4 Intensity peak obtained at diffraction peaks for (1-x)PMMA-EC/PC-LiClO4- (x)Al2O3 system
109
4.5 Intensity obtained at diffraction peaks for (1-x)PMMA-EC/PC-LiClO4- (x)SiO2 system
112
4.6 Vibration modes and wavenumber of pure PMMA 118 4.7 Vibration modes and wavenumber of pure EC 119 4.8 Vibration modes and wavenumber of pure PC 120 4.9 Vibration modes and wavenumber of pure LiClO4 125 4.10 Vibration modes and wavenumber of pure Al2O3 132 4.11 4.12
Vibration modes and wavenumber of pure SiO2 Overall tensile strength and tensile strain for the best ionic conductivity sample
136 166
5.1 Work done by other researchers in solid polymer electrolyte system
169

xii
LIST OF FIGURES
Figure Page 2.1 Discharge and recharge mechanism for a lithium ion
rechargeable battery 14
2.2 Solid polymer electrolyte battery (Linden and Reddy, 2002) 15 3.1 Chemical structure of MMA 39 3.2 Chemical structure of LiClO4 41 3.3 Chemical structure of Ethylene Carbonate 43 3.4 Chemical structure of Propylene Carbonate 44 3.5 Chemical structure of Alumina Oxide (Al2O3) 46 3.6 Chemical structure of SiO2 48 3.7 Chemical structure of Tetrahydrofuran (THF) 50 3.8 Polymer Electrolyte Samples 52 3.9 Cole-Cole plot of AC impedance spectroscopy 55 3.10 Equivalent circuit of the AC impedance spectroscopy 56 3.11 Experimental setup of Solartron SI 1260 Impedance/ Gain-
Phase Analyzer 57
3.12 Operation of the FTIR spectroscopy 59 3.13 Experimental setup of Perkin Elmer Spectrum RX1 FTIR
spectroscopy 60
3.14 Diffraction in the crystalline material 62 3.15 Experimental setup of the Shimazu XRD-6000 diffratometer 63 3.16 Experimental setup of the Hitachi S-3400N Scanning
Electron Microscope 67
4.1 Cole-Cole plot of a.cimpedamce spectroscopy for 12 wt % Al2O3, 12 wt% SiO2 and sample without filler
68
4.2 Ionic Conductivity of EC in (EC + PC) 70 4.3 Ionic Conductivity versus wt% of EC/PC mixture added into
PMMA 72
4.4 Ionic Conductivity versus wt% of LiClO4 added into PMMA-EC/PC
74
4.5 Ionic Conductivity versus wt% of nano-sized Al2O3 added into PMMA-EC/PC- LiClO4
77
4.6 Ionic Conductivity versus wt% of nano-sized SiO2 added into PMMA-EC/PC-LiClO4
80
4.7 Ionic conductivity of the best sample in each system 82 4.8 Temperature dependence of polymer electrolytes with 12
wt% of SiO2, 12 wt% of Al2O3 and without filler 85
4.9 Real part of complex permittivity (ε’) for PMMA-EC/PC-(x wt%) LiClO4 corresponding to frequency
89
4.10 Real part of complex permittivity (ε’) for PMMA-EC/PC-LiClO4-(x wt%) Al2O3 corresponding to frequency
90
4.11 Real part of complex permittivity (ε’) for PMMA-EC/PC-LiClO4-(x wt%) SiO2 corresponding to frequency
90

xiii
4.12 Imaginary part of complex permittivity (ε”) for PMMA-EC/PC-(x wt%) LiClO4 corresponding to frequency
92
4.13 Imaginary part of complex permittivity (ε”) for PMMA-EC/PC-LiClO4-(x wt%) Al2O3 corresponding to frequency
93
4.14 Imaginary part of complex permittivity (ε”) for PMMA-EC/PC-LiClO4-(x wt%) SiO2 corresponding to frequency
93
4.15 Real part of complex permittivity (ε’) for PMMA-EC/PC- 25 wt% of LiClO4 corresponding to frequency in the temperature range of 298-373K
96
4.16 Real part of complex permittivity (ε’) for PMMA-EC/PC-LiClO4- 12 wt% of Al2O3 corresponding to frequency in the temperature range of 298-373K
97
4.17 Real part of complex permittivity (ε’) for PMMA-EC/PC-LiClO4- 12 wt% of SiO2 corresponding to frequency in the temperature range of 298-373K
97
4.18 Imaginary part of complex permittivity (ε”) for PMMA-EC/PC- 25 wt% of LiClO4 corresponding to frequency in the temperature range of 298-373K
99
4.19 Imaginary part of complex permittivity (ε”) for PMMA-EC/PC-LiClO4- 12 wt% of Al2O3 corresponding to frequency in the temperature range of 298-373K
99
4.20 Imaginary part of complex permittivity (ε”) for PMMA-EC/PC-LiClO4- 12 wt% of SiO2 corresponding to frequency in the temperature range of 298-373K
100
4.21 XRD patterns of (a) pure PMMA, (b) 5 wt% EC/PC, (c) 10 wt% EC/PC, (d) 15 wt% EC/PC, (e) 20 wt% EC/PC, (f) 25 wt% EC/PC, (g) 30 wt% EC/PC, (h) 35 wt% EC/PC added into PMMA
102
4.22 XRD patterns of (a) pure PMMA, (b) pure LiClO4, (c) 0 wt% LiClO4, (d) 5 wt% LiClO4, (e) 15 wt% LiClO4, (f) 25 wt% LiClO4, (g) 35 wt% LiClO4, (h) 50 wt% LiClO4 doped into PMMA-EC/PC system
105
4.23 XRD patterns of (a) pure PMMA, (b) pure Al2O3, (c) 0 wt% Al2O3, (d) 4 wt% Al2O3, (e) 8 wt% Al2O3, (f) 12 wt% Al2O3, (g) 16 wt% Al2O3, (h) 20 wt% Al2O3, dispersed into PMMA-EC/PC-LiClO4 system
109
4.24 XRD patterns of (a) pure PMMA, (b) pure SiO2, (c) 0 wt% SiO2, (d) 4 wt% SiO2, (e) 8 wt% SiO2, (f) 12 wt% SiO2, (g) 16 wt% SiO2, (h) 20 wt% SiO2 dispersed into PMMA-EC/PC-LiClO4 system
112
4.25 XRD patterns of (a) pure PMMA, (b) pure LiClO4, (c) pure Al2O3, (d) pure SiO2, (e) PMMA (70):EC/PC (30), (f) PMMA-EC/PC (75): LiClO4 (25), (g) PMMA-EC/PC- LiClO4 (88): Al2O3 (12), (h) PMMA-EC/PC- LiClO4 (88): SiO2 (12)
114
4.26 FTIR spectrum for pure PMMA 118 4.27 FTIR spectrum for pure EC 119 4.28 FTIR spectrum for pure PC 120
xiv
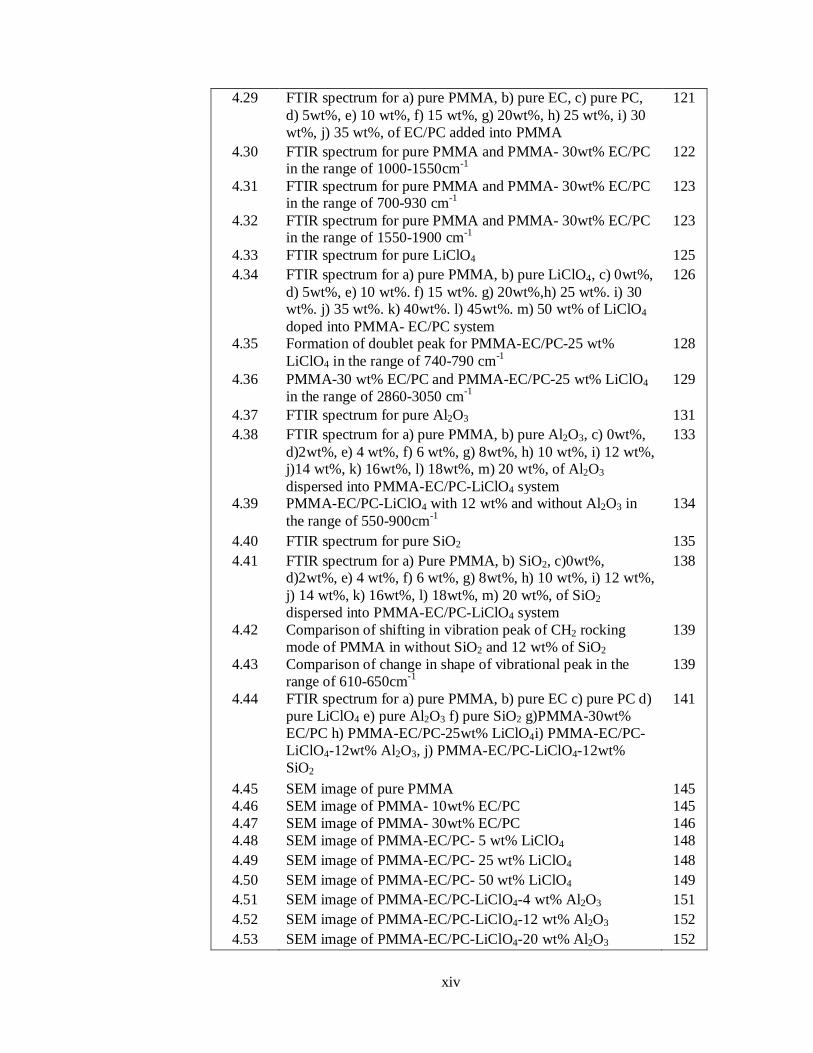
4.29 FTIR spectrum for a) pure PMMA, b) pure EC, c) pure PC, d) 5wt%, e) 10 wt%, f) 15 wt%, g) 20wt%, h) 25 wt%, i) 30 wt%, j) 35 wt%, of EC/PC added into PMMA
121
4.30 FTIR spectrum for pure PMMA and PMMA- 30wt% EC/PC in the range of 1000-1550cm-1
122
4.31 FTIR spectrum for pure PMMA and PMMA- 30wt% EC/PC in the range of 700-930 cm-1
123
4.32 FTIR spectrum for pure PMMA and PMMA- 30wt% EC/PC in the range of 1550-1900 cm-1
123
4.33 FTIR spectrum for pure LiClO4 125 4.34 FTIR spectrum for a) pure PMMA, b) pure LiClO4, c) 0wt%,
d) 5wt%, e) 10 wt%. f) 15 wt%. g) 20wt%,h) 25 wt%. i) 30 wt%. j) 35 wt%. k) 40wt%. l) 45wt%. m) 50 wt% of LiClO4 doped into PMMA- EC/PC system
126
4.35 Formation of doublet peak for PMMA-EC/PC-25 wt% LiClO4 in the range of 740-790 cm-1
128
4.36 PMMA-30 wt% EC/PC and PMMA-EC/PC-25 wt% LiClO4 in the range of 2860-3050 cm-1
129
4.37 FTIR spectrum for pure Al2O3 131 4.38 FTIR spectrum for a) pure PMMA, b) pure Al2O3, c) 0wt%,
d)2wt%, e) 4 wt%, f) 6 wt%, g) 8wt%, h) 10 wt%, i) 12 wt%, j)14 wt%, k) 16wt%, l) 18wt%, m) 20 wt%, of Al2O3 dispersed into PMMA-EC/PC-LiClO4 system
133
4.39 PMMA-EC/PC-LiClO4 with 12 wt% and without Al2O3 in the range of 550-900cm-1
134
4.40 FTIR spectrum for pure SiO2 135 4.41 FTIR spectrum for a) Pure PMMA, b) SiO2, c)0wt%,
d)2wt%, e) 4 wt%, f) 6 wt%, g) 8wt%, h) 10 wt%, i) 12 wt%, j) 14 wt%, k) 16wt%, l) 18wt%, m) 20 wt%, of SiO2 dispersed into PMMA-EC/PC-LiClO4 system
138
4.42 Comparison of shifting in vibration peak of CH2 rocking mode of PMMA in without SiO2 and 12 wt% of SiO2
139
4.43 Comparison of change in shape of vibrational peak in the range of 610-650cm-1
139
4.44 FTIR spectrum for a) pure PMMA, b) pure EC c) pure PC d) pure LiClO4 e) pure Al2O3 f) pure SiO2 g)PMMA-30wt% EC/PC h) PMMA-EC/PC-25wt% LiClO4i) PMMA-EC/PC-LiClO4-12wt% Al2O3, j) PMMA-EC/PC-LiClO4-12wt% SiO2
141
4.45 SEM image of pure PMMA 145 4.46 SEM image of PMMA- 10wt% EC/PC 145 4.47 SEM image of PMMA- 30wt% EC/PC 146 4.48 SEM image of PMMA-EC/PC- 5 wt% LiClO4 148 4.49 SEM image of PMMA-EC/PC- 25 wt% LiClO4 148 4.50 SEM image of PMMA-EC/PC- 50 wt% LiClO4 149 4.51 SEM image of PMMA-EC/PC-LiClO4-4 wt% Al2O3 151 4.52 SEM image of PMMA-EC/PC-LiClO4-12 wt% Al2O3 152 4.53 SEM image of PMMA-EC/PC-LiClO4-20 wt% Al2O3 152
xv
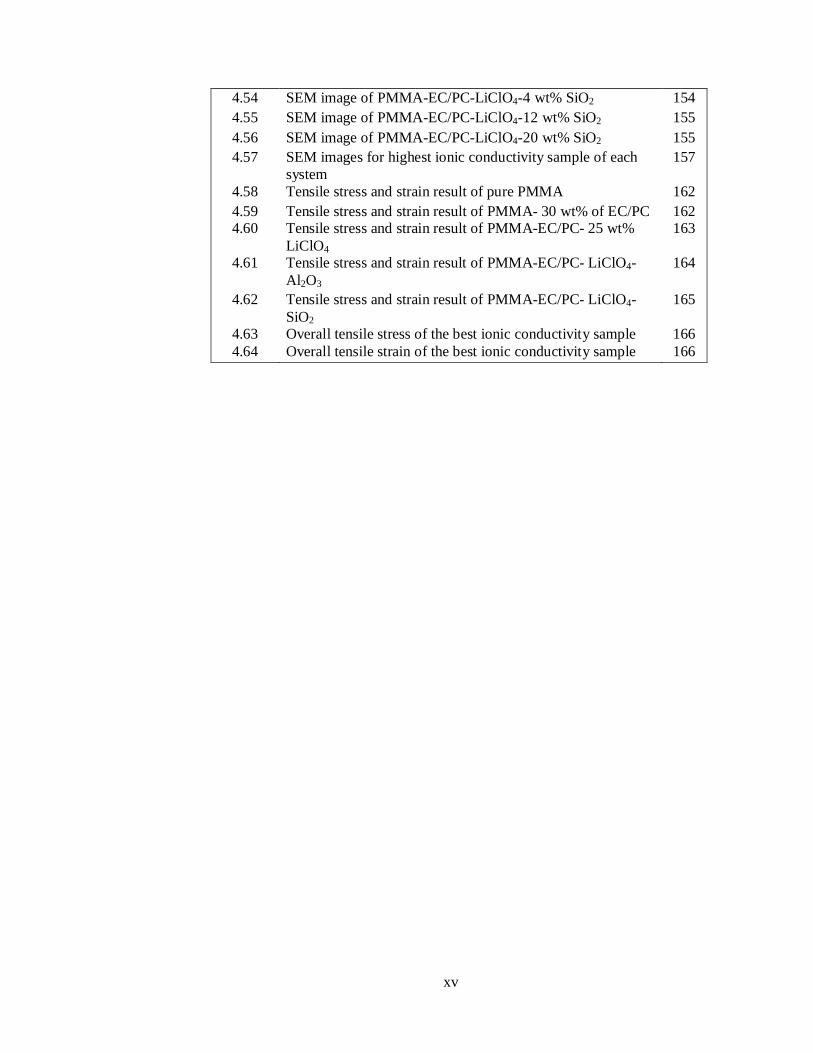
4.54 SEM image of PMMA-EC/PC-LiClO4-4 wt% SiO2 154 4.55 SEM image of PMMA-EC/PC-LiClO4-12 wt% SiO2 155 4.56 SEM image of PMMA-EC/PC-LiClO4-20 wt% SiO2 155 4.57 SEM images for highest ionic conductivity sample of each
system 157
4.58 Tensile stress and strain result of pure PMMA 162 4.59 Tensile stress and strain result of PMMA- 30 wt% of EC/PC 162 4.60 Tensile stress and strain result of PMMA-EC/PC- 25 wt%
LiClO4 163
4.61 Tensile stress and strain result of PMMA-EC/PC- LiClO4- Al2O3
164
4.62
4.63 4.64
Tensile stress and strain result of PMMA-EC/PC- LiClO4-SiO2 Overall tensile stress of the best ionic conductivity sample Overall tensile strain of the best ionic conductivity sample
165
166 166
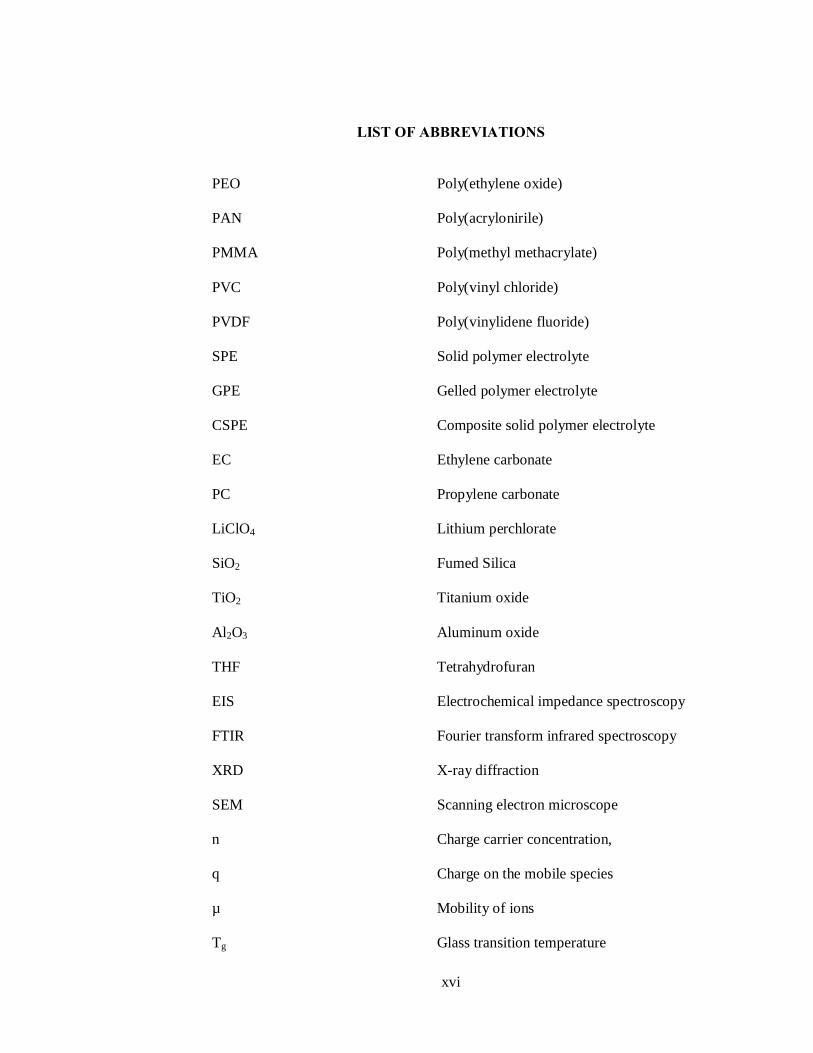
xvi
LIST OF ABBREVIATIONS
PEO Poly(ethylene oxide)
PAN Poly(acrylonirile)
PMMA Poly(methyl methacrylate)
PVC Poly(vinyl chloride)
PVDF Poly(vinylidene fluoride)
SPE Solid polymer electrolyte
GPE Gelled polymer electrolyte
CSPE Composite solid polymer electrolyte
EC Ethylene carbonate
PC Propylene carbonate
LiClO4 Lithium perchlorate
SiO2 Fumed Silica
TiO2 Titanium oxide
Al2O3 Aluminum oxide
THF Tetrahydrofuran
EIS Electrochemical impedance spectroscopy
FTIR Fourier transform infrared spectroscopy
XRD X-ray diffraction
SEM Scanning electron microscope
n Charge carrier concentration,
q Charge on the mobile species
µ Mobility of ions
Tg Glass transition temperature

xvii
Li+ Lithium ions
σ Ionic conductivity in Scm-1
Rb Bulk impedance in Ohm
A Surface Area in cm2
t Thickness
λ Wavelength in m
θ Incident Angle
d d- spacing
σ Tensile Stress
F Applied Force
A Area
ε Tensile Strain
il Elongated Length
ol Original Length

CHAPTER 1
INTRODUCTION
1.1 Background of Study
In view of the demand for energy and environment, the research
onelectrochemical energy has undergone rapid development as an alternative
energy source. The lithium ion rechargeable battery, with a significantly higher
energy density and lighter weight has replaced the conventional rechargeable
battery such as NiMh, NiCd, NiZn, AgNi, etc as a primary choice for portable
electronics devices (Ahmad, 2009). Recently, different types of lithium-ion
rechargeable battery with different capacity, shape and size are commercially
available. However, the most common type of lithium-ion rechargeable battery
is still uses the liquid electrolyte in the battery system. This type of battery is
not completely safe because it is suffering from leakage and is flammable. In
order to eliminate the internal short-circuiting in the cell, a separator must be
placed in between the cathode and the anode (Osaka et al., 1997). Furthermore,
the formation of lithium dendrites during the charging period will lower the
cycling efficiency and will lead to internal short circuiting in the battery (Song
etal.,1999).
2
In the current progress, researchers are looking for an alternative to
replace the liquid electrolyte. It has been discovered that polymer electrolyte
may be a good candidate to replace the liquid electrolyte as it does not suffer
from leakage and have no flammable problem (Tan et al., 2007). Besides that,
the intrinsic advantages of polymer electrolyte make it favourable to replace
the conventional liquid electrolyte. By using solid polymer electrolyte as the
battery electrolyte, a separator is not required. Hence, a possible explosion can
be avoided. Furthermore, polymer electrolytes offer better flexibility and shape
versatility which allow for the fabrication of thin and flexible shape of lithium
ion batteries with good mechanical integrity (Deka and Kumar, 2010).
The initial work on polymer electrolytes were mainly focused on the
complexes of poly(ethylene oxide) PEO with the incorporation of various
inorganic lithium salts. Unfortunately, these systems failed to exhibit any
desirable ionic conductivity due to its high degree of crystallisation and low
solubility of salt in amorphous region (Berthier et al., 1983). In order to attain a
high ambient-temperature conductivity, a polymer that is amorphous in nature
and has a flexible backbone is preferred (Ahmad, 2009). Due to this reason,
PMMA-based electrolyte is preferred due to its amorphous nature, flexible
backbone, solvent retention ability and less reactive towards lithium electrode
(Ahmad et al., 2006;Appetecchi et al., 1995).

3
1.2 Justification of Studies
PEO-based solid polymer electrolyte have received much attention over
the past few decades for many applications such as batteries, fuel cells, super
capacitors, display devices, sensors, etc (Scrosati, 2000). Due to its high
degree of crystalline, PEO-based polymer electrolyte faced an inherent
problem of low ionic conductivity that limits the application of this type of
polymer electrolyte (Pradhan et al.,2008). To attain a high room temperature
ionic conductivity, several types of polymer electrolyte based on
poly(acrylonirile) (PAN) (Huang et al., 1996; Wang et al.,1997), poly(methyl
methacrylate) (PMMA) (Bohnkeet al., 1993;Stallworth et al., 1995), poly(vinyl
chloride) (PVC) (Pistoia et al., 1996; Sung et al., 1998) and poly(vinylidene
fluoride) (PVDF) (Tsuchida et al., 1993; Jiang et al., 1998) are developed and
characterised. In order to enhance the ionic conductivity in SPEs, several
modifications are reported such as an addition of excessive plasticiser to
generate gelled polymer electrolyte (GPE) or nano-composite filler to generate
composite solid polymer electrolyte (CSPE).
As reported by Rajendran and Sivakumar (2008), ethylene carbonate
(EC) (ε=89) and propylene carbonate (PC) (ε=64.4) exhibit a high dielectric
constant which may be a good candidate to dissolve lithium salt and forming
complexation with polymer. In fact, most of the studies based on EC/PC
plasticiser mixture are to generate GPE. In the present study, the EC/PC

4
mixture is used to generate plasticised SPE with controlled EC/PC mixture to
avoid the formation of gel. A study by Deka and Kumar (2010) showed that the
dispersion of ceramic filler in the polymeric complexes could prevent the
polymer chain reorganisation. In addition, the ionic conductivity and interfacial
properties when come into contact with lithium electrode could be improved
with the addition of ceramic filler (Saikia et al., 2009). In this current project,
SiO2 and Al2O3 are used as ceramic filler.
1.3 Aim and Objectives of Research
Aim:
- To develop a high ionic conductivity PMMA-based solid type of
polymer electrolyte.
Objectives:
- To enhance the ionic conductivity of polymer electrolyte with
plasticiser upon addition of lithium salt and nano-sized fillers.
- To examine the mechanisms of the conducting ions in the polymer
electrolytes through dielectric analysis.
- To study thecomplexation within the polymer electrolytes systems by
Fourier Transform Infrared Spectroscopy (FTIR).
- To study the structural behaviour of the polymer electrolytes by X-Ray
Diffraction (XRD) and Scanning Electron Microscope (SEM).

5
1.4 Organisation of Thesis
Basically, this thesis emphasises on the development of solid polymer
electrolyte based on PMMA as a host polymer. The preparation of the
electrolyte thin film and the behaviour of the polymer electrolyte are
determined and discussed.
The literature review of this study is reported in Chapter 2. Different
types of battery and the development of lithium-ion polymer battery are
discussed. The discussion on the polymer electrolyte is focused on PMMA-
based electrolyte which can be further classified into solid polymer electrolyte
(SPE), gelled polymer electrolyte (GPE) and composite solid polymer
electrolyte (CSPE). The effects of additives such as plasticiser, lithium salts
and ceramic filler toward electrical and mechanical properties are reported.
In Chapter 3, the research methodology of this study is discussed. The
raw materials (PMMA, LiClO4, EC, PC, Al2O3, SiO2 and THF) used in this
study are explained. This is followed by an explanation of the solution cast
technique. Later, the characterisation methods used in this study such as
Electrochemical Impedance Spectroscopy (EIS), Fourier Transform Infrared
Spectroscopy (FTIR), X-Ray Diffraction (XRD) and the Scanning Electron
Microscope (SEM) are explained.

6
The results obtained from the experiments are shown and discussed in
Chapter 4. The ionic conductivity behaviour at ambient temperature and higher
temperature are discussed. This is followed by the characterisation of XRD
where the chemical composition and crystalline structure of the materials are
reported. Later, the results obtained from FTIR are discussed where the
spectrums are plotted and the bonding of materials are explained. Lastly, the
micro-structures of polymer electrolytes obtained from SEM are examined.
Finally, the conclusions of this study are reported in Chapter 5. In
addition, the suggestions and recommendations for future research in this area
of study are discussed.

7
CHAPTER 2
LITERATURE REVIEW
2.1 Types of Battery
Normally, a battery is made up of one or more electrochemical
cellswhich convert the stored chemical energy into electrical energy. There are
two general types of battery, which are non-rechargeable battery (so-called
primary battery) and rechargeable battery (so-called secondary battery). Non-
rechargeable battery is a kind of battery in which the electrochemicalreaction is
not reversible and must be disposed of after used. The advantages of using
primary battery are convenient and inexpensive. Comparatively, the
rechargeable battery can be recharged electrically back to the initial condition
after discharging i.e. the electrochemical reaction is reversible. The different
shapes and sizes of rechargeable battery make it usable for a wide range of
applications. As compared to primary batteries, the rechargeable batteries have
a lower total usage cost and are more environmental friendly than the
disposable primary batteries. Table 2.1 shows the examples of primary and
secondary batteries.

8
Table 2.1: Examples of primary and secondary batteries Primary Batteries Secondary Batteries
cadmium/mercury oxide nickel-zinc
lithium/manganese dioxide nickel-iron
lithium/sulfur dioxide nickel-hydrogen
magnesium lithium ion
zinc/carbon Lithium ion polymer
zinc/mercury oxide silver-cadmium
zinc/silver oxide sodium/nickel chloride
zinc/chlorine
Since the first industrial implementation by Sony Corporation in 1991,
lithium ion (Li-ion) battery has achieved tremendous technological and
commercial success (Osinska et al., 2009). The contributions such as high
energy density, high working voltage, long cycle and low weight make this
type of electrochemical energy storage devices an ideal power source for many
applications such as electrical vehicles, portable power sources and space
exploration.
The development of a solid-state battery based on solid electrolytes
have been most active in the area of portable rechargeable batteries due to the
advantages over conventional lithium-ion battery such as improved safety and
easy of fabrication (Li et al., 2003). Therefore, researchers dedicated most
interest in the development of rechargeable batteries in order to exploit its
advantages and market needs.

9
2.2 The Development of Lithium ion Polymer Battery
Pioneer work with the lithium battery began in 1912 under G.N. Lewis.
However, until the early 1970s the first non-rechargeable lithium battery
became commercially available. Lithium is the lightest weight, highest voltage,
and greatest energy density of all metals. The first published interest in lithium
batteries began in the works of Harris in 1958. The work eventually led to the
development and commercialisation of a variety of primary lithium cells during
1970s.
The original design of the Li-ion polymer battery is invented in 1970s;
the researcher uses a dry solid polymer electrolyte only in the battery system.
This electrolyte resembles a plastic-like film and act as a separator that does
not conduct electricity but allows an exchange of ions between anode to
cathode. The polymer electrolyte offers simplifications with respect to
fabrication, safety, light weight and flexibility. There is no leaking problem and
any danger of flammability because no liquid or gelled electrolyte is used.
With the provision of a thin film of electrolyte system, the form, shape and size
of the battery can be fabricated easily at lower production cost (Mahendran and
Rajendran, 2003).
10
Although using the solid polymer electrolyte in a lithium ion polymer
battery has several advantages, but it still suffers from poor conductivity. Due
to its high internal resistance, the battery cannot deliver the current to modern
communication devices or spinning up the hard drives of mobile computing
equipment. Even though heating the cell to 60°C or higher temperature will
eventually increase the conductivity to acceptable levels but this requirement is
unsuitable for practical applications.
Therefore, research continues to develop a solid Li-ion polymer battery
that performs at room temperature. A solid Li-ion polymer is commercially
available in 2005. It is expected to be very stable and would run 1000 full
cycles with higher energy densities. In order to build up a small Li-ion polymer
battery system, gelled electrolyte has been invented. Most of the commercial
Li-polymer batteries used today for mobile phones are a hybrid and contain
gelled electrolyte. With the implementation of gelled electrolyte, the
characteristics and performance are similar to the solid type where these
polymer electrolytes are used to replace the porous separator and to enhance
ion conductivity.

11
2.2.1 Main Components of a Rechargeable Battery
A battery is a device that converts the chemical energy contained in its
active materials directly into electrical energy by an electrochemical reaction.
For a rechargeable system, the battery is discharged and recharged by a
reversal of process by transferring the electrons from anode to cathode or vice
versa.
A battery consists of three main components, which are anode, cathode
and electrolyte. The anode or negative electrode which gives up electrons to
the external circuit and are oxidised during the electrochemical reaction.
Besides, the cathode or positive electrode which accepts electron from the
external circuit is reduced during the electrochemical reaction. Whereby, the
electrolyte is an ionic conductor which is sandwiched between anode and
cathode to provide the medium for transfer of ions between anode and cathode.
All these parts are connected properly in order to ensure the safety when
discharging and recharging of the battery.
A polymer electrolyte plays an important role due to the safety and
environmental issues. A polymer electrolyte acts as a separator between anode
and cathode to prevent internal short circuit and at the same time, provide good
ionic conductivity. The polymer electrolytes have more advantages compared
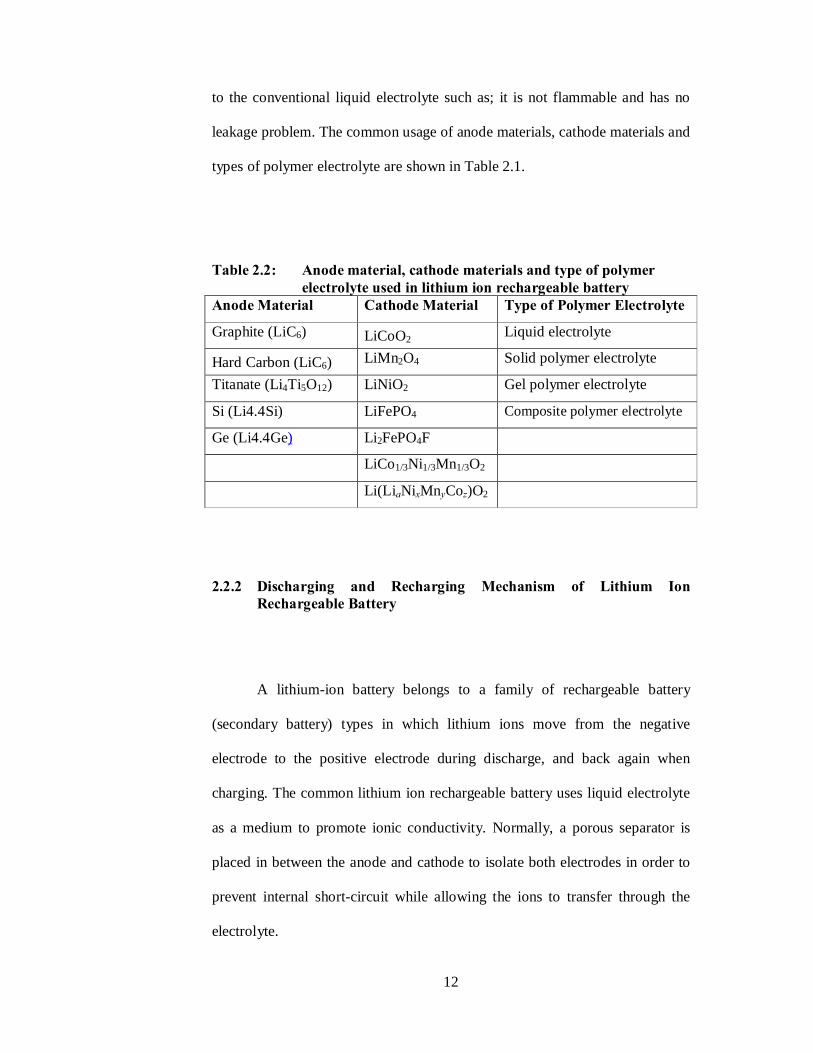
12
to the conventional liquid electrolyte such as; it is not flammable and has no
leakage problem. The common usage of anode materials, cathode materials and
types of polymer electrolyte are shown in Table 2.1.
Table 2.2: Anode material, cathode materials and type of polymer electrolyte used in lithium ion rechargeable battery Anode Material Cathode Material Type of Polymer Electrolyte
Graphite (LiC6) LiCoO2 Liquid electrolyte
Hard Carbon (LiC6) LiMn2O4 Solid polymer electrolyte
Titanate (Li4Ti5O12) LiNiO2 Gel polymer electrolyte
Si (Li4.4Si) LiFePO4 Composite polymer electrolyte
Ge (Li4.4Ge) Li2FePO4F
LiCo1/3Ni1/3Mn1/3O2
Li(LiaNixMnyCoz)O2
2.2.2 Discharging and Recharging Mechanism of Lithium Ion Rechargeable Battery
A lithium-ion battery belongs to a family of rechargeable battery
(secondary battery) types in which lithium ions move from the negative
electrode to the positive electrode during discharge, and back again when
charging. The common lithium ion rechargeable battery uses liquid electrolyte
as a medium to promote ionic conductivity. Normally, a porous separator is
placed in between the anode and cathode to isolate both electrodes in order to
prevent internal short-circuit while allowing the ions to transfer through the
electrolyte.

13
Generally, a battery converts the chemical energy stored in the
electrodes into electric energy through an electrochemical oxidation-reduction
process. As shown in Figure 2.1, the positive electrode is made of Lithium
cobalt oxide, or LiCoO2. The negative electrode is made of carbon. The battery
is recharged when an external DC power supply is connected. The lithium ions
move through the electrolyte from the positive electrode to the negative
electrode and is attached to the carbon. During the discharging process where
an external load is connected to the battery therefore the lithium ions which is
attached to the carbon (cathode) move back to the LiCoO2 electrode. The
chemical reaction in the anode and cathode is shown in the following process.
The cathode half-reaction (with charging being forward) is:
LiCoO2 ↔ Li1-xCoO2 + xLi+ + xe-
The anode half-reaction is:
xli+ + xe- + 6C ↔ LixC6
Overall reaction is:
LiCoO2 +6C ↔ Li(1-x)CoO2 + LixC6

14
Figure 2.1: Discharge and recharge mechanism for a lithium ion
rechargeable battery (Linden and Reddy, 2002)
2.2.3 Lithium Ion Polymer Battery
The main objective for the development of the rechargeable lithium
batteries is to produce batteries that have high energy density, high power
density, and good cycle life and charge retention. The following characteristics
are critical when choosing a proper electrolyte for rechargeable lithium battery
(Linden and Reddy, 2002):

15
1. Good ionic conductivity (>10-3 S/cm from -40 to 90 degree C) to
minimise internal resistance.
2. Lithium ion transference number approaching unity (to limit
concentration polarisation)
3. Wide electrochemical voltage window (0 to 5V)
4. Thermal stability (up to 70 degree C)
5. Compatibility with other cell components
Figure 2.2 illustrates the components of the lithium polymer battery, the
polymer electrolyte acts as electrolyte and separator, a thin lithium metal foil as
the anode material and transition metal oxide blend backed by a metal-foil
current collector as the positive electrode. As the polymer electrolyte act as a
separator, therefore no extra separator material is needed.
Figure 2.2: Solid polymer electrolyte battery (Linden and Reddy, 2002)
The rechargeable lithium ion battery which uses a solid type of polymer
electrolyte (SPE) is considered to have a safety advantage over the organic
liquid electrolyte because of their lower reactivity with lithium and the absence
of a volatile, flammable organic solvent. Another potential advantage of the

16
solid polymer battery is its capability to be easily fabricated in a variety of
shapes and forms. Very thin batteries for cell phones, PDAs and similar
application can be manufactured at the other extreme. Moreover, large thin
plates can be manufactured and assembled in multiplate prismatic to produce
very high energy density batteries. The advancement of high capacity battery
has lead to the development of automotives to allow the development of high
performances EV and the mobile industries.
The mechanism of discharging and recharging is almost similar to the
conventional lithium ion battery as shown in Figure 2.1 except for the
intercalation process where lithium ions are reversibly removed and placed into
electrodes without significantly changing the electrodes structure. During the
charging process the positive electrode material is oxidised while its negative
electrode material is reduced. Lithium ions are de-intercalated from the
positive electrode material and then intercalated into negative electrode
material. As for the discharging operation, the opposite processes takes place
when the negative electrode material is oxidised and the positive electrode
material is reduced.
17
2.3 The Development of Polymer Electrolyte
Polymer electrolytes have gained wide attention due to its potential
application in rechargeable lithium-ion batteries during the last two decades.
For the promising application of polymer electrolyte, lithium-ion polymer
rechargeable batteries are applicable in automotive industries, portable devices,
aerospace applications, etc.
The term “Solid State Ionics” was given by Prof Takehiko Takahashi in
1960, who did pioneering work investigating ionic motion in solid polymer
electrolytes. Solid state Ionics is not only limited to ionic conductors but also
includes conductors and mixed conductors, in which the electric conduction is
affected by migration not only of ions but also electrons or positive holes.
Initially, the conventional liquid electrolytes were replaced by gel polymer
electrolyte and later by composite solid polymer electrolytes leading to all solid
state electrochemical devices (Gray, 1997a).
With the use of polymer electrolyte in lithium batteries, high specific
energy and specific power, safe operation, flexibility in packaging and low cost
of fabrication can be expected (Gray, 1991; MacArthur and Powers, 1996). The
poor ionic conductivity of solid polymer electrolyte can be enhanced by adding
plasticiser to form gel polymer electrolyte where the plasticiser effect might
18
make the lithium salt favourably dissociated and enhance the amorphous region
in polymeric matrix (Sekhon et al., 2006; Singh et al. 2009). Further
enhancement can be achieved by dispersing a nano-sized filler to form a
composite solid polymer electrolyte where the ion pairs and ion aggregates can
be dissociated due to the Lewis acid-base interaction to build up a new ionic
pathway for ionic transportation (Scrosati et al., 2000).
Polymer electrolytes can be divided into four types, which are:-
- Solid polymer electrolyte (SPE)
- Gelled polymer electrolyte (GPE)
- Composite solid polymer electrolyte (CSPE)
- Composote polymer electrolyte (CPE)
Generally, a solid polymer electrolyte (SPE) is based on neat (is it neat
or heat) high polymers, which serve as both solvent to dissolve lithium salts
and mechanical matrix to support the processability. A gelled polymer
electrolyte (GPE) is formed based on the encagement of polymer in a liquid
electrolyte solution. Coheres, the Composite solid polymer electrolyte (CSPE)
is formed based on the dispersion of composite or ceramic filler into SPE when
the composite or ceramic filler is dispersed into the GPE.

19
2.4 Development of PMMA-Based Polymer Electrolyte
PMMA has been chosen as a host polymer because of its advanced
physical properties like good film forming, thermal and chemical stability.
PMMA itself is an amorphous (random arrangement of the asymmetrical
carbon atom) by nature and it is colourless, transparent, has an excellent life
period, and good mechanical properties (Rajendran et al., 2002). The common
name for PMMA is acrylic glass which is a member of the acrylates family
which is often used as an alternative to glass. In the current trend, PMMA is
commonly used as a host polymer in polymer electrolyte due to the amorphous
nature, excellent physical properties and higher ionic conductivity as compared
to other polymer. The ionic conductivity is only conducted in amorphous
region. It is believed that PMMA may be a good candidate to use as a host
polymer in order to develop polymer electrolyte.
As reported by Tan et al. (2007), the ionic conductivity value of pure
PMMA solid polymer electrolyte is 10-10 Scm-1. Although the ionic
conductivity of pure PMMA exhibits slightly higher than other polymer, but
the low ionic conductivity makes it unfavourable to use as a polymer
electrolyte. In fact, the ionic conductivity of the solid polymer electrolyte could
be elevated to a higher level (10-7-10-5 Scm-1) by integrating different
plasticiser and lithium salt into the polymeric matrices. With the addition of 25
wt% of EC and 25 wt% of LiCF3SO3, the ionic conductivity is enhanced to ~

20
1.36 × 10⁻⁵ Scm-1 (Tan et al., 2007). Othman et al. (2007) revealed that the
ionic conductivity is varied according to different lithium salt and plasticiser
added into the polymer electrolyte system. The conductivity of [PMMA-EC]-
LiCF3SO3 system is 3.40 × 10⁻⁵ Scm-1 and [PMMA-EC]-LiBF4 system is about
4.07 × 10⁻⁷ Scm-1 (Othman et al., 2007). It is revealed that the dielectric
parameters and solubility of additives are strongly influenced by the nature of
electrolyte materials.
Another approach to further enhance the ionic conductivity is
dispersing the inorganic ceramic filler into the solid polymer electrolyte and
developing the composite solid polymer electrolyte. Adebahr et al. (2003) and
Ahmad et al. (2003) reported that the dispersion of nanosized ceramic filler
particles not only increases its mechanical properties, but also enhances its
ionic conductivity. The conductivity of a filler added polymer electrolyte
system can be achieved by the conductivity at the order of 10-3 Scm-1 (Ahmad
et al., 2003). Studies showed that composite filler with high dielectric constant
helps to dissolve the electrolyte salt and increase ion conduction through the
solvent domain surrounding the polymer matrix (Deka and Kumar, 2010).
Besides, Adebahr et al. (2003) claimed that dispersing of filler to the PMMA
based electrolyte decreases the polymer/cation interaction and introduces a new
pathway for lithium ions transportation.

21
In the current research, many strategies have been accomplished to
enhance the ionic conductivity of polymer electrolytes. These include the
incorporating of solvent (plasticisers) to form plasticised or gel polymer
electrolytes, dispersing with inorganic fillers to make composite polymer
electrolytes and synthesising new polymer electrolyte.
2.5 Electrolytes for Li-Ion Battery
There are several types of electrolyte including liquid electrolyte, solid
polymer electrolyte (SPE), gelled polymer electrolyte (GPE) and composite
solid polymer electrolyte (CSPE). Electrolyte is one of the main components
sandwiched between anode and cathode to complete the circuitry in the battery.
A polymer electrolyte functions as a separator to anode and cathode and at the
same time, provides a medium for the transferring of ions between anode and
cathode during the redox processes.
In order to improve the safety and ionic conductivity of the polymer
electrolytes, many researchers have been carried out to overcome these
problems. Current research in lithium-ion battery technology replaces the
liquid electrolyte with a polymer membrane which is capable to function as a
separator and as the electrolyte (Fenton et al., 1973). Xu et al. (1998) revealed
that polymer electrolytes are good compatibility with lithium metal which

22
exhibits no leakage, low self-discharge, elastic relaxation under stress, easy
processing, continued production, and good electrical conductivity.
On the other hand, the polymer electrolyte formed from polymer, salts
and plasticiser should have high chemical stability in order to prevent any
chemical reaction between the electrolytes and electrodes. Linden and Reddy
(2002) summarised that electrolytes should have good ionic conductivity to
minimise internal resistance, lithium ion transference number approaching
unity to limit concentration polarisation, wide electrochemical voltage window
ranging from 0 to 5V, good thermal stability and good compatibility with other
components in the batteries.
2.5.1 Solid Polymer Electrolyte (SPE)
Solid polymer electrolyte or SPE is defined as a solid solution of the
conducted ions. The ions can be transported inside and through the host under
the effect of an electric field. The fundamental of ionic conduction in the
polymer electrolytes is the covalent bonding between the polymer backbones
with the ionising group. The electron donor group in the polymer forms
solvation to the cation component in the dopant salt and then facilitates ion
separation, leading to ionic hopping mechanism. In recent years, polymer
electrolyte has been used as an electrolyte in lithium batteries. The polymer
23
electrolyte plays three important roles in the solid polymer electrolyte (SPE)
battery.
1) It is a lithium ion carrier and it can be formed into thin films to improve
the energy density.
2) It acts as an electrode separator, which eliminates the need to
incorporate an inert porous separator.
3) It is a binder which ensures good electrical contact with the electrodes.
The flexibility and mechanical resilience allowed SPEs to have a major
advantage over all other -solid-state cells.
According to Ahmad (2009) the advantages of using these SPE over
liquid electrolyte in a battery system are:
a) Excellent processability and flexibility that could enable the
fabrication of ultrathin lithium cells of various geometric shapes
so that high energy and power density could be achieved for
versatile application.
b) Higher safety due to the absence of flammable organic solvents
and the much lower reactivity of macro-molecules toward
lithium.

24
c) The possible prevention of the growth of lithium dendrite
crystals upon cycling.
d) The high dimensional stability, which will lead to the
elimination of a separator, so that further improvement in both
energy density and manufacturing cost could be achieved due to
the simplified cell configuration and enhanced packing
efficiency.
The SPEs are good compatibility with lithium metal, no leakage, and
low self-discharge, elastic relaxation under stress, easy processing, continued
production, and good electrical conductivity (Rajendran et al., 2003).
2.5.2 Gelled Polymer Electrolyte (GPE)
Due to the low conductivity, a concept of gelled polymer electrolyte
(GPE) was introduced. The ionic conductivity could be increased by
incorporating a liquid plasticiser into host polymer.Song et al. (1999) reported
that the gel-type membranes may benefit in ionic transport mechanism, which
is similar to that of their liquid components. Ionic conductivity of these
membranes is closely related to the diffusive motion of low molecular weight
solvent mixture within the gel. The ionic conductivity of gelled type polymer
electrolyte is reported to exhibit ionic conductivity as high as 10-3 S cm-1 (Deka
and Kumar, 2010)

25
Compare to liquid electrolyte, gelled polymer electrolyte exhibits a
higher ionic conductivity due to an increase in carrier concentration. Besides
that, the gel electrolytes shows more advantages than Liquid electrolytes due to
the fact that the liquid phase still provides the channels for ion conduction in
the gel medium whereas the polymer provides the mechanical support and
mainly acts as a stiffener. This effect might increase the number of carrier
concentration (n). According to the formula of ionic conductivity in Liquid
electrolyte or GPE,
Conductivity (σ) = nqµ
where n is the charge carrier concentration,
q is the charge on the mobile species
µ is the mobility of ions
The ionic conductivity in GPE depends upon two factors which are
carrier concentration and mobility. The conductivity of charge carrier (n)
depends upon the concentration of salt containing the mobile species. If the salt
is completely dissociated, the formation of ion aggregation takes place which
shall lower the conductivity. However, large numbers of charge concentration
may also lead to ion association resulting in the formation of ion aggregates
which blocked the ionic motion between anode and cathode.
26
Although the GPEs provide many advantages to battery system,
however the ionic conductivity and mechanical integrity of GPEs are mutually
exclusive (Ahmad et al., 2006). The approach to overcome the dimensional
stability and mechanical properties of the gelled polymer electrolyte (GPE) is
attributed to the addition of nanosized inorganic composite fillers to yield
composite polymer electrolyte (CPE). The toughness of the polymer electrolyte
can be increased through the addition of fillers such as silica particle whereas
the presence of fillers can give rise to flaws, which can reduce both the fracture
strength of the polymer and the elongation to failure (Quartarone et al., 1998).
Besides that, the ionic conductivity of the composite polymer electrolyte is
increased accordingly to the dispersion of inorganic fillers.
2.5.3 Composite Solid Polymer Electrolyte (CSPE)
Composite solid polymer electrolyte is a class of reinforced polymers
with low quantities of micro- or nano-metric sized fillers particles, to improve
mechanical integrity, enhanced film processability, as well as the strength. This
electrolyte is obtained by doping ceramic particles such as Al2O3, SiO2 and
TiO2 in the polymer matrix (Liu et al., 2003; Adebahr et al., 2003;Dissanayake
et al., 2003). According to Adebahr et al. (2003), the addition of filler particle
to polymer effectively controls the growth of the passivation layer on the Li
electrode, as well as increases its stability during long-term storage.

27
Besides, the usage of ceramic fillers tends to reduce the glass transition
temperature (Tg) and crystallinity of the polymer, and therefore allow
amorphous polymer to maintain liquid-like characteristics and increase their
conductivity (Weston and steele, 1982). The increase in conductivity is mainly
attributed to the decrease in the level of crystallinity in polymers due to the
presence of fillers. Other than that, due to the Lewis acid-base interactions
between the polar surface groups of the inorganic solid oxide fillers and the
electrolyte ionic species which yield a greater degree of salt dissociation
through the formation of ionic-ceramic complex (Xiong et al., 2003; Croce et
al., 2006).
The particle size of the fillers may affect the properties of the composite
solid polymer electrolyte. The mechanical strength and the electrochemical
performance of the electrolytes are expected to increase with the decreasing of
the filler size (Kim et al., 2003; Srun Jung et al.2009; MadhuryyaDeka and
Ashok Kumar, 2010). Krawiec et al. (1995) reported the relationship between
the particle size and conductivity. The composite of PEO, LiBF4 system
showed an increase in conductivity in going over from 10-5 (micrometer) to 10-
4 (nanosized) Scm-1 for Al2O3 fillers dispersed into the polymeric complex.
This effect is related to a new transport mechanism which develops due to
interaction between the polymer and the ceramic phase. This interaction serves
as a path for the conduction of lithium ions. Furthermore, addition of ceramic
filler can also prevent the polymer chain reorganisation, which promotes the

28
ion transportation and improves the interfacial, electrochemical stability and
mechanical properties of the polymer electrolyte (Kim et al., 2003).
2.6 Ionic Conductivity of Polymer Electrolyte
Ionic conductivity is certainly the most important concern for polymer
electrolytes. Ionic conductivity or ionic transport occurs mainly through a
coupling between the ions and polymer segmental motion. The early work
using PEO as the host polymer which shows that ionic conduction only takes
place mainly in the amorphous region (Haris et al., 1986; Selvasekarapandian
et al., 2006). As the ionic transportation mechanism are concerned in PEO-
based polymer electrolyte, the PEO segment assisted motion in the amorphous
region and the ion hopping along coordination sites in the crystalline phase are
suggested independently (Xiong et al., 2003).
The ionic conductivity of polymer electrolytes has been attained
through the incorporation of substantial amounts of plasticisers. The purpose of
plasticiser is served to reduce the crystalline content and increase the polymer
segmental mobility. At the same time plasticisers can result in greater ion
dissociation which allows greater numbers of charge carriers for ionic transport
(Song et al., 1999). Ito et al. (1987) revealed that the contribution of PEG
plasticizer enhanced the conductivity of the PEO-LiCF3SO3 at room
29
temperature. The PEG aids in ionic transport mainly by reducing crystallinity
and increasing the free volume of the system.
Many researchers reported that the ionic conductivity of polymer
electrolytes has a specific dependence on the amorphous nature of the sample.
The ionic conductivity is increased with the suitable incorporation of
plasticisers into the polymer electrolyte (Ragavendran et al., 2004). Besides
that, dielectric constant and viscosity of the plasticiser are important
parameters to be considered. High value of dielectric constant ensures better
salt dissociation that increases the number of free mobile charge carriers and
lower viscosity which increases ionic mobility. Therefore, with the addition of
plasticiser which tends to decouple the ionic motion from the polymer chain
leading to the increase of the ionic mobility by lowering the viscosity of ionic
environment (Forsyth et al., 1997).
Generally, the ionic conductivity in a polymer electrolyte is determined
by the amorphous nature of the polymer, the high conductivity can be observed
from the polymer electrolyte with enhanced amorphous character and a
reduced energy barrier to the segmental motion of lithium ions in the matrix.
Polymer electrolyte is strongly dependent on the glass transition temperature
Tg, where low Tg is necessary for high ionic conductivity (Gray, 997b). From
these approaches, the improvements have been achieved either by reducing the
crystallinity of the polymers or by lowering the glass transition temperature.
30
2.6.1 The Effect of Plasticiser to the Ionic Conductivity in Polymer Electrolyte
As mentioned earlier, plasticiser is used to enhance the ionic
conductivity by lowering the glass transition temperature (Tg). The plasticiser
aids in the ionic transport mainly by reducing crystallinity (induce amorphous
region), increasing the free volume and addition of the transit site available in
the system.
Ionic conductivity is certainly the most important concern for the
polymer electrolytes. The effect of plasticiser on the polymer segmental and
ionic mobility and conductivity depends on the specific nature of the
plasticiser, including viscosity, dielectric constant, polymer-plasticiser
interaction and ion-plasticiser interaction. The research done shows that all
plasticised electrolyte films exhibit an enhancement in conductivity as
compared to the unplasticised electrolytes. It is showing that ionic mobility
plays the pivotal role in the improvement of the conductivity of polymer
electrolytes.
Mahendran et al. (2005) reported that plasticiser molecules being
relatively small in size compared with polymer molecules penetrate into the
polymer matrix and establish attractive force between the plasticiser molecule
and chain segments. The addition of plasticiser introduces more free volume to

31
the polymer, which lowers the glass transition temperature. The effect is due to
the reduction in cohesive force between the polymer chains which increase the
segmental mobility thus enhancing the conductivity. The increase in
conductivity by the addition of plasticisers may be due to the existence of
separate ionic path ways for the migration of the free lithium ions through the
plasticiser. This path provides a less viscous medium to allow Li+ ions to pass
through (Rajendran and Mahendran, 2001).
Ionic conductivity of polymer electrolytes has been attained through the
incorporation of substantial amounts of plasticisers. Plasticiser such as PC and
EC are preferred because of its high dielectric constant 64.4 for PC and 89.6
for EC (Tobishima and Yamaji, 1984). With the low molecular weight of
plasticisers, it helps to dissociate lithium salt which provides more mobile
charge carriers and reduces the viscosity of the polymer matrix leading to
higher ionic conductivity. Some researchers reported that EC is a better solvent
than PC due to its higher dielectric constant and lower viscosity. These
properties enhance ionic conductivity because they favour salt dissociation and
high ionic diffusion rates. However, EC is a solid at room temperature where
its melting point is 36.2 ˚C. Therefore, a mixture with PC is required for
practical applications (Li and Balbuena, 1999).

32
2.6.2 The Effect of Lithium Salt to the Ionic Conductivity in Polymer Electrolyte
For a solid type of polymer electrolyte, doping the lithium salt into the
polymeric complex tends to increase the charge carriers in the polymer
electrolyte system. An ideal electrolyte solute for ambient-temperature
electrochemical devices should be able to completely dissolve and dissociate in
the non-aqueous media, and the solvated ions (especially Li+) should be able to
travel in the medium with high mobility (Ahmad, 2009).
The increase in conductivity is due to the increase in the number of free
mobile ions as more salt is dissolved into the solution. When the salt content is
increased, the number of free ions also increases, hence increases the
conductivity (Othman et al., 2007). However, as the salt concentration
increases beyond its saturation level, the number of carrier ions also increase
which in turn cause the retarding effects such as ion pairs or ion triplets, charge
cloud effects, and restriction to chain mobility (Rajendran et al., 2010). The
segmental motions and the charge carriers are reduced hence the ionic
conductivity is decreased. The effect of decrease in ionic conductivity agrees
well with the literature when at high salt concentrated polymer electrolytes
indicates the formation of ion pairs, ion aggregates and ionic cluster, which
reduces the ionic mobility (Selvasekarapandian et al., 2006; Osman et al.,
2005).

33
The lithium salts with low lattice energy and large anions are generally
expected to dissociate better with lithium salt, thereby providing a higher
concentration of ions (Mahendran and Rajendran, 2003; Kang X., 2004). As
reported by Rajendran and Sivakumar (2008), the lithium perchlorate has
smaller ionic radius and smaller dissociation energy which is highly soluble in
most of the organic solvents. Therefore, the lithium perchlorate (LiClO4) is
selected as a doping salt for this research.
2.6.3 The Effect of Inorganic Filler to the Ionic Conductivity in Polymer Electrolyte
The dispersion of filler into the polymer electrolyte has brought several
advantages to the particular electrolyte system such as improvement of the
mechanical strength, enhancing the ionic conductivity and also the
electrochemical stability. The conductivity in this composite is not likely to be
contributed directly from the movement of ion-ceramic complex due to a heavy
mass. The major conduction path is originated from the local diffusion within
the amorphous polymer matrix. According to Ahmad (2009), the increase in
conductivity is mainly attributed to the decrease in the level of crystallinity in
polymers due to the presence of fillers.

34
By using the SiO2 as ceramic filler in the polymer electrolyte, SiO2
reduces the glass transition temperature and crystallinity of the polymer, and
allows the amorphous polymer to provide specific liquid-like characteristics.
The addition of ceramic fillers into a polymer improved the ionic conductivity
by reducing the crystallisation tendency (Scrosati et al., 2000).
Besides that, the addition of inorganic fillers may prevent the polymer
chain reorganisation, which promotes the ion transportation. The Lewis acid-
base interactions between the polar surface groups of the inorganic solid oxide
fillers and the electrolyte ionic species yield a greater degree of salt
dissociation through the formation of ionic-ceramic complex (Croce et al.,
2006). The enhancement of ionic conductivity might be due to the Lewis acid-
base type oxygen and OH surface groups on filler grains which interact with
the cations and anions and therefore providing additional sites creating
favourably high conducting pathway in the vicinity of grains for the migration
of ions (Dissanayake et al., 2003).
Although the dispersion of fillers helps to increase the ionic
conductivity of the polymer electrolyte, a high concentration of filler tends to
reduce the ionic conductivity of the polymer electrolyte due to the blocking
effect. As reported, the blocking effect is imposed by the more abundant filler
grains which could make the long polymer chains more immobilised and make

35
the grains get close to one another, leading to the decreasing of the
conductivity (Dissanayake et al., 2003).
2.6.4 The Effect of Temperature towards the Ionic Conductivity
In a conventional solid type of polymer electrolyte, the relaxation and
segmental motion of the solvent chains are regarded as the key factors in
enabling ion transport. It is suggested that a sufficient conductivity can be
obtained only when the energy of ions are over its energy level (Jung et al.,
2009). Further increase of ionic conductivity for an amorphous polymer
electrolyte is possible. From the established theory, when the temperature
increases, the conductivity also increases for all complexes, this can be
recognised by the free volume model (Miyamoto and Shibayama, 1973).
The increment of temperature causes an increase in conductivity due to
an increase of free volume in the electrolyte in respect of the ionic and
segmental mobility. Therefore, the free volume around the polymer chain
causes the increment of mobility for ions and polymer segmental mobility.
According to Mahendran et al. (2005), the conductivity increases when the
temperatures increase. As the temperature increases, the polymer can expand
easily and produce free volume. Thus, ions and solvated molecules as well as
polymer segments can move into the free volume. Besides that, the overall

36
mobility of ion and polymer segment which are determined by the free volume
leads to an increase in ionic and segmental mobility that will assist ion
transport and practically compensate for the retarding effect of the ion clouds
(Mahendran et al., 2005).
When the temperature is increased, the vibrational energy of segment is
sufficient to push against the hydrostatic pressure imposed by its neighbouring
atoms and creates a small amount of space surrounding its own volume that
generate extra transit site for ionic movement (Rajendran and Prabhu, 2010).
Moreover, the conduction mechanism is not entirely attributable to the
segmental motions of the polymer and is more likely to involve ion hopping
between static sites or limited motions of parts of the polymer chain (Rajendran
and Mahendran, 2001).

37
CHAPTER 3
RESEARCH METHODOLOGY
3.1 Materials
A series of solid polymer electrolyte thin films are developed through
solution-cast technique. PMMA (poly (methyl methacrylate) is used as the host
polymer, EC (ethylene carbonate) and PC (propylene carbonate) mixture is
applied as a plasticiser, LiClO4 (lithium perchlorate) is used as a carrier source
and the dispersion of Al2O3 (aluminium oxide) and SiO2 (silicon dioxide) as
ceramic fillers.
3.1.1 Poly(methylmethacrylate) (PMMA)
PMMA is a hard, clear, colourless and transparent amorphous polymer
with good resistance to acid. PMMA has good insulating properties (1E-19 Ω-
1) with high dielectric strength (2.6 at 1MHz). Combining the stiffness, density
and moderate toughness behaviours allowed this material to be applied in a

38
wide range of applications. In addition, PMMA has good thermal properties
with good resistance to temperature changes, moderate transition temperature
(Tg) of 105˚ C, a heat deflection temperature in the range of 74 to 100˚ C and
service temperature about 93˚ C.
.
The reasons for choosing PMMA is mainly because the amorphous
phase and flexible backbone in nature which leads to high ionic conductivity.
Ahmad (2009) mentioned that to attain a high ambient-temperature
conductivity, a polymer that is amorphous in nature and has a flexible
backbone is more preferred. Polymer material of high molecular weight is
usually used to provide good mechanical strength and filming processability.
Besides, PMMA is selected because of its higher surface resistance, good
interfacial stability towards lithium electrodes and high ability to solvate
inorganic salts to form a complexation between polymer and salt (Stephan et
al., 2002).
As mentioned in Chapter 2, ions are transported in the polymeric host
material which is amorphous. The chain motions or rearrangements of the
polymer host virtually contribute to the ion transport. Hence, an amorphous
polymeric host is one of the importance factors to enhance the ambient
temperature ionic conductivity. Besides that, the amorphous properties and a
high molecular weight of PMMA would enhance the ionic conductivity and

39
mechanical integrity of the polymer electrolyte. The structure of PMMA is
illustrated in Figure 3.1.
Figure 3.1: Chemical structure of MMA
Table 3.1: Physical Properties of the Poly(methylmetharylate) (PMMA) Linear Formula [CH2C(CH3)(CO2CH3)]n
Molecular Weight (average) 996,000 by GPC
Density 1180 kg/m3
Transition Temperature 105 °C
Flash Point >250 °C
Water Absorption 0.1 - 0.5 % (50% rh)
Tensile Strength 55 - 80 MN/m2
Flexural Strength 100 - 150 MN/m2
Specific Heat 1.25 - 1.7 kJ/kg/oC
Appearance (Form) Crystals or Powder
Transmission for visible light (wave length) 92 %
CH3 / -[-CH2-C]- \ C=O /
O \
CH3

40
The advantages of PMMA are:-
-Broad softening range attribute to thermal agitation of the molecules
breaks down the weak secondary bonds. The rate at which this occurs
throughout the formless structure varies; producing a broad temperature
range for softening.
-Usually transparent-the looser structure transmits light so the material
appears transparent
-Low shrinkage on solidification, the random arrangement of molecules
produces little volume change and hence low shrinkage.
-Low chemical resistance where the more open random structure
enables chemicals to penetrate deep into the material and to destroy
many of the secondary bonds, thus it can be dissolved easily in solvent
3.1.2 Lithium Perchlorate (LiClO4)
Lithium perchlorate is the chemical compound with the formula
LiClO4. It is a white crystalline lithium salt with high solubility in many
solvents. It decomposes at about 400 °C, yielding lithium chloride and oxygen,
the latter being over 60% of its mass. It has both the highest oxygen to weight
and oxygen to volume ratio of all perchlorates, which makes it especially
advantageous for aerospace applications. Lithium perchlorate is also
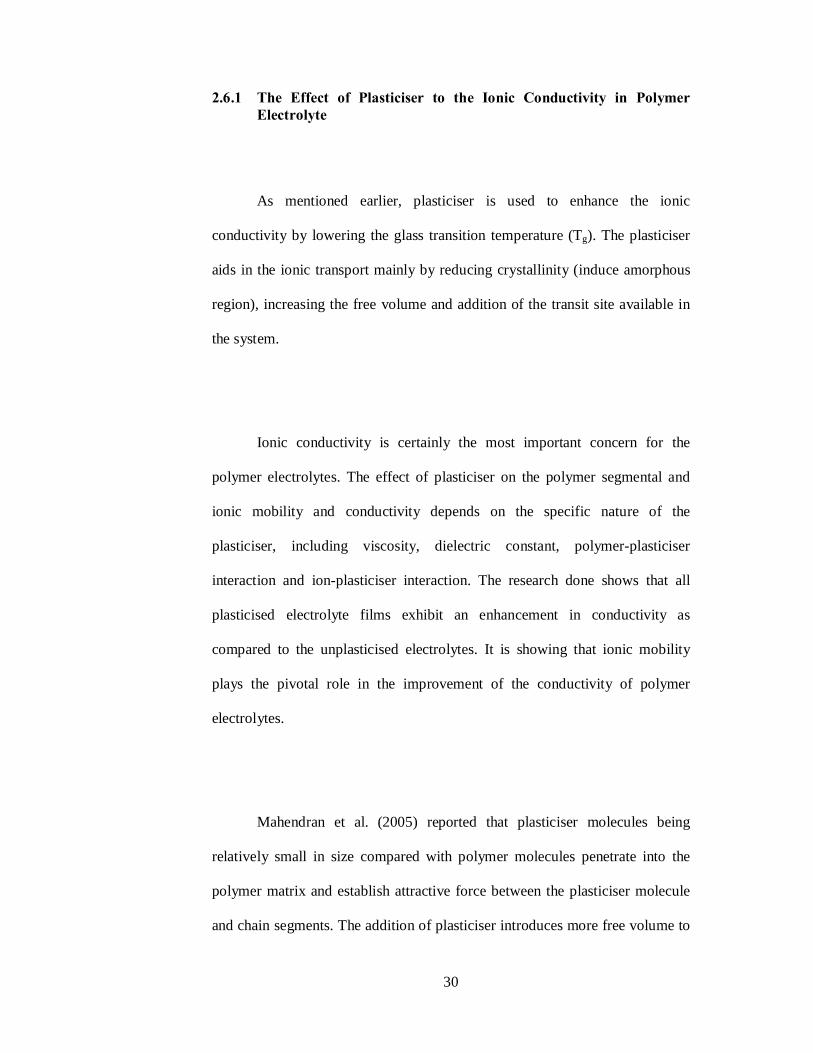
41
extensively used as an electrolyte in lithium batteries, as it does not undergo
oxidation on the anode. The chemical structure of LiClO4 is shown in Figure
3.2.
Figure 3.2: Chemical structure of LiClO4
Lithium perchlorate has been accepted for developing electrolyte in the
battery system due to its solubility and high conductivity and high anodic
stability. As compared with other lithium salts, LiClO4 has the advantage of
being relatively less hygroscopic and is relatively stable to ambient moisture in
comparison with their counterparts. It is being used frequently as a salt in
various laboratory tests because of its ease of handling and cost-effectiveness
(Ahmad, 2009).
Rajendran and Sivakumar (2008) reported that LiClO4 has a smaller
ionic radius, smaller dissociation energy and is highly soluble in most of the
organic solvents. Mahendran and Rajendran (2005) also mentioned that the salt
Cl
O
OOO
Li

42
has low lattice energy and large anions which are generally expected to
promote greater dissociation of salts, thereby more salts will be dissociated to
provide a higher concentration of ions.
Table 3.2: Physical Properties of Lithium Perchlorate (LiClO4) Molecular formula LiClO4
Molecular weight 106.39 g/mol
Density 2.42 g/cm3, solid
Melting point 236 °C
Boiling point 430 °C
Solubility in water 60 g/100 mL
Solubility in organic solvents Soluble
Appearance white crystals
Odor odourless
3.1.3 Ethylene Carbonate (EC)
Ethylene carbonate (EC) is an ester of ethylene glycol and carbonic
acid. This is an organic chemical also named 1,3-Dioxolane-2-one. Ethylene
Carbonate is a transparent crystalline solid in room temperature and it is
odourless, colourless and soluble in water. The chemical structure can be seen
in Figure 3.3 below.

43
Figure 3.3: Chemical Structure of Ethylene Carbonate
EC is used as a plasticiser due to its high dielectric constant about 89.6
at 40˚C and lower viscosity (Rajendran et al., 2003). Low viscosity and high
dielectric constant as a plasticiser in the polymer host helps to enhance the
conductivity of polymer electrolytes (Rajendran and Prabhu, 2010).
Table 3.3: Physical Properties of Ethylene Carbonate Linear Formula C3H4O3
Molar Mass 88.06 g/mol
Density 1.34 g/cm3 (20 °C)
Melting point 36 °C
Boiling point 248 °C
Flash point 150 °C
Solubility 214 g/l (20 °C)
dielectric constant 89.6 (40˚C)
O
O
O

44
3.1.4 Propylene Carbonate (PC)
Propylene carbonate (PC) also known as 4-Methyl-1, 3-dioxolan-2-one.
It is an organic compound and also a colourless and odourless liquid.
Propylene carbonate is used as a polar solvent that, unlike water, does not
donate protons to the dissolved substances. Due to its high dielectric constant,
it is frequently used as a high-permittivity component of electrolytes in lithium
batteries, usually together with a low-viscosity solvent. Its high polarity allows
it to create an effective solvation shell around lithium ions, thereby creating a
conductive electrolyte. The chemical structure is shown in the Figure 3.4 and
the physical properties are shown in Table 3.4.
Figure 3.4: Chemical Structure of Propylene Carbonate
O
O
OCH3

45
Table 3.4: Physical Properties of Propylene Carbonate Molecular formula C4H6O3
Molar mass 102.09 g/mol
Density 1.205 g/mL
Boiling point 241.7°C
Flash point 275°F (135°C) by closed cup
Solubility of propylene carbonate 17.5% at 25°C
Dielectric constant 64.9 at 20°C
Propylene carbonate is preferred because of its high dielectric constant
and low molecular weight which will enhance the dissociation of ion pairs of
the salt (Rajendran et al., 2010). Ahmad (2009) also reported that a high
dielectric constant and inert stability of propylene carbonate toward lithium
made it attractive for maximum research attention in the polymer electrolyte
field.
Li and Balbuena (1999) reported that EC is a better plasticiser than PC
due to its higher dielectric constant and lower viscosity. These properties
enhance the ionic conductivity because they favour salt dissociation and high
ionic diffusion rates. However, EC is a solid at room temperature where its
melting point is 36.2 ˚C. Li and Balbuena (1999) studied the EC/PC mixture
which shows that EC tends to substitute PC in the first shell of the cation.
Consequently, the effective radius of the complex ion solvent is smaller lead to
higher ionic conductivities.

46
Deepa et al. (2002) revealed that the synergistic effect of both EC and
PC providing desired characteristics such as a high degree of dissociation and
fast ion migration. The synergistic effect also affects the physico-chemical
properties of individual plasticiser like high dielectric and low viscosity of EC
and the low freezing point of PC along with its good plasticising characteristics
which are contributed towards improving conductivity performance.
3.1.5 Aluminium Oxide (Al2O3)
Aluminium oxide belongs to the family of inorganic compounds with
the chemical formula Al2O3 commonly referred as alumina. Aluminium oxide
is an electrical insulator but has an excellent thermal conductivity and also
insulator for a ceramic material and it usually occurs in crystalline form. The
chemical structure and physical properties are shown in Figure 3.5 and Table
3.5, respectively.
Figure 3.5: Chemical Structure of Aluminium Oxide (Al2O3)
OAl
OAl
O
47
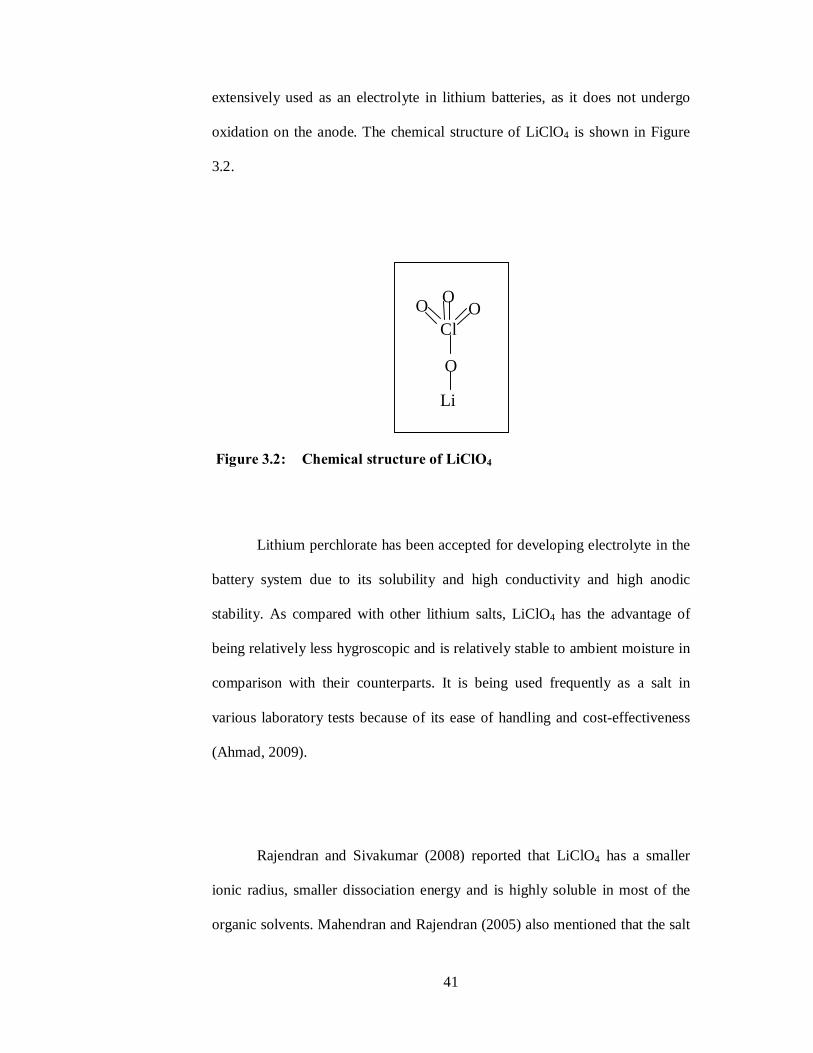
Table 3.5: Physical Properties of Aluminium Oxide (Al2O3) Molecular formula Al2O3
Molar mass 101.96 g mol−1
Density 3.95-4.1 g/cm3
Appearance white solid crystal
Melting point 2072 °C
Boiling point 2977 °C
Odor Odorless
Solubility in water Insoluble
According to Croce et al.(1999), Al2O3 is dispersed in PEO-LiClO4 to
form complexes with the basic oxygen atoms in the PEO chains and acts as
cross-linking centers for PEO segments, thereby reducing the reorganisation
tendency of the polymer chain and promoting preferred Li+ transport at the
boundaries of the filler particles. Thus, the ionic conductivity of the particular
polymer electrolyte will be increased.
Krawiec et al. (1995) also agreed that the dispersing of Al2O3 tends to
increase the ionic conductivity of polymer electrolyte. They also mentioned
that decreasing the size of the Al2O3 from micrometer to nanometer, the ionic
conductivity is enhanced significantly. Dispersion of this filler to the polymer
electrolyte, the cell or battery performance of the system is maintained at 95%
of the initial capacity after 100 cycles (Jung et al., 2009).

48
3.1.6 Silicon Dioxide (SiO2)
Silicon dioxide is also known as silica.It is an oxide of silicon with a chemical
formula of SiO2. It has been known for its hardness since antiquity. Silica is
used primarily in the production of glass for windows, drinking glasses,
beverage bottles, and many other uses. The majority of optical fibres for
telecommunications are also made from silica. Thin films of silica grown on
silicon wafers via thermal oxidation methods can be quite beneficial in
microelectronics, where they act as electric insulators with high chemical
stability. In electrical applications, it can protect the silicon, store charge, block
current, and even act as a controlled pathway to limit current flow. The
Chemical Structure is shown in Figure 3.6 and the physical properties are
shown in Table 3.6.
Figure 3.6: Chemical Structure of SiO2
O=Si=O

49
Table 3.6: Physical properties of SiO2
Molecular formula SiO2
Molar mass 60.0843 g/mol
Density 2.634 g/ cm3
Melting point 1650(±75) °C
Boiling point 2230 °C
Solubility in water 0.012 g/100 mL
Appearance white powder
Generally, SiO2 is found to act as a passive filler and played a
predominant role in controlling the rheological properties while ions transport
properties (Ahmad et al., 2006). The dispersion of SiO2 in the polymer
electrolyte system is to reduce the glass transition temperature (Tg) and
crystallinity of the polymer which allows amorphous polymer to provide
specific liquid-like characteristics for the transportation of ions (Kim et al.,
2003).
Jung et al.(2009) reported that Silica has been expected to enhance the
ionic conductivity of polymer electrolytes due to the surface hydroxyl groups
which can be easily modified for a specific need. The nanosized SiO2 was
found to contribute to the rapid formation of compact and stable passive films,
which stabilise the interface between the electrolyte and lithium electrode.
Besides that, the dispersion of the nano-sized SiO2 powder is also capable to
enhance the mechanical strength, conductivity, and electrochemical properties
of the SPEs.

50
3.1.7 Tetrahydrofuran THF
Tetrahydrofuran (THF) is a colourless liquid with ether-like smell. It is
an aprotic solvent with a dielectric constant of 7.6 and is usually applied as a
polar solvent and it is used to dissolve a wide range of nonpolar and polar
chemical compounds. THF is particularly capable of dissolving many ionic
species which is commonly used in specialty syntheses. In many cases, THF
makes higher yields and faster reaction rates possible. In addition, THF's high
volatility and very high purity facilitate solvent removal and recovery without
leaving residues in the desired polymer electrolyte thin films. The chemical
structure is shown in Figure 3.7 and the physical properties are shown in Table
3.7.
Figure 3.7: Chemical structure of Tetrahydrofuran (THF)
O

51
Table 3.7: Pysical properties of Tetrahydrofuran (THF)
Chemical formula C4H8O
Molar mass 72.11 g/mol
Density 0.89 g/ cm3
Solubility soluble
Melting point -108.5 °C
Boiling point 65 - 66 °C
Flash point -21.5 °C
Evaporation number 2.3
3.2 Solution-Cast Technique
Four systems of polymer electrolyte samples (PMMA-EC/PC, PMMA-
EC/PC-LiClO4, PMMA-EC/PC-LiClO4-Al2O3 and PMMA-EC/PC-LiClO4-
SiO2) were prepared using the solution-cast technique. Prior to the preparation
of the polymer electrolytes, LiClO4 was dried at 60 °C for overnight to
eliminate any trace water in the material. The quantity of materials integrated
was expressed in weight percentage (wt%). Approprite amounts of materials
were dissolved in THF. The solution was then stirred continously for 24 hours
on a hot plate stirrer at room temperature to obtain homogeneous solution.
After that, the solution was poured into Petri dishes and the Petri dishes are
covered with aluminium foil with a few holes to avoid direct exposure to
atmosphere. However, the samples are allowed to evaporate slowly inside the
fume hood for 24 hours to form a polymer electrolyte thin film. The films were

52
then transferred into a desiccator for further drying. The polymer sample is
depicted in Figure 3.8.
Figure 3.8: Polymer Electrolyte Samples
In the initial stage, the pre-determined EC: PC ratio is obtained at
70:30. The weight of PMMA was fixed as 1 gram, while the EC/PC weight
percentage was from 0 wt% until 50 wt%, with an increment of 5 wt%. After
the PMMA-EC/PC samples with the best ionic conductivity was determined,
the sample with 70 wt% of PMMA and 30 wt% of EC/PC achieved the highest
ionic conductivity. Therefore, this ratio is being fixed in this system and the
sample preparation process was then repeated with an addition of LiClO4
(5wt% to 50 wt%).
Petri Dish
Polymer Electrolyte
Aluminum Foil

53
In the last stage of the sample preparation, Al2O3 (grain size of 40-47
nm) inorganic fillers and SiO2 (grain size of 7nm) inorganic fillers are
dispersed separately into the best ionic conductivity sample in the PMMA-
EC/PC-LiClO4. PMMA-EC/PC (75 wt%) and LiClO4 (25wt%) were employed
as it achieved the maximum ionic conductivity in the PMMA-EC/PC-LiClO4
system. In this work, dispersion of 2 to 20 wt% of Al2O3 and SiO2 inorganic
fillers with an increment of 2 wt% is dispersed in order to obtain two different
systems of samples. All of these samples generated from the solution-cast
technique will then be characterised by EIS, FTIR, XRD and SEM.
3.3 Characterisations
The polymer electrolyte thin films generated from the solution cast
technique are characterised by electrochemical impedance spectroscopy (EIS)
to determine the ionic conductivity (σ), fourier transform infrared spectroscopy
(FTIR) to identify the interaction between molecules and the structural
changes, x-ray diffraction (XRD) to reveal the information about
crystallographic structure and chemical composition and scanning electron
spectroscopy (SEM) to investigate the micro-structure of the particularly thin
films.

54
3.3.1 Electrochemical Impedance Spectroscopy (EIS)
Electrochemical Impedance Spectroscopy (EIS) is a characterisation technique
used to determine the bulk resistance (Rb) of the solid polymer electrolytes. A
conductivity study on the polymer electrolytes was carried out using the
Solartron SI 1260 Impedance/Gain-Phase Analyser with the frequency ranging
from 1Hz to 1MHz. The thickness of the polymer electrolytes was measured by
using a micrometer screw gauge. As the ionic conductivity varies
corresponding to the thickness of the sample, therefore, the measurement of
thickness was repeated onto the polymer electrolyte sample in order to obtain
an average thickness. The prepared electrolyte samples were placed between
two stainless steel plates that acted as the electrodes for the conductivity
studies and an AC voltage at 10 mV was applied with varied frequency. The Rb
of the samples was then determined through the Cole-Cole plot as shown in
Figure 3.9, which cause the intercept on the real axis of the spectrum.

55
Figure 3.9: Cole-Cole plot of AC impedance spectroscopy
The plot in Figure 3.9 (a) shows a slight depressed semicircle which
corresponds to the bulk resistance (Rb) and a spur corresponding to the
0 500 1000 1500 2000
-2000
-1500
-1000
-500
0
Z'
Z''
25 wt% LiClO4.dat
Rb
0 5.0e5 1.0e6 1.5e6 2.0e6
-2.0e6
-1.5e6
-1.0e6
-5.0e5
0
Z'
Z''
30 wr% EC/PC.dat
Rb
(a)
(b)

56
interfacial resistance (Rs). The non vertical spikes at low frequency might
attribute to the surface roughness in electrolyte and electrodes interface
(Rajendran et al., 2010). Besides that, the high frequency semi-circle yields
information about the properties of the electrolyte such as bulk resistance (Rb)
and bulk capacitance (Cb). This effect is attributed to the migration of ions and
the dielectric polarisation in the polymer electrolyte film (Ragavendran et al.,
2004). For the cole-cole plot in Figure 3.9 (b), this response is typically for the
electrolyte with a major contribution towards total resitance from bulk
resistance (Rb) and constributeminorly to the interfacial resistance (Rs). This
straight line is inclined towards the real axis representing the
electrode/electrolyte double layer capacitance behaviour (Raghavan et al.,
2010). The attribute to the current carriers are ions and the total conductivity is
mainly contributed by ion conduction (Rajendran and Sivakumar, 2008).
Figure 3.10: Equivalent circuit of the AC impedance spectroscopy
The equivalent circuit representing the AC response of the polymer
electrolyte with the electrodes is shown in Figure 3.10. The electrodes became
alternatively positively and negatively charged and the alternating field across
Rs
Rb
Cb
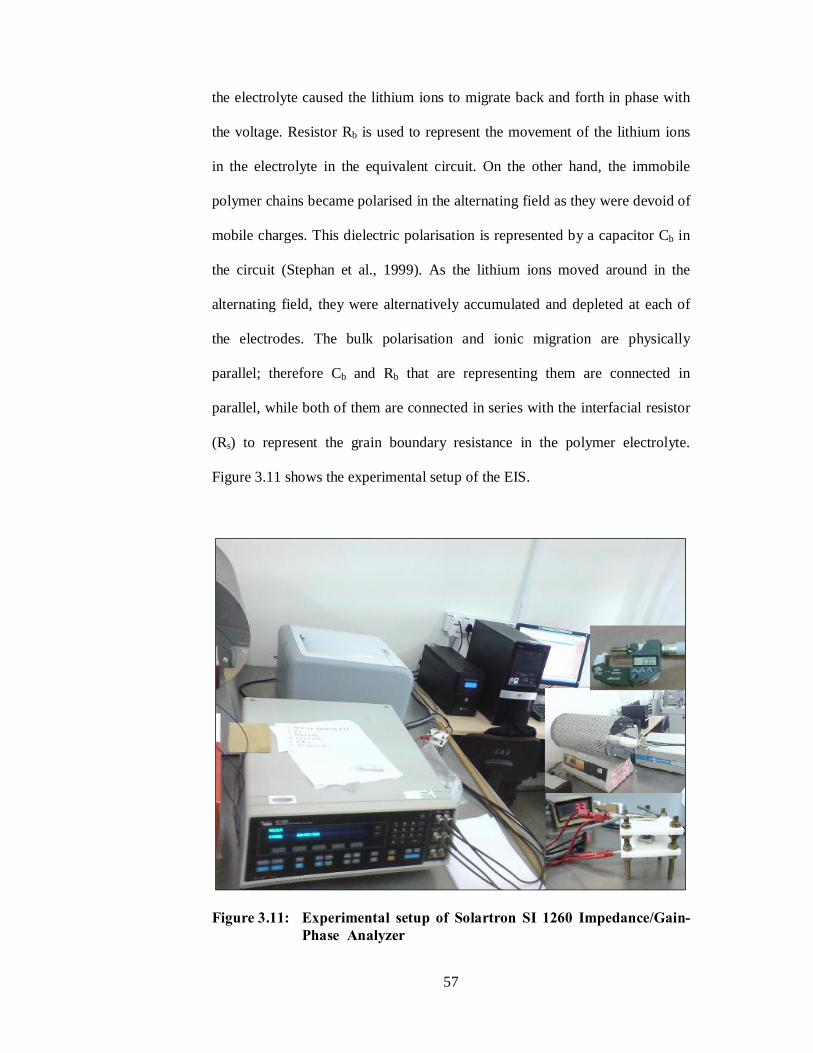
57
the electrolyte caused the lithium ions to migrate back and forth in phase with
the voltage. Resistor Rb is used to represent the movement of the lithium ions
in the electrolyte in the equivalent circuit. On the other hand, the immobile
polymer chains became polarised in the alternating field as they were devoid of
mobile charges. This dielectric polarisation is represented by a capacitor Cb in
the circuit (Stephan et al., 1999). As the lithium ions moved around in the
alternating field, they were alternatively accumulated and depleted at each of
the electrodes. The bulk polarisation and ionic migration are physically
parallel; therefore Cb and Rb that are representing them are connected in
parallel, while both of them are connected in series with the interfacial resistor
(Rs) to represent the grain boundary resistance in the polymer electrolyte.
Figure 3.11 shows the experimental setup of the EIS.
Figure 3.11: Experimental setup of Solartron SI 1260 Impedance/Gain- Phase Analyzer

58
3.3.2 Fourier Transform Infrared Spectroscopy (FTIR)
Fourier transform infrared spectroscopy (FTIR) is a technique to obtain
an infrared spectrum of emission and absorption of a solid such as metal,
powder and thin film. An FTIR spectrometer simultaneously collects spectral
data in a wide spectral range.
S. Rajendran et al. (2009) revealed that FTIR is an efficient tool to
study the local structural changes in polymers. The IR spectra of these
materials vary according to their composition and may be able to show the
occurrence of the complexation and interaction between various constituents.
IR spectroscopy has been used to enumerate the inter- and intra-molecular
interactions of the components of the polymer-salt complexes. Such interaction
could induce changes in vibrational modes of the atoms or molecules in the
material, which in turn changes the physical and chemical properties of the
constituents of the complex.
The operation of the FTIR is shown in Figure 3.12. The IR
spectrometer consists of two mirrors located at a right angle to each other and
oriented perpendicularly, with a beam splitter placed at the vertex of the right
angle and oriented at a 45˚ angle relative to the two mirrors. The beam splitter
split the light from the source ideally 50 % of the light is reflected towards the

59
fixed mirror and 50 % is transmitted towards the moving mirror. Light is
reflected from the two mirrors back to the beam splitter and 50 % of the
original light passes into the sample. Once the infrared beam is passed through
the sample, the molecules absorbed the infrared radiation and is then excited to
a higher energy state. Therefore, the energies associated with these vibrations
are quantisized within a molecule. The amount of energy absorbed at each
wavelength was recorded. The frequencies which have been absorbed by the
sample are determined by a detector and the signal is amplified.
Figure 3.12: Operation of the FTIR spectroscopy
The FTIR characterisation was done on the polymer electrolytes using
the Perkin Elmer Spectrum RX1 within the range of 400-4000 cm-1 and the
resolution of the spectra obtained at room temperature was 4 and recorded in
Light source
Fixed mirror
Movable mirror
beam splitter
detector
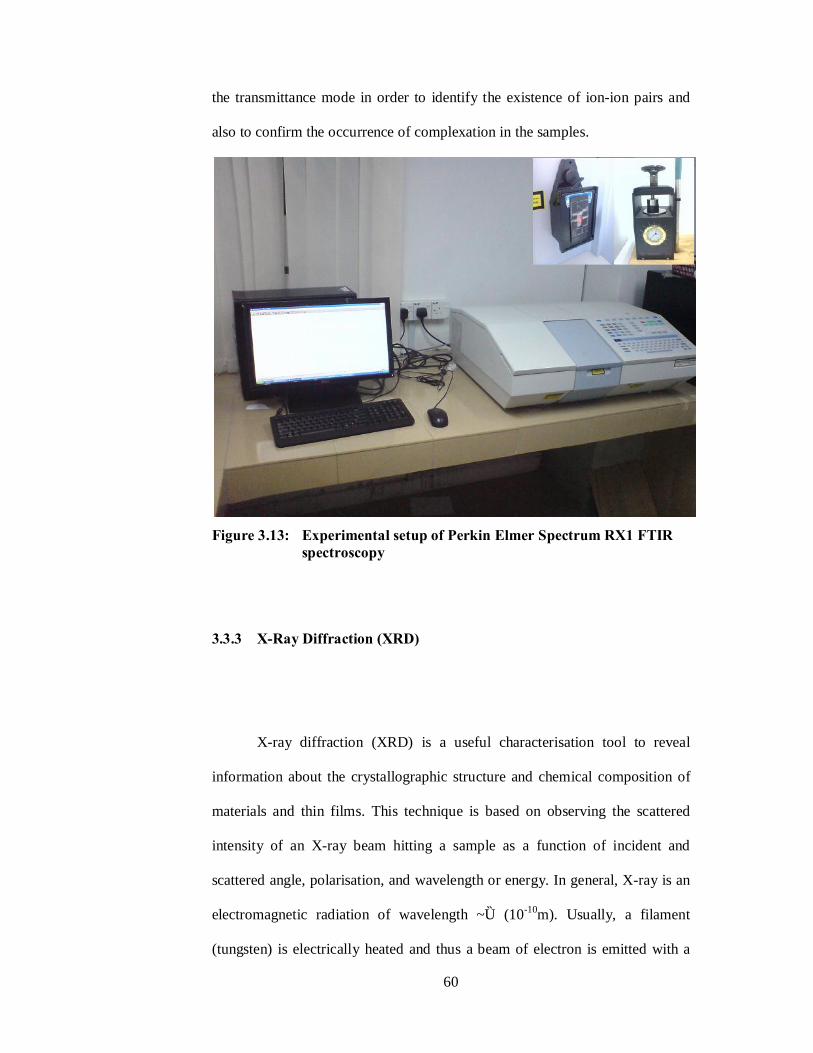
60
the transmittance mode in order to identify the existence of ion-ion pairs and
also to confirm the occurrence of complexation in the samples.
Figure 3.13: Experimental setup of Perkin Elmer Spectrum RX1 FTIR
spectroscopy
3.3.3 X-Ray Diffraction (XRD)
X-ray diffraction (XRD) is a useful characterisation tool to reveal
information about the crystallographic structure and chemical composition of
materials and thin films. This technique is based on observing the scattered
intensity of an X-ray beam hitting a sample as a function of incident and
scattered angle, polarisation, and wavelength or energy. In general, X-ray is an
electromagnetic radiation of wavelength ~Ǻ (10-10m). Usually, a filament
(tungsten) is electrically heated and thus a beam of electron is emitted with a

61
high potential difference in between 20 to 50 kV which strikes to a metal target
(Cu).
Using the Bragg’s approach of diffraction, crystals can be regarded as
built up in layers or planes such that each acts as a semi-transparent mirror.
This is known as the angle of incidence other than the Bragg’s angle when the
reflected beams are out of phase, has a destructive interface or when
cancellation occurs. The derivation of Bragg’s law is shown in Figure 3.14,
where the two X-ray beams, 1 and 2, are reflected from adjacent planes i.e. A
and B within the crystal. As an X-ray that reflects from a plane of atom inside,
the crystal travelled more distance than an X-ray that reflects from a crystal’s
surface. The perpendicular distance between pairs of adjacent planes, d-spacing
(d) and the angle of incidence, or Bragg angle (θ) are related to the distance xy
by
xy = yz = dsinθ (3.1)
Thus
xyz = 2d sinθ (3.2)
But
xyz = nλ (3.3)
Therefore
2d sin θ = nλ (3.4)

62
where λ = wavelength of X-ray (10-10m)
d = spacing between layers of atoms
θ = incident angle between the X-ray and the surface
Figure 3.14: Diffraction in the crystalline material
The Crystal structures with their regularly repeating patterns may be
referred to as a 3D grid thus the repeating unit of the grid, the unit cell, can be
found. The grid may be divided up into sets of planes in various orientations
and it is these planes which are considered in derivation of Bragg’s law. Each
set of plane has a characteristic d-spacing and the Bragg angle can be evaluated
for a given wavelength. For instance, diffraction occurs as a result of
interaction between X-rays and atoms but the atoms do not reflect X-rays but
scatter or diffract them in all directions.

63
In the current research, the XRD characterisation study is done by using
the Shimazu XRD-6000 diffratometer with a range which varies from 5˚ to 80˚.
Besides that, the scan speed was 2.5˚ θ/2θ per minute and step size was 0.02˚
θ/2θ. After that, the polymer electrolyte sample is placed in the path of a
monochromatic X-ray beam, the planes in the crystallites will orient at the
correct angle to fulfill the Bragg condition and hence form the diffraction. The
diffraction beam makes an angle of 2θ with the incident beam and the
diffraction pattern is performed by automatic diffractometers. Figure 3.15
shows the experimental setup of the Shimazu XRD-6000 diffratometer.
Figure 3.15: Experimental setup of the Shimazu XRD-6000
diffratometer

64
3.3.4 Scanning Electron Microscope (SEM)
The scanning electron microscope (SEM) is a type of electron
microscope that images the sample surface by scanning it with a high-energy
beam of electrons in a raster scan pattern. The structure and surface
morphology study on polymer electrolyte was carried out using theHitachi S-
3400N scanning electron microscope operated at 20 kV with a magnification
about 1000X. The polymer electrolyte is placed on a multi-holder and then
engages the multi-holder in the Hitachi S-3400N Scanning electron
microscope. Before that, the polymer electrolyte samples were initially coated
with a thin layer of gold to prevent electrostatic charging. Once the scanning is
ready, the chamber is vacuumed to prevent the interaction of the beam with any
extraneous particles in the atmosphere. Figure 3.16 shows the Experimental
setup of the Hitachi S-3400N Scanning Electron Microscope.
Scanning electron microscopy is extremely versatile for providing
structural information over a wide range of magnification. At one extreme,
Scanning electron microscopy complements the optical microscopy for
studying the texture, topography and surface features of solid pieces. Because
of the depth focus of SEM instruments, the resulting pictures have a definite
three-dimension quality. The types of signals produced by an SEM include
secondary electrons and back-scattered electrons, specimen current and
transmitted electrons. Secondary electron detectors are common in all SEMs,

65
the signals result from interactions of the electron beam with atoms at or near
the surface of the sample. In the most common or standard detection mode, the
secondary electron imaging in SEM can produce very high-resolution images
of a sample surface, revealing details about less than 1 to 5 nm in size.
In the operation of SEM, an electron beam emitted from an electron
gun fitted with a tungsten filament cathode. The electron beam has an energy
ranging from few hundred eV to 50eV and is focused by one or two condenser
lenses to a spot about 1 nm to 5 nm in diameter. The beam passes through pairs
of scanning coils or pairs of deflector plates in the electron column which
deflect the beam so that it scans in a raster fashion over a rectangular area of
the sample surface. When the primary electron beam interacts with the sample,
the electrons lose energy by repeated random scattering and absorption within
a teardrop-shaped volume of the specimen named interaction volume, which
extends from less than 100 nm to around 5 µm into the surface. These electrons
are reflected by the surface of the sample with no loss of energy (backscatter
electron). They may be absorbed and emit secondary electrons of low
energy.They may also be absorbed and give rise to the emission of visible
light, and also give rise to electric currents within the specimen. All these
effects can be detected and hence given a map of the surface topography of
samples. For backscattered electrons, it consists of high-energy electrons
originating in the electron beam, which are reflected or back-scattered out of
the specimen interactions with specimen atoms. The atomic number of the
elements in the sample is used to determine the contrast in the produced image.
66
The image will show the distribution of different chemical phases in the
sample.
The spatial resolution of the SEM depends on the size of the electron
spot which in turn depends on both the wavelength of the electrons and the
electron-optical system (magnetic electron-optical system) which produces the
scanning beam. The resolution is also limited by the size of the interaction
volume which is very large as compared to the distances between atoms, so the
resolution of the SEM is not high enough to image down to the atomic scale.
However, SEM has compensating advantages such as the ability to image a
comparatively large area of the specimen, to image bulk materials and the
variety of analytical modes available for measuring the composition and nature
of the specimen.

67
Figure 3.16: Experimental setup of the Hitachi S-3400N Scanning
Electron Microscope

68
CHAPTER 4
RESULT AND DISCUSSION
4.1 Electrochemical Impedance Spectroscopy (EIS) Studies
The bulk resistance (Rb) for a particular polymer electrolyte sample is
obtained from the Cole-Cole plot as shown in Figure 4.1. The ionic
conductivity of the sample can be determined using the Equation 4.1.
Figure 4.1: Cole-Cole plot of a.c. impedamce spectroscopy
0 100 200 300 400 500 600 700 800
-800
-700
-600
-500
-400
-300
-200
-100
0
Z'
Z''
0 wt% filler.dat12 wt% Al2O3.dat12wt% SiO2.dat
Rb

69
Figure 4.1 shows the Cole-Cole plot of a.c impedance spectroscopy for
LiClO4, Al2O3 and SiO2. The straight lines inclined towards the real axis in the
samples when Lithium Perchlorate (LiClO4) is added. This behaviour is
caused by a major contribution towards bulk resistance (Rb). Therefore, the Rb
can be obtained by the interception on the real axis for the polymer electrolyte
(Raghavan et al., 2010) as:
ARt
b
=σ (4.1)
where σ = ionic conductivity
t = thickness of the sample
A = surface area of the sample
Rb = bulk resistance
In the Cole-Cole plot, the disappearance of the high frequency semi-
circular portion which revealed that the current ionic conduction is conducted
by ions. The low ion diffusion resistance results in higher ionic conductivity
(Osaka et al., 1997).

70
4.1.1 Ionic Conductivity at Ambient Temperature
4.1.1.1 Ionic Conductivity for determining the optimum EC and PC mixture ratio
Figure 4.2 shows the ionic conductivity behavior of EC/PC which was
mixed at different weight ratio.
Figure 4.2 Ionic Conductivity of EC in (EC + PC)
From the observation, 70% of EC and 30% of PC mixture exhibit the
highest conductivity in all the system with good mechanical properties. The
synergist effect of binary plasticiser plays an important role to softening or
improving the mechanical properties of polymer host. The proper formulation
of EC/PC ratio may help to optimise the synergist effects to the host polymer.
Thus, pre-determining the ratio of EC/PC mixture is important to enhance the
flexibility and performance of polymer electrolyte.

71
In general, the EC/PC mixture is used as a binary solvent for solvating
the lithium salt neither to generate liquid electrolyte nor integrate a host
polymer into the liquid electrolyte to generate gelled type polymer electrolyte.
In the present studies, EC/PC mixture is used as plasticiser.
4.1.1.2 Ionic Conductivity Results for PMMA-EC/PC system
Pure PMMA polymer film is rigid, fragile, and transparent with a
smooth film surface. The mechanical property of PMMA is altered by an
addition of plasticiser (EC/PC mixture with 70:30). With the increment of
EC/PC mixture, polymer thin films are getting more softened. For PMMA
sample to be added with more than 30 wt% of EC/PC mixtures, the mechanical
polymer systems will become gel like and will loose the mechanical integrity.
As the primary objective of the research is to develop a solid type of polymer
electrolytes, the result of EC/PC mixture into PMMA polymer are limited to 30
wt % of EC/PC mixture before the polymer film turns into gel.
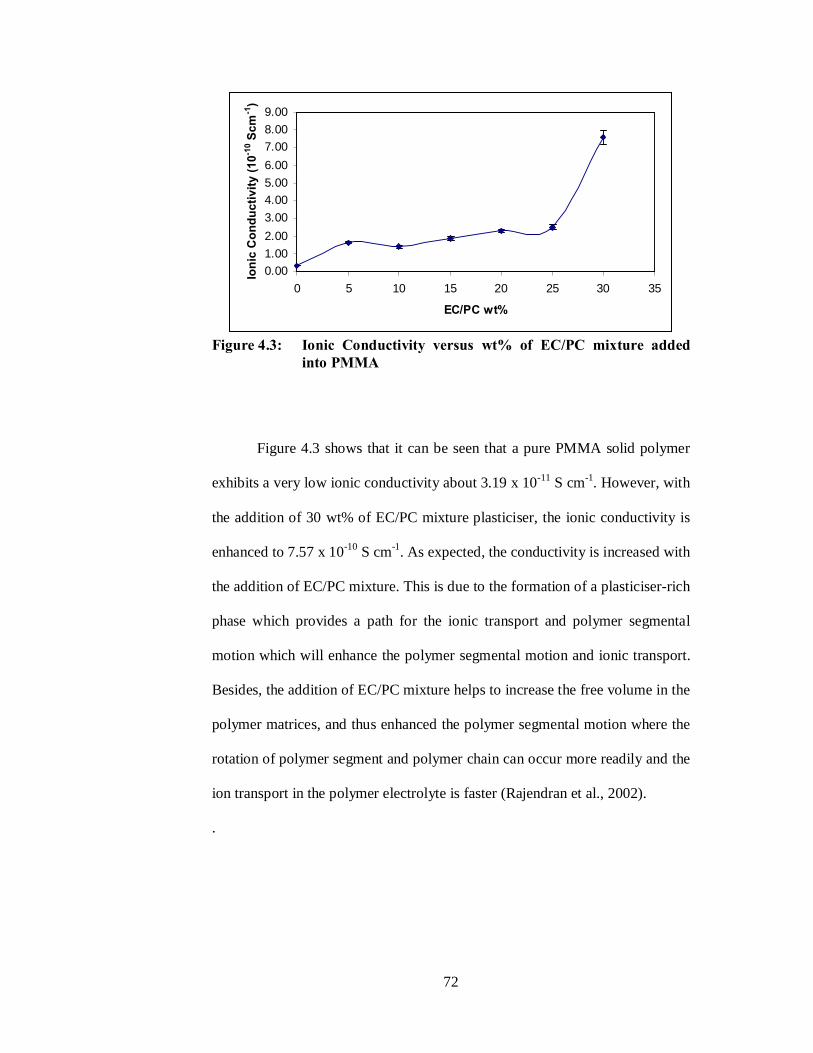
72
Figure 4.3: Ionic Conductivity versus wt% of EC/PC mixture added
into PMMA
Figure 4.3 shows that it can be seen that a pure PMMA solid polymer
exhibits a very low ionic conductivity about 3.19 x 10⁻¹¹ S cm-1. However, with
the addition of 30 wt% of EC/PC mixture plasticiser, the ionic conductivity is
enhanced to 7.57 x 10⁻¹⁰ S cm-1. As expected, the conductivity is increased with
the addition of EC/PC mixture. This is due to the formation of a plasticiser-rich
phase which provides a path for the ionic transport and polymer segmental
motion which will enhance the polymer segmental motion and ionic transport.
Besides, the addition of EC/PC mixture helps to increase the free volume in the
polymer matrices, and thus enhanced the polymer segmental motion where the
rotation of polymer segment and polymer chain can occur more readily and the
ion transport in the polymer electrolyte is faster (Rajendran et al., 2002).
.
0.001.002.003.004.005.006.007.008.009.00
0 5 10 15 20 25 30 35
EC/PC wt%
Ioni
c C
ondu
ctiv
ity (1
0-10 S
cm-1
)

73
Furthermore, the addition of high dielectric and low viscosity plasticiser
into the host polymer helps to enhance the ion and polymer segmental motion
as well as solvation ability. At the same time, the addition of plasticiser can
lower the degree of crystallinity in particular polymer system, this result can be
observed from the XRD studies (Mahendran et al., 2005). As mentioned in the
literature, the conductivity behaviour of polymer electrolytes is strongly
dependent on the glass transition temperature (Tg). Relatively, this sample
exhibits a very low conductivity value which is due to no lithium salts being
added into the system yet.
4.1.1.3 Ionic Conductivity Results for PMMA-EC/PC-LiClO4 system
From the predetermined 70/30 of EC/PC mixture into PMMA host,
LiClO4 lithium salt was added accordingly ranging from 5 wt% to 50 wt%.
With the addition of LiClO4 up to 25 wt%, the SPEs thin film appears
transparent. The localised white spot is observed when the addition of LiClO4
salt is beyond 25 wt%. This is due to the formation of crystalline surface of the
insoluble LiClO4 salt. These crystalline phases are observed by SEM, which
will be presented in section 4.6.2.
The addition of LiClO4 salt to the plasticised polymer caused the ionic
conductivity to increase dramatically even with a small amount of LiClO4 salt

74
(5 wt%). It can be observed in Figure 4.4 that with the addition of 5 wt% of
LiClO4 into the plasticised polymer (PMMA-EC/PC) system, the ionic
conductivity is elevated from 7.57 x 10⁻¹⁰ S cm-1 to 4.17 x10⁻⁸ S cm-1. As the
plasticised polymer provided separate ionic path ways for migration of free Li+
ions in the plasticiser-rich phase, the free Li+ ions may penetrate through these
new paths because of less viscous medium that enhanced the mobility of ions
and polymer segmental motion (Mahendran et al., 2005). Doping of the lithium
salt into polymer complex involved some structural changes, such as the polar
group of plasticiser and polymer backbone favourably to interact with LiClO4.
Due to the plasticisation effect, the inter-columbic interaction between Li+ and
ClO4- is overcome whereby providing more Li+ anions and ClO4
-cations, this
result is further confirmed by FTIR studies, as presented in section 4.5.2.
Figure 4.4: Ionic Conductivity versus wt% of LiClO4 added into
PMMA-EC/PC
0.000.501.001.502.002.503.003.504.004.50
0 10 20 30 40 50
LiClO4 wt%
Ioni
c C
ondu
ctiv
ity (1
0-5 Sc
m-1
)

75
The highest ionic conductivity obtained was 3.95 x 10⁻⁵ S cm-1 at 25
wt% of LiClO4 added into PMMA-EC/PC system. The overall conductivity is
elevated about 5 orders of magnitudes at 25 wt% of LiClO4 compared to 0% of
LiClO4. As the LiClO4 concentration increases, the number of carrier ions also
increases the ionic conductivity. Besides, the effect of the high dielectric
constant of EC/PC mixture helps to dissociate more lithium salt and provides
more charge carrier in the polymer matrix. At the same time, the plasticisation
effect of the EC/PC mixture with interaction at an appropriate concentration of
LiClO4 generated an additional transit “site” available in polymer electrolyte
matrices. Therefore, the increase in capacity for Li+ motion with lesser energy
losses can be achieved.
A further increase of salt concentration causes the ionic conductivity to
drop which may be due to the restricted ionic and polymer segmental mobility
in a rigid matrix (Rajendran et al., 2003). As the LiClO4 concentration is
further increased beyond its optimum level or saturation level, the Li+ ions
become closer to one another thus reduces the overall mobility mode of ion and
polymer segment. At a higher salt concentration, the conductivity decreases
due to the influencing of the ion pairs, ion triplets, charge cloud effects and
restriction to chain mobility and number of effective charge carriers in the solid
polymer electrolytes (MacCallum et al., 1986). The formation of random ionic
pairs and the clustering of aggregate which do not assist in the ionic
transportation might act as a barrier to ionic conduction. Thus, the blocking
effect consequently lowers the ionic and chain mobility and causes the ionic

76
conductivity to decrease. However, a slight increase of ionic conductivity is
observed at 40 wt% of LiClO4 added into PMMA-EC/PC system. This may
attribute to the elimination of inter-columbic interaction between Li+ and ClO4-
. Whereby, the interactions between ClO4-cations with the PMMA backbone,
therefore causing the extra transit sites to be formed for Li+ ions transportation
at this concentration (Tan et al., 2007).
4.1.1.4 Ionic Conductivity Results for PMMA-EC/PC-LiClO4-Al2O3
system
Composite solid polymer electrolytes (CSPEs) are formed with the
dispersion of nano-sized Al2O3 (40 ~ 47nm) into Solid polymer electrolyte
(PMMA-EC/PC-LiClO4) system. The predetermined best ionic conductivity
sample with 75 wt% of PMMA-EC/PC and 25 wt% of LiClO4 is used to
generate the Composite solid polymer electrolyte. The appearance of these
alumina composite solid polymer electrolytes is less transparent and is whitish
in colour due to the nature of Al2O3. It is revealed that this type of ceramic
filler is insoluble but is dispersible into the polymeric matrices. From the visual
investigation of these samples, the mechanical properties are improved as
compared to SPEs. Mainly because the mechanical integrity of these CSPE is
improved by the dispersion of nano-sized Al2O3.

77
The conductivity behaviour of these alumina CSPEs is presented in
Figure 4.5. From this figure, the best ionic conductivity was achieved at a
composition with 12 wt% of Al2O3 filler with the conductivity value of 1.02 x
10-4 S cm-1. The ionic conductivity is increased even when a small amount of
Al2O3 is added into the polymer electrolyte. It can be explained that a high
dielectric constant nanocomposite Al2O3 filler could help to dissociate more
LiClO4 lithium salt to increase more Li+ ions transportation between the
adjacent nanocomposite grains (Deka and Kumar, 2010). The dis-orderliness of
the structure of polymer complex induces the amorphous region when the
alumina filler is integrated into the polymer electrolyte which caused the
enhancement of ionic conductivity (Ahmad et al., 2006).
Figure 4.5: Ionic Conductivity versus wt% of nano-sized Al2O3 added
into PMMA-EC/PC- LiClO4
The increases in the charge carriers as well as in the ionic conductivity
are due to the model based on the Lewis acid-base interactions on the surface
of fillers. This enhanced the Li+ ions mobility under the coexistence of the

78
ceramic filler. The Lewis acid groups of the added filler such as the –OH
groups on the Al2O3 surface may have some interaction with the Lewis acid
lithium cations and anions of the LiClO4 salt (Low et al., 2010). It can be
explained that the Al2O3 filler may weaken the interaction between polymer
chain and Li+ ions (possibly to accelerate the dissociation of the lithium salt)
and creating a new Li+ ions pathway in the polymer complex (Chung et al.,
2001). This interaction is further confirmed by FTIR and SEM.
However, a further addition of Al2O3 beyond 12 wt% causes the
conductivity to drop. But an addition of ceramic filler can create a blocking
effect, thereby the filler grains can get close to one another which could make
the long polymer chains more immobilised leading to the decrease of the
conductivity (Dissanayake et al., 2003). It is believed that, excessive of fillers
in the polymer electrolyte may create a barrier to block the ionic conduction
and reduce the mobility of ionic transportation within the ceramic-rich phase
pathway. Another perspective is the presence of ion association that leads to
the formation of neutral ion clusters, ion pairs and ion aggregates. The
repelling force from the formatted neutral ion clusters, ion pairs and ion
aggregates decreases the density of free mobile ions and no contribution on the
ionic conduction, decreasing the ionic conductivity (Sharma and Sekhon,
2007).

79
4.1.1.5 Ionic Conductivity Results for PMMA-EC/PC-LiClO4-SiO2 system
Another Composite solid polymer electrolytes (CSPEs) system is
prepared by integrating a nano-sized SiO2 filler into the Solid polymer
electrolyte (PMMA-EC/PC-LiClO4) system. From visual observation, the
surface of this type of CSPE appears more transparent as compared to the
sample added with Al2O3. It might be due to the nature of SiO2 and the smaller
particle size about 7 nm (Al2O3 = 40~47 nm). However, the appearance of this
CSPE is not smooth and becomes brittle at high concentration SiO2. The
mechanical properties and integrity appears to be better than the one without
the addition of SiO2 filler.
The ionic conductivity is observed to be increased at a low
concentration of SiO2 filler. This effect may be attributed to the surface
interactions with lithium cationsas mentioned in Section 4.1.1(d). However, for
the higher filler concentrations, the blocking effect has led to lower
conductivity. From the Figure 4.6, it is shown that the ionic conductivity is
increasing at low concentration of filler addition and reached the maximum
ionic conductivity of 2.48 x 10⁻⁴ S cm-1 at 12 wt% of fumed silica. The ionic
conductivity has increased about one order of magnitude as compared to the
best ionic conductivity without filler. This implies that with an addition of 12
wt% of SiO2 filler it exhibits a higher effect on increasing the ionic

80
conductivity. A further increase of filler concentration causes the ionic
conductivity to decrease drastically.
Figure 4.6: Ionic Conductivity versus wt% of nano-sized SiO2 added
into PMMA-EC/PC- LiClO4
The enhancement of ionic conductivity is attributed to the mobility of
the Li+ ions which influence the segmental motion in the free volume.
Therefore, the Li+ ions can be facilitated with higher speed thus causing a
reduction in the total impedance of the polymer electrolyte (Ji et al., 2003). For
a certain concentration of SiO2 filler, the aggregates of silica can interact
through the H-bonding of surface hydroxyl groups, which results in the
formation of three-dimensional networks which is confirmed by SEM studies.
Through the formation of three-dimensional network, fast Li+ ions facilitation
could be achieved (Ahmad et al., 2006). For this composite solid polymer
electrolyte, the mechanism of Lewis acid-base reaction is similar to the system
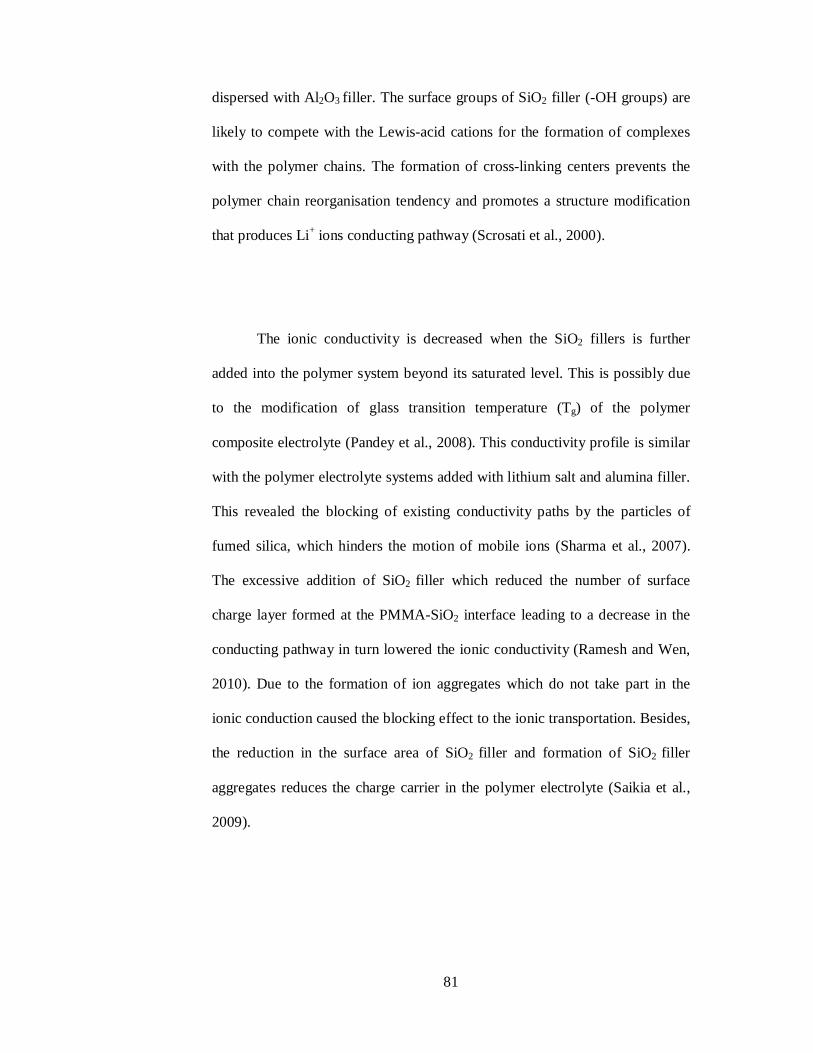
81
dispersed with Al2O3 filler. The surface groups of SiO2 filler (-OH groups) are
likely to compete with the Lewis-acid cations for the formation of complexes
with the polymer chains. The formation of cross-linking centers prevents the
polymer chain reorganisation tendency and promotes a structure modification
that produces Li+ ions conducting pathway (Scrosati et al., 2000).
The ionic conductivity is decreased when the SiO2 fillers is further
added into the polymer system beyond its saturated level. This is possibly due
to the modification of glass transition temperature (Tg) of the polymer
composite electrolyte (Pandey et al., 2008). This conductivity profile is similar
with the polymer electrolyte systems added with lithium salt and alumina filler.
This revealed the blocking of existing conductivity paths by the particles of
fumed silica, which hinders the motion of mobile ions (Sharma et al., 2007).
The excessive addition of SiO2 filler which reduced the number of surface
charge layer formed at the PMMA-SiO2 interface leading to a decrease in the
conducting pathway in turn lowered the ionic conductivity (Ramesh and Wen,
2010). Due to the formation of ion aggregates which do not take part in the
ionic conduction caused the blocking effect to the ionic transportation. Besides,
the reduction in the surface area of SiO2 filler and formation of SiO2 filler
aggregates reduces the charge carrier in the polymer electrolyte (Saikia et al.,
2009).

82
4.1.1.6 Summary of Ionic Conductivity Result at ambient temperature
From the Figure 4.7 and Table 4.1, it is clearly illustrated that the
addition of plasticiser and filler enhanced the ionic conductivity performance
of polymer electrolyte. The ionic conductivity is increased to 1 order of
magnitude when the EC/PC mixture plasticiser is added into pure PMMA.
Figure 4.7: Ionic conductivity of the best sample in each system

83
Table 4.1: Ionic conductivity of the best sample in each system
Sample Conductivity at ambient temperature
Pure PMMA 3.1916 x 10⁻¹¹ S cm-1
70 wt% PMMA : 30% EC/PC 7.5708 x 10⁻¹⁰ S cm-1
75 wt% PMMA-EC/PC : 25 wt% LiClO4 3.9519 x 10⁻⁵ S cm-1 88 wt% PMMA-EC/PC-LiClO4 : 12 wt%
Al2O3 1.0159 x 10⁻⁴ S cm-1
88 wt% PMMA-EC/PC-LiClO4 : 12 wt% SiO2
2.4784 x 10⁻⁴ S cm-1
The addition of the LiClO4 lithium salt into the plasticised host polymer
has caused the ionic conductivity to increase by 5 orders of magnitude up to 10-
05 Scm-1. The enhancement in the ionic conductivity ascribes the interaction
between the host polymer and plasticiser as both of these materials served as a
solvent to dissolve the lithium salt.
With the integration of ceramic fillers into the solid polymer
electrolyte, the ionic conductivity is further increased to 10-04 Scm-1 in both
types of fillers. From these results, it is revealed that the presence of these
electrolyte materials have caused favourable conductivity performance in
particular polymer electrolyte system and the enhancement in the mechanical
properties. The ionic conductivity for SiO2 is greater than Al2O3; this may be
concluded that the smaller particle size of SiO2 filler might have a better
dispersion phase and provides a better Lewis acid-base interaction with LiClO4
in the polymer electrolyte.

84
4.1.2 Temperature Dependence – Ionic Conductivity of Polymer Electrolytes
The polymer electrolytes sample with the highest conductivity (75 wt%
PMMA-EC/PC - 25 wt% LiClO4) and both samples of composite polymer
electrolyte (12 wt% of SiO2 and 12 wt% Al2O3) dispersed in PMMA-EC/PC-
LiClO4 system were studied through the impedance measurement for the
temperature ranging from 298K to 373K (25˚C to 100˚C). Through the
temperature versus conductivity studies, the activation energy (Ea) can be
calculated from the following equation.
−
=KT
Eaexp0σσ (4.2)
σnl = -KT
Ea− + nl 0σ (4.3)
σnl = KEa
1000−
T1000
+ nl 0σ (4.4)
Y= mX + C (4.5)
Gradient, m = KEa
1000−
(4.6)
Ea= - (1000 K) m (4.7)
Where Ea = the activation energy
T = temperature on Kelvin scale
0σ = pre-exponential factor
k = Boltzmann constant (1.3806503 x 10⁻²³ m2kgs-2k-1)
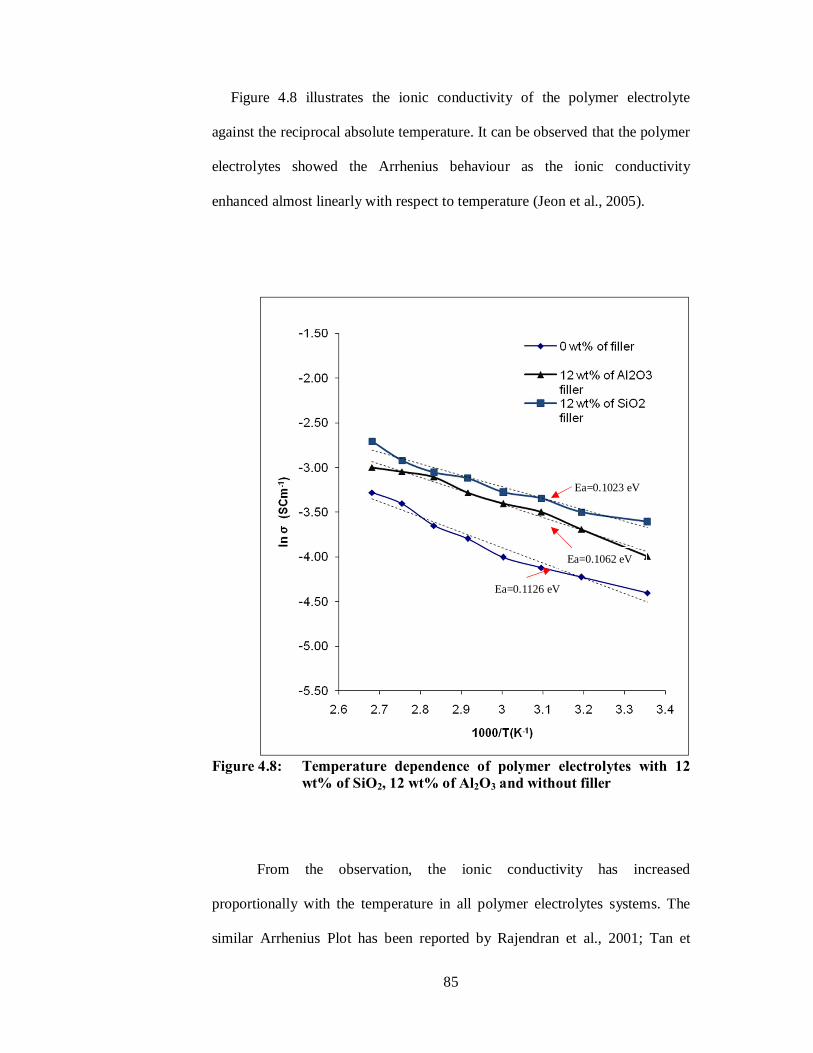
85
Figure 4.8 illustrates the ionic conductivity of the polymer electrolyte
against the reciprocal absolute temperature. It can be observed that the polymer
electrolytes showed the Arrhenius behaviour as the ionic conductivity
enhanced almost linearly with respect to temperature (Jeon et al., 2005).
Figure 4.8: Temperature dependence of polymer electrolytes with 12
wt% of SiO2, 12 wt% of Al2O3 and without filler
From the observation, the ionic conductivity has increased
proportionally with the temperature in all polymer electrolytes systems. The
similar Arrhenius Plot has been reported by Rajendran et al., 2001; Tan et
Ea=0.1023 eV
Ea=0.1062 eV
Ea=0.1126 eV

86
al.,2007; Osinska et al., 2009; Raghavan et al., 2010. This is due to the
improvement on thermal movement of polymer chain segments and the
dissociation of ion aggregates and ion pairs. The enhancement in the mobility
of polymer segmental motion and ionic transport with respect to higher
temperature has led to a higher ionic conductivity. At low temperature, the
polymer segmental motion and ionic mobility is hindered. This is attributed to
the increment of cohesive energy which causes from cation-dipole interaction
lead to lower conductivity (Rajendran et al., 2009). However at higher
temperature, the polymer matrices can expand easily and produce free volume.
The overall mobility of ions and polymer segmental motions are increased
which compensate the retarding effect of ion clouds (Mahendran et al., 2005
and Rajendran et al., 2010). At higher temperature, the polymer chain absorbed
the vibrational energy which is sufficient to push against the hydrostatic
pressure imposed by its neighbouring atoms and creates free volume. Thus, the
enhancement of mobility for the ions and polymer segment is caused by the
free volume movement (Saikia et al., 2008).
Generally, the activation energy (Ea) is a combination of the energy of
defect formation and the energy of defect migration, and it can be
differentiated from the temperature dependence graph slope of the plot
(Ramesh and Arof, 2001). As compared with the Ea obtained from 0 wt% of
filler (0.1126eV), 12 wt% of Al2O3 (0.1062eV) and 12 wt% of SiO2
(0.1023eV), the complete amorphous nature of the particular polymer
electrolyte will exhibit a low activation energy, Ea (Ramesh and Arof, 2001).

87
At higher temperature, the amorphous nature provides a bigger free volume in
the polymer matrix which can facilitate fast Li+ ion motion in the polymer
network (Michael et al., 1997). Those results agreed with the conductivity
studies where the sample showing the highest conductivity exhibits the lowest
activation energy.
4.1.3 Dielectric Relaxation Studies
The dielectric relaxation studies are very useful in understanding the
behaviour of polymers and the electrolyte materials. The relaxation of dipoles
in polymer electrolytes is studied through a broad frequency range (Rajendran
and Prabhu, 2010). Initially, when an electric field is applied to a material, the
dipoles in the material show the tendency to orient itself in the direction of the
applied field. In fact, the mobilisation of the dipole depends on the nature of
the materials. The delayed response of the polymer dipoles against the applied
electrical field is called dielectric relaxation (Jana and Zhong, 2008).
The complex dielectric behaviour of a polymer electrolyte is expressed
as:
ε* = ε’ + iε” (4.8)
|ε| = [(ε’)2 + (ε”)2]½ (4.9)

88
Where ε’ representing the real part of dielectric constant so-called relative
permittivity constant or dielectric constant and ε” representing imaginary part
of dielectric constant called relative loss permittivity or dielectric loss in the
polymer electrolyte system. These dielectric properties can be expressed as:
AtCp
0'
εε = (4.10)
0"
ωεσε = (4.11)
Where Cp= parallel equivalent static capacitance
t = thickness of sample
ε0 = permittivity of free space (8.856 x 10⁻¹⁴ Fcm-1)
A = surface Area of sample
σ = Ionic Conductivity of sample
ω = angular frequency (2πƒ)
4.1.3.1 Dielectric Relaxation Studies on Polymer Electrolytes at Room Temperature
Figures 4.9 to 4.11 illustrate the dielectric constant corresponding to the
frequency for PMMA-EC/PC-LiClO4, PMMA-EC/PC-LiClO4-Al2O3 and
PMMA-EC/PC-LiClO4-SiO2 systems of all samples at room temperature.
However, the result for PMMA-EC/PC system is not presented due to the

89
irregular pattern and low dielectric constant value. There is no distinctive line
presented in PMMA-EC/PC system, it might be due to the absence of lithium
salt in the samples hence not much ion pairs are formed. On the sample which
was added with LiClO4, Al2O3 and SiO2, some variation of the curves can be
observed (Jana and Zhong, 2008).
As mentioned earlier, the dielectric constant plot from Figure 4.9 to
4.11 is plotted according to Equation 4.10. From these figures, the highest
dielectric constant is achieved in the following samples:-
- PMMA-EC/PC with 25 wt% of LiClO4
- PMMA-EC/PC-LiClO4 with 12 wt% of Al2O3
- PMMA-EC/PC-LiClO4 with 12 wt% of SiO2
Figure 4.9: Real part of complex permittivity (ε’) for PMMA-EC/PC-(x
wt%) LiClO4 corresponding to frequency
0
1000
2000
3000
4000
5000
6000
7000
8000
9000
0 1 2 3 4 5 6
Log f
ε'
0%
5%
10%
25%
35%
45%
50%
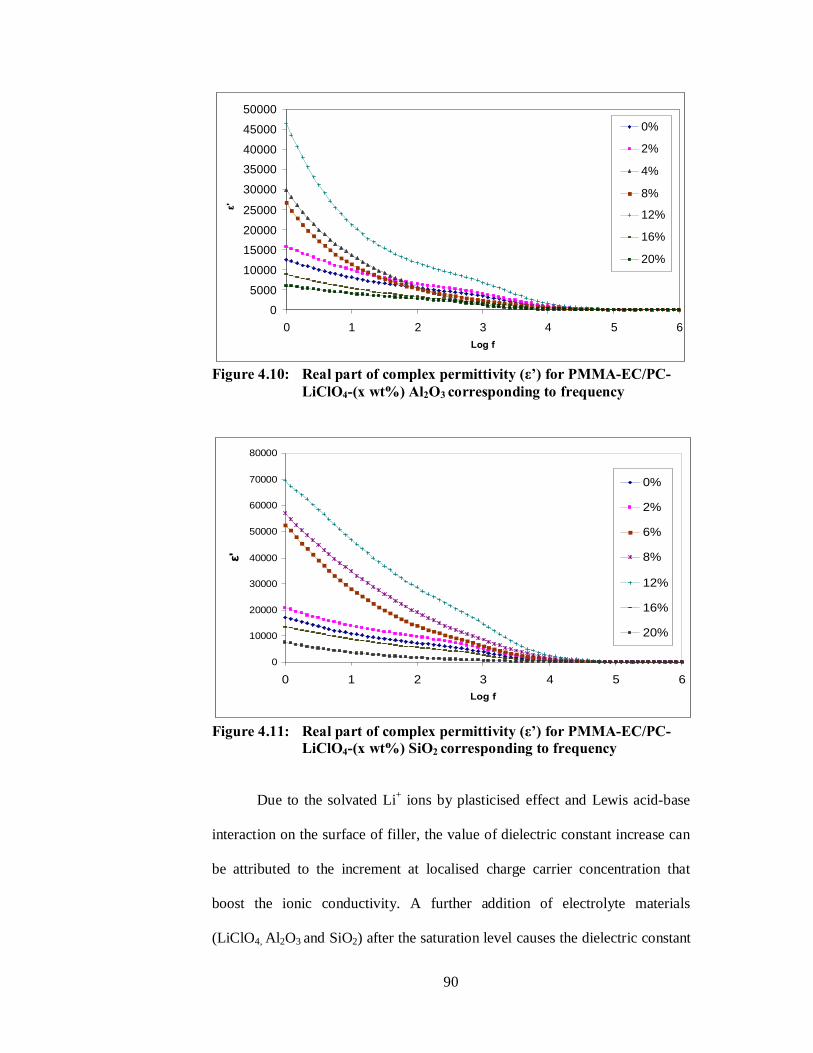
90
Figure 4.10: Real part of complex permittivity (ε’) for PMMA-EC/PC-
LiClO4-(x wt%) Al2O3 corresponding to frequency
Figure 4.11: Real part of complex permittivity (ε’) for PMMA-EC/PC-
LiClO4-(x wt%) SiO2 corresponding to frequency
Due to the solvated Li+ ions by plasticised effect and Lewis acid-base
interaction on the surface of filler, the value of dielectric constant increase can
be attributed to the increment at localised charge carrier concentration that
boost the ionic conductivity. A further addition of electrolyte materials
(LiClO4, Al2O3 and SiO2) after the saturation level causes the dielectric constant
0
5000
10000
15000
20000
25000
30000
35000
40000
45000
50000
0 1 2 3 4 5 6Log f
ε'
0%
2%
4%
8%
12%
16%
20%
0
10000
20000
30000
40000
50000
60000
70000
80000
0 1 2 3 4 5 6Log f
ε'
0%
2%
6%
8%
12%
16%
20%

91
to decrease. This revealed the formation of ion aggregation which reduces the
mobility of ions and hence reduces the ionic conductivity.
Besides that, the dielectric relaxation in the low frequency region is due
to the electrode polarisation effect as a result of an accumulation of charge
carrier at the electrode-electrolyte interface (Karan et al., 2008). Higher
dielectric constant revealed the enhancement of charge carrier density at the
space charge region. As a result, higher equivalent capacitance (Cp) can be
observed where the dielectric constant is directly proportional to the value of
Cp (Ramesh et al., 2002).
When the operating frequency increases, it can be observed from Figure
4.9 to Figure 4.11 that the dielectric constant decreases. Due to the high
periodic reversal of the electric field in higher frequencies, there is no excess
ions diffusion in the direction of the electric field. The contribution of charge
carriers towards the dielectric constant decreases at higher frequencies
(Baskaran et al., 2004). Thus, the excess ions diffusion is lesser in the direction
of electric field that induces the orientation of dipoles. This leads to decrease in
polarisation and weaken the interaction of dipoles and electric field. This
phenomenon can also be regarded that at low frequency range, the dipoles of
molecules tend to reorient in the direction of applied field. But at high
frequency, the dipoles may not have sufficient speed to reorient itself in the

92
direction of applied field thus dielectric constant decreases (Reicha et al.,
1991).
The imaginary part of permittivity, called dielectric loss (ε”) is shown
in Figures 4.12 to 4.14 which are generated according to Equation 4.11.
Dielectric loss composed of an ionic transportation and a direct measurement
of the energy is dissipated in the polymer electrolyte (Stephan et al., 2000). The
ε” measures the energy loss due to the orientation of dipoles and conduction of
ionic species in the polymer electrolyte when an electrical field is applied (Jana
and Zhong, 2008).
Figure 4.12: Imaginary part of complex permittivity (ε”) for PMMA-
EC/PC-(x wt%) LiClO4 corresponding to frequency
0
5000
10000
15000
20000
25000
30000
35000
40000
45000
50000
0 1 2 3 4 5 6Log f
ε"
0%
5%
10%
25%
35%
45%
50%
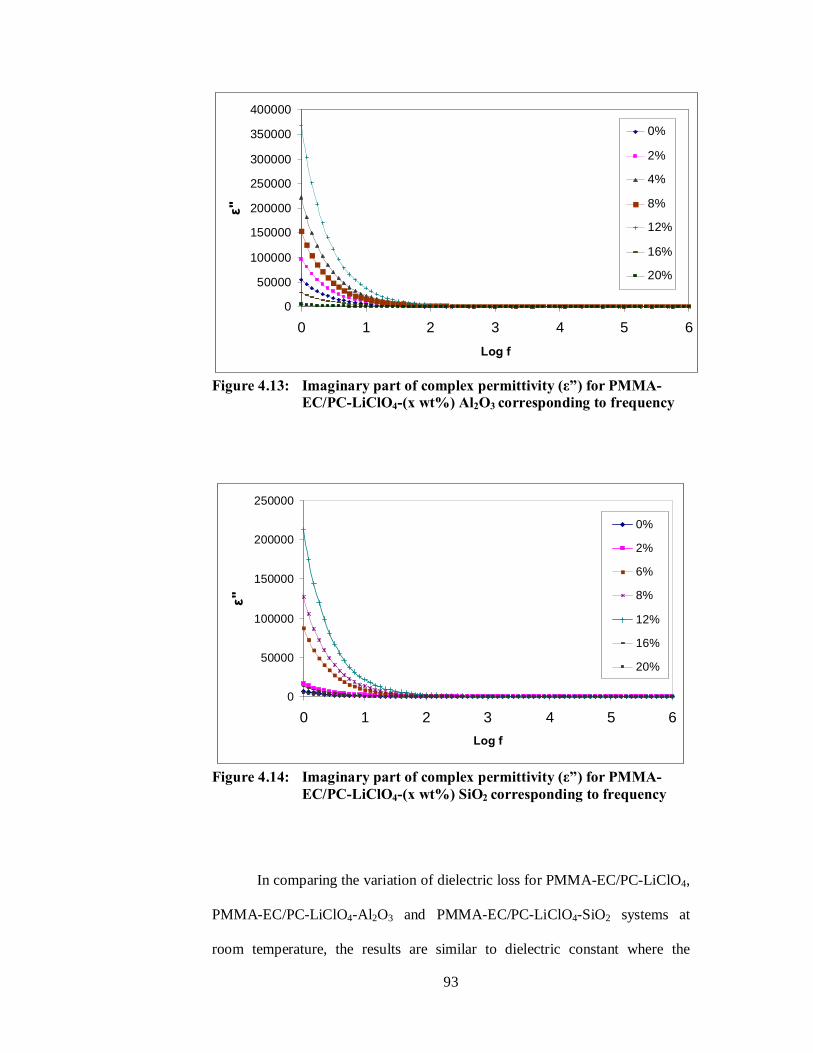
93
Figure 4.13: Imaginary part of complex permittivity (ε”) for PMMA-
EC/PC-LiClO4-(x wt%) Al2O3 corresponding to frequency
Figure 4.14: Imaginary part of complex permittivity (ε”) for PMMA-
EC/PC-LiClO4-(x wt%) SiO2 corresponding to frequency
In comparing the variation of dielectric loss for PMMA-EC/PC-LiClO4,
PMMA-EC/PC-LiClO4-Al2O3 and PMMA-EC/PC-LiClO4-SiO2 systems at
room temperature, the results are similar to dielectric constant where the
0
50000
100000
150000
200000
250000
300000
350000
400000
0 1 2 3 4 5 6Log f
ε"
0%
2%
4%
8%
12%
16%
20%
0
50000
100000
150000
200000
250000
0 1 2 3 4 5 6Log f
ε"
0%
2%
6%
8%
12%
16%
20%

94
highest of the dielectric constant exhibit higher dielectric losses. High
dielectric losses in complex films cause the ionic conductivity to increase (Jana
and Zhong, 2008). In the present study, it can be observed from Figures 4.12 to
4.14 where the dielectric loss rises sharply towards low frequency region and
the dielectric loss is decreased at higher frequencies. This mechanism is due to
the free charge motion where the free charges are building up at the electrode
and electrolyte interface (Arof, 1999). However, at the high frequency, the high
periodic reversal of the electric field at the electrode and electrolyte interface
causes no excess ion diffusion in the direction of the field (Baskaran et al.,
2004).
The addition of electrolyte materials such as LiClO4 salt, Al2O3 filler
and SiO2 filler into PMMA-EC/PC system results in the overall increase of ε’
and ε” due to both dipolar and free charge contributions. Therefore, any
increases in the ionic mobility are reflected in the increase of free charge
mobility that enhanced the ionic conductivity. The results from the dielectric
studies are comparable to the ionic conductivity studies where the higher
dielectric constant and dielectric losses revealed high ions mobility which
generates a higher ionic conductivity.

95
4.1.3.2 Dielectric Relaxation Studies on Polymer Electrolytes in the Temperature Range of 298 K to 373 K
The variation of permittivity (ε’) with respect to frequency for PMMA-
EC/PC- 25 wt% of LiClO4, PMMA-EC/PC-LiClO4- 12 wt% of Al2O3 and
PMMA-EC/PC-LiClO4- 12 wt% of SiO2 at different temperatures are depicted
in Figures 4.15 to 4.17. From the figures, the value of dielectric constant (ε’)
increases when increasing the temperature. This contributes to the higher
carrier density whereby the ionic conductivity is increased (Othman et al.,
2007). At higher temperature, the dipoles can orient easily compared to a
highly cross-linked material (Jana and Zhong, 2008).
The higher values of dielectric constant at higher temperature can be
attributed to the dissociation of ion aggregates and higher degree of salt
dissociation. The crystallinity of the polymer electrolyte is reduced with an
increase in the temperature. This in turn influences the polymer dynamics and
the dielectric behaviour (Awadhia et al., 2006). From the figures, it can be
observed that at low frequencies the dielectric constant is high. This is due to
the accumulation of the charge carriers at electrode-electrolyte interface.
However, the dielectric constant is decreased at higher frequency which
attributes to the high reversal of the applied field. The polarisation of the
charge accumulation decreases leading to a decrease in the dielectric constant

96
(Ramya et al., 2008). The decrease in dielectric constant with increasing
frequency can be associated to the inability of dipoles to rotate rapidly in the
direction of the applied electric field (Nada et al., 2004). Hence, the
polarisation due to charge accumulation decreases at the electrode-electrolyte
interface and thus a decrease in dielectric constant.
Figure 4.15: Real part of complex permittivity (ε’) for PMMA-EC/PC- 25
wt% of LiClO4 corresponding to frequency in the temperature range of 298-373K
0
5000
10000
15000
20000
25000
30000
35000
40000
0 1 2 3 4 5 6
Log f
ε'
298 K313K323K333K343K353K363K373K
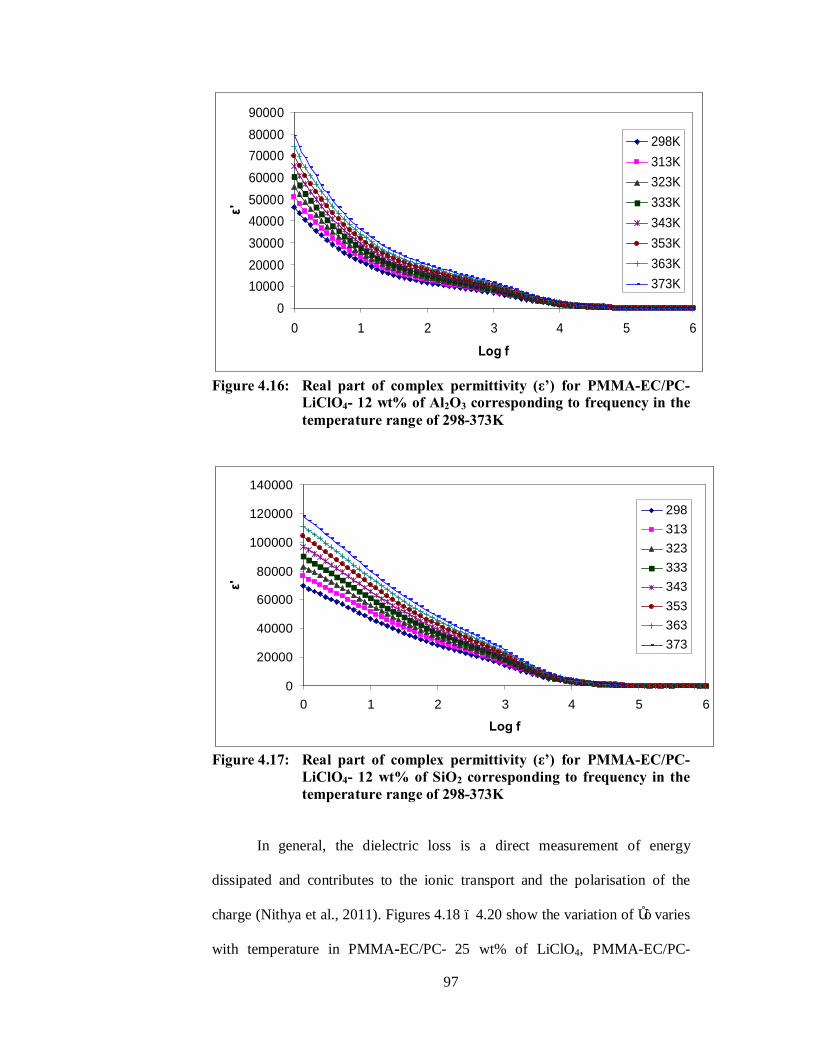
97
Figure 4.16: Real part of complex permittivity (ε’) for PMMA-EC/PC-
LiClO4- 12 wt% of Al2O3 corresponding to frequency in the temperature range of 298-373K
Figure 4.17: Real part of complex permittivity (ε’) for PMMA-EC/PC-
LiClO4- 12 wt% of SiO2 corresponding to frequency in the temperature range of 298-373K
In general, the dielectric loss is a direct measurement of energy
dissipated and contributes to the ionic transport and the polarisation of the
charge (Nithya et al., 2011). Figures 4.18 – 4.20 show the variation of ε” varies
with temperature in PMMA-EC/PC- 25 wt% of LiClO4, PMMA-EC/PC-
0100002000030000400005000060000700008000090000
0 1 2 3 4 5 6
Log f
ε'
298K313K323K333K343K353K363K373K
0
20000
40000
60000
80000
100000
120000
140000
0 1 2 3 4 5 6
Log f
ε'
298313323333343353363373
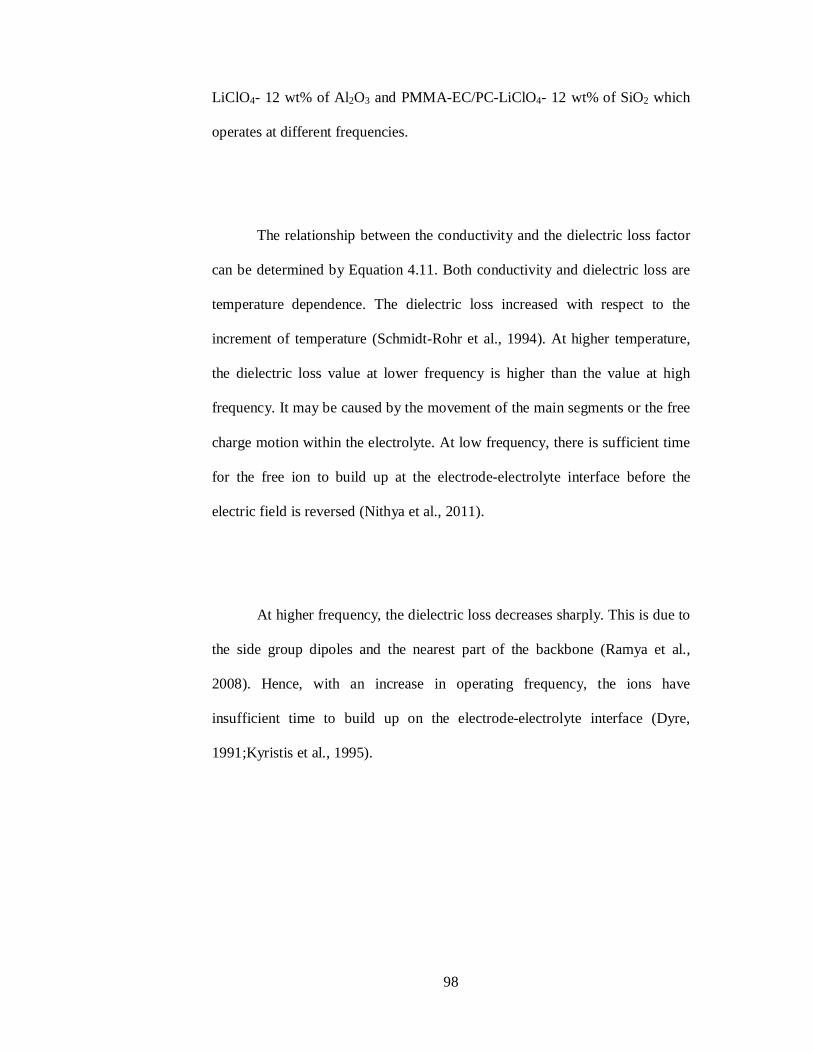
98
LiClO4- 12 wt% of Al2O3 and PMMA-EC/PC-LiClO4- 12 wt% of SiO2 which
operates at different frequencies.
The relationship between the conductivity and the dielectric loss factor
can be determined by Equation 4.11. Both conductivity and dielectric loss are
temperature dependence. The dielectric loss increased with respect to the
increment of temperature (Schmidt-Rohr et al., 1994). At higher temperature,
the dielectric loss value at lower frequency is higher than the value at high
frequency. It may be caused by the movement of the main segments or the free
charge motion within the electrolyte. At low frequency, there is sufficient time
for the free ion to build up at the electrode-electrolyte interface before the
electric field is reversed (Nithya et al., 2011).
At higher frequency, the dielectric loss decreases sharply. This is due to
the side group dipoles and the nearest part of the backbone (Ramya et al.,
2008). Hence, with an increase in operating frequency, the ions have
insufficient time to build up on the electrode-electrolyte interface (Dyre,
1991;Kyristis et al., 1995).

99
Figure 4.18: Imaginary part of complex permittivity (ε”) for PMMA-
EC/PC- 25 wt% of LiClO4 corresponding to frequency in the temperature range of 298-373K
Figure 4.19: Imaginary part of complex permittivity (ε”) for PMMA-
EC/PC-LiClO4- 12 wt% of Al2O3 corresponding to frequency in the temperature range of 298-373K
050000
100000
150000200000250000300000
350000400000450000
0 1 2 3 4 5 6
Log f
ε"
298K313K323K333K343K353K363K373K
0
500000
1000000
1500000
2000000
2500000
3000000
3500000
4000000
0 1 2 3 4 5 6
Log f
ε"
298K313K323K333K343K353K363K373K

100
Figure 4.20: Imaginary part of complex permittivity (ε”) for PMMA-
EC/PC-LiClO4- 12 wt% of SiO2 corresponding to frequency in the temperature range of 298-373K
4.2 X-ray Diffraction (XRD) Studies
In order to investigate the effects of EC/PC plasticizer mixture, LiClO4
lithium salt, Al2O3 alumina filler and SiO2 fumed silica filler in PMMA host
polymer, XRD studies were carried out. The information about the crystalline
nature and the structure changes of the solid materials were revealed through
XRD patterns.
0200000400000600000800000
100000012000001400000160000018000002000000
0 1 2 3 4 5 6
Log f
ε"
298313323333343353363373

101
The spacing between layers of atom (d-spacing) is obtained according to
Equation 4.12.
n λ = 2 d sin θ ( 4.12)
where n = integer
λ = wavelength of X-ray
θ = incident angle of the X-ray to the sample surface
4.2.1 PMMA-EC/PC Samples XRD result
Figure 4.21 illustrates the XRD diffractograms of pure PMMA and
PMMA-EC/PC up to 35 wt% of EC/PC mixtures added into PMMA. Table 4.2
shows the intensity obtained at diffraction peaks with respect to the PMMA-
EC/PC system. The broad characteristic peaks of pure PMMA can be observed
in the Figure 4.21 (a), where the broad peaks are obtained at angles of 2θ
=13.28˚ and 29˚.
By adding 5 wt% of EC/PC into PMMA, the broad peaks obtained from
pure PMMA are shifted to 2θ angle of 16.3˚ and 30˚ with weaker intensities.

102
The shift of the peaks and the change of the intensities revealed the
complexation of PMMA with EC/PC.
Figure 4.21: XRD patterns of (a) pure PMMA, (b) 5 wt% EC/PC, (c) 10 wt% EC/PC, (d) 15 wt% EC/PC, (e) 20 wt% EC/PC, (f) 25 wt% EC/PC, (g) 30 wt% EC/PC, (h) 35 wt% EC/PC added into PMMA
Table 4.2: Intensity peak obtained at diffractionPeaks for samples (1-x) PMMA – (x) EC/PC
x
0 wt%
5 wt%
10 wt%
15 wt%
20 wt%
25 wt%
30 wt%
35 wt%
Intensity at diffraction peaks
13.28˚ 1150 - - - - - - - 16.30˚ - 1100 975 960 960 960 960 850 23.00˚ - 760 700 640 620 640 595 515 29.00˚ 400 - - - - - - - 30.00˚ - 310 310 310 300 305 290 270 38.45˚ - 600 715 740 670 640 635 760 44.70˚ - 640 610 620 595 610 595 655
With the addition of EC/PC mixture into pure PMMS, the formation of
shoulder peak are found at 2θ angle of 23˚ and this shoulder peak is shifted to
lower the 2θ angle as the amount of EC/PC mixture increases with the addition
10 20 30 40 50 60
(h)
(g)
(f)
(e)
(d)
(c)
(b)
(a)
2θ (degree)
Inte
nsity
(a.u
. uni
t)

103
of EC/PC mixture, new intense peaks are observed at 2θ angle of 38.45˚ and
44.7˚. This may be attributed to the EC/PC plasticised effect which softens and
interacts with polymer backbone. Apparently, the polymer thin films became
more flexible and the ionic conductivity is increased proportionally with the
increment of EC/PC concentration.
The broader of 2θ peak and occurrence of new shoulder peak reveal
that the amorphous nature of the film increases as a function of plasticisers
concentration (Ragavendran et al., 2004). The changes of the intensities of the
broad characteristic peak, shoulder peak and intense peaks give strong
evidence that EC/PC mixture added into polymer matrices interact with the
PMMA backbone and enhanced the amorphous nature of the plasticised
polymer. The increase in the amorphous nature of plasticiser polymer causes a
reduction in the energy barrier for the segmental motion in polymer electrolyte
(Rajendran and Prabhu, 2010). Therefore, higher ionic conductivity could be
obtained at higher amorphous nature of polymer. From Section 4.1.2, it gives a
similar result to support the evidence which increases the amount of plasticiser
thus give rise in the ionic conductivity. However, a further increase of EC/PC
mixture into the PMMA host polymer altered the mechanical properties which
changed a rigid and solid polymer to a more gel-liked mixture.
Figure 4.21 (g) and (h), show the changes of the broad peak and
shoulder peak, where the shoulder peak tend to combine with the broad peak.

104
This is a clear evidence to show that the solid polymer electrolyte has behaved
like a gelled electrolyte when added with EC/PC mixture beyond 30 wt%. The
gelled type polymer electrolyte will give a better ionic conductivity due to the
greater amorphous region in the polymer complex (Mahendran et al., 2005). In
the present studies, the concern on the mechanical properties, mechanical
integrity in between electrodes and practical application of polymer electrolyte
are important factors with an objective to produce a solid type of polymer
electrolyte. Therefore, the EC/PC content is fixed at 30 wt% to avoid the
production of gelled type polymer electrolyte.
4.2.2 PMMA-EC/PC-LiClO4Samples XRD result
As illustrated in Figure 4.22 the sharp intense peaks obtained for
LiClO4 lithium salt at 2θ =18.4˚, 23.18˚, 27.66˚, 33˚ and 36.42˚ represent the
crystalline character of LiClO4. Table 4.3 shows the intensity obtained at
diffraction peaks for PMMA-EC/PC-LiClO4 system. It is clearly illustrated in
Figure 4.22 where most of the peak corresponding to lithium salt has
disappeared in the plasticised PMMA polymer electrolyte, which reveals the
complete dissolution of the lithium salt in the polymer matrix.
The diffraction pattern as shown in Figure 4.22 clearly indicates that the
crystallinity in PMMA-EC/PC system is further disturbed by the addition of
LiClO4. It is revealed that the PMMA polymer has undergone significant

105
structural reorganisation while adding the plasticiser and lithium salt. The
plasticised effect may induce significant interaction with LiClO4 within the
polymer matrix. The interaction between the PMMA, plasticiser and lithium
salt contributes a much lower crystallinity and enhances the structural
disorderliness.
Figure 4.22: XRD patterns of (a) pure PMMA, (b) pure LiClO4, (c) 0
wt% LiClO4, (d) 5 wt% LiClO4, (e) 15 wt% LiClO4, (f) 25 wt% LiClO4, (g) 35 wt% LiClO4, (h) 50 wt% LiClO4 doped into PMMA-EC/PC system
10 20 30 40 50 60
(h)
(g)
(f)
(e)
(d)
(c)
(b)
(a)
2θ (degree)
Inte
nsity
(a.u
. uni
t)

106
Table 4.3: Intensity peak obtained at diffraction peaks for (1-x)PMMA-EC/PC- (x) LiClO4 system
X
0 wt% 5 wt% 15 wt% 25 wt% 35 wt% 50 wt%
Intensity at
diffraction peaks
13.55˚ - - - - - 345 16.30˚ 960 750 570 510 360 75 21.30˚ - - - - - 440 23.00˚ 595 560 470 - 320 700 23.30˚ - - - - - 1240 26.92˚ - - - - - 150 30.00˚ 290 310 270 270 180 300 35.78˚ - - - - - 650 38.45˚ 635 500 700 350 760 340 39.50˚ - - - - - 240 44.70˚ 595 470 590 320 640 240 52.30˚ - - - - - 260 55.23˚ - - - - - 180 57.90˚ - - - - - 125
With reference to Figure 4.21 (PMMA-EC/PC system), the intense
peak at 38.45˚ and 44.70˚ appearedwith the addition of EC/PC. Therefore,
similar peaks found in the following sample might refer to the crystalline
character of EC/PC. However, the pure LiClO4 shows the similar intense peak
at 2θ degree, which might be due to the LiClO4 and EC/PC having the common
functional group (oxide group). The result shows that the maximum matching
of the LiClO4 with PMMA-EC/PC while the optimum weight percentage (25
wt/%) shows a smaller peak. However the intense peak increases with respect
to a higher concentration of LiClO4.
By comparing the diffraction patterns in Figure 4.22 (c) and (f), it is
found that the intensity of the broad characteristic peak of PMMA is reduced
and the shoulder peak is brought to a lower level and tends to disappear.

107
Eventually, the shoulder peak vanished at 25 wt% of LiClO4 and the PMMA
broad peak becomes broader. The decrease in the intensities is caused by the
increase of the amorphous region which leads to higher ionic conductivity
(Ganesan et al., 2008). The intensities of sharp intense peaks observed at 2θ
=38.45˚ and 44.7˚. This implies that there is an interaction between lithium salt
with the plasticisers as well as the host polymer. This shows that the EC/PC
mixture provides the additional transit site in the polymeric matrix for ionic
transportation. Therefore, the enhanced dissolvability of the LiClO4 is greater.
The inducing of the amorphous region within the polymeric complexes can be
described as the structural disorderliness that is attributed to the re-arrangement
of the molecules and ions in the polymeric matrices. For the addition of LiClO4
up to 25 wt% into PMMA-EC/PC system results to a gradually decrease in
overall intensities of the shoulder peak and sharp peak as well as consistent
broadening of PMMA peak. The higher degree of amorphous polymer matrix
contributes to more disorder arrangement of polymeric chain and thus increases
flexibility of polymer matrix.
However, beyond the saturation level (25 wt% of LiClO4), the shoulder
peak at 2θ=23˚ has reappeared (it is observed at 35 wt% of LiClO4 added into
plasticized PMMA). This has clearly shown that optimum concentration limits
for salt dissolution into the plasticiser PMMA matrix (Shukla and Thakur,
2009). The significant increase of the intensities show the increase of the
crystallinity in the polymer complex. Upon the addition of 50 wt% into the
PMMA-EC/PC polymer matrix, the polymer-salt phase separation has been

108
observed. Due to the insoluble lithium salt, the broad peak of PMMA has
disappeared and the diffraction pattern is similar to pure LiClO4 which can be
contrasted from Figure 4.22 (b) and (h). As discussed in EIS, due to the
increment of the crystallinity of polymer electrolyte, the energy barrier for
ionic transport is increased hence the ionic conductivity is decreased.
4.2.3 PMMA-EC/PC-LiClO4-Al2O3Samples XRD result
The changes in the diffraction pattern and intensity of diffraction peaks
for PMMA-EC/PC-LiClO4-Al2O3 systems are illustrated in Figure 4.23 and
Table 4.4, respectively. As seen from the figures, the dispersion of alumina
filler (Al2O3) is significantly changing the diffraction pattern of all system. The
changes of diffraction pattern reveals the interaction between polymer with
nano-sized filler as well as plasticiser and lithium salt. The 2θ angles at 25.56˚,
37˚, 43˚, 52.54˚, 57˚ represent the sharp intense peaks of pure alumina filler as
shown in figure 4.23 (b).

109
Figure 4.23: XRD patterns of (a) pure PMMA, (b) pure Al2O3, (c) 0 wt%
Al2O3, (d) 4 wt% Al2O3, (e) 8 wt% Al2O3, (f) 12 wt% Al2O3, (g) 16 wt% Al2O3, (h) 20 wt% Al2O3, dispersed into PMMA-EC/PC-LiClO4 system
Table 4.4: Intensity peak obtained at diffraction peaks for (1-x)PMMA-
EC/PC-LiClO4- (x)Al2O3system
x
0 wt% 4 wt% 8 wt% 12 wt% 16 wt% 20 wt%
Intensity at
diffraction peaks
16.30˚ 510 300 310 270 250 340 23.00˚ - 340 310 200 210 295 25.7˚ - 330 410 310 370 580
30.00˚ 270 200 180 130 150 190 35.3˚ - 320 400 360 500 720
38.45˚ 350 400 525 285 280 320 43.50˚ - 270 390 350 450 620 44.70˚ 320 340 450 270 250 320 52.70˚ - 125 175 160 210 265 57.70˚ - 165 240 270 330 470
From Figure 4.23, it clearly shows that the interaction between Al2O3
with PMMA, EC/PC and LiClO4. When 4 wt% of alumina filler was integrated
into the polymer electrolyte, and the intensity of broad peak of PMMA is
decreased. This shows that the filler is eventually interacted with polymeric
10 20 30 40 50 60
(h)
(g)
(f)
(e)
(d)
(c)
(b)
(a)
2θ (degree)
Inte
nsity
(a.u
. uni
t)

110
matrix whereby the formations of new peaks appeared in the diffraction pattern
when Al2O3 filler is dispersed. The change in the diffraction pattern infer that
the nature of Al2O3 filler. From the observation, the intensity of the intense
peak of characteristic Al2O3 filler decreases with increasing concentration of
Al2O3. Moreover, with the dispersion of 12 wt % alumina filler, the broad peak
is broadened and intensity is decreased. As a result, the broadened peak
decreased in the intensity of the peaks which reveal the decreasing in
crystallinity (Saikia et al., 2008). Higher amorphous degree of polymer matrix
attributes to more disorder arrangement of polymeric chain and increases the
flexibility of polymer matrix. The formation of three-dimensional networks for
ionic transportation, the mobility of ions is enhanced hence the ionic
conductivity is increased (Ahmad et al., 2006). As a result, the ionic
conductivity with 12 wt % Al2O3 dispersion exhibits the highest conductivity
value.
However, a further increase in the concentration of the Al2O3 filler into
the PMMA-EC/PC-LiClO4 complex causes the interaction within the Al2O3
filler to be stronger. As shown in the Figure 4.23 (g) and (h), the intense peak
of Al2O3 filler is increased toward an increment of concentration of alumina
filler. From the EIS characterisation, the ionic conductivity is dropped beyond
12 wt% of Al2O3 filler dispersed into polymer matrix. This may be due to the
strong interaction in between the Al2O3 filler to produce the ion pairs,
aggregates and ion clusters causing the blocking effect in the polymer
electrolyte. As the three-dimensional networksis created at a low concentration

111
of Al2O3 filler, a higher concentration of Al2O3 might cause the conduction
path to be more viscous and decrease in ionic mobility. In fact, the crystallinity
of this composite solid polymer electrolyte system is increased with the
dispersion of Al2O3 beyond the saturation level (12 wt% of Al2O3 filler). As the
ionic conduction is generally conducted in an amorphous region, the decrease
in amorphous region in polymeric matrix revealed the decrease in the ionic
conductivity.
4.2.4 PMMA-EC/PC-LiClO4-SiO2Samples XRD result
Figure 4.24 (b) depicts the diffraction pattern and crystalline nature of
pure fumed silica filler (SiO2). The dispersion of this type of ceramic fillers
into the polymer matrix does have some interactions with the polymer chain
and polymer backbone. It is clearly indicated in Figure 4.24 and Table 4.4 the
overall changes in the diffraction pattern and intensity for PMMA-EC/PC-
LiClO4-SiO2 system.

112
Figure 4.24: XRD patterns of (a) pure PMMA, (b) pure SiO2, (c) 0
wt%SiO2, (d) 4 wt% SiO2, (e) 8 wt% SiO2, (f) 12 wt% SiO2, (g) 16 wt% SiO2, (h) 20 wt% SiO2 dispersed into PMMA-EC/PC-LiClO4 system
Table 4.5: Intensity obtained at diffraction peaks for (1-x)PMMA-EC/PC-LiClO4- (x)SiO2system
x
0 wt% 4 wt% 8 wt% 12 wt% 16 wt% 20 wt%
Intensity at
diffraction peaks
16.30˚ 510 310 370 310 320 310 23.00˚ - 350 330 - 350 290 30.00˚ 270 180 200 170 160 170 38.45˚ 350 640 530 250 345 580 44.70˚ 320 550 480 250 360 480
Apparently, the shoulder peak has disappeared and caused the broad
peak of polymer to become wider or broader in the peak area upon addition of
the SiO2 filler. The intensities of the sharp peak are brought to a lower level.
This is an indication of reduction in the degree of crystallinity. The formation
of three-dimensional network among aggregates contributes to the distortion of
the arrangement (amorphous) of polymer matrix. In general, the polymer
10 20 30 40 50 60
(h)
(g)
(f)
(e)
(d)
(c)
(b)
(a)
2θ (degree)
Inte
nsity
(a.u
. uni
t)

113
segmental motion and flexibility of polymer backbone is improved due to the
enhancement in the amorphous phase. From these effects, the ion diffusivity
eventually improved with a higher ionic conductivity. From the figure, no new
peak appears in all diffraction patterns. This inferred that the SiO2filler may be
a better ceramic filler candidate compared to Al2O3 filler. This result is well
metered with EIS studies where the ionic conductivity for the sample dispersed
with SiO2filler is slightly higher than the sample added Al2O3 filler.
As a higher concentration of SiO2filler is being dispersed into the
polymer electrolyte, the shoulder peak re-appears and the intensities for sharp
peaks are increased due to the reduction of amorphous region and formation of
SiO2 clusters (Pandey et al., 2008). Consequently, the reduction in the
amorphous region might cause the conduction path to become more viscous
and block the motion in polymeric matrices. Therefore the ionic conductivity is
dropped.
4.2.5 Summary of XRD characterisation
The overall variation of the diffraction pattern of highest polymer
electrolyte sample in particular electrolyte system is illustrated in Figure 4.25.
The diffraction pattern of pure PMMA is disturbed by the addition of 30 wt%
of EC/PC mixture. The reduction of intensity in the broad peak and a slight

114
shift of the PMMA peak as well as the existence of new shoulder and sharps
peak. This is the evidence to show that the EC/PC plasticiser is interacted with
PMMA backbone.
Figure 4.25: XRD patterns of (a) pure PMMA, (b) pure LiClO4, (c) pure
Al2O3, (d) pure SiO2, (e) PMMA (70):EC/PC (30), (f) PMMA-EC/PC (75): LiClO4 (25), (g) PMMA-EC/PC- LiClO4 (88): Al2O3 (12), (h) PMMA-EC/PC- LiClO4 (88): SiO2 (12)
With the addition of 25 wt% of LiClO4 salt into PMMA-EC/PC system,
significant changes of diffraction pattern are observed as shown in Figure 4.25
(f). The broad characteristic peak of PMMA is broadened upon the addition of
LiClO4. Besides that, the intensities of sharp peaks are reduced. This effect
inferred to the solubility (high dielectric constant) of EC/PC mixture which is
dissolved and interacts with LiClO4. The reduction in the intensities gives the
evidence that the crystallinity of polymer matrix is further decreased hence
10 20 30 40 50 60
(h)
(g)
(f)
(e)
(d)
(c)
(b)
(a)
2θ (degree)
Inte
nsity
(a.u
. uni
t)

115
leads to a higher ionic conductivity (Ganesan et al., 2008). Higher degree of
amorphous region in polymer matrix might contribute to more disorder
arrangement of polymeric chain and increases the flexibility of polymer matrix.
Therefore more solvated ions can travel along these paths and increase the
mobility. As a result, the higher conductivity is achieved due to a higher
mobility of ion transportation in the amorphous region.
Further dispersing of the ceramic filler eventually brings some effects
to the polymer electrolytes such as improving the mechanical properties as well
as enhancing the ionic conductivity. In Figure 4.25 (g) and (h), both ceramic
fillers clearly altered the diffraction pattern, the broad peak is further reduced
and the shoulder peak is vanished to broaden the broad characteristic peak of
PMMA. The intensities of the sharp peaks in the diffraction pattern are
reduced. This may be evidence to conclude that there are some structures
which are undergoing changes in the polymeric matrix, such as the formation
of three dimension network for ionic transportation (Ahmad et al., 2006). By
comparing the diffraction pattern of both ceramic filler, it can be seen that the
crystalline nature of the system with SiO2 filler is lower than Al2O3 filler
system. This infers that the new peak exhibit in the Al2O3 filler system has a
slight distinction in the crystallinity (amorphous). It may be caused by the
deficiency interaction between this ceramic filler with other electrolyte
materials. This shows that the interaction between PMMA-EC/PC-LiClO4 with
SiO2 filler is better when the amorphous region is enhanced and no significant

116
new peak is observed. Therefore, the ionic conductivity for PMMA-EC/PC-
LiClO4-SiO2 system is higher than the PMMA-EC/PC-LiClO4-Al2O3 system.
4.3 Fourier Transform Infrared (FTIR) Studies
The FTIR spectroscopy is used to analyse the structure of polymer and
the interaction between electrolyte materials and host polymer. These
interactions can induce changes in the vibration modes of the molecules in the
polymer electrolyte. The FTIR spectrum pattern may show noticeable changes
in vibrational modes which are observed in term of shifting the band position,
band width, and intensity. In the present samples, the FTIR spectrum is studied
at the range of 400-4000 cm-1.
4.3.1 FTIR for PMMA-EC/PC samples
The FTIR spectrum of pure PMMA is shown in Figure 4.26 and the
assignments of vibration modes and wavenumber are indicated in Table 4.6.
The wavenumber at 750, 1191, 1240 and 1433 cm-1 are assigned to CH2
rocking, CH2 twisting, CH3 Symmetric bending and CH3 asymmetric bending
for PMMA. The vibrational peaks at 1071, 1150, 1722 and 2951 cm-1 are

117
assigned to O-CH2 stretching, C-O-C asymmetric stretching, C=O symmetric
stretch and CH3 asymmetric stretching of PMMA.
In order to investigate the interaction of molecules between plasticiser
and host polymer, the pure plasticiser such as EC and PC is priory investigated
from FTIR. The vibration peaks for pure EC is illustrated in Figure 4.27 and
the vibrational mode and wavenumber is depicted in Table 4.7. The structure
CH2 in EC is undergoing wagging and bending at a frequency of 1392 and
1477 cm-1, respectively. The frequency of 1780 are assigned to C=O stretching
in EC. From figure 4.27, the Ring breathing and skeletal stretching for EC is
observed at 891, 967 and 1074 cm-1.
The spetrum of pure PC is illustrated in Figure 4.28 and the assigning
of vibrational mode and wavenumber is indicated in Table 4.8. The vibration
modes such as ring deformation, CH2 rocking, CH2 wagging and C=O
stretching are found in the frequency at 711 and 776, 954 and 1222, 848, and
1790, respectively. The observed peaks for pure PMMA, EC and PC were
comparable with the wavenumber found by other researchers as shown in
Table 4.6 – 4.8.

118
Figure 4.26: FTIR spectrum for pure PMMA
Table 4.6: Vibration modes and wavenumber of pure PMMA
No. Vibration mode Wavenumber (cm-1) Reference Wavenumber
obtained (cm-1)
1 CH2 rocking 750 Rajendran and Mahendran, 2001 751
2 O-CH2 stretching 1070
Mahendran et al., 2005 ; Mahendran
and Rajendran, 2003 1071
3 C-O-C
asymmetric stretching
1151 Deka and Kumar,2010 1150
4 O-CH3 stretching 1191 Ramesh et al., 2007 1191
5 C-O stretching 1235 RajendranmMahend
ran and Kannan (2002)
1238
6 CH3
asymmetric bending
1452 Tan et al., 2007 1433
7 C=O stretching 1725 Deka and Kumar,2010 1722
8 CH3
asymmetric stretching
2954 Rajendran et al., 2003 2951
4000.0 3600 3200 2800 2400 2000 1800 1600 1400 1200 1000 800 600 400.0-10.0
-50
510 15 20 25
30 35 40 45 50 55 60 65 70 75 80
85.0
Wavenumber(cm-1)
% T
rans
mitt
ance
(T)
1
2
34
5
67
8

119
Figure 4.27: FTIR spectrum for pure EC
Table 4.7: Vibration modes and wavenumber of pure EC
No. Vibration mode Wavenumber (cm-1) Reference Wavenumber
obtained (cm-1)
1 Ring breathing 890 Wang et al., 1996 891
2 Skeletal Stretching 970, 1076 Angell, 1956 967, 1074
3 CH2 wagging 1394 Wang et al., 1996 1392
4 CH2 bending 1480 Angell, 1956 1477
5 C=O stretching 1778 Fini and Mirone, 1973 1780
4000.1 3600 3200 2800 2400 2000 1800 1600 1400 1200 1000 800 650.072.0
7476
7880
82
84
868890
92
9496
98
100
102104106
108108.8
%
Tran
sWav
enum
bers
(c
Wavenumber(cm-1)
1
2
2
34
5
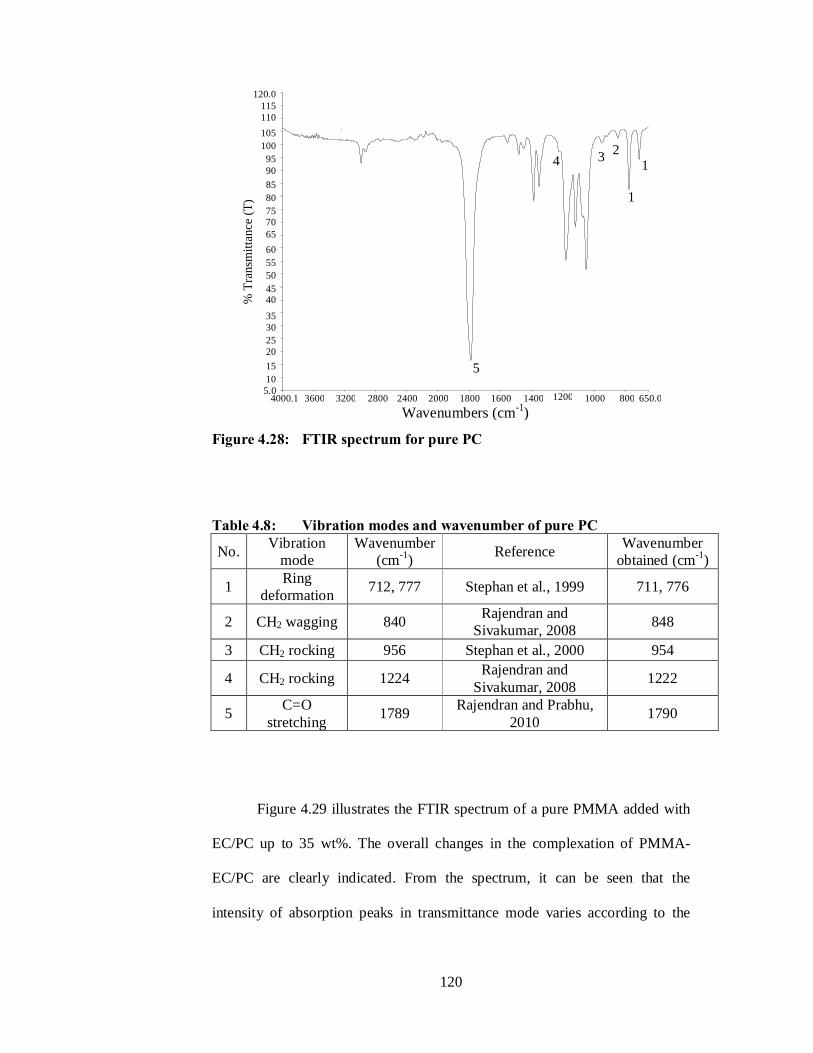
120
Figure 4.28: FTIR spectrum for pure PC
Table 4.8: Vibration modes and wavenumber of pure PC
No. Vibration mode
Wavenumber (cm-1) Reference Wavenumber
obtained (cm-1)
1 Ring deformation 712, 777 Stephan et al., 1999 711, 776
2 CH2 wagging 840 Rajendran and Sivakumar, 2008 848
3 CH2 rocking 956 Stephan et al., 2000 954
4 CH2 rocking 1224 Rajendran and Sivakumar, 2008 1222
5 C=O stretching 1789 Rajendran and Prabhu,
2010 1790
Figure 4.29 illustrates the FTIR spectrum of a pure PMMA added with
EC/PC up to 35 wt%. The overall changes in the complexation of PMMA-
EC/PC are clearly indicated. From the spectrum, it can be seen that the
intensity of absorption peaks in transmittance mode varies according to the
4000.1 3600 3200 2800 2400 2000 1800 1600 1400 1200 1000 800 650.05.010 15 20 25 30 35
40 45 50 55 60 65 70 75 80 85 90 95
100 105 110 115
120.0
Wavenumbers (cm-1)
% T
rans
mitt
ance
(T)
1
1
234
5

121
weight percentage of EC/PC mixture added into the pure PMMA host polymer.
Besides, some disappearance of absorption peak can also be observed.
Figure 4.29: FTIR spectrum for a) pure PMMA, b) pure EC, c) pure PC, d) 5wt%, e) 10 wt%, f) 15 wt%, g) 20wt%, h) 25 wt%, i) 30 wt%, j) 35 wt%, of EC/PC added into PMMA
From the observation, there are some disappearances of absorption
peaks located at 1150, 1191, 1238, and 1433 cm-1 which were assigned to C-O-
C asymmetric stretching, O-CH3 stretching,C-O stretching and asymmetric
bending, respectively with 30 wt% of EC/PC mixture in PMMA. The
disappearance of absorption peaks which can be observed from Figure 4.30
indicates the formation of complexation between PMMA and EC/PC mixture.
The PMMA sample added with 30 wt% of EC/PC, O-CH2 stretching obtained
4000 3600 3200 2800 2400 2000 1800 1600 1400 1200 1000 800 600 400
(b)
(c)
(d)
(e)
(f)
(g)
(h)
(a)
(i)
(j)
Wavenumbers (cm-1)
% T
rans
mitt
ance
(%T)

122
at the 1071 cm-1 are shifted to 1086 cm-1. Figure 4.31 depicts the shift of the
CH2 rocking from 751 to 745 cm-1 as 30 wt% of EC/PC was added into
PMMA. As observed in Figure 4.32, the absorption peak at 1722 cm-1 is
broaden and shifted to 1805 cm-1 which is referred to the addition of 30 wt% of
plasticiser. This shift can be observed in the reliable carbonyl (C=O) stretching
frequency of the complexes as compared to pure PMMA which indicates the
formation of complex (Mahendran et al., 2005).
Figure 4.30: FTIR spectrum for pure PMMA and PMMA- 30wt% EC/PC in the range of 1000-1550cm-1
95010001050 110011501200 125013001350 140014501500 1550
PMMAPMMA- 30 wt% EC/PC
% T
rans
mitt
ance
(%T)
Wavenumbers (cm-1)

123
Figure 4.31: FTIR spectrum for pure PMMA and PMMA- 30wt% EC/PC in the range of 700-930 cm-1
Figure 4.32: FTIR spectrum for pure PMMA and PMMA- 30wt% EC/PC in the range of 1550-1900 cm-1
1550 16001650 17001750 180018501900
PMMA
PMMA- 30 wt% EC/PC
% T
rans
mitt
ance
(%T)
Wavenumbers (cm-1)
700720740760780800820840860880900920
% T
rans
mitt
ance
(%T)
Wavenumbers (cm-1)
PMMA
PMMA- 30 wt% EC/PC

124
As noticed in Figure 4.29, the intensity of the absorption peak is
reduced when in transmittance mode. This may infer that a favourable
interaction has happened between PMMA and EC/PC. From the investigation,
some of this absorption peaks have re-appeared in the complexation where 35
wt% of EC/PC are added into PMMA. This inferred that the polymer is
changed from solid types to gelled types. The overall intensity of FTIR
spectrum in the range of 400-1100cm-1 is decreased when the concentration of
EC/PC mixture is increased up to 30 wt%. But the intensity of the peaks in
400-1100 cm-1 is increased again when 35 wt% of EC/PC is added into the host
polymer. This may be evidence to show that the characteristic of solid polymer
becomes gelled. Based on the changes in shift, changes in intensity and
disappearance of the characteristic peaks, it can be concluded that there is a
complexation between PMMA and the EC/PC mixture in PMMA-EC/PC
system. The appearance of the new peak and changes of intensity concluded
that an addition of 35 wt% EC/PC into the host polymer can alter the
characteristic of solid polymer and behave like a gelled polymer. The
information obtained is similar and comparable with the results of XRD.
4.3.2 FTIR for PMMA-EC/PC-LiClO4samples
Figure 4.33 shows the FTIR spectrum of the pure LiClO4 salt and Table
4.9 depicts its assignments of important bands. The vibration modes such as

125
ClO4- anti-symmetric stretching and Pure LiClO4 vibration mode are found at a
vibration frequency of 1095 and 1635 cm-1.
Figure 4.33: FTIR spectrum for pure LiClO4
Table 4.9: Vibration modes and wavenumber of pure LiClO4
No. Vibration mode
Wavenumber (cm-1) Reference Wavenumber
obtained (cm-1)
1 ClO4
-
antisymmetric stretching
1092 Mahendran et al., 2005 1095
2 Pure LiClO4 vibration mode 1630 Rajendran et al.,
2002 1635
From Figure 4.34, it can be seen that the integration of LiClO4 lithium
salt into PMMA-EC/PC system have changed all the FTIR spectrum pattern of
sample deposited with LiClO4. With the addition of 15 wt% of LiClO4, there is
4000.1 3600 3200 2800 2400 2000 1800 1600 1400 1200 1000 800 649.960.0
62 64 66 68 70 72 74 76 78 80 82 84 86 88 90 92 94 96 98
100 102 104 106 108
110.0
Wavenumbers (cm-1)
% T
rans
mitt
ance
(T)
1
2

126
no significant absorption peak which can be observed between 400-600 cm-1.
The absorption peaks between 3400-3700 cm-1 have disappeared and are
broaden. It can be inferred the formation of complexation between PMMA-
EC/PC with LiClO4. The vibration mode of the sample exhibits the highest
conductivity value (25 wt% LiClO4) is shown in Figure 4.34 (h))
Figure 4.34: FTIR spectrum for a) pure PMMA, b) pure LiClO4, c)
0wt%, d) 5wt%, e) 10 wt%. f) 15 wt%. g) 20wt%,h) 25 wt%. i) 30 wt%. j) 35 wt%. k) 40wt%. l) 45wt%. m) 50 wt% of LiClO4 doped into PMMA-EC/PC system
The stretching mode for ClO4- for pure LiClO4 vibration mode obtained
at 628 cm-1 is shifted to 629 cm-1 (Deka and Kumar, 2010). The addition of
lithium salt after the saturation level have caused the band to disappear. This
provides evidence for the formation of ion pairs, ion aggregates and ion
4000 3600 3200 2800 2400 2000 1800 1600 1400 1200 1000 800 600 400
(b)
(c) (d)
(e) (f)
(g)
(h) (i) (j) (k)
(a)
(l) (m)
% T
rans
mitt
ance
(%T)
Wavenumbers (cm-1)

127
clusters. The ClO4- anti-symmetric stretching observed at 1095 cm-1 has
disappeared due to the complete dissolution of lithium salt into the polymer
electrolyte system. This may be caused by the interaction of ClO4- anion with
polar group on PMMA backbone (O-CH2 molecules at 1070 cm-1). A new
absorption peak at the vibration frequency of 1386 cm-1 might refer to the
interaction between lithium salt with EC and PC whereas, the polar group in
PC providing additional free volume and transit site for Li+ ion. Besides, the
frequency of 2988 cm-1 might refer to the interaction of PMMA backbone. As
seen in Figure 4.35, the formation of doublet peak is observed at 751 and 778
cm-1. These frequencies might refer to the ring deformation for EC/PC mixture
where the ionic association is stronger through the redistribution of charge
accompanying the formation of ionic pairs and aggregations (Stephan et al.,
1999).
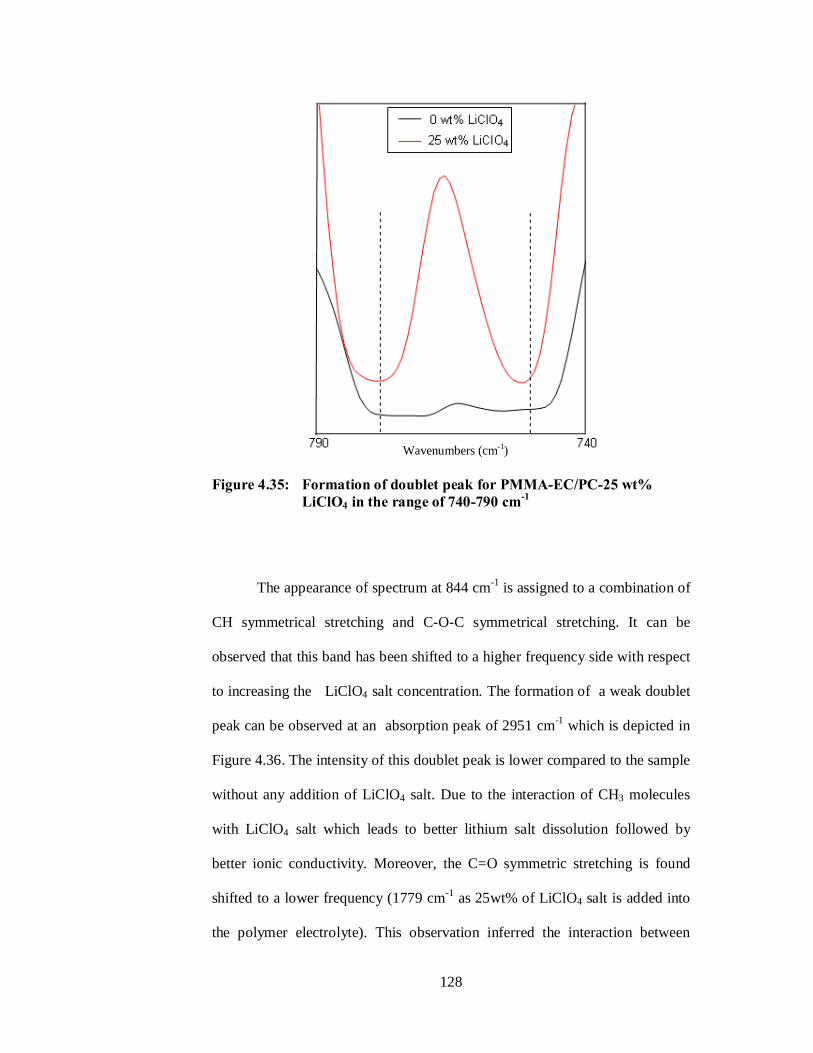
128
Figure 4.35: Formation of doublet peak for PMMA-EC/PC-25 wt% LiClO4 in the range of 740-790 cm-1
The appearance of spectrum at 844 cm-1 is assigned to a combination of
CH symmetrical stretching and C-O-C symmetrical stretching. It can be
observed that this band has been shifted to a higher frequency side with respect
to increasing the LiClO4 salt concentration. The formation of a weak doublet
peak can be observed at an absorption peak of 2951 cm-1 which is depicted in
Figure 4.36. The intensity of this doublet peak is lower compared to the sample
without any addition of LiClO4 salt. Due to the interaction of CH3 molecules
with LiClO4 salt which leads to better lithium salt dissolution followed by
better ionic conductivity. Moreover, the C=O symmetric stretching is found
shifted to a lower frequency (1779 cm-1 as 25wt% of LiClO4 salt is added into
the polymer electrolyte). This observation inferred the interaction between
Wavenumbers (cm-1)

129
lithium salt with PMMA and EC/PC, the Li+ may break the covalent bonding
and attach to oxide ion (O2-). The overall intensity of the absorption peaks is
decreased with respect to the increment of LiClO4 salt up to 25 wt%. Beyond
this saturation point, the overall intensity of the absorption peaks is increased
again after this saturation level. The increases in the intensity can be explained
by the ClO4- ions favouring for re-association of ions or the formation of ion
pair (Mahendran et al., 2005). This inferred that the ionic conductivity is
increased before its saturation level and is dropped after its saturation level.
Figure 4.36: PMMA-30 wt% EC/PC and PMMA-EC/PC-25 wt% LiClO4 in the range of 2860-3050 cm-1
According to Figure 4.34 (l) and (m), it shows that the unfavourable
vibrational bands representing 45 wt% and 50 wt% of LiClO4 salt added into
Wavenumbers (cm-1)

130
PMMA-EC/PC complex. It revealed that further addition of LiClO4 salt into
the solid polymer electrolyte, the spectrum or main peaks (characteristic peaks)
of PMMA has almost disappeared. It may be due to the insoluble LiClO4 salt
which forms a crystalline structure in the particular polymer electrolyte sample
which is confirmed by XRD and SEM. The amorphous characteristic of
plasticised PMMA is totally replaced by the crystalline structure of LiClO4 salt.
As the amorphous region in the electrolyte system is reduced, the ionic
conductivity is dropped significantly. Besides that, another structure
modification can be observed at 2951 cm-1. The doublet peak has disappeared
as the excessive lithium salt is doped into the polymer electrolyte. This may be
due to the insoluble lithium salt which produces the ion aggregates, ion pair
and ion clouds along the polymeric backbone. Hence no significant
characteristic peak for PMMA can be obtained.
All of these observations indicate that the interaction occurred between
PMMA-EC/PC and LiClO4 salt. With careful dopant of LiClO4 into the
PMMA-EC/PC system, optimised come conductivity behaviour can be
obtained.

131
4.3.3 FTIR for PMMA-EC/PC-LiClO4–Al2O3 samples
In the PMMA-EC/PC-LiClO4 system doped with Al2O3 filler, the FTIR
spectrum for pure Al2O3 is shown in Figure 4.37 as a reference sample and the
information about the assignment of vibrational mode and wavenumber is
depicted in Table 4.10. From these observation, it reveals that the H2O rocking
vibration and O-H stretching is obtained at 1623 and 3490 cm-1, respectively.
These observed peaks are similar to the wavenumber suggested by other
researchers as shown in Table 4.10
Figure 4.37: FTIR spectrum for pure Al2O3
4000.0 3600 3200 2800 2400 2000 1800 1600 1400 1200 1000 800 600.00.0
5101520253035404550556065707580
9095
100105
110.0
Wavenumbers (cm-1)
% T
rans
mitt
ance
(T)
1
2
85

132
Table 4.10: Vibration modes and wavenumber of pure Al2O3
No. Vibration mode
Wavenumber (cm-1) Reference Wavenumber
obtained (cm-1)
1 H2O
rocking vibration
1600 Raveh et al., 1997 1623
2 O-H stretching 3500 Ozer et al., 1999 3490
Figure 4.28 shows the variation of spectrums of Al2O3 added into
PMMA-EC/PC-LiClO4 system. The Addition of Al2O3 eventually alter the
FTIR spectrum which inferred the structure changes and forming the
complexation in the polymeric matrix. In Figure 4.39, it can be seen that the
characteristic peaks in vibration band of 550-900 cm-1 have disappeared and
the band is broader when 25 wt% of Al2O3 concentration is dispersed into
composite solid polymer electrolyte (CSPE). This is the evidence to show the
formation of complexation between Al2O3 filler with PMMA-EC/PC-LiClO4.
As discussed in EIS and XRD, dispersing Al2O3 filler significantly increases
the ionic conductivity and enhances the amorphous region which is attributed
to the formation of three dimension network within the polymer complexes.

133
Figure 4.38: FTIR spectrum for a) pure PMMA, b) pure Al2O3, c) 0wt%,
d)2wt%, e) 4 wt%, f) 6 wt%, g) 8wt%, h) 10 wt%, i) 12 wt%, j) 14 wt%, k) 16wt%, l) 18wt%, m) 20 wt%, of Al2O3 dispersed into PMMA-EC/PC-LiClO4 system
4000 3600 3200 2800 2400 2000 1800 1600 1400 1200 1000 800 600 400
(b)
(c)
(d)
(e)
(f)
(g)
(h)
(i)
(j)
(k)
(a)
(l)
(m)
Wavenumbers (cm-1)
%
Tra
nsm
ittan
ce (%
T)

134
Figure 4.39: PMMA-EC/PC-LiClO4 with 12 wt% and without Al2O3 in the range of 550-900cm-1
Besides that, the CH3 bending, C=O symmetric stretching and CH3
asymmetric stretching of PMMA have all been shifted to 1460, 1727 and 2953
cm-1, respectively. From the investigation of these spectrums, there are no
significant changes along the vibration frequency at 1800 to 2800 cm-1, only a
slight shift of some characteristic peak and slight change of intensity is
observed. For the vibration mode in pure Al2O3, the vibration mode of H2O
rocking has disappeared and the O-H stretching is shifted to 3548 cm-1. The
shift of the O-H stretching revealed the information about the interaction
between alumina filler and lithium salt (LiClO4). The appearance of O-H
stretching vibration indicates the presence of the oxygen-hydrogen (O-H)
group at the surface of Al2O3 surface (Song et al., 2006). Therefore, it is
suggested that the Lewis acid-base type OH surface groups on alumina grains
interactwith the ions of the lithium salt.
550600650700750800850900
0 wt% Al2O3
12 wt% Al2O3
Wavenumbers (cm-1)
% T
rans
mitt
ance
(%T)

135
4.3.4 FTIR for PMMA-EC/PC-LiClO4–SiO2 samples
The FTIR spectrum for pure SiO2 filler is plotted in Figure 4.40 and the
detail of assignation of vibration mode and wavenumber is depicted in Table
4.11. The O-H bending modes of hydrogen-bonded and isolated silanolic
groups are identified at wavenumber of 808 and 975 cm-1. The vibration
frequency at 1108, 1638, 3428 cm-1 is assigned to Si-O stretching, O-H
deformation vibration of surface hydroxyl group of fumed silica and O-H
stretching mode of surface hydroxyl group of fumed silica, respectively. The
O-H deformation vibration of surface hydroxyl group indicates the existence of
OH surface groups for the Lewis acid-base interaction.
Figure 4.40: FTIR spectrum for pure SiO2
4000.0 3600 3200 2800 2400 2000 1800 1600 1400 1200 1000 800 600 400.0 0.0
2468
1012 1416 1820 2224 26 283032 34 3638
40.0
Wavenumbers (cm-1)
% T
rans
mitt
ance
(T)
1
3
2
4
5

136
Table 4.11: Vibration modes and wavenumber of pure SiO2
No. Vibration mode Wavenumber (cm-1) Reference Wavenumber
obtained (cm-1)
1
O-H bending mode of hydrogen bonded silanolic
group
813 Arico et al., 2003 808
2
O-H bending mode of hydrogen isolated silanolic
group
972 Arico et al., 2003 975
3 Si-O stretching 1104 Arico et al., 2003 1108
4
O-H deformation vibration of
surface hydroxyl group of fumed
silica
1639 Sharma and Sekhon 2007 1638
5
O-H stretching mode of surface
hydroxyl group of fumed silica
3423 Ramesh and Wen, 2010 3428
From the Figure 4.41, the overall intensity of absorption peaks
decreases with respect to the increment of SiO2 filler which is dispersed into
the polymer electrolyte complexes. This phenomenon occurred at the vibration
frequencies range in between 1300-1450 cm-1. In the spectrum with 12 wt% of
SiO2 filler was dispersed into PMMA-EC/PC-LiClO4 system, The shifting of
CH2 rocking, C-O-C bending, CH3 bending and CH3 asymmetric stretching of
PMMA is observed at 750, 849, 1452 and 2952 cm-1, respectively. Moreover,
the Shifting of CH2 rocking is depicted in Figure 4.42. This shifted the peak to
reveal the presence of the interaction and coordination of CH2 bond with SiO2.

137
It can be observed that, after dispersion of SiO2 filler into the polymer
electrolyte, the absorption peaks for O-H bending mode of hydrogen has
bonded and isolated the silanolic group, and O-H stretching mode of surface
hydroxyl group of fumed silica are shifted to 811, 978 and 3477 cm-1,
respectively. These might attribute to the polar surface group of filler grain
which helps to dissolve and interact with lithium salt. For the vibration
frequency shifting to 1095 cm-1 as observed in spectrum of 12 wt% of SiO2
filler (spectrum i) and dispersed into PMMA-EC/PC-LiClO4 system, this
inferred to the interaction of Si-O molecules with LiClO4, whereby producing
more favourable of lithium salt dissolution in the polymer electrolyte. Figure
4.43 depicts the change in shape of vibrational peak from a single peak to
doublet peaks, it is confirmed that the Lewis acid-based interaction where the
surface groups of SiO2 filler are likely to compete with the ClO4- for the
formation of complexes with the polymer chains.
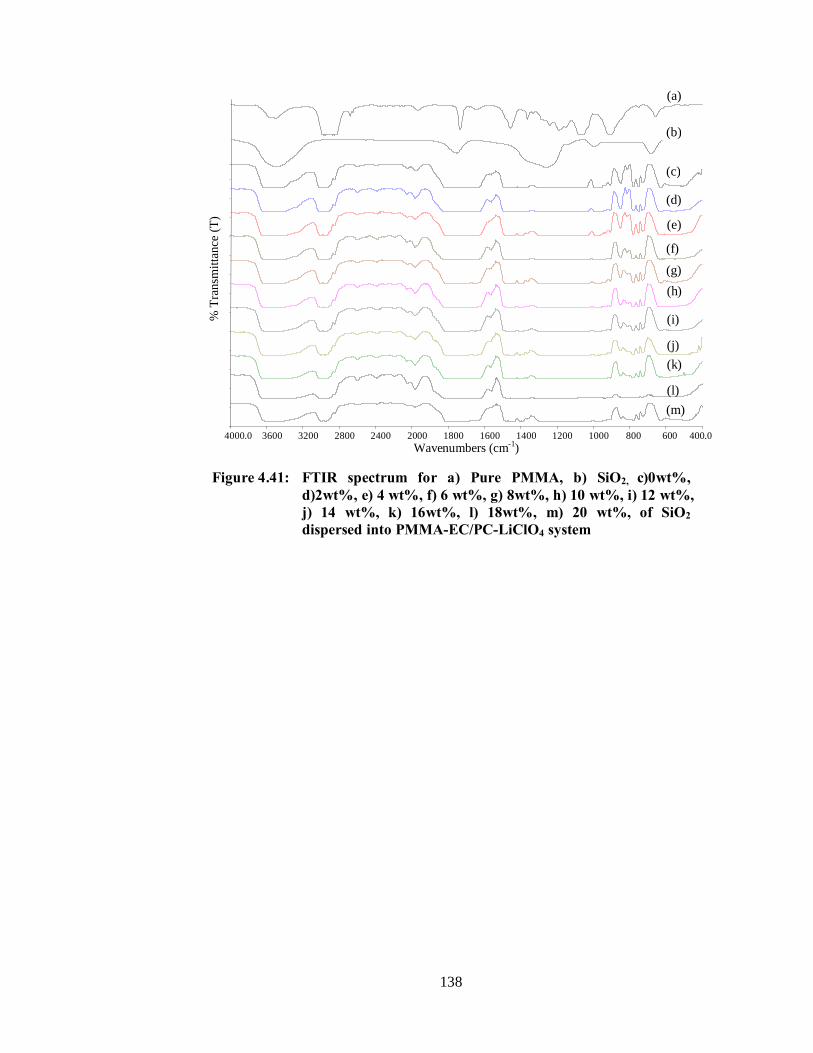
138
Figure 4.41: FTIR spectrum for a) Pure PMMA, b) SiO2, c)0wt%,
d)2wt%, e) 4 wt%, f) 6 wt%, g) 8wt%, h) 10 wt%, i) 12 wt%, j) 14 wt%, k) 16wt%, l) 18wt%, m) 20 wt%, of SiO2 dispersed into PMMA-EC/PC-LiClO4 system
4000.0 3600 3200 2800 2400 2000 1800 1600 1400 1200 1000 800 600 400.0
Wavenumbers (cm-1)
(a)
(b)
(c)
(d)
(e)
(f)
(g) (h)
(i)
(j) (k)
(l) (m)
% T
rans
mitt
ance
(T)

139
Figure 4.42: Comparison of shifting in vibration peak of CH2 rocking mode of PMMA in without SiO2 and 12 wt% of SiO2
Figure 4.43: Comparison of change in shape of vibrational peak in the range of 610-650cm-1
690700 710720730 740 750 760 770780790 800 810 820
0 wt% SiO2
12 wt% SiO2
Wavenumbers (cm-1)
% T
rans
mitt
ance
(%T)

140
Eventually, there are not much changes on the FTIR spectrum pattern
along the vibrational frequency as illustrated in figures. But the increase of
intensity and some shifting of the absorption peaks may be the evidence to
show the interaction of SiO2 filler with the polymeric matrices. It is believed
that the dispersion of SiO2 filler might favourably enhance the properties and
re-organise the structures of the composite solid polymer electrolyte. As
explained in EIS, the Lewis acid-base O-H surface group is favourably
dissolved and avoid the re-association of LiClO4 at a certain amount of SiO2
filler.
4.3.5 Summary of FTIR Spectroscopy
In this study, FTIR spectra of various compositions of PMMA-based
polymer electrolytes were shown in Figure 4.44. Referring to Figure 4.44,CH2
rocking at 750 cm−1, C-O-C bending at 844 cm−1, C-O-C asymmetric stretch at
1152 cm−1, C-O-C symmetric stretching at 1287 cm−1, CH3 bending at 1456
cm−1, C=O symmetric stretch at 1724 cm−1, CH3 asymmetric stretching at 2954
cm−1are observed for PMMA.
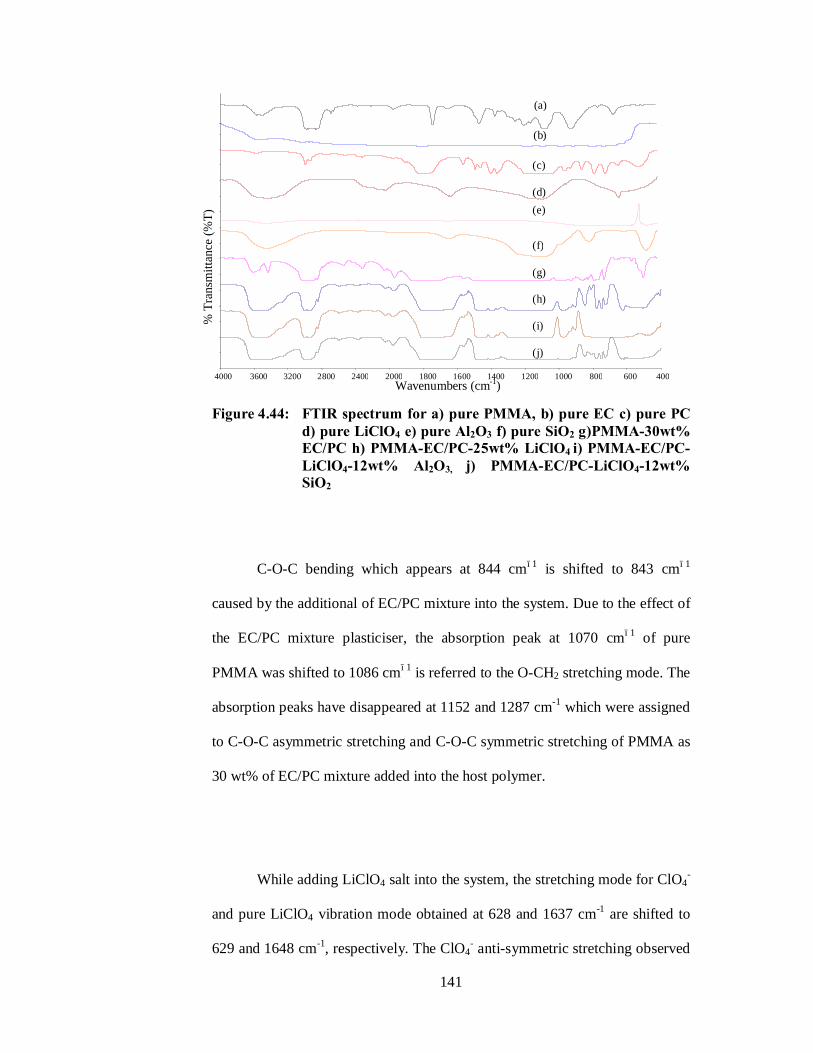
141
Figure 4.44: FTIR spectrum for a) pure PMMA, b) pure EC c) pure PC
d) pure LiClO4 e) pure Al2O3 f) pure SiO2 g)PMMA-30wt% EC/PC h) PMMA-EC/PC-25wt% LiClO4 i) PMMA-EC/PC-LiClO4-12wt% Al2O3, j) PMMA-EC/PC-LiClO4-12wt% SiO2
C-O-C bending which appears at 844 cm−1 is shifted to 843 cm−1
caused by the additional of EC/PC mixture into the system. Due to the effect of
the EC/PC mixture plasticiser, the absorption peak at 1070 cm−1 of pure
PMMA was shifted to 1086 cm−1 is referred to the O-CH2 stretching mode. The
absorption peaks have disappeared at 1152 and 1287 cm-1 which were assigned
to C-O-C asymmetric stretching and C-O-C symmetric stretching of PMMA as
30 wt% of EC/PC mixture added into the host polymer.
While adding LiClO4 salt into the system, the stretching mode for ClO4-
and pure LiClO4 vibration mode obtained at 628 and 1637 cm-1 are shifted to
629 and 1648 cm-1, respectively. The ClO4- anti-symmetric stretching observed
4000 3600 3200 2800 2400 2000 1800 1600 1400 1200 1000 800 600 400
(a)
(b)
(c)
(d) (e)
(f)
(g)
(h)
(i)
(j)
Wavenumbers (cm-1)
% T
rans
mitt
ance
(%T)

142
at 1089 cm-1 is shifted to 1093 cm-1. The formation of weak doublet peak can
be observed through investigation at the absorption peak at 2954 cm-1. The
intensity of the doublet peak obtained is lower than the sample without addition
of LiClO4 salt. This may be due to the interaction of CH3 molecules with
LiClO4 salt which leads to better lithium salt dissolution hence better ionic
conductivity. Moreover, the C=O symmetric stretching is shifted to 1779 cm-1
as 25 wt% of LiClO4 salt is added into polymer electrolyte. This may infer the
interaction between lithium salt with PMMA and EC/PC. Thereby, the Li+ may
break the covalent bonding and attach to O2-. The overall intensity of the
absorption peaks are decreased according to increment in the concentration of
LiClO4 salt up to 25 wt% and the overall intensity of the absorption peaks has
increased again after this saturation level. The increases in the intensity can be
explained by the ClO4- ions in favour for the re-association of ions or the
formation of ion pair (Mahendran et al., 2005). This inferred that the ionic
conductivity is increased before its saturation level and is dropped after its
saturation level.
The vibration modes of H2O rocking vibrations and O-H stretching of
the Al2O3 were found at 1623 cm−1, and 3490 cm−1. The appearance of O-H
stretching vibration indicates the presence of the oxygen-hydrogen (O-H)
group at the Al2O3 surface (Song et al., 2006). Therefore, it is suggested that
the Lewis acid-base type OH surface groups on alumina grains interacts with
the ions of the lithium salt. Upon the dispersion of Al2O3 filler, the CH3
bending, C=O symmetric stretching and CH3 asymmetric stretching of PMMA

143
is shifted to 1460, 1727 and 2953 cm-1, respectively. The vibration mode in
pure Al2O3, the vibration mode of H2O rocking has disappeared and the O-H
stretching has shifted to 3548 cm-1. The shift of the O-H stretching revealed the
information about the interaction between the polar group of alumina filler and
lithium salt (LiClO4).
For the samples doped with SiO2, the O-H bending modes of hydrogen-
bonded and isolated silanolic groups at wavenumber of 808 and 975 cm-1 are
shifted to 811, 978 cm-1. The shift of O-H stretching mode of surface hydroxyl
group of fumed silica is found at 3477 cm-1. The shifting of these absorption
peaks gives the evidence that the polar surface group of filler grain helps to
dissolve and interacts with lithium salt. The vibration frequency at 1095 cm-1
which can be observed from spectrum (i) where this shifting inferred the
interaction of Si-O molecules with LiClO4 to provide more favourable of
lithium salt dissolution in the polymer.Besides that, the CH2 rocking, C-O-C
bending, CH3 bending and CH3 asymmetric stretching of PMMA is shifted to
750, 849, 1452 and 2952 cm-1, respectively. The changes of intensity and
shifting of the absorption peaks may be due to the interaction of SiO2 filler
with the polymeric matrices. Therefore, it is believed that the dispersion of
SiO2 filler might favourably enhance the properties and re-organise the
structures of the composite solid polymer electrolyte.

144
4.4 Scanning Electron Microscopy (SEM) Studies
SEM is used to investigate the structure, morphology, grain size and
distribution of elements (Smart and Moore, 2005). As explained in section
3.3.4, the electron beam produced is scanned across the polymer surface at the
point of interest. The SEM image can be produced by the exchange of energy
between the electron beam and the sample causing an emission of secondary
electrons and electromagnetic radiation that can be detected.
4.4.1 PMMA-EC/PC SEM
The SEM image of pure PMMA electrolyte is shown in Figure 4.45.
Several craters were found on the surface of the electrolyte caused by the rapid
evaporation of THF solvent used in the preparation of the film (Stephan et al.,
2000). As shown in Figure 4.46, the craters eventually disappeared when 10
wt% of EC/PC mixture was added into the PMMA host polymer. This may
attribute to the nature of PC plasticiser which slows down the drying process
and prolongs the solvent evaporation time.
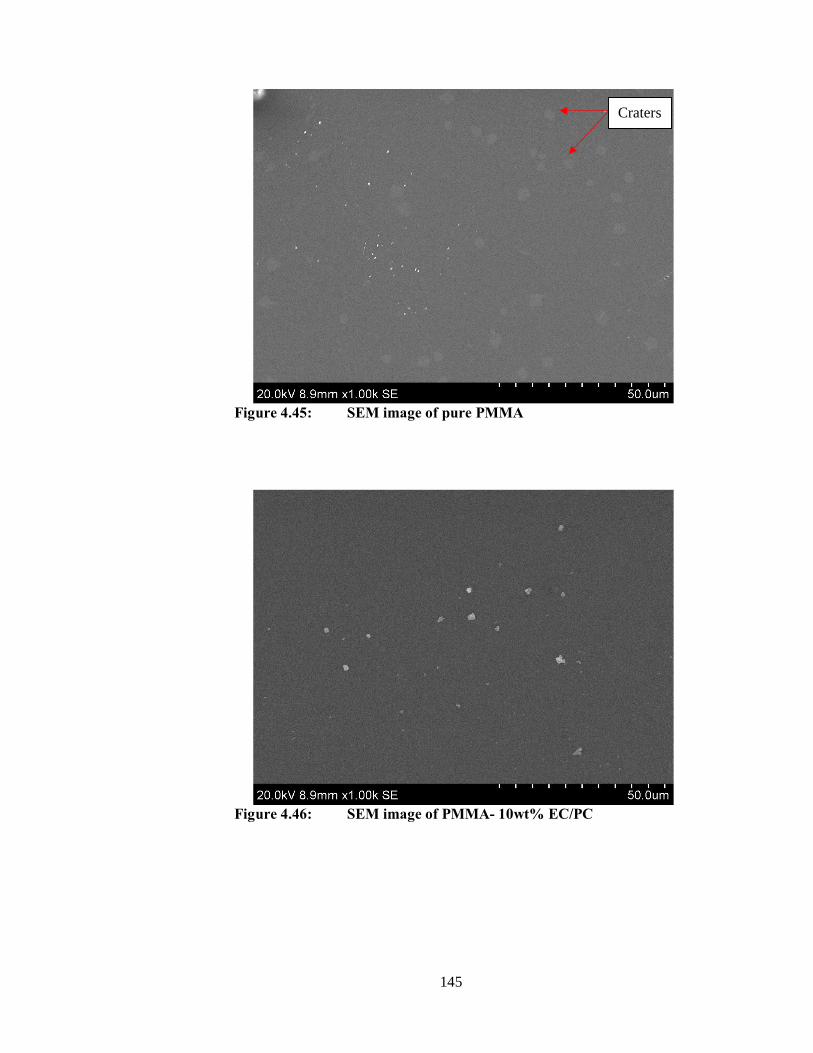
145
Figure 4.45: SEM image of pure PMMA
Figure 4.46: SEM image of PMMA- 10wt% EC/PC
Craters

146
Figure 4.47: SEM image of PMMA- 30wt% EC/PC
As the EC/PC increases, the existence of pores are more obvious. As
shown in Figure 4.47, a further increase of EC/PC mixtures up to 30 wt%,
will cause the existing pores to increase significantly. The association of these
pores that serve as a connecting path in the polymer matrix can enhance the
ionic conductivity of the sample. As the porosity increases, the microstructure
of the sample has become rougher. This inferred that the EC/PC tends to
disorder the structure and increase the amorphous region in the polymeric
matrix.
As discussed in the XRD study, the higher the amorphous in nature, the
higher ionic conductivity could be obtained. The conducting ions and polymer
segments can move more freely in the electrolyte within a smooth surface and
therefore caused enhancement in the conductivity (Low et al., 2010). This

147
result matches with the conductivity study where the EC/PC mixture is added
into the PMMA which exhibits a slight increase in conductivity as compared to
the pure PMMA. When the EC/PC is added into the polymer matrix up to 35
wt%, the sample turns gelled. Hence, 30 wt% of EC/PC is selected to be the
optimised composition where no phase separation occurs and the electrolyte
remains solid.
4.4.2 PMMA-EC/PC-LiClO4 SEM
Figure 4.48 to 4.50 depicted the SEM images of PMMA-EC/PC-
5wt%, 25wt% and 50wt% of LiClO4 lithium salt polymer electrolyte,
respectively. From Figure 4.48, the surface morphology is changed due to a
small quantity of LiClO4 salt doped into the PMMA-EC/PC system. This
quantity of LiClO4 salt in the PMMA matrix has brought substantial
modification to the microstructure pattern as contrasted with plasticised
PMMA (Shukla and Thakur, 2009). Besides, it can be noticed from Figure 4.48
that the LiClO4 salt is dispersed uniformly in the polymer matrix. Hence, as the
charge carrier is increased in the free volume, the ionic conductivity is also
increased.
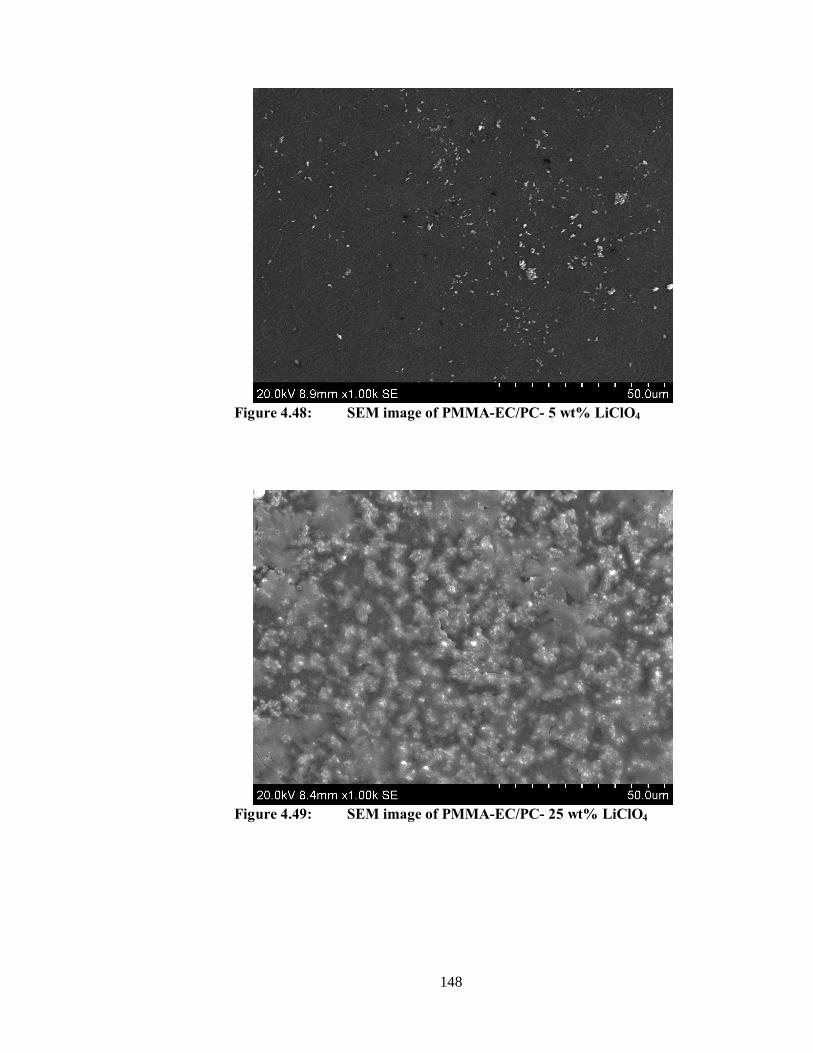
148
Figure 4.48: SEM image of PMMA-EC/PC- 5 wt% LiClO4
Figure 4.49: SEM image of PMMA-EC/PC- 25 wt% LiClO4

149
Figure 4.50: SEM image of PMMA-EC/PC- 50 wt% LiClO4
As shown in Figure 4.49, it can be observed that the addition of 25 wt%
of LiClO4 salt into the PMMA-EC/PC system forms a sphere-like surface. This
is mainly due to the disruption of LiClO4 salt onto the plasticised polymer. This
indicates that the interaction between LiClO4 salt with PMMA-EC/PC polymer
complex is a result of the competitive interaction (Yen et al., 2008). The effect
of high dielectric constant of EC/PC mixture plasticiser helps to dissociate
more lithium salt and provides more charge carrier in the polymer matrix.
Hence, a greater number of charge carriers within the polymer electrolyte
further enhance the ionic conductivity of the solid polymer electrolyte. As the
LiClO4 is evenly dispersed in polymer matrix, the mobility of ionic transport
and polymer segmental motion is greater with no barrier, thus the ionic
conductivity is able to reach about 10-05 Scm-1. As indicated in Figure 4.49, the
film containing 25 wt% of LiClO4 salt shows a more dispersed phase which
indicates the higher amorphous nature as compared to 5 wt% and 50 wt%

150
LiClO4 salt. The SEM image for 25 wt% of LiClO4 doped into PMMA-EC/PC
is almost similar to the work done by Mahendran and Rajendran, 2003.
Further addition of LiClO4 salt into the PMMA-EC/PC system, caused
the polymer-salt phase separation and the coarse surface morphology to be
observed. From the Figure 4.50, at high LiClO4 salt loadings, the salt tends to
exist in ion pairs rather than form complexation between PMMA-EC/PC
polymer matrices. As explained in XRD and FTIR, these aggregated ions lead
to a more crystalline phase in this polymer electrolyte. Due to the increment in
the crystallinity of polymer electrolyte, the energy barrier for ionic transport is
increased hence the ionic conductivity is decreased. Upon the addition of
LiClO4 salt after its saturation level, the ionic mobility is hindered. Therefore,
the existence of blocking effect might cause the ionic conductivity to drop.
Moreover, the changes in micro-structure revealed in SEM agree well with the
XRD pattern and unfavourable interaction between high concentrations of
LiClO4 salt with PMMA-EC/PC complexes as discussed in FTIR.
4.4.3 PMMA-EC/PC-LiClO4-Al2O3 SEM
Figures 4.51 to 4.53 show SEM images for 4 wt%, 12wt% and 20wt%
of Al2O3 filler have dispersed into the predetermined PMMA-EC/PC-LiClO4
system. The effect of Al2O3 filler could be seen from Figure 4.51, the tiny
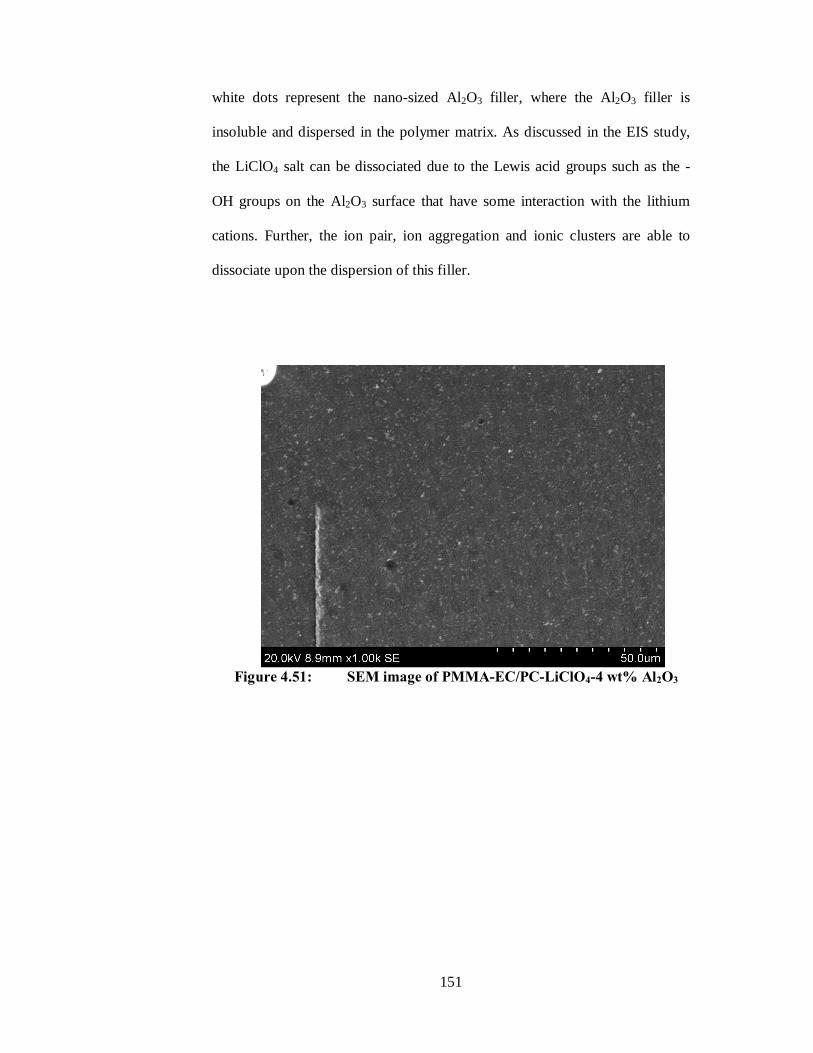
151
white dots represent the nano-sized Al2O3 filler, where the Al2O3 filler is
insoluble and dispersed in the polymer matrix. As discussed in the EIS study,
the LiClO4 salt can be dissociated due to the Lewis acid groups such as the -
OH groups on the Al2O3 surface that have some interaction with the lithium
cations. Further, the ion pair, ion aggregation and ionic clusters are able to
dissociate upon the dispersion of this filler.
Figure 4.51: SEM image of PMMA-EC/PC-LiClO4-4 wt% Al2O3

152
Figure 4.52: SEM image of PMMA-EC/PC-LiClO4-12 wt% Al2O3
Figure 4.53: SEM image of PMMA-EC/PC-LiClO4-20 wt% Al2O3
By increasing the Al2O3 filler up to 12 wt% of Al2O3 fillers, the Al2O3
grains are dispersed evenly across the polymeric matrices and the Al2O3 grains
are getting closer to one another which can be observed from Figure 4.52. As

153
the Al2O3 grains are getting closer, the formations of three dimensional
networks are established. The ionic conduction could be performed between
the adjacent nano-sized grains. Therefore, the ionic conductivity is increased.
Besides that, appropriate quantity of Al2O3 filler is able to weaken the tendency
of LiClO4 salt re-association. Consequently, the number of charge carriers is
enhanced due to the tendency to dissociate with lithium salt and the ionic
mobility is increased. Other than that, the sphere-like surface in Figure 4.52 has
disappeared as 12 wt% of Al2O3 fillers are integrated into the polymeric
matrices. The sphere-like surface is then replaced by the tiny Al2O3 filler grains
as observed. This type of appearance reveals the amorphous region in the
polymer electrolytes.
A further increase of the Al2O3 filler beyond its saturation level (12
wt%), phase separation on the polymer surface is discovered as seen in Figure
4.53. As the Al2O3 filler grains are getting closer to each other, the three
dimensional transportation networks become more and more packed with
Al2O3 filler. This blocking effect is creating a barrier for ionic conduction, and
for conductivity to be decreased. The formation of ion pairs and ion aggregates
which do not assist in ionic conduction might also act as a barrier for ionic
transport. The SEM studies agree with the result in XRD and FTIR that an
appropriate quantity of Al2O3 filler, in the amorphous region is increased but at
higher Al2O3 filler concentration, the amorphous region is reduced by the
formation of aggregates.

154
4.4.4 SEM of PMMA-EC/PC-LiClO4-SiO2 system
The morphologies of sample doped with 4 wt%, 12wt% and 20wt% of
SiO2 filler are illustrated in Figure 4.54 to Figure 4.56. The morphology of
PMMA-EC/PC-LiClO4 is altered by dispersion of SiO2 filler which can be
observed in figure 4.54. The SiO2 filler is dispersed across the surface of the
composite solid polymer electrolyte. At the sample doped with 4 wt% of SiO2
filler, the SiO2 grains has started to attract each other due to the Lewis acid-
base interaction and the three dimensional transportation channels are
established. Due to the smaller grain size, the SiO2 filler is dispersed uniformly
in the polymer electrolyte.
Figure 4.54: SEM image of PMMA-EC/PC-LiClO4-4 wt% SiO2

155
Figure 4.55: SEM image of PMMA-EC/PC-LiClO4-12 wt% SiO2
Figure 4.56: SEM image of PMMA-EC/PC-LiClO4-20 wt% SiO2

156
As the SiO2 filler concentration is increased up to 12 wt%, the
formation of three dimension transportation network is established. From
Figure 4.55, the black cavities is observed, these black cavities might represent
the evidence of three dimensional transportation network for ionic conduction.
Hence, the ionic conduction is favourable as compared to lower filler
concentrations. This inferred that the three dimensional transportation channels
are fully established at 12 wt% of SiO2 filler. Besides that, the ionic
conductivity observed in this composite solid polymer electrolyte is elevated to
10-4 Scm-1. As a result from the FTIR studies, the LiClO4 salt is able to
dissociate due to the Lewis acid groups -OH groups on the SiO2 surface which
indicates the lithium cations. Therefore, the charge carriers in this polymer
electrolyte are increased. Moreover, with the new ionic transportation path, the
ionic mobility in this polymer electrolyte is enhanced. Therefore, more Li+ ions
finds it favourable to use this path for ionic conduction.
From Figure 4.56, the phase separation in polymeric matrices is
observed. This may be inferred to the excessive SiO2 fillers (20 wt%) that
blocked the conducting path along the three dimensional transportation
networks. Besides that, the formation of ions aggregates and ions pairs due to
excessive SiO2 fillers have reduced the ionic mobility. As a result, the ionic
conductivity has decreased to a very low level. The reduction of amorphous
nature in the polymer is also further confirmed by XRD and FTIR studies.

157
4.4.5 SEM images for Highest Ionic Conductivity Samples in Each System
Figure 4.57 shows the highest conductivity sample as compared to the
pure PMMA. As seen from Figure 4.57 (a), the pure PMMA sample shows the
formation of several craters on the surface. This might be inferred to the rapid
evaporation of THF solvent used in the preparation of the film (Stephan et al.,
2000). These craters have disappeared (Figure 4.57b) as the EC/PC mixture is
integrated into the host polymer. This may be due to the nature of liquid PC
plasticiser slowing the drying process hence prolonged the solvent evaporation
time which was carried out inside the fumed hood.

158
(a) Pure PMMA (b) PMMA(70):(30)EC/PC
(c) PMMA-EC/PC(75):(25)LiClO4 (d)PMMA-EC/PC-LiClO4(88):(12)Al2O3
(e) PMMA-EC/PC- LiClO4(88):(12)SiO2
Figure 4.57: SEM images for highest ionic conductivity sample of each system
When the lithium salt is further added into the PMMA-EC/PC system
as shown in Figure 4.57 (c), the sphere-like surface morphology is evenly
spread across the polymer electrolyte surface at 25 wt% of LiClO4 salt. From
Figure 4.57 (c), the disruption of LiClO4 salt onto the plasticised polymer is

159
mainly attributed to the interaction between LiClO4 salt with PMMA-EC/PC
polymer complex as a result of the competitive interaction (Yen et al., 2008).
From the observation from Figure 4.57 (d) and (e), the Al2O3 fillers (40-
47nm) and SiO2 filler (7nm) are getting closer to one another as the filler
concentration has increased. Upon dispersion of an appropriate quantity of
ceramic filler (both systems are 12 wt%), a new ionic transportation pathway
so-called three dimensional transportation network has generated. The black
cavities observed in the figures might represent the evidence of three
dimensional transportation networks. Hence, the ionic conduction is favourable
to be conducted in this ionic transportation pathway. Due to the Lewis acid-
based interaction, the LiClO4 salt is able to dissociate with the Lewis acid
groups -OH groups on the fillers surface with the Lewis acid lithium cations.
The roles of ceramic fillers in the polymer electrolyte are weakening the
tendency of Li+-ClO4- re-association. Therefore, the charge carriers in this
polymer electrolyte have increased which leads to a higher ionic conductivity.
For both types of ceramic filler integrated into the polymer electrolyte system,
the composite solid polymer electrolyte has remained in the amorphous region
whereby the dispersion of these ceramic filler may disorder and then reorganise
the structure. The dispersion phase with SiO2 filler is better than Al2O3 fillers.
This may be attributed to the formation of three dimensional network which
has formed better SiO2 filler as compared to Al2O3 fillers. As a result, the ionic
conductivity for SiO2 filler is higher than Al2O3 fillers.
160
4.5 Mechanical Properties
In general, the stress-strain test is employed for the characterisation of
the mechanical parameters for many polymeric materials (Billmeyer, 1984).
The understanding of the deformation mechanism of polymers (stress and
strain test) is important for managing the mechanical characteristics of the
polymer membranes. Callister (2000) revealed that the response toward the
tensile stresses is the elongation of the chain molecules in the direction of the
applied stress. Besides, the tensile stress and tensile strain can be calculated by
the following equation:
AF
=σ (4.13)
o
i
l
l=ε (4.14)
Where σ = Tensile Stress
F = Applied Force
A = Area
ε = Tensile Strain
il = Elongated Length
ol = Original Length

161
In this study, the mechanical properties of the polymer electrolyte are
carried out by tensile stress-strain characterisation. The results of tensile stress-
strain plots for the best ionic conductivity in each system are depicted in Figure
4.58 - 4.62. From the Figure 4.58, it shows that the pure PMMA film is rigid
and fragile. The tensile stress-strain result shows that the pure PMMA have
high mechanical strength but low ductility. However, due to the amorphous
structure, the flexibility of the PMMA thin film is better over other polymers
such as PVC, PEMA, PEO etc. The high molecular weight of host polymer
mainly contributes to the mechanical integrity to the polymer itself. In order to
make the polymer thin film become more flexible, plasticiser is introduced into
the polymer matrix. From Figure 4.59, it is depicted that the polymer film
becomes more elastic with an addition 30 wt% of EC/PC. The tensile strain is
increased from 2.25 % to 60.17%. However, the tensile stress has decreased
from 62 MPa to 18.67 MPa. The synergist effect of EC/PC has softened and
has improved the mechanical properties. This effect is attributed to the
reduction in the cohesive force of attraction between PMMA. The
enhancement of elasticity can be ascribed to the inducement of amorphous
regions and disordering of the structure of the polymer complex.

162
Figure 4.58: Tensile stress and strain result of pure PMMA
Figure 4.59: Tensile stress and strain result of PMMA- 30 wt% of EC/PC
For the PMMA-EC/PC-LiClO4 system, the elongation capability is
enhanced at 25 wt% of LiClO4 into polymeric matrices. The changes of the
tensile stress and strain can be observed at Figure 4.60. The polymer electrolyte
has become more flexible as the tensile strain is enhanced from 60.17% to
278%. However, the enhancement of elasticity eventually reduces the
mechanical strength of the polymer electrolyte. In comparing Figure 4.59 with
Figure 4.60, the tensile stress is reduced to 0.94 MPa. This result agreed with

163
the XRD characterisation where the addition of 25 wt% LiClO4 has induced
and enhanced the amorphous region. The disorderliness of the structure makes
the polymer electrolyte more elastical and ductile. The enhancement on the
flexibility may attribute to the interaction between LiClO4 with polymer
backbone. As reported by Mahendran and Rajendran (2003), the low lattice
energy with large anion LiClO4 favourably promotes better dissolution in the
polymer matrices. Therefore, the dispersed phase or constructed amorphous
region by LiClO4 may act as a barrier before the polymer electrolyte is
fractured. Besides, the structure changes and the interaction between PMMA
with LiClO4 are confirmed by XRD, FTIR and SEM.
Figure 4.60: Tensile stress and strain result of PMMA-EC/PC- 25 wt% LiClO4
The tensile stress and tensile strain results together with the dispersion
of Al2O3 and SiO2 are depicted in Figure 4.61 and Figure 4.62, respectively.
The mechanical strength has improved to 1.61 MPa and 4.47 MPa for 12 wt%
of Al2O3 and 12 wt% of SiO2. For the tensile strain properties, the elasticity has

164
improved to 288% and 331% for 12 wt% of Al2O3 and 12 wt% of SiO2. From
these results, it is proven that the dimensional stability and mechanical
properties of the polymer electrolyte have improved with the dispersion of both
ceramic fillers. Ahmad et al. (2006) reported that the toughness of the polymer
electrolyte can be increased through the addition of ceramic fillers. Whereby,
the presence of the fillers can reduce the fracture strength of the polymer and
the elongation to failure. This may infer that the dispersion of the ceramic
fillers changes the structure of the polymer complex. The effect of disordering
the structure can induce the amorphous region in the polymeric matrices which
is confirmed by the XRD result. This ascribes that the flexibility of the polymer
electrolyte has improved due to the enhancement in the amorphous phase.
Whereas the enhancement of amorphous region in the polymer electrolytes has
destroyed the crystalline portion and disrupted the interaction of polymer
chain. Besides, the aggregation of ceramic fillers might reinforce the fracture
strength of the polymer electrolyte. At the same time, the disorderliness of
structure improves the elongation property of the polymer electrolyte.
Figure 4.61: Tensile stress and strain result of PMMA-EC/PC- LiClO4- Al2O3

165
Figure 4.62: Tensile stress and strain result of PMMA-EC/PC- LiClO4-
SiO2
For the summary of the mechanical tensile stress and strain test, the
addition of EC/PC into the rigid PMMA basically improves the flexibility of
the polymer electrolyte. However, the mechanical strength is reduced. A
further addition of LiClO4 in the sample, resulting to the mechanical strength
being further reduced due to the enhancement of flexibility in the sample. With
the dispersing of the nano-size ceramic filler into the polymer electrolyte, both
mechanical strength and flexibility have increased. The Figure 4.63, Figure
4.64 and Table 4.12 show that the sacrifice of the tensile strength in turn
enhances the tensile strain of polymer electrolyte. This is more preferred when
the flexibility of the polymer electrolyte has improved the practical application
of the lithium rechargeable battery.
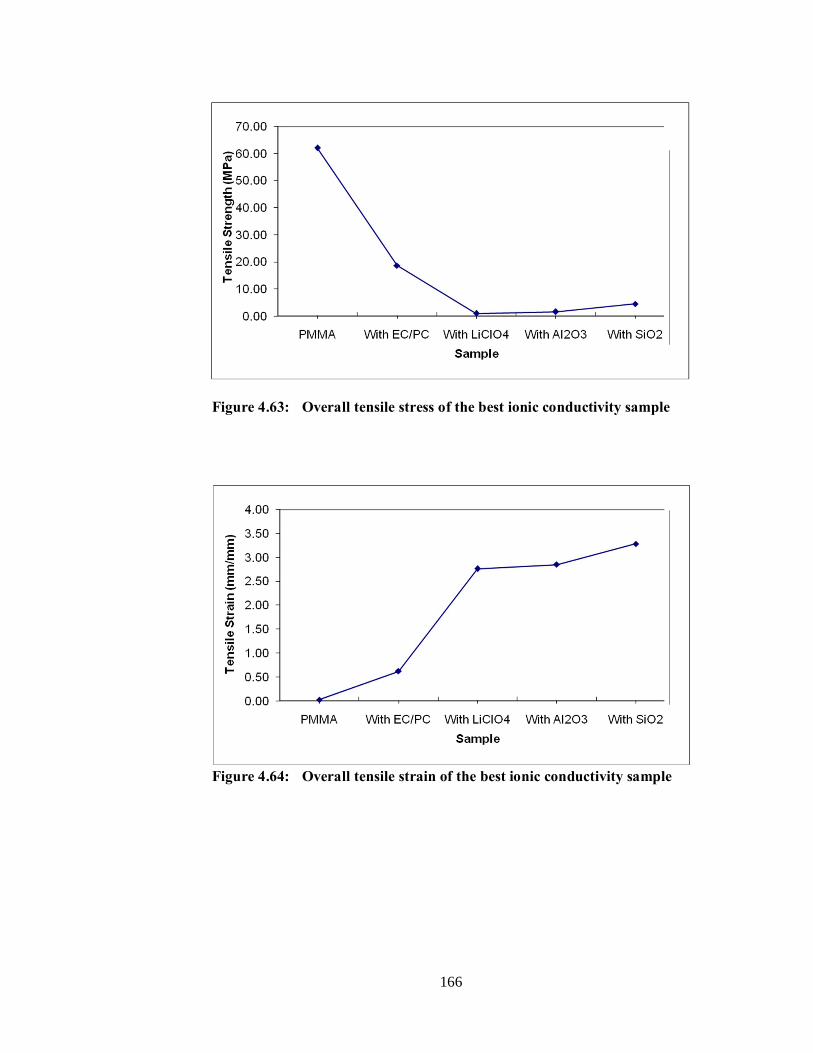
166
Figure 4.63: Overall tensile stress of the best ionic conductivity sample
Figure 4.64: Overall tensile strain of the best ionic conductivity sample

167
Table 4.12: Overall tensile strength and tensile strain for the best ionic conductivity sample
Sample Tensile Stress Tensile Strain
Pure PMMA 62 Mpa 0.0225 mm/mm 70 wt% PMMA : 30% EC/PC 18.6 Mpa 0.62 mm/mm
75 wt% PMMA-EC/PC : 25 wt% LiClO4 0.92 Mpa 2.76 mm/mm 88 wt% PMMA-EC/PC-LiClO4 : 12 wt% Al2O3 1.6 Mpa 2.85 mm/mm 88 wt% PMMA-EC/PC-LiClO4 : 12 wt% SiO2 4.5 Mpa 3.28 mm/mm

168
CHAPTER 5
CONCLUSION
5.1 Summary
Four groups of PMMA based polymer electrolyte consisting of PMMA-
EC/PC, PMMA-EC/PC-LiClO4, PMMA-EC/PC-LiClO4-Al2O3 and PMMA-
EC/PC-LiClO4-SiO2 have been prepared using solution-cast technique. These
thin films are flexible in nature without losing its mechanical integrity. In this
work, a high molecular weight PMMA of 996,000 is used as a host polymer.
The optimum ratio of EC/PC mixture was at 70:30 through the EIS
characterisation.
When 30 wt% of EC/PC mixture is added into the host polymer, the
ionic conductivity is enhanced from 3.19 x 10⁻¹¹ S cm-1 to 7.57 x 10⁻¹⁰ S cm-1 at
ambient temperature. This effect can be attributed to the plasticiser effect
which makes the polymer electrolyte more flexible and amorphous for ionic
transportation and polymer segmental motion. A further addition of EC/PC
mixture can cause the film to turn into a gel type polymer thin film.

169
Upon the addition of 25 wt% of LiClO4 into PMMA-EC/PC, the ionic
conductivity is enhanced to 3.95 x 10-05 S cm-1 at ambient temperature. The
enhancement in ionic conductivity is achieved by increasing the number of
charge carriers and the mobility of ionic transportation. A further addition of
12 wt% of Al2O3 and SiO2 into PMMA-EC/PC-LiClO4 is to generate two
different composite solid polymer electrolyte systems. The highest ionic
conductivity at ambient temperature obtained was 1.02 x 10-04 S cm-1 and 2.48
x 10-04 S cm-1, respectively. The ionic conductivity is enhanced due to the
interaction between the Lewis acid-base type oxygen and the OH surface
groups on filler grains with cations and anions. The ionic conductivity is found
to be at a decreased level. This might be attributed to the formation of ion pairs
and ion aggregates which contribute to the blocking effects. In comparing the
ionic conductivity obtained in this study with Table 5.1, the ionic conductivity
of polymer electrolyte samples generated in this study is eventually enhanced.
This may attribute to the synergised effect of EC and PC which reduces the
mobility restriction in the polymer electrolyte samples and the Lewis acid base
interaction from Al2O3 and SiO2 that provide greater Li+ ions available to
transport in the three dimensional network. Therefore, the objective of
generating high ionic conductivity in the solid polymer electrolyte is achieved.
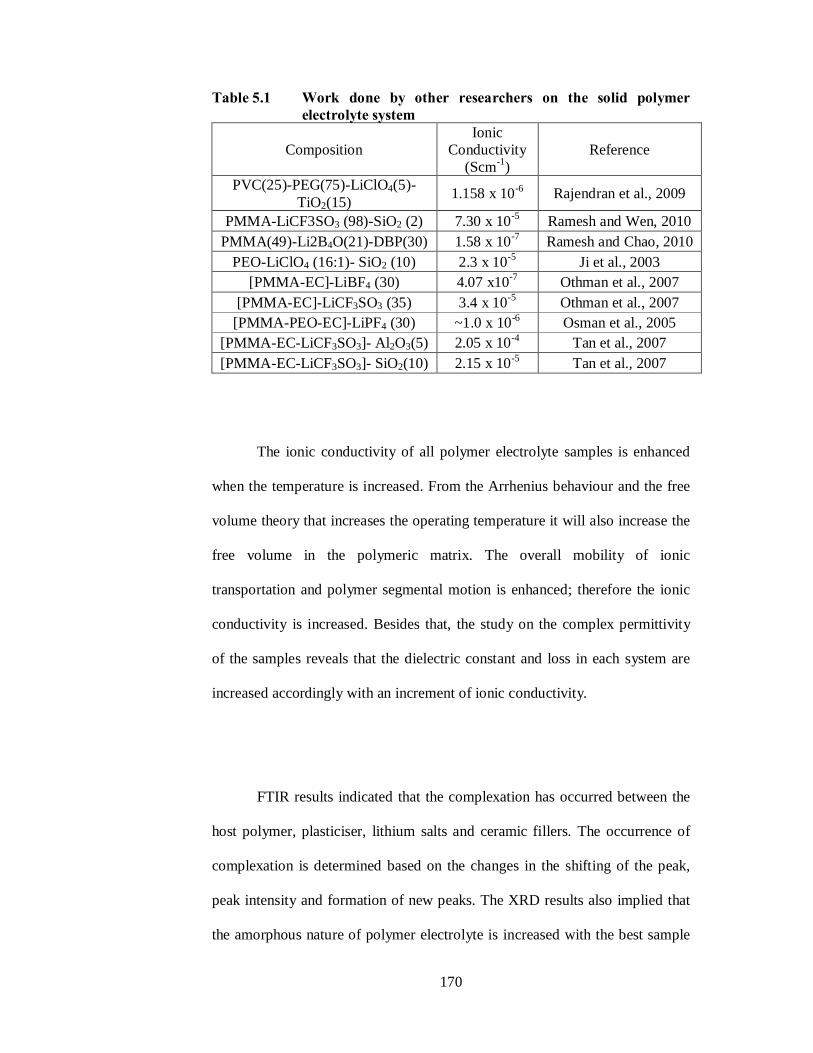
170
Table 5.1 Work done by other researchers on the solid polymer electrolyte system
Composition Ionic
Conductivity (Scm-1)
Reference
PVC(25)-PEG(75)-LiClO4(5)-TiO2(15) 1.158 x 10⁻⁶ Rajendran et al., 2009
PMMA-LiCF3SO3 (98)-SiO2 (2) 7.30 x 10⁻⁵ Ramesh and Wen, 2010 PMMA(49)-Li2B4O(21)-DBP(30) 1.58 x 10⁻⁷ Ramesh and Chao, 2010
PEO-LiClO4 (16:1)- SiO2 (10) 2.3 x 10⁻⁵ Ji et al., 2003 [PMMA-EC]-LiBF4 (30) 4.07 x10⁻⁷ Othman et al., 2007
[PMMA-EC]-LiCF3SO3 (35) 3.4 x 10⁻⁵ Othman et al., 2007 [PMMA-PEO-EC]-LiPF4 (30) ~1.0 x 10⁻⁶ Osman et al., 2005
[PMMA-EC-LiCF3SO3]- Al2O3(5) 2.05 x 10⁻⁴ Tan et al., 2007 [PMMA-EC-LiCF3SO3]- SiO2(10) 2.15 x 10⁻⁵ Tan et al., 2007
The ionic conductivity of all polymer electrolyte samples is enhanced
when the temperature is increased. From the Arrhenius behaviour and the free
volume theory that increases the operating temperature it will also increase the
free volume in the polymeric matrix. The overall mobility of ionic
transportation and polymer segmental motion is enhanced; therefore the ionic
conductivity is increased. Besides that, the study on the complex permittivity
of the samples reveals that the dielectric constant and loss in each system are
increased accordingly with an increment of ionic conductivity.
FTIR results indicated that the complexation has occurred between the
host polymer, plasticiser, lithium salts and ceramic fillers. The occurrence of
complexation is determined based on the changes in the shifting of the peak,
peak intensity and formation of new peaks. The XRD results also implied that
the amorphous nature of polymer electrolyte is increased with the best sample

171
in each system as the intensity of the characteristic peaks is reduced. The
changes in the amorphous nature are determined through the changes in the
peak intensity and the diffraction peaks in the results obtained. For the SEM
characterisation, the microstructure studies clearly showed that complexation
has occurred in the samples as the electrolyte materials are integrated into the
polymer complex. The SEM images proved that the formation of three
dimensional transportation channel for ionic conduction upon dispersion of the
inorganic ceramic filler reveal the improved ionic migration in the polymer
electrolyte samples.
5.2 Suggestions For Future Work
In the current study, the polymer electrolytes are generated based on a
single type of host polymer (PMMA). Thus, for future work, the blending of
polymer hosts such as PMMA/PVDF (Mahendran et al., 2005), PVC/PEG
(Rajendran et al., 2009), PMMA/grafted natural rubber (Low et al., 2010),
PVAc/PMMA (Rajendran et al., 2010) and others might be considered in the
development of a solid type of polymer electrolytes. Due to the concern for the
environment impact, the biodegradable polymer might be a good candidate to
replace the conventional liquid electrolyte and polymer electrolyte in order to
reduce the impact to environment (Ng et al., 2011).

172
Different types of lithium dopant salts, such as lithium triflate
(LiCF3SO3), lithium hexafluoroarsenate (LiAsF6), lithium tetrafluoroborate
(LiBF4) and lithium trifluromethanesulfonimide (LiN(DF3SO2)2), and also
other types of ceramic fillers, such as titanium dioxide (TiO2) and zirconium
dioxide (ZrO2) might be incorporated into the polymer host in order to study
the effects of different types of lithium dopant salt and ceramic fillers, with the
current samples as the reference materials.
More characterisation methods can be used to enhance the knowledge
in this study. The thermal property of the polymer electrolyte can be observed
from the results of the Defferential Scanning Calorimeter (DSC) and
Thermogravimetric Analysis (TGA) to determine the glass transition
temperature (Tg), thermal stability and thermal degradation of the samples.
Rheological studies might be carried out to further clarify the relationship
between the viscosities with ionic conductivity in the samples. The physical
properties of the samples have also been thoroughly studied in order to
understand the effects of the physical characteristics on the bulk ionic
transportation.

173
LIST OF REFERENCES
Adebahr, J. et al., 2003. Enhancement of ion dynamics in PMMA-based gels with addition of TiO2nano-particles. ElectrochimicaActa, 48, pp. 2099-2103.
Ahmad, S., Ahmad, S. and Agnihotry, S.A., 2003. Composite polymeric electrolytes based on PMMA-LiCF3SO3-SiO2. Ionics, 9, pp. 439-443.
Ahmad, S. et al., 2006. Role offumed silica on ion conduction and rheology in nanocomposite polymeric electrolytes. Polymer, 47, pp. 3583-3590.
Ahmad, S., 2009. Polymer electrolytes: characteristics and peculiarities.Ionics, 15, pp. 309-321.
Angell, C.L., 1956. The infra-red spectra and structure of ethylene carbonate. Transistions of the Faraday Society, 52, pp. 1178-1183.
Appetecchi, G.B., Crocce, F. andScrosati, B.,1995. Kinetics and stability ofthe lithium electrode in poly(methylmethacylate)-based gel electrolytes. ElectrochimicaActa, 40, pp. 991-997.
Arico, A.S. et al., 2003. FTIR spectroscopic investigation of inorganic filler for composite DMFC membranes. Electrochemistry Communications, 5, pp. 862-866.
Arof, A.K., 1999. Impedance Spectroscopy. Im A. K. Arof (Ed.),Proceedings of the Workshop on Current Problems in Batteries (pp.59-80).Kuala Lumpur: PenerbitUniversiti Malaya.

174
Awadhia, A., Patel, S.K. andAgrawal, S.L., 2006. Dielectric investigations in PVA based gel electrolytes. Progress in Crystal Growth and Characterization of Materials, 52, pp. 61-68.
Baskaran, R. et al., 2004. Vibrational, ac impedance and dielectric spectroscopic studies of poly(vinylacetate)-N, N-dimethylformamide-LiClO4.Journal of Power Sources, 134, pp. 235-240.
Bernson, A. and Lindgren, J., 1993. Free ions pairing/clustering in the system LiCF3SO3-PPO n. Solid State Ionics, 60, pp. 37-41.
Berthier, C. et al., 1983. Microscopic investigation of ionic conductivity inalkali metal salts-poly(ethylene oxide) adducts. Solid State Ionics,11, pp. 91-95.
Billmeyer, F.W., 1984. Textbook of Polymer Science, 3rd ed. New York: Wiley-Interscience.
Bohnke, O. et al., 1993. FastIon transport in new lithium electrolytes gelled with PMMA. Influence of polymer concentration. Solid State Ionics, 66, pp. 97-104.
Callister, W. D., 2000. Materials Science and Engineering. 5th ed. NewYork: John Wiley & Sons, Inc.
Chintapalli, S. and Frech, R., 1996. Effect of plasticizers on high molecularweight PEO-LiCF3SO3 complexes. Solid State Ionics, 86-88, pp. 341-346.
Chung, S.H. et al., 2001. Enhancement of ion transport in polymer electrolytes by addition of nanoscale inorganic oxides. Journal ofPower Sources, 97-98, pp. 644-648

175
Croce, F., 1999. Physical and chemical properties ofnanocomposite polymer electrolytes. Journal of Physical Chemistry B, 103, pp. 10632-10638.
Croce, F., Saccheti, S., andScrosati, B., 2006. Advaced high-performance composite polymer electrolytes for lithium batteries. Journal of PowerSources, 161(1), pp. 560-564.
Croce, F., Settimi, L., and Scrosati, B., 2006. Superacid ZrO2 – added, composite polymer electrolytes with improved transport properties. Electrochemistry Communications, 8(2), pp. 364-368.
Deepa, M. et al., 2002. Conductivity and viscosity of liquid and gel electrolytes based on LiClO4, LiN(CF3SO2)2 and PMMA. Solid State Ionics, 152-153, pp. 253-258.
Deka, M. and Kumar, A., 2010. Enhanced ionic conductivity in novel nanocomposite gel polymer electrolyte based on intercalation ofPMMA into layered LiV3O8. Journal of Solid State Electrochemistry,14, pp. 1649-1656
Dissanayake, M.A.K.L. et al., 2003. Effect of concentration and grain size of alumina filler on the ionic conductivity enhancement of the (PEO)(9)LiCF3SO3: Al2O3 composite polymer electrolyte. Journal of Power Sources, 119, pp. 409-414.
Dyre, J.C., 1991. Some remarks on ac conduction in disordered solid. Journal Of Non-Crystalline Solid, 135, pp. 219-226.
Fini, G. and Mirone, P., 1973. Evidence for short-range orientation effects in dipolar aprotic liquids from vibrational spectroscopy. Part 1.-Ethylene and propylene carbonates. Journal of the Chemical Society, Faraday Transaction 2, 69, pp. 1243-1248.
176
Fenton, D. E., Parker, J. M., and Wright, P. V., 1973. Complexes of alkali metal ions with poly(ethylene oxide). Polymer, 14(11), pp. 589.
Forsyth, M., et al., 1997. Ionic conductivity in poly(diethylene glycol carbonate)/sodium triflate complexes. Solid State Ionics, 99(3-4), pp. 257 - 261.
Ganesan, S., et al., 2008. Performance of a new polymerelectrolyte incorporated with diphenylamine in nanocrystalline dye- sensitized solar cell. Solar Energy Materials and Solar Cells, 92, pp. 1718-1722.
Gray, F.M., 1991. Polymer Electrolytes-Based Devices. Solid polymerelectrolytes: Fundamentals of technological application. (pp. 1-30). United Kingdom: Wiley-VCH.
Gray, F.M., 1997a. What are Polymer Electrolytes? Polymer Electrolyte. (pp.1- 30). Cambridge: The Royal Society of Chemistry.
Gray, F.M., 1997b. What Materials are suitable as Polymer electrolyte? Polymer Electrolyte. (pp. 31-78). Cambridge: The Royal Society of Chemistry.
Harris, C.S., Shriver, D.S. and Ratner, M.A., 1986. Complex formation of polyethylenmine with sodium triflate and conductivity behavior of the complex. Macromolecules, 19, pp. 987-989.
Huang, B. et al., 1994. Lithium ion conduction in polymer electrolytes based on PAN. Solid State Ionics, 85, pp. 79-84.
Ito, Y., Kanehori, K., Miyauchi, K. and Kuda, T., 1987. Ionic conductivity of electrolytes formed from PEO-LiCF3SO3 complex low molecularweight poly(ethylene glycol). Journal of Materials Science, 22, pp. 1845-1849.

177
Jana, S. andZhong, W.-H., 2008. Electrical conductivity enhancement of a polymer using butyl gylcidyl ether (BGE)-lithium hexafluorophosphate(LiPF6) complex. Journal of Material Science, 43, pp. 4607-4617.
Jeon, J.D., Kwak, S.Y. and Cho, B.W., 2005. Solvent-free polymer electrolytes -I. Preparation and characterization of polymer electrolytes havingpores filled with viscous P(EO-EC)/LiCF3SO. Journal of theElectrochemical Society, 152, pp. A1583-A1589.
Ji, K.S., Moon, H.S., Kim, J.W. and Park, J.W., 2003. Role of Functional nano-sized inorganic filler in poly(ethylene) oxide-based polymerelectrolytes. Journal of Power Sources, 117, pp. 124-130.
Jiang, J., Gao, D., Li, Z. and Su, G., 2006. Gel polymer electrolytes preparedby in situ polymerization of vinyl monomers in room-temperatureIonic liquids. Reactive and Functional Polymers, 66, pp. 1141-1148.
Jiang, Z., Carroll, B. and Abraham, K.M., 1997. Studies of somepoly(vinylidene fluoride) electrolytes. ElectrochimicaActa, 42, pp. 2667-2677.
Jung, S. et al., 2009. Filler for solid-state polymer electrolyte: highlight.Bulletin of Korean Chemical Society, 30, pp. 2355-2360.
Kakihana, M., Schantz, S. andTorell, L.M., 1990. Raman Spectroscopic study of ion-ion interaction and its temperature dependence in a poly(propylene-oxide)-based-NaCF3SO3-polymer electrolyte. Journalof Chemistry Physics, 92, pp. 6271-6276.
Kang, X., 2004. Nonaqueous Liquid Electrolytes for Lithium-Based Rechargeable Batteries. Chemical Reviews, 104, pp. 4303-4417.
Karan, N.K. et al., 2008. Solid polymer electrolytes based on polyethylene oxide and lithium trifluoro- methane sulfonate (PEO-LiCF3SO3): Ionic conductivity and dielectric relaxation. Solid State Ionics, 179, pp. 689-696.

178
Kim, H.S. et al., 2003. Electrochemical and physical properties of composite polymerelectrolyte of poly(methyl methacrylate) and poly(ethylene glycoldiacrylate). Journal of Power Sources, 124, pp. 221-224.
Krawiec, W. et al., 1995. Polymer nanocomposites: a new strategy forsynthesizing solid electrolytes for rechargeable lithium batteries.Journal of Power Sources, 54, pp. 310-315
Kyritsis, A., Pissis, P. and Grammatikakis, J., 1995. Dielectric relaxation spectroscopy in poly(hydroxyethyl acrylates)/water hydrogels. Journalof Polymer Science Part B: Polymer Physics, 33, pp. 1737-1750.
Linden, D. and Reddy, T., 2002. Handbook of Batteries. 3rd Edition. NewYork: McGrawHill.
Li, Q. et al., 2003.All solid lithium polymer batteries with a novel composite polymer electrolyte. Solid State Ionics, 159, pp. 97-109.
Li, T. and Balbuena, P.B., 1999. Theoretical studies of Lithium Perchlorate in Ethylene Carbonate, Propylene Carbonate, and their mixture. Journalof The Electrochemical Society, 146, pp. 3613-3622.
Liu, Y., Lee, J.Y., and Hong, L., 2002. Functionalized SiO2 in poly(ethylene oxide)-based polymer electrolytes. Journal of Power of Power Sources, 109(2), pp. 507-514.
Low, S.P., Ahmad, A. andRahman, M.Y.A., 2010. Effect of ethylenecarbonate plasticizer and TiO2 nanoparticles on 49% poly(methylmethacrylate) grafted natural rubber-based polymer electrolyte. Ionics,16, pp. 821-826.
MacArthur, D., and Powers, R., 1996. The Challenges of Polymer Electrolytes for lithium Batteries. Proceedings of the Eleventh AnnualBattery Conference on Applications and Advances, pp. 307-310.

179
MacCallum, J.R., Tomlin, A.S., and Vincent, C.A., 1986. An investigation of the conducting species in polymer electrolytes. European PolymerJournal, 22, pp. 787-791.
Mahendran, O, andRajendran, S., 2003. Ionic conductivity studies in PMMA/PVDF polymer blend Electrolyte with lithium salts. Ionics, 9, pp. 282-288
Mahendran, O. et al., 2005. Investigation on PMMA-PVdF polymer blend electrolyte with ester of Dibenzoic Acids as plasticizer. Ionics, 11, pp. 251-258. Michael, M.S. et al., 1997. Enhanced lithium ion transport in PEO-based solid polymerelectrolytes employing a novel class of plasticizers. Solid State Ionics, 98, pp. 167-174.
Miyamoto, T., andShibayama, K., 1973. Free-volume model for ionic conductivity in polymers. Journal of Applied Physics, 44(12), pp. 5372-5376.
Nada, A.M.A., Dawy, M. andSalama, A.H., 2004. Dielectric properties and ac-conductivity of cellulose polyethylene glycol blends. Materials Chemistry and Physics, 84, pp. 205-215.
Ng, B.C. et al., 2011. Development and characterization of poly-ε-caprolatone-based polymer electrolyte for lithium rechargeable battery. International Journal of Electrochemical Science, 6, pp. 4355-4364.
Nithya, H. et al., 2011. Thermal and dielectric studies on polymer electrolyte based on P(ECH-EO). Materials Chemistry and Physics, 126, pp. 404-408.
Osaka, T. et al., 1997. Performances oflithium/ gel electrolyte/ polypyrrole secondary batteries. Journal of PowerSources, 68, pp. 392-396

180
Osinska, M. et al., 2009. Study of the role of ceramic filler in composite gel electrolytes based on microporouspolymermembranes.Journal of Membrane Science, 326, pp. 582-588.
Osman, Z. et al., 2005. Infrared and conductivity studies on blend of PMMA/PEO based polymer electrolytes. Ionics, 11, pp. 431-435.
Othman, L., Chew, K.W. and Osman, Z., 2007. Impedance spectroscopy studies of poly(methyl methacrylate)-lithium salts polymer electrolytesystems. Ionics, 13, pp. 337-342
Ozer, N. et al., 1999. Optical properties of sol-gel deposited Al2O3 films. Solar Energy Materials and SolarCells, 59, pp. 355-366.
Pandey, K. et al., 2008. Structural, thermal and ion transport studies on nanocompositepolymer electrolyte-{(PEO+SiO2):NH4SCN} system. Ionics, 14, pp. 515-523.
Pistoia, G., Antonini, A. and Wang, G., 1996. Impedance study on thereactivity of gel polymer electrolytes towards a lithium electrode.Journal of Power Sources, 58, pp. 139-144.
Pradhan, D.K., Choudhary, R.N.P. andSamantaray, B.K., 2008. Studies of dielectric relaxation and ac conductivity behavior of plasticizedpolymer nanocomposite electrolytes. International Journal ofElectrochemical Science, 3, pp. 597-608.
Quartarone, E. et al., 1998. Long term structural stability of PMMA-based gel polymerelectrolytes. ElectrochimicaActa, 43(10-11), pp. 1435-1439.
Ragavendran, K. et al., 2004. Characterization of plasticized PEO basedsolid polymer electrolyte by XRD and AC impedance methods. Portugaliae Electrochimica Acta, 22, pp. 149-159.

181
Raghavan, P. et al., 2010. Electrochemical performance of electrospunpoly (vinylidenefluoride-co-hexafluoropropylene) based nanocomposite polymer electrolytes incorporating ceramic fillers androom temperature ionic liquid. Electrochimica Acta,55, pp. 1347-1354.
Rajendran, S. andMahendran, O., 2001. Experimental investigation onplasticized PMMA/PVA polymer blend electrolyte. Ionics, 7, pp. 463-468.
Rajendran, S., Mahendran, O. andKannan, R., 2002. Ionic conductivity studies incomposite solid polymer electrolyte electrolytes based on methylmethacrylate. Journal of Physics and Chemistry of Solids, 63, pp. 303-307.
Rajendran, S., Sivakumar, M. andSubadevi, R., 2003. Effect of saltconcentration in poly(vinyl alcohol)-based solid polymer electrolytes.Journal of Power Sources, 124, pp. 225-230.
Rajendran, S., Sivakumar, M. andSubadevi, R., 2004. Investigations on the effect of the various plastizers in PVA-PMMA solid polymer blendelectrolytes. Materials Letter, 58, pp. 641-649.
Rajendran, S. andSivakumar, P., 2008. An investigation of PVdF/PVC-based blend electrolytes with EC/PC as plasticizers in lithium battery applications. Physica B, 403, pp. 509-516.
Rajendran, S., Babu, R.S. and Devi, K.R., 2009. Ionic conduction behavior in PVC-PEG blend polymer electrolytes upon the addition of TiO2.Ionics,15, pp. 61-66.
Rajendran, S. andPrabhu, M.R., 2010. Effect of different plasticizer onstructural and electrical properties of PEMA-base polymer electrolytes.Journal of Applied Electrochemistry, 40, pp. 327-332.

182
Rajendranm S., Bama, V.S. andPrabhu, M.R., 2010. Effect of lithium salt concentration in PVAc/PMMA-based gel polymer electrolytes. Ionics, 16, pp. 27-32.
Ramesh, S. andArof, A.K., 2001. Ionic conductivity studies of plasticized poly(vibyl chloride) polymer electrolytes. Materials Science and Engineering B-Solid State Materials for Advanced Technology, 85, pp. 11-15.
Ramesh, S. et al., 2007. FTIR studies of PVC/PMMA blend based polymer electrolytes. SpectrochimicaActaPart A: Molecular and Biomolecular Spectroscopy, 66, 4–5, pp. 1237-1242.
Ramesh, S. and Wen, L.C., 2010. Investigation on the effect of addition of SiO2 nanoparticles on ionic conductivity, FTIR, and thermalproperties of nanocomposite PMMA-LiCF3SO3-SiO2. Ionics, 16, pp. 255-262.
Ramesh, S., Yahaya, A.H. andArof, A.K., 2002. Dielectric behaviour of PVC-based polymer electrolytes. Solid State Ionics, 152, pp. 291-294.
Ramya, C.S. et al., 2008. Investigation on dielectric relaxations of PVP-NH4SCN polymer electrolyte. Journal of Non-Crystalline Solids, 354, pp. 1494-1502.
Raveh, A., Tsameret, Z.K., and Grossman, E., 1997. Surface characterizationof thin layers of aluminium oxide. Surface and Coating Technology, 88, pp.103-111.
Reicha, F.M. et al., 1991. Conducting polymers. v. electrical conductivity of polymer complexes of bis-2,6-diaminopyridinesulphoxide-copper halides. Journal of Physics D:Applied Physics, 24, pp. 369-374.
Saikia, D. et al., 2008.Investigation of ionic conductivity of composite gel polymerelectrolyte membranes based on P(VDF-HFP), LiClO4 and silicaaerogel for lithium ion battery. Desalination, 234, pp. 24-32.

183
Saikia, D. et al., 2009. LiNMR spectroscopy and ion conduction mechanism of composite gel polymer electrolyte: A comparative study with variation of salt andplasticizer with filler. ElectrochimicaActa, 54, pp. 1218-1227.
Schmidt-Rohr, K. et al., 1994. Molecular Nature of the .beta,relaxation in poly(methacrylate) investigated by multidimensionalNMR. Macromolecules, 27, pp. 4733-4745.
Scrosati, B., 2000. Recent advances in lithium ion battery materials. ElectrochimicaActa, 45, pp. 2461-2466.
Scrosati, B., Croce, F. and Persi, L., 2000. Impedance spectroscopy study ofPEG-based nanocomposite polymer electrolytes. Journal of theElectrochemical Society, 147, pp. 1718-1721.
Sekhon, S.S., Arora, M. and Chandra, S., 2003. Proton conducting polymer gel electrolytes with NO2 substituted carboxylic acids. European Polymer Journal, 39, pp. 915-920.
Sekhon, S.S., Arora, M. and Sing, H.P., 2003. Effect of donor number of solvent on the conductivity behaviour of nonaqueous proton-conducting polymer gel electrolytes. SolidState Ionics, 160, pp. 301-307.
Sekhon, S.S. et al., 2006. Proton conducting membrane containing room temperature ionic liquid. ElectrochimicaActa, 52, pp. 1639-1644.
Selvasekarapandian, S. et al., 2006. Laser Raman and FTIR studies on Li+ interaction in PVAc- LiClO4 polymer electrolytes. SpectrochimicaActa A, 65, pp. 1234-1240.
Sharma, J.P, andSekhon, S.S., 2007. Nanodispersed polymer gel electrolytes: Conductivity modification with the addition of PMMA and fumed silica. Solid State Ionics, 178, pp. 439-445.

184
Shukla, N. and Thakur, A. K., 2009. Role of salt concentration on conductivity optimization and structural phase separation in a solid polymer electrolyte based on PMMA-LiClO4. Ionics, 15, pp. 357-367.
Singh, P. K., Kim, K. W. and Rhee, H. W., 2009. Development and characterization of ionic liquid doped solid polymer electrolyte membranes for better efficiency. Synthetic Metals, 159, pp. 1538-1541.
Smart, L. and Moore, E.A., 2005. Physical Methods for Characterizing Solids. SolidState Chemistry: An introduction. (pp. 175-238). New York:Taylor & Francis.
Song, H.J., Zhang, Z.Z. and Men, X.H., 2006. Effect of nano-Al2O3 surface treatment on the tribological performance of phenolic compositecoating. Surface & Coating Technology, 201, pp. 3767-3774.
Song, J.Y., Wang, Y.Y. and Wan, C.C., 1999. Review of gel-type electrolytesfor lithium-ion batteries. Journal of Power Sources, 77, pp. 183-197
Stallworth, P.E. et al., 1995. Lithium-7 NMR and ionic conductivity studies of gelelectrolytes based on poly(methylmethacrylate). ElectrochimicaActa, 40, pp. 2137-2141.
Stephan, A.M. et al., 2000. Ionic conductivity and FT-IR studies on plasticized PVC/PMMA blend polymer electrolytes. Journal of Power Sources, 89, pp. 80-87.
Stephan, A.M. et al., 1999. A study on polymer blend electrolyte based onPVC/PMMA with lithium salt. Journal of Power Sources, 81-82, pp.782-758.

185
Stephan, A.M. et al., 2002. Preparation and characterization of PVC/PMMA blend polymer electrolytes complexedwith LiN(CF3SO2)2. Solid State Ionics, 148, pp. 467-473.
Sung, H.Y., Wang, Y.Y. and Wan, C.C., 1998. Preparation andCharacterization of Poly(vinyl chloride-co-vinyl acetate)-based gelelectrolytes for Li-ion batteries. Journal of The Electrochemical Society,145, pp. 1207-1211.
Tan, C.G. et al., 2007. The effects of ceramic filler on the PMMA-based polymer electrolytesystems. Ionics, 13, pp. 361-364.
Tobishima, S. andYamaji, A., 1984. Ethylene carbonate-propylene carbonate mixed electrolyte for lithium batteries. ElectrochimicaActa 29, pp. 267-271.
Tsuchida, E., Ohno, H. andTsunemi, K., 1983. Conduction of lithium ions in polyvinylidene fluoride and its derivatives-1. ElectrochimicaActa, 28, pp. 591-595.
Wang, Z. et al., 1996. Infrared spectroscopic study of the interaction between lithium saltLiClO4 and the plasticizer ethylene carbonate in the polyacrylonitrile- based electrolyte. Solid State Ionics, 85, pp. 143-148.
Wang, Z. et al., 1997. Competition between the plasticizer and polymer on associating withLi+ ions in polyacrylonitrile-based electrolyte. Journal of The Electrochemical Society, 144, pp. 778-786.
Weston, J.E. and Steele, B.C.H., 1982. Effect of inert filler on the mechanicaland electrochemical properties of lithium salt-poly(ethylene oxide) polymer electrolytes. Solid State Ionics, 71, pp. 75-79.
Xiong, H.M., Chen, J.S. and Li, D.M., 2003, Controlled growth of Sb2O5 nanoparticles and their use as polymer electrolyte fillers. Journal of Material Chemistry, 13, pp. 1994-1998.

186
Xu, W. et al., 1998. The influence of the compatibility of plasticizer with polymer ionic conductors on ionic conduction. Journal of Solid State Electrochemistry, 2, pp. 257-261.
Yen, Y.C. et al., 2008. Effect of LiClO4 on the thermal and morphological properties of organic/inorganic polymer hybrids. Polymer, 49, pp. 3625-3628.