Embed Size (px)
Citation preview

TANK Ridership Research Final Report March, 2015

Table of Contents
Slide Description Slide Number
Introduction 3
• Introduction – Background & Objectives 3
• Research Design 4
Executive Summary 5
Express/Local 12
• Rider Profile 13
• Riding TANK 23
• TANK Ratings 35
• Marketing & Communications 41
Southbank Shuttle 49
• Rider Profile 50
• Riding the Shuttle 54
• Marketing & Communication 59
Non-Riders 65
• Non-Rider Profile 66
• Awareness & Barriers 71
2

Introduction
Background
Previous TANK ridership studies were completed in 2007 and 2004. Due to the length of time since the last study, an update of our understanding of TANK riders and non-riders was determined to be a necessary step for 2014.
Research Objectives
Primary Research Objectives
• Understand current riders’ motivations, usage and ridership decisions
• Understand current brand perceptions and key equities
• Identify any desired service improvements
• Understand non-rider beliefs, perceptions, barriers and opportunity for conversion
• Capture rider demographics to support Title 6 requirements
Secondary Research Objectives
• Understand use and value of “My TANK” Alerts
• Understand how current and target riders use social media platforms and implications for TANK
3

Research Design
Methodology
This research was conducted in two simultaneous legs, one focusing on current riders and the other on non-riders.
Current Riders (Express, Local, and Southbank Shuttle)
• Current riders were intercepted on the bus and asked to complete a self-administered paper survey. TANK riders were also able to complete the same survey online through the TANK website.
• Both surveys were available in English and Spanish.
• The total ending sample size was n=1056 Express/Local and n=260 Shuttle. Riders were classified into Express and Local riders based upon which they ride most often (n=406 Express and n=444 Local). (Note: due to missing data the actual base size will vary from question to question).
• Data collection was completed during November 17- December 13, 2014.
• (Previous waves of this study also utilized a paper, self-administered survey and riders were also intercepted on the bus and asked to complete the survey. Ending sample sizes for the Express/Local survey and Southbank Shuttle were n=662 and n=261 respectively in the previous wave.)
Non-Riders (Lapsed and ‘Never’ Riders)
• The Non-Rider survey was completed online by residents of the three northern Kentucky counties – Boone, Campbell, and Kenton.
• Respondents were screened to have NOT ridden TANK in the past 6 months, or have Never ridden TANK before.
• The ending sample size was n=112.
Reporting Notes
Consumer verbatims are included throughout the report and italicized. Quotes were obtained from open end question answers.
All stat testing was performed at the 95% confidence level.
4

Executive Summary and Recommendations

TANK Express/Local Survey
Perceptions of TANK are positive and when riders are asked how they would describe TANK they most often mention – Convenient, Easy to Use, Friendly Drivers, and Safe.
When asked to describe their ‘favorite thing’ about riding TANK, two themes emerge:
• The good drivers that TANK has – ‘I like how nice and friendly all of the drivers are. They are always so polite to me.’
• The relaxing/no stress ride – ‘I enjoy being able to read and relax on my commute to work every morning.’
TANK is rated most highly on a variety of characteristics including: ‘Locations near my work’, ‘Safety’, ‘Easily accessible route info’, and ‘Driver courtesy’.
Gaps (Rider expectations versus performance) were noted in several areas, however, including: ‘Bus Cleanliness’, ‘Service Frequency’, and ‘Schedule Reliability/On Time’.
Usage of the TANK website is up significantly versus 2007 and overall the ratings are very positive in terms of being easy to locate schedules and route info.
• May want to consider automating the route schedules/and times (rather than PDF).
6

Express/Local
TANK Riders fall into two very different and distinct universes, Express and Local. Express and Local riders are quite different demographically and also different in terms of their needs and how they use TANK.
7
Express Local
Demographic Profile 63% have incomes > $50K 52% have incomes < $20K
90% have at least one vehicle (not dependent on TANK to get where they are going)
57% have no vehicle (captive audience)
93% are employed full time 58% are employed full time
Only 1 member of HH riding TANK Multiple members of HH riding TANK
22% minority 32% minority
TANK Usage Profile Primarily riding TANK to commute to/from work.
More than half are riding TANK every day to travel to a variety of destinations
Saving gas/parking costs, avoiding traffic/driving hassles, avoiding driving in bad weather conditions, and reducing stress are primary reasons for riding TANK.
Use TANK as their primary mode of transportation since they typically don’t drive or don’t own a vehicle . These riders use TANK to travel to a variety of destinations including shopping centers/malls, work, medical appointments, errands, and even entertainment places.
These riders would simply drive to their destination if TANK was unavailable.
These riders would either walk, ride with a friend, take a taxi, or simply not take the trip.

Express/Local
Media Habits & Practices are relatively similar for both rider segments. Both are active users of social media.
Twenty-six percent (26%) have signed up to receive myTANK alerts and 57% of those say the alerts have been extremely/very helpful.
• Penetration of the TANK app is lower, with only 18% having downloaded it.
8
Express Local
74% Smartphone ownership (37% android, 33% iPhone)
60% Smartphone ownership (34% android, 15% iPhone)
76% use social media (65% Facebook, 30% YouTube)
82% use social media (68% Facebook, 39% YouTube)
74% use internet for news & weather (57% Smartphone, 44% laptop/desktop)
57% use internet for news & weather (44% Smartphone, 28% laptop/desktop)
45% spend 5+ hours a week on internet for pleasure.
44% spend 5+ hours a week on internet for pleasure.
Radio stations – 101.9 WKRQ (16%), 98.5 WRRM (14%), 107.1 KISS (14%), 105.1 WUBE (14%), 103.5 WGRR (14%);
Radio stations – 107.1 KISS (23%), 102.7 WEBN (18%), 101.9 WKRQ(15%), 103.5 WGRR (14%), 92.5 WOFX (13%);

TANK Southbank Shuttle Survey
Rider ratings of the Southbank Shuttle are extremely positive on all attributes, with especially high scores for fare/cost, driver courtesy, destinations served, frequency of service, and vehicle appearance.
• Only attribute falling short of expectations on: hours of service.
• Some ‘qualitative’ dissatisfaction with the wooden seats!
Southbank Shuttle Riders fall into three distinct segments based on residency: Northern Kentucky Residents, Cincinnati residents, and out-of-town visitors.
9
Northern Kentucky Residents Cincinnati Residents Out-of-Town Visitors
Demographic Profile
More likely to be working full time and have higher incomes, with nearly half making $50K or more.
More likely to have lower income, less likely to employed full time.
Have the highest income levels - >$50K
These riders are more likely to own at least one vehicle, and tend to be slightly older, live in 2+ person households.
Less likely to own a vehicle and more likely to be Black/African American.
Usage Profile More likely to use the Southbank Shuttle daily for commuting and to travel to a variety of destinations including to/from work, sports events, Newport on the Levee, downtown Cincinnati, and special events.
Also use the Shuttle for commuting to and from work as well as other locations. Also use the shuttle for leisure activities – going to Newport on the Levee, or sports events.
Most likely to be ‘first time’ riders and riding as a tourist; Using the Shuttle for convenience, to save on parking costs, or lack of familiarity with the area.
Most likely to opt to take the Southbank Shuttle to save on parking costs or avoid traffic/driving hassles.
Most likely to take the Southbank shuttle because they don’t drive.
Place greater importance on Driver Courtesy and vehicle appearance.
They are more likely to simply drive to their destination if the shuttle was not available.
If the Shuttle did not exist, these riders are more likely to not make the trip.
If the shuttle did not exist, they would either walk or drive to their destination.

TANK Non Rider Survey
TANK non-riders mention cite these barriers most often. • Takes the bus longer to get to destination • No control over the schedule when riding • Logistical: the bus does not go to my destination or the bus stop is too far away to make it worthwhile • Live close enough to destination
Perceptual barriers to riding TANK • Bus comfort • Bus cleanliness
Non-riders say they would be most interested in these features: • Wifi on buses (49%) • Security cameras (46%) • Frequent rider discount/reward program (46%)
Demographics and media habits of Non-Riders
10
Demographic Profile Media Habits & Practices
3 out of 4 own multiple vehicles High penetration of Smartphones (77%)
Highest incomes, nearly 70% >$50K Active on social media: (76% Facebook, 38% YouTube)
Less likely to be employed full time (47%) 56% use Smartphone as a source for news & weather
Higher proportion of seniors (21% vs. 3%) 37% spend more than 8 hours per week on the internet for pleasure
White/Caucasian skew (98% vs. 69%)

Recommendations
TANK Express
• Improve bus cleanliness (more frequent cleanings)
• Increase service frequency (more runs on the routes)
• Improve schedule reliability/on time departures and arrivals
• Improve bus comfort
TANK Local
• Increase service frequency (more runs on the routes)
• Improve schedule reliability/on time departures and arrivals
Southbank Shuttle • Increase hours of service • Consider improving bus comfort/seating
Website
• Automate the route schedules
11

Express/Local Survey – Detailed Findings - Rider Profile: Who is riding TANK?
- Where, when, why, and how often are they Riding TANK? - What are Riders’ perceptions of TANK?
Express/Local Rider Profile: Who’s Riding TANK?

Demographic Profile TANK Express Riders
63% have incomes > $50K
90% have at least one vehicle (not dependent on TANK to get where they are going)
93% are employed full time
22% minority
Wide age range and HH size distribution (18% other HH members also ride TANK)
Media Habits & Practices
74% Smartphone ownership (37% Android, 33% iPhone)
76% use social media (65% Facebook, 30% YouTube)
74% use internet for news & weather (57% Smartphone, 44% laptop/desktop)
45% spend 5+ hours a week on internet for pleasure.
Radio stations – 101.9 WKRQ (16%), 98.5 WRRM (14%), 107.1 KISS (14%), 105.1 WUBE (14%), 103.5 WGRR (14%);
TANK Express/Local Riders profile into two distinct demographic universes – mostly driven by their economic situation.
14
Demographic Profile TANK Local Riders
52% have incomes < $20K
57% have no vehicle (captive audience)
58% are employed full time
32% minority
Wide age range and HH size distribution (61% other HH members also ride TANK)
Media Habits & Practices
60% Smartphone ownership (34% android, 15% iPhone)
82% use social media (68% Facebook, 39% YouTube) 57% use internet for news & weather (44%
Smartphone, 28% laptop/desktop) 44% spend 5+ hours a week on internet for pleasure. Radio stations – 107.1 KISS (23%), 102.7 WEBN (18%),
101.9 WKRQ(15%), 103.5 WGRR (14%), 92.5 WOFX (13%);

Gender 2014 2007 Employment Status 2014 2007
Female 58% 65% Employed Full-time 93% NA
Male 42% 35% Employed Part-time 3% NA
Age 2014 2007 Student 2% NA
Less than 18 years old 0% 0% Full-time Temp Employee 2% NA
18 – 24 years 9% 8% Not Employed 0% NA
25 – 34 years 18% 18% Retired 0% NA
35 – 44 years 18% 23% Part-time Temp Employee 0% NA
45 – 54 years 29% 31% Household Income 2014 2007
55 – 64 years 23% 17% Less than $12,000 4% NA
65+ years 3% 2% $12,000 - $15,999 2% NA
# People in Household 2014 2007 $16,000 - $19,999 3% NA
1 17% NA $20,000 - $23,999 2% NA
2 34% NA $24,000 - $27,999 3% NA
3 18% NA $28,000 - $31,999 3% NA
4 18% NA $32,000 - $35,999 6% NA
5 8% NA $36,000 - $39,999 5% NA
6 2% NA $40,000 - $49,999 10% NA
7 2% NA $50,000 or more 63% NA
8 or more 1% NA Speak Language Other Than English
2014 2007 # Vehicles in Household 2014 2007
0 10% 11% No 93% NA
1 26% 23% Yes, Spanish 4% NA
2 40% 43% Yes, other language 3% NA
3 or more 24% 23% How Well Speak English (if speak language other than English)
2014 2007 # People Employed in Household 2014 2007
1 42% NA Very Well 93% NA
2 46% NA Well 6% NA
3 11% NA Not Well 0% NA
4 1% NA Not Well at All 1% NA
5 or more 0% NA Ethnicity 2014 2007
White/Caucasian 78% NA
Black/African American 18% NA
American Indian/Alaskan Native 2% NA
Hispanic/Latin American 2% NA
Asian 1% NA
Native Hawaiian/Pacific Islander 0% NA
Express Rider Demographic Profile
18
2014: n=406 2007: n=350

Radio Stations Listen To 2014 Social Media Sites Use 2014
101.9 WKRQ 16% Facebook 65%
98.5 WRRM 14%
107.1 KISS 14% YouTube 30%
105.1 WUBE 14%
103.5 WGRR 14% Pinterest 19%
92.5 WOFX 12%
102.7 WEBN 12% Google+ 18%
700 WLW (AM) 12%
94.1 WVMX 7% Twitter 13%
96.5 WYGY 5%
55 KRC (AM) 5% Instagram 10%
Non-local radio/satellite 9%
Other 25% Vine 4%
Do not listen to radio 11%
When Listen to the Radio 2014 MySpace 1%
6-10 a.m. 67%
10-2 p.m. 11% Other 1%
2-6 p.m. 36% Don’t use social media sites 24%
After 6 p.m. 29% Electronic Devices Own 2014
Have Internet Access? 2014 Smartphone (Net) 74%
Yes 95% Smartphone - Android 37%
No 5% Smartphone - iPhone 33%
# Hours/Week Spend on Internet 2014 Smartphone - Windows 2%
None 4% Smartphone - Other 4%
1-2 hours 24% Laptop Computer 56%
3-4 hours 26% Tablet or E-reader 48%
5-6 hours 19% Desktop Computer 46%
7-8 hours 9% Cell Phone (NOT Smartphone) 29%
More than 8 hours 17% None of the above 1%
Sources Use for News & Weather 2014
Internet (Net) 74%
Internet – Smart phone 57%
Internet – Laptop, Desktop 44%
Television 73%
Radio 38%
Newspaper 12%
Express Rider Media Habits & Practices
19
Note: No Media Habits data available from 2007. 2014: n=406 2007: n=350

Gender 2014 2007 Employment Status 2014 2007
Female 59% 60% Employed Full-time 58% NA
Male 41% 40% Employed Part-time 18% NA
Age 2014 2007 Not Employed 8% NA
Less than 18 years old 2% 5% Student 7% NA
18 – 24 years 17% 19% Retired 4% NA
25 – 34 years 24% 18% Full-time Temp Employee 3% NA
35 – 44 years 20% 22% Part-time Temp Employee 2% NA
45 – 54 years 18% 20% Household Income 2014 2007
55 – 64 years 15% 13% Less than $12,000 27% NA
65+ years 3% 4% $12,000 - $15,999 14% NA
# People in Household 2014 2007 $16,000 - $19,999 11% NA
1 23% NA $20,000 - $23,999 7% NA
2 32% NA $24,000 - $27,999 6% NA
3 18% NA $28,000 - $31,999 5% NA
4 12% NA $32,000 - $35,999 6% NA
5 8% NA $36,000 - $39,999 5% NA
6 5% NA $40,000 - $49,999 4% NA
7 2% NA $50,000 or more 15% NA
8 or more 2% NA Speak Language Other Than English
2014 2007 # Vehicles in Household 2014 2007
0 57% 41% No 92% NA
1 27% 31% Yes, Spanish 5% NA
2 12% 18% Yes, other language 3% NA
3 or more 4% 10% How Well Speak English (if speak language other than English)
2014 2007 # People Employed in Household 2014 2007
1 53% NA Very Well 88% NA
2 32% NA Well 8% NA
3 9% NA Not Well 2% NA
4 4% NA Not Well at All 3% NA
5 or more 2% NA Ethnicity 2014 2007
White/Caucasian 68% NA
Black/African American 27% NA
American Indian/Alaskan Native 2% NA
Hispanic/Latin American 2% NA
Asian 0% NA
Native Hawaiian/Pacific Islander 0% NA
Local Rider Demographic Profile
21
2014: n=444 2007: n=312

Radio Stations Listen To 2014 Social Media Sites Use 2014
107.1 KISS 23% Facebook 68%
102.7 WEBN 18%
101.9 WKRQ 15% YouTube 39%
103.5 WGRR 14%
92.5 WOFX 13% Google+ 26%
98.5 WRRM 10%
105.1 WUBE 10% Instagram 16%
700 WLW (AM) 9%
94.1 WVMX 8% Twitter 16%
96.5 WYGY 3%
55 KRC (AM) 1% Pinterest 8%
Non-local radio/satellite 5%
Other 21% Vine 4%
Do not listen to radio 22%
When Listen to the Radio 2014 MySpace 2%
6-10 a.m. 40%
10-2 p.m. 20% Other 3%
2-6 p.m. 23% Don’t use social media sites 18%
After 6 p.m. 37% Electronic Devices Own 2014
Have Internet Access? 2014 Smartphone (Net) 60%
Yes 82% Smartphone - Android 34%
No 18% Smartphone - iPhone 15%
# Hours/Week Spend on Internet 2014 Smartphone - Windows 6%
None 13% Smartphone - Other 7%
1-2 hours 23% Cell Phone (NOT Smartphone) 41%
3-4 hours 20% Laptop Computer 35%
5-6 hours 15% Tablet or E-reader 28%
7-8 hours 9% Desktop Computer 22%
More than 8 hours 20% None of the above 2%
Sources Use for News & Weather 2014
Television 73%
Internet (Net) 57%
Internet – Smart phone 44%
Internet – Laptop, Desktop 28%
Radio 28%
Newspaper 13%
Local Rider Media Habits & Practices
22
Note: No Media Habits data available from 2007. 2014: n=444 2007: n=312

Express/Local Riding TANK
Express Rider
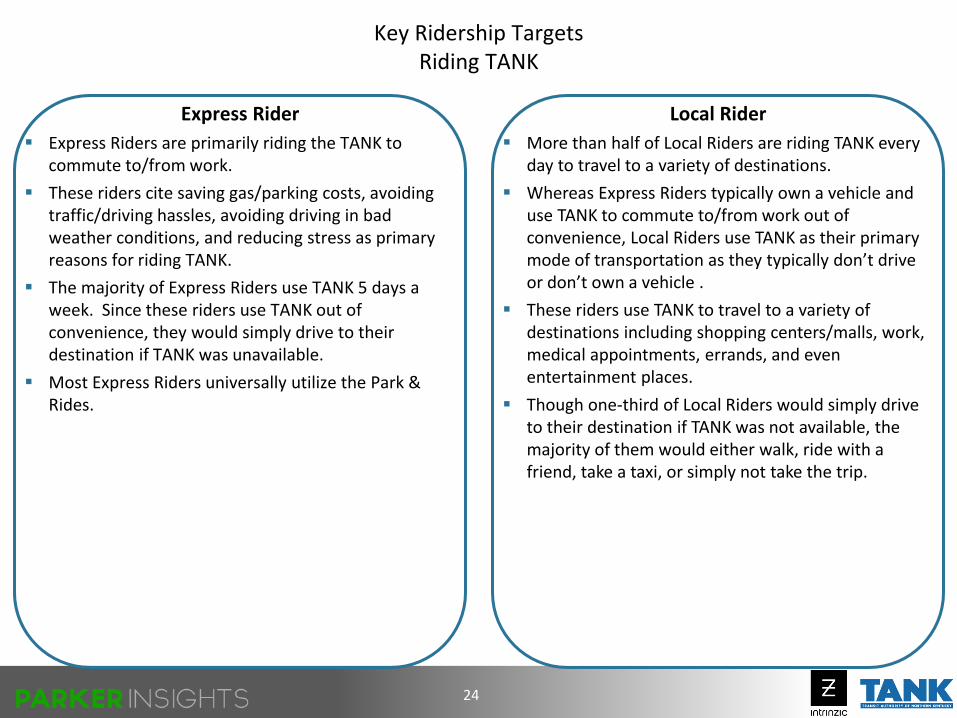
Express Riders are primarily riding the TANK to commute to/from work.
These riders cite saving gas/parking costs, avoiding traffic/driving hassles, avoiding driving in bad weather conditions, and reducing stress as primary reasons for riding TANK.
The majority of Express Riders use TANK 5 days a week. Since these riders use TANK out of convenience, they would simply drive to their destination if TANK was unavailable.
Most Express Riders universally utilize the Park & Rides.
Key Ridership Targets Riding TANK
24
Local Rider
More than half of Local Riders are riding TANK every day to travel to a variety of destinations.
Whereas Express Riders typically own a vehicle and use TANK to commute to/from work out of convenience, Local Riders use TANK as their primary mode of transportation as they typically don’t drive or don’t own a vehicle .
These riders use TANK to travel to a variety of destinations including shopping centers/malls, work, medical appointments, errands, and even entertainment places.
Though one-third of Local Riders would simply drive to their destination if TANK was not available, the majority of them would either walk, ride with a friend, take a taxi, or simply not take the trip.

Express riders are more likely to ride the same route day to day, back and forth to work. Local riders, as evidenced by the high proportion of 6-7 day ridership are using TANK for more than
just commuting to work.
27
32%
58%
5%
2%
1%
2%
1%
Frequency Make This Trip
2014 Total Express (E) Local (L)
E/L indicate significant differences between 2014 Express and Local data at the 95% confidence level. Note: No 2007 data available on Total, Express, or Local.
6-7 days/week
3-5 days/week
1-2 days/week
Twice a month
Once a month
Less than once a month
10%
86%
2%
1%
0%
1%
0%
42%
42%
8%
3%
1%
2%
1%
L
E
E
E
Total 2014: n=1056 Express 2014: n=406 Local 2014: n=444
2014 2014

E/L indicate significant differences between 2014 Express and Local data at the 95% confidence level. Note: No 2007 data available on Total, Express, or Local.
46.2
36.0
48.7
34.6
Average door-to-door trip time is 50 minutes with 38 minutes spent on the bus.
28
50.0
38.0
2014 2014 2014
Average Commute Length
Total Express (E) Local (L)
Average Commute Length Door to
Door (in Minutes)
Average Commute Length on TANK (in
Minutes)
Total 2014: n=1056 Express 2014: n=406 Local 2014: n=444

E/L indicate significant differences between 2014 Express and Local data at the 95% confidence level. * Average Commute from Home to TANK Park & Ride only asked of respondents that have Used TANK Park & Ride. Note: Average Commute from Home to TANK Park & Ride not comparable to 2007. Note: No 2007 data available on Total.
7.3
19.3
5.0
9.5
As expected, Express riders are much more likely to be making use of Park & Ride. Typical distance from home to the Park & Ride is 5 miles and the commute to it is 10 minutes.
29
5.6
11.7
2014 2014 2014
Average Commute from Home to TANK Park & Ride*
Total Express (E) Local (L)
Yes 37%
No 63%
Yes 67%
No 33%
Yes 14%
No 86%
Used TANK Park & Ride
Total Express (E) Local (L) 2014 2014 2014
E L
(55%)
(45%)
(83%)
(17%)
Commute Distance (in
Miles)
Commute Length (in
Minutes
E
Total 2014: n=1056 Express 2014: n=406; 2007 n=350 Local 2014: n=444; 2007: n=312

22%
43%
29%
4%
2%
4%
1%
1%
59%
14%
23%
7%
8%
3%
1%
2%
Local riders typically pay with cash (59%). Express Riders are more likely to use the 10 ride or 30 day passes.
30
46%
25%
25%
6%
6%
4%
2%
1%
Fare Payment Method
2014 Total Express (E) Local (L)
E/L indicate significant differences between 2014 Express and Local data at the 95% confidence level. Note: No 2007 data available on Total, Express, or Local.
L
E
E
Total 2014: n=1056 Express 2014: n=406 Local 2014: n=444
2014 2014
Cash
10 Ride Pass
30 Day Pass
Day Pass
Reduced Fare
NKU U-Pass
MT Pass
Gateway U-Pass

Express riders most typically take TANK just to get to and from work. Although three quarters of Local riders also take TANK to work, they utilize it for many other trip types including
shopping, medical, entertainment etc.
31
86%
30%
28%
25%
21%
15%
11%
10%
7%
Destination Points
2014
To/From Work
Shopping Center/Mall
Basic Errands
Medical Appts
Entertainment Places
Special Events
To/From School
Sporting Events
Local Parks
78%
48%
45%
39%
32%
22%
17%
13%
12%
Total Express (E) Local (L)
2007 2007
96%
5%
3%
3%
5%
6%
4%
5%
1%
99%
7%
6%
7%
7%
10%
3%
7%
1%
75%
36%
31%
30%
28%
19%
18%
12%
9%
E/L indicate significant differences between 2014 Express and Local data at the 95% confidence level. Note: No 2007 data available on Total.
L
E
E
E
E
E
E
E
E
Total 2014: n=1056 Express 2014: n=406; 2007 n=350 Local 2014: n=444; 2007: n=312
2014 2014

Express riders are most likely to cite positive aspects of ‘bus versus car’ commuting – cost of gas, cost of parking, avoiding the stress of driving, and being able to relax.
32
48%
42%
38%
35%
32%
27%
27%
25%
21%
12%
4%
Reasons Why Ride TANK
2014
32%
24%
23%
20%
45%
17%
17%
36%
16%
13%
5%
Total Express (E) Local (L)
2007 2007
76%
73%
64%
59%
9%
45%
43%
8%
30%
10%
4%
E/L indicate significant differences between 2014 Express and Local data at the 95% confidence level. Note: No 2007 data available on Total.
L
E
E
Save Gas Cost
Save Parking Cost
Avoid Traffic/Driving Hassles
Reduce Vehicle Expenses
Don't Own a Vehicle
Avoid Driving in Bad Weather
Relax/Less Stress
Don’t Drive
Improve Environment
Backup Transportation
Other
75%
77%
68%
57%
12%
39%
44%
10%
40%
NA
NA
41%
33%
33%
26%
36%
NA
21%
41%
24%
NA
NA
L
L
L
L
L
L
Total 2014: n=1056 Express 2014: n=406; 2007 n=350 Local 2014: n=444; 2007: n=312
Local riders quite often do not have an alternative means of getting to their destination and are dependent on TANK for this service.
2014 2014

75%
16%
11%
1%
4%
1%
18%
35%
24%
28%
18%
4%
If TANK were not available, most Express riders would simply use their car to get where they need to go.
33
35%
28%
23%
19%
14%
4%
Alternative Transportation if TANK Wasn't Available
2014 Total Express (E) Local (L)
E/L indicate significant differences between 2014 Express and Local data at the 95% confidence level. Note: No 2007 data available on Total, Express, or Local.
L
E
E
E
Drive
Ride with a friend
Would not make this trip
Walk/wheelchair
Taxi
Bicycle
E
Local riders would be most likely to ask a friend for a ride, walk, or cancel the trip altogether.
Total 2014: n=1056 Express 2014: n=406 Local 2014: n=444
2014 2014

39%
24%
20%
14%
13%
13%
53%
19%
28%
NA
10%
10%
56%
16%
15%
9%
9%
8%
No One Else
Spouse
Other Relative
Roommates/Housemates
Older Children Age 13+)
Young Children (Age <12)
82%
8%
6%
2%
3%
1%
81%
6%
12%
NA
3%
1%
Total 2014: n=1056 Express 2014: n=406; 2007 n=350 Local 2014: n=444; 2007: n=312
Express riders generally have no other household members riding TANK.
34
2014 2014 2014
Who Else in Household Rides TANK
E/L indicate significant differences between 2014 Express and Local data at the 95% confidence level. Note: No 2007 data available on Total.
Total Express (E) Local (L)
L
E
2007 2007
Local riders often have other family members or other household members riding TANK.
E
E
E
E

Express/Local Perceptions and Ratings

Key strengths for TANK include location proximity (work/home), safety, and driver courtesy. Although ‘locations of Park and Ride’ is rated under 4.0, TANK does exceed expectations.
36
3.7
3.8
3.8
3.9
3.9
3.9
4.0
4.0
4.1
4.1
4.1
4.2
4.2
4.3
4.3
1.0 2.0 3.0 4.0 5.0
Schedule Reliability/On Time
Service Frequency
Locations of Park and Ride
Bus Comfort
Bus Cleanliness
Travel Time
Customer Service Help…
Number of Stops
Fare/Cost
TANK Website
Locations Near My Home
Driver Courtesy
Easily Accessible Route Info
Safety
Locations Near My Work
Needs a Lot of Improvement
Excellent
* Gap = Performance Top 2 Box % - Importance Top 2 Box % * 100 Note: No 2007 data available on Total.
TANK Performance - TOTAL
Gap Analysis - TOTAL
Attribute Importance
(Top 2 Box%) Performance (Top 2 Box%)
Gap*
Locations of Park and Ride 58% 66% +8%
Number of Stops 65% 73% +8%
TANK Website 69% 75% +7%
Customer Service Help Number 66% 71% +6%
Easily Accessible Route Info 80% 83% +2%
Driver Courtesy 80% 78% -1%
Locations Near My Work 90% 84% -5%
Safety 92% 85% -7%
Fare/Cost 82% 74% -8%
Locations Near My Home 87% 78% -8%
Bus Comfort 75% 65% -10%
Travel Time 83% 71% -12%
Bus Cleanliness 87% 69% -18%
Service Frequency 90% 64% -26%
Schedule Reliability/On Time 93% 65% -28%
Falls Short of Rider Expectations
Surpasses Rider Expectations
Meaningful ‘GAPs’ are noted for ‘bus cleanliness’, ‘service frequency’, and ‘schedule reliability/on time’.
Total 2014: n=1056
2014

Proximity to work location, safety, easily accessible route info, and driver courtesy are key strengths for TANK Express.
37
3.6
3.6
3.7
3.7
3.8
3.8
3.9
4.0
4.0
4.1
4.1
4.1
4.2
4.2
4.5
1.0 2.0 3.0 4.0 5.0
Service Frequency
Schedule Reliability/On Time
Bus Comfort
Bus Cleanliness
Travel Time
Customer Service Help…
Locations of Park and Ride
Locations Near My Home
Fare/Cost
TANK Website
Number of Stops
Driver Courtesy
Safety
Easily Accessible Route Info
Locations Near My Work
Needs a Lot of Improvement
Excellent
* Gap = Performance Top 2 Box % - Importance Top 2 Box % * 100 Note: Unable to line up 2014 Importance/Performance Gap Analysis data with 2007.
TANK Performance - Express
Gap Analysis - Express
Attribute Importance
(Top 2 Box%) Performance (Top 2 Box%)
Gap*
Customer Service Help Number 55% 66% +11%
Easily Accessible Route Info 75% 86% +10%
TANK Website 68% 77% +10%
Number of Stops 73% 80% +7%
Driver Courtesy 75% 81% +6%
Locations of Park and Ride 74% 75% +1%
Locations Near My Work 94% 91% -3%
Fare/Cost 80% 73% -8%
Safety 95% 87% -8%
Locations Near My Home 84% 75% -10%
Travel Time 86% 72% -14%
Bus Comfort 79% 59% -20%
Bus Cleanliness 92% 62% -30%
Schedule Reliability/On Time 96% 62% -33%
Service Frequency 92% 58% -33%
Falls Short of Rider Expectations
Surpasses Rider Expectations
Improvement opportunities for TANK Express include: bus cleanliness, schedule reliability/on time, service frequency, and bus comfort.
Express 2014: n=406
2014
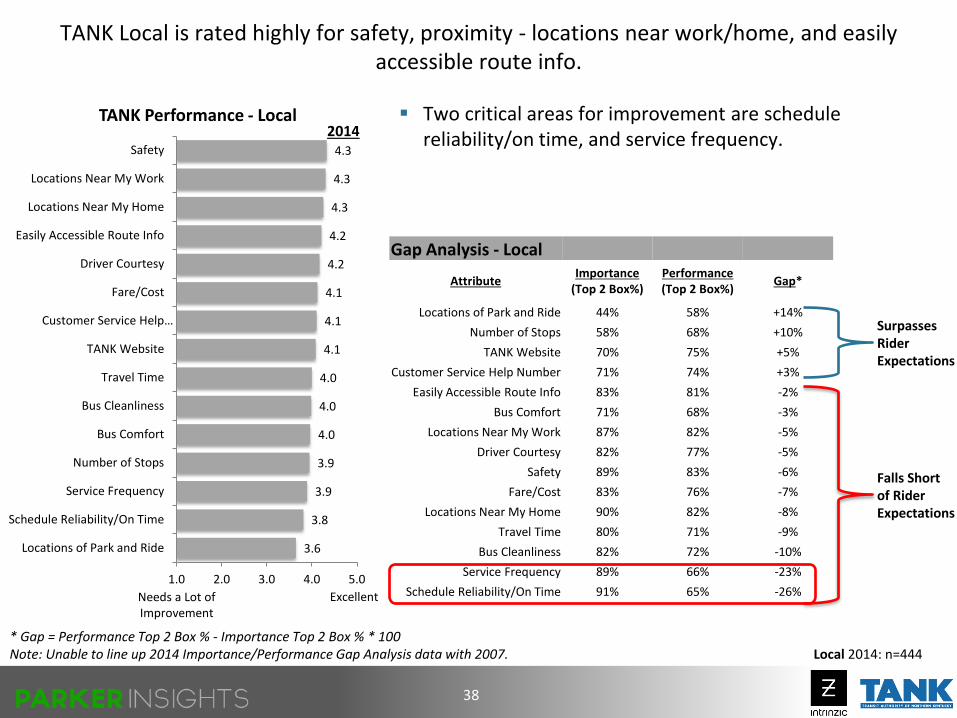
Gap Analysis - Local
Attribute Importance
(Top 2 Box%) Performance (Top 2 Box%)
Gap*
Locations of Park and Ride 44% 58% +14%
Number of Stops 58% 68% +10%
TANK Website 70% 75% +5%
Customer Service Help Number 71% 74% +3%
Easily Accessible Route Info 83% 81% -2%
Bus Comfort 71% 68% -3%
Locations Near My Work 87% 82% -5%
Driver Courtesy 82% 77% -5%
Safety 89% 83% -6%
Fare/Cost 83% 76% -7%
Locations Near My Home 90% 82% -8%
Travel Time 80% 71% -9%
Bus Cleanliness 82% 72% -10%
Service Frequency 89% 66% -23%
Schedule Reliability/On Time 91% 65% -26%
TANK Local is rated highly for safety, proximity - locations near work/home, and easily accessible route info.
38
3.6
3.8
3.9
3.9
4.0
4.0
4.0
4.1
4.1
4.1
4.2
4.2
4.3
4.3
4.3
1.0 2.0 3.0 4.0 5.0
Locations of Park and Ride
Schedule Reliability/On Time
Service Frequency
Number of Stops
Bus Comfort
Bus Cleanliness
Travel Time
TANK Website
Customer Service Help…
Fare/Cost
Driver Courtesy
Easily Accessible Route Info
Locations Near My Home
Locations Near My Work
Safety
Needs a Lot of Improvement
Excellent
* Gap = Performance Top 2 Box % - Importance Top 2 Box % * 100 Note: Unable to line up 2014 Importance/Performance Gap Analysis data with 2007. Local 2014: n=444
TANK Performance - Local
Falls Short of Rider Expectations
Surpasses Rider Expectations
Two critical areas for improvement are schedule reliability/on time, and service frequency. 2014

Good Driver
Quiet/Relax
On Time
Other Riders
Convenient
Price
Bus Features
Other
Add/Change Route
Bus Issues (Dirty, etc.)
Hours of Route
Late Bus
Driver
Price
Better Website/App
Other
Nothing
TANK drivers and a quiet/relaxing ride are key TANK benefits. Additional/modified routes, cleaner buses, and expanded route hours are what they would most like to see.
39
Favorite Thing About Riding TANK
25%
22%
16%
16%
11%
11%
6%
8%
Improvement Opportunities for TANK
27%
15%
14%
11%
10%
5%
5%
11%
16%
Note: No 2007 data available on Total. Total 2014: n=1056
“I like how nice and friendly all of the drivers are. They are always so polite to me.”
“I enjoy being able to read and relax on my commute to work every morning.”
"Allows me to get from point A to point B on time without asking friends for help."
"I've met some great people on the bus. Some have been friends of mine for over 18 years."
"I like the fact that its convenient and runs in all weather conditions."
"I don’t have to drive during rush hour and saves me gas money as well as wear and tear on my car."
"Having a warm, comfortable ride to work in the morning."
“ ALSO add more routes.”
“I would like the buses to be cleaned a lot more frequently. The older buses really are not attractive to ride in.”
"Better hours after work day in case people need to stay later at work."
"Bus to be on time more. I am often late to work because of TANK."
"A lot of the drivers are very rude and not courteous."
"1.50 fare and .25 for every transfer is too much. Should get free transfers."
"If you are set up for mobile alerts you should get an alert when the bus arrives. Don't often get alerts even though signed up for them."

75%
53%
45%
46%
46%
50%
46%
29%
30%
22%
13%
4%
3%
4%
4%
2%
3%
2%
1%
70%
49%
54%
49%
42%
36%
39%
35%
31%
33%
11%
6%
5%
5%
5%
4%
3%
2%
0% Total 2014: n=1056 Express 2014: n=406; 2007 n=350 Local 2014: n=444; 2007: n=312
Riders are most likely to associate ‘Convenient’, ‘Easy to Use’, ‘Friendly Drivers’, and ‘Safe’ with TANK.
40
71%
49%
48%
47%
42%
42%
39%
34%
30%
29%
12%
5%
5%
5%
4%
3%
3%
2%
1%
2014 2014 2014
E/L indicate significant differences between 2014 Express and Local data at the 95% confidence level. Note: No 2007 data available on Total.
Total Express (E) Local (L)
L
2007 2007
Local riders are more likely to associate ‘Friendly Drivers’ with TANK, while Express riders are more likely to associate ‘reliable/dependable’ with TANK.
Convenient
Easy to use
Friendly Drivers
Safe
Valuable to the Community
Reliable/Dependable
Inexpensive/Affordable
On-Time
Environmentally Friendly
Clean
Late
Expensive
Unfriendly Drivers
Unreliable
Dirty
Complicated
Inconvenient
Intimidating
Unsafe
Top 5 Ways Riders Describe TANK
86%
50%
48%
43%
48%
55%
44%
50%
35%
28%
NA
NA
NA
NA
NA
NA
NA
NA
NA
73%
47%
54%
48%
42%
44%
37%
44%
36%
32%
NA
NA
NA
NA
NA
NA
NA
NA
NA
E
E

Express/Local Marketing and Communication

40%
20%
9%
9%
6% 4%
2%
3%
2%
4%
27%
31%
18%
11%
20%
23%
NA
2%
NA
NA
62%
6%
6%
6%
4%
5%
7%
1% 1%
2%
53%
10%
18%
7%
15%
18%
NA%
4%
NA%
NA%
Total 2014: n=1056 Express 2014: n=406; 2007 n=350 Local 2014: n=444; 2007: n=312
The TANK website is the primary source for information. Significantly more riders consider the website to be their primary source than in 2007.
42
49%
15%
8%
8%
5%
5%
4%
3%
2%
3%
TANK Website
331-TANK
On the Bus
Flyer/Brochure
From Bus Driver
The Bus Stop Store
myTANK Alerts
Work
myTANK App
Other
2014 2014 2014
Where Get TANK Info MOST OFTEN
E/L indicate significant differences between 2014 Express and Local data at the 95% confidence level. Note: No 2007 data available on Total.
Total Express (E) Local (L)
L
L
E
Local riders also use 331-TANK to obtain info.
Information Sources
TANK
2007 2007

More riders use the TANK website than in 2007. This was particularly true among Local Riders.
43
Total 2014: n=1056 Express 2014: n=406; 2007 n=350 Local 2014: n=444; 2007: n=312
Yes 79%
No 21%
Yes 91%
No 9%
Yes 72%
No 28%
Total Express (E) Local (L)
Used TANK Website 2014 Data (2007 Data)
E/L indicate significant differences between 2014 Express and Local data at the 95% confidence level. Note: No 2007 data available on Total.
(20%)
(80%)
(53%)
(47%) L
E

46%
15%
17%
13%
7%
2%
41%
11%
18%
17%
14%
NA
17%
27%
17%
15%
13%
12%
Total 2014: n=1056 Express 2014: n=406; 2007 n=350 Local 2014: n=444; 2007: n=312
Express riders most typically access the website once per month. Local Riders are more likely to be using the site once per week (27% versus 15%).
44
31%
21%
16%
14%
10%
8%
2014 2014 2014
Frequency Use TANK Website*
E/L indicate significant differences between 2014 Express and Local data at the 95% confidence level. * Frequency Use TANK Website only asked of respondents that have Used TANK Website. Note: No 2007 data available on Total.
Total Express (E) Local (L)
L
E
2007 2007
Once per Month
Once per Week
Only in Extreme Conditions
Before Taking New Route
Only Once
Before Each Bus Trip
34%
20%
8%
17%
16%
5%
E
E

88%
56%
18%
16%
3%
2%
1%
96%
48%
11%
11%
9%
5%
NA
88%
67%
18%
15%
5%
1%
1%
Total 2014: n=1056 Express 2014: n=406; 2007 n=350 Local 2014: n=444; 2007: n=312
Riders primary access the bus schedule or route information.
45
87%
61%
16%
16%
4%
2%
1%
2014 2014 2014
Type(s) of Info Accessed from TANK Website*
E/L indicate significant differences between 2014 Express and Local data at the 95% confidence level. * Type(s) of Info Accessed from TANK Website only asked of respondents that have Used TANK Website. Note: No 2007 data available on Total.
Total Express (E) Local (L)
L
2007 2007
Bus Schedule Information
Route Information
Purchase Bus Passes
View TANK Map
Provide Feedback/ Recommendations
Learn about TANK Organization
Learn Rider Etiquette
94%
58%
8%
18%
5%
3%
1%
3.9
4.1
4.1
4.2
4.3
4.4
1.0 2.0 3.0 4.0 5.0
3.6
3.8
4.0
4.0
4.2
4.2
1.0 2.0 3.0 4.0 5.0
Total 2014: n=1056 Express 2014: n=406; 2007 n=350 Local 2014: n=444; 2007: n=312
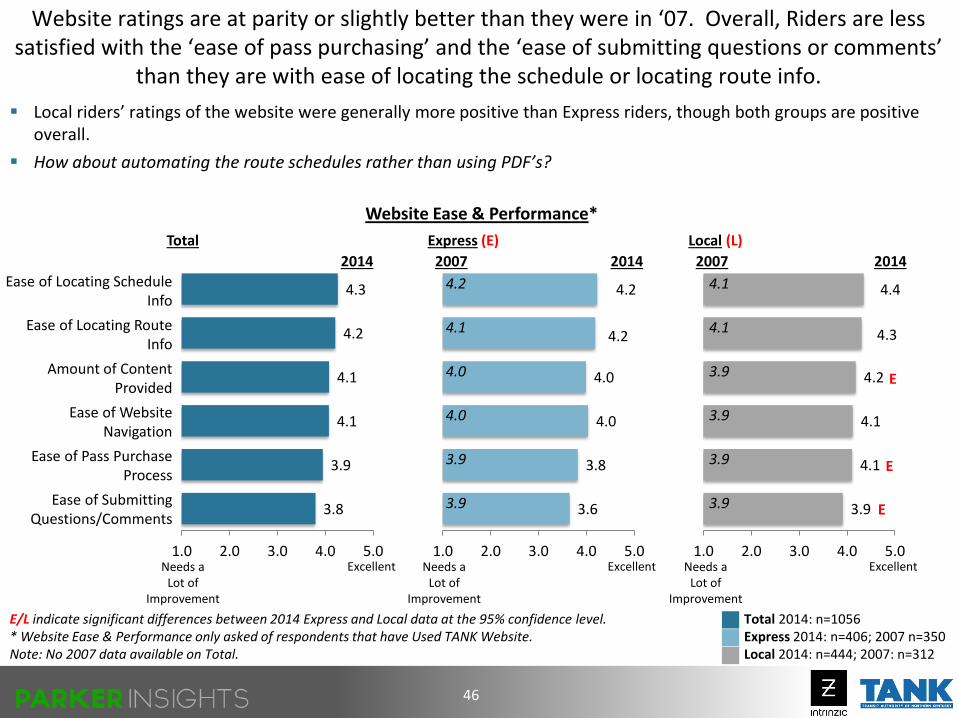
Website ratings are at parity or slightly better than they were in ‘07. Overall, Riders are less satisfied with the ‘ease of pass purchasing’ and the ‘ease of submitting questions or comments’
than they are with ease of locating the schedule or locating route info.
46
3.8
3.9
4.1
4.1
4.2
4.3
1.0 2.0 3.0 4.0 5.0
2014 2014 2014
Website Ease & Performance*
E/L indicate significant differences between 2014 Express and Local data at the 95% confidence level. * Website Ease & Performance only asked of respondents that have Used TANK Website. Note: No 2007 data available on Total.
Total Express (E) Local (L)
E
2007 2007
Local riders’ ratings of the website were generally more positive than Express riders, though both groups are positive overall.
How about automating the route schedules rather than using PDF’s?
Ease of Locating Schedule Info
Ease of Locating Route Info
Amount of Content Provided
Ease of Website Navigation
Ease of Pass Purchase Process
Ease of Submitting Questions/Comments
4.1
4.1
3.9
3.9
3.9
3.9
4.2
4.1
4.0
4.0
3.9
3.9
Needs a Lot of
Improvement
Excellent Needs a Lot of
Improvement
Excellent Needs a Lot of
Improvement
Excellent
E
E

E/L indicate significant differences between 2014 Express and Local data at the 95% confidence level. * Helpfulness only asked of respondents that Currently Receive/Have Signed Up for myTANK Alerts. Note: No myTANK Alerts data available from 2007.
42%
29%
22%
5%
3%
18%
33%
33%
12%
4%
Total 2014: n=1056 Express 2014: n=406 Local 2014: n=444
About one fourth (26%) have signed up to receive alerts. Express riders are more likely to use the service (42%).
47
25%
32%
30%
9%
4%
2014 2014 2014
Helpfulness of myTANK Alerts*
Total Express (E) Local (L)
Among users, Local riders are more positive concerning how helpful it has been (71% ‘Extremely/Very Helpful).
Extremely Helpful
Very Helpful
Somewhat Helpful
Not Very Helpful
Not Helpful at All
57% 71% 51% E
Yes 26%
No 74%
Yes 42% No
58%
Yes 18%
No 82%
Currently Receive/Have Signed Up for myTANK Alerts
Total Express (E) Local (L) 2014 2014 2014
E
L

About one out of 5 riders has downloaded the TANK app.
48
Yes 18%
No 82%
Yes 18%
No 82%
Yes 18%
No 82%
Total Express (E) Local (L)
Downloaded TANK App
E/L indicate significant differences between 2014 Express and Local data at the 95% confidence level. Note: No TANK App data available from 2007.
Total 2014: n=1056 Express 2014: n=406 Local 2014: n=444
TANK App

Southbank Shuttle Survey - Rider Profile: Who is riding TANK?
- Where, when, why, and how often are they Riding TANK? - What are Riders’ perceptions of TANK?

Southbank Shuttle Rider Profile: Who’s Riding the Shuttle?

Demographic Profile
Who’s Riding the Shuttle?
• One half (50%) are from Northern Kentucky, while approximately 40% reside in Cincinnati, and 10% are out-of-town.
• Equal gender split – 52% male, 48% female
• One half (49%) fall in the 25-44 age range.
• 39% with income > $50K – similar to Express/Local overall;
• The majority (69%) do have at least one vehicle in the household.
• Three fourths (73%) report being employed full time.
• Three fourths (73%) are White/Caucasian (note: this may be overstated due to lower coop rates among minorities).
Comparison versus ’07
• The age and gender mix is similar to ‘07. Although more out-of-town visitors were reported in ‘07 (30%), only 15% were out-of-town visitors in ‘04.
Southbank Shuttle Rider Profile
51
Media Habits & Practices
Nearly 90% of Shuttle riders access the Internet.
• Forty-three percent (43%) spend 5+ hours per week on the internet for pleasure (reading, visiting websites, etc.)
Three out of four (75%) use social media sites
• Two thirds (66%) are active on Facebook, one third (31%) on YouTube, one fourth (24%) use Google+, and one fifth (20%) use Instagram.
69% of Shuttle riders own a Smartphone.
• Ownership of iPhones and Androids is similar (29% and 31% respectively).
• Forty percent (40%) own a laptop and 31% own a tablet or E-reader.
Over one half (56%) mention ‘Smart Phone’ as one of their sources for News & Weather.
• Twenty-nine percent (29%) mention laptop/desktop as another source. Television is still mentioned by the largest number of riders (71%).

Southbank Shuttle Riding the Shuttle

Cincinnati Residents Cincinnati Resident riders ride the
Shuttle a little less frequently, but they also use it heavily for commuting to and from work and to a variety of other locations.
• Some riders also use the shuttle for leisure activities including going to Newport on the Levee, downtown Cincinnati, or sports events.
Unlike other residents, Cincinnati natives are most likely to take the Southbank Shuttle because they don’t drive. However, convenience and cost savings are also key motivators.
While most riders would walk or drive if the Southbank Shuttle was not available, Cincinnati Residents are more likely than Northern Kentucky Residents or Out-of-Towners to not make the trip they originally intended.
Cincinnati Residents are more likely to not own a vehicle and not be employed full time.
These riders also tend to have a lower income and are significantly more likely to be African American.
Key Ridership Targets Riding the Shuttle
55
Out-of-Town Visitors Not surprisingly, Out-of-Town riders are
more likely to be riding the Southbank Shuttle for the first time and be riding as a tourist.
These riders use Southbank Shuttle to avoid traffic, out of convenience, and to save parking costs. Some riders opt for the shuttle due to lack of familiarity with the area.
If the Southbank Shuttle was not available, these riders are most likely to walk or drive to their destination.
Out-of-Towners also place more importance on things like driver courtesy and appearance of the vehicle.
These riders are most likely to learn about TANK from their from their hotel concierge.
This ridership group is also most likely to be making $50K+.
Northern Kentucky Residents Northern Kentucky Resident riders are
generally more likely to use the Southbank Shuttle daily for commuting as well as to travel to a variety of destinations including to/from work, sports events, Newport on the Levee, downtown Cincinnati, and special events.
Unlike Cincinnati Residents, these riders are most likely to opt to take the Southbank Shuttle to save on parking costs or avoid traffic/driving hassles.
Since Northern Kentucky Residents ride the Southbank Shuttle out of convenience, they are more likely to simply drive to their destination if the shuttle was not available.
These riders tend to be slightly older, live in 2+ person households, and own at least one vehicle.
They are also more likely to be working full time and have higher incomes, with nearly half making $50K or more.

Nearly one half of Shuttle riders (43%) ride it daily for commuting and nearly all pay in cash.
56
Residency 2014 Data (2007 Data)
88%
9%
2%
2%
1%
0%
Cash
30 Day Pass
Day Pass
Reduced Fare
Gateway U-Pass
NKU U-Pass
Fare Payment Method
43%
24%
12%
11%
8%
3%
Daily for Commuting
Weekly
Monthly
First Time
1–2 Times per Year
Daily as a Tourist
Frequency Ride Southbank Shuttle
2014: n=260 2007: n=261 Note: No Fare Payment Method data available from 2007.
2007
27%
20%
15%
22%
12%
4%
2014 2014
Northern Kentucky Resident
50%
Cincinnati Resident
39%
Out-of-Town Visitor
10%
(38%) (32%)
(30%)
Frequency of riding is up versus 2007, but this could be due to the greater prevalence of out-of-town riders in 2007.

3 primary reasons for riding the Southbank Shuttle are ‘Save on parking costs’, ‘Avoid traffic/driving hassles’, and ‘convenient to destination’.
57
52%
35%
30%
23%
20%
18%
13%
13%
7%
2%
8%
To/From work
Newport on the Levee
Downtown Cincinnati
Reds Games
Bengals Games
Main Strasse Village
Special Events
Bellevue Area
Convention Center(s)
Freedom Center
Other
Destination Points
45%
39%
39%
28%
27%
18%
17%
17%
14%
12%
11%
4%
2%
Save Parking Costs
Avoid Traffic/Driving Hassles
Convenient to Destination
Don’t Drive
Save Gas Costs
Reduce Vehicle Expenses
Express Route to Activity
Relax/Less Stress
Improve Environment
Avoid Driving in Bad Weather
Backup Transportation
Visitor/Unfamiliar with City
Other
Reasons Ride Southbank Shuttle
40%
36%
17%
12%
8%
5%
10%
Drive
Walk/Wheelchair
Taxi
Ride with a Friend
Bicycle
Park Closer
Would Not Make Trip
Alternative Transportation if Shuttle Wasn't Available
2014: n=260 2007: n=261 Note: No Alternative Transportation if Shuttle Wasn't Available data available from 2007.
2007
34%
35%
20%
20%
36%
11%
11%
6%
5%
1%
NA
2007 50% 43% 33% 20%
33% 15% NA
23% 15% NA NA
17% NA
2014
2014
2014

GAP Analysis: Importance and Performance
58
* Gap = Performance Top 2 Box % - Importance Top 2 Box % * 100 Note: Unable to line up 2014 Importance/Performance Gap Analysis data with 2007. 2014: n=260
Excellent
Needs a Lot of Improvement
TANK Performance 4.6 Fare/Cost 4.4 Driver Courtesy 4.4 Destinations Served 4.3 Frequency of Service 4.3 Vehicle Appearance 4.0 Hours of Service
5
1
Gap Analysis
Attribute Importance
(Top 2 Box%) Performance (Top 2 Box%)
Gap*
Vehicle Appearance 59% 84% +26
Driver Courtesy 80% 87% +7
Fare/Cost 86% 90% +4
Destinations Served 90% 85% -5
Frequency of Service 93% 85% -8
Hours of Service 91% 72% -19
Falls Short of Rider Expectations
Surpasses Rider Expectations
4
3
2
Perceptions of the Shuttle are very high overall, higher than Express/Local TANK ratings. If one aspect of the shuttle was to be improved, lengthening the hours would drive the greatest satisfaction.

Southbank Shuttle Marketing & Communication
36%
33%
11%
7%
6%
3%
0%
4%
Personally Saw Bus
Friend/Family/Co-Worker
Street Sign
TANK Website
Hotel Concierge
Print Advertisement
Convention Group
Other
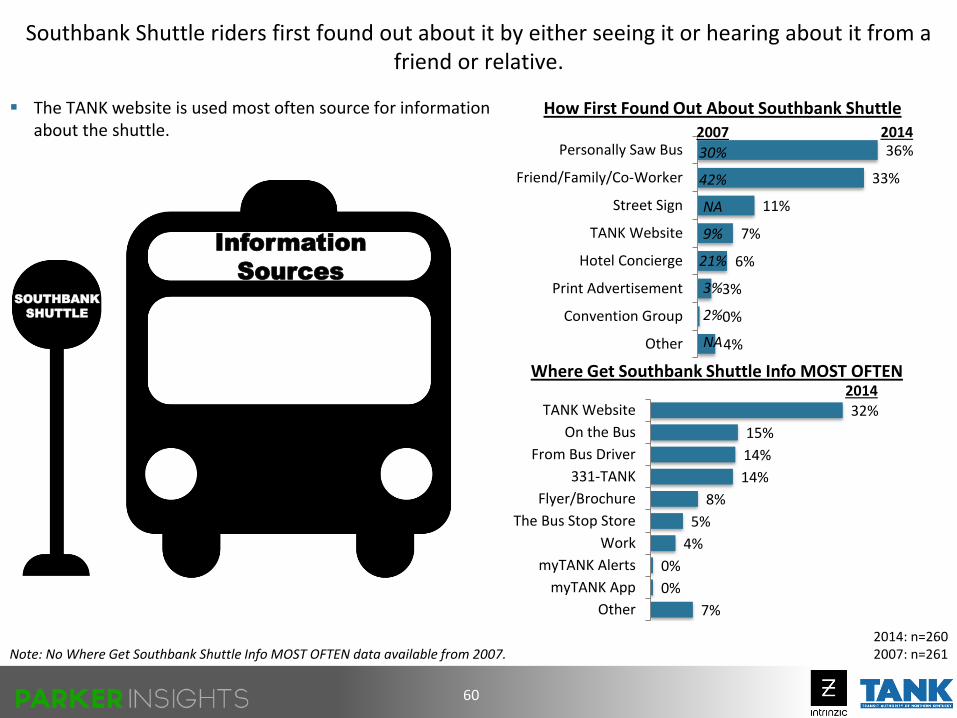
Southbank Shuttle riders first found out about it by either seeing it or hearing about it from a friend or relative.
60
32%
15%
14%
14%
8%
5%
4%
0%
0%
7%
TANK Website
On the Bus
From Bus Driver
331-TANK
Flyer/Brochure
The Bus Stop Store
Work
myTANK Alerts
myTANK App
Other
2014: n=260 2007: n=261
How First Found Out About Southbank Shuttle
Where Get Southbank Shuttle Info MOST OFTEN
Note: No Where Get Southbank Shuttle Info MOST OFTEN data available from 2007.
Information
Sources
SOUTHBANK
SHUTTLE
2007
30%
42%
NA
9%
21%
3%
2%
NA
2014
2014
The TANK website is used most often source for information about the shuttle.

Use of the TANK website has doubled versus ‘07.
61
25%
21%
20%
19%
8%
8%
Only Once
Once per Month
Only in Extreme Conditions
Once per Week
Before Each Bus Trip
Before Taking a New Route
Yes 53%
No 47%
Used TANK Website 2014 Data (2007 Data)
(27%) (73%)
2014: n=260 2007: n=261 * Frequency Use TANK Website only asked of respondents that have Used TANK Website.
TANK Website
Frequency Use TANK Website*
2007
32%
8%
15%
26%
13%
7%
2014

83%
51%
17%
5%
2%
2%
0%
Get Time Schedule
Get Route Info
View TANK Map
Purchase Bus Passes
ProvideFeedback/Recommendations
Learn about TANKOrganization
Learn Rider Etiquette
2007
68%
52%
24%
16%
15%
5%
NA
62
4.0
4.0
4.0
4.1
4.2
4.2
1.0 2.0 3.0 4.0 5.0
Ease of SubmittingQuestions/Comments
Ease of Pass PurchaseProcess
Ease of Website Navigation
Amount of Content Provided
Ease of Locating ScheduleInfo
Ease of Locating Route Info
2014: n=260 2007: n=261 * Type(s) of Info Accessed from TANK Website & Website Ease & Performance only asked of respondents that have Used TANK Website.
Type(s) of Info Accessed from TANK Website* Website Ease & Performance*
2014 2014 2007
4.2
4.2
4.2
4.1
3.9
4.0
Needs a Lot of Improvement
Excellent
Most riders access the TANK website to get the Time Schedule or Route Info.
Ratings are generally very positive for the website, averaging 4.0 or higher on all of the attributes. Ratings are also similar to those observed in ’07.

* Helpfulness only asked of respondents that Currently Receive/Have Signed Up for myTANK Alerts. Note: No myTANK Alerts data available from 2007.
Only a small percentage (11%) have signed up for myTANK Alerts. The majority who have, find the alerts to be very helpful.
63
Yes 11%
No 89%
Currently Receive/Have Signed Up for myTANK Alerts
24%
44%
28%
4%
0%
Extremely Helpful
Very Helpful
Somewhat Helpful
Not Very Helpful
Not Helpful at All
Helpfulness of myTANK Alerts*
myTANK Alerts
2014: n=260
68% of myTANK Alert Users find it helpful.

The large majority of riders found the map/brochure easy to understand and that it contained all of the information they needed.
64
Yes 57%
No 43%
Southbank Shuttle Map/Brochure
Easy 96%
Not Easy 4%
All of the Info 82%
Some of the Info 18%
Did Not
Have Info 1%
(50%)
(50%)
Ease of Understanding* 2014 Data (2007 Data)
Contained Needed Information* 2014 Data (2007 Data)
Read Map/Brochure 2014 Data (2007 Data)
(7%)
(93%)
(24%) (3%)
(74%)
2014: n=260 2007: n=261 * Ease of Understanding & Contained Needed Information only asked of respondents that have Read Map/Brochure.

TANK Non-Rider Survey Non-Rider Profile
Media Habits & Practices Barriers to Riding TANK

Non-Riders Who’s not riding TANK?

Demographic Profile
The majority, 3 out of 4, own multiple vehicles (73% versus 33%).
Higher income relative to Riders, nearly 70% have incomes >$50K.
Higher proportion of seniors (21% - 65+ versus 3% - 65+)
Less likely to be employed full time (47% versus 73%) and more likely to be retired.
White/Caucasian skew (98% versus 69%).
Non-Rider Profile
67
Media Habits & Practices
Non-riders have high penetration of Smart Phones (77%)
Over half (56%) indicate Smart Phone as a source (among others) for news & weather.
They are active on Social Media: 76% - Facebook, 38% - YouTube;

Non-riders are dispersed/fragmented across a variety of cities, towns, and neighborhoods.
70
City/Neighborhood: Reside Work: Independence 11% Cincinnati 9%
Florence 10% Florence 6%
Union 8% Covington 4%
Burlington 6% Hebron 4%
Villa Hills 6% Erlanger 4%
Cold Spring 5% Blue Ash, Cincinnati 3%
Covington 5% Burlington 3%
Erlanger 4% Clifton 2%
Elsmere 4% Crescent Springs 2%
Edgewood 4% Fort Mitchell 2%
Fort Mitchell 4% Independence 2%
California 3% Mount Auburn, OH 2%
Fort Thomas 3% Newport 2%
Highland Heights 3% Union 2%
Ludlow 2% Alexandria 2%
Taylor Mill 2% Downtown Cincinnati 2%
Bellevue 2% Edgewood 2%
Alexandria 1% Taylor Mill 2%
Birmingham 1% Anderson Township, Cincinnati 1%
Dayton, near Ervin & 6th Ave 1% Birmingham 1%
Dixie Hwy & Maher Road, Walton, KY 1% Cleves 1%
Fort Wright 1% CVG Airport 1%
Hebron 1% Dayton, KY 1%
Lakeside Park 1% Evendale 1%
Latonia 1% Ft. Thomas 1%
LAWRENCEBURG, INDIANA 1% Glenridge 1%
Monte Casino 1% Hartwell, OH 1%
Newport 1% Highland Heights 1%
Oakbrook 1% Ludlow KY 1%
Park Hills 1% Madisonville, Cincinnati 1%
Richwood 1% Norwood 1%
Silver Grove. 1% Thomas More Parkway, Crestview Hills 1%
South Newport 1% University of Cincinnati 1%
southern Campbell County 1% Walnut Hills, Cincinnati 1%
Southgate 1% Walton, KY 1%
Spring valley 1% West End Cincinnati 1%
Verona 1% Wilder 1%
Wilder 1% Other (Homemaker, Unemployed, Travel, Work from home) 15%
Retired 15% 2014: n=112

Non-Riders - Awareness and Perceptions of TANK
- Barriers to riding TANK

About 40% of TANK non-riders are ‘never’ riders. Nearly 60% are ‘lapsed’ riders, having ridden TANK but not in the past 6 months.
72
94%
38%
16%
14%
7%
4%
4%
Park&Ride service
Bike&Ride
College U-Pass program
Special events
RAMP
Guaranteed ride home
myTANK alerts
TANK Services Aware Of
4%
54%
41%
Six months ago to twelve months ago
More than twelve months ago
Have never used TANK or the Southbank Shuttle
Last Time Used TANK or Southbank Shuttle
2014: n=112 Note: No data available from 2007.
Non Riders are universally aware of ‘Park & Ride’. ‘Bike & Ride service has the next highest level of awareness at 38%.

Non-riders’ most positive perceptions of TANK relate to safety, reliability, and cost.
73
Excellent
Needs a Lot of Improvement
5
1
4
3
2
63%
62%
59%
57%
56%
52%
51%
50%
49%
49%
48%
47%
46%
45%
42%
Safety
Schedule reliability
Fare/cost
Driver courtesy
Park&Ride locations
Easy accessible route…
Travel time
TANK website
Locations near home
Number of stops
Service frequency
Bus comfort
Locations near work
Bus cleanliness
Customer service help number
TANK Performance
3.8
3.8
3.7
3.7
3.7
3.6
3.5
3.6
3.5
3.6
3.5
3.5
3.4
3.5
3.5
T2B% Mean
2014: n=112 Note: No data available from 2007.
Perceptions of bus comfort, cleanliness, having locations near work, and customer service help number are lower.

74
36%
30%
28%
26%
26%
24%
22%
20%
19%
17%
13%
13%
11%
11%
9%
9%
8%
5%
4%
4%
It takes the bus longer to get where I’m going
No control over my schedule when riding
I can’t run errands on the way home
Bus does not go to my destination
Having to wait in the rain or cold for the bus
Bus stop is too far away to make it worthwhile
I live close enough to destination
Can’t use it if I have appointments throughout the …
I can’t shop at multiple stores/comparison shop …
I feel uncomfortable with the types of people…
Can’t carry larger items or shopping bags
It’s a hassle to change buses
The length of ride is too long
Can’t pick up the kids at their activities
Bus doesn’t run when needed
I don’t feel safe on the bus
Hard to figure out their schedule
Bus is not clean/dirty, smells
Bus does not run frequently enough
Too crowded
Barriers to Riding TANK
15%
10%
2%
14%
4%
16%
16%
3%
6%
3%
2%
0%
1%
3%
1%
3%
1%
2%
0%
2%
Most Important Reason
2014: n=112 Note: No data available from 2007.
Taking longer to get where I’m going, Lack of control over the schedule, Not going to their destination, Bus stop is too far away, and Live close enough to destination.
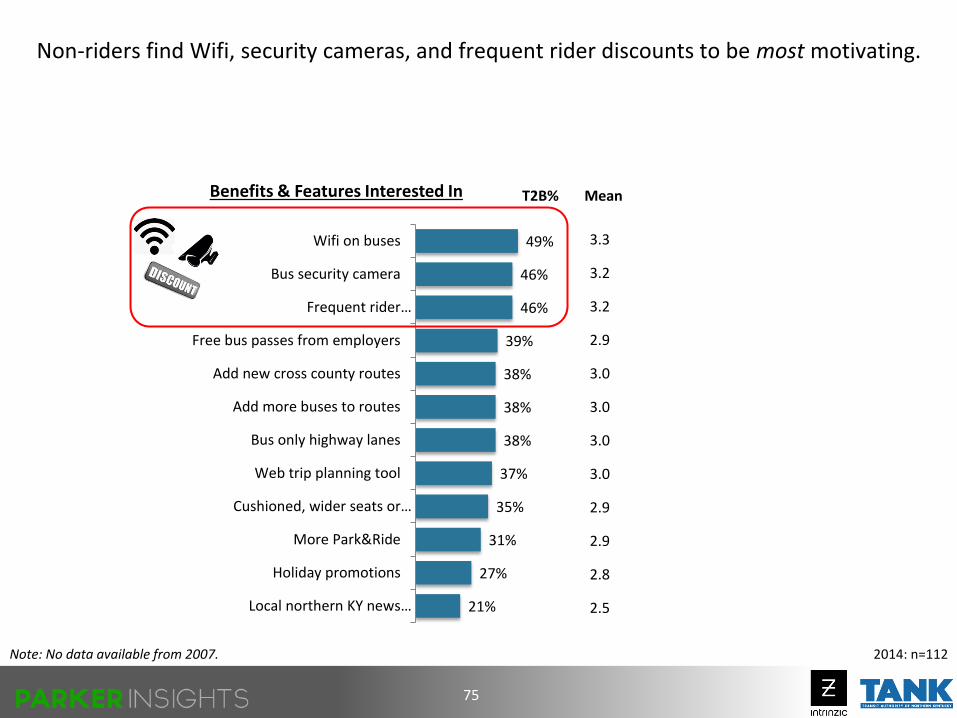
49%
46%
46%
39%
38%
38%
38%
37%
35%
31%
27%
21%
Wifi on buses
Bus security camera
Frequent rider…
Free bus passes from employers
Add new cross county routes
Add more buses to routes
Bus only highway lanes
Web trip planning tool
Cushioned, wider seats or…
More Park&Ride
Holiday promotions
Local northern KY news…
75
Benefits & Features Interested In
2014: n=112 Note: No data available from 2007.
T2B% Mean
3.3
3.2
3.2
2.9
3.0
3.0
3.0
3.0
2.9
2.9
2.8
2.5
Non-riders find Wifi, security cameras, and frequent rider discounts to be most motivating.

76
84%
72%
68%
64%
61%
56%
Provides transportation to thosewho can't drive due to physical or
legal restriction
Supports the local economy byproviding economical means of
transportation
Reduces traffic congestion andimproves parking downtown
Helps improve air quality andreduce pollution
Reduces wear and tear on roads
Supports local entertainment andculture by getting people to events
and locations
2014: n=112 Note: No data available from 2007.
T2B% Mean
4.4
4.0
4.0
3.8
3.7
3.7
Describing TANK
Non-riders are very positive about the benefits that TANK provides to the community.