Embed Size (px)
Citation preview
GREENMAX CAPITAL ADVISORS
1
Tanzania Market Intelligence Final Report
December 2013
GREENMAX CAPITAL ADVISORS 2
CORPORATE HEADQUATERS
540 President Street 3rd floor
Brooklyn, NY 11215, USA
Phone: +1 646 – 564 3500
Fax: +1 646 – 998-8023
www.greenmaxcap.com
EAST AFRICA REGIONAL OFFICE
Rue Akagera
P.O Box 3446
Kigali, Rwanda
Phone: +25) 252 577757
Fax: +250 252 577758
The findings, interpretations, and conclusions
expressed in this paper are entirely those of the
authors. They do not necessarily represent the view of
the Lighting Africa Program, its affiliated organizations,
or the governments they represent.
GREENMAX CAPITAL ADVISORS
3
ACKNOWLEDGEMENTS
Partners
GreenMax Capital Advisors prepared the Lighting Africa Tanzania Market Intelligence Report, with support from the Rural Energy Agency in Tanzania. Surveys and interviews were conducted with a wide range of stakeholders, among them representatives from the energy sector in Tanzania, private enterprises and civil societies dealing with off-grid lighting products and services, and local community members in various regions within Tanzania.
GREENMAX CAPITAL ADVISORS 4
Table of Contents
ABBREVIATIONS & ACRONYMS ............................................................................................................. 6
EXECUTIVE SUMMARY ............................................................................................................................ 8
1.0. INTRODUCTION ................................................................................................................................. 17
2.0. RESEARCH GOALS & METHODOLOGY ..................................................................................... 20
3.0. STATE OF ELECTRIFICATION IN TANZANIA ........................................................................... 21
3.1. Access to Electricity ............................................................................................................. 21 3.2. Electricity Generation ......................................................................................................... 23 3.3. Power System Development Plans ....................................................................................... 25 3.4. Rural Renewable Energy Projects ....................................................................................... 26
4.0. BOTTOM OF THE PYRAMID CONSUMER PROFILE ................................................................. 28
4.1. Rural and Peri-Urban Populations ...................................................................................... 28 4.2. Income Generation among BOP .......................................................................................... 29 4.3. Household Budget ................................................................................................................ 33
5.0. EXISTING LIGHTING SOLUTIONS .............................................................................................. 36
5.1. Common Lighting Options .................................................................................................. 36 5.2. Characteristics of the Prevalent Lighting Options for the BOP .......................................... 37 5.3. Alternative Lighting Devices in the Tanzanian Market ...................................................... 39
6.0. LIGHTING ECONOMICS ............................................................................................................... 42
6.1. Comparative Life Cycle Costs of Lighting Solutions ........................................................... 42 6.2. Consumer Attitudes Toward Financing Alternatives .......................................................... 44
7.0. MARKET SIZING AND POTENTIAL ............................................................................................ 47
7.1. Market Potential and its Key Characteristics ..................................................................... 47 7.3. Estimation of market size for the next five years ................................................................. 50
8.0. EXISTING DISTRIBUTION MODELS FOR SOLAR LIGHTING PRODUCTS ............................. 53
8.1. Supply Chain Configurations .............................................................................................. 53 8.2. Other Important Players in the Value Chain ...................................................................... 55 8.3. Commercial Distribution Models for Off-Grid Lighting and their Benefits ....................... 59 8.4. Most Promising Distribution Models ................................................................................... 62 8.5. Underlying Barriers to Scaling up Distribution of Solar Lanterns ..................................... 64
9.0. COMPETITIVENESS OF THE MARKETS .................................................................................... 66
9.1. Distributors of Solar Lighting Products .............................................................................. 66 9.2. Key Commercial Distribution Partners in the Regions ....................................................... 66 9.3. Common Products in the Market……………………………………………………….67 ..... 66 9.4. Direct and Indirect Competition…………………………………………………………… ... 68 9.5. Demand trends .................................................................................................................... 70 9.6. Competition from Alternative Lighting Products ............................................................... 71
Tanzania: Market Intelligence
GREENMAX CAPITAL ADVISORS 5
10.0. KEY STAKEHOLDERS FOR THE OFF-GRID LIGHTING MARKET AND POLICY ISSUES . 73
10.1. Key Stakeholders for the Off-Grid Market ...................................................................... 73 10.2. Policies for Lighting Products .......................................................................................... 75 10.2.1 Bonded Warehousing Policy in relation to Lighting Products ......................................... 76
11.0. CONCLUSIONS AND RECOMMENDATIONS .......................................................................... 77
APPENDICES…………………………………………………………………………………………………80
GREENMAX CAPITAL ADVISORS 6
ABBREVIATIONS & ACRONYMS
AfDB African Development Bank BOP Bottom of the Pyramid BOT Bank of Tanzania BRELA Business Registration & Licensing Agency CBO Community Based Organization COSTECH Commission for Science &Technology CRDB Cooperative Rural Development Bank DANIDA Danish International Development Agency ESRF Economic &Social Research Foundation EWURA Energy Water Utilities Regulatory Authority FIT Feed-in Tariff GoT Government of Tanzania GWh Gigawatt-hour HBS Household Budget Survey IFC International Finance Corporation IPPs Independent Power Producers KWh Kilowatt-hour kWp Kilowatt-peak LA Lighting Africa Program LAMIM Lighting Africa Market Intelligence Materials LCC Life Cycle Cost LED Light Emitting Diode LV-Tariff Low-Voltage Tariff MEM Ministry of Energy and Minerals M&E Monitoring and Evaluation MFIs Micro financing Institutions MITM Ministry of Industry Trade & Marketing MOF Ministry of Finance MSME Micro, Small and Medium Enterprises MW Megawatt NBS National Bureau of Statistics NEM National Environmental Management Council NGOs Non-Governmental Organizations NSGRP National Strategy for Growth and Reduction Poverty PPPs Public Private Partnerships PV Photovoltaic REA Rural Electrification Agency REB Rural Energy Board REPOA Research on Poverty Alleviation SACCOS Savings & Credit Cooperative Organization SIDA Swedish International Development Cooperation Agency SHS Solar Home System SPP Small Power Producers SME Small& Medium Size Enterprise TANESCO Tanzania Electricity Supply Company TAREA Tanzania Renewable Energy Association TaTEDO Tanzania Traditional Energy Development and Environment Organization TBS Tanzania Bureau of Standards TIC Tanzania Investment Center TIRDO Tanzania Industrial Research and Development Organization TRA Tanzania Revenue Authority TSD Tanzania Socioeconomic Database TSHs Tanzania Shillings
Tanzania: Market Intelligence
GREENMAX CAPITAL ADVISORS 7
USD United States Dollar UDSM University of Dar es salaam UNFCCC United Nations Framework Convention on Climate Change UNDP United Nations Development Programme URT United Republic of Tanzania
CURRENCY EQUIVALENTS
Currency Unit = Tanzanian Shilling (TSh)
USD 1 = TSh 1,6001
1 In 2008, following the financial crisis the exchange rate fell to TSh 1162 = USD1. It has been fluctuating around TSh 1600 = USD1 for the past 3 -4 years, and this is the rate that is used in the report

GREENMAX CAPITAL ADVISORS 8
EXECUTIVE SUMMARY
GreenMax Capital Advisors (GreenMax) was contracted by the Lighting Africa Program to perform the Tanzania
Market Intelligence study. The purpose of the study is to provide detailed information on the utilization and cost
of current forms of lighting found amongst the “Bottom of the Pyramid (BOP)” population in Tanzania, the off-grid
sustainable lighting products that have been introduced into the Tanzanian market, consumer attitudes towards
these products and the supply and distribution chains that deliver them to the rural and peri-urban areas where
the vast majority of the BOP consumers live and work. The goal is to inform stakeholders of key market issues
and recommend how program interventions can support viable distribution models that will significantly increase
the use of off-grid sustainable lighting products in Tanzania.
Key Findings of the Tanzania Market Intelligence Study Include:
State of Electrification and Lighting Access
• Only 21% of the Tanzanian population currently has access to electricity. There is a significant rural-
urban gap as only 7% of the total electrification reaches rural areas, while 70% percent of the total
population lives in these areas. Of the 25 mainland regions in Tanzania, the Dar es Salaam region has
the greatest access to electricity at 59% of all households in the region with grid connection. Some
regions however lag far behind, with Kagera, Kigoma, Lindi, Manyara, Mtwara, Mwanza, Rukwa and
Shunyanga all registering less than 5% access to electricity.
• Access to electricity correlates with the rate of literacy, for example Dar es Salaam, which has the
highest access rate of 59% has a literacy rate of approximately 91%. Arusha, which follows with the
next highest access rate of 11%, has a literacy rate of 73%. The Lindi region, which has the lowest
electricity access rate of 5%, also has the lowest rate of literacy, which is 60%.
• Over the last decade the demand for electricity has grown at a considerable rate due to population
growth and the growth tendency of household social status in general. However, lighting provision has
been inadequate to meet the need. The total units of electricity generated currently add up to around
5,700 GWh but due to losses, the actual amount of electricity distributed, is only around 4,200 GWh.
• The Government, through the Ministry of Energy and Minerals, the Rural Energy Agency, TANESCO,
and various development partners, is undertaking several electrification projects in the provinces to
increase generation capacity by 3262 MW by the year 2020. However, this will only supply about 37% of
the national demand, mainly in urban areas.
• The lack of sustainable energy sources and lighting services reduces national productivity; for example,
if children from rural households do not have enough light to study at night, they are losing opportunities
to improve their education, and consequently their living standards. Likewise, micro enterprises in peri-
urban areas spend more on meeting energy costs than on investments to expand their business
activities.
Profile of Bottom of Pyramid (BOP) Consumers
Tanzania: Market Intelligence
GREENMAX CAPITAL ADVISORS 9
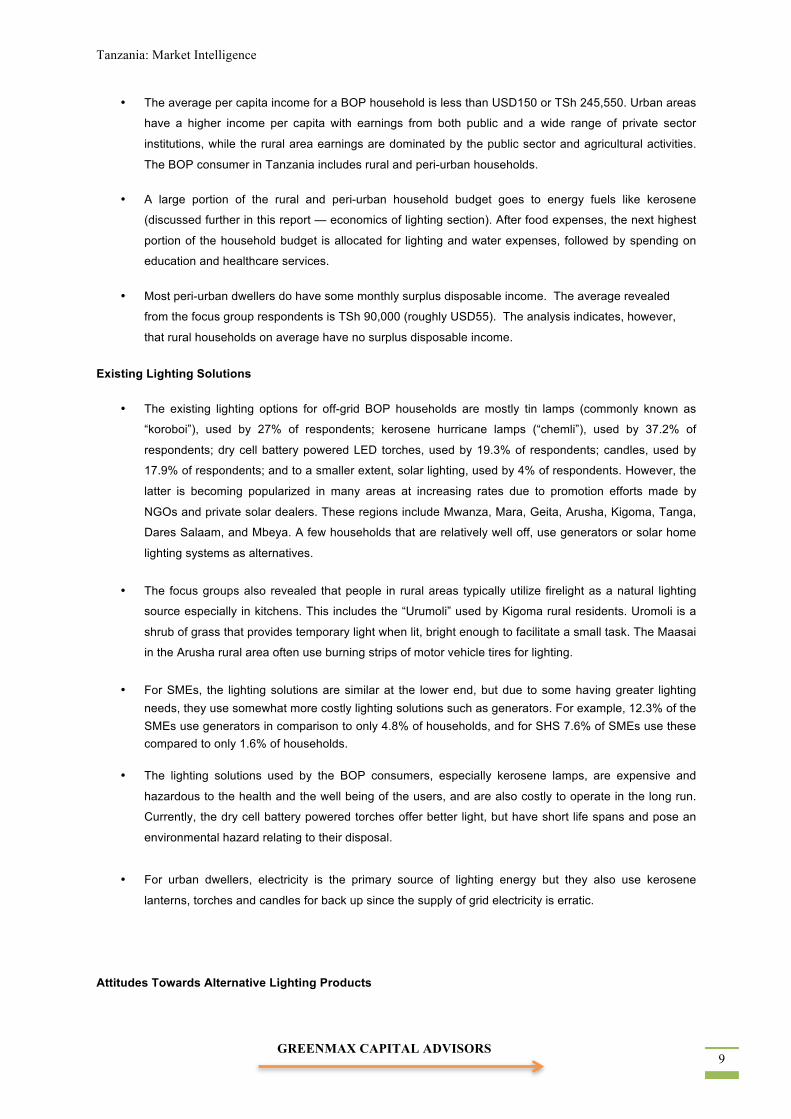
• The average per capita income for a BOP household is less than USD150 or TSh 245,550. Urban areas
have a higher income per capita with earnings from both public and a wide range of private sector
institutions, while the rural area earnings are dominated by the public sector and agricultural activities.
The BOP consumer in Tanzania includes rural and peri-urban households.
• A large portion of the rural and peri-urban household budget goes to energy fuels like kerosene
(discussed further in this report — economics of lighting section). After food expenses, the next highest
portion of the household budget is allocated for lighting and water expenses, followed by spending on
education and healthcare services.
• Most peri-urban dwellers do have some monthly surplus disposable income. The average revealed
from the focus group respondents is TSh 90,000 (roughly USD55). The analysis indicates, however,
that rural households on average have no surplus disposable income.
Existing Lighting Solutions
• The existing lighting options for off-grid BOP households are mostly tin lamps (commonly known as
“koroboi”), used by 27% of respondents; kerosene hurricane lamps (“chemli”), used by 37.2% of
respondents; dry cell battery powered LED torches, used by 19.3% of respondents; candles, used by
17.9% of respondents; and to a smaller extent, solar lighting, used by 4% of respondents. However, the
latter is becoming popularized in many areas at increasing rates due to promotion efforts made by
NGOs and private solar dealers. These regions include Mwanza, Mara, Geita, Arusha, Kigoma, Tanga,
Dares Salaam, and Mbeya. A few households that are relatively well off, use generators or solar home
lighting systems as alternatives.
• The focus groups also revealed that people in rural areas typically utilize firelight as a natural lighting
source especially in kitchens. This includes the “Urumoli” used by Kigoma rural residents. Uromoli is a
shrub of grass that provides temporary light when lit, bright enough to facilitate a small task. The Maasai
in the Arusha rural area often use burning strips of motor vehicle tires for lighting.
• For SMEs, the lighting solutions are similar at the lower end, but due to some having greater lighting needs, they use somewhat more costly lighting solutions such as generators. For example, 12.3% of the SMEs use generators in comparison to only 4.8% of households, and for SHS 7.6% of SMEs use these compared to only 1.6% of households.
• The lighting solutions used by the BOP consumers, especially kerosene lamps, are expensive and
hazardous to the health and the well being of the users, and are also costly to operate in the long run.
Currently, the dry cell battery powered torches offer better light, but have short life spans and pose an
environmental hazard relating to their disposal.
• For urban dwellers, electricity is the primary source of lighting energy but they also use kerosene
lanterns, torches and candles for back up since the supply of grid electricity is erratic.
Attitudes Towards Alternative Lighting Products
GREENMAX CAPITAL ADVISORS 10
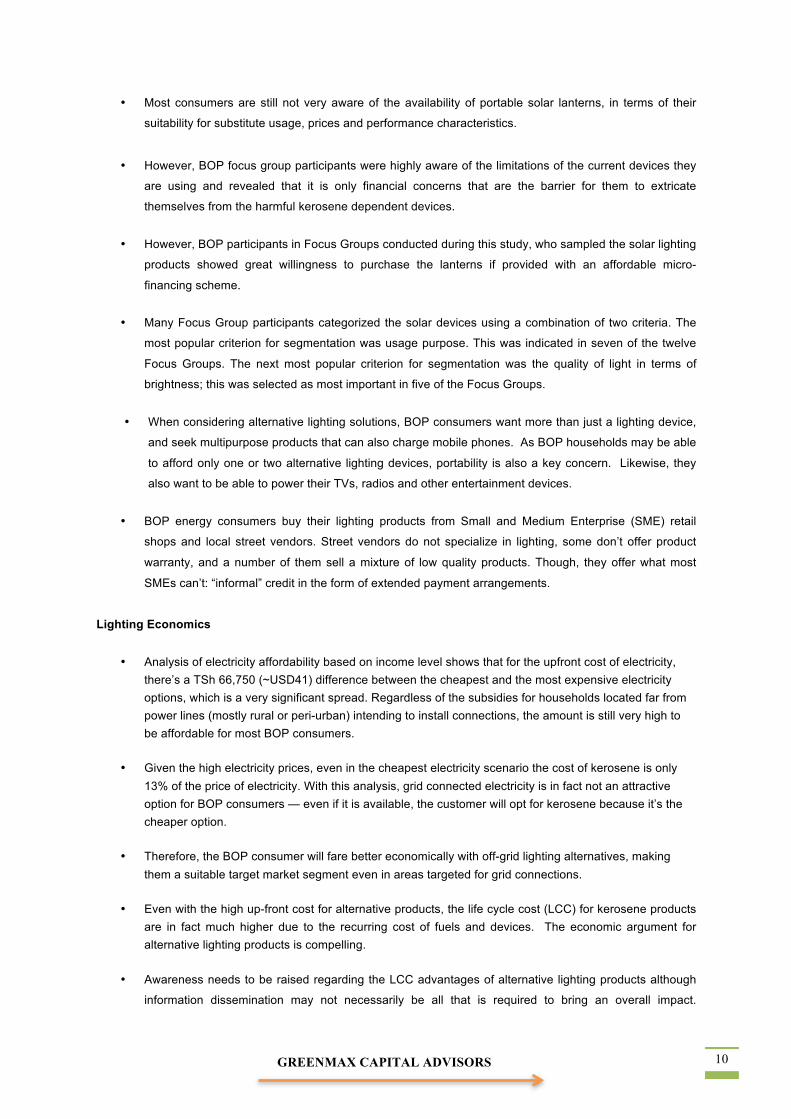
• Most consumers are still not very aware of the availability of portable solar lanterns, in terms of their
suitability for substitute usage, prices and performance characteristics.
• However, BOP focus group participants were highly aware of the limitations of the current devices they
are using and revealed that it is only financial concerns that are the barrier for them to extricate
themselves from the harmful kerosene dependent devices.
• However, BOP participants in Focus Groups conducted during this study, who sampled the solar lighting
products showed great willingness to purchase the lanterns if provided with an affordable micro-
financing scheme.
• Many Focus Group participants categorized the solar devices using a combination of two criteria. The
most popular criterion for segmentation was usage purpose. This was indicated in seven of the twelve
Focus Groups. The next most popular criterion for segmentation was the quality of light in terms of
brightness; this was selected as most important in five of the Focus Groups.
• When considering alternative lighting solutions, BOP consumers want more than just a lighting device,
and seek multipurpose products that can also charge mobile phones. As BOP households may be able
to afford only one or two alternative lighting devices, portability is also a key concern. Likewise, they
also want to be able to power their TVs, radios and other entertainment devices.
• BOP energy consumers buy their lighting products from Small and Medium Enterprise (SME) retail
shops and local street vendors. Street vendors do not specialize in lighting, some don’t offer product
warranty, and a number of them sell a mixture of low quality products. Though, they offer what most
SMEs can’t: “informal” credit in the form of extended payment arrangements.
Lighting Economics
• Analysis of electricity affordability based on income level shows that for the upfront cost of electricity, there’s a TSh 66,750 (~USD41) difference between the cheapest and the most expensive electricity options, which is a very significant spread. Regardless of the subsidies for households located far from power lines (mostly rural or peri-urban) intending to install connections, the amount is still very high to be affordable for most BOP consumers.
• Given the high electricity prices, even in the cheapest electricity scenario the cost of kerosene is only 13% of the price of electricity. With this analysis, grid connected electricity is in fact not an attractive option for BOP consumers — even if it is available, the customer will opt for kerosene because it’s the cheaper option.
• Therefore, the BOP consumer will fare better economically with off-grid lighting alternatives, making them a suitable target market segment even in areas targeted for grid connections.
• Even with the high up-front cost for alternative products, the life cycle cost (LCC) for kerosene products are in fact much higher due to the recurring cost of fuels and devices. The economic argument for alternative lighting products is compelling.
• Awareness needs to be raised regarding the LCC advantages of alternative lighting products although
information dissemination may not necessarily be all that is required to bring an overall impact.
Tanzania: Market Intelligence
GREENMAX CAPITAL ADVISORS 11
Financing will need to be offered to a majority of BOP consumers to allow them to cover the purchase
costs, as the high up-front prices of solar lighting products put them out of reach of many of the targeted
population. In fact, the study determined that this is the biggest barrier.
• Household incomes of BOP consumers clearly indicate that coming up with sufficient funds all at once to purchase an alternative lighting device would be problematic for rural BOP consumers. However, when consumers in the household survey were asked about how likely they are to be willing to purchase solar lighting products when financing is offered, 72 percent across both rural and peri-urban households said they will either definitely buy or perhaps might buy.
• Of the responding SMEs, 54 percent said they are definitely willing to purchase alternative lighting products when credit is offered.
• These attitudes provide a striking endorsement of how important offering credit solutions should be in any large-scale marketing effort for alternative lighting products.
• Households and SMEs prefer to take loans either through Savings and Credit Cooperative Societies (SACCOS) or local banks, according to FGDs and survey responses.
Market Size and Potential
• The “technical potential” of the market for alternative lighting products may be considered to be as large
as the number of households and SMEs that are today not connected to the grid. The Government
estimates that the number of households without grid connection today remains over 7.8 million. One
estimate of the total number of SME’s is approximately 3.1 million. There is no reliable data on how
many of these SMEs are not grid connected, but if the rate of electrification is taken at the overall
country average, then one may assume that roughly 2.45 million SME’s are without grid supplied
power.
• The price range of all alternative lighting products on the market was estimated in a very wide range
between USD 5 – 250, owing to significant differences in type, features and quality. Since many of the
products are concentrated at the lower end, the median price range can reasonably be assumed to be
at USD 50.
• Using this median pricing and information culled from supply chain interviews the study team estimates
the current demand value for 2014 to be USD 9,150,000 and the projected national demand five years
from now to be USD 21,250,000. This would imply that the market is expected to grow 2.3 times
according to the surveyed dealers.
• The study team’s estimate of total sales across five years is approximately USD 82,000,000. This may
be a conservative estimate but it at least indicates the trends of sales in terms of growth rate.
Supply and Distribution of Alternative Lighting Products
GREENMAX CAPITAL ADVISORS 12
• The supply chain for off-grid lighting products to BOP populations has until recently involved mostly the
government and NGOs; today, however, several private solar distributors have become engaged in
targeting this market segment and some have managed to systematically deliver off-grid lighting
alternatives in some rural and peri-urban areas;
• The general supply chain for alternative lighting products consists of three or four levels, with importers and national distributors at the top end of the chain and retailers and street hawkers interfacing with customers at the end;
• Four or five significant private national players have emerged, and they handle the largest portion of
product turnover. Their characteristics are as follows:
o Operate both as national and regional distributors
o Service high and middle-income customers, and only recently began to engage with BOP market segments
o Evaluate product performance and some offer warranties
o Expand distribution network to other neighboring countries in East Africa
• Vendors and street hawkers have received a particularly low amount of attention to date, however, they
play an important role in delivering electronic devices of all sorts to BOP consumers and provide
important informal credits in the form of extended payments offered on a “hand-shake” basis.
• Major solar system markets are located in Dar es Salaam, Arusha and Mwanza, these are also the
areas where of a majority of the solar lighting suppliers are located, and where BOP energy consumers
have access to modern lighting technologies. Markets in those three regions have evolved based on
needs and opportunities. For example, Dar es Salaam is a commercial center where solar technologies
are marketed and all business operations are governed, while Arusha is the tourism region where
education is highly valued and technology adoption is linked to access through neighboring countries
like Kenya. In Mwanza, however, solar market penetration has been mainly through government
sponsored projects in partnership with NGO development partners;
• NGOs continue to play a critical role in planning and delivering off grid lighting to BOP consumers using
a more programmatic approach;
• Several distribution models have emerged which systematically target different market sub-segments.
These are mostly delivered by NGOs, but some of the large private distributors are now also bringing
novel ideas. While all of the models have some shortcomings, in totality they represent a variety of
innovative approaches which may be improved upon and expanded. Some of these models are:
o Using middle schools as marketing centers; selling first to school headmasters with follow-on
promotions to students, who in turn convince their parents to make the purchase; the school
serves as the local stocking, distribution and sales center.
o Well organized campaigns that feature music and entertainment targeted for youth and
women — using mobile shops inside trucks that travel to remote areas while carrying many
diverse products.
o Using community based organizations such as Savings and Credit Cooperative Organizations
(SACCOS), Care International, and JUKULIA (a district association in the Ilala district, Dar es
Tanzania: Market Intelligence
GREENMAX CAPITAL ADVISORS 13
Salaam) to reach each member of the association. The dealer supplies the products and the
promotion materials to the SACCOS, or village/community agents who supply to their
members.
o Use of mobile payment systems such as MPESA which are already used in the banking
system to pay for services such as water and food, for lighting products as well.
o NGO awareness campaigns, through mass media.
o Business networking, skills training, and building capacity for solar entrepreneurs.
• While some of these organizations have partnered with Microfinance Institutions (MFIs), most dealers
and distributors indicated that lack of a simple and affordable financing plan was one of several key
obstacles to rapid expansion.
• A large number of distributors cite poor product quality and shipments of defective merchandise as a
second key obstacle. The problem seems to lie at three distinct levels – poor product designs offered
by manufacturers, insufficient technical expertise at the distribution level to select quality devices, and
manufacturers dumping the defective units on the Tanzanian market with insufficient enforcement and
control at importation by the Tanzania Bureau of Standards (TBS).
• High costs of establishing proper logistics and poor transport infrastructure were cited as additional key
obstacles by distributors.
• Provision of after sales service is uneven amongst distributors and along with poor product quality is a
major source of concern. NGOs are often the biggest culprit of lack of follow-up and product servicing
due to poor technical capabilities and the transient nature of many NGO distribution efforts, which
provide a flurry of promotion and distribution without any permanent presence in the community.
Government Actions:
• The Rural Electrification Agency (REA) has been the main government catalyst for alternative lighting
solutions mainly through the Tanzania Energy Development Access Project (TEDAP), which focuses
on improving rural electrification through supporting diverse off grid initiatives by fostering PPP
arrangements. TEDAP receives funding from the REA administered Rural Energy Fund (REF) and
donor contributions.
• TEDAP has administered Tanzania’s major off-grid lighting initiative, the Lighting Rural Tanzania
Competition (LRTC), supported by Lighting Africa, which channeled grants to distribution agents,
mainly to fund start-up costs for launching or expanding delivery to rural and peri-urban areas.
• Financing to TEDAP for off grid lighting through the REF accounts for a minimal portion (only USD1
million of the USD22.6 million) of the total program budget. Private distributors fault TEDAP and the
LRTC for providing the majority of their support to NGO development partners with limited private
sector participation — eligibility criteria for renewable project developers offer little incentives for
investors and on-line applications in English make it difficult for SME retailers to access. Initial focus
has also been mainly towards supplying off-grid lighting only to institutional facilities with little or no
outreach to individuals and businesses.
• TEDAP has pointed to a lack of sufficient national and local government support leading to questions
whether it will leave a sustainable framework in place when the donor funding expires in 2015.
GREENMAX CAPITAL ADVISORS 14
• Regulations have not yet been put in place specifically for alternative lighting products. EWURA
(Energy Water Utilities Regulatory Authority) has not been able to develop regulations governing the
application of efficient lighting because the Ministry of Energy has not yet developed the Renewable
Energy Policy.
• There are 11 standards for regulating the influx of solar equipment products, including specifications on
Solar photovoltaic power systems test procedures for main components; Photovoltaic modules;
Installation, maintenance, testing and replacement of batteries; Charge regulators; Inverters;
Luminaires; Solar photovoltaic (PV) power systems-design, installation, operation, monitoring and
maintenance-code of practice; Design of solar PV systems; Installation of power PV power systems;
Operation of solar PV power system; and Monitoring and maintenance of solar systems.
• However, the study team found that these standards have little or no relevance to the quality assurance
of lighting products. Only one of the standards mentions the application of lighting systems.
• Import duties and value added taxes are exempted for all solar products according to the government
officials interviewed for this study. However, the concerns of the supply chain survey respondents were
that, although tax exemptions for solar products are well structured, the implementation is poorly
managed by the Tanzania Revenue Authority and by the TBS. The survey respondents indicated that
the system lacks technical capacity and knowledge at all levels from import, to storage, to the product
inspection, to the clearance process.
• TAREA (the Tanzania Renewable Energy Association), an NGO involved in solar suppliers’
accreditation is spearheading the prevention of counterfeit products entry, which is prohibited by the
law.
Financing Mechanisms:
• Some amount of financing for lighting supplies in rural and peri-urban areas is provided in form of
credits and microloans through Village community Banks (VIKOBAs); Savings and Credit Societies
(SACCOS); and Trust Funds (“Mfuko wa HISA”).
• Only a few MFI’s offer specific loan products for household or business sustainable energy purchases.
• The BOP’s income base, especially in rural areas, often does not enable borrowing from MFIs. In peri-
urban areas, incomes are higher but there is often no asset base to support lending since many peri-
urban BOP consumers live in rented homes and have no agricultural assets. MFIs prefer lending to
SMEs since the enterprise cash flows and assets can serve as collateral.
• Across the full range of potential expenditure levels for solar lighting products, BOP participants in the
study Focus Groups indicated the need for some form of financing to cover up front costs.
• If, for example, financing terms of up to a year were made available, a wide majority of Focus Group
participants felt they would be able to handle expenditures in acquiring alternative lighting devices
considerably better then in the absence of such financing or if credit terms are short.
Tanzania: Market Intelligence
GREENMAX CAPITAL ADVISORS 15
• Financing was also cited as the main challenge among supply chain survey respondents. A common
challege established for all levels of private dealers is that they have no access to loans for importation
and distribution of goods. Based on the interviews held with the dealers almost all of them (97%) had no
access to loans to support their business. According to the financial institutions interviewed most of the
dealers were being denied provision of loans due to lack of collateral, lack of expertise in finance, the
high cost involved in small transactions, and risk aversion.
Recommendations:
In order to enhance delivery of high-quality solar lighting products to the market, key actors like the Rural
Electificatin Agency (REA) should strengthen their role in rural lighting provision, and encourage increased and
more organized private sector partcipation. In effect, three keys aspects for effective market entry of solar lighting
products should be focused upon; (i) limited knowledge on the use and benefits of solar lighting products (ii) lack
of product standards leading to market saturation with low quality products; and (iii) limited financing for solar
lighting products.
The following recommendations are made for stakeholders and government institutions responsible for off grid
lighting programs:
• Offering information and training particularly in these areas: understanding of the entire product
Life Cycle Costs, comparative product durability, maintenance and disposal costs;
• Work with the Ministry of Energy and Mineral Resource (MEM) to ensure that Solar VAT/Duty
exemptions are allowed only for high quality products;
• Work with REA to establish a quality certification program for lighting products in which
manufacturers will compete and receive approval for their brands so that they gather greater appeal
in the market place;
• Assist REA in working with the Tanzania Bureau of Standards (TBS) on developing minimum
quality standards specifically for lighting products, which TBS should enforce in the usual manner
under their jurisdiction;
• Conduct a more intensified campaign for awareness of private dealers in the supply chain and
disseminate information on successful distribution models and provide training for implementation
of these models;
• Provide TA to MFIs to encourage and assist them in establishing special financing programs to
support off grid lighting product purchases. Help make connections between distributor/dealers and
MFIs to set up joint programs and provide TA to both on workable models for collaboration;
• Develop closer relations with the Government of Tanzania through MEM to help government take
an even greater role in promoting off grid lighting solutions as a cornerstone of national energy
policy;
• Use the mass media institutions to disseminate publicity about off grid lighting products and the
efforts of various stakeholders to ensure that better quality products are being delivered to the
GREENMAX CAPITAL ADVISORS 16
market. This can be through joint press conferences, sponsored programs in broadcast media, and
advertisements
Lighting Africa Tanzania Market Intelligence, Appendices
GREENMAX CAPITAL ADVISORS 17
1.0. INTRODUCTION
For the majority of Tanzanians living in rural and peri-urban areas, access to grid power has been slow, and in most cases unaffordable. Off-grid alternatives for lighting such as kerosene lamps or paraffin candles produce polluting fossil fuels, and come with long-term health and environmental repercussions, besides being very expensive. For those with access to electricity, the majority is under-served and they also turn to similar unsustainable lighting solutions. Inadequate access to electricity has traditionally left rural and peri-urban households and Small and Medium Sized Enterprises (SMEs) with a poor choice of lighting options. Energy efficient products have slowly started to enter the market with the availability of lighting alternatives such as LED lamps and solar lanterns providing more options, though the market penetration and awareness about these modern lighting technologies remains limited.
The lack of sustainable energy sources and lighting services reduces national productivity; for example, if children from rural households do not have enough light to study at night, they are losing opportunities to improve their education, and consequently their living standards. Likewise micro enterprises in peri- urban areas spend more on meeting energy costs than on investments to expand their business activities. 2
It is in this context that the Lighting Africa (LA) program was launched in 2007 as a joint program of the World Bank (WB) and International Finance Corporation (IFC). The LA program is part of a global movement towards an Energy Access Policy3 framework, which sets goals for investing in energy transformation providing education and healthcare services to marginalized communities. The LA program works to provide sustainable lighting options for populations without access to the electricity grid. Through market development and mobilization, the program offers modern lighting options for Bottom of the Pyramid (BOP) energy consumers in Africa. Lighting Africa seeks to eliminate market barriers for the private sector to reach the 250 million people in Africa currently without electricity and to those using fuel-based lighting, by 2030, which responds to the Sustainable Energy For All initiative. The program has completed pilot projects in Kenya and Ghana and is in the early stages of a large-scale rollout across the continent, with activities already initiated in Tanzania, Ethiopia, Malawi, the Democratic Republic of Congo, Zambia, Burkina Faso, Mali and Senegal.
The activities of Lighting Africa in Tanzania started in 2008, with an initial market assessment report4, followed by the partnering up with the Tanzania Rural Energy Agency (REA) to undertake a competitive solicitation in 2010 aimed at selecting suppliers of alternative lighting products that would receive funding for targeted distribution campaigns. The implementation of these campaigns was followed by a Policy Report Note that was agreed upon by Lighting Africa sponsors and the Government of Tanzania in 2012.
Climate change has negatively impacted Tanzania’s over-reliance on hydropower for supplying electricity. Frequent droughts in the past have caused severe depletion of water supply to dams thereby leading to a reduction in power generation and consequently a disruption in socioeconomic activities.5 These climatic changes are projected to increase in the near future6 with intensified droughts, heat waves and wildfires.
2An economic analysis of energy sources showing affordability and expenditure patterns for electricity and kerosene, when considering the various lighting options available to BOP (Maliti & Mnenwa, 2011) 3Energy Access Policy — An analysis that examines energy policies and market trends that will provide insight on an enabling ecosystem, which is geared towards meeting pro-poor energy access goals. This is based on the ‘Energy Access Ecosystem Index’, which focuses on nine indicators, three each in the areas of energy policy, financing and capacity (Practical Action, 2013) 4The 2008 market assessment in Tanzania established a set of research objectives, which are incorporated in the Tanzania Market Intelligence study. Unlike previous market assessment that focus more on ascertaining the existing lighting options in the market, the current study focuses on determining the characteristics and needs of the BOP consumer, and maps the supply-chain of actors involved in distributing modern lighting products in Tanzania. 5The Economics of Climate Adaptation Working Group Report shows climatic changes affected power provision and result in unsustainable livelihoods and national underproduction (ECA, 2009) 6Studies published by the Intergovernmental Panel on Climate Change show that freshwater resources have been depleting
GREENMAX CAPITAL ADVISORS 18
Fortunately, the increased exploitation of the country’s considerable natural gas deposits, and the early stage development of geothermal, wind, solar and biomass resources are offering optional power generation and providing Tanzania an opportunity for socioeconomic growth, and environmental sustainability. Of specific significance to this Lighting Africa study, is that Tanzania’s location near the equator, which allows for a large amount of solar radiation and comparatively high sunshine hours7 during the day, provides an environment conducive to the use of solar powered lighting technologies.
The energy sector in Tanzania is undertaking deliberate efforts to introduce renewable energy strategies, and expand efforts to bring energy services to both on and off-grid segments of the population. Under the National Strategy for Growth and Poverty Reduction (NSGRP)8, development goals focus on rural transformation through investment in environmental infrastructure and market opportunities for SMEs (URT, 2005). In particular, the national plan addresses energy policy reforms through enabling environments for renewable energy access and investments in Public-Private Partnerships (PPPs). This Market Intelligence study therefore coincides with positive steps taken by the Government of Tanzania towards energy sector reform, rural electrification, and introduction of renewable energy projects. Among these efforts is the implementation of the Tanzania Energy Development and Access Project (TEDAP) which, among its activities, utilizes PPPs to deliver off-grid lighting solutions to BOP populations. TEDAP has helped create opportunities for the entry of energy efficient technologies in local markets. A variety of household level appropriate modern technologies have been explored in Tanzania as a result. These include solar photovoltaic (PV), solar thermal, biogas for cooking, bio-waste for small-scale power generation, micro-wind turbines for water pumping and a plethora of solar lighting products.
The Tanzania Market Intelligence study focuses on the BOP energy consumer and renewable energy actors, along with secondary information on the energy sector trade, and investment and policy trends in the country. Similar to previously piloted Lighting Africa programs, ‘Market Intelligence’ is a critical part of the project planning that will provide market information for designing suitable products for local markets, in addition to determining the market demand and supply chain mapping for modern lighting products.
Terms of Reference for this Study
The terms of reference for this assignment were to conduct market research which involved reviewing existing
demand information on the lighting sources in off-grid rural areas, consumption and expenditures for
kerosene/candles and other prevalent lighting alternatives, willingness to pay, consumer preferences, etc. and
complement it with socio-economic surveys and focus groups in representative target rural and peri-urban areas
Specifically the goals of the assignment covered the following:
• Evaluation of the State of Electrification (% of population with access to electricity, those connected to the grid, off-grid connections, etc.);
• Characterization of the existing lighting solutions, their challenges and their costs (financial and environmental);
• Summarizing the market potential and its key characteristics for the purpose of distributing information to potential manufacturers and distributors of off-grid lighting products;
• Screening the market for Solar Home Systems (SHS), solar lanterns, and other similar products, including PPPs (e.g. concessions, private sector-driven initiatives and informal market.);
• Analysis of the most promising distribution models;
• Analysis of the competiveness (direct and indirect) of the market for prices, types, functions, performance, quality, etc.;
over the last 50 years, and projections for this trend are expected to increase in the future primarily due to natural and anthropogenic factors — natural seasonal changes and ecological impacts from population growth (IPCC, 2011) 7Daily solar radiation is 4-8 kWh/m2, with 2800-3500 hours of sunshine per year (Kimambo, 2009). 8NSGRP — Tanzania’s long-term development plans aimed at poverty reduction and moving the country into middle-income status. Policy reforms within the energy sector aim to ensure availability of reliable and affordable energy services and their use in a sustainable manner to support national transformation (URT, 2005).
Lighting Africa Tanzania Market Intelligence, Appendices
GREENMAX CAPITAL ADVISORS 19
• Mapping out the key stakeholders to engage in the country’s off-grid lighting market (commercial sector, NGOs, and national/local government);
• Mapping out areas for collaboration with key stakeholders, the best institutional arrangements and engagements;
• Defining the key implementation areas for the program;
• Defining the monitoring and evaluation framework;
• Defining the consumer needs and analyzing the cost and growth of the current options.
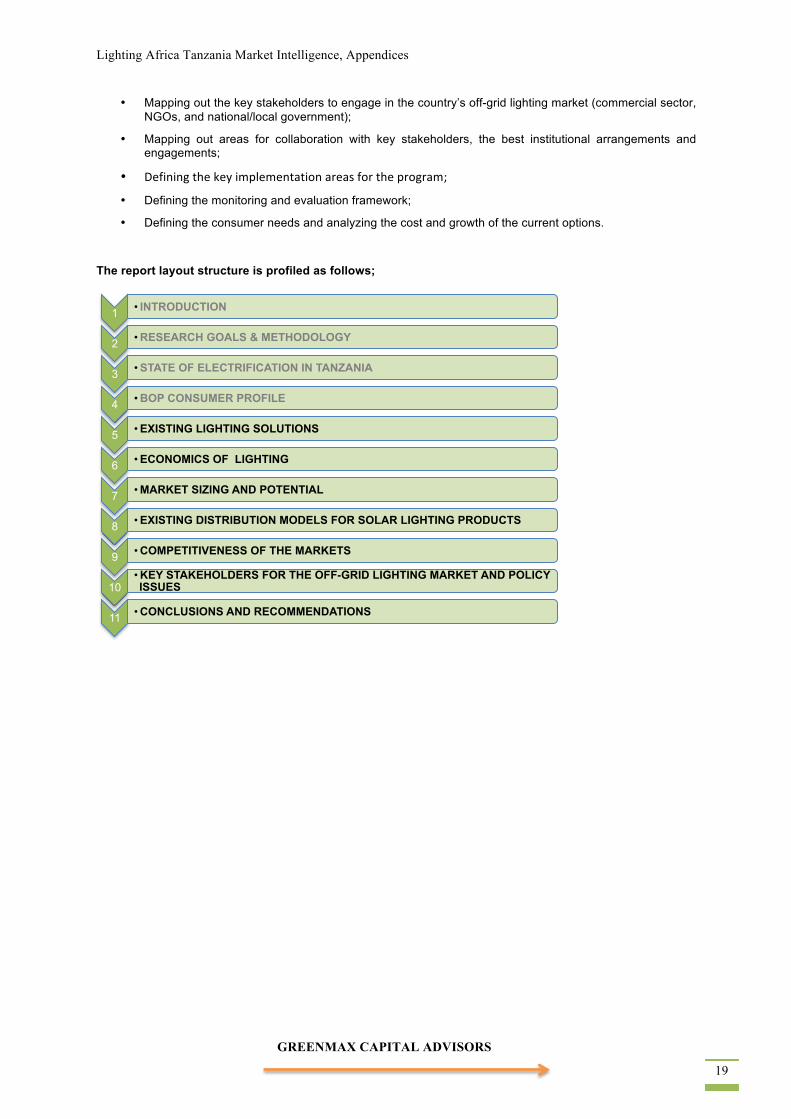
The report layout structure is profiled as follows;
1 • INTRODUCTION
2 • RESEARCH GOALS & METHODOLOGY
3 • STATE OF ELECTRIFICATION IN TANZANIA
4 • BOP CONSUMER PROFILE
5 • EXISTING LIGHTING SOLUTIONS
6 • ECONOMICS OF LIGHTING
7 • MARKET SIZING AND POTENTIAL
8 • EXISTING DISTRIBUTION MODELS FOR SOLAR LIGHTING PRODUCTS
9 • COMPETITIVENESS OF THE MARKETS
10 • KEY STAKEHOLDERS FOR THE OFF-GRID LIGHTING MARKET AND POLICY ISSUES
11 • CONCLUSIONS AND RECOMMENDATIONS
GREENMAX CAPITAL ADVISORS 20
2.0. RESEARCH GOALS & METHODOLOGY
Purpose of the Study
The primary objective of the study is to collect information that will provide manufacturers/distributors with market insights and data that would inform/facilitate their entry, growth and scale up in the country.
Market Assessment Methodology
The specific research activities undertaken, involved:
a) A desk review of relevant documents on energy and lighting in Tanzania, including Government and Development partners.
b) In-person interviews with relevant stakeholders, including businesses with operating supply and distribution channels for alternative lighting products, and representatives from the Government of Tanzania and Non-Governmental Organizations. Interviews were conducted with 163 private dealers at various levels of the supply chain, 6 interviews with government agencies and 16 interviews with NGOs, development partners, research and micro-financing institutions. Also, interviews were conducted with 40 supply chain distributors of general electronic goods across the country.
c) Twelve focus groups were selected from 6 representative regions, one from a peri-urban location and one from a rural location in each region. The groups comprised household heads who had been carefully selected to reflect the socio-economic profile of the BOP population in that cluster. A total of 185 household members participated in these discussions.
d) A consumer survey in six geographical zones of Tanzania, involving 374 households and 236 owners of micro and small enterprises (SMEs) was conducted to determine the characteristics related to energy access for the provision of lighting solutions and lighting usage behaviors.
e) Compilation of the market research materials into a report with program monitoring and evaluation recommendations, to be shared with manufacturers and distributors of modern lighting products.
Lighting Africa Tanzania Market Intelligence, Appendices
GREENMAX CAPITAL ADVISORS 21
3.0. STATE OF ELECTRIFICATION IN TANZANIA ___________________________________________________________________________________
3.1. Access to Electricity The total population of Tanzania is 43.9 million with an average household size of 4.5 persons according to the most recent census conducted in 2012 (NBS 2013). The rate of electrification in the country stands at 21% with only 7% coverage in rural areas and about 50% in the urban areas. Of the 25 mainland regions in Tanzania, the Dar es Salaam region has the greatest access to electricity with 39% of all households in the region having a grid connection. The Government is targeting 30 per cent connectivity by 2015, involving connection of 250,000 new customers per annum starting in 2013, to 2017. So far the Rural Energy Agency (REA) has been actively participating in rural electrification initiatives mainly in either grid extension or isolated mini-grids. For example, electrification of villages that will be affected by the 400kV Backbone transmission line, the Millennium Challenge Corporation (MCC) funded electrification projects in seven mainland regions (Morogoro, Iringa, Mwanza, Kigoma, Mbeya, Tanga and Dodoma), and the electrification expansion program in Mpanda, Ngara and Biharamulo.
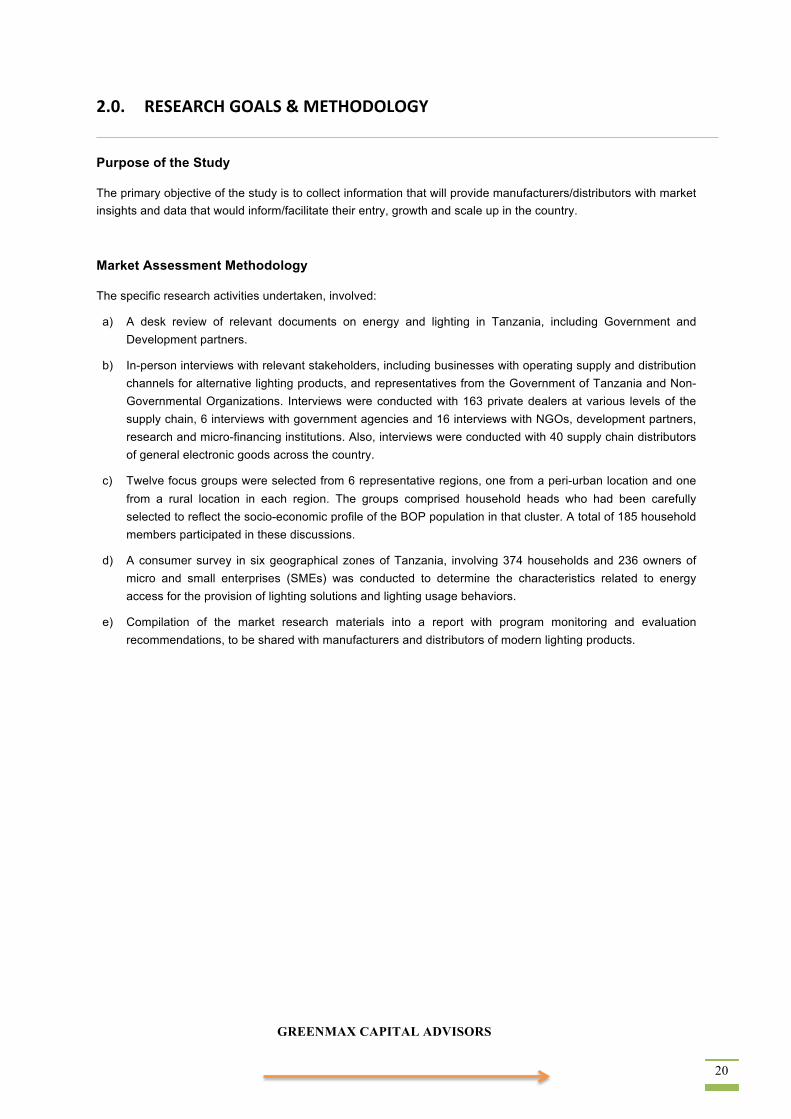
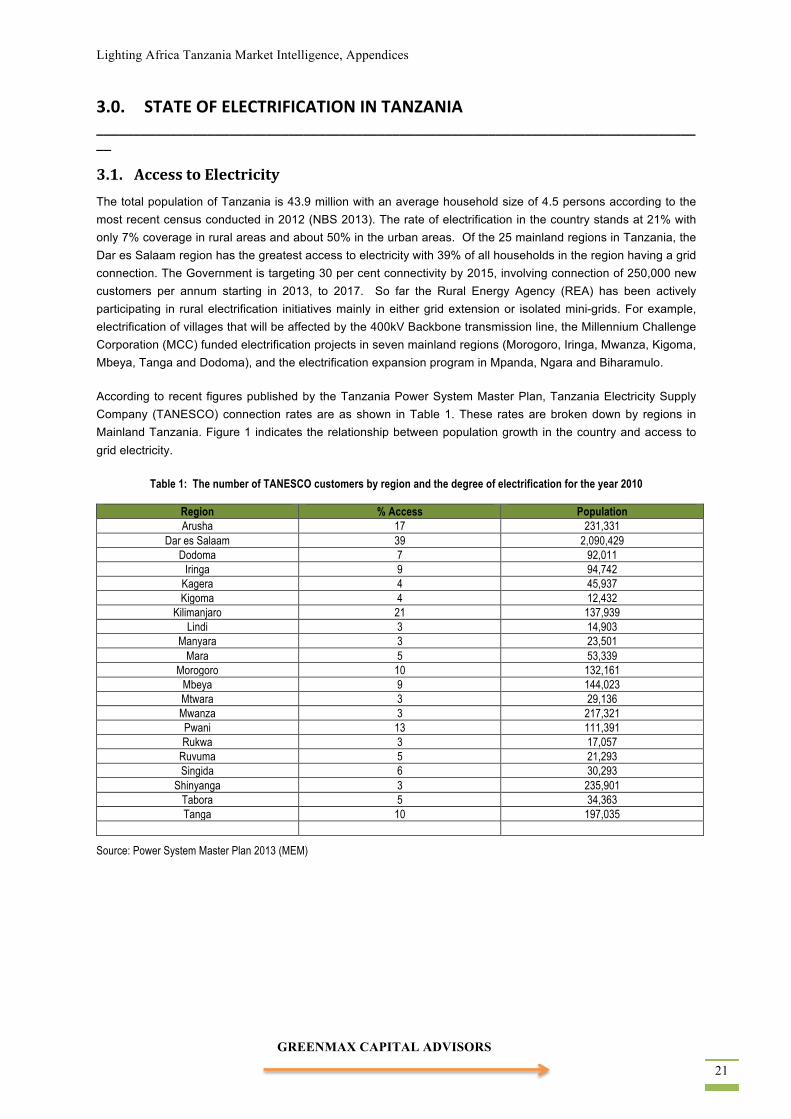
According to recent figures published by the Tanzania Power System Master Plan, Tanzania Electricity Supply Company (TANESCO) connection rates are as shown in Table 1. These rates are broken down by regions in Mainland Tanzania. Figure 1 indicates the relationship between population growth in the country and access to grid electricity.
Table 1: The number of TANESCO customers by region and the degree of electrification for the year 2010
Region % Access Population Arusha 17 231,331
Dar es Salaam 39 2,090,429 Dodoma 7 92,011
Iringa 9 94,742 Kagera 4 45,937 Kigoma 4 12,432
Kilimanjaro 21 137,939 Lindi 3 14,903
Manyara 3 23,501 Mara 5 53,339
Morogoro 10 132,161 Mbeya 9 144,023 Mtwara 3 29,136 Mwanza 3 217,321 Pwani 13 111,391 Rukwa 3 17,057
Ruvuma 5 21,293 Singida 6 30,293
Shinyanga 3 235,901 Tabora 5 34,363 Tanga 10 197,035
Source: Power System Master Plan 2013 (MEM)
GREENMAX CAPITAL ADVISORS 22
Figure 1: Population Growth and Grid Access in Tanzania
The approximately 5,700 GWh of electricity generated annually supplied through the grid is for both industrial and household consumption. The proportion which goes to households and institutions is about 37 percent while the rest goes to industries (38%) or is lost in the process of transmission (25%) (PSMP 2011). Those who do have access to the grid, however, experience frequent power outages and supply is generally erratic. For the past decade, the undersupply of electricity has been prominent with the increase in domestic energy demand due to population growth, and the high consumption of biomass fuels at 85% of the total energy consumption in the nation.9
9(URT, 2012b)

Lighting Africa Tanzania Market Intelligence, Appendices
GREENMAX CAPITAL ADVISORS 23
3.2. Electricity Generation Electricity generation has fluctuated tremendously due to recurring drought periods10 in 2003/2004, 2005/2006, 2009/2010, 2010/2011 and 2011/2012, which have forced the country to pursue development of other indigenous sources of energy supply including natural gas, coal and all forms of renewable energy. As a result, a larger portion of electricity is now derived from thermal generation. However thermal generation has not been able to cover the deficit caused by the low levels of supply from installed hydropower. Figure 2 illustrates the proportional contribution of the different sources of electricity generation to the grid.
Figure 2: Current Source of Electricity Generation
Source: Tanesco 2013
Tanzania’s power industry remains centralized, with one vertically integrated, public corporation, Tanzania Electricity Supply Company (TANESCO), which is in charge of electricity generation, transmission and distribution. TANESCO has an installed generation capacity of 1545 MW11; of which 36% is derived from hydropower12 and 64% is derived from thermal energy. About 13MW of the generated electricity is imported from Uganda and Zambia13. TANESCO’s monopoly position was ended in June 1992 to allow private sector participation in power trading. The sector is, however, undergoing major transformation with liberalization being at the forefront.
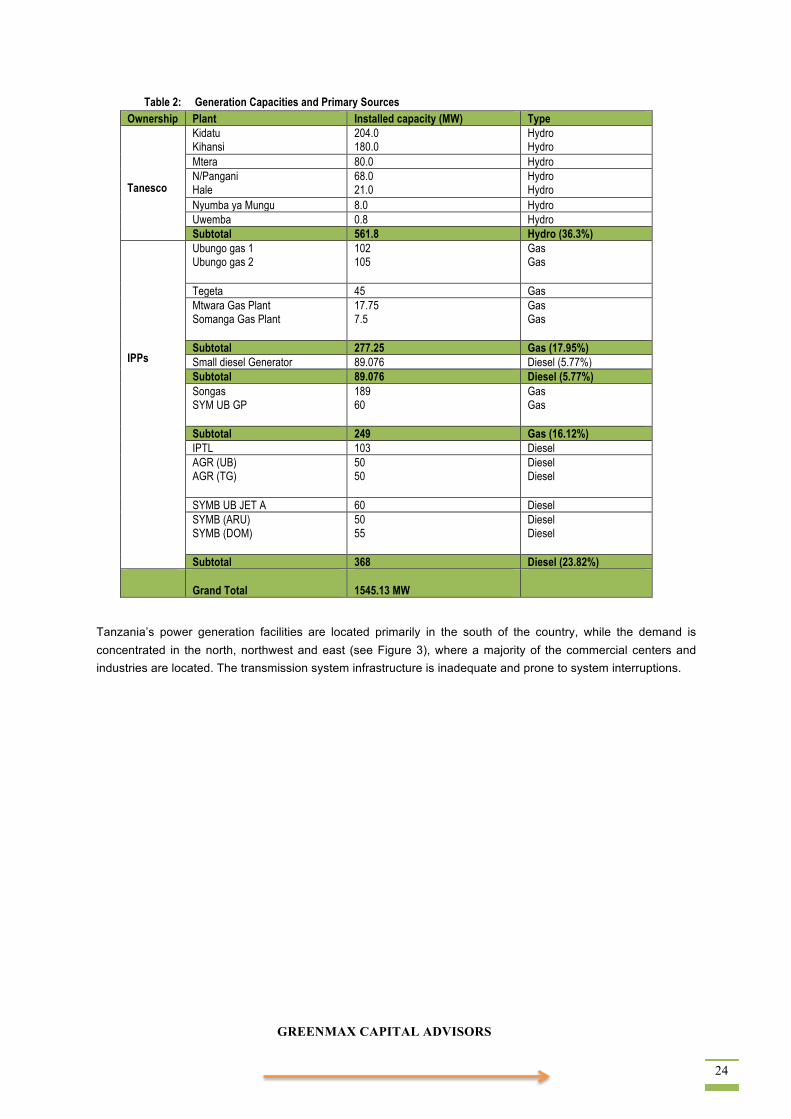
Table 2 shows the country’s generation capacities and primary sources.
10 (Eberhard&Kapitak, 2010; MEM, 2013) 11(Msyani, 2013)
12Hydropower— Hydropower accounts for 55% of Tanzania’s power generation this is a reduction in reliance on hydropower compared to the past, where in 2002 97% of the country’s grid-based electricity came from hydropower, but also because in 2006 there were severe droughts, which affected the hydropower generation (Malley, 2011) 13(Nganga et al., 2013)
GREENMAX CAPITAL ADVISORS 24
Table 2: Generation Capacities and Primary Sources Ownership Plant Installed capacity (MW) Type Tanesco
Kidatu Kihansi
204.0 180.0
Hydro Hydro
Mtera 80.0 Hydro N/Pangani Hale
68.0 21.0
Hydro Hydro
Nyumba ya Mungu 8.0 Hydro Uwemba 0.8 Hydro Subtotal 561.8 Hydro (36.3%)
IPPs
Ubungo gas 1 Ubungo gas 2
102 105
Gas Gas
Tegeta 45 Gas Mtwara Gas Plant Somanga Gas Plant
17.75 7.5
Gas Gas
Subtotal 277.25 Gas (17.95%) Small diesel Generator 89.076 Diesel (5.77%) Subtotal 89.076 Diesel (5.77%) Songas SYM UB GP
189 60
Gas Gas
Subtotal 249 Gas (16.12%) IPTL 103 Diesel AGR (UB) AGR (TG)
50 50
Diesel Diesel
SYMB UB JET A 60 Diesel SYMB (ARU) SYMB (DOM)
50 55
Diesel Diesel
Subtotal 368 Diesel (23.82%)
Grand Total 1545.13 MW
Tanzania’s power generation facilities are located primarily in the south of the country, while the demand is concentrated in the north, northwest and east (see Figure 3), where a majority of the commercial centers and industries are located. The transmission system infrastructure is inadequate and prone to system interruptions.
Lighting Africa Tanzania Market Intelligence, Appendices
GREENMAX CAPITAL ADVISORS 25
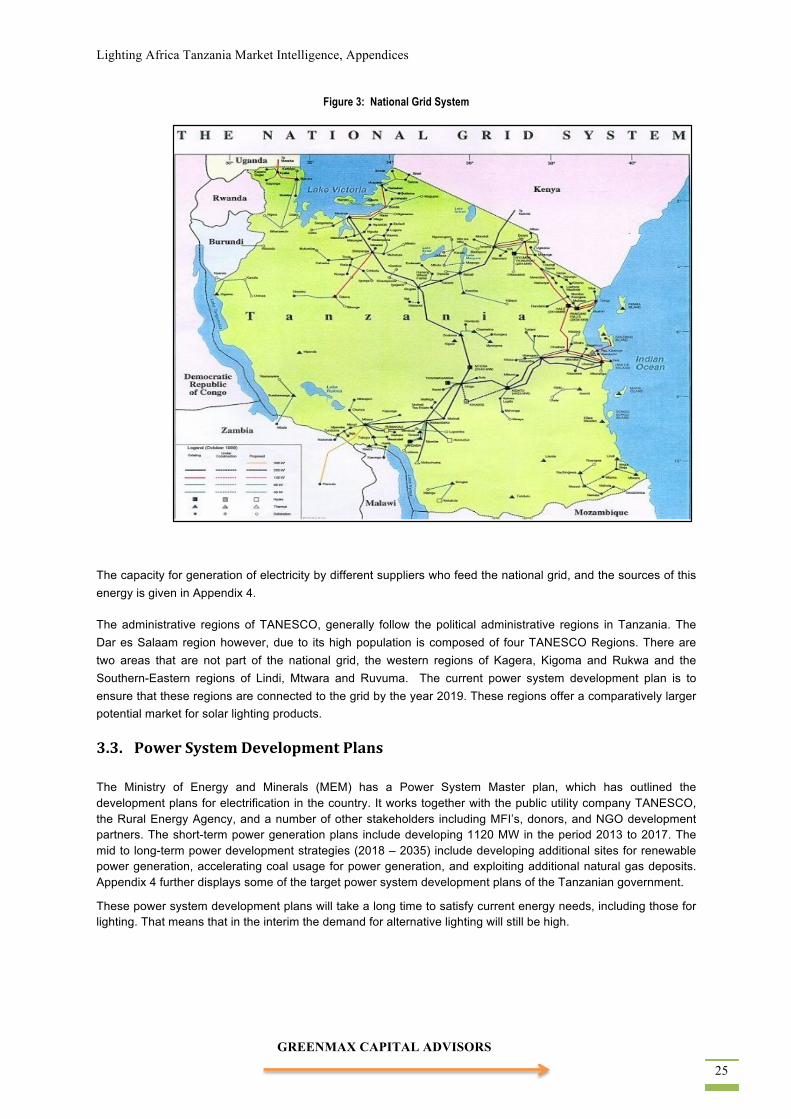
Figure 3: National Grid System
The capacity for generation of electricity by different suppliers who feed the national grid, and the sources of this energy is given in Appendix 4.
The administrative regions of TANESCO, generally follow the political administrative regions in Tanzania. The Dar es Salaam region however, due to its high population is composed of four TANESCO Regions. There are two areas that are not part of the national grid, the western regions of Kagera, Kigoma and Rukwa and the Southern-Eastern regions of Lindi, Mtwara and Ruvuma. The current power system development plan is to ensure that these regions are connected to the grid by the year 2019. These regions offer a comparatively larger potential market for solar lighting products.
3.3. Power System Development Plans The Ministry of Energy and Minerals (MEM) has a Power System Master plan, which has outlined the development plans for electrification in the country. It works together with the public utility company TANESCO, the Rural Energy Agency, and a number of other stakeholders including MFI’s, donors, and NGO development partners. The short-term power generation plans include developing 1120 MW in the period 2013 to 2017. The mid to long-term power development strategies (2018 – 2035) include developing additional sites for renewable power generation, accelerating coal usage for power generation, and exploiting additional natural gas deposits. Appendix 4 further displays some of the target power system development plans of the Tanzanian government.
These power system development plans will take a long time to satisfy current energy needs, including those for lighting. That means that in the interim the demand for alternative lighting will still be high.
GREENMAX CAPITAL ADVISORS 26
3.4. Rural Renewable Energy Projects Potential energy resources for off-grid electrification available for investment include Geothermal Energy, Biomass Energy, Solar Energy, Wind Energy and Small Hydropower. For rural electrification the development of the projects in Tanzania is coordinated through the REA.
Through the Tanzania Energy Development Access Project (TEDAP), five small hydropower projects have been provided with matching grants for pre-investment studies. The REA has identified small hydropower projects that are eligible for carbon financing through the Clean Development Mechanism (CDM), implemented capacity building for prospective developers of CDM projects, and implemented a Program of Activities (PoA) to aggregate small projects in one application. The Government of Tanzania has signed an agreement with the World Bank to advance up to 5% of capital investment to developers, which will be recovered from revenues accrued from the selling of Certified Emission Reductions (CER). This is a positive development towards increased access rate for the BOP consumers.
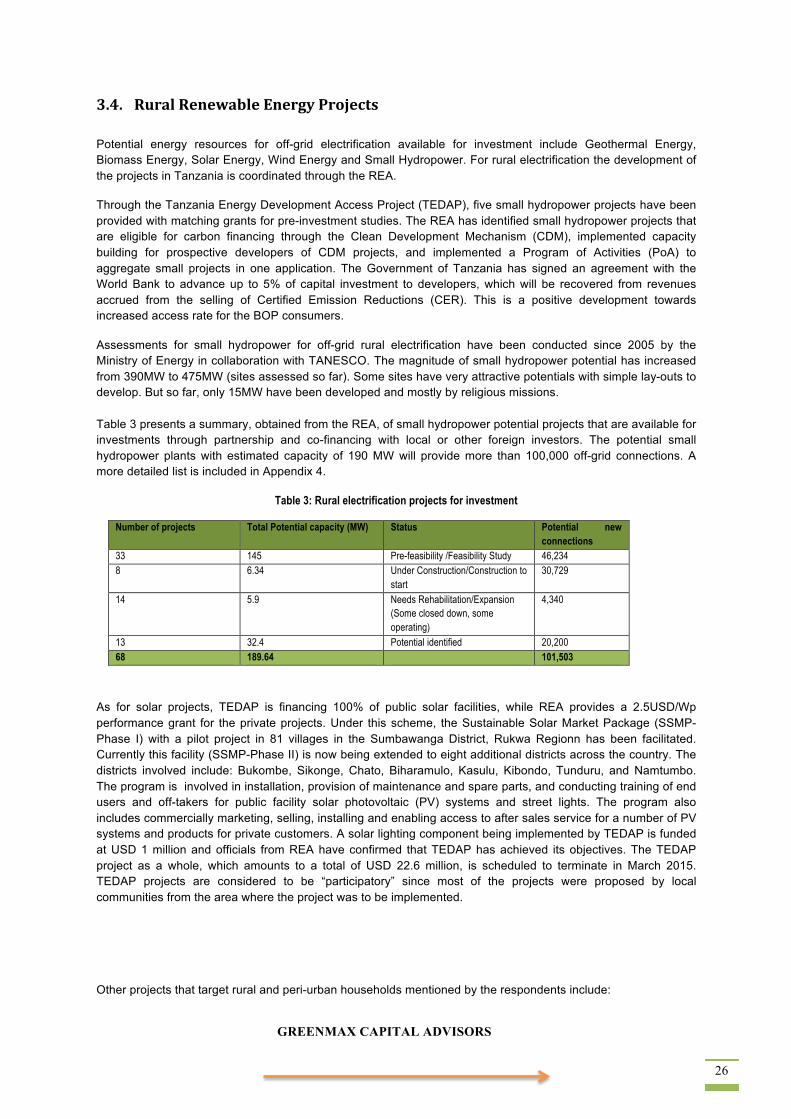
Assessments for small hydropower for off-grid rural electrification have been conducted since 2005 by the Ministry of Energy in collaboration with TANESCO. The magnitude of small hydropower potential has increased from 390MW to 475MW (sites assessed so far). Some sites have very attractive potentials with simple lay-outs to develop. But so far, only 15MW have been developed and mostly by religious missions. Table 3 presents a summary, obtained from the REA, of small hydropower potential projects that are available for investments through partnership and co-financing with local or other foreign investors. The potential small hydropower plants with estimated capacity of 190 MW will provide more than 100,000 off-grid connections. A more detailed list is included in Appendix 4.
Table 3: Rural electrification projects for investment
Number of projects Total Potential capacity (MW) Status Potential new connections
33 145 Pre-feasibility /Feasibility Study 46,234 8 6.34 Under Construction/Construction to
start 30,729
14 5.9 Needs Rehabilitation/Expansion (Some closed down, some operating)
4,340
13 32.4 Potential identified 20,200 68 189.64 101,503
As for solar projects, TEDAP is financing 100% of public solar facilities, while REA provides a 2.5USD/Wp performance grant for the private projects. Under this scheme, the Sustainable Solar Market Package (SSMP-Phase I) with a pilot project in 81 villages in the Sumbawanga District, Rukwa Regionn has been facilitated. Currently this facility (SSMP-Phase II) is now being extended to eight additional districts across the country. The districts involved include: Bukombe, Sikonge, Chato, Biharamulo, Kasulu, Kibondo, Tunduru, and Namtumbo. The program is involved in installation, provision of maintenance and spare parts, and conducting training of end users and off-takers for public facility solar photovoltaic (PV) systems and street lights. The program also includes commercially marketing, selling, installing and enabling access to after sales service for a number of PV systems and products for private customers. A solar lighting component being implemented by TEDAP is funded at USD 1 million and officials from REA have confirmed that TEDAP has achieved its objectives. The TEDAP project as a whole, which amounts to a total of USD 22.6 million, is scheduled to terminate in March 2015. TEDAP projects are considered to be “participatory” since most of the projects were proposed by local communities from the area where the project was to be implemented.
Other projects that target rural and peri-urban households mentioned by the respondents include:
Lighting Africa Tanzania Market Intelligence, Appendices
GREENMAX CAPITAL ADVISORS 27
(a) The proposed SNV Tanzania project supporting lighting entrepreneurs–independent project for Pico solar in Mwanza, result-based financing to promote the solar market in the country;
(b) SNV supports TEDAP’s biogas sector awareness program; (c) SNV supports TAREA in expanding and implementing its mandate; e.g. in promoting awareness of quality
energy efficient/services and renewable energy programs among the population. The support is mainly in the technical areas involving expert human resources in conducting awareness campaigns;
(d) Research for Poverty Alleviation (REPOA) is coming up with energy policy research to advise the MEM on an energy sector reform/plan since the current energy policy is 10 years old with few changes. The research will focus on infrastructure development and investment in renewable energy.
GREENMAX CAPITAL ADVISORS 28
4.0. BOTTOM OF THE PYRAMID CONSUMER PROFILE
4.1. Rural and Peri-‐Urban Populations A 2012 census report published by the National Bureau of Statistics (NBS)14 shows that the Tanzanian population has tripled in the last 45 years, from 12.3 million to 44.9 million, with an annual growth rate of 2.9%, with a 1.05:1 ratio of women to men respectively.
Geographically, Tanzania is an expansive country, and its regions and residents vary greatly. The country covers an area of 945,203 square Kilometers, with a population density of 51.06 per square kilometer (July 2013 estimate). Urban centers have higher population growth rates, while the household size in rural areas is biggest — Dar es Salaam has the highest annual population growth rate, which stood at 5.6 percent in the period 2002 – 2012 and currently has 4.4 million people, and Simiyu has the highest average household size at 7. There are 120 tribes in Tanzania, and the sizes of their populations vary (from 5.5 million of the “Sukuma” tribe to fewer than 50,000 for others). The BOP energy consumer resides mainly in rural and peri-urban areas. The majority of the people are Christians and Muslims, and a few have indigenous beliefs and some are Hindus. The annual average household size has remained constant compared to the population growth and the population for women slightly exceeds that for men).
In 2002 women in Tanzania were twice as likely as men to have no education at all; over one third of women in rural areas had little or no education15. Fortunately this has changed over time. Due to universal education reform and women’s participation in innovative microenterprises, women have become more empowered and are now occupying high-level ministerial positions. What has not changed is the male-dominated household, and the low literacy rates among young women, especially in rural areas, where access to electricity is also low (see Figure 4). A 2010 Health Demographic Study by NBS shows a 3:1 ratio for male to female heads of households, and 72% of women and 82% of men are literate — this is a slight change from the 67% and 80% women and men literacy rates in 2004. In terms of rural-urban disparities, the literacy rates for women and men in rural areas are lower compared to urban areas.16
14National Bureau of Statistics indicated a rapid population growth in the urban areas — Dar es Salaam has the highest growth
rate at 5.6% in the entire country, however a large portion of the population of Tanzanians live in rural areas (NBS, 2012). 15(NBS, 2002), 16(NBS, 2011).
Lighting Africa Tanzania Market Intelligence, Appendices
GREENMAX CAPITAL ADVISORS 29
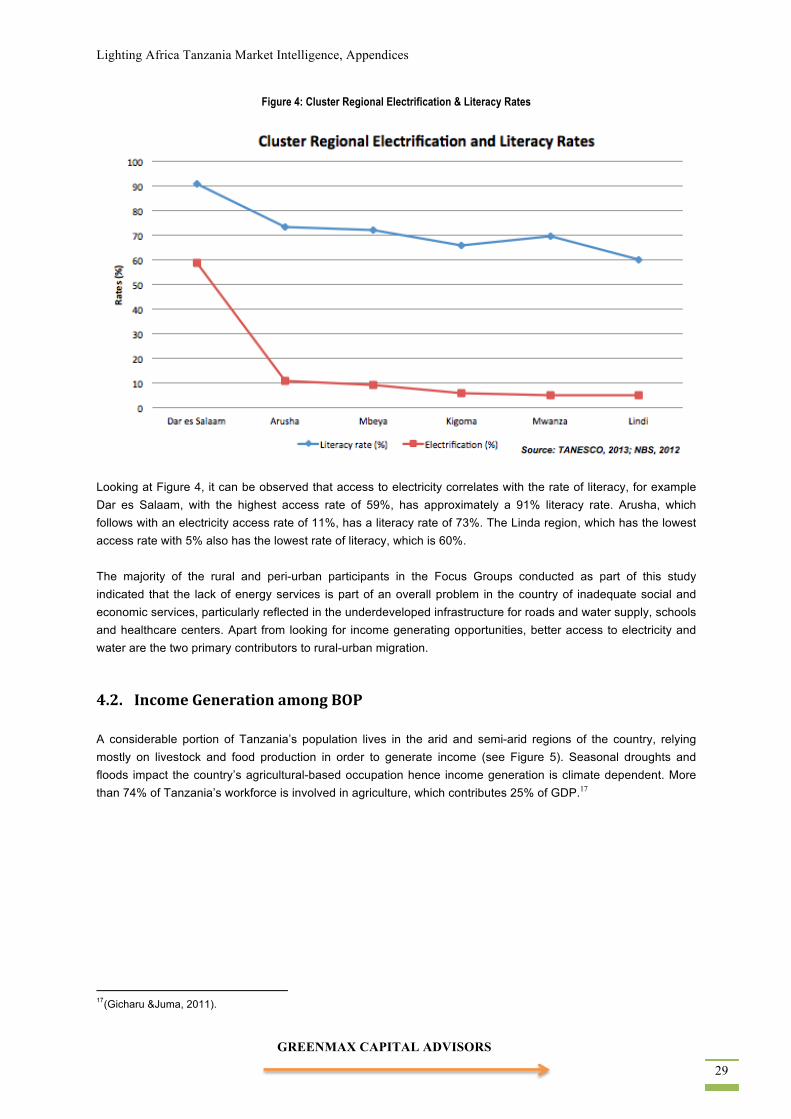
Figure 4: Cluster Regional Electrification & Literacy Rates
Looking at Figure 4, it can be observed that access to electricity correlates with the rate of literacy, for example Dar es Salaam, with the highest access rate of 59%, has approximately a 91% literacy rate. Arusha, which follows with an electricity access rate of 11%, has a literacy rate of 73%. The Linda region, which has the lowest access rate with 5% also has the lowest rate of literacy, which is 60%. The majority of the rural and peri-urban participants in the Focus Groups conducted as part of this study indicated that the lack of energy services is part of an overall problem in the country of inadequate social and economic services, particularly reflected in the underdeveloped infrastructure for roads and water supply, schools and healthcare centers. Apart from looking for income generating opportunities, better access to electricity and water are the two primary contributors to rural-urban migration.
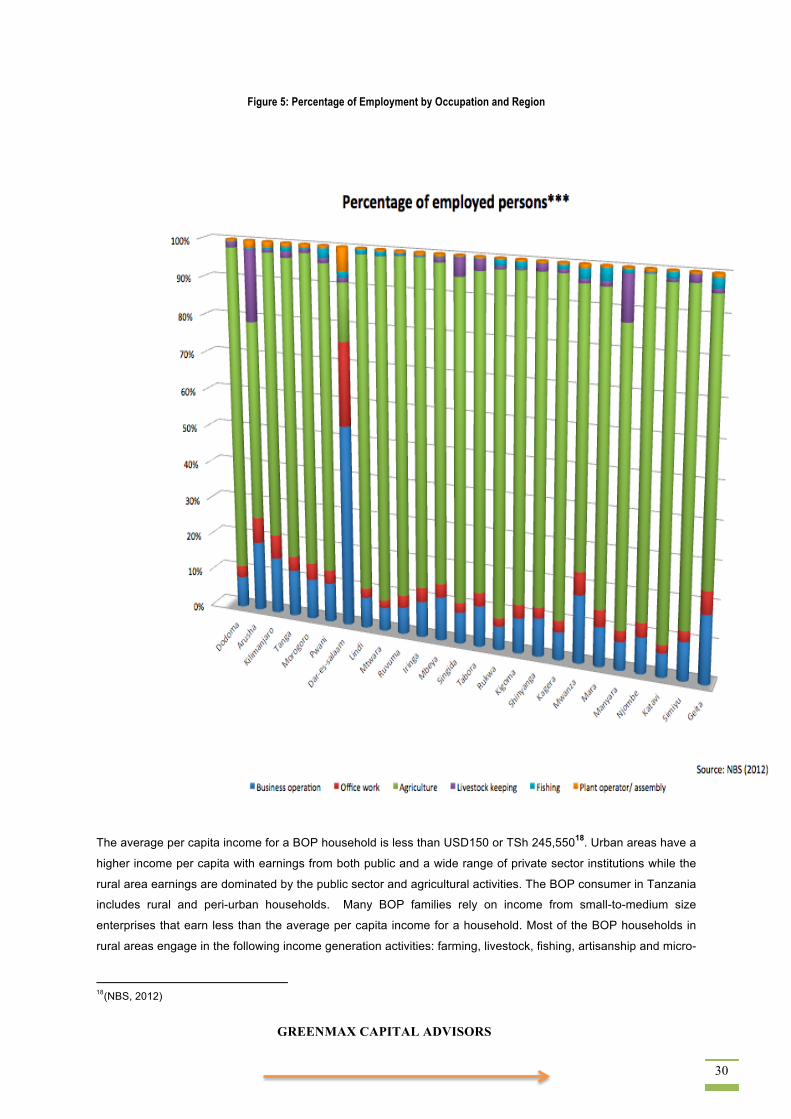
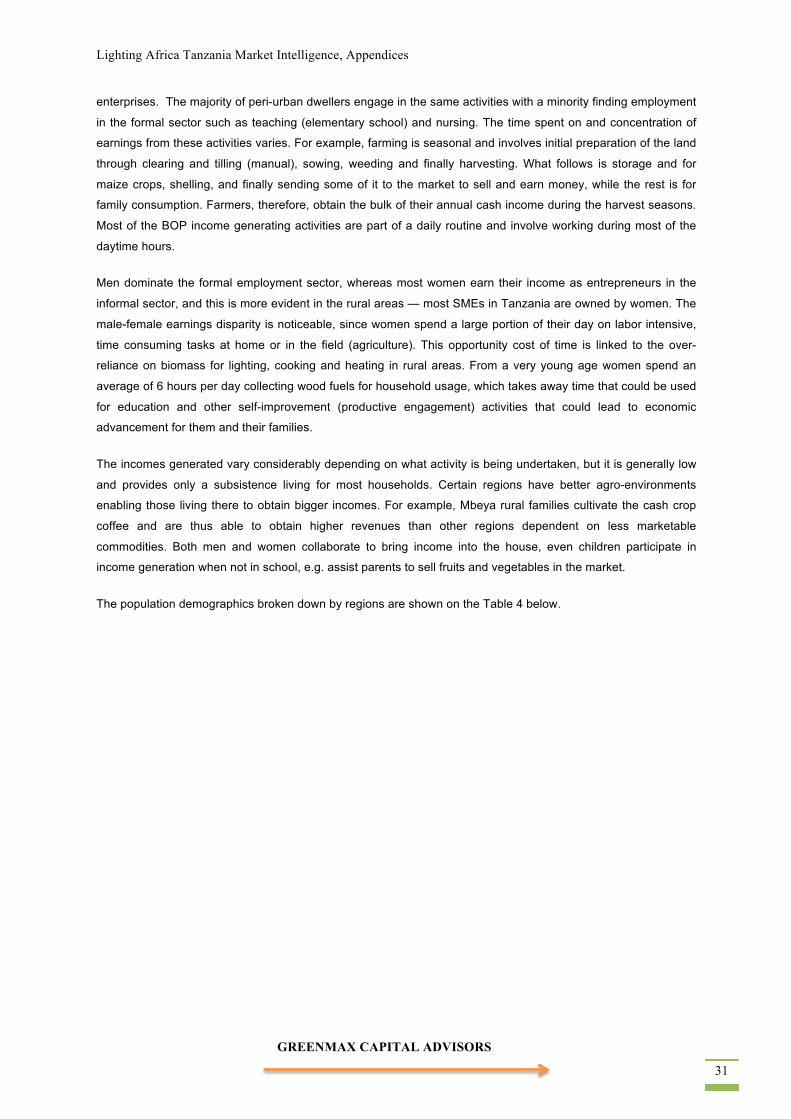
4.2. Income Generation among BOP A considerable portion of Tanzania’s population lives in the arid and semi-arid regions of the country, relying mostly on livestock and food production in order to generate income (see Figure 5). Seasonal droughts and floods impact the country’s agricultural-based occupation hence income generation is climate dependent. More than 74% of Tanzania’s workforce is involved in agriculture, which contributes 25% of GDP.17
17(Gicharu &Juma, 2011).
GREENMAX CAPITAL ADVISORS 30
Figure 5: Percentage of Employment by Occupation and Region
The average per capita income for a BOP household is less than USD150 or TSh 245,55018. Urban areas have a
higher income per capita with earnings from both public and a wide range of private sector institutions while the
rural area earnings are dominated by the public sector and agricultural activities. The BOP consumer in Tanzania
includes rural and peri-urban households. Many BOP families rely on income from small-to-medium size
enterprises that earn less than the average per capita income for a household. Most of the BOP households in
rural areas engage in the following income generation activities: farming, livestock, fishing, artisanship and micro-
18(NBS, 2012)
Lighting Africa Tanzania Market Intelligence, Appendices
GREENMAX CAPITAL ADVISORS 31
enterprises. The majority of peri-urban dwellers engage in the same activities with a minority finding employment
in the formal sector such as teaching (elementary school) and nursing. The time spent on and concentration of
earnings from these activities varies. For example, farming is seasonal and involves initial preparation of the land
through clearing and tilling (manual), sowing, weeding and finally harvesting. What follows is storage and for
maize crops, shelling, and finally sending some of it to the market to sell and earn money, while the rest is for
family consumption. Farmers, therefore, obtain the bulk of their annual cash income during the harvest seasons.
Most of the BOP income generating activities are part of a daily routine and involve working during most of the
daytime hours.
Men dominate the formal employment sector, whereas most women earn their income as entrepreneurs in the
informal sector, and this is more evident in the rural areas — most SMEs in Tanzania are owned by women. The
male-female earnings disparity is noticeable, since women spend a large portion of their day on labor intensive,
time consuming tasks at home or in the field (agriculture). This opportunity cost of time is linked to the over-
reliance on biomass for lighting, cooking and heating in rural areas. From a very young age women spend an
average of 6 hours per day collecting wood fuels for household usage, which takes away time that could be used
for education and other self-improvement (productive engagement) activities that could lead to economic
advancement for them and their families.
The incomes generated vary considerably depending on what activity is being undertaken, but it is generally low
and provides only a subsistence living for most households. Certain regions have better agro-environments
enabling those living there to obtain bigger incomes. For example, Mbeya rural families cultivate the cash crop
coffee and are thus able to obtain higher revenues than other regions dependent on less marketable
commodities. Both men and women collaborate to bring income into the house, even children participate in
income generation when not in school, e.g. assist parents to sell fruits and vegetables in the market.
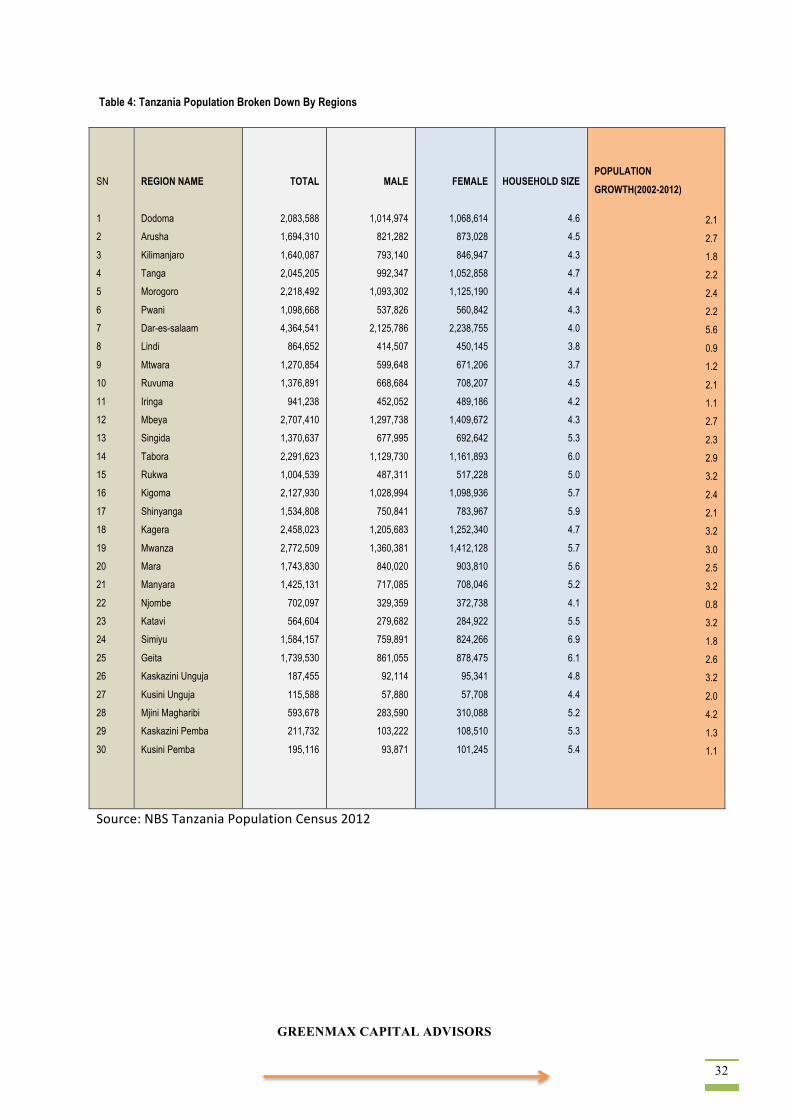
The population demographics broken down by regions are shown on the Table 4 below.
GREENMAX CAPITAL ADVISORS 32
Table 4: Tanzania Population Broken Down By Regions
SN
1
2
3
4
5
6
7
8
9
10
11
12
13
14
15
16
17
18
19
20
21
22
23
24
25
26
27
28
29
30
REGION NAME
Dodoma
Arusha
Kilimanjaro
Tanga
Morogoro
Pwani
Dar-es-salaam
Lindi
Mtwara
Ruvuma
Iringa
Mbeya
Singida
Tabora
Rukwa
Kigoma
Shinyanga
Kagera
Mwanza
Mara
Manyara
Njombe
Katavi
Simiyu
Geita
Kaskazini Unguja
Kusini Unguja
Mjini Magharibi
Kaskazini Pemba
Kusini Pemba
TOTAL
2,083,588
1,694,310
1,640,087
2,045,205
2,218,492
1,098,668
4,364,541
864,652
1,270,854
1,376,891
941,238
2,707,410
1,370,637
2,291,623
1,004,539
2,127,930
1,534,808
2,458,023
2,772,509
1,743,830
1,425,131
702,097
564,604
1,584,157
1,739,530
187,455
115,588
593,678
211,732
195,116
MALE
1,014,974
821,282
793,140
992,347
1,093,302
537,826
2,125,786
414,507
599,648
668,684
452,052
1,297,738
677,995
1,129,730
487,311
1,028,994
750,841
1,205,683
1,360,381
840,020
717,085
329,359
279,682
759,891
861,055
92,114
57,880
283,590
103,222
93,871
FEMALE
1,068,614
873,028
846,947
1,052,858
1,125,190
560,842
2,238,755
450,145
671,206
708,207
489,186
1,409,672
692,642
1,161,893
517,228
1,098,936
783,967
1,252,340
1,412,128
903,810
708,046
372,738
284,922
824,266
878,475
95,341
57,708
310,088
108,510
101,245
HOUSEHOLD SIZE
4.6
4.5
4.3
4.7
4.4
4.3
4.0
3.8
3.7
4.5
4.2
4.3
5.3
6.0
5.0
5.7
5.9
4.7
5.7
5.6
5.2
4.1
5.5
6.9
6.1
4.8
4.4
5.2
5.3
5.4
POPULATION GROWTH(2002-2012)
2.1
2.7
1.8
2.2
2.4
2.2
5.6
0.9
1.2
2.1
1.1
2.7
2.3
2.9
3.2
2.4
2.1
3.2
3.0
2.5
3.2
0.8
3.2
1.8
2.6
3.2
2.0
4.2
1.3
1.1
Source: NBS Tanzania Population Census 2012

Lighting Africa Tanzania Market Intelligence, Appendices
GREENMAX CAPITAL ADVISORS 33
4.3. Household Budget The following estimates are based on the market information collected during Focus Group discussions. The
samples selected were of households representing the typical socio-economic clusters of mainland Tanzania.
The figures presented are, however, indicative of the BOP rural and peri-urban households.
The average rural household has 4 to 6 family-members, while a peri-urban household usually consists of 2 to 4
family-members. Within the typical BOP household, men are viewed as the head of the household in the vast
majority of cases and are expected to provide income (mainly in terms of monetary funds) for the family, while
women manage the household activities (which in many cases could be worth more in monetary terms if their
engagement in day-to-day household activities were paid). Ultimately, women decide on household budget
spending, although in most cases the decision-making is a collaborative effort within the family and at times even
involves children in an active role with a real voice. There is little financial planning and thus a lot of uncertainty
about household budget spending, in part due to the seasonality of agricultural earnings. Due to the irregular
amount of income earnings throughout the year, the market introduction of any new technologies should consider
the period when the households’ earning value is better compared to other regular times. The composition of
family members also determines the household budget.
Typical daily expenses for food bought by cash for rural households total about USD1.25 (TSh 2,000) and about
USD12.50 (TSh 20,000) for urban households for at least 2 main meals for a family of size seven. Part of the
discrepancy in expenses is because rural households typically produce a major portion of their own food and
therefore spend money only on additional items such as animal protein and sugar. BOP households normally buy
most food items on a daily basis, and not in bulk. This is especially true for peri-urban families, while rural
families tend to store part of the harvest for consumption for as long as it will last, before they start buying more.
For example, maize is stored in its seed form and when the time comes the women go to the millers to grind it
into flour. Daily food purchases may therefore be for cooking oil, vegetables, etc.19
Other normal daily expenses include energy for cooking and lighting, water, schooling, health, and transport.
Apart from energy, the other expenses vary from place to place depending on factors such as individual school
requirements, type of health institution and distance from school/work place. The main sources of energy are
charcoal, firewood, and kerosene with rural families obtaining free firewood from forests, typically at considerable
and increasing distances from their homes due to deforestation. The average daily expense for kerosene, which
is mostly used for lighting devices is about USD0.50 (TSh 800). Peri-urban households mostly use charcoal for
cooking and heating, which is purchased at between USD0.60 (TSh 1000) and USD1.25 (TSh 2000) for their
daily needs. When it comes to water services, these are by far the most inadequately supplied in both rural and
peri-urban areas. Most peri-urban households have limited access to the water pipeline, and even when
connected, water is not supplied frequently. Many end up purchasing water from street vendors or from individual
suppliers (carrying water usually pumped from deep wells). Vendors charge higher costs which often are about
USD0.30 for a 20-liter container. This also applies to rural areas where households have very little access to
water services, though street vendors in rural areas are mainly located in villages.
19In this section an FX of USD 1= TSh 1600, was applied which, was the average exchange rate prevailing between the buying
and selling of a USD (LAMIM) as of September 10, 2013.
GREENMAX CAPITAL ADVISORS 34
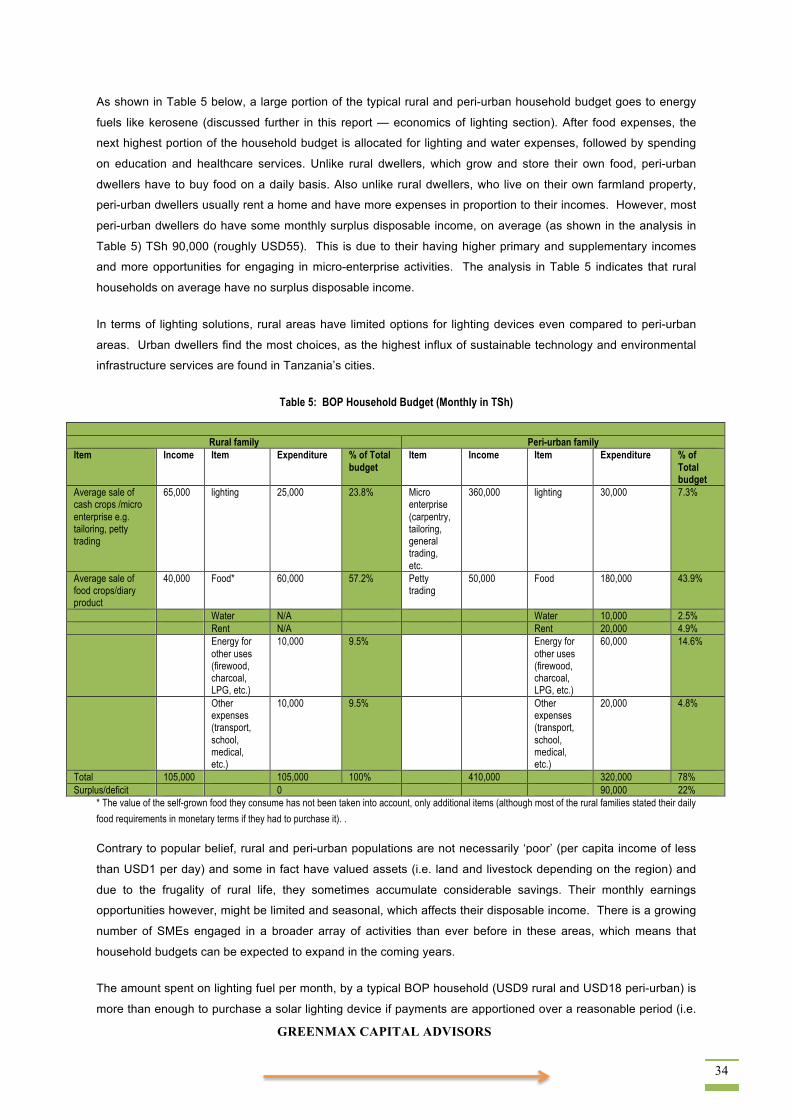
As shown in Table 5 below, a large portion of the typical rural and peri-urban household budget goes to energy
fuels like kerosene (discussed further in this report — economics of lighting section). After food expenses, the
next highest portion of the household budget is allocated for lighting and water expenses, followed by spending
on education and healthcare services. Unlike rural dwellers, which grow and store their own food, peri-urban
dwellers have to buy food on a daily basis. Also unlike rural dwellers, who live on their own farmland property,
peri-urban dwellers usually rent a home and have more expenses in proportion to their incomes. However, most
peri-urban dwellers do have some monthly surplus disposable income, on average (as shown in the analysis in
Table 5) TSh 90,000 (roughly USD55). This is due to their having higher primary and supplementary incomes
and more opportunities for engaging in micro-enterprise activities. The analysis in Table 5 indicates that rural
households on average have no surplus disposable income.
In terms of lighting solutions, rural areas have limited options for lighting devices even compared to peri-urban
areas. Urban dwellers find the most choices, as the highest influx of sustainable technology and environmental
infrastructure services are found in Tanzania’s cities.
Table 5: BOP Household Budget (Monthly in TSh)
Rural family Peri-urban family
Item Income Item Expenditure % of Total budget
Item Income Item Expenditure % of Total budget
Average sale of cash crops /micro enterprise e.g. tailoring, petty trading
65,000 lighting 25,000 23.8% Micro enterprise (carpentry, tailoring, general trading, etc.
360,000 lighting 30,000 7.3%
Average sale of food crops/diary product
40,000 Food* 60,000 57.2% Petty trading
50,000 Food 180,000 43.9%
Water N/A Water 10,000 2.5% Rent N/A Rent 20,000 4.9% Energy for
other uses (firewood, charcoal, LPG, etc.)
10,000 9.5% Energy for other uses (firewood, charcoal, LPG, etc.)
60,000 14.6%
Other expenses (transport, school, medical, etc.)
10,000 9.5% Other expenses (transport, school, medical, etc.)
20,000 4.8%
Total 105,000 105,000 100% 410,000 320,000 78% Surplus/deficit 0 90,000 22%
* The value of the self-grown food they consume has not been taken into account, only additional items (although most of the rural families stated their daily
food requirements in monetary terms if they had to purchase it). .
Contrary to popular belief, rural and peri-urban populations are not necessarily ‘poor’ (per capita income of less
than USD1 per day) and some in fact have valued assets (i.e. land and livestock depending on the region) and
due to the frugality of rural life, they sometimes accumulate considerable savings. Their monthly earnings
opportunities however, might be limited and seasonal, which affects their disposable income. There is a growing
number of SMEs engaged in a broader array of activities than ever before in these areas, which means that
household budgets can be expected to expand in the coming years.
The amount spent on lighting fuel per month, by a typical BOP household (USD9 rural and USD18 peri-urban) is
more than enough to purchase a solar lighting device if payments are apportioned over a reasonable period (i.e.
Lighting Africa Tanzania Market Intelligence, Appendices
GREENMAX CAPITAL ADVISORS 35
with financing). For example, a lantern costing USD30 will require a monthly remittance of USD5 for six months.
With rising amounts of disposable income already spent on existing, poor lighting options, the economics of new
alternatives look attractive on a life cycle basis. Although the analysis in Table 5 indicates that peri urban
households should have enough surplus disposable income to elect to purchase alternative lighting products
without any financing, both peri-urban and rural household participants indicated a high willingness to purchase
these products only when financing was offered. The willingness of consumers to pay for alternative lighting
products, as well as the type of financing needed, are addressed in Sections 6 and 7 of this report.
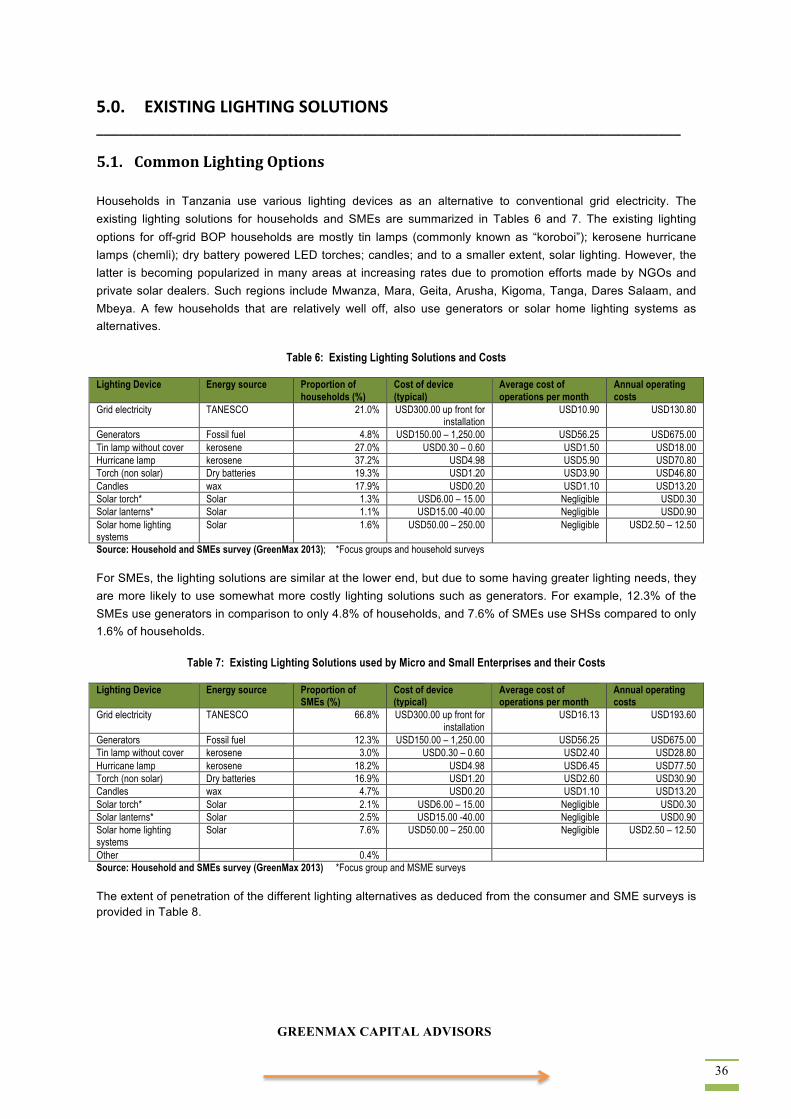
GREENMAX CAPITAL ADVISORS 36
5.0. EXISTING LIGHTING SOLUTIONS _______________________________________________________________________________
5.1. Common Lighting Options Households in Tanzania use various lighting devices as an alternative to conventional grid electricity. The existing lighting solutions for households and SMEs are summarized in Tables 6 and 7. The existing lighting options for off-grid BOP households are mostly tin lamps (commonly known as “koroboi”); kerosene hurricane lamps (chemli); dry battery powered LED torches; candles; and to a smaller extent, solar lighting. However, the latter is becoming popularized in many areas at increasing rates due to promotion efforts made by NGOs and private solar dealers. Such regions include Mwanza, Mara, Geita, Arusha, Kigoma, Tanga, Dares Salaam, and Mbeya. A few households that are relatively well off, also use generators or solar home lighting systems as alternatives.
Table 6: Existing Lighting Solutions and Costs
Lighting Device Energy source Proportion of households (%)
Cost of device (typical)
Average cost of operations per month
Annual operating costs
Grid electricity TANESCO 21.0% USD300.00 up front for installation
USD10.90 USD130.80
Generators Fossil fuel 4.8% USD150.00 – 1,250.00 USD56.25 USD675.00 Tin lamp without cover kerosene 27.0% USD0.30 – 0.60 USD1.50 USD18.00 Hurricane lamp kerosene 37.2% USD4.98 USD5.90 USD70.80 Torch (non solar) Dry batteries 19.3% USD1.20 USD3.90 USD46.80 Candles wax 17.9% USD0.20 USD1.10 USD13.20 Solar torch* Solar 1.3% USD6.00 – 15.00 Negligible USD0.30 Solar lanterns* Solar 1.1% USD15.00 -40.00 Negligible USD0.90 Solar home lighting systems
Solar 1.6% USD50.00 – 250.00 Negligible USD2.50 – 12.50
Source: Household and SMEs survey (GreenMax 2013); *Focus groups and household surveys
For SMEs, the lighting solutions are similar at the lower end, but due to some having greater lighting needs, they are more likely to use somewhat more costly lighting solutions such as generators. For example, 12.3% of the SMEs use generators in comparison to only 4.8% of households, and 7.6% of SMEs use SHSs compared to only 1.6% of households.
Table 7: Existing Lighting Solutions used by Micro and Small Enterprises and their Costs
Lighting Device Energy source Proportion of SMEs (%)
Cost of device (typical)
Average cost of operations per month
Annual operating costs
Grid electricity TANESCO 66.8% USD300.00 up front for installation
USD16.13 USD193.60
Generators Fossil fuel 12.3% USD150.00 – 1,250.00 USD56.25 USD675.00 Tin lamp without cover kerosene 3.0% USD0.30 – 0.60 USD2.40 USD28.80 Hurricane lamp kerosene 18.2% USD4.98 USD6.45 USD77.50 Torch (non solar) Dry batteries 16.9% USD1.20 USD2.60 USD30.90 Candles wax 4.7% USD0.20 USD1.10 USD13.20 Solar torch* Solar 2.1% USD6.00 – 15.00 Negligible USD0.30 Solar lanterns* Solar 2.5% USD15.00 -40.00 Negligible USD0.90 Solar home lighting systems
Solar 7.6% USD50.00 – 250.00 Negligible USD2.50 – 12.50
Other 0.4% Source: Household and SMEs survey (GreenMax 2013) *Focus group and MSME surveys
The extent of penetration of the different lighting alternatives as deduced from the consumer and SME surveys is provided in Table 8.

Lighting Africa Tanzania Market Intelligence, Appendices
GREENMAX CAPITAL ADVISORS 37
Table 8: Proportion of the Sample Using the Following Lighting Devices
Households (374 total) Device used
Generator Lanterns Tin lamps with wick
Candles Dry battery Torch
Solar Torch
Portable solar lanterns
Solar home system
Other
Number 18 139 101 67 72 5 4 6 0 Percent 4.8 37.2 27.0 17.9 19.3 1.3 1.1 1.6 0 Micro Enterprises (236 total) Device used
Generator Lanterns Tin lamps with wick
Candles Dry battery Torch
Solar Torch
Portable solar lanterns
Solar home system
Other
Number 29 43 7 11 40 5 6 18 1 Percent 12.3 18.2 3.0 4.7 16.9 2.1 2.5 7.6 0.4 Source: Household and MSME survey (GreenMax 2013) Total sample size HH = 374.total sample size MSMEs = 236
Only one respondent in this sample, from the Dar es Salaam region, indicated using “other” devices. Previous studies however, indicate that the alternative devices used by a very small fraction of the Tanzanian population include gas lamps, car batteries, pressure lamps and lamps powered by biogas. The focus groups revealed that people in rural areas typically utilize firelight as a natural lighting source, especially in kitchens. This includes the “urumoli,” which are used by Kigoma rural residents. The “urumoli” is a shrub of grass that, when lit, provides a temporary light that is bright enough to facilitate a small task. The Maasai in the Arusha rural area often use burning strips of motor vehicle tires for lighting, and scaring off wild animals, especially hyenas.
Figure 6 below shows the level of household kerosene expenditures differentiated by regions.
Figure 6: Mean Monthly Household Expenditure on Kerosene by Region
Source: Household and MSME survey (GreenMax 2013)
5.2. Characteristics of the Prevalent Lighting Options for the BOP The focus group study revealed that lighting is used for the following tasks:
• Preparing dinner for the family • Kitchen and dining room chores • Caring for infants and small children, especially at night • Caring for the sick • Operating SMEs • Self-care and personal hygiene • Reading
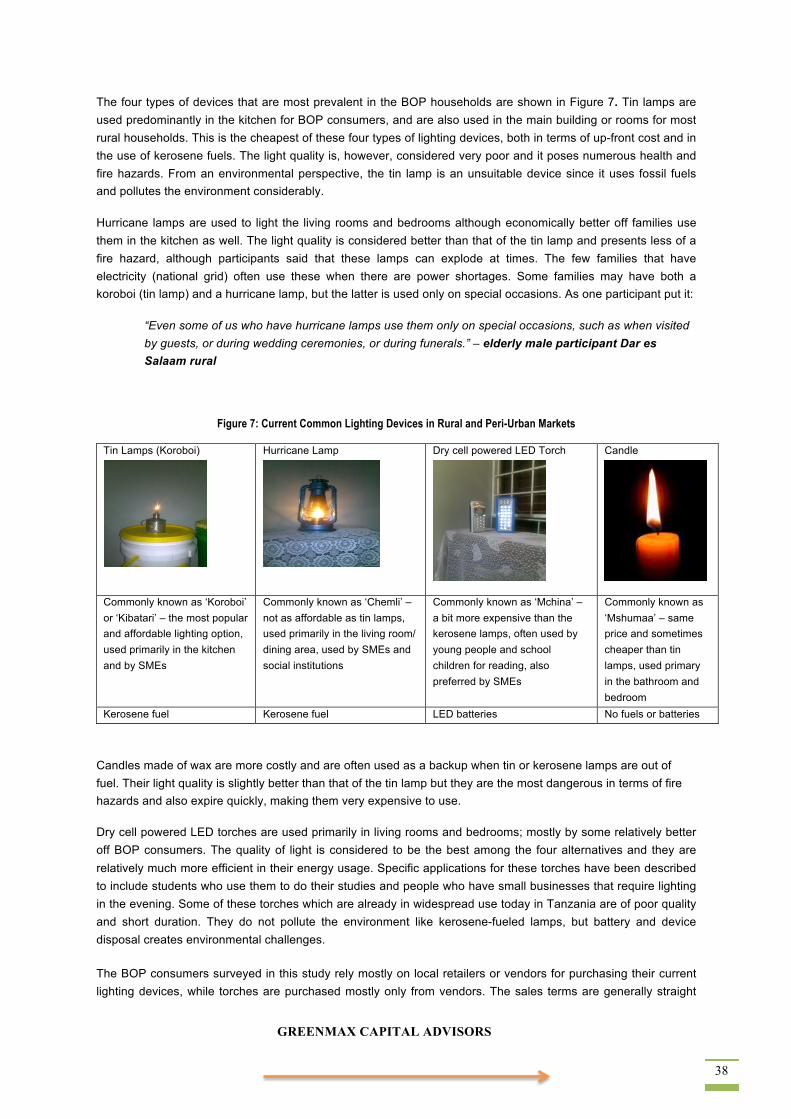
GREENMAX CAPITAL ADVISORS 38
The four types of devices that are most prevalent in the BOP households are shown in Figure 7. Tin lamps are used predominantly in the kitchen for BOP consumers, and are also used in the main building or rooms for most rural households. This is the cheapest of these four types of lighting devices, both in terms of up-front cost and in the use of kerosene fuels. The light quality is, however, considered very poor and it poses numerous health and fire hazards. From an environmental perspective, the tin lamp is an unsuitable device since it uses fossil fuels and pollutes the environment considerably.
Hurricane lamps are used to light the living rooms and bedrooms although economically better off families use them in the kitchen as well. The light quality is considered better than that of the tin lamp and presents less of a fire hazard, although participants said that these lamps can explode at times. The few families that have electricity (national grid) often use these when there are power shortages. Some families may have both a koroboi (tin lamp) and a hurricane lamp, but the latter is used only on special occasions. As one participant put it:
“Even some of us who have hurricane lamps use them only on special occasions, such as when visited by guests, or during wedding ceremonies, or during funerals.” – elderly male participant Dar es Salaam rural
Figure 7: Current Common Lighting Devices in Rural and Peri-Urban Markets
Tin Lamps (Koroboi)
Hurricane Lamp
Dry cell powered LED Torch
Candle
Commonly known as ‘Koroboi’ or ‘Kibatari’ – the most popular and affordable lighting option, used primarily in the kitchen and by SMEs
Commonly known as ‘Chemli’ – not as affordable as tin lamps, used primarily in the living room/ dining area, used by SMEs and social institutions
Commonly known as ‘Mchina’ – a bit more expensive than the kerosene lamps, often used by young people and school children for reading, also preferred by SMEs
Commonly known as ‘Mshumaa’ – same price and sometimes cheaper than tin lamps, used primary in the bathroom and bedroom
Kerosene fuel Kerosene fuel LED batteries No fuels or batteries
Candles made of wax are more costly and are often used as a backup when tin or kerosene lamps are out of fuel. Their light quality is slightly better than that of the tin lamp but they are the most dangerous in terms of fire hazards and also expire quickly, making them very expensive to use.
Dry cell powered LED torches are used primarily in living rooms and bedrooms; mostly by some relatively better off BOP consumers. The quality of light is considered to be the best among the four alternatives and they are relatively much more efficient in their energy usage. Specific applications for these torches have been described to include students who use them to do their studies and people who have small businesses that require lighting in the evening. Some of these torches which are already in widespread use today in Tanzania are of poor quality and short duration. They do not pollute the environment like kerosene-fueled lamps, but battery and device disposal creates environmental challenges.
The BOP consumers surveyed in this study rely mostly on local retailers or vendors for purchasing their current lighting devices, while torches are purchased mostly only from vendors. The sales terms are generally straight
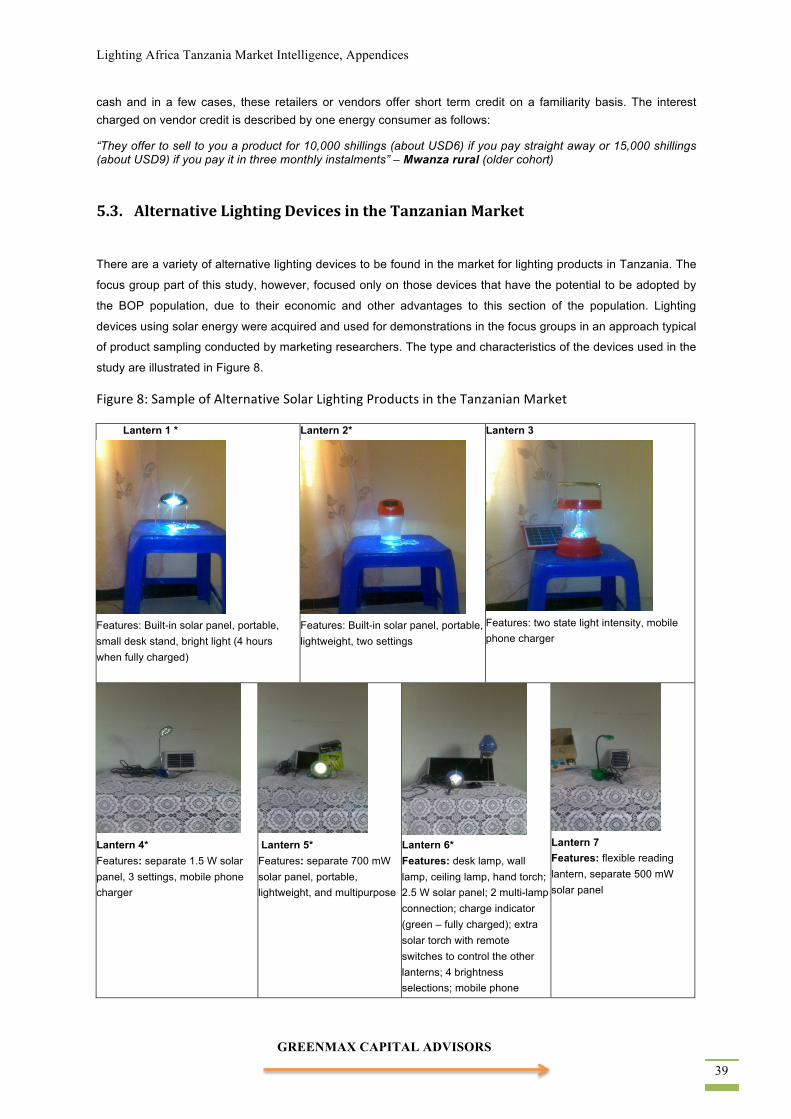
Lighting Africa Tanzania Market Intelligence, Appendices
GREENMAX CAPITAL ADVISORS 39
cash and in a few cases, these retailers or vendors offer short term credit on a familiarity basis. The interest charged on vendor credit is described by one energy consumer as follows:
“They offer to sell to you a product for 10,000 shillings (about USD6) if you pay straight away or 15,000 shillings (about USD9) if you pay it in three monthly instalments” – Mwanza rural (older cohort)
5.3. Alternative Lighting Devices in the Tanzanian Market
There are a variety of alternative lighting devices to be found in the market for lighting products in Tanzania. The
focus group part of this study, however, focused only on those devices that have the potential to be adopted by
the BOP population, due to their economic and other advantages to this section of the population. Lighting
devices using solar energy were acquired and used for demonstrations in the focus groups in an approach typical
of product sampling conducted by marketing researchers. The type and characteristics of the devices used in the
study are illustrated in Figure 8.
Figure 8: Sample of Alternative Solar Lighting Products in the Tanzanian Market
Lantern 1 *
Features: Built-in solar panel, portable, small desk stand, bright light (4 hours when fully charged)
Lantern 2*
Features: Built-in solar panel, portable, lightweight, two settings
Lantern 3
Features: two state light intensity, mobile phone charger
Lantern 4* Features: separate 1.5 W solar panel, 3 settings, mobile phone charger
Lantern 5* Features: separate 700 mW solar panel, portable, lightweight, and multipurpose
Lantern 6* Features: desk lamp, wall lamp, ceiling lamp, hand torch; 2.5 W solar panel; 2 multi-lamp connection; charge indicator (green – fully charged); extra solar torch with remote switches to control the other lanterns; 4 brightness selections; mobile phone
Lantern 7 Features: flexible reading lantern, separate 500 mW solar panel
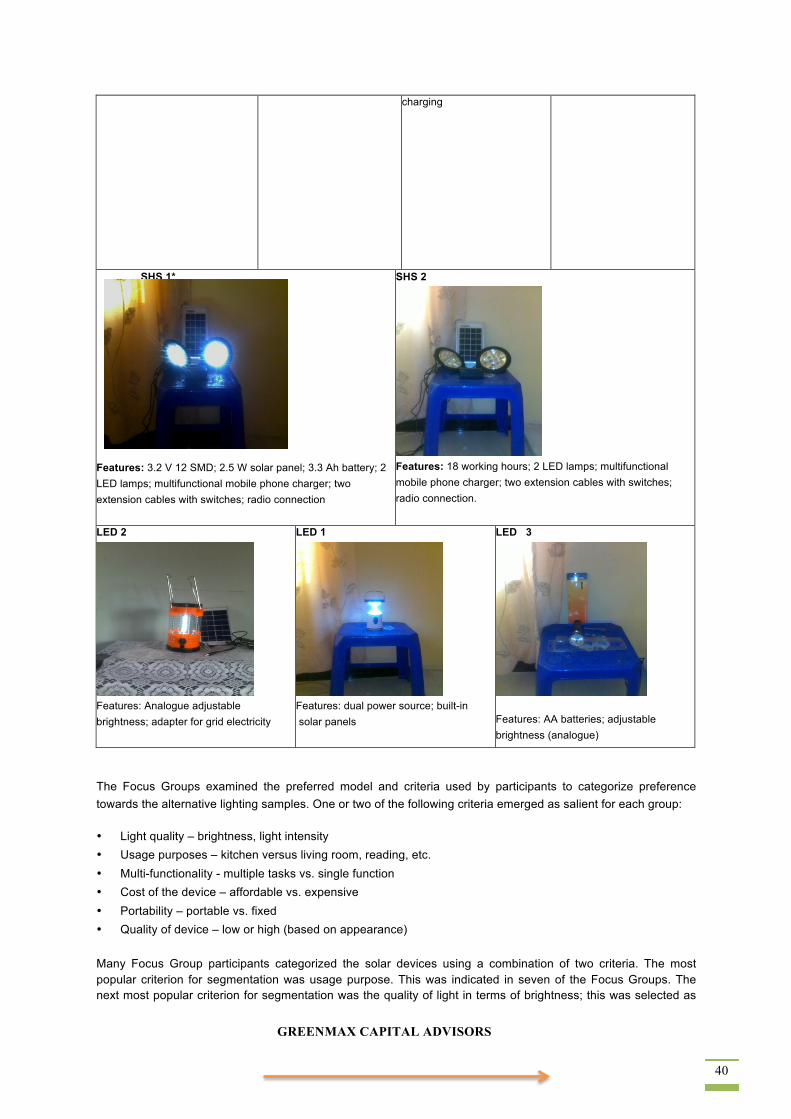
GREENMAX CAPITAL ADVISORS 40
charging
SHS 1*
Features: 3.2 V 12 SMD; 2.5 W solar panel; 3.3 Ah battery; 2 LED lamps; multifunctional mobile phone charger; two extension cables with switches; radio connection
SHS 2
Features: 18 working hours; 2 LED lamps; multifunctional mobile phone charger; two extension cables with switches; radio connection.
LED 2
Features: Analogue adjustable brightness; adapter for grid electricity
LED 1
Features: dual power source; built-in solar panels
LED 3
Features: AA batteries; adjustable brightness (analogue)
The Focus Groups examined the preferred model and criteria used by participants to categorize preference towards the alternative lighting samples. One or two of the following criteria emerged as salient for each group:
• Light quality – brightness, light intensity • Usage purposes – kitchen versus living room, reading, etc. • Multi-functionality - multiple tasks vs. single function • Cost of the device – affordable vs. expensive • Portability – portable vs. fixed • Quality of device – low or high (based on appearance)
Many Focus Group participants categorized the solar devices using a combination of two criteria. The most popular criterion for segmentation was usage purpose. This was indicated in seven of the Focus Groups. The next most popular criterion for segmentation was the quality of light in terms of brightness; this was selected as
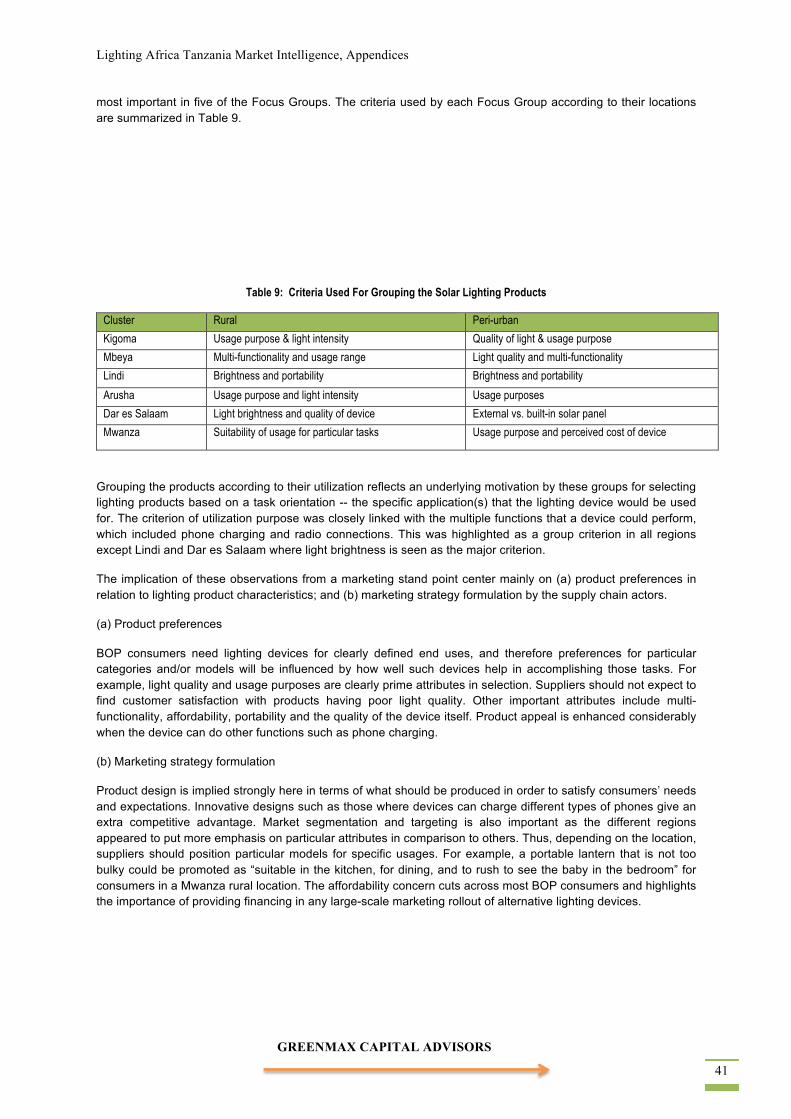
Lighting Africa Tanzania Market Intelligence, Appendices
GREENMAX CAPITAL ADVISORS 41
most important in five of the Focus Groups. The criteria used by each Focus Group according to their locations are summarized in Table 9.
Table 9: Criteria Used For Grouping the Solar Lighting Products
Cluster Rural Peri-urban
Kigoma Usage purpose & light intensity Quality of light & usage purpose
Mbeya Multi-functionality and usage range Light quality and multi-functionality
Lindi Brightness and portability Brightness and portability
Arusha Usage purpose and light intensity Usage purposes
Dar es Salaam Light brightness and quality of device External vs. built-in solar panel
Mwanza Suitability of usage for particular tasks Usage purpose and perceived cost of device
Grouping the products according to their utilization reflects an underlying motivation by these groups for selecting lighting products based on a task orientation -- the specific application(s) that the lighting device would be used for. The criterion of utilization purpose was closely linked with the multiple functions that a device could perform, which included phone charging and radio connections. This was highlighted as a group criterion in all regions except Lindi and Dar es Salaam where light brightness is seen as the major criterion.
The implication of these observations from a marketing stand point center mainly on (a) product preferences in relation to lighting product characteristics; and (b) marketing strategy formulation by the supply chain actors.
(a) Product preferences
BOP consumers need lighting devices for clearly defined end uses, and therefore preferences for particular categories and/or models will be influenced by how well such devices help in accomplishing those tasks. For example, light quality and usage purposes are clearly prime attributes in selection. Suppliers should not expect to find customer satisfaction with products having poor light quality. Other important attributes include multi-functionality, affordability, portability and the quality of the device itself. Product appeal is enhanced considerably when the device can do other functions such as phone charging.
(b) Marketing strategy formulation
Product design is implied strongly here in terms of what should be produced in order to satisfy consumers’ needs and expectations. Innovative designs such as those where devices can charge different types of phones give an extra competitive advantage. Market segmentation and targeting is also important as the different regions appeared to put more emphasis on particular attributes in comparison to others. Thus, depending on the location, suppliers should position particular models for specific usages. For example, a portable lantern that is not too bulky could be promoted as “suitable in the kitchen, for dining, and to rush to see the baby in the bedroom” for consumers in a Mwanza rural location. The affordability concern cuts across most BOP consumers and highlights the importance of providing financing in any large-scale marketing rollout of alternative lighting devices.

GREENMAX CAPITAL ADVISORS 42
6.0. LIGHTING ECONOMICS
6.1. Comparative Life Cycle Costs of Lighting Solutions In Tanzania, the cost of accessing grid-connected electricity is on average higher for BOP consumers than for middle to high-income households, although the differential varies. This is mainly due to the variable costs of bringing new connections to rural and peri-urban areas depending on proximity to the existing grid. The 2011 cost-analysis study on energy spending performed by Maliti and Mnenwa shows that when doing a comparison based on up-front costs, the cost of electricity is far higher than that for kerosene (see Table 10). The cost of using electricity (the expensive cost category) is 16 times higher than the costs for using kerosene (in a similar cost category), this is due to higher fixed costs which are associated with electricity transmission20.
Table 10: Cost Comparison of Energy Sources
Electricity Kerosene
Upfront Costs Cheapest Cost Expensive Cost Cheapest Cost Expensive Cost
Fixed Costs (TSh) 310, 295 377, 045 5,500 13,250
Recurring Cost (TSh) 79,411 79,411 14,840 14,840
Total (TSh) 389, 706 456,456 20,340 28,090
Annualized Costs Cheapest Cost Expensive Cost Cheapest Cost Expensive Cost
Fixed Costs (TSh) 37,816 43,933 637 1,660
Recurring Cost (TSh) 79,411 79,411 14,840 14,840
Total (TSh) 117,227 123,404 15,477 16,500
Source: Cost of Electricity, Kerosene and Liquefied petroleum Gas in Tanzania, Maliti and Mnenwa (2011)
A further analysis of electricity affordability based on income level shows that for the upfront cost of electricity, there’s a TSh 66,750 (~USD41) difference between the cheapest and the most expensive electricity options, which is a very significant spread. Regardless of the subsidies for households located far from power lines (mostly rural or peri-urban) intending to install connections, the amount is still very high to be affordable for most BOP consumers21. Given the high electricity prices, even in the cheapest scenario the cost of kerosene is only 13% of the cost of electricity. With this analysis, grid connected electricity is in fact not an attractive option for BOP consumers — even if it is available, the customer will opt for kerosene because it’s the cheaper option. Therefore the BOP consumer will do better economically with off-grid lighting alternatives, making them a suitable target market segment even in areas targeted for grid connections.
A comparison of costs of lighting products from previous Lighting Africa demographic studies in Tanzania in 200822 with the current study is reflected in Table 11. As shown in this table, the expenditure on kerosene has not changed much — from TSh 400/day (USD 0.25/day) in 2008 to TSh 500/day (USD 0.31) in 2013, but the cost of the lighting devices has doubled — from TSh 150 to 6,000 (USD 0.09 – 3.75) in 2008 to TSh 400 to 12,000 (USD 0.25 -7.50) in 2013. There are of course the issues of exchange rate differences that might explain at least
20(Maliti and Mnenwa, 2011) 21 TANESCO subsidizes connection fees between 30 – 70% depending on the distance from the existing power lines. It also subsidizes consumption by charging a lower tariff to consumers who consume up to 50 KWh per month. Most of these are BOP and it is declared at the beginning during connection time. (Those who fraudulently consume more than the limit are penalized severely). 222011 Lighting Africa Synthesis Report shows that many BOP consumers already allocate a substantial part of their household budget spending on lighting. Information on these products is scarce and there is limited access since many suppliers prefer conducting business in more lucrative cities like Dar es Salaam, Arusha and Mwanza, all of which have a growing solar market.
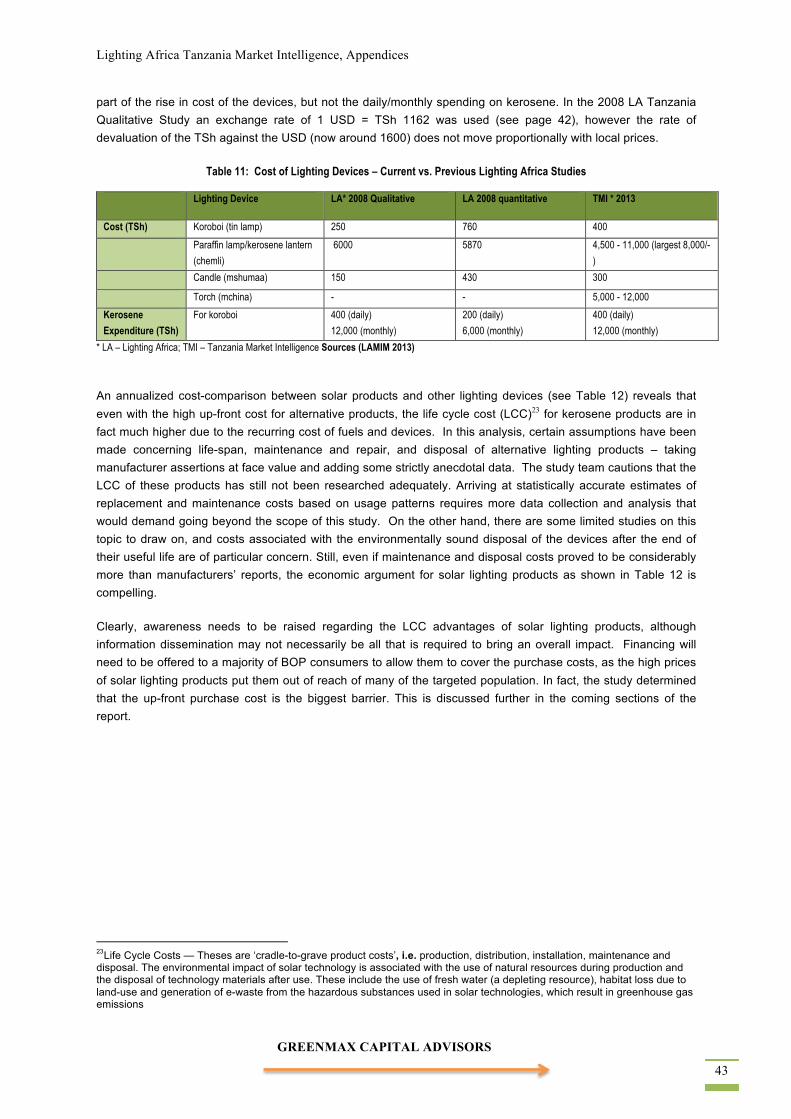
Lighting Africa Tanzania Market Intelligence, Appendices
GREENMAX CAPITAL ADVISORS 43
part of the rise in cost of the devices, but not the daily/monthly spending on kerosene. In the 2008 LA Tanzania Qualitative Study an exchange rate of 1 USD = TSh 1162 was used (see page 42), however the rate of devaluation of the TSh against the USD (now around 1600) does not move proportionally with local prices.
Table 11: Cost of Lighting Devices – Current vs. Previous Lighting Africa Studies
Lighting Device LA* 2008 Qualitative LA 2008 quantitative TMI * 2013
Cost (TSh) Koroboi (tin lamp) 250 760 400
Paraffin lamp/kerosene lantern
(chemli)
6000 5870 4,500 - 11,000 (largest 8,000/-
)
Candle (mshumaa) 150 430 300
Torch (mchina) - - 5,000 - 12,000
Kerosene Expenditure (TSh)
For koroboi 400 (daily)
12,000 (monthly)
200 (daily)
6,000 (monthly)
400 (daily)
12,000 (monthly)
* LA – Lighting Africa; TMI – Tanzania Market Intelligence Sources (LAMIM 2013)
An annualized cost-comparison between solar products and other lighting devices (see Table 12) reveals that even with the high up-front cost for alternative products, the life cycle cost (LCC)23 for kerosene products are in fact much higher due to the recurring cost of fuels and devices. In this analysis, certain assumptions have been made concerning life-span, maintenance and repair, and disposal of alternative lighting products – taking manufacturer assertions at face value and adding some strictly anecdotal data. The study team cautions that the LCC of these products has still not been researched adequately. Arriving at statistically accurate estimates of replacement and maintenance costs based on usage patterns requires more data collection and analysis that would demand going beyond the scope of this study. On the other hand, there are some limited studies on this topic to draw on, and costs associated with the environmentally sound disposal of the devices after the end of their useful life are of particular concern. Still, even if maintenance and disposal costs proved to be considerably more than manufacturers’ reports, the economic argument for solar lighting products as shown in Table 12 is compelling.
Clearly, awareness needs to be raised regarding the LCC advantages of solar lighting products, although information dissemination may not necessarily be all that is required to bring an overall impact. Financing will need to be offered to a majority of BOP consumers to allow them to cover the purchase costs, as the high prices of solar lighting products put them out of reach of many of the targeted population. In fact, the study determined that the up-front purchase cost is the biggest barrier. This is discussed further in the coming sections of the report.
23Life Cycle Costs — Theses are ‘cradle-to-grave product costs’, i.e. production, distribution, installation, maintenance and disposal. The environmental impact of solar technology is associated with the use of natural resources during production and the disposal of technology materials after use. These include the use of fresh water (a depleting resource), habitat loss due to land-use and generation of e-waste from the hazardous substances used in solar technologies, which result in greenhouse gas emissions
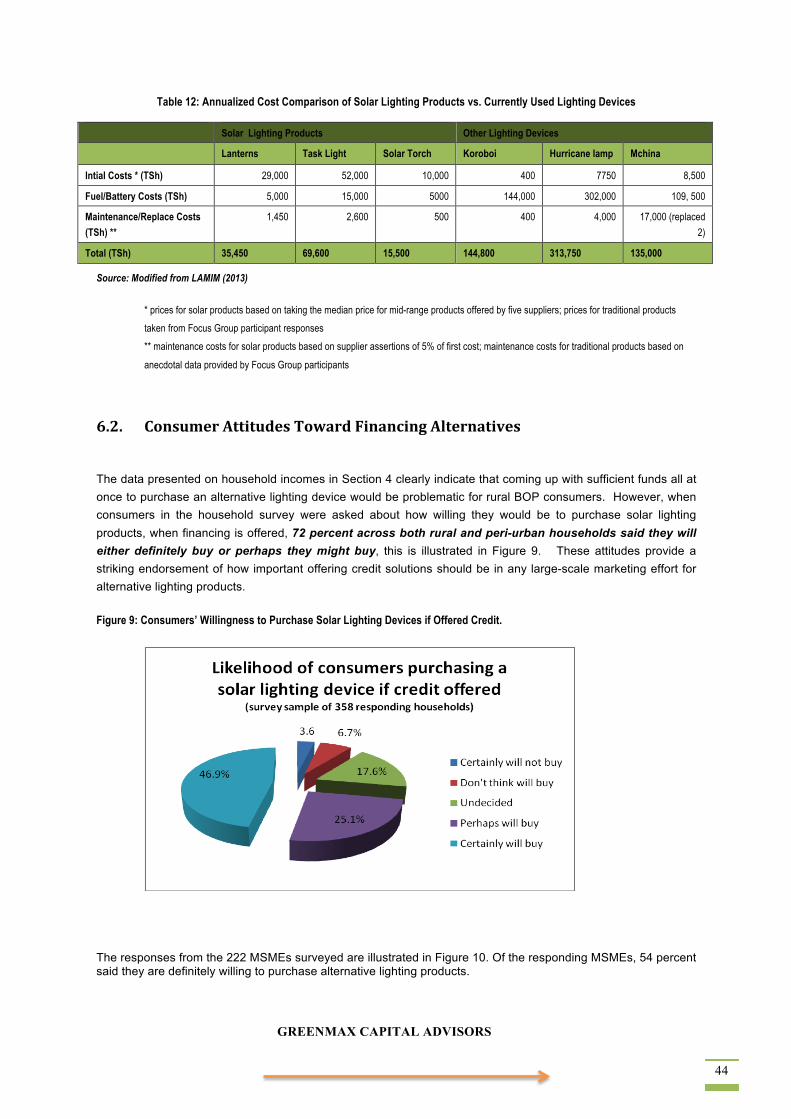
GREENMAX CAPITAL ADVISORS 44
Table 12: Annualized Cost Comparison of Solar Lighting Products vs. Currently Used Lighting Devices
Solar Lighting Products Other Lighting Devices
Lanterns Task Light Solar Torch Koroboi Hurricane lamp Mchina
Intial Costs * (TSh) 29,000 52,000 10,000 400 7750 8,500
Fuel/Battery Costs (TSh) 5,000 15,000 5000 144,000 302,000 109, 500
Maintenance/Replace Costs (TSh) **
1,450 2,600
500 400 4,000 17,000 (replaced
2)
Total (TSh) 35,450 69,600 15,500 144,800 313,750 135,000
Source: Modified from LAMIM (2013)
* prices for solar products based on taking the median price for mid-range products offered by five suppliers; prices for traditional products
taken from Focus Group participant responses
** maintenance costs for solar products based on supplier assertions of 5% of first cost; maintenance costs for traditional products based on
anecdotal data provided by Focus Group participants
6.2. Consumer Attitudes Toward Financing Alternatives
The data presented on household incomes in Section 4 clearly indicate that coming up with sufficient funds all at once to purchase an alternative lighting device would be problematic for rural BOP consumers. However, when consumers in the household survey were asked about how willing they would be to purchase solar lighting products, when financing is offered, 72 percent across both rural and peri-urban households said they will either definitely buy or perhaps they might buy, this is illustrated in Figure 9. These attitudes provide a striking endorsement of how important offering credit solutions should be in any large-scale marketing effort for alternative lighting products.
Figure 9: Consumers’ Willingness to Purchase Solar Lighting Devices if Offered Credit.
The responses from the 222 MSMEs surveyed are illustrated in Figure 10. Of the responding MSMEs, 54 percent said they are definitely willing to purchase alternative lighting products.
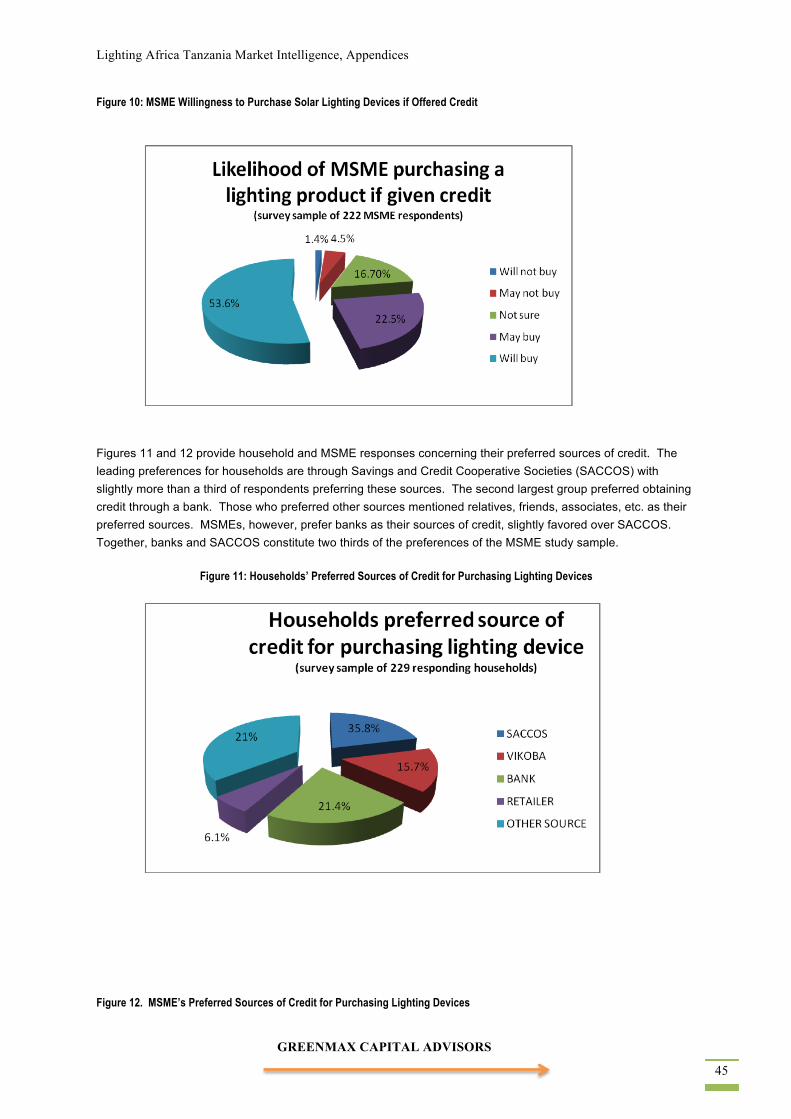
Lighting Africa Tanzania Market Intelligence, Appendices
GREENMAX CAPITAL ADVISORS 45
Figure 10: MSME Willingness to Purchase Solar Lighting Devices if Offered Credit
Figures 11 and 12 provide household and MSME responses concerning their preferred sources of credit. The leading preferences for households are through Savings and Credit Cooperative Societies (SACCOS) with slightly more than a third of respondents preferring these sources. The second largest group preferred obtaining credit through a bank. Those who preferred other sources mentioned relatives, friends, associates, etc. as their preferred sources. MSMEs, however, prefer banks as their sources of credit, slightly favored over SACCOS. Together, banks and SACCOS constitute two thirds of the preferences of the MSME study sample.
Figure 11: Households’ Preferred Sources of Credit for Purchasing Lighting Devices
Figure 12. MSME’s Preferred Sources of Credit for Purchasing Lighting Devices
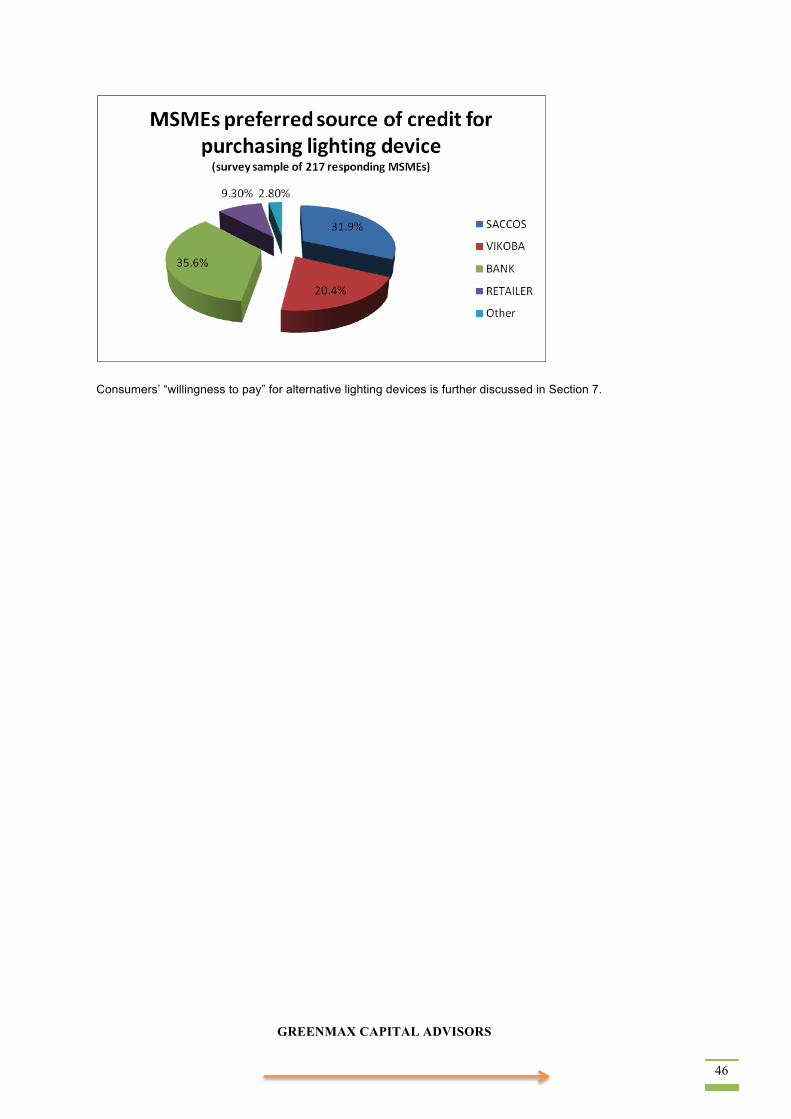
GREENMAX CAPITAL ADVISORS 46
Consumers’ “willingness to pay” for alternative lighting devices is further discussed in Section 7.
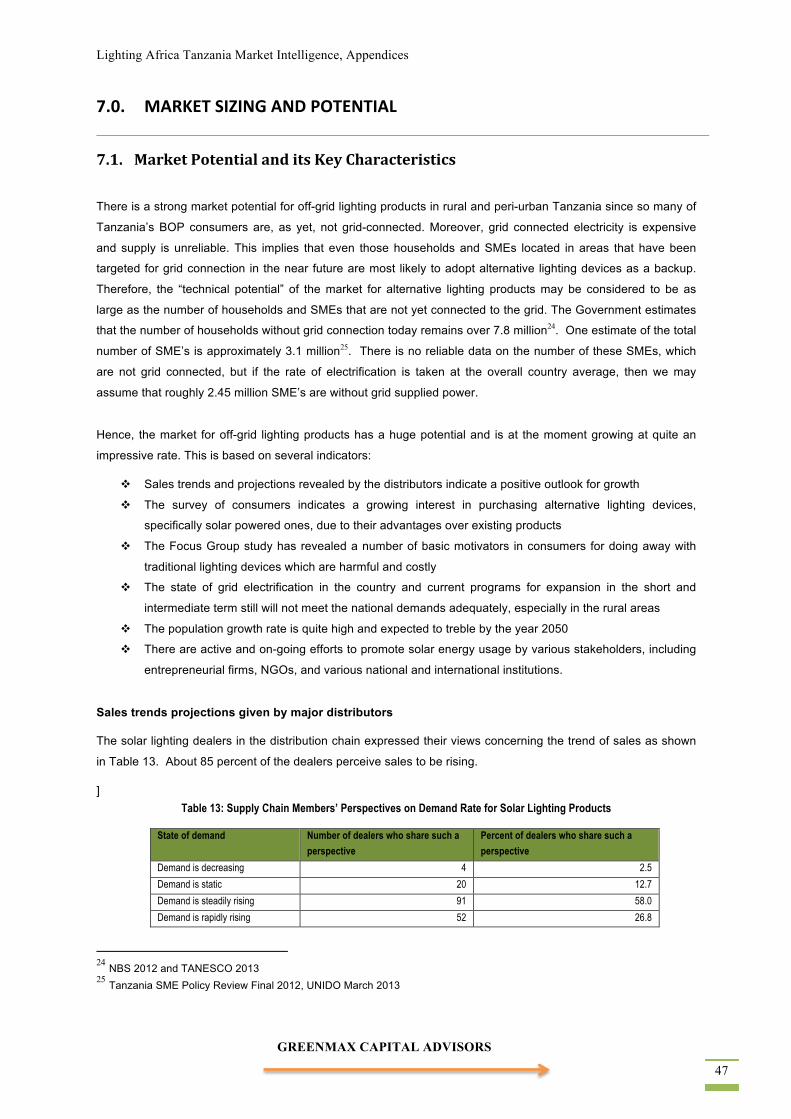
Lighting Africa Tanzania Market Intelligence, Appendices
GREENMAX CAPITAL ADVISORS 47
7.0. MARKET SIZING AND POTENTIAL
7.1. Market Potential and its Key Characteristics
There is a strong market potential for off-grid lighting products in rural and peri-urban Tanzania since so many of
Tanzania’s BOP consumers are, as yet, not grid-connected. Moreover, grid connected electricity is expensive
and supply is unreliable. This implies that even those households and SMEs located in areas that have been
targeted for grid connection in the near future are most likely to adopt alternative lighting devices as a backup.
Therefore, the “technical potential” of the market for alternative lighting products may be considered to be as
large as the number of households and SMEs that are not yet connected to the grid. The Government estimates
that the number of households without grid connection today remains over 7.8 million24. One estimate of the total
number of SME’s is approximately 3.1 million25. There is no reliable data on the number of these SMEs, which
are not grid connected, but if the rate of electrification is taken at the overall country average, then we may
assume that roughly 2.45 million SME’s are without grid supplied power.
Hence, the market for off-grid lighting products has a huge potential and is at the moment growing at quite an
impressive rate. This is based on several indicators:
Sales trends and projections revealed by the distributors indicate a positive outlook for growth
The survey of consumers indicates a growing interest in purchasing alternative lighting devices,
specifically solar powered ones, due to their advantages over existing products
The Focus Group study has revealed a number of basic motivators in consumers for doing away with
traditional lighting devices which are harmful and costly
The state of grid electrification in the country and current programs for expansion in the short and
intermediate term still will not meet the national demands adequately, especially in the rural areas
The population growth rate is quite high and expected to treble by the year 2050
There are active and on-going efforts to promote solar energy usage by various stakeholders, including
entrepreneurial firms, NGOs, and various national and international institutions.
Sales trends projections given by major distributors
The solar lighting dealers in the distribution chain expressed their views concerning the trend of sales as shown
in Table 13. About 85 percent of the dealers perceive sales to be rising.
] Table 13: Supply Chain Members’ Perspectives on Demand Rate for Solar Lighting Products
State of demand Number of dealers who share such a perspective
Percent of dealers who share such a perspective
Demand is decreasing 4 2.5
Demand is static 20 12.7
Demand is steadily rising 91 58.0
Demand is rapidly rising 52 26.8
24 NBS 2012 and TANESCO 2013 25 Tanzania SME Policy Review Final 2012, UNIDO March 2013
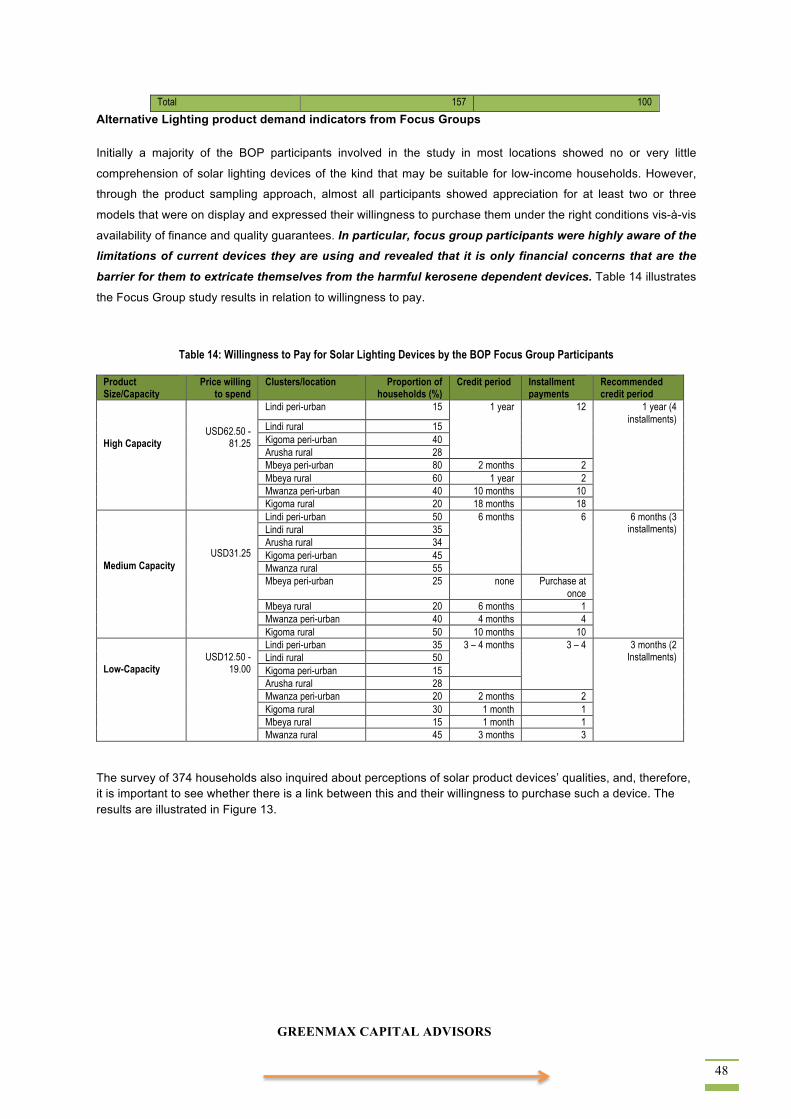
GREENMAX CAPITAL ADVISORS 48
Total 157 100
Alternative Lighting product demand indicators from Focus Groups
Initially a majority of the BOP participants involved in the study in most locations showed no or very little
comprehension of solar lighting devices of the kind that may be suitable for low-income households. However,
through the product sampling approach, almost all participants showed appreciation for at least two or three
models that were on display and expressed their willingness to purchase them under the right conditions vis-à-vis
availability of finance and quality guarantees. In particular, focus group participants were highly aware of the limitations of current devices they are using and revealed that it is only financial concerns that are the
barrier for them to extricate themselves from the harmful kerosene dependent devices. Table 14 illustrates
the Focus Group study results in relation to willingness to pay.
Table 14: Willingness to Pay for Solar Lighting Devices by the BOP Focus Group Participants
Product Size/Capacity
Price willing to spend
Clusters/location Proportion of households (%)
Credit period Installment payments
Recommended credit period
High Capacity
USD62.50 - 81.25
Lindi peri-urban 15 1 year 12 1 year (4 installments)
Lindi rural 15 Kigoma peri-urban 40 Arusha rural 28 Mbeya peri-urban 80 2 months 2 Mbeya rural 60 1 year 2 Mwanza peri-urban 40 10 months 10 Kigoma rural 20 18 months 18
Medium Capacity
USD31.25
Lindi peri-urban 50 6 months 6 6 months (3 installments) Lindi rural 35
Arusha rural 34 Kigoma peri-urban 45 Mwanza rural 55 Mbeya peri-urban 25 none Purchase at
once Mbeya rural 20 6 months 1 Mwanza peri-urban 40 4 months 4 Kigoma rural 50 10 months 10
Low-Capacity
USD12.50 -
19.00
Lindi peri-urban 35 3 – 4 months 3 – 4 3 months (2 Installments) Lindi rural 50
Kigoma peri-urban 15 Arusha rural 28 Mwanza peri-urban 20 2 months 2 Kigoma rural 30 1 month 1 Mbeya rural 15 1 month 1 Mwanza rural 45 3 months 3
The survey of 374 households also inquired about perceptions of solar product devices’ qualities, and, therefore, it is important to see whether there is a link between this and their willingness to purchase such a device. The results are illustrated in Figure 13.
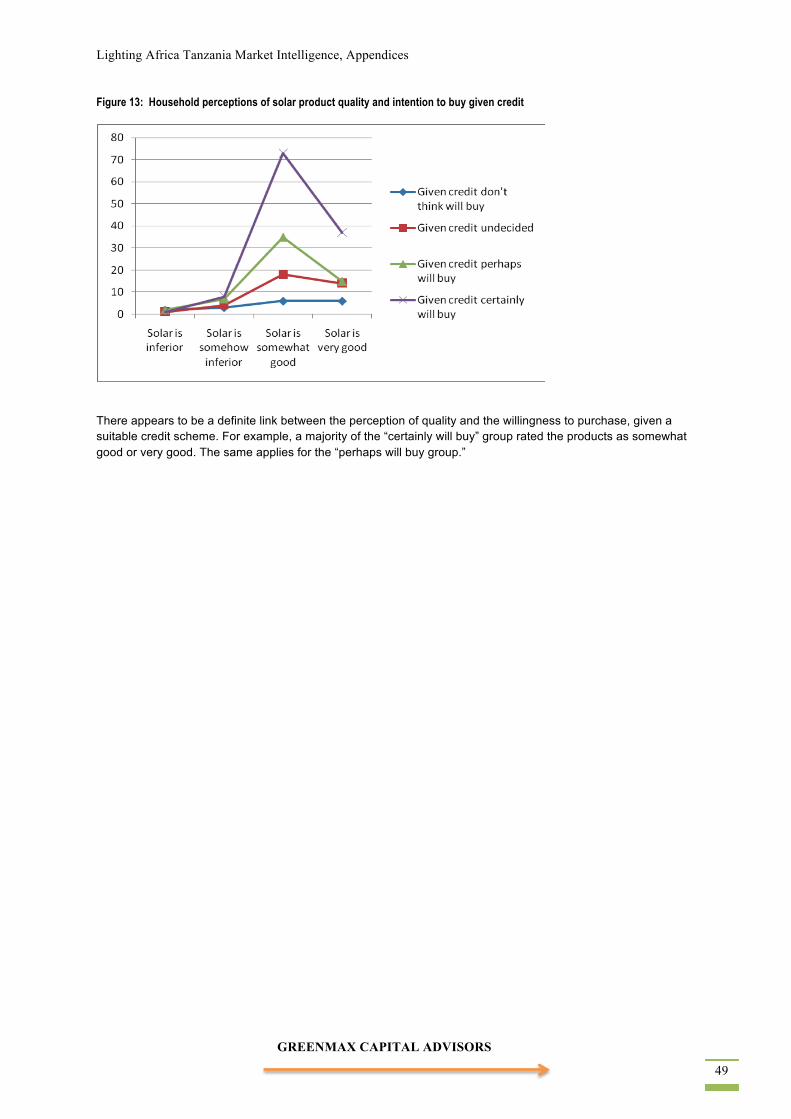
Lighting Africa Tanzania Market Intelligence, Appendices
GREENMAX CAPITAL ADVISORS 49
Figure 13: Household perceptions of solar product quality and intention to buy given credit
There appears to be a definite link between the perception of quality and the willingness to purchase, given a suitable credit scheme. For example, a majority of the “certainly will buy” group rated the products as somewhat good or very good. The same applies for the “perhaps will buy group.”
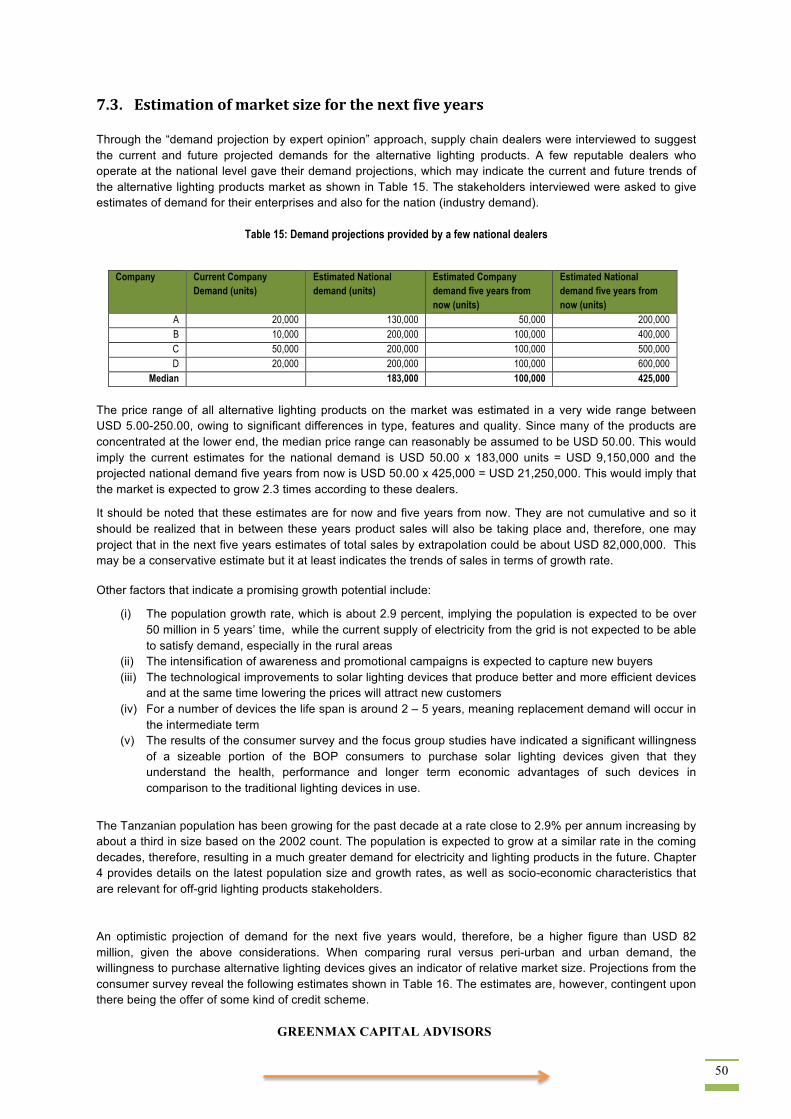
GREENMAX CAPITAL ADVISORS 50
7.3. Estimation of market size for the next five years Through the “demand projection by expert opinion” approach, supply chain dealers were interviewed to suggest the current and future projected demands for the alternative lighting products. A few reputable dealers who operate at the national level gave their demand projections, which may indicate the current and future trends of the alternative lighting products market as shown in Table 15. The stakeholders interviewed were asked to give estimates of demand for their enterprises and also for the nation (industry demand).
Table 15: Demand projections provided by a few national dealers
Company Current Company
Demand (units) Estimated National demand (units)
Estimated Company demand five years from now (units)
Estimated National demand five years from now (units)
A 20,000 130,000 50,000 200,000 B 10,000 200,000 100,000 400,000 C 50,000 200,000 100,000 500,000 D 20,000 200,000 100,000 600,000
Median 183,000 100,000 425,000 The price range of all alternative lighting products on the market was estimated in a very wide range between USD 5.00-250.00, owing to significant differences in type, features and quality. Since many of the products are concentrated at the lower end, the median price range can reasonably be assumed to be USD 50.00. This would imply the current estimates for the national demand is USD 50.00 x 183,000 units = USD 9,150,000 and the projected national demand five years from now is USD 50.00 x 425,000 = USD 21,250,000. This would imply that the market is expected to grow 2.3 times according to these dealers.
It should be noted that these estimates are for now and five years from now. They are not cumulative and so it should be realized that in between these years product sales will also be taking place and, therefore, one may project that in the next five years estimates of total sales by extrapolation could be about USD 82,000,000. This may be a conservative estimate but it at least indicates the trends of sales in terms of growth rate. Other factors that indicate a promising growth potential include:
(i) The population growth rate, which is about 2.9 percent, implying the population is expected to be over 50 million in 5 years’ time, while the current supply of electricity from the grid is not expected to be able to satisfy demand, especially in the rural areas
(ii) The intensification of awareness and promotional campaigns is expected to capture new buyers (iii) The technological improvements to solar lighting devices that produce better and more efficient devices
and at the same time lowering the prices will attract new customers (iv) For a number of devices the life span is around 2 – 5 years, meaning replacement demand will occur in
the intermediate term (v) The results of the consumer survey and the focus group studies have indicated a significant willingness
of a sizeable portion of the BOP consumers to purchase solar lighting devices given that they understand the health, performance and longer term economic advantages of such devices in comparison to the traditional lighting devices in use.
The Tanzanian population has been growing for the past decade at a rate close to 2.9% per annum increasing by about a third in size based on the 2002 count. The population is expected to grow at a similar rate in the coming decades, therefore, resulting in a much greater demand for electricity and lighting products in the future. Chapter 4 provides details on the latest population size and growth rates, as well as socio-economic characteristics that are relevant for off-grid lighting products stakeholders.
An optimistic projection of demand for the next five years would, therefore, be a higher figure than USD 82 million, given the above considerations. When comparing rural versus peri-urban and urban demand, the willingness to purchase alternative lighting devices gives an indicator of relative market size. Projections from the consumer survey reveal the following estimates shown in Table 16. The estimates are, however, contingent upon there being the offer of some kind of credit scheme.
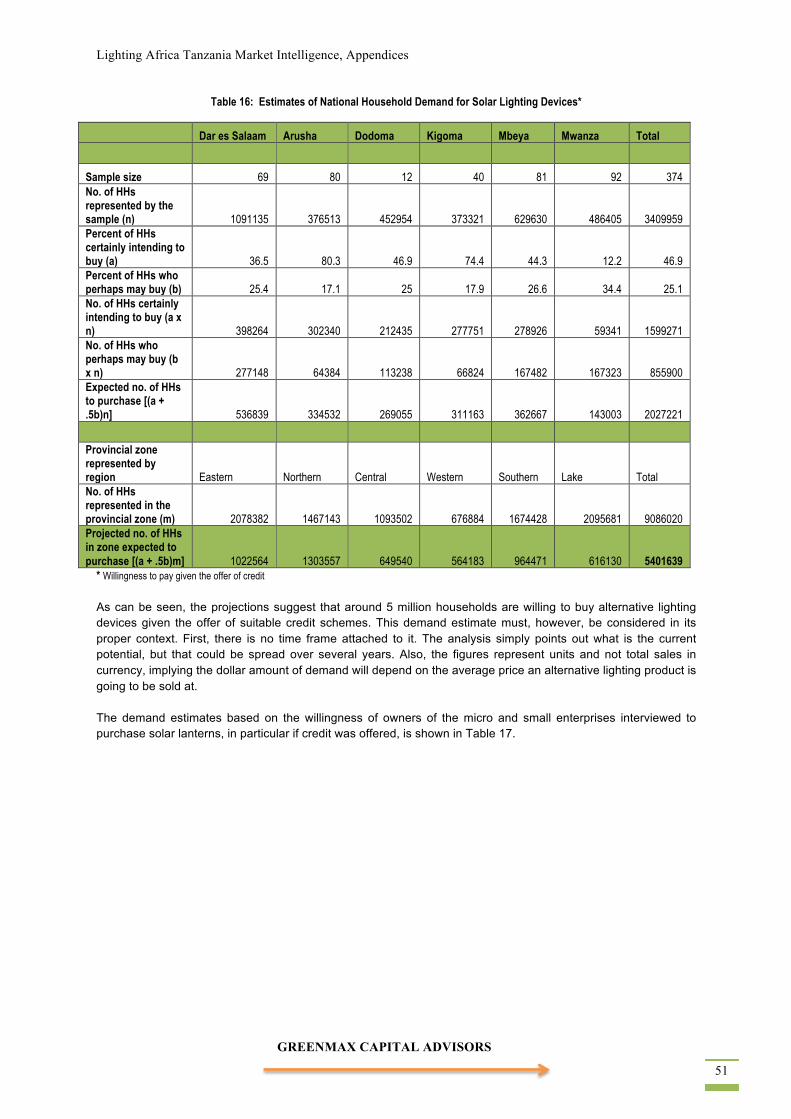
Lighting Africa Tanzania Market Intelligence, Appendices
GREENMAX CAPITAL ADVISORS 51
Table 16: Estimates of National Household Demand for Solar Lighting Devices*
Dar es Salaam Arusha Dodoma Kigoma Mbeya Mwanza Total
Sample size 69 80 12 40 81 92 374 No. of HHs represented by the sample (n) 1091135 376513 452954 373321 629630 486405 3409959 Percent of HHs certainly intending to buy (a) 36.5 80.3 46.9 74.4 44.3 12.2 46.9 Percent of HHs who perhaps may buy (b) 25.4 17.1 25 17.9 26.6 34.4 25.1 No. of HHs certainly intending to buy (a x n) 398264 302340 212435 277751 278926 59341 1599271 No. of HHs who perhaps may buy (b x n) 277148 64384 113238 66824 167482 167323 855900 Expected no. of HHs to purchase [(a + .5b)n] 536839 334532 269055 311163 362667 143003 2027221
Provincial zone represented by region Eastern Northern Central Western Southern Lake Total No. of HHs represented in the provincial zone (m) 2078382 1467143 1093502 676884 1674428 2095681 9086020 Projected no. of HHs in zone expected to purchase [(a + .5b)m] 1022564 1303557 649540 564183 964471 616130 5401639
* Willingness to pay given the offer of credit As can be seen, the projections suggest that around 5 million households are willing to buy alternative lighting devices given the offer of suitable credit schemes. This demand estimate must, however, be considered in its proper context. First, there is no time frame attached to it. The analysis simply points out what is the current potential, but that could be spread over several years. Also, the figures represent units and not total sales in currency, implying the dollar amount of demand will depend on the average price an alternative lighting product is going to be sold at. The demand estimates based on the willingness of owners of the micro and small enterprises interviewed to purchase solar lanterns, in particular if credit was offered, is shown in Table 17.
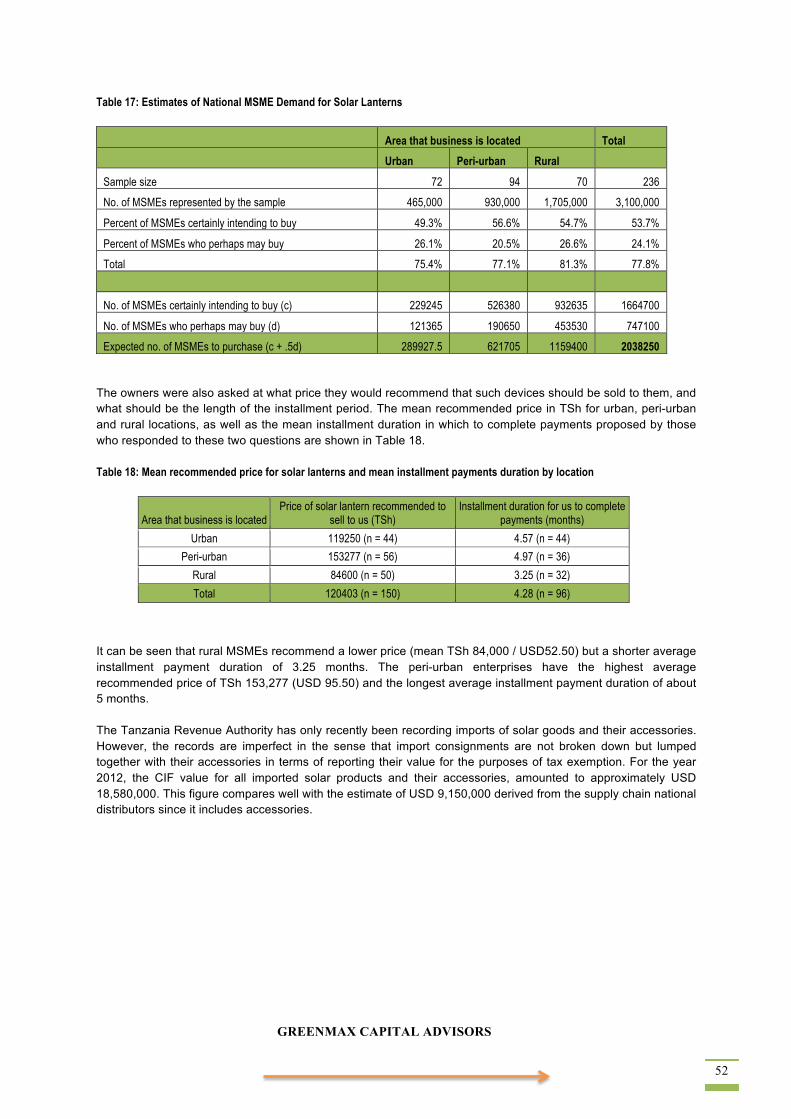
GREENMAX CAPITAL ADVISORS 52
Table 17: Estimates of National MSME Demand for Solar Lanterns
Area that business is located Total
Urban Peri-urban Rural
Sample size 72 94 70 236
No. of MSMEs represented by the sample 465,000 930,000 1,705,000 3,100,000
Percent of MSMEs certainly intending to buy 49.3% 56.6% 54.7% 53.7%
Percent of MSMEs who perhaps may buy 26.1% 20.5% 26.6% 24.1%
Total 75.4% 77.1% 81.3% 77.8%
No. of MSMEs certainly intending to buy (c) 229245 526380 932635 1664700
No. of MSMEs who perhaps may buy (d) 121365 190650 453530 747100
Expected no. of MSMEs to purchase (c + .5d) 289927.5 621705 1159400 2038250 The owners were also asked at what price they would recommend that such devices should be sold to them, and what should be the length of the installment period. The mean recommended price in TSh for urban, peri-urban and rural locations, as well as the mean installment duration in which to complete payments proposed by those who responded to these two questions are shown in Table 18. Table 18: Mean recommended price for solar lanterns and mean installment payments duration by location
Area that business is located Price of solar lantern recommended to
sell to us (TSh) Installment duration for us to complete
payments (months)
Urban 119250 (n = 44) 4.57 (n = 44)
Peri-urban 153277 (n = 56) 4.97 (n = 36)
Rural 84600 (n = 50) 3.25 (n = 32)
Total 120403 (n = 150) 4.28 (n = 96)
It can be seen that rural MSMEs recommend a lower price (mean TSh 84,000 / USD52.50) but a shorter average installment payment duration of 3.25 months. The peri-urban enterprises have the highest average recommended price of TSh 153,277 (USD 95.50) and the longest average installment payment duration of about 5 months. The Tanzania Revenue Authority has only recently been recording imports of solar goods and their accessories. However, the records are imperfect in the sense that import consignments are not broken down but lumped together with their accessories in terms of reporting their value for the purposes of tax exemption. For the year 2012, the CIF value for all imported solar products and their accessories, amounted to approximately USD 18,580,000. This figure compares well with the estimate of USD 9,150,000 derived from the supply chain national distributors since it includes accessories.
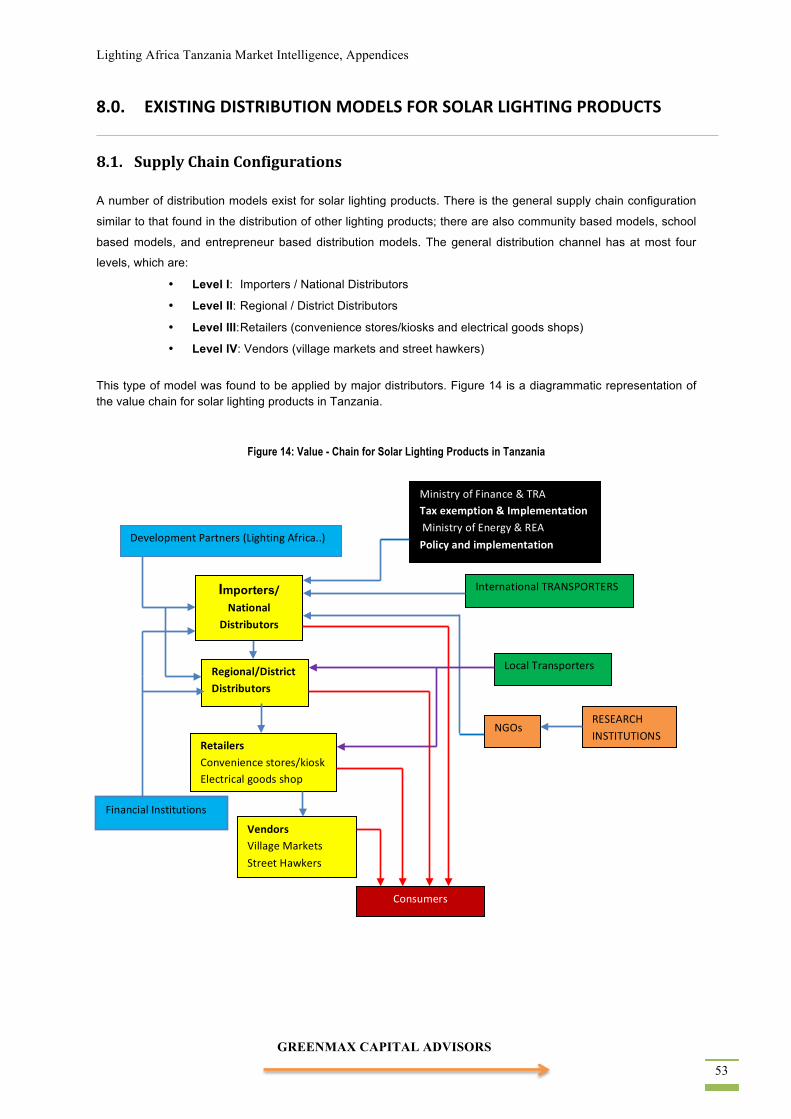
Lighting Africa Tanzania Market Intelligence, Appendices
GREENMAX CAPITAL ADVISORS 53
8.0. EXISTING DISTRIBUTION MODELS FOR SOLAR LIGHTING PRODUCTS
8.1. Supply Chain Configurations A number of distribution models exist for solar lighting products. There is the general supply chain configuration
similar to that found in the distribution of other lighting products; there are also community based models, school
based models, and entrepreneur based distribution models. The general distribution channel has at most four
levels, which are:
• Level I: Importers / National Distributors
• Level II: Regional / District Distributors
• Level III: Retailers (convenience stores/kiosks and electrical goods shops)
• Level IV: Vendors (village markets and street hawkers)
This type of model was found to be applied by major distributors. Figure 14 is a diagrammatic representation of the value chain for solar lighting products in Tanzania.
Figure 14: Value - Chain for Solar Lighting Products in Tanzania
Regional/District Distributors
Importers/ National
Distributors
Vendors Village Markets Street Hawkers
Retailers Convenience stores/kiosk Electrical goods shop
International TRANSPORTERS
Ministry of Finance & TRA Tax exemption & Implementation Ministry of Energy & REA Policy and implementation
Local Transporters
Development Partners (Lighting Africa..)
NGOs RESEARCH INSTITUTIONS
Financial Institutions
Consumers
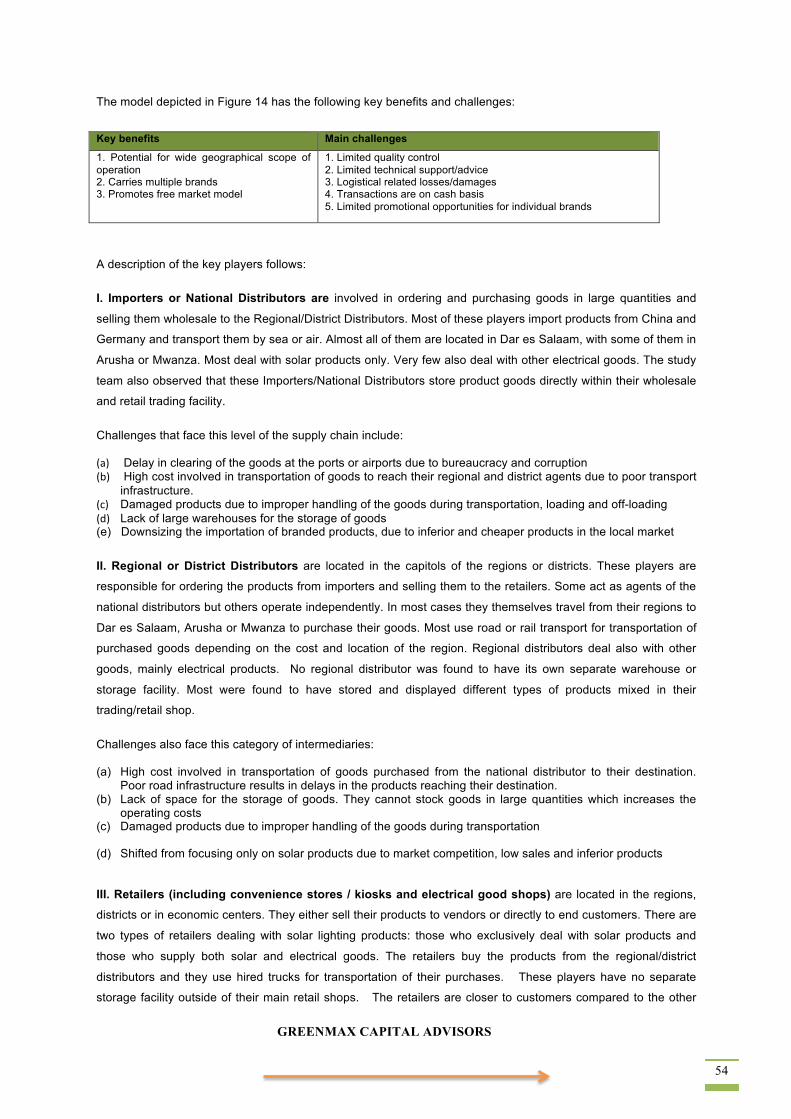
GREENMAX CAPITAL ADVISORS 54
The model depicted in Figure 14 has the following key benefits and challenges:
Key benefits Main challenges
1. Potential for wide geographical scope of operation 2. Carries multiple brands 3. Promotes free market model
1. Limited quality control 2. Limited technical support/advice 3. Logistical related losses/damages 4. Transactions are on cash basis 5. Limited promotional opportunities for individual brands
A description of the key players follows:
I. Importers or National Distributors are involved in ordering and purchasing goods in large quantities and
selling them wholesale to the Regional/District Distributors. Most of these players import products from China and
Germany and transport them by sea or air. Almost all of them are located in Dar es Salaam, with some of them in
Arusha or Mwanza. Most deal with solar products only. Very few also deal with other electrical goods. The study
team also observed that these Importers/National Distributors store product goods directly within their wholesale
and retail trading facility.
Challenges that face this level of the supply chain include:
(a) Delay in clearing of the goods at the ports or airports due to bureaucracy and corruption (b) High cost involved in transportation of goods to reach their regional and district agents due to poor transport
infrastructure. (c) Damaged products due to improper handling of the goods during transportation, loading and off-loading (d) Lack of large warehouses for the storage of goods (e) Downsizing the importation of branded products, due to inferior and cheaper products in the local market
II. Regional or District Distributors are located in the capitols of the regions or districts. These players are
responsible for ordering the products from importers and selling them to the retailers. Some act as agents of the
national distributors but others operate independently. In most cases they themselves travel from their regions to
Dar es Salaam, Arusha or Mwanza to purchase their goods. Most use road or rail transport for transportation of
purchased goods depending on the cost and location of the region. Regional distributors deal also with other
goods, mainly electrical products. No regional distributor was found to have its own separate warehouse or
storage facility. Most were found to have stored and displayed different types of products mixed in their
trading/retail shop.
Challenges also face this category of intermediaries:
(a) High cost involved in transportation of goods purchased from the national distributor to their destination. Poor road infrastructure results in delays in the products reaching their destination.
(b) Lack of space for the storage of goods. They cannot stock goods in large quantities which increases the operating costs
(c) Damaged products due to improper handling of the goods during transportation
(d) Shifted from focusing only on solar products due to market competition, low sales and inferior products
III. Retailers (including convenience stores / kiosks and electrical good shops) are located in the regions,
districts or in economic centers. They either sell their products to vendors or directly to end customers. There are
two types of retailers dealing with solar lighting products: those who exclusively deal with solar products and
those who supply both solar and electrical goods. The retailers buy the products from the regional/district
distributors and they use hired trucks for transportation of their purchases. These players have no separate
storage facility outside of their main retail shops. The retailers are closer to customers compared to the other
Lighting Africa Tanzania Market Intelligence, Appendices
GREENMAX CAPITAL ADVISORS 55
levels in the supply chain. However, they are static, in the sense that they are in fixed locations. This means
buyers have to seek out the retailers for buying goods. The disadvantage for the retailers who deal with both
electrical and modern technologies categories is the lack of specialization in alternative lighting products. They
are not able to vigorously promote these products or even engage customers in dialogue at potential points of
sale. The retailers are generally faced with the following challenges:
(a) General low awareness of customers on solar products. Many customers returned damaged products due to poor handling of the devices
(b) Complaints from customers due to inferior products sold to them (b) There are no trained artisans/technicians in off-grid locations to maintain, repair and service of the products (c) Complaints from customers due to price fluctuations (d) Absence of regional/district wholesalers in their local areas. The retailers are forced to travel to Dar es
Salaam, Mwanza, or Arusha to buy goods (e) Not focusing only on solar products due to market competition and low sales on solar products due to little
awareness of the consumers (f) Length of time between ordering and delivery of products
IV. Vendors (Village Markets or Street Hawkers) are split in two categories; those who sells their goods at the
village markets, and street hawkers who move with few items along the road. They all keep their goods at their
home, or at other retail shops, as they normally don’t have an established place of business. Some of them buy a
few items to sell while the rest enter into an agreement with a retailer for a commission. These are informal
operators and normally pay only city taxes. They do not specialize in solar lighting products, but sell a wide range
of electrical products and modern technologies. Their advantage is that they know the consumers well in terms of
location, purchase habits and purchase abilities; many of their customers are also neighborhoods, relatives, etc.
They are often skilled at persuading their customers to purchase their goods based on reference to regular
customers who are often their neighbors or friends who have perhaps purchased the same product.
8.2. Other Important Players in the Value Chain
Other players involved in this distribution channel are:
NGOs who play a prominent role in solar lighting products distribution, through dissemination of information by
conducting continuous workshops/seminars, training SMES in business skill development and financing, and
training technicians/artisans in the installation and maintenance of solar lighting products. NGOs also link SMEs
to micro financing institutions after appropriate training and vetting. A few of the NGOs participate in wholesale
delivery of solar lighting products to regional distributors. Table 19 shows some of the major NGO’s that were
interviewed, their roles in the energy sector, and some of their programs and locations.

GREENMAX CAPITAL ADVISORS 56
Table 19: Roles and Programs of Major NGOs in the Energy Sector
NGO Role in Energy sector Programs Location GVEP Support SMEs who sell lighting
products through training (business development skills, and technology), and awareness building Linking SMEs and suppliers to financial institutions such as banks, SACCOS etc.
Development of Energy Entrepreneurship Project (DEEP). This 5-year project has dealt with almost all renewable energy technologies: solar, briquetting, ICS, biogas etc. The project has assisted more than 350 entrepreneurs by linking them with financial institutions Capital Access for Renewable Energy Entrepreneurship project. GVEP supports people by linking them to financial institutions for funding a solar system that can charge a mobile telephone, with two lights, so that the entrepreneur can continue to conduct business at night.
Mwanza
SNV Facilitates/advises on system change by assisting the public and private sector to adapt inclusive development strategies – building partnerships networks on various levels
Improve the value chain for solar products – through participatory approach and capacity building, informing people on means to access lighting and expand RE financial opportunities
Supports TEDAP projects through awareness building Supports TAREA in expanding and implementing its mandate, e.g. support of quality energy efficient products/services and RE programs.
Dar es Salaam
ECUSINI To create awareness on the importance of adopting renewable energies including solar at the community level
Water pumping project using solar energy for drip irrigation
Kigoma
Southern Highland Energy and Environment Centre
Dissemination of information on access to modern energy to the community in villages
Feasibility studies of renewable energy technologies
Gasification: changing municipal waste to electricity, fabrication of briquettes, and design and manufacturing of gas fire for electricity
Mbeya
Research Institutions engage in researching and developing affordable lighting products in conjunction with
NGOs and SMEs. Once the technologies are proven successful the products are passed over to the distributors.
The Tanzania Institute for Research and Development Organization (TIRDO) in conjunction with Kakute Projects
Ltd, an NGO based in Arusha, developed a lantern that uses jatropha oil. The research was successful, but
needed more financial support for refining the technology and commercialization.
Transport and Logistics Operators: These include international companies, which transport the goods from
their origin to their intended destinations -- usually to or through Dar es Salaam. Clearing and forwarding
agencies handle the importation formalities such as customs duties and bonded warehousing management.
Local transporters enter into agreement with regional distributors and retailers to transport goods to the regions
and districts from the national distributors.
The logistics in the supply channel mainly suffer due to the high cost of transportation as a result of poor
infrastructure, products damaged during transportation, and absence of big warehouses for storage of goods.
This would be addressed through:

Lighting Africa Tanzania Market Intelligence, Appendices
GREENMAX CAPITAL ADVISORS 57
(a) Use of specialized trucks for transportation; and
(b) Big importers should create bonded warehouses for storage of imported solar products and create
distribution mechanisms to retailers and final delivery to consumers.
The creation of specialized warehouses to handle alternative lighting products would also assist TBS to easily
inspect and conduct control quality assurances of solar lighting products.
Policy Formulation and Regulation: The Ministry of Energy and Minerals (MEM) and the Rural Energy Agency
(REA) are key players in the overall country supervision of energy activities. They develop the relevant policies
and perform supervision of the legal and regulatory framework governing solar lighting products. REA oversees
the implementation of the plans and programs in partnership with development partners, private dealers, NGOs,
and other stakeholders, for the purpose of increasing lighting access in the rural and peri-urban areas.
From the interviews with the stakeholders it was revealed that there is no regulation in place for alternative
lighting products because of the absence of a renewable energy policy that would accelerate the enactment of
appropriate rules. An official from EWURA confirmed that the Authority has not been able to develop regulations
governing the application of efficient lighting because the Ministry of Energy has not developed the Renewable
Energy Policy. The official further confirmed that EWURA was in the process of developing a tariff structure that
encourages efficient lighting since the present structure does not. Likewise, REA is also piloting low cost design
standards for rural electrification.
There are 11 standards for regulating the influx of solar equipment products as stated by the officer from the
Tanzania Bureau of Standards. The specifications for these standards are on the following subjects:
• Solar photovoltaic power systems test procedures for main components,
• Photovoltaic modules,
• Installation, maintenance, testing and replacement of batteries,
• Charge regulators,
• Inverters,
• Luminaires,
• Solar photovoltaic (PV) power systems-design, installation, operation, monitoring and maintenance-
code of practice,
• Design of solar PV systems,
• Installation of power PV power systems,
• Operation of solar PV power system, and
• Monitoring and maintenance of solar systems.
These standards were examined and found that they had no relevance to the quality assurance of lighting
products. Only one of the standards mentions the application of lighting systems. Import duties and value added
taxes are exempted for all solar products according to the government officials interviewed for this study.
However, the concerns of the supply chain survey respondents were that, although tax exemptions for solar
products are well structured, the implementation is poorly managed by the Tanzania Revenue Authority and by
TBS. The survey respondents indicated that the system lacks technical capacity and knowledge at all levels from
the import, including storage, product inspection, and the clearance process. TAREA, an NGO involved in solar

GREENMAX CAPITAL ADVISORS 58
suppliers’ accreditation is spearheading the prevention of counterfeit products entry, which is prohibited by the
law.
Financing Institutions: There are various public and private institutions, which play a role at different levels of
the supply chain, in facilitating access to finance for BOP consumers. These include government ministries and
agencies, international development partners, MFIs, and CBOs. Through various schemes private dealers and
consumers can access grants and loans. For example the Ministry of Finance (MOF) and the Tanzania Revenue
Authority (TRA) develop the budgetary policies governing energy and rural electrification funding. In this case the
tax exemptions governing solar lighting products are developed by the MOF, and enforced by the TRA. MFIs and
CBOs provide microloans to BOP consumers and traders.
Financing schemes available to BOP
Micro-financing institutions that serve the BOP give loans to members for healthcare services, school fees, funerals, and for small projects such as soap making and tie-dye businesses. There are three basic types of microfinance associations:
(i) village community banks (VIKOBA) (ii) savings and credit societies (SACCOS) (iii) trust funds (Mfuko wa HISA) (iv) Village Savings and Lending Associations – CARE International model (VSLA)
Village community banks are microfinance schemes or associations operated on a self-help basis mostly by women, and aim at offering micro-credit, with the main objective being poverty alleviation by helping the members engage in some beneficial economic activity. The projects are sometimes supervised by an NGO or a national MFI but generally they are formalized with an elected secretariat and an operating bank account. This might be a viable option for BOP consumers wishing to purchase alternative lighting products.
Savings and credit societies are associations created by a group of people who could be employed in the same organization, living in the same locality, or who have practically any kind of informal or formal relationship and decide to cooperate in a savings and loan microfinance scheme. The associations are officially registered and monitored by government authorities to avoid possible breaches. SACCOSs normally provide loans on a rotational basis, and for the bigger ones, funds are borrowed from banks but then the interest rates become higher. This is another possible financing scheme option for BOP consumer purchases of alternative lighting devices.
Micro trust funds are associations that operate in a similar manner to VIKOBAs, and some of them are registered while others are not (usually in the process of being registered). They may offer a reasonable financing option for purchasing alternative lighting devices, depending on their state of establishment (assets and liquidity) and formalization.
Village Savings and Lending Associations (VLSAs) pioneered by CARE International are similar to the VIKOBA model, but limit their memberships to only village residents while VIKOBAs accept outside members. VLSAs are well supervised by CARE and are very widespread in the country.
Financing for the Supply Chain
Most of the lighting product dealers that were interviewed, still lack access to micro financing services for a variety of reasons although they claim to need it. The reasons that financial Institutions deny the dealers loans are due to: perceived high risks, high cost involved in small transactions, and the dealers’ inability to provide credible collateral. There is need to create a micro financing-friendly environment to encourage rural banks and cooperatives to lend to these dealers. Efforts in this regard could be: (a) Government to identify bona fide alternative lighting product dealers and provide guarantees so that they
can access loans from financing Institutions.
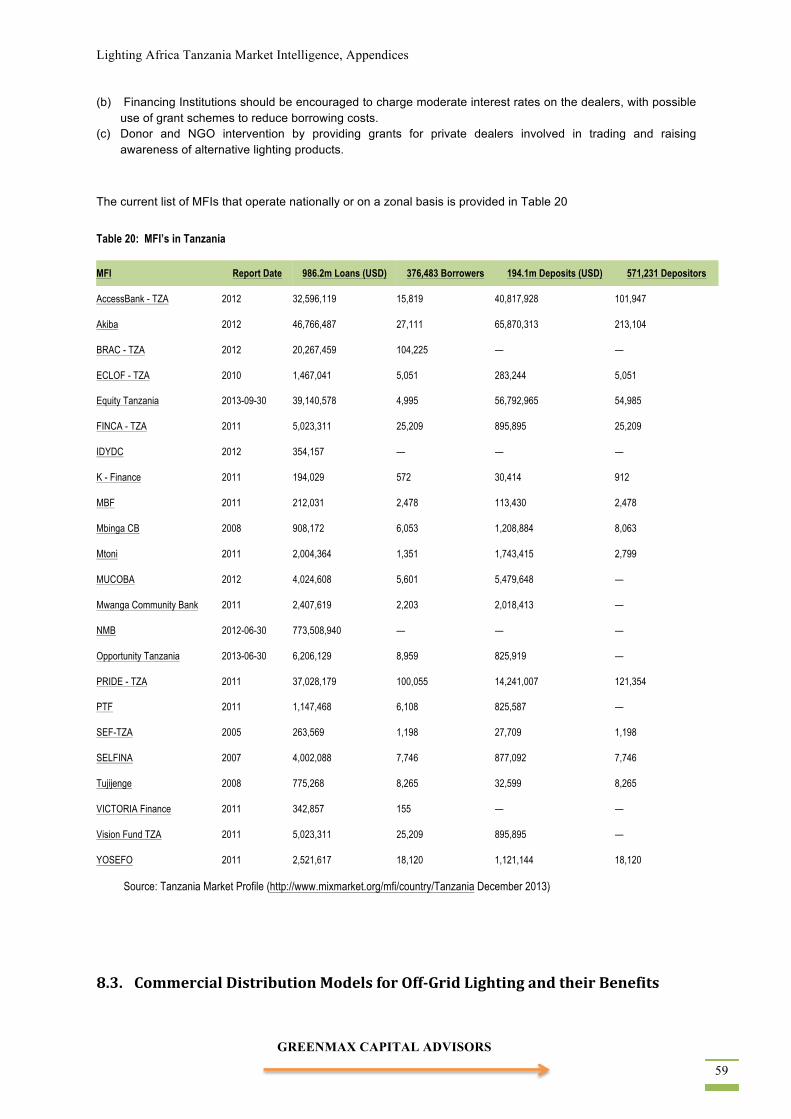
Lighting Africa Tanzania Market Intelligence, Appendices
GREENMAX CAPITAL ADVISORS 59
(b) Financing Institutions should be encouraged to charge moderate interest rates on the dealers, with possible use of grant schemes to reduce borrowing costs.
(c) Donor and NGO intervention by providing grants for private dealers involved in trading and raising awareness of alternative lighting products.
The current list of MFIs that operate nationally or on a zonal basis is provided in Table 20
Table 20: MFI’s in Tanzania
MFI Report Date 986.2m Loans (USD) 376,483 Borrowers 194.1m Deposits (USD) 571,231 Depositors
AccessBank - TZA 2012 32,596,119 15,819 40,817,928 101,947
Akiba 2012 46,766,487 27,111 65,870,313 213,104
BRAC - TZA 2012 20,267,459 104,225 — —
ECLOF - TZA 2010 1,467,041 5,051 283,244 5,051
Equity Tanzania 2013-09-30 39,140,578 4,995 56,792,965 54,985
FINCA - TZA 2011 5,023,311 25,209 895,895 25,209
IDYDC 2012 354,157 — — —
K - Finance 2011 194,029 572 30,414 912
MBF 2011 212,031 2,478 113,430 2,478
Mbinga CB 2008 908,172 6,053 1,208,884 8,063
Mtoni 2011 2,004,364 1,351 1,743,415 2,799
MUCOBA 2012 4,024,608 5,601 5,479,648 —
Mwanga Community Bank 2011 2,407,619 2,203 2,018,413 —
NMB 2012-06-30 773,508,940 — — —
Opportunity Tanzania 2013-06-30 6,206,129 8,959 825,919 —
PRIDE - TZA 2011 37,028,179 100,055 14,241,007 121,354
PTF 2011 1,147,468 6,108 825,587 —
SEF-TZA 2005 263,569 1,198 27,709 1,198
SELFINA 2007 4,002,088 7,746 877,092 7,746
Tujijenge 2008 775,268 8,265 32,599 8,265
VICTORIA Finance 2011 342,857 155 — —
Vision Fund TZA 2011 5,023,311 25,209 895,895 —
YOSEFO 2011 2,521,617 18,120 1,121,144 18,120
Source: Tanzania Market Profile (http://www.mixmarket.org/mfi/country/Tanzania December 2013)
8.3. Commercial Distribution Models for Off-‐Grid Lighting and their Benefits
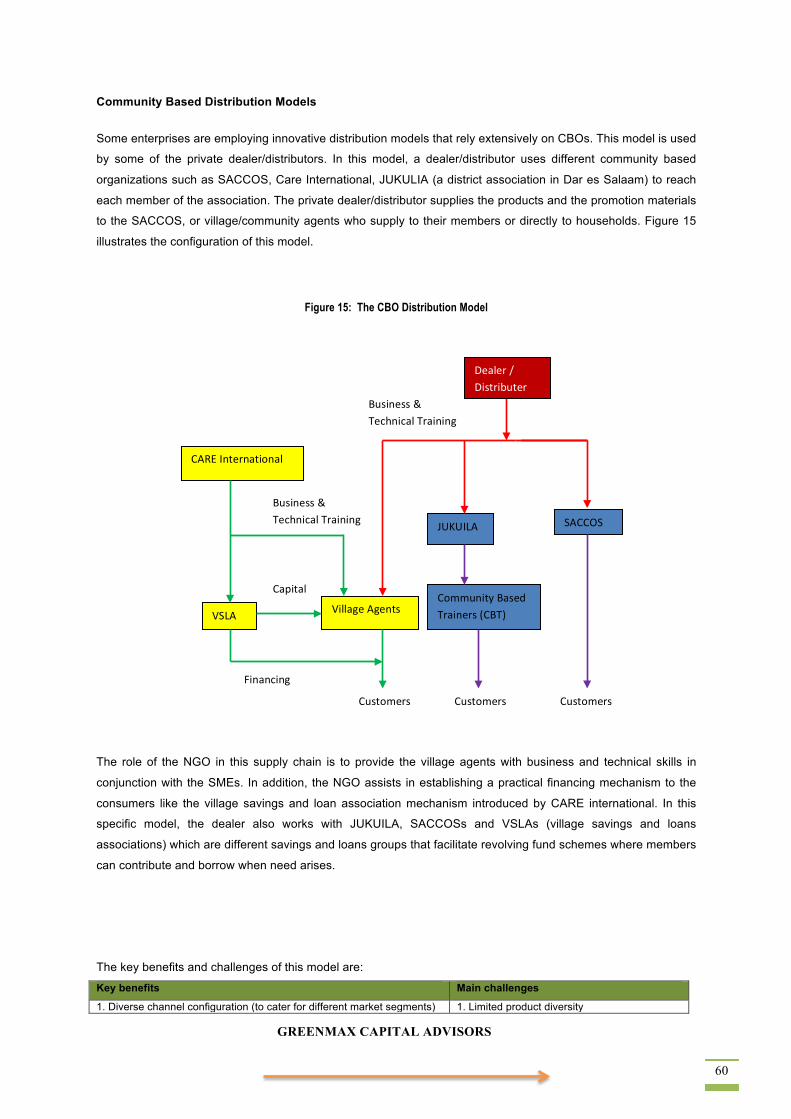
GREENMAX CAPITAL ADVISORS 60
Community Based Distribution Models
Some enterprises are employing innovative distribution models that rely extensively on CBOs. This model is used
by some of the private dealer/distributors. In this model, a dealer/distributor uses different community based
organizations such as SACCOS, Care International, JUKULIA (a district association in Dar es Salaam) to reach
each member of the association. The private dealer/distributor supplies the products and the promotion materials
to the SACCOS, or village/community agents who supply to their members or directly to households. Figure 15
illustrates the configuration of this model.
Figure 15: The CBO Distribution Model
The role of the NGO in this supply chain is to provide the village agents with business and technical skills in
conjunction with the SMEs. In addition, the NGO assists in establishing a practical financing mechanism to the
consumers like the village savings and loan association mechanism introduced by CARE international. In this
specific model, the dealer also works with JUKUILA, SACCOSs and VSLAs (village savings and loans
associations) which are different savings and loans groups that facilitate revolving fund schemes where members
can contribute and borrow when need arises.
The key benefits and challenges of this model are:
Key benefits Main challenges
1. Diverse channel configuration (to cater for different market segments) 1. Limited product diversity
JUKUILA
CARE International
VSLA Village Agents
Financing
Community Based Trainers (CBT)
SACCOS
Customers Customers Customers
Business & Technical Training
Business & Technical Training
Capital
Dealer / Distributer

Lighting Africa Tanzania Market Intelligence, Appendices
GREENMAX CAPITAL ADVISORS 61
2. Provides installation and troubleshooting services 3. Highly targeted market segments 4. Fast promotion and delivery mechanism – supply close to demand 5. Development of solar entrepreneurs – rural network 6. Investing in social institutions - VSLAs and SACCOSs 7. Gender empowerment (CARE collaboration) 8. Short channel so damage reduction and lower prices (overall margin low)
2. Limited customer reach (mostly members of VSLAs and SACCOSs) 3. Needs huge amount of resources for managing the channel and for promotional efforts
Enterprise Based Distribution model
The enterprise based distribution model has managed to penetrate the BOP market segment and improve access to clean energy in rural and peri-urban areas. Key features of this model include targeted consumers and suppliers, with social institutions utilized as delivery hubs. The enterprise works with SMEs that receive financing from MFIs, they also work with kiosks and small shops in village markets. They also support schools, health facilities, religious centers, etc.
Figure 16: The Entrepreneur Based Distribution Model
The key benefits and challenges of this model are summarized below.
Key benefits Main challenges
1. Support for micro and small solar and job creating within local region 2. Access to financing and business networks 3. Prioritize women in distribution mechanism through supplying to SMEs 4. Improvement in product quality over time and development of the value-chain 5. Supply close to demand and addresses other social issues like school performance 6. Investing in social institutions and improving access to social services – schools and healthcare centers 7. Support mobile-money management – used for sales communications and payments (MPESA)26
1. Limited to entrepreneurs within the network, with limited operating capacity 2. Doesn't address solar affordability/consumer financing because expanding distribution networks requires setting up payment options for BOP consumers
The School Based Distribution Model
26 MPESA is a system of money transfer through the mobile phone network operated by VODACOM Ltd. Any subscriber using this network can send or receive money from another person through kiosks franchised to entrepreneurs located in almost parts of the country. A fee is charged for each transfer. MPESA also doubles as a mobile banking system whereby customers can deposit money for later use (not savings). Three other mobile phone companies also operate similar systems.
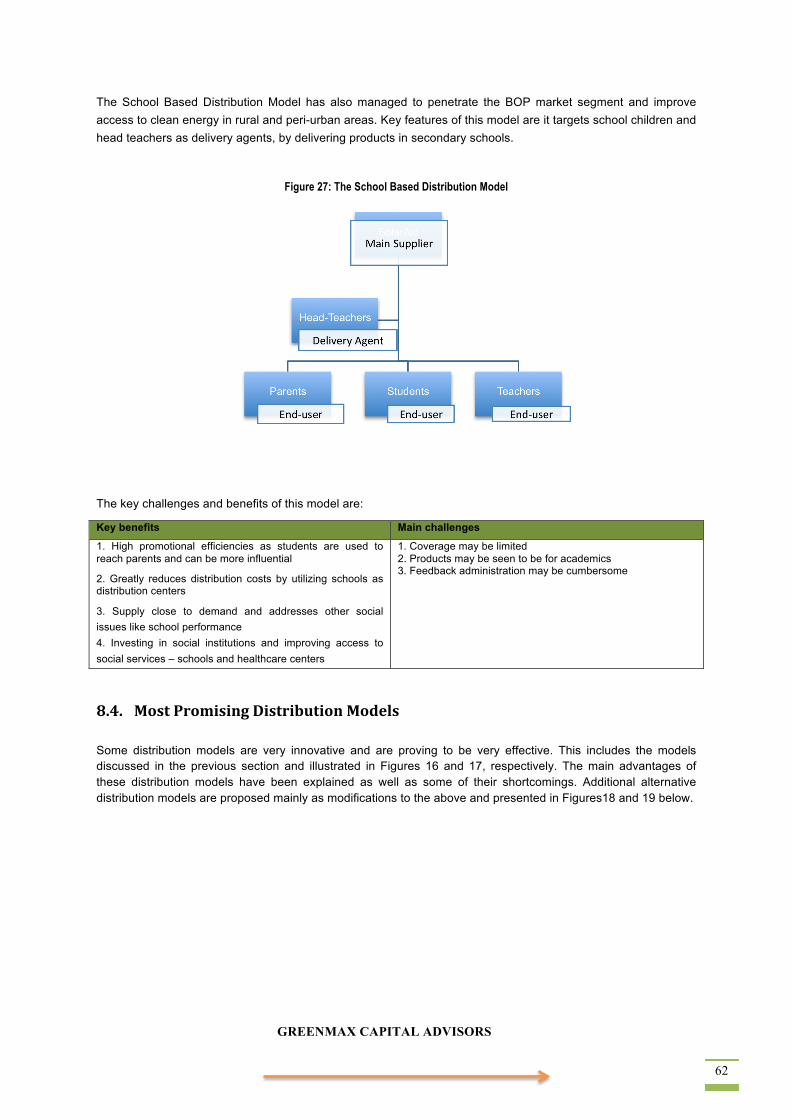
GREENMAX CAPITAL ADVISORS 62
The School Based Distribution Model has also managed to penetrate the BOP market segment and improve access to clean energy in rural and peri-urban areas. Key features of this model are it targets school children and head teachers as delivery agents, by delivering products in secondary schools.
Figure 27: The School Based Distribution Model
The key challenges and benefits of this model are:
Key benefits Main challenges
1. High promotional efficiencies as students are used to reach parents and can be more influential
2. Greatly reduces distribution costs by utilizing schools as distribution centers
3. Supply close to demand and addresses other social issues like school performance 4. Investing in social institutions and improving access to social services – schools and healthcare centers
1. Coverage may be limited 2. Products may be seen to be for academics 3. Feedback administration may be cumbersome
8.4. Most Promising Distribution Models Some distribution models are very innovative and are proving to be very effective. This includes the models discussed in the previous section and illustrated in Figures 16 and 17, respectively. The main advantages of these distribution models have been explained as well as some of their shortcomings. Additional alternative distribution models are proposed mainly as modifications to the above and presented in Figures18 and 19 below.
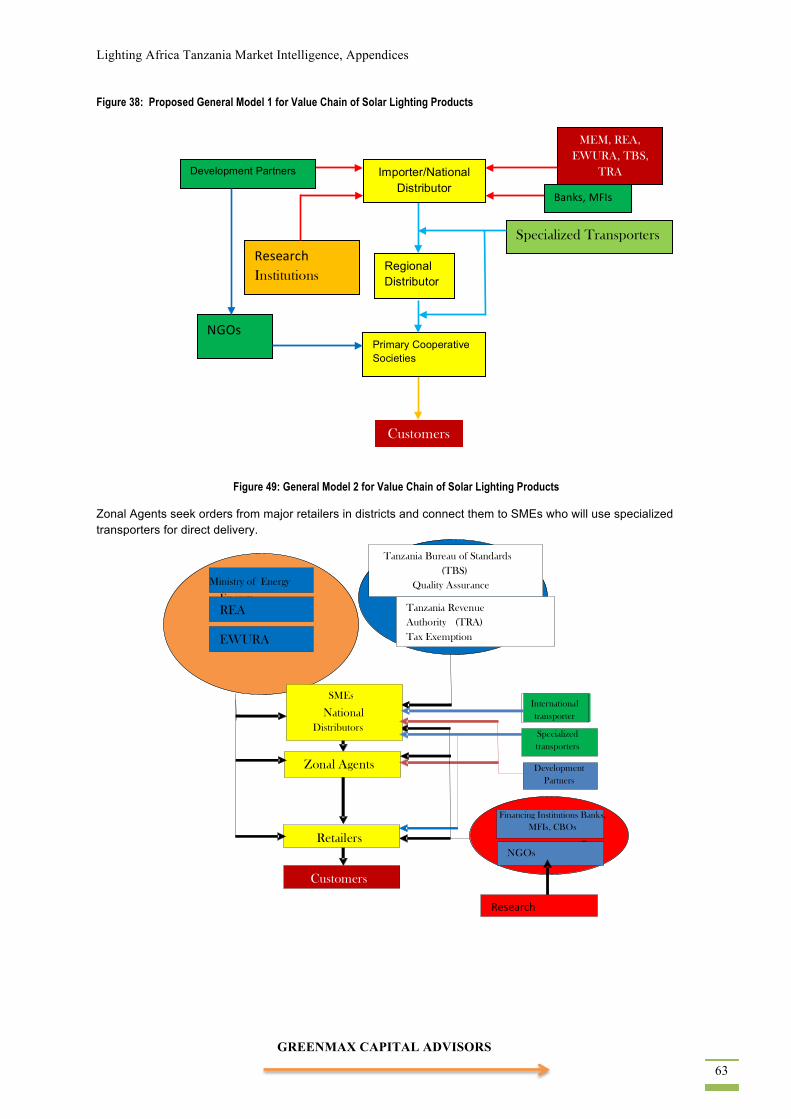
Lighting Africa Tanzania Market Intelligence, Appendices
GREENMAX CAPITAL ADVISORS 63
Figure 38: Proposed General Model 1 for Value Chain of Solar Lighting Products
Figure 49: General Model 2 for Value Chain of Solar Lighting Products
Zonal Agents seek orders from major retailers in districts and connect them to SMEs who will use specialized transporters for direct delivery.
Financing Institutions Banks, MFIs, CBOs
– NGOs
Ministry of Energy
Energy REA
EWURA
Tanzania Revenue Authority (TRA) Tax Exemption
Tanzania Bureau of Standards (TBS)
Quality Assurance
Customers
SMEs National
Distributors
Zonal Agents
Retailers
Specialized transporters
International transporter
Research
Development Partners
Specialized Transporters
Customers
Importer/National Distributor
Research Institutions
NGOs
MEM, REA, EWURA, TBS,
TRA
Banks, MFIs
Development Partners
Regional Distributors
Primary Cooperative Societies
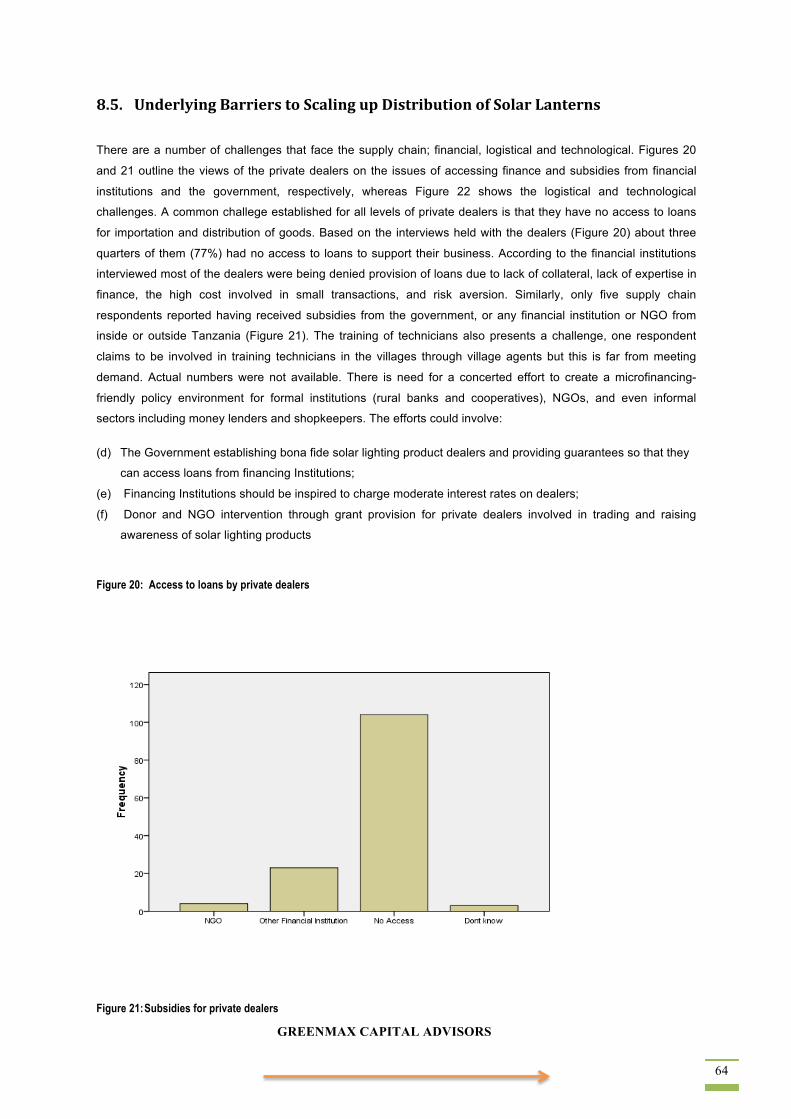
GREENMAX CAPITAL ADVISORS 64
8.5. Underlying Barriers to Scaling up Distribution of Solar Lanterns
There are a number of challenges that face the supply chain; financial, logistical and technological. Figures 20
and 21 outline the views of the private dealers on the issues of accessing finance and subsidies from financial
institutions and the government, respectively, whereas Figure 22 shows the logistical and technological
challenges. A common challege established for all levels of private dealers is that they have no access to loans
for importation and distribution of goods. Based on the interviews held with the dealers (Figure 20) about three
quarters of them (77%) had no access to loans to support their business. According to the financial institutions
interviewed most of the dealers were being denied provision of loans due to lack of collateral, lack of expertise in
finance, the high cost involved in small transactions, and risk aversion. Similarly, only five supply chain
respondents reported having received subsidies from the government, or any financial institution or NGO from
inside or outside Tanzania (Figure 21). The training of technicians also presents a challenge, one respondent
claims to be involved in training technicians in the villages through village agents but this is far from meeting
demand. Actual numbers were not available. There is need for a concerted effort to create a microfinancing-
friendly policy environment for formal institutions (rural banks and cooperatives), NGOs, and even informal
sectors including money lenders and shopkeepers. The efforts could involve:
(d) The Government establishing bona fide solar lighting product dealers and providing guarantees so that they
can access loans from financing Institutions;
(e) Financing Institutions should be inspired to charge moderate interest rates on dealers;
(f) Donor and NGO intervention through grant provision for private dealers involved in trading and raising
awareness of solar lighting products
Figure 20: Access to loans by private dealers
Figure 21: Subsidies for private dealers
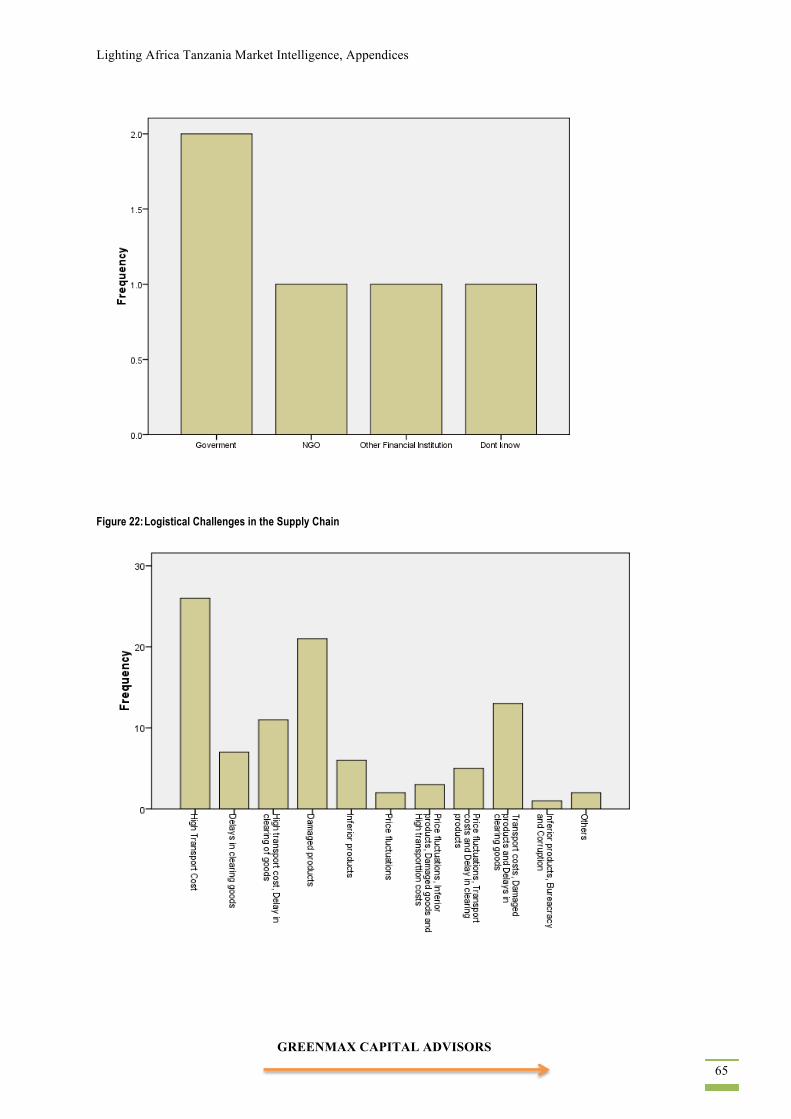
Lighting Africa Tanzania Market Intelligence, Appendices
GREENMAX CAPITAL ADVISORS 65
Figure 22: Logistical Challenges in the Supply Chain
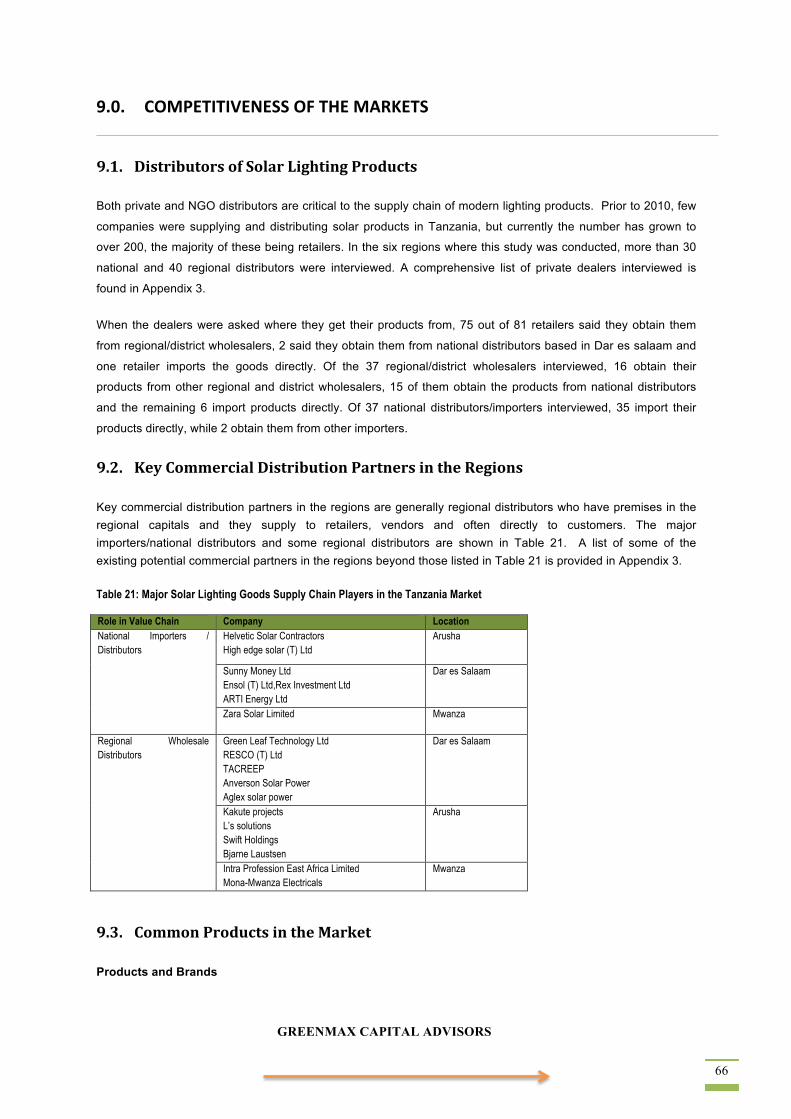
GREENMAX CAPITAL ADVISORS 66
9.0. COMPETITIVENESS OF THE MARKETS
9.1. Distributors of Solar Lighting Products Both private and NGO distributors are critical to the supply chain of modern lighting products. Prior to 2010, few
companies were supplying and distributing solar products in Tanzania, but currently the number has grown to
over 200, the majority of these being retailers. In the six regions where this study was conducted, more than 30
national and 40 regional distributors were interviewed. A comprehensive list of private dealers interviewed is
found in Appendix 3.
When the dealers were asked where they get their products from, 75 out of 81 retailers said they obtain them
from regional/district wholesalers, 2 said they obtain them from national distributors based in Dar es salaam and
one retailer imports the goods directly. Of the 37 regional/district wholesalers interviewed, 16 obtain their
products from other regional and district wholesalers, 15 of them obtain the products from national distributors
and the remaining 6 import products directly. Of 37 national distributors/importers interviewed, 35 import their
products directly, while 2 obtain them from other importers.
9.2. Key Commercial Distribution Partners in the Regions Key commercial distribution partners in the regions are generally regional distributors who have premises in the regional capitals and they supply to retailers, vendors and often directly to customers. The major importers/national distributors and some regional distributors are shown in Table 21. A list of some of the existing potential commercial partners in the regions beyond those listed in Table 21 is provided in Appendix 3.
Table 21: Major Solar Lighting Goods Supply Chain Players in the Tanzania Market
Role in Value Chain Company Location National Importers / Distributors
Helvetic Solar Contractors High edge solar (T) Ltd
Arusha
Sunny Money Ltd Ensol (T) Ltd,Rex Investment Ltd ARTI Energy Ltd
Dar es Salaam
Zara Solar Limited Mwanza
Regional Wholesale Distributors
Green Leaf Technology Ltd RESCO (T) Ltd TACREEP Anverson Solar Power Aglex solar power
Dar es Salaam
Kakute projects L’s solutions Swift Holdings Bjarne Laustsen
Arusha
Intra Profession East Africa Limited Mona-Mwanza Electricals
Mwanza
9.3. Common Products in the Market Products and Brands
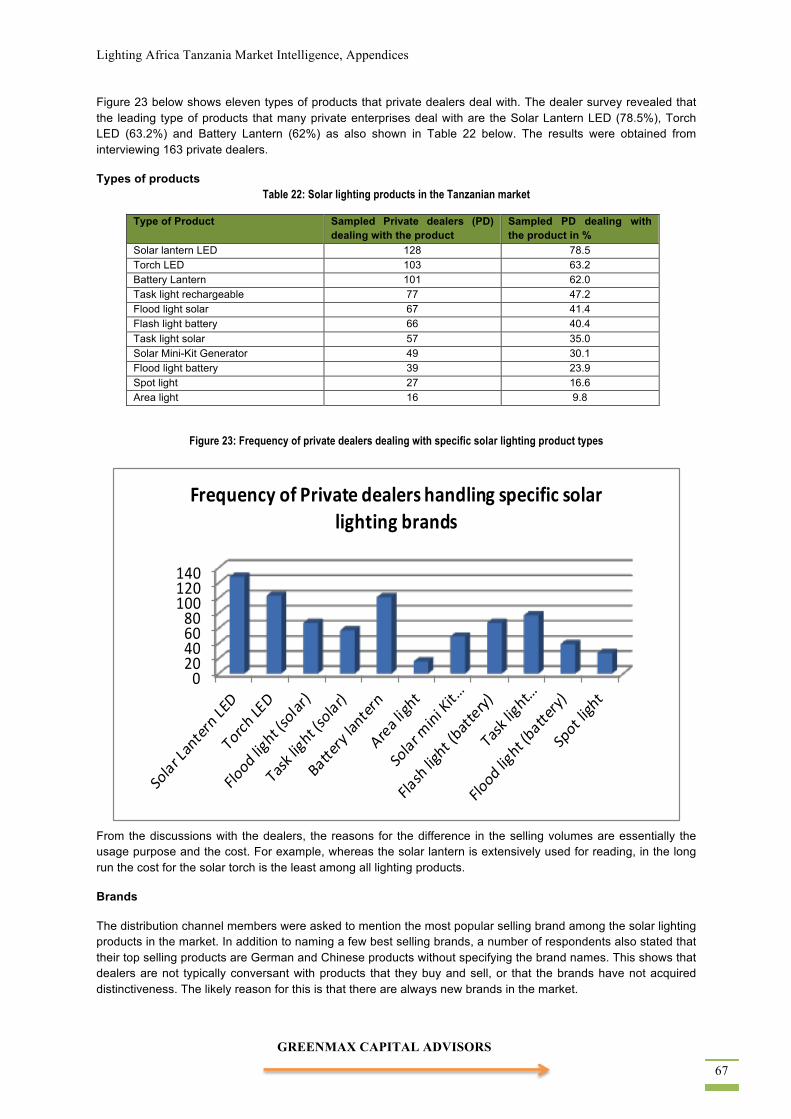
Lighting Africa Tanzania Market Intelligence, Appendices
GREENMAX CAPITAL ADVISORS 67
Figure 23 below shows eleven types of products that private dealers deal with. The dealer survey revealed that the leading type of products that many private enterprises deal with are the Solar Lantern LED (78.5%), Torch LED (63.2%) and Battery Lantern (62%) as also shown in Table 22 below. The results were obtained from interviewing 163 private dealers.
Types of products Table 22: Solar lighting products in the Tanzanian market
Type of Product Sampled Private dealers (PD) dealing with the product
Sampled PD dealing with the product in %
Solar lantern LED 128 78.5 Torch LED 103 63.2 Battery Lantern 101 62.0 Task light rechargeable 77 47.2 Flood light solar 67 41.4 Flash light battery 66 40.4 Task light solar 57 35.0 Solar Mini-Kit Generator 49 30.1 Flood light battery 39 23.9 Spot light 27 16.6 Area light 16 9.8
Figure 23: Frequency of private dealers dealing with specific solar lighting product types
020406080
100120140
Frequency of Private dealers handling specific solar lighting brands
From the discussions with the dealers, the reasons for the difference in the selling volumes are essentially the usage purpose and the cost. For example, whereas the solar lantern is extensively used for reading, in the long run the cost for the solar torch is the least among all lighting products.
Brands
The distribution channel members were asked to mention the most popular selling brand among the solar lighting products in the market. In addition to naming a few best selling brands, a number of respondents also stated that their top selling products are German and Chinese products without specifying the brand names. This shows that dealers are not typically conversant with products that they buy and sell, or that the brands have not acquired distinctiveness. The likely reason for this is that there are always new brands in the market.
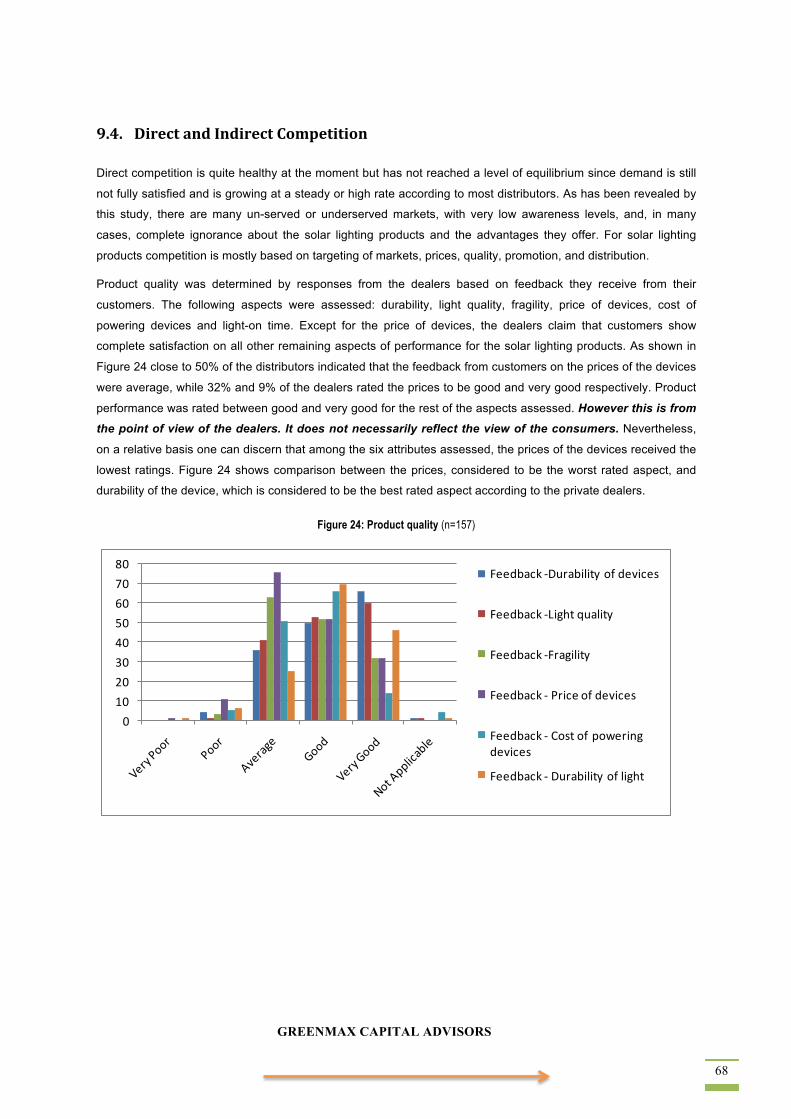
GREENMAX CAPITAL ADVISORS 68
9.4. Direct and Indirect Competition Direct competition is quite healthy at the moment but has not reached a level of equilibrium since demand is still
not fully satisfied and is growing at a steady or high rate according to most distributors. As has been revealed by
this study, there are many un-served or underserved markets, with very low awareness levels, and, in many
cases, complete ignorance about the solar lighting products and the advantages they offer. For solar lighting
products competition is mostly based on targeting of markets, prices, quality, promotion, and distribution.
Product quality was determined by responses from the dealers based on feedback they receive from their
customers. The following aspects were assessed: durability, light quality, fragility, price of devices, cost of
powering devices and light-on time. Except for the price of devices, the dealers claim that customers show
complete satisfaction on all other remaining aspects of performance for the solar lighting products. As shown in
Figure 24 close to 50% of the distributors indicated that the feedback from customers on the prices of the devices
were average, while 32% and 9% of the dealers rated the prices to be good and very good respectively. Product
performance was rated between good and very good for the rest of the aspects assessed. However this is from the point of view of the dealers. It does not necessarily reflect the view of the consumers. Nevertheless,
on a relative basis one can discern that among the six attributes assessed, the prices of the devices received the
lowest ratings. Figure 24 shows comparison between the prices, considered to be the worst rated aspect, and
durability of the device, which is considered to be the best rated aspect according to the private dealers.
Figure 24: Product quality (n=157)
01020304050607080
Feedback -‐Durability of devices
Feedback -‐Light quality
Feedback -‐Fragility
Feedback -‐ Price of devices
Feedback -‐ Cost of powering devices
Feedback -‐ Durability of light
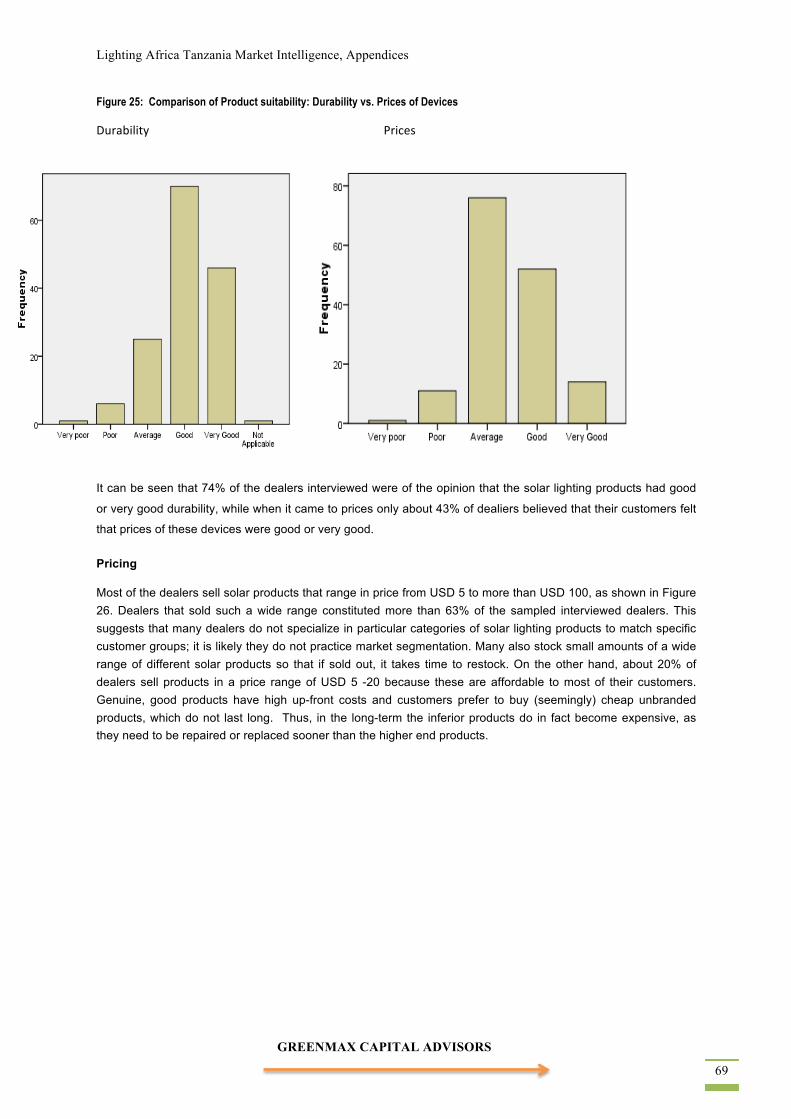
Lighting Africa Tanzania Market Intelligence, Appendices
GREENMAX CAPITAL ADVISORS 69
Figure 25: Comparison of Product suitability: Durability vs. Prices of Devices
Durability Prices
It can be seen that 74% of the dealers interviewed were of the opinion that the solar lighting products had good
or very good durability, while when it came to prices only about 43% of dealiers believed that their customers felt
that prices of these devices were good or very good.
Pricing
Most of the dealers sell solar products that range in price from USD 5 to more than USD 100, as shown in Figure 26. Dealers that sold such a wide range constituted more than 63% of the sampled interviewed dealers. This suggests that many dealers do not specialize in particular categories of solar lighting products to match specific customer groups; it is likely they do not practice market segmentation. Many also stock small amounts of a wide range of different solar products so that if sold out, it takes time to restock. On the other hand, about 20% of dealers sell products in a price range of USD 5 -20 because these are affordable to most of their customers. Genuine, good products have high up-front costs and customers prefer to buy (seemingly) cheap unbranded products, which do not last long. Thus, in the long-term the inferior products do in fact become expensive, as they need to be repaired or replaced sooner than the higher end products.
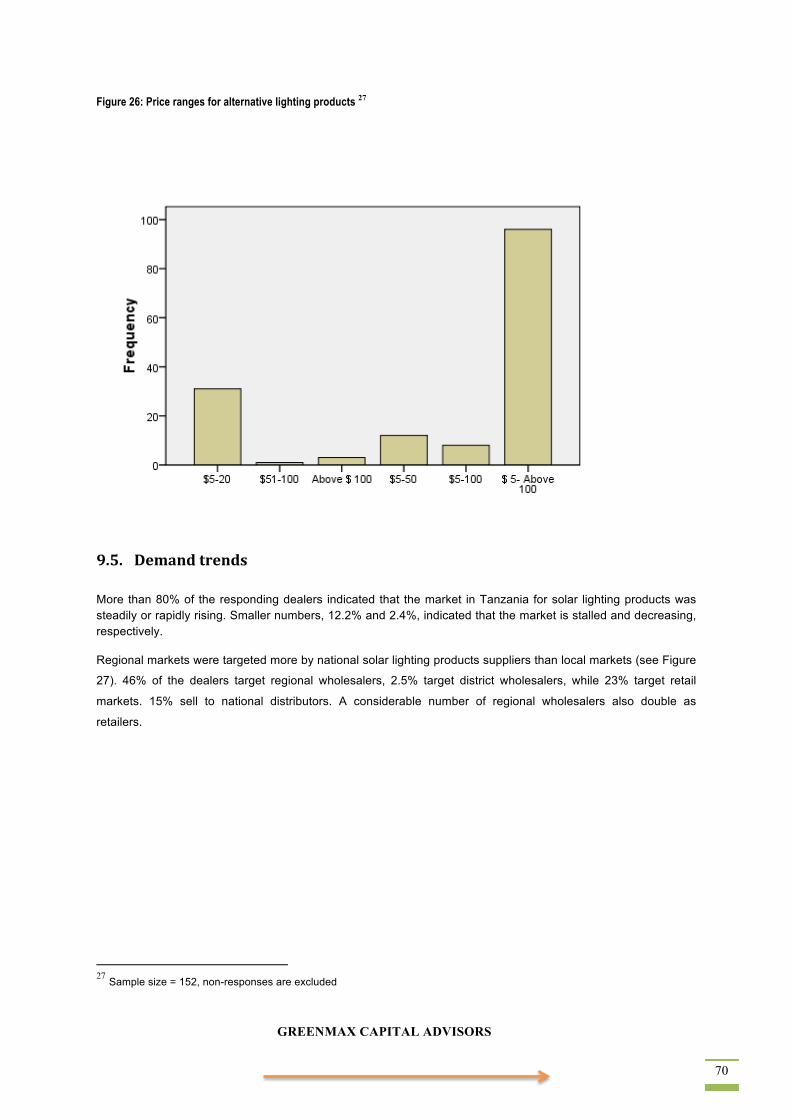
GREENMAX CAPITAL ADVISORS 70
Figure 26: Price ranges for alternative lighting products 27
9.5. Demand trends More than 80% of the responding dealers indicated that the market in Tanzania for solar lighting products was steadily or rapidly rising. Smaller numbers, 12.2% and 2.4%, indicated that the market is stalled and decreasing, respectively.
Regional markets were targeted more by national solar lighting products suppliers than local markets (see Figure
27). 46% of the dealers target regional wholesalers, 2.5% target district wholesalers, while 23% target retail
markets. 15% sell to national distributors. A considerable number of regional wholesalers also double as
retailers.
27 Sample size = 152, non-responses are excluded
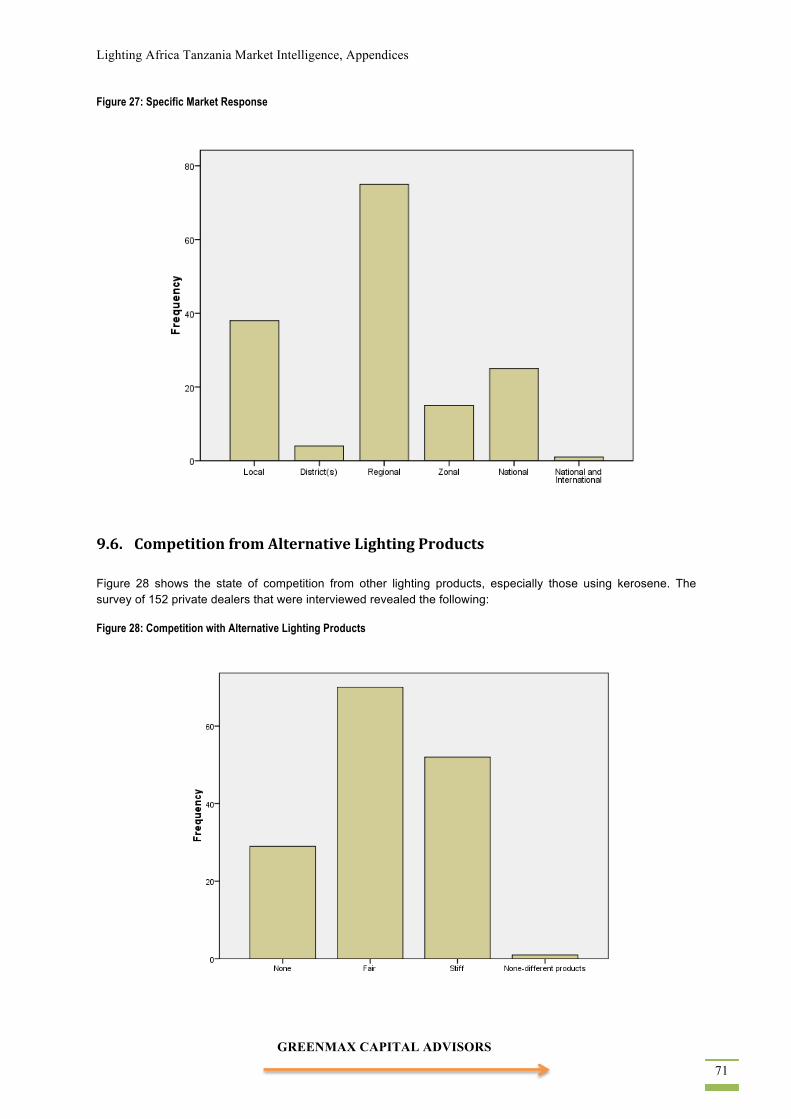
Lighting Africa Tanzania Market Intelligence, Appendices
GREENMAX CAPITAL ADVISORS 71
Figure 27: Specific Market Response
9.6. Competition from Alternative Lighting Products Figure 28 shows the state of competition from other lighting products, especially those using kerosene. The survey of 152 private dealers that were interviewed revealed the following:
Figure 28: Competition with Alternative Lighting Products
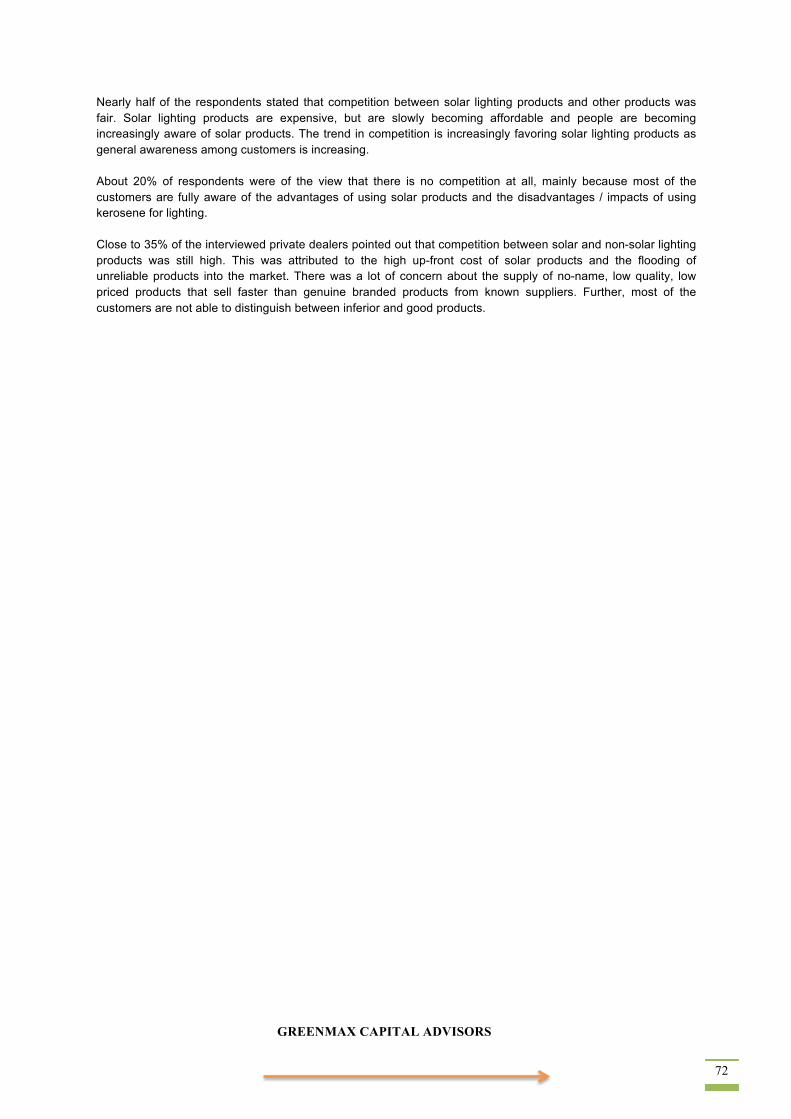
GREENMAX CAPITAL ADVISORS 72
Nearly half of the respondents stated that competition between solar lighting products and other products was fair. Solar lighting products are expensive, but are slowly becoming affordable and people are becoming increasingly aware of solar products. The trend in competition is increasingly favoring solar lighting products as general awareness among customers is increasing. About 20% of respondents were of the view that there is no competition at all, mainly because most of the customers are fully aware of the advantages of using solar products and the disadvantages / impacts of using kerosene for lighting. Close to 35% of the interviewed private dealers pointed out that competition between solar and non-solar lighting products was still high. This was attributed to the high up-front cost of solar products and the flooding of unreliable products into the market. There was a lot of concern about the supply of no-name, low quality, low priced products that sell faster than genuine branded products from known suppliers. Further, most of the customers are not able to distinguish between inferior and good products.
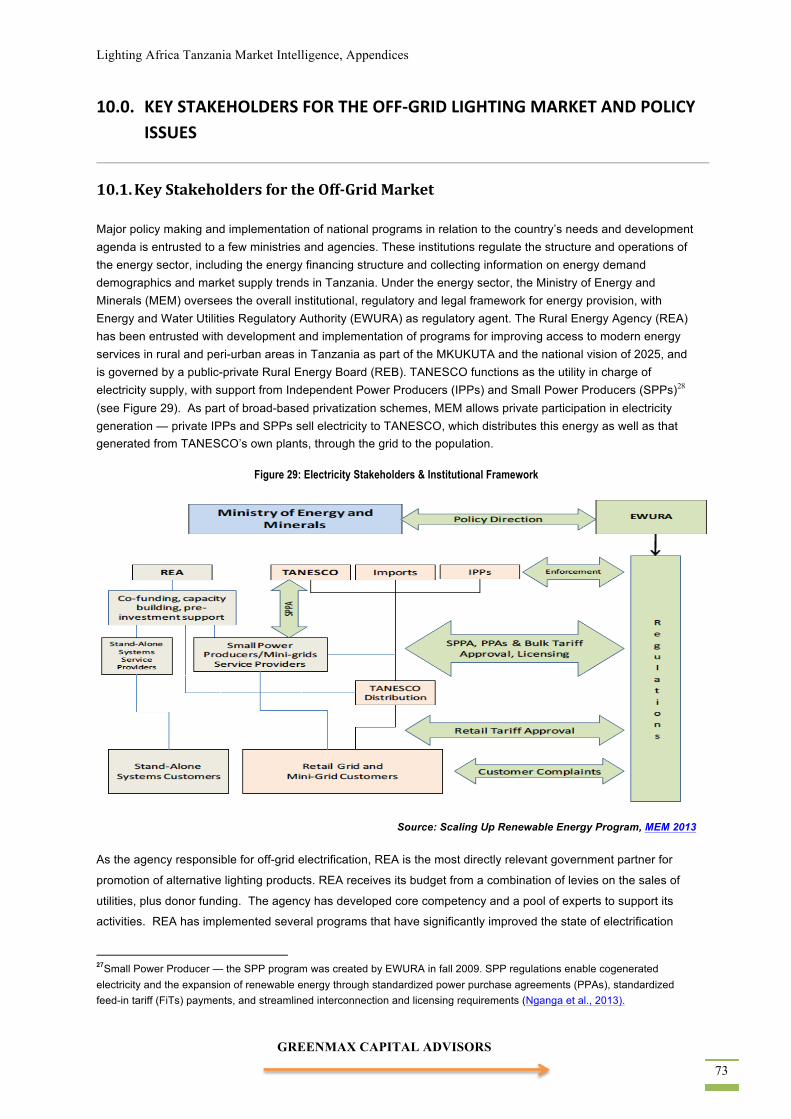
Lighting Africa Tanzania Market Intelligence, Appendices
GREENMAX CAPITAL ADVISORS 73
10.0. KEY STAKEHOLDERS FOR THE OFF-‐GRID LIGHTING MARKET AND POLICY ISSUES
10.1. Key Stakeholders for the Off-‐Grid Market Major policy making and implementation of national programs in relation to the country’s needs and development agenda is entrusted to a few ministries and agencies. These institutions regulate the structure and operations of the energy sector, including the energy financing structure and collecting information on energy demand demographics and market supply trends in Tanzania. Under the energy sector, the Ministry of Energy and Minerals (MEM) oversees the overall institutional, regulatory and legal framework for energy provision, with Energy and Water Utilities Regulatory Authority (EWURA) as regulatory agent. The Rural Energy Agency (REA) has been entrusted with development and implementation of programs for improving access to modern energy services in rural and peri-urban areas in Tanzania as part of the MKUKUTA and the national vision of 2025, and is governed by a public-private Rural Energy Board (REB). TANESCO functions as the utility in charge of electricity supply, with support from Independent Power Producers (IPPs) and Small Power Producers (SPPs)28 (see Figure 29). As part of broad-based privatization schemes, MEM allows private participation in electricity generation — private IPPs and SPPs sell electricity to TANESCO, which distributes this energy as well as that generated from TANESCO’s own plants, through the grid to the population.
Figure 29: Electricity Stakeholders & Institutional Framework
Source: Scaling Up Renewable Energy Program, MEM 2013
As the agency responsible for off-grid electrification, REA is the most directly relevant government partner for
promotion of alternative lighting products. REA receives its budget from a combination of levies on the sales of
utilities, plus donor funding. The agency has developed core competency and a pool of experts to support its
activities. REA has implemented several programs that have significantly improved the state of electrification
27Small Power Producer — the SPP program was created by EWURA in fall 2009. SPP regulations enable cogenerated electricity and the expansion of renewable energy through standardized power purchase agreements (PPAs), standardized feed-in tariff (FiTs) payments, and streamlined interconnection and licensing requirements (Nganga et al., 2013).
GREENMAX CAPITAL ADVISORS 74
and ‘rural lighting’29 throughout Tanzania — the Rural Energy Fund (REF) has enabled off-grid lighting financing
through renewable energy subsidies.
REA, together with partners, plans and implements programs aimed at increasing lighting access in rural areas.
One of its main goals is the facilitation of PPPs. REA does not own projects, facilitation is given to public and
private sector entities. One of the PPP projects that has been facilitated is the development of a new 10MW small
hydropower plant in the Momba District in the Mbeya region, where a company from the USA, in collaboration
with he Momba District Council are developing said project.
Much of REA’s efforts to date have gone towards establishing favorable frameworks and programs for the
development of small power projects (SPPs). These SPPs are primarily, but not exclusively, micro and mini-
hydro, both connected to TANESCO’s national grid, and built in tandem with an isolated mini-grid. REA has
proven itself to be a dynamic proponent of such endeavors, providing sound technical and commercial guidance
to private and community based project developers, as well as providing funding for technical feasibility studies
and business plans. REA, by its own admission, has been less successful to date in organizing equity and debt
financing for implementation of their pipeline of projects, and such financing remains a key obstacle to the many
private and non-profit entrepreneurs active in this space. It has been challenging, but the financing options
available could be good models for replication once there is closure to the current projects. With respect to off-
grid lighting, REA has been the implementing partner for Lighting Africa in Tanzania. In this regard, the main
accomplishment has been the management of the 2010 funding competition for off-grid solar lighting product
distributors, through the Tanzania Energy Development Access Project.
There are other government agencies, which are important to the distribution of lighting solutions in Tanzania but are not directly involved in the energy sector. They include: the Ministry of Finance (MOF), responsible for economic planning and national budget mobilization (having a voice on the REB); the Tanzania Bureau of Standards (TBS), which governs lighting product standards and market quality assurance; the Tanzania Revenue Authority (TRA), responsible for the central government’s tax administration and taxation policies for clearing lighting products at the ports of entry; the Ministry for Industry Trade and Marketing (MITM), which oversees lighting trade regulations and governs market operations; the Business Registration and Licensing Agency (BRELA), responsible for business registration and licensing of lighting companies; the Tanzania Investment Center (TIC), responsible for facilitating investments by enabling environments conducive to business and entrepreneurship growth; and the Bank of Tanzania (BOT), which finances all the budgets under the MEM. Additional stakeholders include the Tanzania Harbors Authority (THA), the Customs Inspection Company, and related forwarding agents in charge of clearing commercial goods from the ports of entry.
Civil Society and Research Institutions
Nongovernmental organizations (NGOs), community-based organizations (CBOs) and research institutions
create community awareness of off-grid lighting product use, and its benefits and effects, in addition to providing
grants to solar dealers and transportation companies that distribute in rural areas. NGOs include both public and
private think tanks that are leading policy research for socioeconomic development and environmental
preservation. Research institutions like the Research on Poverty Alleviation (REPOA), the Tanzania Industrial
28Rural Lighting — Apart from focusing on rural energy access, REA is the main implementer of Lighting Africa, and sponsored the Lighting Rural Tanzania Competition. Overall, the MEM has been aggressively promoting grid expansion through REA, e.g. funding for rural electrification has increased from USD7.4 million in 2007/08 to USD27 million in 2009/10 (LAMIM, 2013).
Lighting Africa Tanzania Market Intelligence, Appendices
GREENMAX CAPITAL ADVISORS 75
Research and Development Organization (TIRDO), the University of Dar es Salaam (UDSM), the Tanzania
Commission on Science and Technology (COSTECH), the Vocational Education Training Authority (VETA) and
the Tanzania Renewable Energy Association (TAREA) all work on policy research in sustainable energy and
socioeconomic development, along with providing expert advice on renewable energy investment and progress
on lighting initiatives. Others like SNV Tanzania, Solar Aid, and GVEP International are directly involved with
solar lighting awareness and distribution efforts, and have managed to influence the diffusion of Photovoltaic
(PV) technologies and some solar lighting into Tanzania.
Financing Institutions
Major donor financing for solar lighting projects and infrastructure comes from multilateral development
institutions like the World Bank and the African Development Bank (AfDB), which to one degree or another
provide seed funds to private enterprises, advise on public-private policy strategies with MEM, and finance rural
lighting projects in collaboration with REA.
Micro-financing Institutions (MFIs) like Savings and Credit Cooperative Organizations (SACCOS), Village
community Banks (VIKOBA), and Trust Funds (“Mfukowa HISA”) offer energy credits to BOP consumers through
community arrangements. SACCOS are fragmented and work at the grassroots level offering services through
social infrastructures like schools and hospitals, as well as financing for SMEs through the Small Industries
Development Organization (SIDO). In fact, SIDO has been robustly supporting women’s’ initiatives and the
promotion of entrepreneurship and works closely with REA on rural lighting projects.
10.2. Policies for Lighting Products
Regulatory arrangements pertaining to renewable energy generally, and off-grid lighting in particular, are set by
EWURA and managed by REA. Currently no formal renewable energy policy is yet in place; however several
policies and enacted laws affect the provision of lighting in Tanzania. The following regulations directly affect the
delivery of modern off-grid lighting technologies:
• National Energy Policy of 2003 — promotes clean energy, cost-efficient energy pricing and facilitation of energy investments through research development, building gender-balanced capacity in energy planning and commercialization of sustainable energy distribution of energy.
• Rural Energy Act of 2005 — created the REA and the Rural Energy Fund (REF) whose main tasks are to prioritize improved rural access to modern energy services by providing performance-based subsidies for renewable energy projects
• Electricity Act of 2008 — adapted to privatize the monopolized power industry (by unbundling and restructuring TANESCO to allow IPPs/SPPs to supply directly to consumers). It also established a framework for market penetration of renewable energy technologies.
• Public-Private Partnership Act of 201030— provides frameworks for public and private sector
30Public-Private Partnerships — In attempts to improve public sector operations, Tanzania like other developing countries has been instituting broad privatization schemes, which have affected the regulatory and legal framework for energy at the national level, with expected implementation on the local level. PPPs have existed in Tanzania since its independence, though the PPP policy was only instituted in 2010, with exception of land, state-owned water, energy and transport utilities are partly privatized, or exist in one form of PPPs (URT, 2009).
GREENMAX CAPITAL ADVISORS 76
collaboration, and procurement guidelines for implementing public-private partnerships (PPPs) in environmental infrastructure investment.
The government seems favorable to the adaptation of off-grid lighting solutions such as solar lighting, as an
alternative to help meet the growing energy demands that are not being met through grid electrification. To
encourage the diffusion and usage of solar lighting technologies, the GoT has done the following:
• Solar Product Exemption31 — removed duty and VAT on imported solar lighting products. Exemption is provided for all categories of solar products, this includes pico-solar products, which a number of suppliers are distributing in the market. For example, thousands of lights in this category have been distributed to school children.
• Solar Research – through the Tanzania Renewable Energy Association (TAREA), an energy think-tank of diverse public and private sector energy experts who promote the renewable energy development, investment and energy sector reforms). They have also partnered with NGOs, who work on renewable energy awareness across the country.
The Ministry of Energy and Minerals through its renewable energy policy, which is currently under development,
should include facilitation of affordable rural lighting initiatives. Once this is in place, then regulations and rules to
enforce lighting product standards should also be established.
Challenges also face the tax exemption provision for solar products, which is provided for all categories. There is
no clear categorization of which products fall into this category, as some importers seek exemption for products,
which are accessories to solar devices. There is a clear lack of expertise amongst customs officials in being able
to identify with certainty which products should be considered part of this category and thus merit the
exemptions. This can be problematic when it comes to enforcement of quality standards.
Another weakness is in the limited ability of regulatory bodies to effectively enforce standards. Although
regulations exist or may be put into place, enforcing standards that may have a positive impact on quality is a
challenge, since experience shows that the practice of implementing such activities is unsystematic. The
evidence is clear from the proliferation of sub-standard electronic products all over the country. In most
incidences that are reported through the media the action taken is the “destruction” of the counterfeit or
substandard products.
The Ministry of Trade and Industry should, through its Business Registration and Licensing Authority, make clear
what enterprises can be registered to conduct business. This will avoid unqualified adventurers in entering the
supply chain, and thereby importing/distributing sub-standard lighting products.
10.2.1 Bonded Warehousing Policy in relation to Lighting Products
Conditions for application of a license include the applicant already having or renting premises. The general
regulations allow for an importer to have a bonded warehouse and pay an annual fee of USD1,500. Alternatively
the importer may use the Customs warehouse, which charges USD 0.30 per cubic meter per day. At present
however, there is no specific regulation regarding the importation of solar lighting products in relation to
warehousing. More details of bonded warehousing policy are provided in Appendix 6.
31Solar Product Exemption — Solar products exempt from VAT/Duty charges at the port include solar: panels/modules, charge controllers, inverters, batteries, pumps, refrigerators, lights, vacuum tube solar collectors, plastic collector, linear actuators for tracking system, concentrating collectors, Fresnel lenses, cookers, water heaters, water distillation units, cooling system components and crop dryers.

Lighting Africa Tanzania Market Intelligence, Appendices
GREENMAX CAPITAL ADVISORS 77
11.0. CONCLUSIONS AND RECOMMENDATIONS
11.1 Conclusions
Implications of the Current State of Electrification on Demand for Alternative Lighting Products Demand
With the current state of electrification of only 21 percent nationally, and within it a significant urban-rural gap,
there is big potential demand for off-grid alternative lighting products. Even with the current programs for
expanding electrification in the intermediate and long term, not all BOP consumers will be satisfactorily served by
electricity from the grid, especially households in rural areas.
Satisfaction with Current Lighting Solutions of the BOP and Market Potential for Alternative Lighting Products
The current lighting solutions for most BOP consumers, who form the majority of the population, and who live
mainly in rural and peri-urban locations, consist of fossil fuel powered devices such as hurricane and tin lanterns.
A minority of all BOP consumers have access to grid electricity, but this is very unreliable as it is frequently
subject to power outages. These solutions are expensive due to their high operational costs, and also pose
serious health and environmental risks. As a result, most BOP consumers are not satisfied with them.
The study shows that a majority of these BOP consumers are willing to adopt alternatives which can provide
good lighting, are cheaper, and do not pose health or other hazards, as do those using kerosene fuel. In
particular, the study revealed that solar lighting devices are a viable alternative, once study participants were
exposed to samples of relatively low cost devices with the suggestion of purchases through suitable micro-
financing schemes.
Market size estimates put the current national demand value for solar lighting devices to be in excess of USD 9
million, and project that over the next five years it cumulatively will be in excess of USD 80 million. All findings
from the study indicate that there is much larger potential given the execution of appropriate promotional
campaigns, and particularly if micro-credit schemes are put in place.
A Summary of the Regulatory Obstacles from the Stakeholders’ Perspective
The supply environment is hampered by numerous logistical challenges that are linked to inadequate regulation
at the port of entry and on the lack of product standards. The majority of stakeholders who were interviewed
highlighted the following as areas creating market entry barriers to off-grid lighting distribution:
• No mandated framework for a renewable energy policy, and a mostly donor driven agenda —
from the government agencies interviewed (REA and EWURA), both seem to be waiting on a renewable
energy policy mandate from the MEM;
• Lack of energy sector representation at the district and local level — MEM, EWURA, and REA
staff are based mostly in Dar es Salaam;
• Limited availability of energy subsidies and financing for distribution to solar companies;

GREENMAX CAPITAL ADVISORS 78
• Relatively slow rate of policy implementation that is relevant to rural off-grid lighting —most work
is done through the REA, although their influence is yet to be widely known both by the private sector
and BOP;
• Lack of access to diverse ports — most import/exported goods go through Dar es Salaam;
• Bureaucratic clearing process at the port — slow the movement of lighting goods to the market and
increase product cost;
• Inadequate quality control of lighting products and technology modules (major issue) 25 —
presence of obsolete and low performing products due to low product standards;
• Theft risk when goods are in storage, and other losses incurred by entities importing solar products.
Finally, although tax exemptions for solar products are well structured, the implementation is poorly managed by
the Tanzania Revenue Authority and the TBS. Interviews conducted with these institutions indicated that the
system lacks technical capacity and knowledge at all levels from the import, to storage, to the product inspection,
to the clearance process. TBS is trying to regulate product quality, but the change is slow because the market is
saturated with inferior products. What is somewhat promising, however, is that TAREA, an NGO involved in solar
suppliers’ accreditation is spearheading the prevention of counterfeit products entry, which is prohibited by law.
But it needs much greater support from other stakeholders.
11.2 Recommendations
In order to achieve better Lighting Africa program design in Tanzania, key actors like REA should strengthen their
role in off-grid lighting provision, and encourage increased and more organized private sector partcipation. Three
keys aspects for effective market entry of solar lighting products should be addressed; (i) limited knowledge on
the use and benefits of solar lighting products (ii) lack of product standards leading to market saturation with low
quality products; and (iii) limited financing for solar lighting products.The following framework is recommended:
General: Increasing knowledge of the BOP consumer
Awareness levels of the existence of alternative lighting products, especially solar powered ones at affordable
prices, which have superior advantages, environmentally, economically, health wise etc., are very low in the
general public and especially among the BOP. Out of 156 solar lighting products dealers who were interviewed,
only 33 (21%) were aware of the Lighting Africa Program and most of these were actually the winners of the
LRTC 2010 and 2012. Mass media institutions should be used to disseminate publicity about these products and
the efforts of various stakeholders to ensure that better quality products are being made for the market. This can
be done through joint press conferences, sponsored programs in broadcast media, and advertisements.
Offering information and training particularly in these areas: understanding of the entire product Life Cycle Costs,
comparative product durability, maintenance and disposal costs.
Government:
1) Improving lighting product standards in the supply-chain
Work with the Ministry of Energy and Mineral Resource (MEM) to ensure that Solar VAT / duty exemptions are
allowed only for high quality products;
2) Increase Government Role in Promoting Off-grid Lighting
Lighting Africa Tanzania Market Intelligence, Appendices
GREENMAX CAPITAL ADVISORS 79
The GOT through its Ministry of Energy and Minerals should take a greater role in promoting the LA program. Support by the Government even if just expressed verbally and if disseminated in the mass media, goes a long way to influence the public to accept the program.
The supply chain
The LA program is still unknown by a number of private dealers in the supply chain. This was observed during the stakeholders’ interviews. A case in point was when a national dealer did not know that some brands had undergone quality testing, and met LA’s Minimum Quality Standards. The recommendation is, therefore, a more intensive awareness campaign to private dealers in the supply chain. This will not only increase the uptake of the brands that have met Minimum Quality Standards, but will also promote their uptake further down the chain.
Specifically, knowledge of products that have met LA’s Minimum Quality Standards amongst the public should be increased; develop consumer awareness on quality products; encourage MFI/FIs to develop innovative financing products for both enterprise (dealers/retailers) and consumer financing (for BOP); and develop programs for targeted subsidy schemes to develop weak markets etc.
The Renewable Energy Association (TAREA)
Technical support should be provided to the Renewable Energy Association (TAREA); specifically, capacity building in conducting promotion campaigns for solar lighting products, as this association is very active and in the forefront of engaging in such activities nationwide. This will contribute to consumer awareness and stimulate more demand for solar lighting products.
GREENMAX CAPITAL ADVISORS 80
APPENDIX 1: Literature Review
1. Aikaeli, J. Determinant of Rural Income in Tanzania: An Empirical Approach. Research Report 10/4, Research on Poverty Alleviation: Dar es salaam. Retrieved from: http://www.repoa.or.tz/documents/rr10_4.pdf
2. BOT. (2011). Monetary Policy Statement Bank of Tanzania, Dar es salaam. Retrieved from: http://www.bot-tz.org/Publications/MonetaryPolicyStatements/2011_June_MPS.pdf
3. Eberhard, A. and Kapitak, J. (2010). Tanzania: Learning the Hard Way. Graduate School of Business, University of Cape Town. Retrieved from: http://www.gsb.uct.ac.za/files/Tanzania.pdf
4. ECA (2009). Shaping Climate-Resilient Development: A Framework for Decision Making. The Economics of Climate Adaptation Working Group Report. ClimateWorks Foundation, the Global Environment Facility, McKinsey & Company, Swiss Re, the Rockefeller Foundation, the European Commission, and Standard Chartered Bank. Retrieved from: http://ccsl.iccip.net/climate_resilient.pdf
5. EWURA. (2012). Determination of Multi-Year Cost Reflective Electricity Tariffs in Tanzania, Discussion Paper. Energy and Water Utilities regulatory Authority. Retrieved from: http://www.ewura.go.tz/newsite/attachments/article/65/Discussion%20Paper%20-%20Multi-Year%20Tariffs%20FINAL.pdf
6. Felten, J. The Tanzanian Market for Rural Lighting Technologies. CAMCO presentation at Lighting Rural Tanzania Competition in April 2010
7. GeoModel Solar. (2013). Tanzania Solar Radiation Map. SolarGIS Maps, GeoModel Solar: Bratislava. Retrieved from: http://solargis.info/imaps/#loc=-6.817353,39.243164&c=-7.362467,37.792969&z=6
8. Gicharu, J. and Juma, M. (2011). Enabling Poor People to Overcome Poverty in the United Republic of Tanzania. International Fund for Agricultural Development: Rome. Retrieved from:
http://www.ifad.org/operations/projects/regions/pf/factsheets/tanzania.pdf
9. Hamid, M.A and Magessa, F. (2009). Transformation of Rural PV Market in Tanzania. Evaluation Report. Retrieved from: http://erc.undp.org/evaluationadmin/manageevaluation/viewevaluationdetail.html?evalid=3018
10. Karekezi, et. al. (2009). Climate Change and Energy Security in East Africa. Energy Environment and Development Network for Africa (AFREPREN/FWD). Journal of Economics and Sustainable Development, Vol.3, No.8, 2012.
11. Kihwele et al. (2012). Visions, Scenarios and Action Plans Towards Next Generation Tanzania Power System
12. Kimambo, C. Z. M. (2009): “Best Practices in Dissemination of Solar Photovoltaic Technology: Experience of the Solar PV Mwanza Project in Tanzania”, A Report Submitted to UNDP/GEF and the Government of the URT, Dar es Salaam.
13. Kingdon, J.W. Agendas, Alternatives, and Public Policy. 2nd Ed. New York: HarperCollins College Publishers, 1995.
14. Lighting Africa Market Intelligence Material (2013) — Progress Report 2010/2011, Inception Report for Policy Support Project, Market Assessment Results in Tanzania, Tanzania Qualitative Off-Grid Lighting Market Assessment 2008, Ghana Qualitative Off-Grid Lighting Market Assessment 2008, Kenya Qualitative Off-Grid Lighting Market Assessment 2008, Market Research Synthesis 2011 Report for the Off-Grid Lighting Market in Sub-Saharan Africa, 2011 Policy Report Note for Tanzania
15. Magessa, F. (2008). EAC Strategy to Scale-Up Access to Modern Energy Services. Retrieved from: http://www.eac.int/energy/index.php?option=com_docman&task=cat_view&gid=52&Itemid=70
16. Maliti, E. and Mnenwa, R. (2011). Affordability and Expenditure Patterns for Electricity and Kerosene in Urban Households in

Lighting Africa Tanzania Market Intelligence, Appendices
GREENMAX CAPITAL ADVISORS 81
Tanzania. Research on Poverty Alleviation, Research Report 11/2: Dar es salaam. Retrieved from: http://www.repoa.or.tz/documents/RR_11_2.pdf
17. Malley, Z.J. (2011). Climate Change and Water Resources for Energy Generation in Tanzania. Climate Change Issues Paper. World Renewable Energy Congress: Sweden. Retrieved from: http://www.ep.liu.se/ecp/057/vol2/018/ecp57vol2_018.pdf
18. MEM. (2002). Removing Barriers to the Transformation of the Rural PV Market in Tanzania. Final Report on Industry Survey and Delivery Modes. Ministry of Energy and Minerals. Retrieved from: http://www.tatedo.org/files/publications/Research%20And%20Studies/solarenergy.pdf
19. MEM. (2012). Power System Master Plan. Final Report Updated in 2012. Ministry of Energy and Minerals. Retrieved from: http://www.mem.go.tz/Portals/0/EasyDNNNewsDocuments/1059/0062_10072013-Power_System_Master_Plan_2012.pdf
20. MOF. (2012). Quarterly Economic Review and Budget Execution Report: For Fiscal Year 2012/13. United Republic of Tanzania: Dar es salaam. Retrieved from: http://www.mof.go.tz/mofdocs/budget/BER%20July-%20September%202012.pdf
21. Msofe, B. H. (2010). Rural Energy Access Through Off-Grid Renewables: A Perspective from Tanzania. Dar es Salaam, Tanzania: Rural Energy Agency. PowerPoint presentation. Retrieved from: http://siteresources.worldbank.org/EXTAFRREGTOPENERGY/Resources/717305-1264695610003/6743444-1268073490440/4.4.REF_REA_Tanzania_offgrid_renewables.pdf
22. Msyani, C.M (2013). Current Status of Energy Sector in Tanzania. Executive Exchange on Developing an Ancillary Service Market. United Republic of Tanzania Presentation to the United States Energy Organization: Washington DC. Retrieved from: http://www.usea.org/sites/default/files/event-
/Tanzania%20Power%20Sector.pdf
23. Mwakapuji, A. et. al. (2010). The Tanzanian Energy Sector: The Potential for Job Creation and Productive Gains Through Expanded Electrification. Research on Poverty Alleviation Special Paper 10/3: Dar es salaam. Retrieved from: http://www.repoa.or.tz/documents/sp_10-3_NOV2010HR.pdf
24. NBS. (2002). Household Budget Survey 2000-2001, Final Report. United Republic of Tanzania: Dar es Salaam. Retrieved from: http://www.tanzania.go.tz/hbs/Key_Findings_HBS_Eng.pdf
25. NBS. (2011). Tanzania Demographic and Health Survey 2010. United Republic of Tanzania: Dar es Salaam. Retrieved from: http://www.nbs.go.tz/takwimu/references/2010TDHS.pdf
26. NBS. (2012). 2012 Tanzania Population and Housing Census. Ministry of Finance, United Republic of Tanzania: Dar es salaam. Retrieved from: http://www.nbs.go.tz/sensa/PDF/2012%20PHC%20POPULAR%20VERSION.pdf
27. NBS. (2012). Employment and Earning Survey: Analytical Report (2010-11). Ministry of Finance, United Republic of Tanzania: Dar es salaam. Retrieved from: http://www.kazi.go.tz/wp-content/uploads/2013/02/Employment-and-Earning-Survey-Report-2011-.pdf
28. Nganga, J. et al. (2013). Powering Africa Through Feed-In Tariffs. Advancing renewable Energy to Meet the Continent’s Electricity Needs. World Future Council Foundation and Heinrich Boll Stiftung: Addis Abba. Retrieved from: http://www.worldfuturecouncil.org/fileadmin/user_upload/PDF/Feed_in_Tariff/Powering_Africa_through_Feed-in_Tariffs.pdf
29. Ngeleja, J. and Mwihava, N. (2009). Large scale hydropower, renewable energy adaptation and climate change and energy security in East and Horn of Africa. Draft country paper. National Environment Management Council and Ministry of Energy and Minerals, United Republic of Tanzania: Dar es salaam. Retrieved from:
GREENMAX CAPITAL ADVISORS 82
http://www.afrepren.org/Pubs/Occasional_Papers/pdfs/OP33.pdf
30. Noel, S. (2010). The Economics of Climate Change: Tanzania Water Resources. Stockholm Environment Institute SEI-Africa Centre. Institute of Resource Assessment, University of Dar es Salaam: Dar es salaam. Retrieved from: http://www.economics-of-cc-in-tanzania.org/images/Water_resources_final_.pdf
31. Ondraczek, J. (2011). The Development and Status of Solar Markets in Kenya and Tanzania. Research Unit Sustainability and Global Exchange, University of Hamburg. Retrieved from: http://www.fnu.zmaw.de/fileadmin/fnu-files/staff/ondraczek/110816_PVSEC_Paper_Janosch_Ondraczek_final.pdf
32. Practical Action. (2013). Poor People’s Energy Outlook 2013: Energy for Community Services. Practical Action Publishing: Rugby, UK. Retrieved from: http://cdn1.practicalaction.org/5/1/513f47d0-1950-4f85-a40f-191d0ae4f5bb.pdf
33. REA. (2012). The Rural Energy Fund. Rural Energy Agency, United Republic of Tanzania: Dar es salaam. Retrieved from: http://www.rea.go.tz/AboutUs/Projects/ProjectsFunding/TheRuralEnergyFund.aspx
34. REA (2013). Tanzania Energy Development and Access Project. Rural Energy Agency, United Republic of Tanzania: Dar es salaam. Retrieved from: http://www.rea.go.tz/News/Announcements/TEDAPCreditLine.aspx
35. REA (2013). Lighting Rural Tanzania Competition. Rural Energy Agency, United Republic of Tanzania: Dar es salaam. Retrieved from http://www.rea.go.tz/News/BusinessOpportunities/RFPLightingRuralTanzaniaCompetition2012.aspx
36. SIDA. (2012). Renewable energy helps rural development. Swedish International Development Cooperation Agency. Retrieved from: http://www.sida.se/English/Countries-and-regions/Africa/Tanzania/Programmes-and-projects1/Renewable-energy-helps-rural-
development/
37. Stewart, J. and MacGeorge, R. (2010). Provision of Financial Advisory and Modeling Services to TANESCO. Cost of Service Study Final Report, Ridgway Capital Projects LTD. Retrieved from: http://www.ewura.com/pdf/Notices/TANESCO%20Financial%20Cost%20of%20Service%20-%20Final%20Report_Annex%20to%20the%20TA.pdf
38. TANESCO. (2009). Power Master System Plan Study. Tanzanian Electricity Supply Company, Dar es salaam.
39. TANESCO. (2013a). Power Generation Capacity. Tanzania Electricity Supply Company. Retrieved from: http://www.tanesco.co.tz/index.php?option=com_content&view=article&id=70&Itemid=158
40. TANESCO. (2013b). Approved New Projects Under REA. Tanzania Electricity Supply Company. Retrieved from: http://www.tanesco.co.tz/index.php?option=com_content&view=article&id=96&Itemid=254
41. Lyimo, B. M. (2005). Energy and Sustainable Development in Tanzania. Sustainable Energy Watch 2005/2006, HELIO International Tanzania: Dar es salaam. Retrieved from: http://www.helio-international.org/uploads/Tanzania-EN.pdf
42. .Uisso, J.P. (2011). Rural Energy Agency and Innovation in Delivery of Modern Energy Services to rural areas. Rural Energy Agency, United Republic of Tanzania: Dar es salaam. Retrieved from: http://www.esmap.org/sites/esmap.org/files/4b.%20TANZANIA_Innovation%20in%20Delivery%20of%20Services.pdf
43. URT. (1996). Sustainable Industrial Development Policy (1996-2020). Ministry of Industry and Trade, United Republic of Tanzania
44. URT. (2002). Small and Medium Enterprise Development Policy. Ministry of Industry and Trade: Dar es salaam. Retrieved from: http://www.tanzania.go.tz/pdf/smepolicy.pdf
45. URT. (2003). The National Energy Policy.
Lighting Africa Tanzania Market Intelligence, Appendices
GREENMAX CAPITAL ADVISORS 83
Ministry of Energy and Minerals: Dar es salaam. Retrieved from: http://tatedo.org/cms/images/publications/reports/energypolicy.pdf
46. URT. (2005). Summary of the National Strategy for Growth and Poverty Reduction. Vice President’s Office: Dar es salaam. Retrieved from: http://www.tanzania.go.tz/mkukuta/mkukutasummary.pdf
47. URT. (2009). The National Public-Private Partnership. Prime Minister’s Office: Dar es salaam. Retrieved from: http://www.pmo.go.tz/index.php?option=com_docman&task=cat_view&gid=44&Itemid=91
48. URT (2012a). Development Plan 2011/12 to 2015/16: Unleashing Tanzania’s Latent Growth Potential. Planning Commission, President’s Office: Dar es salaam. Retrieved from: http://www.tanzania.go.tz/pdf/FYDP-2012-07-26.pdf
49. URT (2012b). Poverty and Human Development Report 2011. MKUKUTA, National Strategy for Growth and Poverty Reduction, MOF and REPOA Working Group. Retrieved from: http://www.repoa.or.tz/images/uploads/Poverty_and_Human_Development_Report_2011.pdf
50. World Bank. (2010). Tanzania’s Infrastructure: A Continental Perspective. Africa Infrastructure Country Diagnosis. Policy Research Working Paper 5962. The World Bank: Washington DC. Retrieved from: http://infrastructureafrica.org/system/files/Tanzania%20Country%20Report.pdf
51. World Bank (2013). The Africa Competitiveness Report 2013 . Retrieved from: http://www.worldbank.org/content/dam/Worldbank/document/Africa/Report/africa-competitiveness-report-2013-main-report-web.pdf
52. Boylan, Jessie: Addressing Energy Crisis Through Alternatives and Efficiency at Household Level. International Press Service News Agency. http://ipsnews.net/news.asp?idnews=49876
53. GTZ. (2007). The Potential of Renewable Energies in East Africa. East African Business Council, Dr. Frommel International Consulting,
GTZ. Retrieved from: http://www.renewableseastafrica.de/_uploads/media/1317_Solar%20Energy.pdf
54. Hussain, M. N. (2000). Linkages between SMEs and Large Industries for Increased Markets and Trade: An African Perspective. Economic Research Paper NO 53. Strategic Planning and Research Department, African Development Bank: Abijian. Retrieved from: http://www.afdb.org/fileadmin/uploads/afdb/Documents/Publications/00157640-EN-ERP-53.PDF
55. IPCC, 2011: IPCC Special Report on Renewable Energy Sources and Climate Change Mitigation. Prepared by Working Group III of the Intergovernmental Panel on Climate Change [O. Edenhofer, R. Pichs-Madruga, Y. Sokona, K. Seyboth, P. Matschoss, S. Kadner, T. Zwickel, P. Eickemeier, G. Hansen, S. Schlömer, C. von Stechow (eds)]. Cambridge University Press, Cambridge, United Kingdom and New York, NY, USA, 1075 pp. (Chapter 7 & 9)
56. Ishengoma, E.K. (2010). Financing Options for Solar Energy Application in Rural Areas of Tanzania: Lessons and Challenges. Retrieved from: http://www.giga-hamburg.de/content/fsp4/fine/pdf/fine_paper_ishegoma.pdf
57. Kaguo, T. (2012). FCT throws out OMCs move to block new price formula. EWURA Newsletter, October 2012, Issue No. 007. Retrieved from: http://www.ewura.com/pdf/newsletters/EWURA%20english%20Oct%202012.pdf
58. Kibassa, F.M. (2012).The Role of Small and Micro Enterprises (SMEs) on Government Revenue: Amstelveen. Retrieved from: http://www.iiste.org/Journals/index.php/JEDS/article/view/2302/2304
59. Laquinta, D.L and Drescher, A.W. (2000). Defining the peri-urban: rural-urban linkages and institutional connections. Land Reform: Land Settlement and Cooperatives, Food and Agriculture Organization: Rome. Retrieved from: http://www.fao.org/docrep/003/x8050t/x8050t02.htm
GREENMAX CAPITAL ADVISORS 84
60. Magessa, F. (2005). Contribution of Tanzania GVEP Activities in Achieving Millenium Development Goals. Retrieved October 27, 2010 from http://deafrica.net/workshops/Tanzania%201/Tanzania%20GVEP.ppt
61. Rutaihwa, J. (2013). Examining the Institutional Framework for Investing in Tanzania: A Perspective from the Executive Opinion Survey, 2012-13. Research on Poverty Alleviation, REPOA Brief No. 39: Dar es salaam. Retrieved from: http://www.repoa.or.tz/documents/REPOA_BRIEF_39.pdf
62. Sawe, E.N. (2008). Decentralizing Rural Electrification Through Liquid Biofuel Multifunctional Platforms. Sustainable Energy and Development Forum. Tanzania Traditional Energy Development and Environment Organization (TaTEDO) Newsletter, Issue No. 6.: Dar es salaam. Retrieved from: http://www.tatedo.org/files/publications/SEDF%20Newsletters/sedf6.pdf
63. Songela, F. (2009). Target Market Analysis: Tanzania’s Bioenergy Market. Deutsche Gesellschaft für Technische Zusammenarbeit (GTZ) GmbH, German Federal Ministry of Economics and Technology: Berlin. Retrieved from: http://www.giz.de/Themen/de/dokumente/gtz2009-en-targetmarketanalysis-bioenergy-tanzania.pdf
64. Schwab, K. and Martin, X. S (2012). The Global Competitiveness Report 2012-2013. World Economic Fourm. Retrieved from: http://www3.weforum.org/docs/WEF_GlobalCompetitivenessReport_2012-13.pdf
65. The White House "FACT SHEET: Power Africa." The White House. www.whitehouse.gov, 30 June 2013.
66. TIC. (2008). Power Crisis in Tanzania and it’s Impact on Investment. United Republic of Tanzania: Dar es salaam. Retrieved from: http://www.tic.co.tz/ticwebsite.nsf/0/0fda30f7cdd33c91432576660041ecac/$FILE/Power%20crisis%2
0in%20Tanzania.pdf
67. Uisso, J.P. (2011). Rural Energy Agency Initiatives in Mainstreaming Gender in the Delivery of Modern Energy Services to Rural Areas in Tanzania. Rural Energy Agency, United Republic of Tanzania: Dar es salaam. Retrieved from: http://www.esmap.org/sites/esmap.org/files/DocumentLibrary/FINAL_REA%20Tanzania_AEI%20Gender%20and%20Energy%20Presentation.pdf
68. UNIDO 1. Module 1: Overview of Energy and Energy Efficiency. Sustainable Energy Regulation and Policy Making for Africa. United Nations Industrial Development Organization: Vienna. Retrieved from: http://www.unido.org/fileadmin/media/documents/pdf/EEU_Training_Package/Module1.pdf
69. UNIDO 2. Module 2: Energy Sector in Africa. Sustainable Energy Regulation and Policy Making for Africa. United Nations Industrial Development Organization: Vienna. Retrieved from: http://www.unido.org/fileadmin/media/documents/pdf/EEU_Training_Package/Module2.pdf
70. UNIDO 3. Module 4: The Reform of the Power Sector in Africa. United Nations Industrial Development Organization: Vienna. Retrieved from: http://www.unido.org/fileadmin/media/documents/pdf/EEU_Training_Package/Module4.pdf
71. UNIDO 4. Module 13: Supply-Side Management. Sustainable Energy Regulation and Policy Making for Africa. United Nations Industrial Development Organization: Vienna. Retrieved from: http://africa-toolkit.reeep.org/modules/Module13.pdf
72. UNIDO 5. Module 15: Demand-Side Management. Sustainable Energy Regulation and Policy Making for Africa. United Nations Industrial Development Organization: Vienna. Retrieved from: http://www.unido.org/fileadmin/import/83268_Module15.pdf
73. UNIDO 6. Module 10: Increasing Access to Energy Services in Rural Areas. Sustainable Energy Regulation and Policy Making for Africa. United Nations Industrial Development
Lighting Africa Tanzania Market Intelligence, Appendices
GREENMAX CAPITAL ADVISORS 85
Organization: Vienna. Retrieved from: http://africa-toolkit.reeep.org/modules/Module10.pdf
74. MITM (2009). Tanzania Trade Integration Strategy, 2009-2013. United Republic of Tanzania: Dar es salaam. Retrieved from: http://enhancedif.org/documents/DTIS%20english%20documents/english/Tanzania_TTIS_2009-2013.pdf
75. World Bank (2003). Implementation Completion Report: Tanzania Power VI Project. http://www-wds.worldbank.org/external/default/WDSContentServer/WDSP/IB/2003/09/29/000090341_20030929111722/Rendered/PDF/267450icr.pdf
76. World Bank. (2011). Tanzania: Poverty, Growth, and Public Transfers: Options for a National Productive Safety Net Program. Report No. AAA62 – TZ. Human Development Department, Africa Region, World Bank. Retrieved from: http://www-wds.worldbank.org/external/default/WDSContentServer/WDSP/IB/2012/02/06/000333037_20120206233359/Rendered/PDF/AAA620P12322000hPublicTransfers2011.pdf
77. World Bank (2012). Doing Business in a More Transparent World. Comparing Regulations for Domestic Firms in More than 183 Economics. The World Bank and the International Finance Corporation. Retrieved from: http://www.tic.co.tz/ticwebsite.nsf/0/8bf642b905997d0f432579ae002e83de/$FILE/Doing%20Business%202012.pdf
GREENMAX CAPITAL ADVISORS 86
APPENDIX 2: FOCUS GROUP DISCUSSIONS
2.1 Objectives and Methodology
2.1.1 Purpose of the Focus Group Study
The general objective of conducting focus group discussions as part of this project was to understand the nature and characteristics of the BOP household and SME consumers who reside in rural and peri-urban areas in Tanzania. Household and income-generating needs of rural and peri-urban populations were assessed, in addition to their perspective on solar lighting products. These discussions were to reveal market demand information for modern lighting products, which is a critical part of creating a clear profile of the targeted BOP energy consumer. The specific objectives of the focus groups were to:
a. Understand the living conditions and lifestyles of the rural and peri-urban households, including an outline of how they meet their lighting needs — to establish a list of lighting products commonly used or heard of by BOP consumers such as paraffin candles or kerosene lamps, and reflect how and where these products are used.
b. Summarize the experiences and attitudes of BOP consumers towards different lighting products, their preferences for different delivery mechanisms and financing schemes — to outline a distribution model that a typical BOP consumer encounters at the retail end of the value chain.
c. Assess their lighting product preferences, including their household spending on lighting products (expenditure and time), and the benefits and challenges they see in using them — to outline the BOP consumer budget, including their ability and willingness to pay for alternative lighting products.
d. Understand their familiarity with solar lighting products and assess their knowledge of these products — a short product demonstration after group discussions to establish solar lighting model preferences for the BOP consumer, and estimate market share projections for the different categories of solar lighting products.
2.1.2 Sample description
The study was conducted between June 18th 2013 and July 15th 2013. Socio-economic characteristics of the
population’s 25 mainland regions were used to group them into six clusters. There were 12 groups in 6 clusters.
Two focus groups were organized from each region. The first group consisted of BOP consumers in the
periphery of the modern city/town in that region which is expressive, and distinctive while the second one was
from a rural precinct, which was also typical of that cluster. Stratified purposive samples of heads of households
were drawn for each village/township to obtain a sample size of 15 participants for each focus group.
Stratification was based primarily on gender, with the aim of having a 50 – 50 balance of male versus female-
headed households.
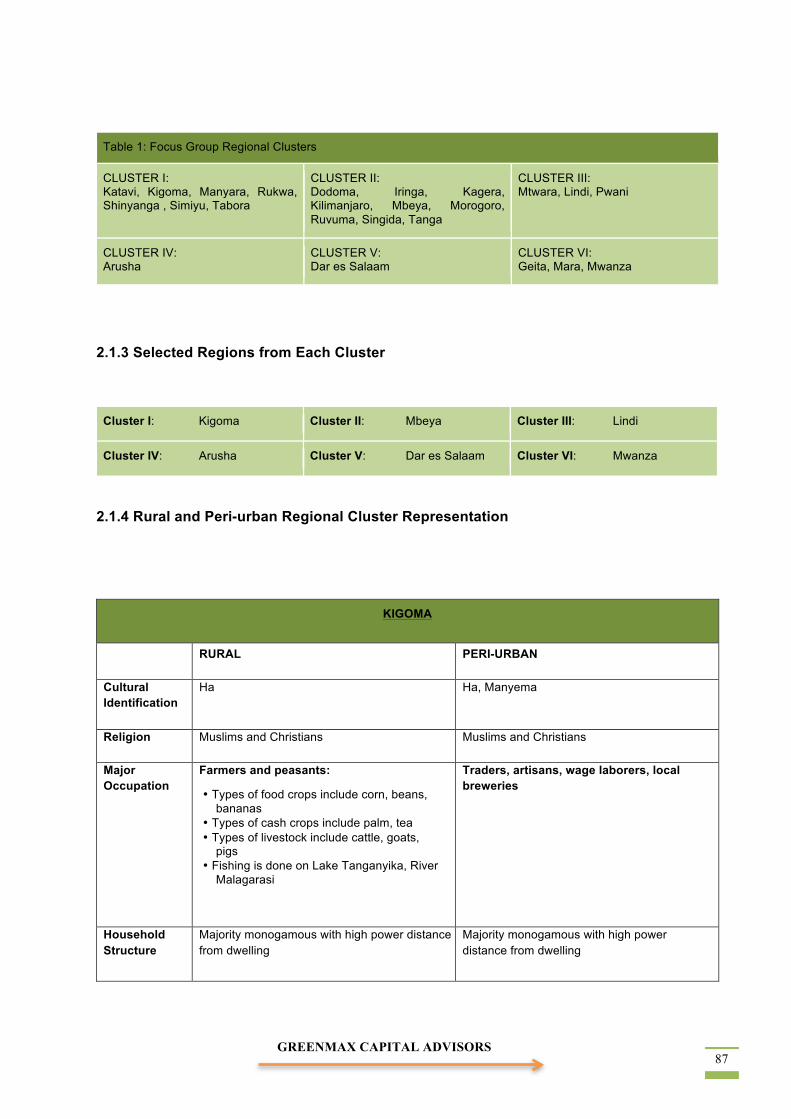
GREENMAX CAPITAL ADVISORS
87
Table 1: Focus Group Regional Clusters
CLUSTER I: Katavi, Kigoma, Manyara, Rukwa, Shinyanga , Simiyu, Tabora
CLUSTER II: Dodoma, Iringa, Kagera, Kilimanjaro, Mbeya, Morogoro, Ruvuma, Singida, Tanga
CLUSTER III: Mtwara, Lindi, Pwani
CLUSTER IV: Arusha
CLUSTER V: Dar es Salaam
CLUSTER VI: Geita, Mara, Mwanza
2.1.3 Selected Regions from Each Cluster
Cluster I: Kigoma Cluster II: Mbeya Cluster III: Lindi
Cluster IV: Arusha Cluster V: Dar es Salaam Cluster VI: Mwanza
2.1.4 Rural and Peri-urban Regional Cluster Representation
KIGOMA
RURAL PERI-URBAN
Cultural Identification
Ha Ha, Manyema
Religion Muslims and Christians Muslims and Christians
Major Occupation
Farmers and peasants:
• Types of food crops include corn, beans, bananas
• Types of cash crops include palm, tea • Types of livestock include cattle, goats,
pigs • Fishing is done on Lake Tanganyika, River
Malagarasi
Traders, artisans, wage laborers, local breweries
Household Structure
Majority monogamous with high power distance from dwelling
Majority monogamous with high power distance from dwelling

GREENMAX CAPITAL ADVISORS 88
Economic Activities by Gender
Food Crops: Men are responsible for initial preparations; while women care for the farm
Cash Crops: Men and women care for tea plantations, harvest tea, and extract palm oil
• Men fish in the lake predominantly at night using lighting devices
• Women gather firewood, cooking, and perform domestic chores
• Diversified livelihoods including: wage labor, craftsmanship, shop keeping, petty trading sometimes involving children
• Food vending and agricultural produce marketing is mainly done by women
• Men engage in fishing (predominantly at night using lighting devices).
MBEYA
RURAL PERI-URBAN
Cultural Identification
Nyiha, Safwa, Nyakyusa Nyakyusa, Safwa, Kinga
Religion Majority Christians and traditionalists Majority Christians, few Muslims
Major Occupation
Farmers and peasants:
• Types of food crops include corn, beans, potatoes, bananas
• Types of cash crops include coffee, tea, horticultural, cocoa
• Types of livestock include cattle, goats, pigs
Traders, artisans, wage laborers, local breweries
Household Structure
Majority monogamous, significant number of FHH (female headed households) with high power distance from dwelling
• A chief hut where parents and small children live • Girls live in a 3-room hut • Older boys construct smaller huts some distance
away • For polygamous families, younger wives dwell in
separate huts with their small children • Cooking is done in a separate hut
Majority monogamous, significant number of FHH (female headed households) with high power distance from dwelling
• Typically rented rooms (2 to 3) with no access to the grid, or unreliable electricity
• Dwellings are constructed using mud bricks with corrugated iron roofing
Economic Activities by Gender
Food Crops: Men are responsible for initial preparations like breaking land, planting, weeding; while women are responsible for harvesting and selling Cash Crops: Both men and women tend to tea and coffee plantations • Women gather firewood, fetch water, cook, and
engage in domestic chores.
• Both men and women engage in off-farm activities like petty trades, local beer brewing and selling.
• Diversified livelihoods allow participation of both men and women.
• E.g. men are employed, while woman engage in petty businesses (children sometimes assist).
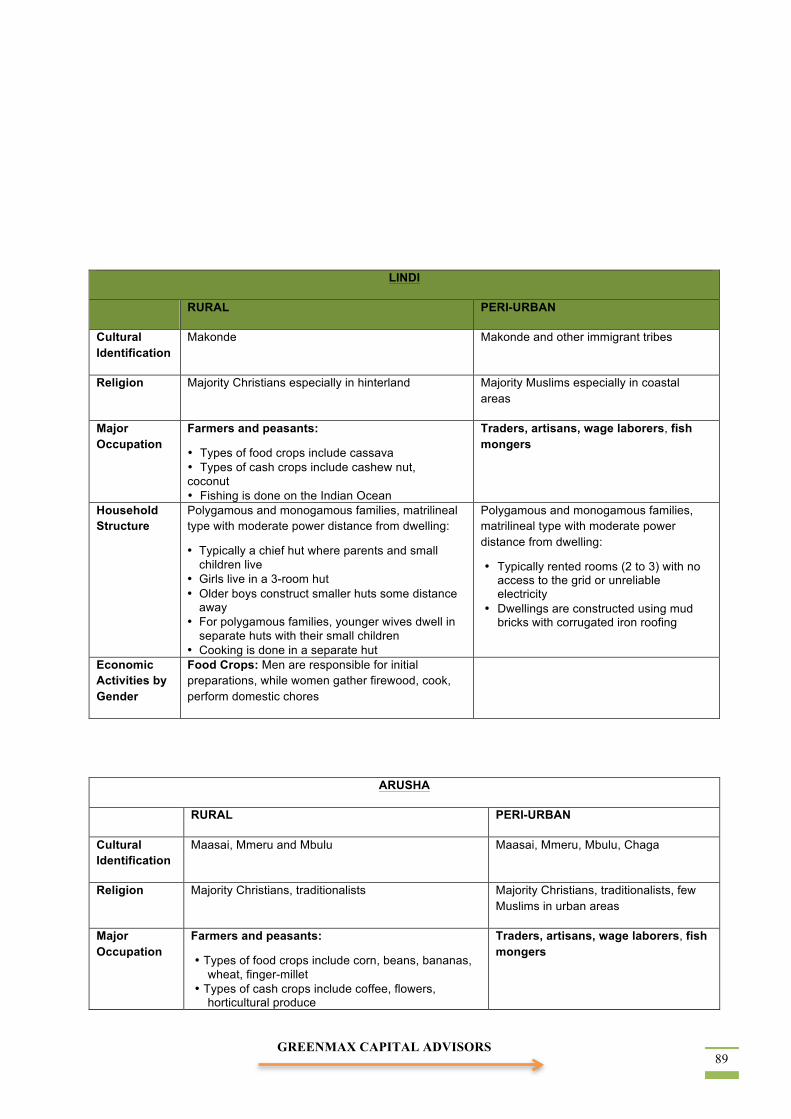
GREENMAX CAPITAL ADVISORS
89
LINDI
RURAL PERI-URBAN
Cultural Identification
Makonde Makonde and other immigrant tribes
Religion Majority Christians especially in hinterland Majority Muslims especially in coastal areas
Major Occupation
Farmers and peasants:
• Types of food crops include cassava • Types of cash crops include cashew nut, coconut • Fishing is done on the Indian Ocean
Traders, artisans, wage laborers, fish mongers
Household Structure
Polygamous and monogamous families, matrilineal type with moderate power distance from dwelling:
• Typically a chief hut where parents and small children live
• Girls live in a 3-room hut • Older boys construct smaller huts some distance
away • For polygamous families, younger wives dwell in
separate huts with their small children • Cooking is done in a separate hut
Polygamous and monogamous families, matrilineal type with moderate power distance from dwelling:
• Typically rented rooms (2 to 3) with no access to the grid or unreliable electricity
• Dwellings are constructed using mud bricks with corrugated iron roofing
Economic Activities by Gender
Food Crops: Men are responsible for initial preparations, while women gather firewood, cook, perform domestic chores
ARUSHA
RURAL PERI-URBAN
Cultural Identification
Maasai, Mmeru and Mbulu Maasai, Mmeru, Mbulu, Chaga
Religion Majority Christians, traditionalists Majority Christians, traditionalists, few Muslims in urban areas
Major Occupation
Farmers and peasants:
• Types of food crops include corn, beans, bananas, wheat, finger-millet
• Types of cash crops include coffee, flowers, horticultural produce
Traders, artisans, wage laborers, fish mongers
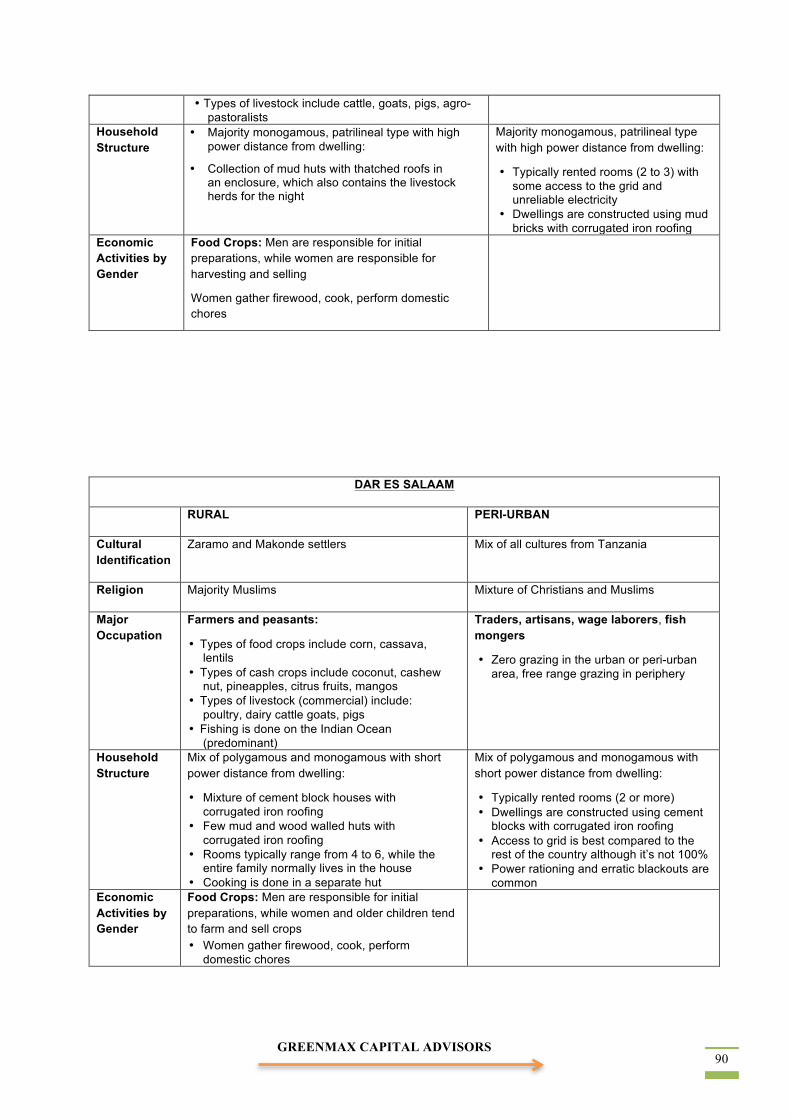
GREENMAX CAPITAL ADVISORS 90
• Types of livestock include cattle, goats, pigs, agro- pastoralists
Household Structure
• Majority monogamous, patrilineal type with high power distance from dwelling:
• Collection of mud huts with thatched roofs in an enclosure, which also contains the livestock herds for the night
Majority monogamous, patrilineal type with high power distance from dwelling:
• Typically rented rooms (2 to 3) with some access to the grid and unreliable electricity
• Dwellings are constructed using mud bricks with corrugated iron roofing
Economic Activities by Gender
Food Crops: Men are responsible for initial preparations, while women are responsible for harvesting and selling
Women gather firewood, cook, perform domestic chores
DAR ES SALAAM
RURAL PERI-URBAN
Cultural Identification
Zaramo and Makonde settlers Mix of all cultures from Tanzania
Religion Majority Muslims Mixture of Christians and Muslims
Major Occupation
Farmers and peasants:
• Types of food crops include corn, cassava, lentils
• Types of cash crops include coconut, cashew nut, pineapples, citrus fruits, mangos
• Types of livestock (commercial) include: poultry, dairy cattle goats, pigs
• Fishing is done on the Indian Ocean (predominant)
Traders, artisans, wage laborers, fish mongers
• Zero grazing in the urban or peri-urban area, free range grazing in periphery
Household Structure
Mix of polygamous and monogamous with short power distance from dwelling:
• Mixture of cement block houses with corrugated iron roofing
• Few mud and wood walled huts with corrugated iron roofing
• Rooms typically range from 4 to 6, while the entire family normally lives in the house
• Cooking is done in a separate hut
Mix of polygamous and monogamous with short power distance from dwelling:
• Typically rented rooms (2 or more) • Dwellings are constructed using cement
blocks with corrugated iron roofing • Access to grid is best compared to the
rest of the country although it’s not 100% • Power rationing and erratic blackouts are
common Economic Activities by Gender
Food Crops: Men are responsible for initial preparations, while women and older children tend to farm and sell crops • Women gather firewood, cook, perform
domestic chores
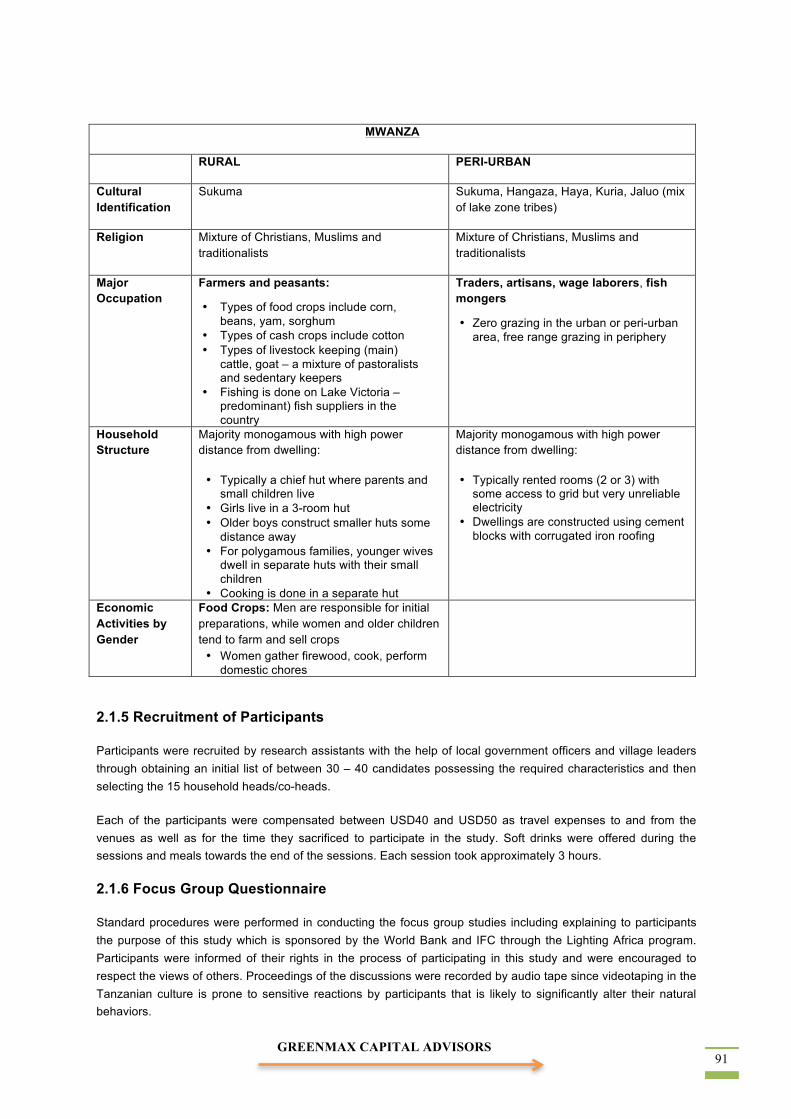
GREENMAX CAPITAL ADVISORS
91
MWANZA
RURAL PERI-URBAN
Cultural Identification
Sukuma Sukuma, Hangaza, Haya, Kuria, Jaluo (mix of lake zone tribes)
Religion Mixture of Christians, Muslims and traditionalists
Mixture of Christians, Muslims and traditionalists
Major Occupation
Farmers and peasants:
• Types of food crops include corn, beans, yam, sorghum
• Types of cash crops include cotton • Types of livestock keeping (main)
cattle, goat – a mixture of pastoralists and sedentary keepers
• Fishing is done on Lake Victoria –predominant) fish suppliers in the country
Traders, artisans, wage laborers, fish mongers
• Zero grazing in the urban or peri-urban area, free range grazing in periphery
Household Structure
Majority monogamous with high power distance from dwelling:
• Typically a chief hut where parents and small children live
• Girls live in a 3-room hut • Older boys construct smaller huts some
distance away • For polygamous families, younger wives
dwell in separate huts with their small children
• Cooking is done in a separate hut
Majority monogamous with high power distance from dwelling:
• Typically rented rooms (2 or 3) with some access to grid but very unreliable electricity
• Dwellings are constructed using cement blocks with corrugated iron roofing
Economic Activities by Gender
Food Crops: Men are responsible for initial preparations, while women and older children tend to farm and sell crops • Women gather firewood, cook, perform
domestic chores
2.1.5 Recruitment of Participants
Participants were recruited by research assistants with the help of local government officers and village leaders through obtaining an initial list of between 30 – 40 candidates possessing the required characteristics and then selecting the 15 household heads/co-heads.
Each of the participants were compensated between USD40 and USD50 as travel expenses to and from the venues as well as for the time they sacrificed to participate in the study. Soft drinks were offered during the sessions and meals towards the end of the sessions. Each session took approximately 3 hours.
2.1.6 Focus Group Questionnaire
Standard procedures were performed in conducting the focus group studies including explaining to participants the purpose of this study which is sponsored by the World Bank and IFC through the Lighting Africa program. Participants were informed of their rights in the process of participating in this study and were encouraged to respect the views of others. Proceedings of the discussions were recorded by audio tape since videotaping in the Tanzanian culture is prone to sensitive reactions by participants that is likely to significantly alter their natural behaviors.
GREENMAX CAPITAL ADVISORS 92
2.1.7 Solar Products Sampling
The product samples displayed and examined by the participants in the focus group sessions included 4 traditional lighting devices and 8 solar lighting devices that were selected on the basis of (i) functionality, (ii) availability in local markets and recommendations from dealers, and (iii) affordable price range for the BOP consumer. Participants were requested to freely examine the products on display and discover how they function, after which discussions concerning the products ensued and participants were eventually asked to state their preferences for the samples and reasons for the preferences. During the discussions the consultant (moderator) answered questions from the participants about the particular characteristics of each model including whether they had warranties or not.
2.1.8 Activities that Require More Lighting
When it comes to specific activities, the issue of priority is first of all dependent on the time between lights on and lights off. Priority also depends on how many devices are owned by the BOP household. They may have two korobois, or even more, or they may have a koroboi and a kerosene lantern. However if only one device is available, priority for lighting in the early evening (6.00p.m. – 8.00p.m.) is for cooking. The next activity of priority is for taking the evening meal. Reading and socializing are given the lowest priority by the BOP population, except in cases where a child is studying for a major examination, and that will be done after cooking and eating has taken place.
Lighting for security by the BOP population is mostly an impromptu need whereby it is used when signals of danger are heard (for example, noises of alarmed livestock in rural areas, or sounds of an intruder in peri-urban areas). The main reason is that they cannot afford to keep lights on for security throughout the night. Lighting for running SMEs is managed separately, in that the business normally has its own device.
___________________________________________
Lighting Africa: Tanzania Market Intelligence
FOCUS GROUP DISCUSSIONS
Duration: up to 180 minutes _____________________________________________
INTRODUCTION
Opening Statement 15 minutes
• Moderators’ introduction and a brief summary on the purpose of the study. • Self-introductions by focus group participants. • Questions from participants • Moderator’s clarifications
Modalities for the discussions
• Thank you for the introductions, now before we continue, let us agree on the modalities of the discussions.
• I will begin by introducing the topic so that everybody knows the main issues to be discussed.
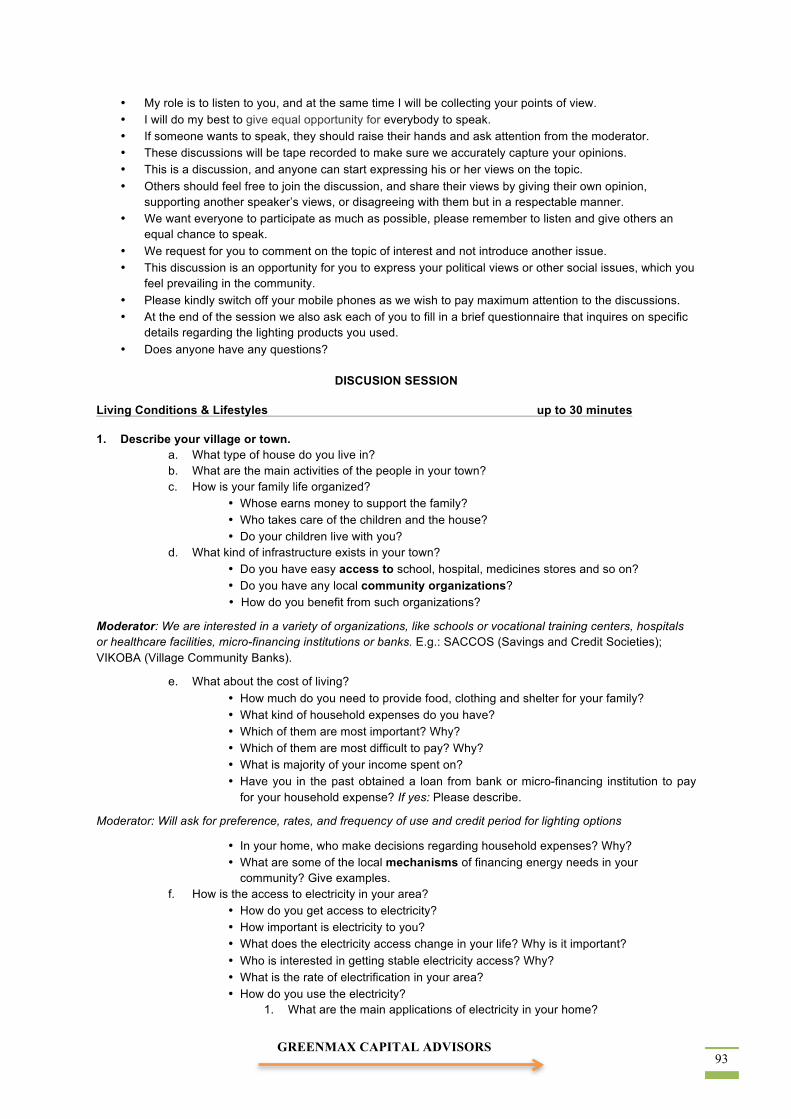
GREENMAX CAPITAL ADVISORS
93
• My role is to listen to you, and at the same time I will be collecting your points of view. • I will do my best to give equal opportunity for everybody to speak. • If someone wants to speak, they should raise their hands and ask attention from the moderator. • These discussions will be tape recorded to make sure we accurately capture your opinions. • This is a discussion, and anyone can start expressing his or her views on the topic. • Others should feel free to join the discussion, and share their views by giving their own opinion,
supporting another speaker’s views, or disagreeing with them but in a respectable manner. • We want everyone to participate as much as possible, please remember to listen and give others an
equal chance to speak. • We request for you to comment on the topic of interest and not introduce another issue. • This discussion is an opportunity for you to express your political views or other social issues, which you
feel prevailing in the community. • Please kindly switch off your mobile phones as we wish to pay maximum attention to the discussions. • At the end of the session we also ask each of you to fill in a brief questionnaire that inquires on specific
details regarding the lighting products you used. • Does anyone have any questions?
DISCUSION SESSION
Living Conditions & Lifestyles up to 30 minutes
1. Describe your village or town. a. What type of house do you live in? b. What are the main activities of the people in your town? c. How is your family life organized?
• Whose earns money to support the family? • Who takes care of the children and the house? • Do your children live with you?
d. What kind of infrastructure exists in your town? • Do you have easy access to school, hospital, medicines stores and so on? • Do you have any local community organizations? • How do you benefit from such organizations?
Moderator: We are interested in a variety of organizations, like schools or vocational training centers, hospitals or healthcare facilities, micro-financing institutions or banks. E.g.: SACCOS (Savings and Credit Societies); VIKOBA (Village Community Banks).
e. What about the cost of living? • How much do you need to provide food, clothing and shelter for your family? • What kind of household expenses do you have? • Which of them are most important? Why? • Which of them are most difficult to pay? Why? • What is majority of your income spent on? • Have you in the past obtained a loan from bank or micro-financing institution to pay
for your household expense? If yes: Please describe.
Moderator: Will ask for preference, rates, and frequency of use and credit period for lighting options
• In your home, who make decisions regarding household expenses? Why? • What are some of the local mechanisms of financing energy needs in your
community? Give examples. f. How is the access to electricity in your area?
• How do you get access to electricity? • How important is electricity to you? • What does the electricity access change in your life? Why is it important? • Who is interested in getting stable electricity access? Why? • What is the rate of electrification in your area? • How do you use the electricity?
1. What are the main applications of electricity in your home?
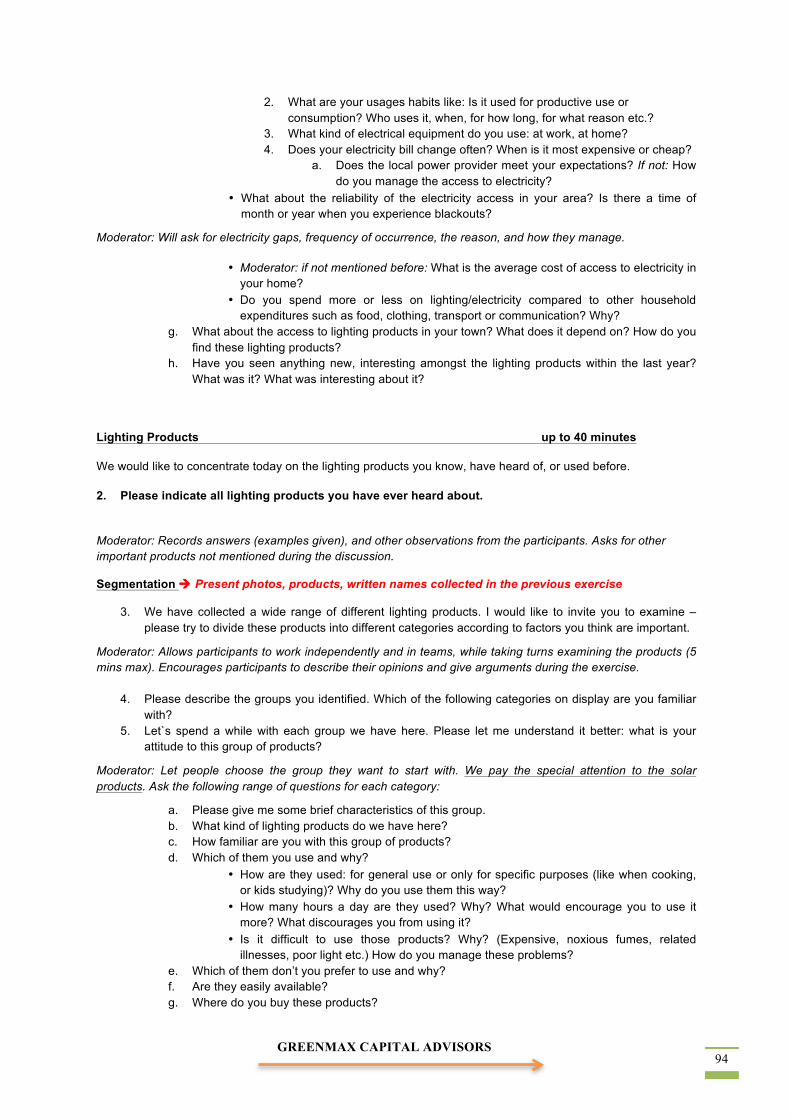
GREENMAX CAPITAL ADVISORS 94
2. What are your usages habits like: Is it used for productive use or consumption? Who uses it, when, for how long, for what reason etc.?
3. What kind of electrical equipment do you use: at work, at home? 4. Does your electricity bill change often? When is it most expensive or cheap?
a. Does the local power provider meet your expectations? If not: How do you manage the access to electricity?
• What about the reliability of the electricity access in your area? Is there a time of month or year when you experience blackouts?
Moderator: Will ask for electricity gaps, frequency of occurrence, the reason, and how they manage.
• Moderator: if not mentioned before: What is the average cost of access to electricity in your home?
• Do you spend more or less on lighting/electricity compared to other household expenditures such as food, clothing, transport or communication? Why?
g. What about the access to lighting products in your town? What does it depend on? How do you find these lighting products?
h. Have you seen anything new, interesting amongst the lighting products within the last year? What was it? What was interesting about it?
Lighting Products up to 40 minutes
We would like to concentrate today on the lighting products you know, have heard of, or used before.
2. Please indicate all lighting products you have ever heard about.
Moderator: Records answers (examples given), and other observations from the participants. Asks for other important products not mentioned during the discussion.
Segmentation Present photos, products, written names collected in the previous exercise
3. We have collected a wide range of different lighting products. I would like to invite you to examine – please try to divide these products into different categories according to factors you think are important.
Moderator: Allows participants to work independently and in teams, while taking turns examining the products (5 mins max). Encourages participants to describe their opinions and give arguments during the exercise.
4. Please describe the groups you identified. Which of the following categories on display are you familiar with?
5. Let`s spend a while with each group we have here. Please let me understand it better: what is your attitude to this group of products?
Moderator: Let people choose the group they want to start with. We pay the special attention to the solar products. Ask the following range of questions for each category:
a. Please give me some brief characteristics of this group. b. What kind of lighting products do we have here? c. How familiar are you with this group of products? d. Which of them you use and why?
• How are they used: for general use or only for specific purposes (like when cooking, or kids studying)? Why do you use them this way?
• How many hours a day are they used? Why? What would encourage you to use it more? What discourages you from using it?
• Is it difficult to use those products? Why? (Expensive, noxious fumes, related illnesses, poor light etc.) How do you manage these problems?
e. Which of them don’t you prefer to use and why? f. Are they easily available? g. Where do you buy these products?
GREENMAX CAPITAL ADVISORS
95
• Are they available on the local market? • Do you get services after purchase (repair/exchange)?
Moderator: if not mentioned ask for: maintenance, spare parts if applicable, trouble shooting.
h. How much do they cost? i. What is/are the reason(s) for selecting such devices? j. Please try to describe the typical user of this category. k. Try to imagine a situation where this group of products are the only lighting products used.
Give the description. What is this place like? Who lives there? What is the most important thing for people living there? Why? How do they think about their future? Why do you think so?
Usage Habits up to 15 minutes
[Expectation: Type(s) of lighting they use, what they use the lighting for, and the types of fuel or energy sources they use to power the devices]
6. Generally, how much money do you spend in a month to power those devices, and what other associated costs might you incur?
7. Who normally uses those lights in your home? For what purposes are they used? (Moderator: ask for examples)
8. Generally for how long into the night are they used? Why? What factors determinate the length of usage? (Moderator: ask for examples)
Moderator: Refers to the previous categories or products used in the segmentation. If you compare the different lighting devices that you have used or heard of before (e.g. kerosene lanterns; pressure lamps; solar lanterns; etc.) what can you say about their advantages? How about the disadvantages?
.
Solar Lighting Products up to 25 minutes
10. Are you familiar with solar lighting products? 11. How do you know of these products? Give me you first impressions, words, pictures, colors or anything
that comes to your mind when you hear about solar lighting products. 12. What do you think about this solution? Why? 13. How would you explain what a solar lantern is to someone who has never heard of it? 14. Do you have any experiences with solar lanterns/torches that are now becoming more available in the
market places? If yes, please describe. 15. What are the advantages of solar lanterns/torches? Why? 16. What are the disadvantages of solar lanterns/torches? Why? 17. Try to imagine the typical user of solar lanterns/torches. Who do can think of? Is it a man, a woman, a
child? Where does he/ she live? What kind of things are important to him/ her? Why?
Optionally Solar products presentation (+10 min)
Distribution models up to 20 minutes
In this part of the discussion we would like to concentrate on different distributions models of lighting products.
18. How are you provided with the lighting products you need? a. Where can you buy these lighting products? Do you like them? Why? b. Are the ranges of lighting products available sufficient for your needs and tastes? c. What about prices – how much do these products cost? How affordable are they to you? Why? d. What about buying them on credit? If it was available, would it change your mind to buy?
GREENMAX CAPITAL ADVISORS 96
• On what terms? • Is there any other similar product that you managed to procure on credit bases?
1. Is yes: What is that product and how is the credit modality 2. Is there any micro-financing organization involved or it is the
supplier/manufacturer facilitating that credit system? If yes, please describe how this system works.
e. What is your assessment of the retailers and distributors of lighting products in your town? Are they reliable? Trustworthy? Why yes/ no? What should change for you to feel more comfortable with their services and products?
Closing Remarks up to 10 minutes
2.1.10 Role of Research Assistants
Six research Assistants were employed to assist in implementing focus group discussions, most of whom were
familiar with the region of study, one for each cluster group. They underwent a two-day training and travelled to
select locations and participants for focus group discussions. This was intended to put positive impact to the
recruitment process by strengthening the credibility of the assistant for the local inhabitants — their role is
summarized below.
• Establish contact with local CBOs in order to lay the groundwork for the study
• Collect and record socioeconomic information on households in selected focus groups locations, and
create a matrix to facilitate the final selection to be done by the consultant;
• Secure a space and arrange pickup and drop off for survey participants
• Visit prospective participants for formal invitations and offer a stipend to cover transportation to the
focus group location
• Assist in facilitating the focus groups discussions through recording conversations, demonstrating the
lighting devices and disseminating and collecting survey questionnaires
GREENMAX CAPITAL ADVISORS
97
APPENDIX 3: STAKEHOLDER INTERVIEWS
_________________________________________________________
3.1 Objectives & Methodology The objective of the survey of stakeholders dealing with solar lighting products was to compile a wide range of
information that would provide them with market insight and data for their strategic marketing plans, as well as a
prescription for the design and implementation plan of the Lighting Africa program. During this phase, information
was obtained through in-person interviews conducted with individuals from relevant Government bodies, a range
of private sector entities and representatives from relevant Civil Society Organizations. The specific objectives of
the survey were to:
(a) Determine the views of the stakeholders on the status of affordable lighting for the BOP population and their roles in facilitating the expansion of lighting in Tanzania
(b) Determine the current policy perspectives and programs in place for provision of affordable lighting to the population who are not connected to the grid
(c) Know the regulatory and institutional frameworks (including quality assurance) governing the relevant product supply chain
(d) Determine the perceptions of the stakeholders of the Lighting Africa program and their actual and potential contribution to support the program roll-out
(e) Assess the efficiency and effectiveness of the supply chain for lighting products for off-grid consumers (f) Determine the current brands and models of lighting products available and their associated functional and
market characteristics (g) Determine the logistical, financial, and technological frameworks governing the relevant product supply chain (h) Map the product supply chains in existence and recommend the most suitable one
3.2. Selection of the Stakeholders and their Role in the Value Chain
The stakeholders were selected to meet the criteria for regional distribution of the targeted BOP population, and that of their role in value chain of lighting products and service access. The three categories selected were: (a) Ministries and Public Institutions (b) NGOs, Research Institutions, and Donors and (c) the private sector
Ministries and Public Institution
Major policy making and implementation of national programs in relation to the country’s needs and development agenda is entrusted to a few Government ministries, agencies and a few public and private institutions. The institutions listed in table 1 were interviewed in order to gather information on policy development and implementation.

GREENMAX CAPITAL ADVISORS 98
Table 1: Ministries and Public Institution
Institution Role in Energy Sector Information gathered
1 MEM Overall Country Supervisor of Energy activities in the Country
Policy issues including legal, regulatory, institutional framework and micro financing
2 TANESCO Tanzania’s sole utility company
Plans to increase access to electricity in the country and the partners in the implementation
3 REA Rural Energy Authority Plans and programs implementation and partners on increasing lighting access in the rural areas
5 EWURA Energy Regulatory Authority
Regulatory information on lighting products
6 Tanzania Bureau of Standards (TBS)
Regulation and Enforcement of standards of products
Regulation and Quality Assurance of lighting products
7 Tanzania Revenue Authority (TRA)
Administering taxes of the Central Government
Taxation policies on lighting products; e.g.: tax exemption, VAT etc.
NGO’s, Research Institutions, Donors and Financing Institutions
For information on partnerships and collaborative initiatives, the consultants interviewed major Non-Governmental Organizations dealing with energy in the Country and environmental NGOs. The criteria for selection were based on the location in the sampled areas and on the roles in the value chain. Three major Research Institutions involved in energy research and donors involved in energy programs were also interviewed. The list of organizations that were interviewed in this category is provided in Table 2 below. Table 2: NGO’s, Research Institutions, Donors and Financing Institutions
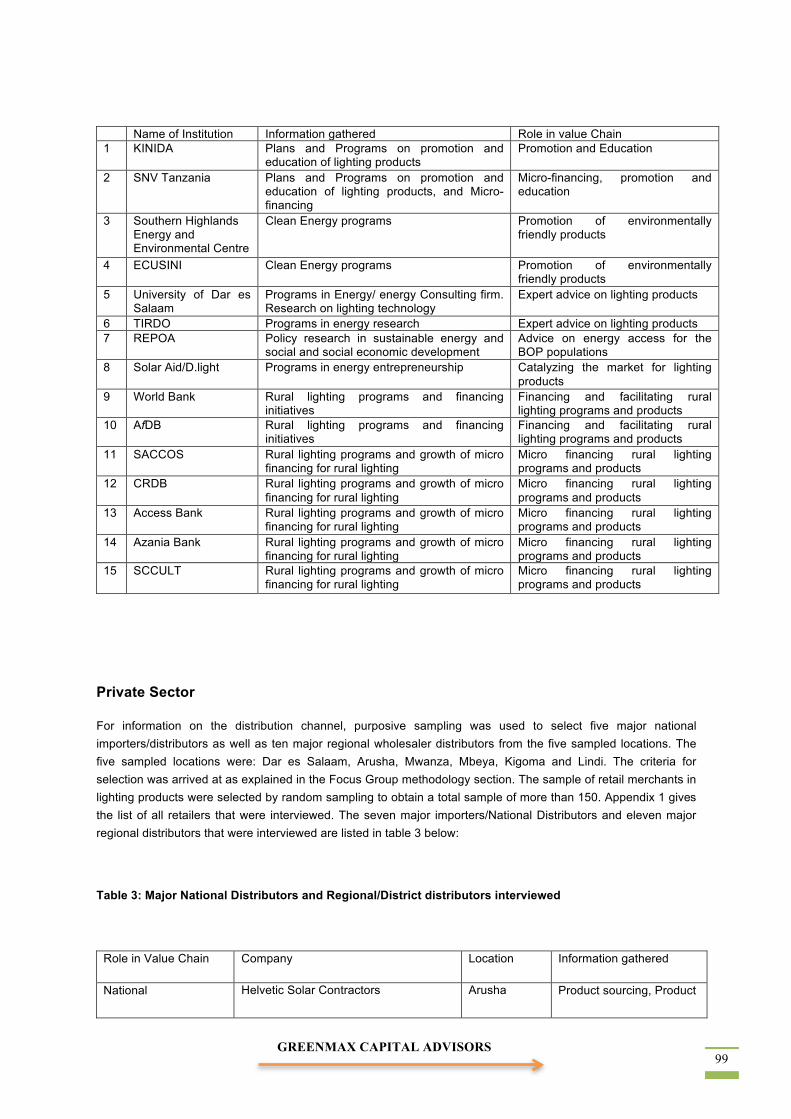
GREENMAX CAPITAL ADVISORS
99
Name of Institution Information gathered Role in value Chain 1 KINIDA Plans and Programs on promotion and
education of lighting products Promotion and Education
2 SNV Tanzania Plans and Programs on promotion and education of lighting products, and Micro-financing
Micro-financing, promotion and education
3 Southern Highlands Energy and Environmental Centre
Clean Energy programs Promotion of environmentally friendly products
4 ECUSINI Clean Energy programs Promotion of environmentally friendly products
5 University of Dar es Salaam
Programs in Energy/ energy Consulting firm. Research on lighting technology
Expert advice on lighting products
6 TIRDO Programs in energy research Expert advice on lighting products 7 REPOA Policy research in sustainable energy and
social and social economic development Advice on energy access for the BOP populations
8 Solar Aid/D.light Programs in energy entrepreneurship Catalyzing the market for lighting products
9 World Bank Rural lighting programs and financing initiatives
Financing and facilitating rural lighting programs and products
10 AfDB Rural lighting programs and financing initiatives
Financing and facilitating rural lighting programs and products
11 SACCOS Rural lighting programs and growth of micro financing for rural lighting
Micro financing rural lighting programs and products
12 CRDB Rural lighting programs and growth of micro financing for rural lighting
Micro financing rural lighting programs and products
13 Access Bank Rural lighting programs and growth of micro financing for rural lighting
Micro financing rural lighting programs and products
14 Azania Bank Rural lighting programs and growth of micro financing for rural lighting
Micro financing rural lighting programs and products
15 SCCULT Rural lighting programs and growth of micro financing for rural lighting
Micro financing rural lighting programs and products
Private Sector
For information on the distribution channel, purposive sampling was used to select five major national importers/distributors as well as ten major regional wholesaler distributors from the five sampled locations. The five sampled locations were: Dar es Salaam, Arusha, Mwanza, Mbeya, Kigoma and Lindi. The criteria for selection was arrived at as explained in the Focus Group methodology section. The sample of retail merchants in lighting products were selected by random sampling to obtain a total sample of more than 150. Appendix 1 gives the list of all retailers that were interviewed. The seven major importers/National Distributors and eleven major regional distributors that were interviewed are listed in table 3 below:
Table 3: Major National Distributors and Regional/District distributors interviewed
Role in Value Chain Company Location Information gathered
National Helvetic Solar Contractors Arusha Product sourcing, Product
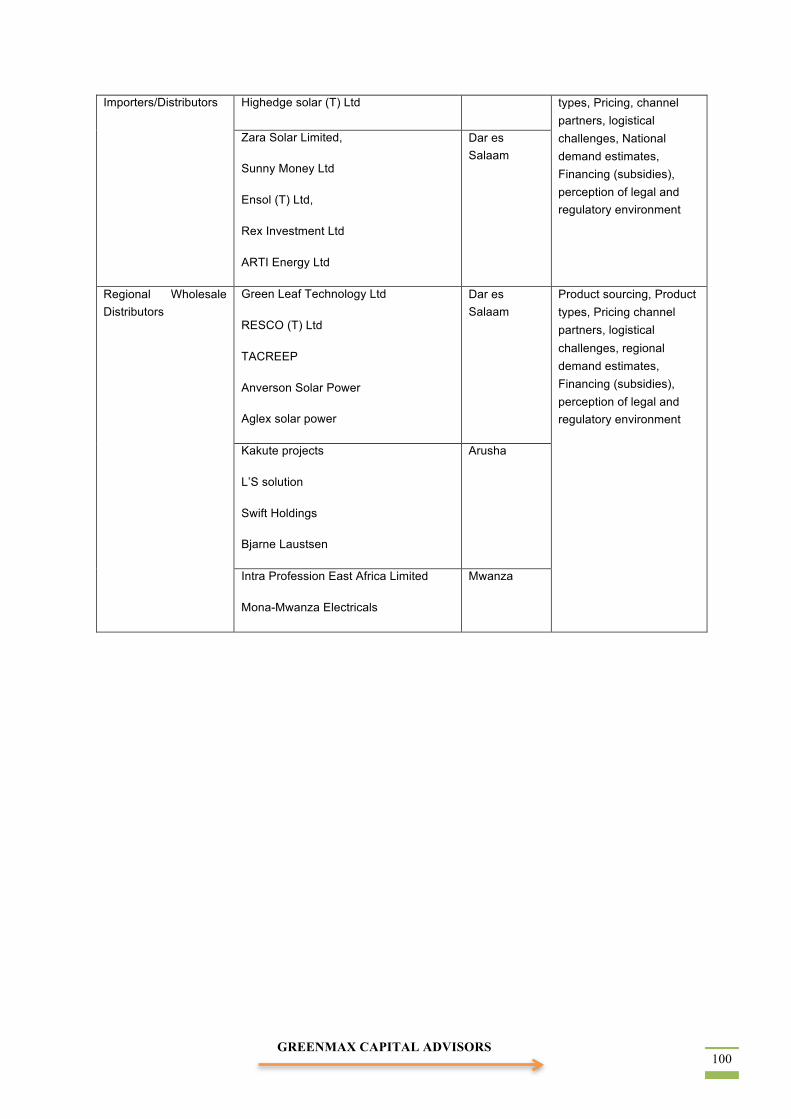
GREENMAX CAPITAL ADVISORS 100
Importers/Distributors Highedge solar (T) Ltd types, Pricing, channel partners, logistical challenges, National demand estimates, Financing (subsidies), perception of legal and regulatory environment
Zara Solar Limited,
Sunny Money Ltd
Ensol (T) Ltd,
Rex Investment Ltd
ARTI Energy Ltd
Dar es Salaam
Regional Wholesale Distributors
Green Leaf Technology Ltd
RESCO (T) Ltd
TACREEP
Anverson Solar Power
Aglex solar power
Dar es Salaam
Product sourcing, Product types, Pricing channel partners, logistical challenges, regional demand estimates, Financing (subsidies), perception of legal and regulatory environment
Kakute projects
L’S solution
Swift Holdings
Bjarne Laustsen
Arusha
Intra Profession East Africa Limited
Mona-Mwanza Electricals
Mwanza
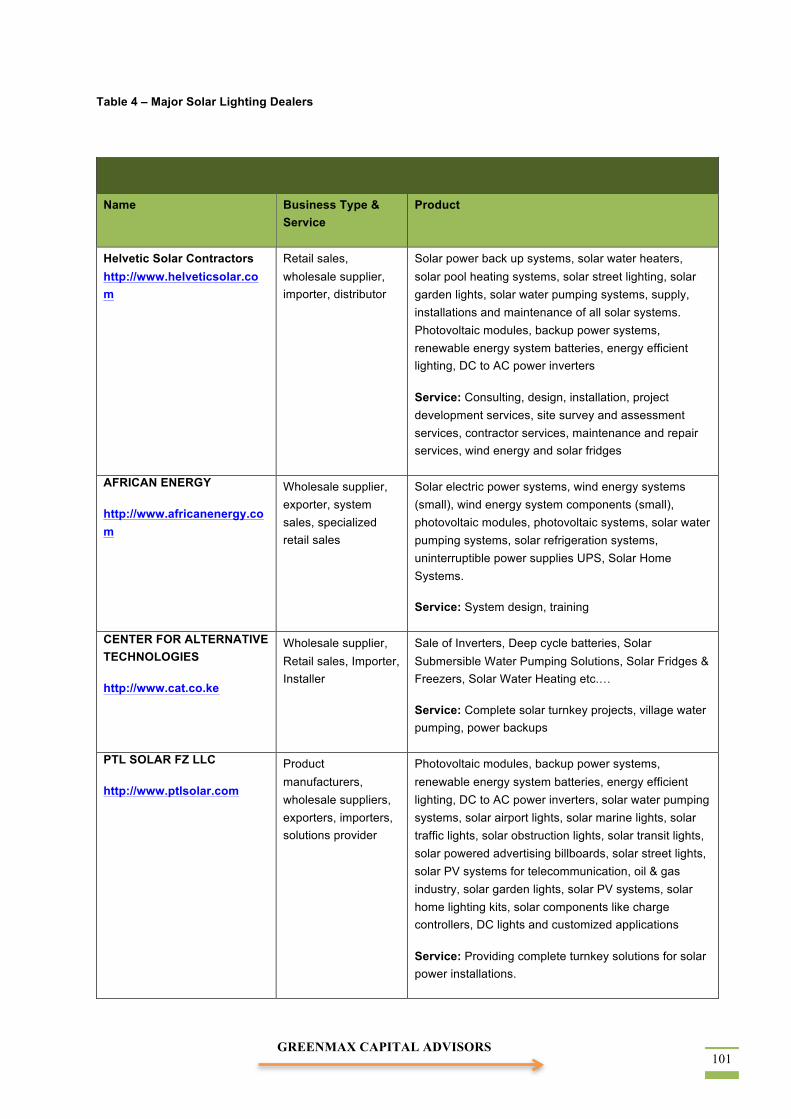
GREENMAX CAPITAL ADVISORS
101
Table 4 – Major Solar Lighting Dealers
Name Business Type & Service
Product
Helvetic Solar Contractors http://www.helveticsolar.com
Retail sales, wholesale supplier, importer, distributor
Solar power back up systems, solar water heaters, solar pool heating systems, solar street lighting, solar garden lights, solar water pumping systems, supply, installations and maintenance of all solar systems. Photovoltaic modules, backup power systems, renewable energy system batteries, energy efficient lighting, DC to AC power inverters
Service: Consulting, design, installation, project development services, site survey and assessment services, contractor services, maintenance and repair services, wind energy and solar fridges
AFRICAN ENERGY
http://www.africanenergy.com
Wholesale supplier, exporter, system sales, specialized retail sales
Solar electric power systems, wind energy systems (small), wind energy system components (small), photovoltaic modules, photovoltaic systems, solar water pumping systems, solar refrigeration systems, uninterruptible power supplies UPS, Solar Home Systems.
Service: System design, training
CENTER FOR ALTERNATIVE TECHNOLOGIES
http://www.cat.co.ke
Wholesale supplier, Retail sales, Importer, Installer
Sale of Inverters, Deep cycle batteries, Solar Submersible Water Pumping Solutions, Solar Fridges & Freezers, Solar Water Heating etc.…
Service: Complete solar turnkey projects, village water pumping, power backups
PTL SOLAR FZ LLC
http://www.ptlsolar.com
Product manufacturers, wholesale suppliers, exporters, importers, solutions provider
Photovoltaic modules, backup power systems, renewable energy system batteries, energy efficient lighting, DC to AC power inverters, solar water pumping systems, solar airport lights, solar marine lights, solar traffic lights, solar obstruction lights, solar transit lights, solar powered advertising billboards, solar street lights, solar PV systems for telecommunication, oil & gas industry, solar garden lights, solar PV systems, solar home lighting kits, solar components like charge controllers, DC lights and customized applications
Service: Providing complete turnkey solutions for solar power installations.
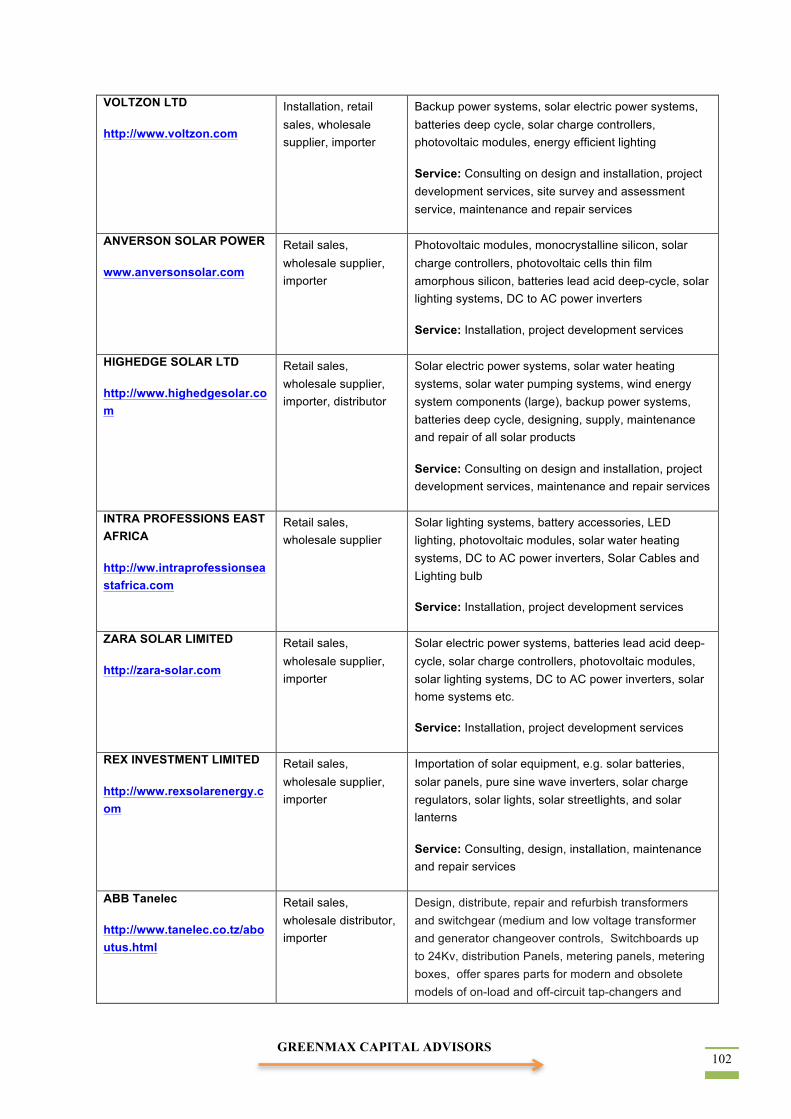
GREENMAX CAPITAL ADVISORS 102
VOLTZON LTD
http://www.voltzon.com
Installation, retail sales, wholesale supplier, importer
Backup power systems, solar electric power systems, batteries deep cycle, solar charge controllers, photovoltaic modules, energy efficient lighting
Service: Consulting on design and installation, project development services, site survey and assessment service, maintenance and repair services
ANVERSON SOLAR POWER
www.anversonsolar.com
Retail sales, wholesale supplier, importer
Photovoltaic modules, monocrystalline silicon, solar charge controllers, photovoltaic cells thin film amorphous silicon, batteries lead acid deep-cycle, solar lighting systems, DC to AC power inverters
Service: Installation, project development services
HIGHEDGE SOLAR LTD
http://www.highedgesolar.com
Retail sales, wholesale supplier, importer, distributor
Solar electric power systems, solar water heating systems, solar water pumping systems, wind energy system components (large), backup power systems, batteries deep cycle, designing, supply, maintenance and repair of all solar products
Service: Consulting on design and installation, project development services, maintenance and repair services
INTRA PROFESSIONS EAST AFRICA
http://ww.intraprofessionseastafrica.com
Retail sales, wholesale supplier
Solar lighting systems, battery accessories, LED lighting, photovoltaic modules, solar water heating systems, DC to AC power inverters, Solar Cables and Lighting bulb
Service: Installation, project development services
ZARA SOLAR LIMITED
http://zara-solar.com
Retail sales, wholesale supplier, importer
Solar electric power systems, batteries lead acid deep-cycle, solar charge controllers, photovoltaic modules, solar lighting systems, DC to AC power inverters, solar home systems etc.
Service: Installation, project development services
REX INVESTMENT LIMITED
http://www.rexsolarenergy.com
Retail sales, wholesale supplier, importer
Importation of solar equipment, e.g. solar batteries, solar panels, pure sine wave inverters, solar charge regulators, solar lights, solar streetlights, and solar lanterns
Service: Consulting, design, installation, maintenance and repair services
ABB Tanelec
http://www.tanelec.co.tz/aboutus.html
Retail sales, wholesale distributor, importer
Design, distribute, repair and refurbish transformers and switchgear (medium and low voltage transformer and generator changeover controls, Switchboards up to 24Kv, distribution Panels, metering panels, metering boxes, offer spares parts for modern and obsolete models of on-load and off-circuit tap-changers and
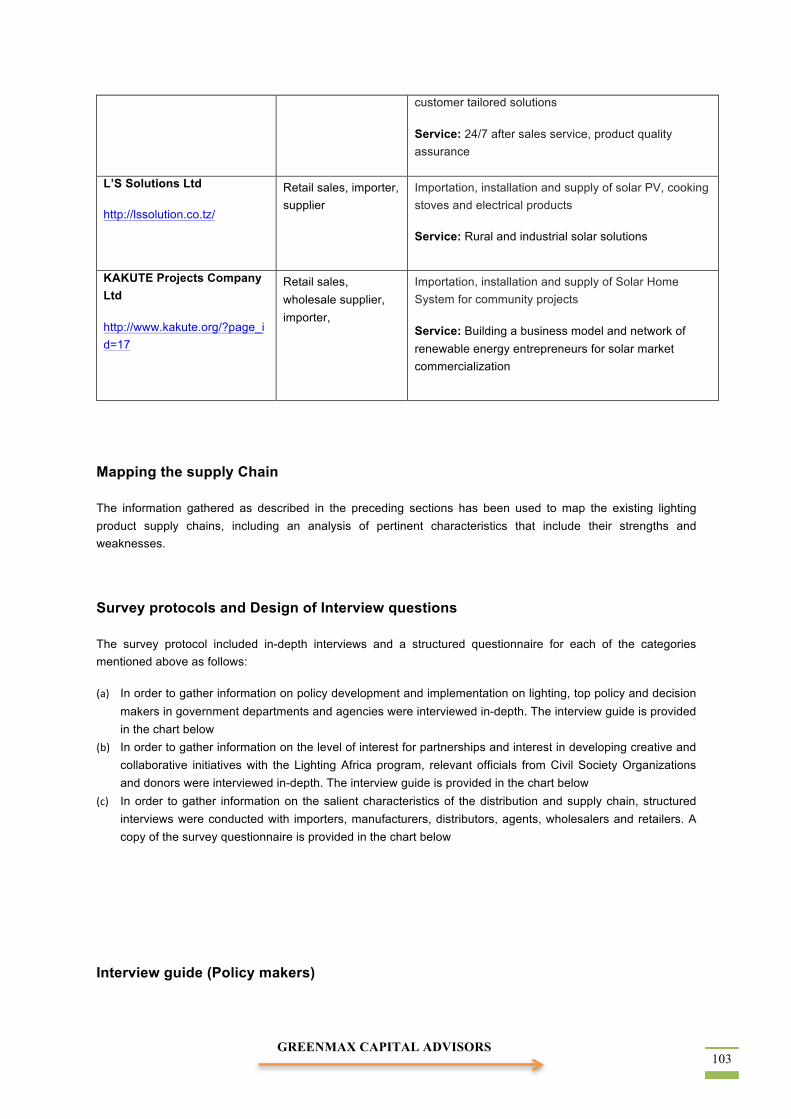
GREENMAX CAPITAL ADVISORS
103
customer tailored solutions
Service: 24/7 after sales service, product quality assurance
L’S Solutions Ltd
http://lssolution.co.tz/
Retail sales, importer, supplier
Importation, installation and supply of solar PV, cooking stoves and electrical products
Service: Rural and industrial solar solutions
KAKUTE Projects Company Ltd
http://www.kakute.org/?page_id=17
Retail sales, wholesale supplier, importer,
Importation, installation and supply of Solar Home System for community projects
Service: Building a business model and network of renewable energy entrepreneurs for solar market commercialization
Mapping the supply Chain
The information gathered as described in the preceding sections has been used to map the existing lighting product supply chains, including an analysis of pertinent characteristics that include their strengths and weaknesses.
Survey protocols and Design of Interview questions
The survey protocol included in-depth interviews and a structured questionnaire for each of the categories mentioned above as follows:
(a) In order to gather information on policy development and implementation on lighting, top policy and decision makers in government departments and agencies were interviewed in-depth. The interview guide is provided in the chart below
(b) In order to gather information on the level of interest for partnerships and interest in developing creative and collaborative initiatives with the Lighting Africa program, relevant officials from Civil Society Organizations and donors were interviewed in-depth. The interview guide is provided in the chart below
(c) In order to gather information on the salient characteristics of the distribution and supply chain, structured interviews were conducted with importers, manufacturers, distributors, agents, wholesalers and retailers. A copy of the survey questionnaire is provided in the chart below
Interview guide (Policy makers)
GREENMAX CAPITAL ADVISORS 104
_____________________________________________
Lighting Africa: Tanzania Market Intelligence
STAKEHOLDER INTERVIEW I: POLICY MAKERS (GOVERNMENT AGENCIES)
_____________________________________________
INTRODUCTION
Opening Statement 10 minutes
• Facilitators’ introduction of study team and a brief summary on the purpose of the study. • Introduction from the stakeholder representative • Interview Questionnaire • Questions regarding the interview • Facilitators’ clarifications
Facilitator: Thank you for agreeing to participate in this interview survey. The objective of this study is to conduct interviews with a wide range of stakeholders, and collect data and information pertaining to the value chain of modern lighting products in Tanzania, especially in rural and peri-urban areas. This is an opportunity to find out about the demands and challenges of supplying lighting products in areas with inadequate or no electricity service connection.
This is a study undertaken [on behalf of the] Tanzania Market Intelligence program sponsored by the World Bank. All the information collected during this interview will be used for market research purposes only, and your private information (such as name, address) won’t be published). We thank you for your participation.
A. Name of Institution/Department ____________________________________________________
Contact Information _____________________________________________________________
B. Name of Respondent ____________________________________________________________
C. Position of Respondent __________________________________________________________
INTERVIEW QUESTIONS
Electricity Demand, Access and Services up to 15 minutes
1. What is your view on the importance of establishing affordable lighting to rural and peri-urban households without access to electricity in Tanzania? What plans are set for the grid extension?
---------------------------------------------------------------------------------------------------------------------------------------------------------------------------------------------------------------------------------------------------------------------------------------------------------------------------------------------------------------------------------------------------------------------------------------------------------------------------------------------------------------------------------------------------------------------------------------------------------------------------------------------------------------------------------------------------------------------------
5. Are there institutional policies in your agency targeted for affordable lighting in Tanzania? (Please describe the regulatory framework, and the tariff structure).
----------------------------------------------------------------------------------------------------------------------------------------------------------------------------------------------------------------------------------------------------------------------------------------------------------------------------------------------------------------------------------------------------------------------------------------------------------------------------------------------------------------------------------------------------------------------------------------------------------------------------------------------------------------------------------------------------------------------------

GREENMAX CAPITAL ADVISORS
105
6. What programs if any, are in place to establish sustainable and affordable lighting for off-grid consumers? Describe the objectives, and if it’s been successful.
----------------------------------------------------------------------------------------------------------------------------------------------------------------------------------------------------------------------------------------------------------------------------------------------------------------------------------------------------------------------------------------------------------------------------------------------------------------------------------------------------------------------------------------------------------------------------------------------------------------------------------------------------------------------------------------------------------------------------
Regulatory Framework up to 15 minutes
7. Are there any upcoming rural electrification projects, or supporting small renewable energy initiatives, and who are your project partners? Are you also aware of the “Lighting Africa” Program sponsored by the International Finance Corporation and the World Bank?
-----------------------------------------------------------------------------------------------------------------------------------------------------------------------------------------------------------------------------------------------------------------------------------------------------------------------------------------------------------------------------------------------------------------------------------------------------------------------------------------------------------------------------------------------------------------------------------------------------------------------------------------------------------------------------------------------------------------
8. Are there any specific policies for alternative energy sources such as solar for lighting? Please describe the policy and how it works.
----------------------------------------------------------------------------------------------------------------------------------------------------------------------------------------------------------------------------------------------------------------------------------------------------------------------------------------------------------------------------------------------------------------------------------------------------------------------------------------------------------------------------------------------------------------------------------------------------------------------------------------------------------------------------------------------------------------------------
9. What long-term impact will renewable energy policy change have? In which specific areas (socioeconomic, environmental, political)?
----------------------------------------------------------------------------------------------------------------------------------------------------------------------------------------------------------------------------------------------------------------------------------------------------------------------------------------------------------------------------------------------------------------------------------------------------------------------------------------------------------------------------------------------------------------------------------------------------------------------------------------------------------------------------------------------------------------------------
Market Outlook up to 15 minutes
10. At the moment it can be seen that there are a variety of brands, which are flooding the market of solar lighting devices. Are there any specific regulations, including quality assurances governing this business in the country? (Please describe the supply policies).
---------------------------------------------------------------------------------------------------------------------------------------------------------------------------------------------------------------------------------------------------------------------------------------------------------------------------------------------------------------------------------------------------------------------------------------------------------------------------------------------------------------------------------------------------------------------------------------------------------------------------------------------------------------------------------------------------------------------------
11. What are the major challenges that you face as an institution with regard to your role in this area of solar lighting devices for the off-grid population?
----------------------------------------------------------------------------------------------------------------------------------------------------------------------------------------------------------------------------------------------------------------------------------------------------------------------------------------------------------------------------------------------------------------------------------------------------------------------------------------------------------------------------------------------------------------------------------------------------------------------------------------------------------------------------------------------------------------------------
GREENMAX CAPITAL ADVISORS 106
12. What are the prospects for rural renewable energy and energy efficient projects in the future? Do you think solar products will become popular, or have helpful or hazardous effects? What are the current plans (or interventions) within your department?
----------------------------------------------------------------------------------------------------------------------------------------------------------------------------------------------------------------------------------------------------------------------------------------------------------------------------------------------------------------------------------------------------------------------------------------------------------------------------------------------------------------------------------------------------------------------------------------------------------------------------------------------------------------------------------------------------------------------------
Partnerships up to 10 minutes
13. Do you have any recommendations to make regarding lighting expansion efforts in Africa? What challenges and potential do you foresee?
----------------------------------------------------------------------------------------------------------------------------------------------------------------------------------------------------------------------------------------------------------------------------------------------------------------------------------------------------------------------------------------------------------------------------------------------------------------------------------------------------------------------------------------------------------------------------------------------------------------------------------------------------------------------------------------------------------------------------
14. How important are partnerships in the design and monitoring of energy programs in rural and peri-urban areas? What types of partnerships are suitable (e.g. PPPs, with CBOs, with MFIs)?
--------------------------------------------------------------------------------------------------------------------------------------------------------------------------------------------------------------------------------------------------------------------------------------------------------------------------------------------------------------------------------------------------------------------------------------------------------------------------------------------------------------------------------------------------------------------------------
Thank you very much sir/madam for your participation!
Interview guide (Civil Society Organizations and Donors)
_____________________________________________
Lighting Africa: Tanzania Market Intelligence
STAKEHOLDER INTERVIEW II: CIVIL SOCIETY ORGANIZATIONS (NGOs, Research Organizations, CBOs)
_____________________________________________
INTRODUCTION
Opening Statement 10 minutes
• Facilitators’ introduction and a brief summary on the purpose of the study, and the study team. • Introduction from the stakeholder representative • Interview Questionnaire • Questions regarding the interview • Facilitators’ clarifications
Facilitator: Thank you for agreeing to participate in this interview survey. The objective of this study is to conduct interviews with a wide range of stakeholders, and collect data and information pertaining to the value chain of modern lighting products in Tanzania, especially in rural and peri-urban areas. This is an opportunity to find out about the demands and challenges of supplying lighting products in areas with inadequate or no electricity service connection.
GREENMAX CAPITAL ADVISORS
107
This is a study undertaken [on behalf of] Lighting Africa: Tanzania Market Intelligence program sponsored by the World Bank. All the information collected during this interview will be used for market research purposes only, and your private information (such as name, address) won’t be published. We thank you for your participation.
D. Name of Organization/Department _________________________________________________
Contact Information _____________________________________________________________
E. Name of Respondent ____________________________________________________________
F. Position of Respondent __________________________________________________________
INTERVIEW QUESTIONS
Electricity Access up to 10 minutes
4. What is your view on the importance of establishing affordable lighting to rural and peri-urban households without access to electricity in Tanzania? Is it for livelihood improvement, gender empowerment, creating access to modern energy, environment, health, education, etc.?
-----------------------------------------------------------------------------------------------------------------------------------------------------------------------------------------------------------------------------------------------------------------------------------------------------------------------------------------------------------------------------------------------------------------------------------------------------------------------------------------------------------------------------------------------------------------------------------------------------------------------------------------------------------------------------------------------------------------
5. What is your Institution’s role in sponsoring/facilitating affordable lighting in Tanzania?
--------------------------------------------------------------------------------------------------------------------------------------------------------------------------------------------------------------------------------------------------------------------------------------------------------------------------------------------------------------------------------------------------------------------------------------------------------------------------------------------------------------------------------------------------------------------------------------------------------------------------------------------------------------------------------------------------------------------------------------------------------------------------------------------------------------------------------------------------------------------------------------------------------------------------------------------------------------------------------------------------------------------
Lighting Programs (Projects) up to 15 minutes
6. Are you aware of the “Lighting Africa” program, and how does your organization participate in this, if at all?
----------------------------------------------------------------------------------------------------------------------------------------------------------------------------------------------------------------------------------------------------------------------------------------------------------------------------------------------------------------------------------------------------------------------------------------------------------------------------------------------------------------------------------------------------------------------------------------------------------------------------------------------------------------------------------------------------------------------------
7. What programs do you have in place to facilitate affordable lighting for off-grid consumers in Tanzania and to what extent have they achieved their objectives? What resources have you committed for this?
------------------------------------------------------------------------------------------------------------------------------------------------------------------------------------------------------------------------------------------------------------------------------------------------------------------------------------------------------------------------------------------------------------------------------------------------------------------------------------------------------------------------------------------------------------------------------------------------------------------------------------------------------------------------------------------------------------------------------------------------------------------------------------------------------------------------------------------------------------------------
GREENMAX CAPITAL ADVISORS 108
Partnerships up to 20 minutes
8. Which specific channels (public/private entities) do you use for delivery of your programs and how do you communicate to your targeted beneficiaries? Out of those, which are most successful and most challenging, why?
------------------------------------------------------------------------------------------------------------------------------------------------------------------------------------------------------------------------------------------------------------------------------------------------------------------------------------------------------------------------------------------------------------------------------------------------------------------------------------------------------------------------------------------------------------------------------------------------------------------------------------------------------------------------------------------------------------------------------------------------------------------------------------------------------------------------------------------------------------
9. Are there any upcoming small renewable energy projects in this regard that are targeted for rural and peri-urban households and small enterprises? Who are your project partners, if any?
---------------------------------------------------------------------------------------------------------------------------------------------------------------------------------------------------------------------------------------------------------------------------------------------------------------------------------------------------------------------------------------------------------------------------------------------------------------------------------------------------------------------------------------------------------------------------------------------------------------------------------------------------------------------------------------------------------------------------
10. If there are any specific preferences for alternative energy sources for lighting such as solar panels, what are your main reasons for sponsoring them?
----------------------------------------------------------------------------------------------------------------------------------------------------------------------------------------------------------------------------------------------------------------------------------------------------------------------------------------------------------------------------------------------------------------------------------------------------------------------------------------------------------------------------------------------------------------------------------------------------------------------------------------------------------------------------------------------------------------------------
11. Do you work with/assist any local entrepreneurs or initiatives that might have benefitted from the Lighting Africa program? What was their role (educator, supplier, financer)? Please explain.
---------------------------------------------------------------------------------------------------------------------------------------------------------------------------------------------------------------------------------------------------------------------------------------------------------------------------------------------------------------------------------------------------------------------------------------------------------------------------------------------------------------------------------------------------------------------------------------------------------------------------------------------------------------------------------------------------------------------------
Lighting Challenges and Opportunities up to 15 minutes
12. What are the major challenges that you face as an organization with regard to your role in this area of solar lighting devices for the off-grid population?
-----------------------------------------------------------------------------------------------------------------------------------------------------------------------------------------------------------------------------------------------------------------------------------------------------------------------------------------------------------------------------------------------------------------------------------------------------------------------------------------------------------------------------------------------------------------------------------------------------------------------------------------------------------------------------------------------------------------
13. And what mechanism can help support the supply of off-grid solutions to populations without access to electricity?
-----------------------------------------------------------------------------------------------------------------------------------------------------------------------------------------------------------------------------------------------------------------------------------------------------------------------------------------------------------------------------------------------------------------------------------------------------------------------------------------------------------------------------------------------------------------------------------------------------------------------------------------------------------------------------------------------------------------
GREENMAX CAPITAL ADVISORS
109
14. What opportunities do you see for this initiative of Lighting Africa in Tanzania, and what recommendations do you make so that it can be successful in meeting its’ objectives?
------------------------------------------------------------------------------------------------------------------------------------------------------------------------------------------------------------------------------------------------------------------------------------------------------------------------------------------------------------------------------------------------------------------------------------------------------------------------------------------------------------------------------------------------------------------------------------------------------------------------------------------------------------------------------------------------------------------------------------------------------------------------------------------------------------------------------------------------------------------------------------------------------------------------------------------------------------------------------------------------------
Thank you very much for your participation!
Survey Questionnaire (importers, manufacturers, distributors, agents, wholesalers and retailers)
_____________________________________________
Lighting Africa: Tanzania Market Intelligence
STAKEHOLDER QUESTIONNAIRES III: PRIVATE SECTOR DEALERS
_____________________________________________
INTRODUCTION
Opening Statement 10 minutes
• Facilitators’ introduction and a brief summary on the purpose of the study, and the study team. • Introduction from the stakeholder representative • Interview Questionnaire • Questions regarding the interview • Facilitators’ clarifications
Facilitator: Thank you for agreeing to participate in this interview survey. The objective of this study is to conduct interviews with a wide range of stakeholders, and collect data and information pertaining to the value chain of modern lighting products in Tanzania, especially in rural and peri-urban areas. This is an opportunity to find out about the demands and challenges of supplying lighting products in areas with inadequate or no electricity service connection.
This is a study undertaken [on behalf of] Lighting Africa: Tanzania Market Intelligence program sponsored by the World Bank. All the information collected during this interview will be used for market research purposes only, and your private information (such as name, address) won’t be published. We thank you for your participation.
G. Name of Company/Department ____________________________________________________

GREENMAX CAPITAL ADVISORS 110
Contact Information _____________________________________________________________
H. Name of Respondent ____________________________________________________________
I. Position of Respondent __________________________________________________________
INTERVIEW QUESTIONS
Company Profile up to 5 minutes
4. Year the business was established in Tanzania ____________________________________________
5. Major business involved in ____________________________________________________________
6. Scope of operations in Tanzania (all regions or some?) _____________________________________
7. Position of respondent in the organization _______________________________________________
Operations and Energy Services up to 15 minutes
8. Which of the following lighting products do you deal with?
Solar lantern (LED) Torch (LED) Flood light (solar) Task light (solar)
Flood light (solar) Battery lantern Area light Solar Mini kit (Generator)
Flashlight (battery) Task light rechargeable Flood light (battery) Spotlight
Others (please mention) ………………………………………………………………………
9. Which particular brands? (i) …………………………………… (iv) ……………………………………
(ii) …………………………………… (v) …………………………………….
(iii) …………………………………… (vi) …………………………………….
10. How do you get these products? __________________________________________________________________________________
11. What are the price ranges for the brands you distribute (i.e. that which you charge on the next level)?
--------------------------------------------------------------------------------------------------------------------------------------------------------------------------------------------------------------------------------------------------------------------------------------------------------------------------------------------------------------------------------------------------------------------------------------------------------------------------------------------------------------------------------------------------------------------------------------------------------------------------------------------------------------------------------------------------------------------------------------------------------------------------------------------------------------------------------------------------------------------------------------------------------------------------------------------------------------------------------------------------------------------
12. Can you please rank three of your top selling brands and their relative proportions in terms of sales?
Top selling brand is-----------------------------------It sells ----------------- times in volume compared to 2nd brand
Second selling brand------------------------------ It sells ------------------- times in volume compared to 3rd brand
Third top selling brand ---------------------------
Market Outlook up to 20 minutes
13 How is the market in Tanzania responding to your lighting brands?

GREENMAX CAPITAL ADVISORS
111
Demand is static/has stalled demand is steadily rising demand is rapidly rising
Demand is decreasing
14. Which specific markets or areas do you target in the country?
----------------------------------------------------------------------------------------------------------------------------------------------------------------------------------------------------------------------------------------------------------------------------------------------------------------------------------------------------------------------------------------------------------------------------------------------------------------------------------------------------------------------------------------------------------------------------------------------------------------------------------------------------------------------------------------------------------------------------
15. What feedback are you getting from your customers/the market about your products in connection with the following? (please put a tick in the box corresponding to your view)
Qn. No.
Very poor Poor Average Good Very good Not applicable
a. Durability of devices
b. Light quality
c. Fragility
d. Prices of devices
e. Cost of powering devices
f. Durability of light once fully charged
16. At the moment there are many brands now appearing in the market, some are clearly branded and some are not so clearly branded. What is your opinion about this?
------------------------------------------------------------------------------------------------------------------------------------------------------------------------------------------------------------------------------------------------------------------------------------------------------------------------------------------------------------------------------------------------------------------------------------------------------------------------------------------------------------------------------------------------------------------------------------------------------------------------------------------------------------------------------------------------------------------------------------------------------------------------------------------------------------------------------------------------------------------------
17. What is the state of competition from other types of lighting products?
------------------------------------------------------------------------------------------------------------------------------------------------------------------------------------------------------------------------------------------------------------------------------------------------------------------------------------------------------------------------------------------------------------------------------------------------------------------------------------------------------------------------------------------------------------------------------------------------------------------------------------------------------------------------------------------------------------------------------------------------------------------------------------------------------------------------------------------------------------------------
Supply Logistics up to 20 minutes
18. Which channels of distribution do your products normally go through in order to reach final consumers? (Please tick all applicable)
GREENMAX CAPITAL ADVISORS 112
National: distributors/wholesalers
Regional/district: distributors/wholesalers
Retailers: Convenience stores/kiosks Electrical goods shops
Vendors: Street hawkers Village markets
19. If you are an importer/supplier can you please mention some of your regional agents/wholesaler who distribute your products.
--------------------------------------------------------------------------------------------------------------------------------------------------------------------------------------------------------------------------------------------------------------------------------------------------------------------------------------------------------------------------------------------------------------------------------------------------------------------------------------------------------------------------------------------------------------------------------------------------------------------------------------------------------------------------------------------------------------------------------------------------------------------------------------------------------------------------------------------------------------------------------------------------------------------------------------------------------------------------------------------------------------------
20. What forms of transportation do you normally use for your products when they are:
(i) Imported: Marine vessels Air freighted Road transport rail transport
(ii) Sent to retailers: Air freighted Road transport rail transport
21. What logistical challenges do you face as a result both in the suitability of the channels used and the physical transportation methods?
----------------------------------------------------------------------------------------------------------------------------------------
--------------------------------------------------------------------------------------------------------------------------------------
----------------------------------------------------------------------------------------------------------------------------------------
-----------------------------------------------------------------------------------------------------------------------------------------
22. Is there access to financial loans for importing and distributing lighting products? If yes, are there any special subsidies or exemptions from the financers and the government?
--------------------------------------------------------------------------------------------------------------------------------------------------------------------------------------------------------------------------------------------------------------------------------------------------------------------------------------------------------------------------------------------------------------------------------------------------------------------------------------------------------------------------------------------------------------------------------------------------------------------------------------------------------------------------------------------------------------------------------------------------------------------------------------------------------------------------------------------------------------------------------------------------------------------------------------------------------------------------------------------------------------------
Project and Partnerships up to 10 minutes
23. Are you aware of the “Lighting Africa” program sponsored by the IFC and the World Bank? If yes, is your company somewhat involved in this initiative? Please elaborate.
--------------------------------------------------------------------------------------------------------------------------------------------------------------------------------------------------------------------------------------------------------------------------------------------------------------------------------------------------------------------------------------------------------------------------------------------------------------------------------------------------------------------------------------------------------------------------------------------------------------------------------------------------------------------------------------------------------------------------------------------------------------------------------------------------------------------------------------------------------------------------------------------------------------------------------------------------------------------------------------------------------------------
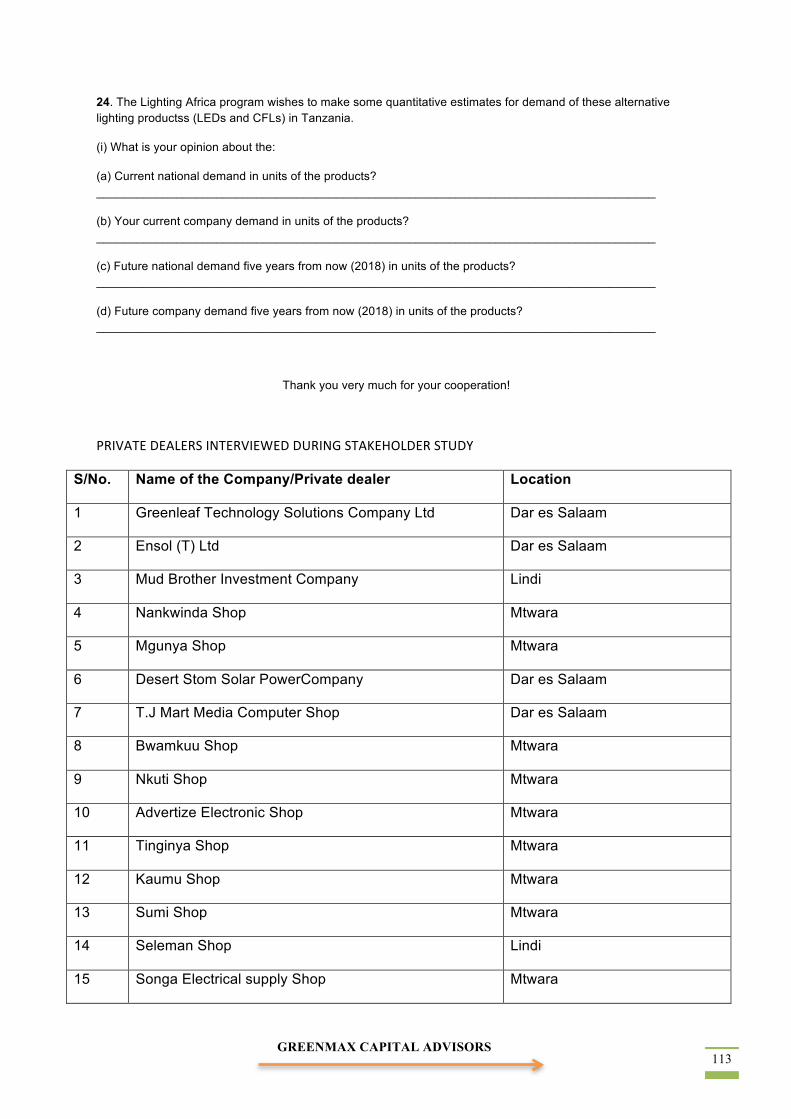
GREENMAX CAPITAL ADVISORS
113
24. The Lighting Africa program wishes to make some quantitative estimates for demand of these alternative lighting productss (LEDs and CFLs) in Tanzania.
(i) What is your opinion about the:
(a) Current national demand in units of the products? ____________________________________________________________________________________
(b) Your current company demand in units of the products? ____________________________________________________________________________________
(c) Future national demand five years from now (2018) in units of the products? ____________________________________________________________________________________
(d) Future company demand five years from now (2018) in units of the products? ____________________________________________________________________________________
Thank you very much for your cooperation!
PRIVATE DEALERS INTERVIEWED DURING STAKEHOLDER STUDY
S/No. Name of the Company/Private dealer Location
1 Greenleaf Technology Solutions Company Ltd Dar es Salaam
2 Ensol (T) Ltd Dar es Salaam
3 Mud Brother Investment Company Lindi
4 Nankwinda Shop Mtwara
5 Mgunya Shop Mtwara
6 Desert Stom Solar PowerCompany Dar es Salaam
7 T.J Mart Media Computer Shop Dar es Salaam
8 Bwamkuu Shop Mtwara
9 Nkuti Shop Mtwara
10 Advertize Electronic Shop Mtwara
11 Tinginya Shop Mtwara
12 Kaumu Shop Mtwara
13 Sumi Shop Mtwara
14 Seleman Shop Lindi
15 Songa Electrical supply Shop Mtwara
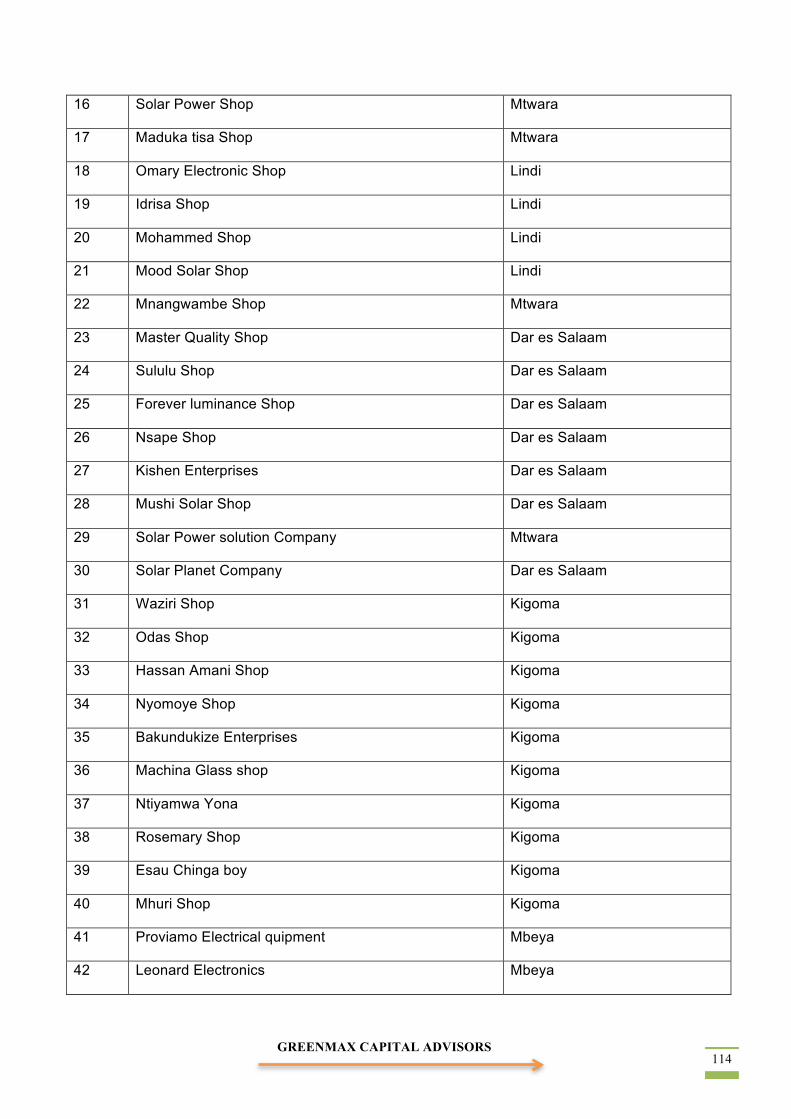
GREENMAX CAPITAL ADVISORS 114
16 Solar Power Shop Mtwara
17 Maduka tisa Shop Mtwara
18 Omary Electronic Shop Lindi
19 Idrisa Shop Lindi
20 Mohammed Shop Lindi
21 Mood Solar Shop Lindi
22 Mnangwambe Shop Mtwara
23 Master Quality Shop Dar es Salaam
24 Sululu Shop Dar es Salaam
25 Forever luminance Shop Dar es Salaam
26 Nsape Shop Dar es Salaam
27 Kishen Enterprises Dar es Salaam
28 Mushi Solar Shop Dar es Salaam
29 Solar Power solution Company Mtwara
30 Solar Planet Company Dar es Salaam
31 Waziri Shop Kigoma
32 Odas Shop Kigoma
33 Hassan Amani Shop Kigoma
34 Nyomoye Shop Kigoma
35 Bakundukize Enterprises Kigoma
36 Machina Glass shop Kigoma
37 Ntiyamwa Yona Kigoma
38 Rosemary Shop Kigoma
39 Esau Chinga boy Kigoma
40 Mhuri Shop Kigoma
41 Proviamo Electrical quipment Mbeya
42 Leonard Electronics Mbeya
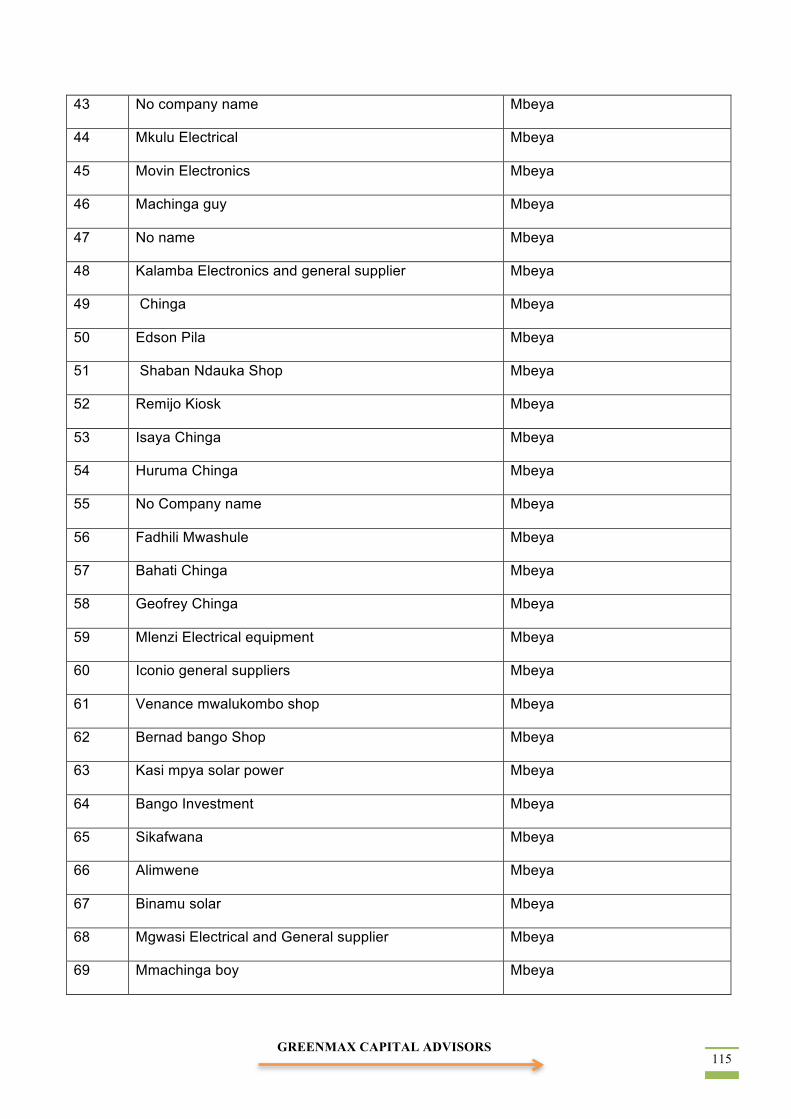
GREENMAX CAPITAL ADVISORS
115
43 No company name Mbeya
44 Mkulu Electrical Mbeya
45 Movin Electronics Mbeya
46 Machinga guy Mbeya
47 No name Mbeya
48 Kalamba Electronics and general supplier Mbeya
49 Chinga Mbeya
50 Edson Pila Mbeya
51 Shaban Ndauka Shop Mbeya
52 Remijo Kiosk Mbeya
53 Isaya Chinga Mbeya
54 Huruma Chinga Mbeya
55 No Company name Mbeya
56 Fadhili Mwashule Mbeya
57 Bahati Chinga Mbeya
58 Geofrey Chinga Mbeya
59 Mlenzi Electrical equipment Mbeya
60 Iconio general suppliers Mbeya
61 Venance mwalukombo shop Mbeya
62 Bernad bango Shop Mbeya
63 Kasi mpya solar power Mbeya
64 Bango Investment Mbeya
65 Sikafwana Mbeya
66 Alimwene Mbeya
67 Binamu solar Mbeya
68 Mgwasi Electrical and General supplier Mbeya
69 Mmachinga boy Mbeya
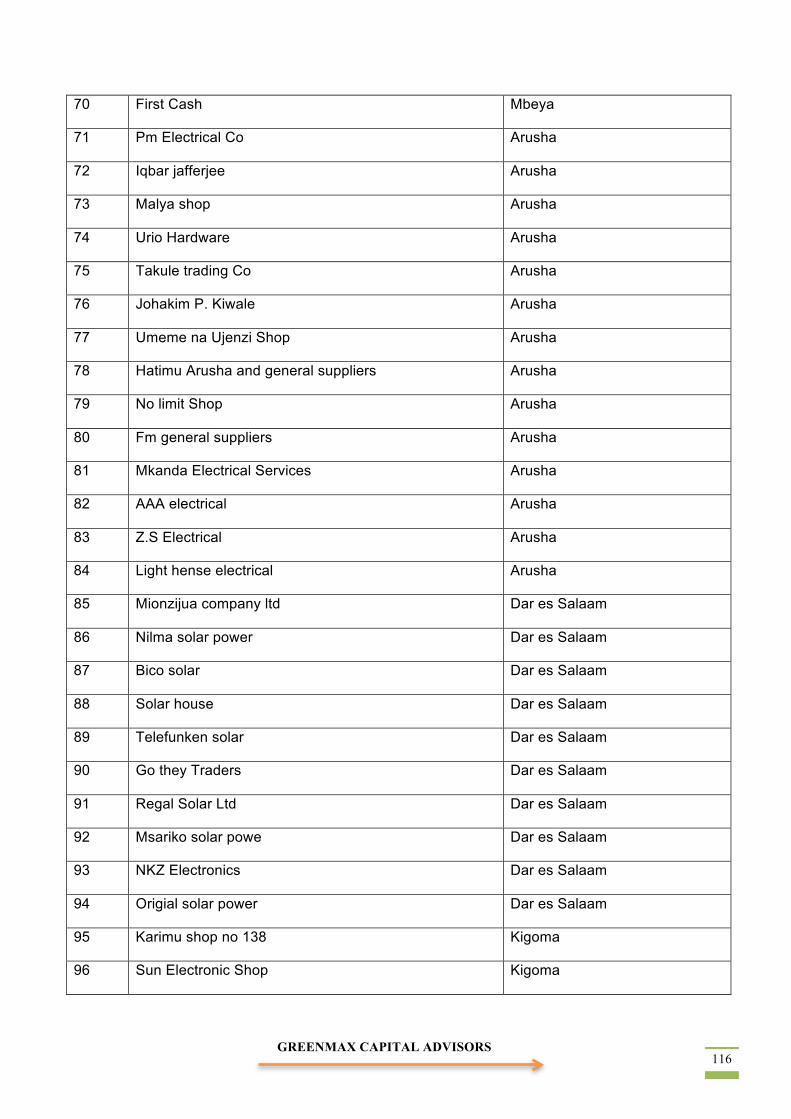
GREENMAX CAPITAL ADVISORS 116
70 First Cash Mbeya
71 Pm Electrical Co Arusha
72 Iqbar jafferjee Arusha
73 Malya shop Arusha
74 Urio Hardware Arusha
75 Takule trading Co Arusha
76 Johakim P. Kiwale Arusha
77 Umeme na Ujenzi Shop Arusha
78 Hatimu Arusha and general suppliers Arusha
79 No limit Shop Arusha
80 Fm general suppliers Arusha
81 Mkanda Electrical Services Arusha
82 AAA electrical Arusha
83 Z.S Electrical Arusha
84 Light hense electrical Arusha
85 Mionzijua company ltd Dar es Salaam
86 Nilma solar power Dar es Salaam
87 Bico solar Dar es Salaam
88 Solar house Dar es Salaam
89 Telefunken solar Dar es Salaam
90 Go they Traders Dar es Salaam
91 Regal Solar Ltd Dar es Salaam
92 Msariko solar powe Dar es Salaam
93 NKZ Electronics Dar es Salaam
94 Origial solar power Dar es Salaam
95 Karimu shop no 138 Kigoma
96 Sun Electronic Shop Kigoma
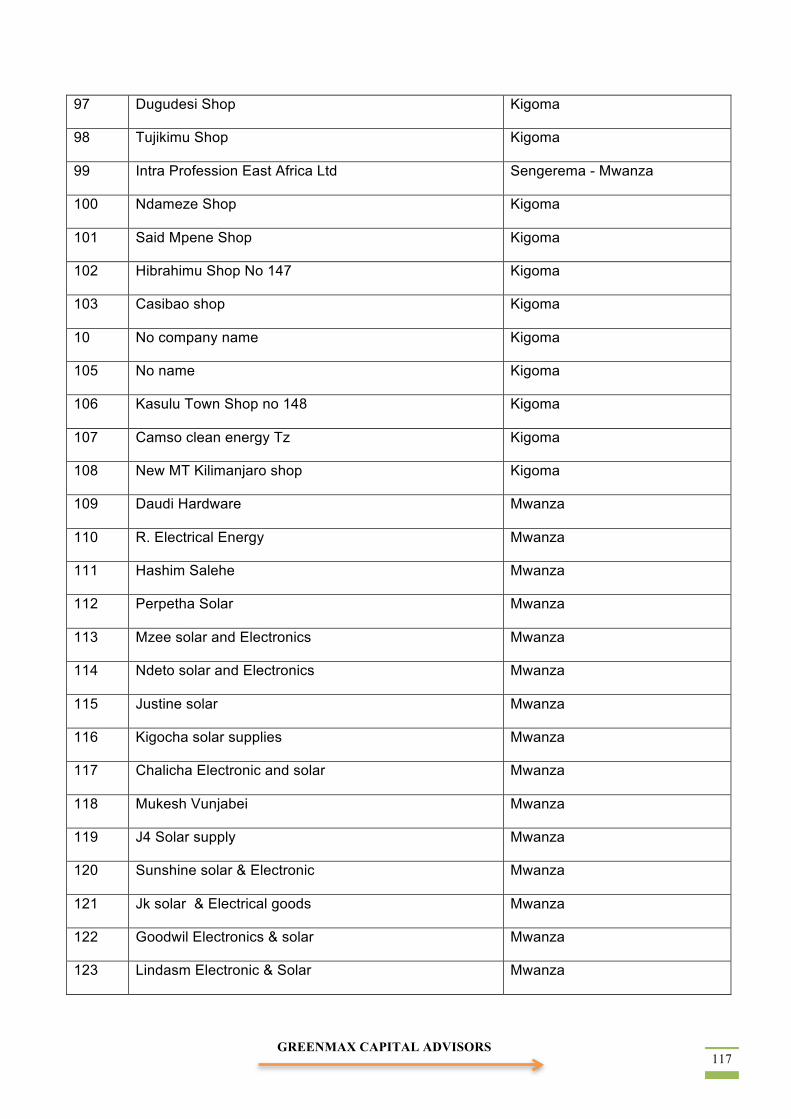
GREENMAX CAPITAL ADVISORS
117
97 Dugudesi Shop Kigoma
98 Tujikimu Shop Kigoma
99 Intra Profession East Africa Ltd Sengerema - Mwanza
100 Ndameze Shop Kigoma
101 Said Mpene Shop Kigoma
102 Hibrahimu Shop No 147 Kigoma
103 Casibao shop Kigoma
10 No company name Kigoma
105 No name Kigoma
106 Kasulu Town Shop no 148 Kigoma
107 Camso clean energy Tz Kigoma
108 New MT Kilimanjaro shop Kigoma
109 Daudi Hardware Mwanza
110 R. Electrical Energy Mwanza
111 Hashim Salehe Mwanza
112 Perpetha Solar Mwanza
113 Mzee solar and Electronics Mwanza
114 Ndeto solar and Electronics Mwanza
115 Justine solar Mwanza
116 Kigocha solar supplies Mwanza
117 Chalicha Electronic and solar Mwanza
118 Mukesh Vunjabei Mwanza
119 J4 Solar supply Mwanza
120 Sunshine solar & Electronic Mwanza
121 Jk solar & Electrical goods Mwanza
122 Goodwil Electronics & solar Mwanza
123 Lindasm Electronic & Solar Mwanza

GREENMAX CAPITAL ADVISORS 118
124 Sundar Solar and Electronics Mwanza
125 Kings brothers Mwanza
126 Marijorie General Trading Mwanza
127 Desai Geneeral Trading Mwanza
128 RFZ General supplier Mwanza
129 Salma solar Mwanza
130 Haji Mohamed Haji Mwanza
131 Kodtec Electronics Mwanza
132 One twenty solar Mwanza
133 Ramla Musa Mwanza
134 Mafole hardware and Electrical Mwanza
135 Dilip general Enterprises Mwanza
136 Nkwabi Electrical supply Mwanza
137 Zara solar Ltd Mwanza
138 Solar planet Mwanza
139 Highhedge solar(T) Ltd Arusha
140 Kakute Projects company ltd( LRTC 2012 Winner) Arusha
141 Bjarne Laustsen (LRTC 2010 Winner) Arusha
142 Swift Holdings Arusha
143 ABB Tanelec Arusha
144 Sunny money Ltd Dar es Salaam
145 L'S Solution Ltd Arusha
146 Helvetic solar contractors Arusha
147 Tadero Dar es Salaam
148 Kiwia&Laustsen ltd Dar es Salaam
149 Masotricity Engineering Co.ltd Dar es Salaam
150 TACREEP Dar es Salaam

GREENMAX CAPITAL ADVISORS
119
151 Rex energy Dar es Salaam
152 Space Engineering Dar es Salaam
153 Baraka Solar specialists Dar es Salaam
154 Voltzon ltd Dar es Salaam
155 Hamenya shop Kasulu-Kigoma
156 SAID JB Shop Kasulu-Kigoma
157 Tuamke shop Kasulu-Kigoma
158 ARTI Energy Limited Dar es Salaam
160 Davis & Shirtliff (T) Ltd Dar es Salaam
161 RESCO (T) Ltd Dar es Salaam
162 Aglex Company Ltd Dar es Salaam
163 Mona Mwanza Electrical & Electronics Mwanza
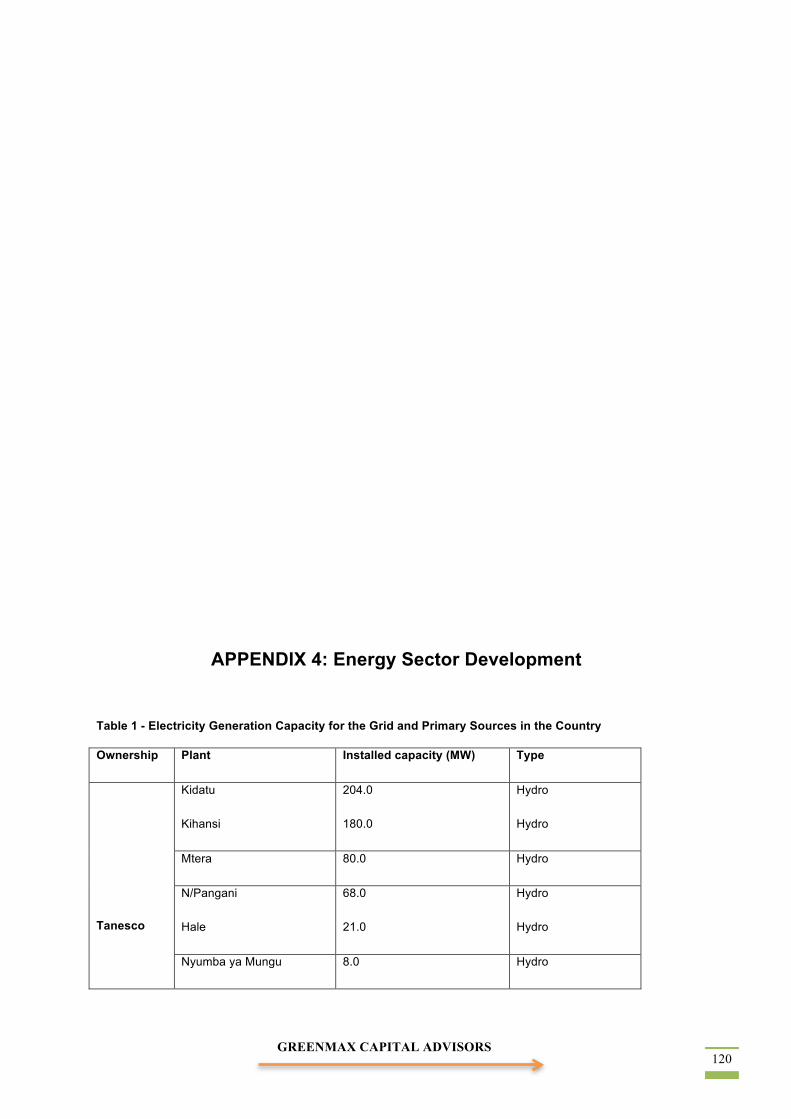
GREENMAX CAPITAL ADVISORS 120
APPENDIX 4: Energy Sector Development
Table 1 - Electricity Generation Capacity for the Grid and Primary Sources in the Country
Ownership Plant Installed capacity (MW) Type
Tanesco
Kidatu
Kihansi
204.0
180.0
Hydro
Hydro
Mtera 80.0 Hydro
N/Pangani
Hale
68.0
21.0
Hydro
Hydro
Nyumba ya Mungu 8.0 Hydro
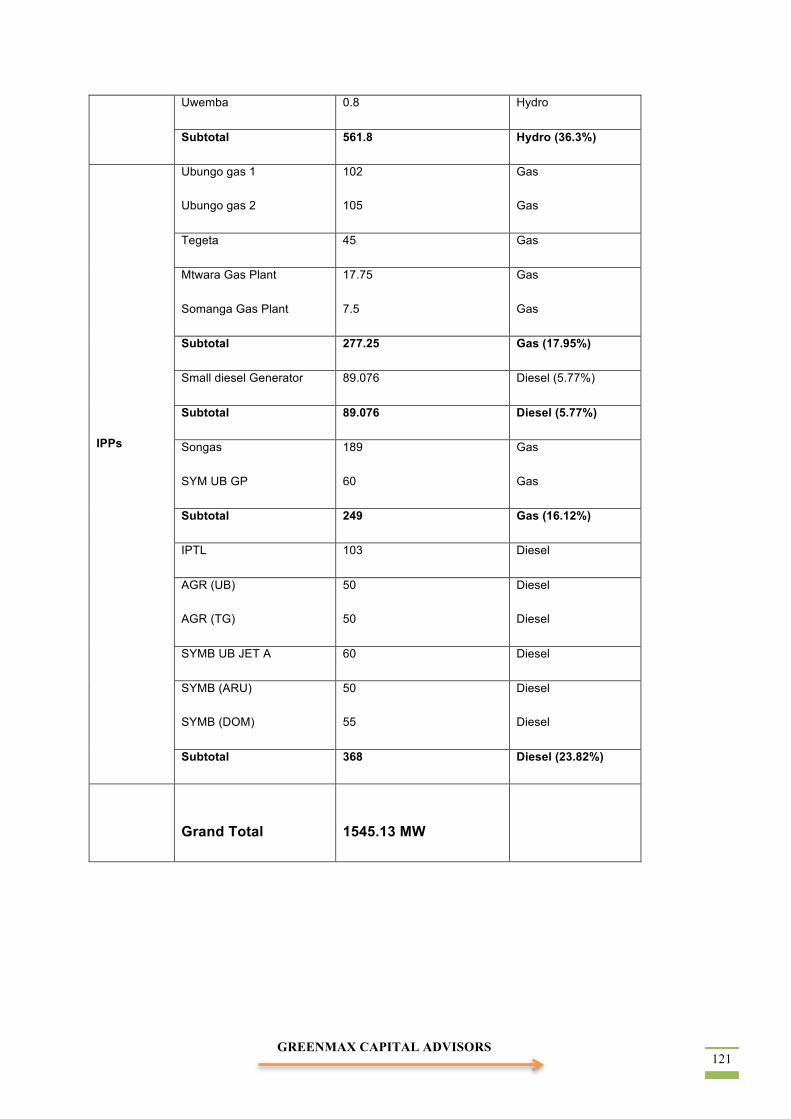
GREENMAX CAPITAL ADVISORS
121
Uwemba 0.8 Hydro
Subtotal 561.8 Hydro (36.3%)
IPPs
Ubungo gas 1
Ubungo gas 2
102
105
Gas
Gas
Tegeta 45 Gas
Mtwara Gas Plant
Somanga Gas Plant
17.75
7.5
Gas
Gas
Subtotal 277.25 Gas (17.95%)
Small diesel Generator 89.076 Diesel (5.77%)
Subtotal 89.076 Diesel (5.77%)
Songas
SYM UB GP
189
60
Gas
Gas
Subtotal 249 Gas (16.12%)
IPTL 103 Diesel
AGR (UB)
AGR (TG)
50
50
Diesel
Diesel
SYMB UB JET A 60 Diesel
SYMB (ARU)
SYMB (DOM)
50
55
Diesel
Diesel
Subtotal 368 Diesel (23.82%)
Grand Total
1545.13 MW
GREENMAX CAPITAL ADVISORS 122
Recent Development in the Power Sector
The following are some of the main developments that have been implemented or under implementation on the power systems:
a) Grid reinforcement and extension of the grid to mines in the northwest (Buzwagi and North Mara),
b) Formulation of emergent power plan to address severe draught, whereby the government had to acquire rental power plants of 205MW (Aggreko 100 MW and Symbion 55MW in Dodoma and 50MW in Arusha) capacity.
c) Installation of a permanent 100MW gas power plant at Ubungo in 2012.
d) Extension of the gas pipeline to fuel a 45MW gas plant at Tegeta, Dar es Salaam in 2009.
e) Implementation of rural electrification program – under the Tanzania Energy Development Access Project (TEDAP).
f) Several Small Power Producers (SPPs) agreements – such as TPC, Mwenga and TANWATT were implemented.
g) Initiative to construct a Backborne Transmission Investment Project (BTIP – 400kV) as part of a plan to reinforce the grid system from Iringa to Shinyanga is underway.
h) Construction of a Gas pipeline from Mtwara to Dar es Salaam, and implementation of the Wayleave Village Electrification Scheme (WVES)
Other developments in the power sector include:
a) Upgrading and rehabilitation of the distribution networks in Tanga, Iringa, Mbeya, Morogoro, Mwanza and Dodoma, and development of the second submarine cable from Dar es Salaam to Zanzibar 132-‐kV.
b) The laying of a 33 kV submarine cable from Tanga to Pemba.
c) Natural gas discoveries: Songo Songo, Mnazi Bay, Mkuranga, Kiliwani, Ntorya and eight discoveries in the Deep Sea (Chaza, Jodari, Zafarani, Pweza, Mzia, Chewa, Papa 1 and Lavani).
d) Development of coal production at in the Ngaka area. Reinforcement of the northeast grid from Dar es Salaam to Arusha via Chalinze Tanga and Same (400kV transmission line) project.
e) Extension of the grid system to the northwest regions of Kigoma, Rukwa and Kagera (220kV line).
f) Development of two wind farms of 50MW each.100MW wind farms in Singida.
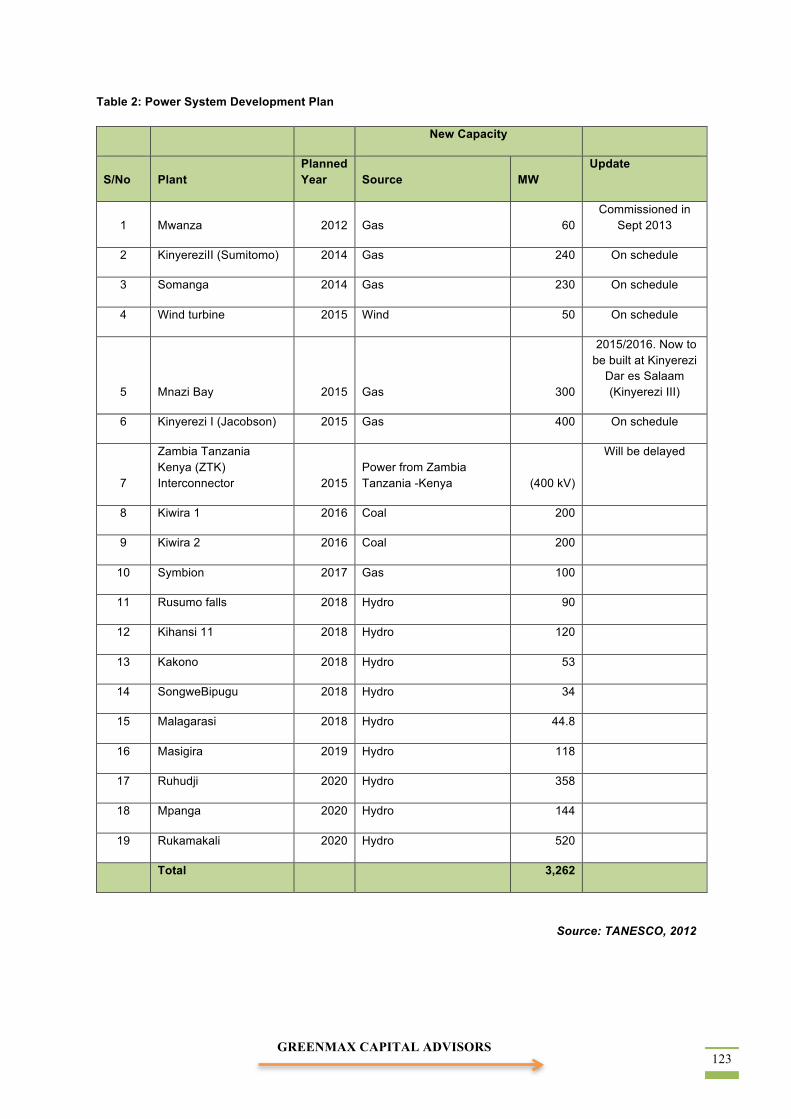
GREENMAX CAPITAL ADVISORS
123
Table 2: Power System Development Plan
New Capacity
S/No Plant Planned Year Source MW
Update
1 Mwanza 2012 Gas 60 Commissioned in
Sept 2013
2 KinyereziII (Sumitomo) 2014 Gas 240 On schedule
3 Somanga 2014 Gas 230 On schedule
4 Wind turbine 2015 Wind 50 On schedule
5 Mnazi Bay 2015 Gas 300
2015/2016. Now to be built at Kinyerezi
Dar es Salaam (Kinyerezi III)
6 Kinyerezi I (Jacobson) 2015 Gas 400 On schedule
7
Zambia Tanzania Kenya (ZTK) Interconnector 2015
Power from Zambia Tanzania -Kenya (400 kV)
Will be delayed
8 Kiwira 1 2016 Coal 200
9 Kiwira 2 2016 Coal 200
10 Symbion 2017 Gas 100
11 Rusumo falls 2018 Hydro 90
12 Kihansi 11 2018 Hydro 120
13 Kakono 2018 Hydro 53
14 SongweBipugu 2018 Hydro 34
15 Malagarasi 2018 Hydro 44.8
16 Masigira 2019 Hydro 118
17 Ruhudji 2020 Hydro 358
18 Mpanga 2020 Hydro 144
19 Rukamakali 2020 Hydro 520
Total 3,262
Source: TANESCO, 2012
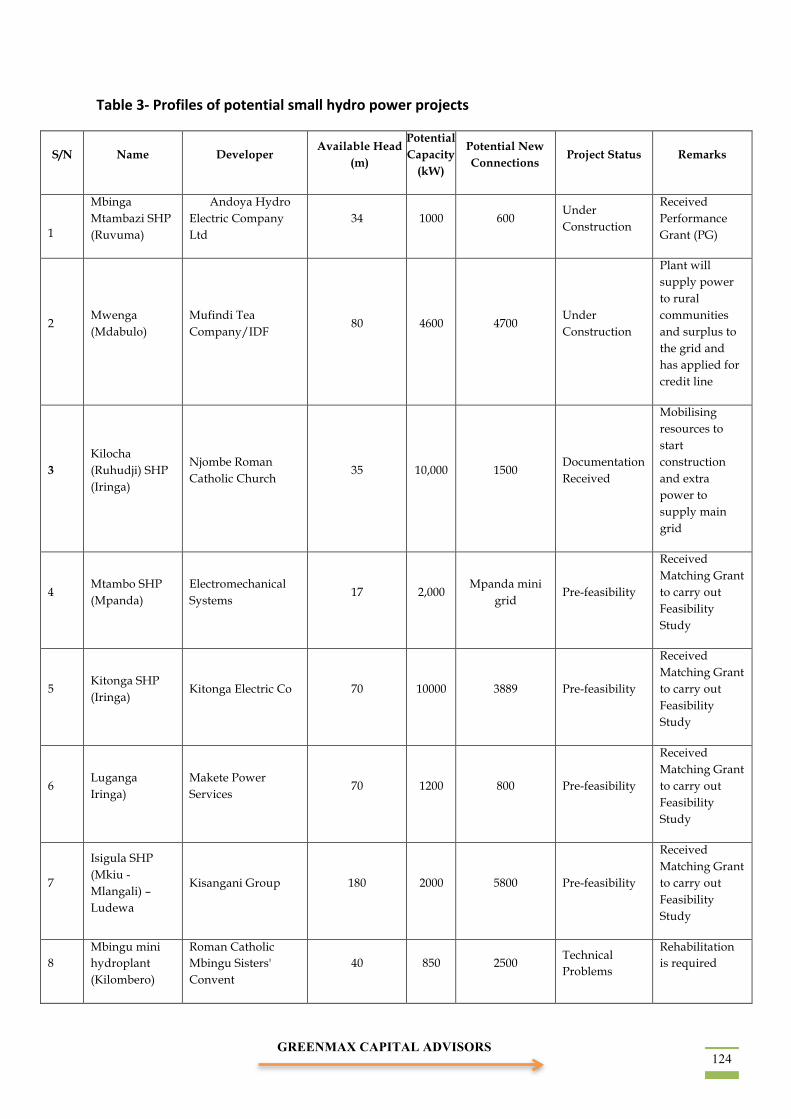
GREENMAX CAPITAL ADVISORS 124
Table 3-‐ Profiles of potential small hydro power projects
S/N Name Developer Available Head
(m)
Potential Capacity
(kW)
Potential New Connections
Project Status Remarks
1
Mbinga Mtambazi SHP (Ruvuma)
Andoya Hydro Electric Company Ltd
34 1000 600 Under Construction
Received Performance Grant (PG)
2 Mwenga (Mdabulo)
Mufindi Tea Company/IDF
80 4600 4700 Under Construction
Plant will supply power to rural communities and surplus to the grid and has applied for credit line
3 Kilocha (Ruhudji) SHP (Iringa)
Njombe Roman Catholic Church
35 10,000 1500 Documentation Received
Mobilising resources to start construction and extra power to supply main grid
4 Mtambo SHP (Mpanda)
Electromechanical Systems
17 2,000 Mpanda mini
grid Pre-feasibility
Received Matching Grant to carry out Feasibility Study
5 Kitonga SHP (Iringa)
Kitonga Electric Co 70 10000 3889 Pre-feasibility
Received Matching Grant to carry out Feasibility Study
6 Luganga Iringa)
Makete Power Services
70 1200 800 Pre-feasibility
Received Matching Grant to carry out Feasibility Study
7
Isigula SHP (Mkiu - Mlangali) – Ludewa
Kisangani Group 180 2000 5800 Pre-feasibility
Received Matching Grant to carry out Feasibility Study
8 Mbingu mini hydroplant (Kilombero)
Roman Catholic Mbingu Sisters' Convent
40 850 2500 Technical Problems
Rehabilitation is required

GREENMAX CAPITAL ADVISORS
125
S/N Name Developer Available Head
(m)
Potential Capacity
(kW)
Potential New Connections
Project Status Remarks
9 Kindimba SHP (Mbinga)
Mbinga Community (CBO)
40 40 400 Completed
Operating, needs to expand distribution network
10 Lupali SHP-MG (Njombe)
Benedictine Sisters - Imiliwaha
25 640 5800 Detail design stage
Received Matching Grant to carry out EIA
11 Nkwiro Shp (Sumbawanga)
Ulaya Hydro & Windmill Technology
200 1165 1900 Pre-feasibility
Received Matching Grant to carry out Feasibility Study
12 Ijangala Shp (Makete)
Tandala Diaconical Centre
40 200 400 Detail design stage
Received Matching Grant to carry out Feasibility Study
13 Yovi Shp (Kilosa)
Msolwa Stigmate Fathers & Brothers
300 950 25000 Detail design Completed
Construction to start soon
14
Ilundo hydropower project (Rungwe)
Ilundo Community 30 200 85 Feasibility level
Mobilising resources to start construction
15 Tulila small hydropower (Songea Rural)
Benedictine Sisters - Chipole
35 6500 Songea Mini
Grid Pre-feasibility
Received Matching Grant to carry out Feasibility Study
16 Kiwira - Malasusa falls(Rungwe)
Mkonge Energy Systems
20 8000 Main Grid Feasibility level Received Matching Grant to Study EIA
17 Kikuletwa II (Hai)
Community Development Cooperation
40 8000 Main Grid Feasibility level
Received Matching Grant to Update the study
18
Simike Small Hydropower Project (Rungwe)
RETDCO 70 300 3400 Pre-feasibility
Received Matching Grant to carry out Feasibility Study
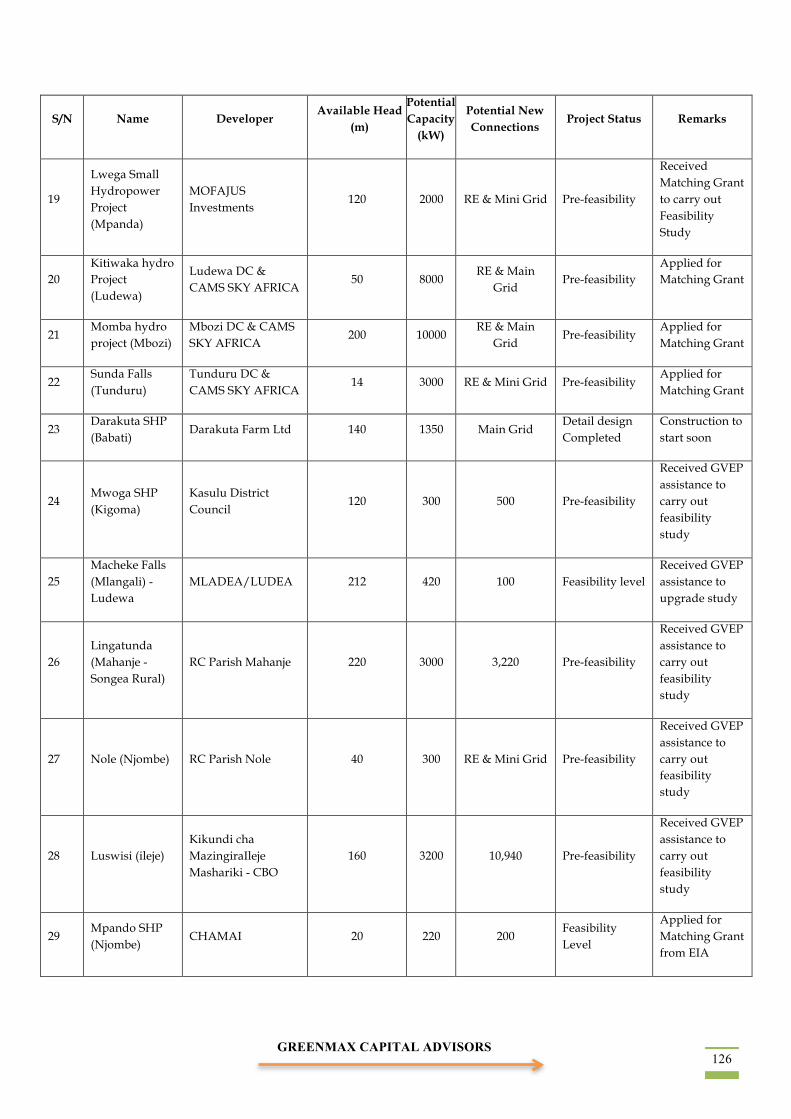
GREENMAX CAPITAL ADVISORS 126
S/N Name Developer Available Head
(m)
Potential Capacity
(kW)
Potential New Connections
Project Status Remarks
19
Lwega Small Hydropower Project (Mpanda)
MOFAJUS Investments
120 2000 RE & Mini Grid Pre-feasibility
Received Matching Grant to carry out Feasibility Study
20 Kitiwaka hydro Project (Ludewa)
Ludewa DC & CAMS SKY AFRICA
50 8000 RE & Main
Grid Pre-feasibility
Applied for Matching Grant
21 Momba hydro project (Mbozi)
Mbozi DC & CAMS SKY AFRICA
200 10000 RE & Main
Grid Pre-feasibility
Applied for Matching Grant
22 Sunda Falls (Tunduru)
Tunduru DC & CAMS SKY AFRICA
14 3000 RE & Mini Grid Pre-feasibility Applied for Matching Grant
23 Darakuta SHP (Babati)
Darakuta Farm Ltd 140 1350 Main Grid Detail design Completed
Construction to start soon
24 Mwoga SHP (Kigoma)
Kasulu District Council
120 300 500 Pre-feasibility
Received GVEP assistance to carry out feasibility study
25 Macheke Falls (Mlangali) - Ludewa
MLADEA/LUDEA 212 420 100 Feasibility level Received GVEP assistance to upgrade study
26 Lingatunda (Mahanje - Songea Rural)
RC Parish Mahanje 220 3000 3,220 Pre-feasibility
Received GVEP assistance to carry out feasibility study
27 Nole (Njombe) RC Parish Nole 40 300 RE & Mini Grid Pre-feasibility
Received GVEP assistance to carry out feasibility study
28 Luswisi (ileje) Kikundi cha MazingiraIleje Mashariki - CBO
160 3200 10,940 Pre-feasibility
Received GVEP assistance to carry out feasibility study
29 Mpando SHP (Njombe)
CHAMAI 20 220 200 Feasibility Level
Applied for Matching Grant from EIA
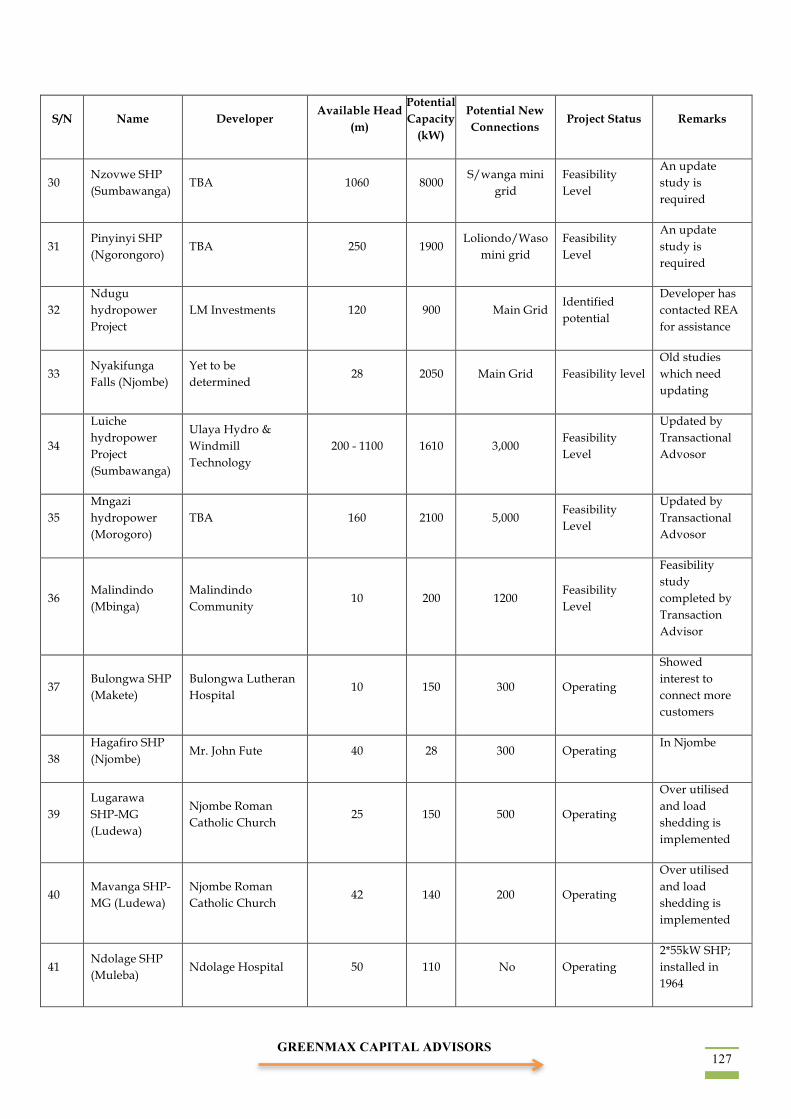
GREENMAX CAPITAL ADVISORS
127
S/N Name Developer Available Head
(m)
Potential Capacity
(kW)
Potential New Connections
Project Status Remarks
30 Nzovwe SHP (Sumbawanga)
TBA 1060 8000 S/wanga mini
grid Feasibility Level
An update study is required
31 Pinyinyi SHP (Ngorongoro)
TBA 250 1900 Loliondo/Waso
mini grid Feasibility Level
An update study is required
32 Ndugu hydropower Project
LM Investments 120 900 Main Grid Identified potential
Developer has contacted REA for assistance
33 Nyakifunga Falls (Njombe)
Yet to be determined
28 2050 Main Grid Feasibility level Old studies which need updating
34
Luiche hydropower Project (Sumbawanga)
Ulaya Hydro & Windmill Technology
200 - 1100 1610 3,000 Feasibility Level
Updated by Transactional Advosor
35 Mngazi hydropower (Morogoro)
TBA 160 2100 5,000 Feasibility Level
Updated by Transactional Advosor
36 Malindindo (Mbinga)
Malindindo Community
10 200 1200 Feasibility Level
Feasibility study completed by Transaction Advisor
37 Bulongwa SHP (Makete)
Bulongwa Lutheran Hospital
10 150 300 Operating
Showed interest to connect more customers
38 Hagafiro SHP (Njombe)
Mr. John Fute 40 28 300 Operating In Njombe
39 Lugarawa SHP-MG (Ludewa)
Njombe Roman Catholic Church
25 150 500 Operating
Over utilised and load shedding is implemented
40 Mavanga SHP-MG (Ludewa)
Njombe Roman Catholic Church
42 140 200 Operating
Over utilised and load shedding is implemented
41 Ndolage SHP (Muleba)
Ndolage Hospital 50 110 No Operating 2*55kW SHP; installed in 1964
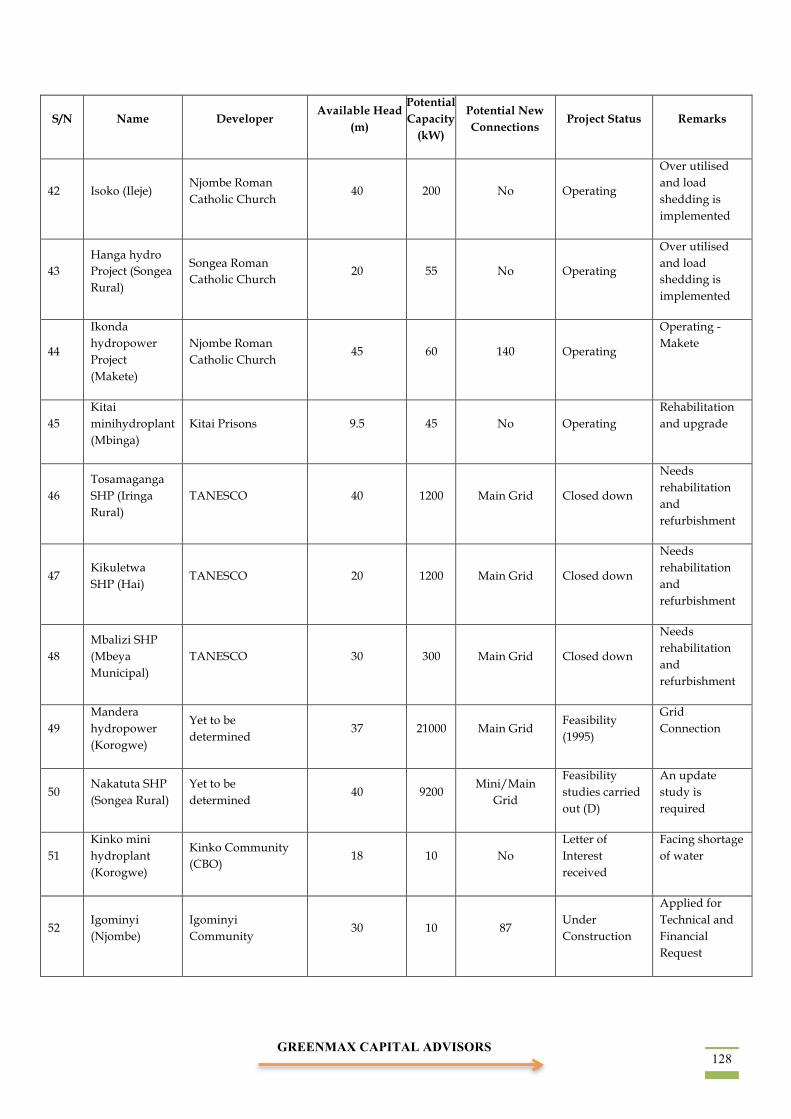
GREENMAX CAPITAL ADVISORS 128
S/N Name Developer Available Head
(m)
Potential Capacity
(kW)
Potential New Connections
Project Status Remarks
42 Isoko (Ileje) Njombe Roman Catholic Church
40 200 No Operating
Over utilised and load shedding is implemented
43 Hanga hydro Project (Songea Rural)
Songea Roman Catholic Church
20 55 No Operating
Over utilised and load shedding is implemented
44
Ikonda hydropower Project (Makete)
Njombe Roman Catholic Church
45 60 140 Operating
Operating - Makete
45 Kitai minihydroplant (Mbinga)
Kitai Prisons 9.5 45 No Operating Rehabilitation and upgrade
46 Tosamaganga SHP (Iringa Rural)
TANESCO 40 1200 Main Grid Closed down
Needs rehabilitation and refurbishment
47 Kikuletwa SHP (Hai)
TANESCO 20 1200 Main Grid Closed down
Needs rehabilitation and refurbishment
48 Mbalizi SHP (Mbeya Municipal)
TANESCO 30 300 Main Grid Closed down
Needs rehabilitation and refurbishment
49 Mandera hydropower (Korogwe)
Yet to be determined
37 21000 Main Grid Feasibility (1995)
Grid Connection
50 Nakatuta SHP (Songea Rural)
Yet to be determined
40 9200 Mini/Main
Grid
Feasibility studies carried out (D)
An update study is required
51 Kinko mini hydroplant (Korogwe)
Kinko Community (CBO)
18 10 No Letter of Interest received
Facing shortage of water
52 Igominyi (Njombe)
Igominyi Community
30 10 87 Under Construction
Applied for Technical and Financial Request

GREENMAX CAPITAL ADVISORS
129
S/N Name Developer Available Head
(m)
Potential Capacity
(kW)
Potential New Connections
Project Status Remarks
53 Wangama (Njombe)
Wangama Community
40 48 126 Under Construction
Applied for Technical and Financial Request
54 Limage (Njombe)
Limage Community 20 10 56 Under Construction
Applied for Technical and Financial Request
55 Magoda (Njombe)
Magoda Community
17 25 160 Under Construction
Applied for Technical and Financial Request
56 Kwitanda hydro Project (Tunduru)
Kwitanda Community
16 3,000 Tunduru mini
grid Identified
57
Uvinza hydropower Project (Kigoma) - Malagarasi
Yet to be determined
20 - 40 8,000
– 24,000
Kigoma mini grid
Feasibility level
EIA prevented further development
58 Mmanga minhydroplant (Morogoro)
Tawa Ward Community
10 50 3000 Pilot, newly identified
Pilot plant
59
Ilondo Hydropower Project (Mufindi)
Fox Company Limited
87 2,700 Main Grid Mobilising Resources
60 Saadani SHP (Mufindi)
Fox Company Limited
50 5,900 Main Grid Mobilising Resources
61 Nyalawa hydro project (Mufindi)
Yet to be determined
100 835 Main Grid Pre-feasibility
62 Mtombozi SHP (Morogoro)
Yet to be determined
57 380 Main Grid Pre-feasibility
63 Mugali River - Maruruma (Mufindi)
Masana Village 20 300 300 Reconnaissance level
64 Kingerikiti (Lumeme River - Mbinga) SHP
Andoya Hydro Electric Company Ltd
14 300 2500 Identified potential
Existing hydromill,32kw
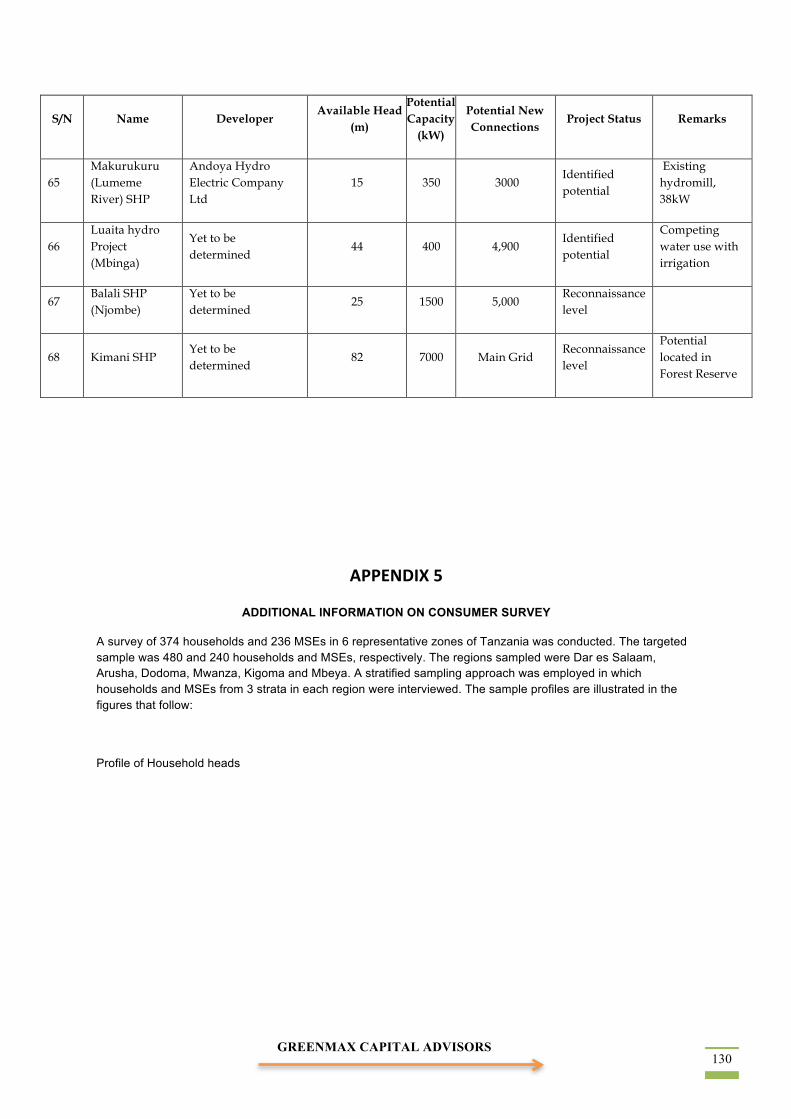
GREENMAX CAPITAL ADVISORS 130
S/N Name Developer Available Head
(m)
Potential Capacity
(kW)
Potential New Connections
Project Status Remarks
65 Makurukuru (Lumeme River) SHP
Andoya Hydro Electric Company Ltd
15 350 3000 Identified potential
Existing hydromill, 38kW
66 Luaita hydro Project (Mbinga)
Yet to be determined
44 400 4,900 Identified potential
Competing water use with irrigation
67 Balali SHP (Njombe)
Yet to be determined
25 1500 5,000 Reconnaissance level
68 Kimani SHP Yet to be determined
82 7000 Main Grid Reconnaissance level
Potential located in Forest Reserve
APPENDIX 5
ADDITIONAL INFORMATION ON CONSUMER SURVEY
A survey of 374 households and 236 MSEs in 6 representative zones of Tanzania was conducted. The targeted sample was 480 and 240 households and MSEs, respectively. The regions sampled were Dar es Salaam, Arusha, Dodoma, Mwanza, Kigoma and Mbeya. A stratified sampling approach was employed in which households and MSEs from 3 strata in each region were interviewed. The sample profiles are illustrated in the figures that follow:
Profile of Household heads
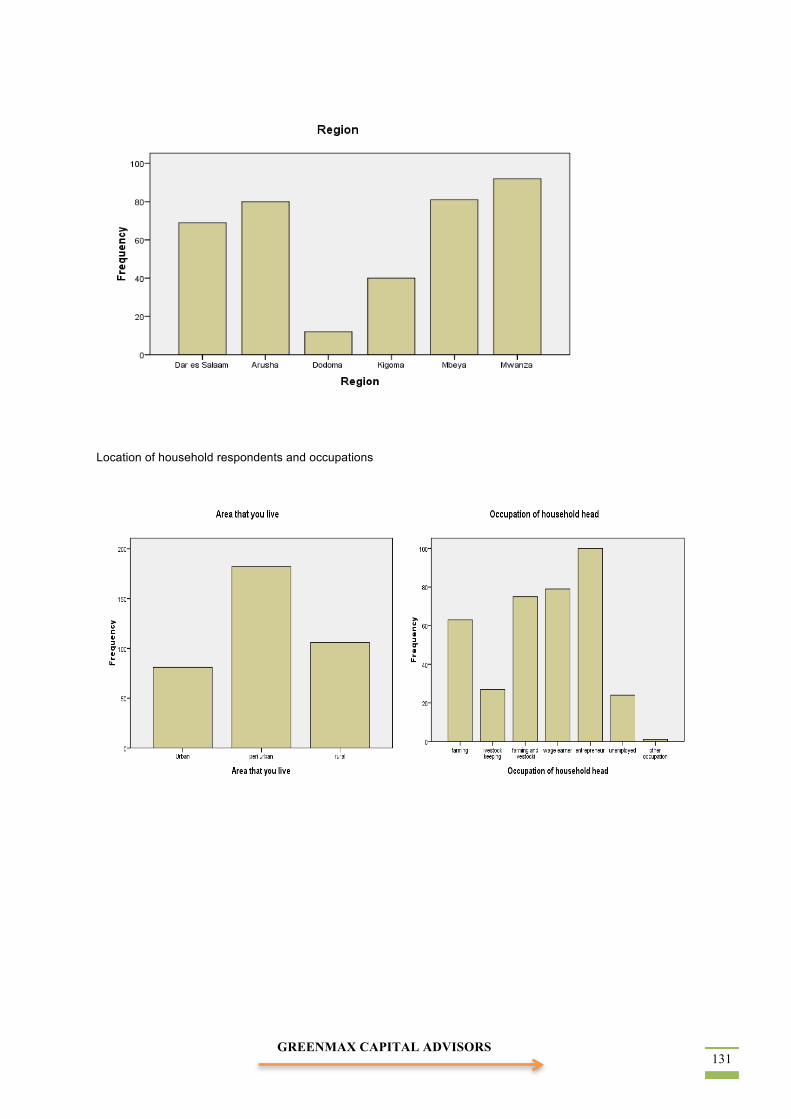
GREENMAX CAPITAL ADVISORS
131
Location of household respondents and occupations
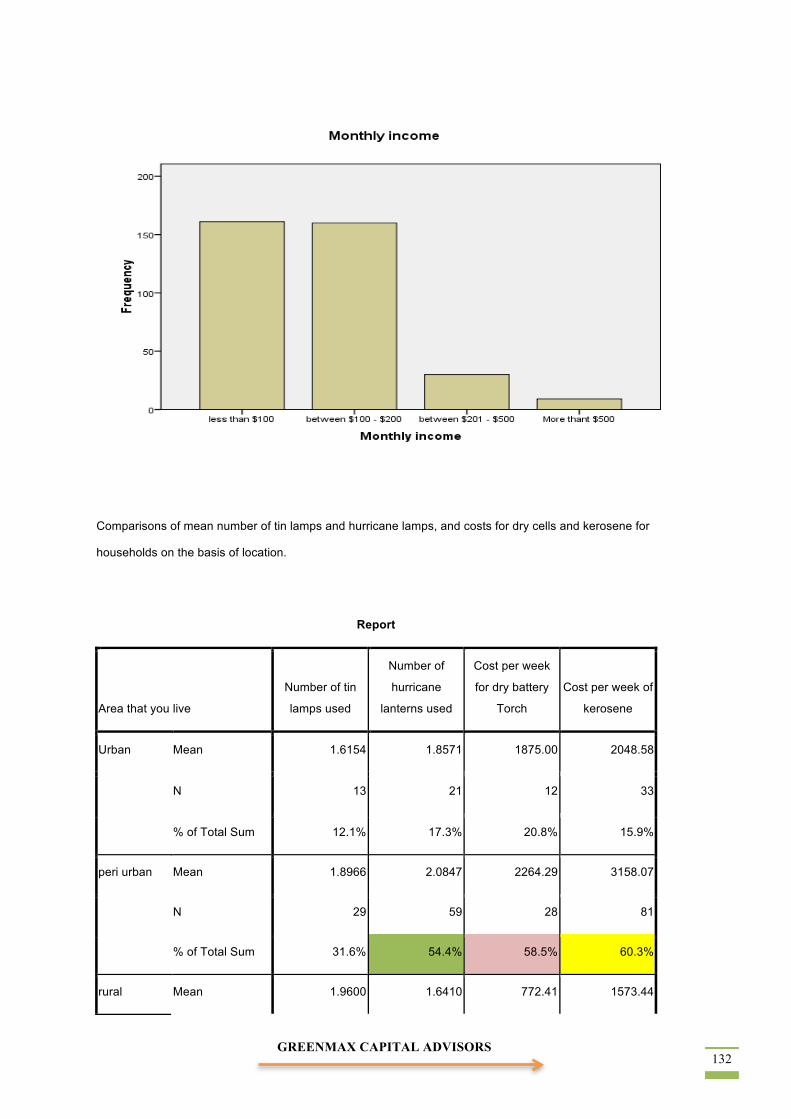
GREENMAX CAPITAL ADVISORS 132
Comparisons of mean number of tin lamps and hurricane lamps, and costs for dry cells and kerosene for
households on the basis of location.
Report
Area that you live
Number of tin
lamps used
Number of
hurricane
lanterns used
Cost per week
for dry battery
Torch
Cost per week of
kerosene
Urban Mean 1.6154 1.8571 1875.00 2048.58
N 13 21 12 33
% of Total Sum 12.1% 17.3% 20.8% 15.9%
peri urban Mean 1.8966 2.0847 2264.29 3158.07
N 29 59 28 81
% of Total Sum 31.6% 54.4% 58.5% 60.3%
rural Mean 1.9600 1.6410 772.41 1573.44
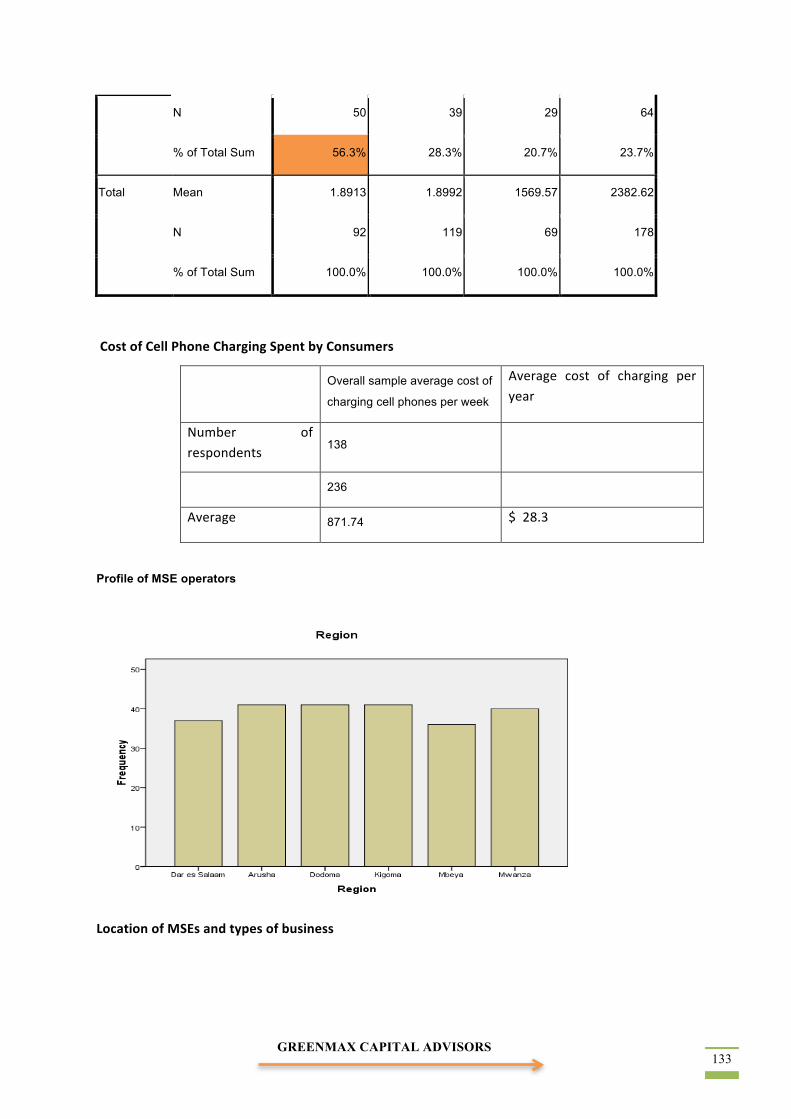
GREENMAX CAPITAL ADVISORS
133
N 50 39 29 64
% of Total Sum 56.3% 28.3% 20.7% 23.7%
Total Mean 1.8913 1.8992 1569.57 2382.62
N 92 119 69 178
% of Total Sum 100.0% 100.0% 100.0% 100.0%
Cost of Cell Phone Charging Spent by Consumers
Overall sample average cost of
charging cell phones per week
Average cost of charging per year
Number of respondents 138
236
Average 871.74 $ 28.3
Profile of MSE operators
Location of MSEs and types of business
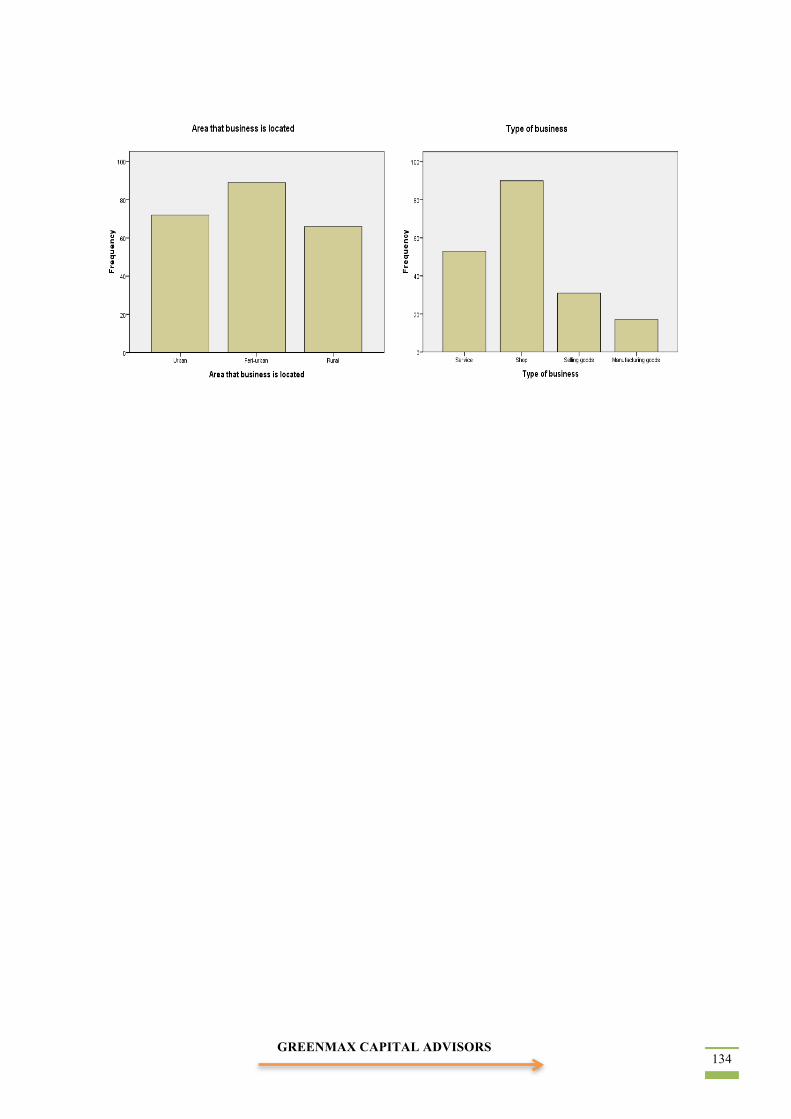
GREENMAX CAPITAL ADVISORS 134
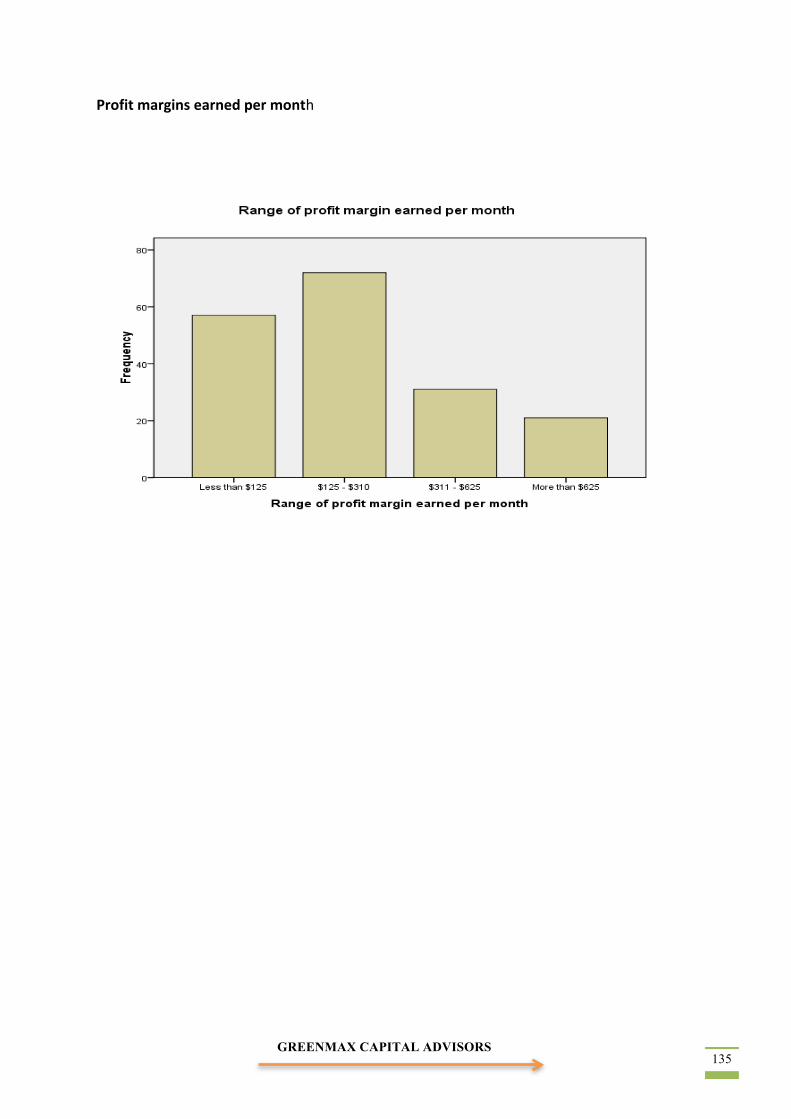
GREENMAX CAPITAL ADVISORS
135
Profit margins earned per month
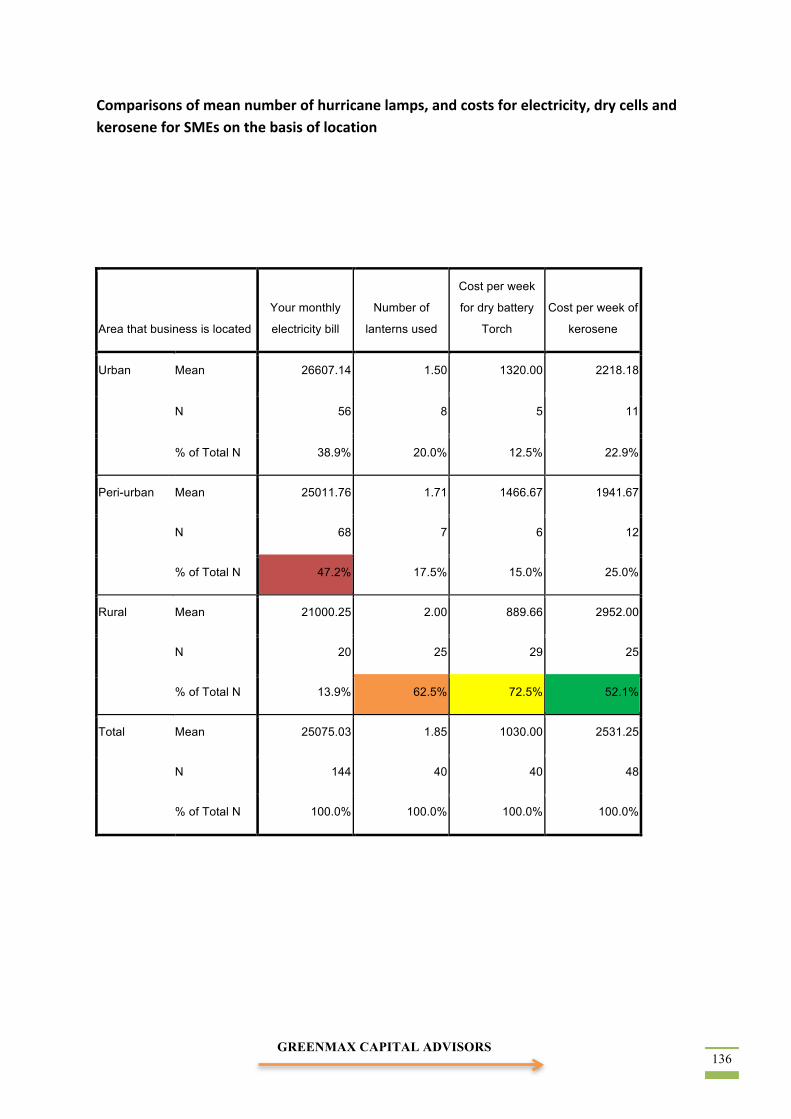
GREENMAX CAPITAL ADVISORS 136
Comparisons of mean number of hurricane lamps, and costs for electricity, dry cells and kerosene for SMEs on the basis of location
Area that business is located
Your monthly
electricity bill
Number of
lanterns used
Cost per week
for dry battery
Torch
Cost per week of
kerosene
Urban Mean 26607.14 1.50 1320.00 2218.18
N 56 8 5 11
% of Total N 38.9% 20.0% 12.5% 22.9%
Peri-urban Mean 25011.76 1.71 1466.67 1941.67
N 68 7 6 12
% of Total N 47.2% 17.5% 15.0% 25.0%
Rural Mean 21000.25 2.00 889.66 2952.00
N 20 25 29 25
% of Total N 13.9% 62.5% 72.5% 52.1%
Total Mean 25075.03 1.85 1030.00 2531.25
N 144 40 40 48
% of Total N 100.0% 100.0% 100.0% 100.0%

GREENMAX CAPITAL ADVISORS
137
APPENDIX 6
Bonded Warehouses Regulations
Licence for bonded warehouse.
An application for the licensing of any premises shall be accompanied by a plan of the premises and its situation in relation to other premises and thoroughfares. The following conditions shall also apply to an application for a licence under this regulation:
• the applicant shall have a rental contract whose duration is longer than the duration of the licence applied for or furnish proof of ownership of
the premises;
• the premises shall be equipped with at least one computer capable of connecting to the customs computer system, the physical location of
which shall be indicated in the licence application form for customs
verification purposes;
• the premises shall have a parking yard or storage area which shall be made of rigid pavement, tarmacked or made of concrete finishing;
• the premises shall have adequate parking space commensurate to the operations of the premises as the Commissioner may deem fit;
• the premises shall be well secured with a perimeter fence and lighting system; and • the premises shall be equipped with a fire fighting system.
The annual licence fee for a bonded warehouse shall be one thousand five hundred dollars. A person shall not make any alteration to a bonded warehouse without obtaining the permission of the Commissioner. A person who contravenes this regulation commits an offence and shall be liable to a fine not exceeding one thousand dollars.
Bonded warehouses shall be distinguished by numbers. The words "Customs Bonded Warehouse" and the number allocated to a customs bonded warehouse shall be clearly marked on the principal entrance to the customs bonded warehouse or in any other place the proper officer may approve and shall be removed when the customs bonded warehouse ceases to be licensed as such.
The words “Duty Free Shop” and the number allocated to a duty free shop shall be clearly marked on the principal entrance to the duty free shop or in any other place the proper officer may approve and shall be removed when the duty free shop ceases to be licensed as such. A person who contravenes this regulation commits an offence and is liable to a fine of five hundred dollars
Customs Warehouse
GREENMAX CAPITAL ADVISORS 138
Customs warehouse rent.
Rent shall be charged on goods deposited, or deemed to be deposited, in a Customs warehouse at a rate of 0.3 dollars per cubic metre per day. Rent shall not be charged on passenger baggage where the baggage is removed within seven working days from the date of deposit in a Customs warehouse. All rents and charges on goods deposited, or deemed to be deposited in a Customs warehouse shall be paid before the delivery of the goods.