Embed Size (px)
Citation preview

United Republic of Tanzania
Tanzania
National Bureau of Statistics
Ministry of Finance and Planning
Dar es Salaam
February 2017
National Panel Survey Wave 4, 2014 – 2015


United Republic of Tanzania
National Bureau of Statistics
Ministry of Finance and Planning
Dar es Salaam
February 2017
STATISTICS FORDEVELOPMENT

The Fourth Wave of the Tanzania National Panel Survey (NPS) was implemented by the National
Bureau of Statistics (NBS) in collaboration with Office of Chief Government Statistician (OCGS)
Zanzibar, from October 2014 to November 2015. The main financiers of the fourth wave of the
NPS included: Ministry of Finance and Planning, European Commission (EC) and the World Bank
/ Gates Foundation. Additional financial assistance was also received from the Tanzania Statistical
Master Plan (TSMP) Basket fund.
Additional information about the survey may be obtained from the National Bureau of Statistics
Director General, 18 Kivukoni Road, P.O. Box 796, 11992 Dar es Salaam, Tanzania (Telephone:
255-22-212-2724; Email: [email protected]) or National Bureau of Statistics General Office, P.O. Box
796, Dar es Salaam, Tanzania (Telephone: 255-22-212-2722/3; Fax: 255-22-213-0852; website:
www.nbs.go.tz).
Recommended citation: National Bureau of Statistics (NBS) [Tanzania]. 2016. Tanzania National
Panel Survey Report (NPS) - Wave 4, 2012 - 2013. Dar es Salaam, Tanzania: NBS.

National Panel Survey Wave 4 Report
i
Contents
Page
List of Tables .................................................................................................................................... iii
List of Figures .................................................................................................................................... v
Foreword ......................................................................................................................................... vii
CHAPTER 1 ....................................................................................................................................... 1
Introduction........................................................................................................................................ 1
1.0 Introduction ........................................................................................................................... 1
1.1 Objectives .............................................................................................................................. 1
1.2 Sample Design ....................................................................................................................... 2
1.3 Panel Sample Trim and Refresh ............................................................................................ 2
1.4 Revised Sample Design ......................................................................................................... 3
1.5 Fieldwork ............................................................................................................................... 4
1.6 Tracking and Attrition ........................................................................................................... 5
CHAPTER TWO ............................................................................................................................... 7
Social and Demographic Characteristics of Households ............................................................... 7
2.0 Introduction ......................................................................................................................... 7
2.1 Population Distribution by Age and Sex ............................................................................... 7
2.2 Characteristics of Households ............................................................................................... 9
2.3 Distribution of Households by Sex of Household Head ....................................................... 9
2.4 Household Size ...................................................................................................................... 9
2.5 Marital Status ....................................................................................................................... 10
2.6 Access to Piped or Protected Water Sources ....................................................................... 11
2.7 Access to Improved Source of Drinking Water .................................................................. 12
2.8 Access to Basic Sanitation Facilities ................................................................................... 13
2.9 Access to Improved Sanitation Facilities ............................................................................ 13
2.10 Access to Electricity ............................................................................................................ 14
2.11 Energy for Cooking Used by Households ........................................................................... 15
CHAPTER THREE ......................................................................................................................... 17
Education .......................................................................................................................................... 17
3.0 Introduction ....................................................................................................................... 17
3.1 Literacy among Population of Age 7 – 13 Years ................................................................ 17
3.2 Literacy among Population of Age 7 – 13 Years Currently Attending School ................... 19
3.3 Net Enrollment Rate at Pre-Primary School ....................................................................... 19
3.4 Primary School Net Enrollment Rate .................................................................................. 20
3.5 Secondary School Net Enrollment Rate .............................................................................. 21

National Panel Survey Wave 4 Report
ii
3.6 Gross Enrollment Rate in Higher Education ....................................................................... 22
3.7 Orphans in School ............................................................................................................... 23
CHAPTER FOUR ........................................................................................................................... 25
Health and Nutrition ....................................................................................................................... 25
4.0 Introduction ....................................................................................................................... 25
4.1 Births Attended by a Skilled Health Worker ....................................................................... 25
4.2 Registration of Births .......................................................................................................... 26
4.3 Satisfaction with Health Services ........................................................................................ 27
4.4 Major Reasons for Client Dissatisfaction Pertaining to Health Services Provision ............ 28
4.5 Health Spending .................................................................................................................. 29
4.6 Under-fives Moderately or Severely Stunted (Height for Age) .......................................... 29
4.7 Wasting ................................................................................................................................ 30
CHAPTER FIVE ............................................................................................................................. 33
Growth and Reduction of Poverty ................................................................................................. 33
5.0 Introduction ....................................................................................................................... 33
5.1 Inflation ............................................................................................................................... 33
5.2 Wealth Based on Real Consumption ................................................................................... 35
5.3 Inequality ............................................................................................................................. 39
5.4 Unemployment .................................................................................................................... 42
CHAPTER SIX ................................................................................................................................ 47
Agriculture ....................................................................................................................................... 47
6.0 Introduction ....................................................................................................................... 47
6.1 Households Involved in the Agricultural Sector ................................................................. 47
6.2 Changes in Production and Major Crop Yields over Time ................................................. 47
6.3 Households using Irrigation ................................................................................................ 49
CHAPTER SEVEN ......................................................................................................................... 55
Food Security ................................................................................................................................... 55
7.0 Introduction ....................................................................................................................... 55
7.1 Number of Meals ................................................................................................................. 58
7.2 Food Shortages .................................................................................................................... 60
7.3 Food Security and Poverty .................................................................................................. 63
APPENDICES .................................................................................................................................. 65
Appendix A: Methodology for Consumption Aggregates ................................................................. 65
Appendix B: Standard Errors and Confidence Intervals for Selected Indicators ................ 72
Appendix C: Additional Tables ......................................................................................... 103

National Panel Survey Wave 4 Report
iii
List of Tables
Table 1.1: Number of Clusters and Households in the Baseline NPS 2008/09 by Area .............. 4
Table 1.2: Number of Clusters and Households in New and Extended Samples of NPS
2014/15 by Area ........................................................................................................... 4
Table 1.3: Distribution of Households for the NPS 2008/09 Sample by Area and Quarter
of Interview .................................................................................................................. 5
Table 2.1: Percentage Distribution of Households by Sex of Head of Household,
Tanzania ....................................................................................................................... 9
Table 2.2: Percentage Distribution of Households by Area and Number of Usual
Residents .................................................................................................................... 10
Table 2.3: Percentage Distribution of Population by Marital Status, Tanzania .......................... 11
Table 2.4: Percentage Distribution of Households with Access to Clean Drinking Water
by Area and Season .................................................................................................... 11
Table 2.5: Proportion of Households with Access to Improved Source of Drinking Water
by Area and Season .................................................................................................... 12
Table 2.6: Percentage Distribution of Households with Basic Sanitation Facilities by Area ..... 13
Table 3.1: Literacy Rate of the Population of Age 7 – 13 Years Currently Attending
School by Area and Sex ............................................................................................. 19
Table 3.2: Net Enrolment Rate in Primary Education by Area and Sex ..................................... 21
Table 3.3: Net Enrolment in Secondary Education by Area and Sex ......................................... 22
Table 3.4: Gross Enrollment in Higher Education Institutions by Area and Sex ....................... 23
Table 4.1: Percentage of Births Registered among Those Born in the 24 Months Period
Prior to the Survey by Area ........................................................................................ 27
Table 4.2: Percentage of Population Expressing Satisfaction with Health Services by Area
and Sex ....................................................................................................................... 28
Table 4.3: Percentage of Population Spending on Health Services, Tanzania ........................... 29
Table 4.4: Percentage of Stunting (height for age) of Children Under 5 Years by Area and
Sex .............................................................................................................................. 30
Table 4.5: Percentage of Wasting (weight for height) of Children Under 5 Years by Area
and Sex ....................................................................................................................... 31
Table 5.1: Spatial and Temporal Food Prices ............................................................................. 35
Table 5.2: Gini Coefficient .......................................................................................................... 40
Table 5.3: Labour Force Participation Rate (percent) by Area, Sex and Age Group (age
>=15) .......................................................................................................................... 43
Table 5.4: Unemployment Rates (percent) by Area, Sex and Age Group (age>=15),
Tanzania ..................................................................................................................... 45

National Panel Survey Wave 4 Report
iv
Table 6.1: Average Yields of Maize (kg / area planted in hectares) by Type of Plot,
Tanzania ..................................................................................................................... 48
Table 6.2: Average Yields of Paddy (kilogram / area planted in hectares) by Type of Plot,
Tanzania ..................................................................................................................... 49
Table 6.3: Percentage of Households using Irrigation, Tanzania ............................................... 50
Table 6.4: Percentage of Households using Irrigation by Method, Tanzania ............................. 50
Table 6.5: Percentage of Households using Various Sources of Water for Irrigation,
Tanzania ..................................................................................................................... 51
Table 6.6: Percentage of Households Using Fertilizer, Improved Seeds and Pesticides,
Tanzania ..................................................................................................................... 52
Table 6.7: Percentage of Households using Farming Technology by Type, Tanzania ............... 52
Table 6.8: Percentage of Farm Households Earning Income from Off-farm Activities by
Survey, Source and Area, Tanzania ........................................................................... 53
Table 7.1: The Percentage of the Population Experiencing Three Food Security Indicators
by Area ....................................................................................................................... 55
Table 7.2: Average Number of Meals Taken per Day by Adults and Children by Area ............ 58
Table 7.3: The Percent of Population by the Average Number of Daily Meals and Area,
Adults ......................................................................................................................... 59
Table 7.4: The Proportion of Population by the Average Number of Daily Meals and
Area, Children (6-59 months) .................................................................................... 59
Table 7.5: Percentage of the Population Experiencing Food Shortage and Average
Number of Months of Food Shortage Experienced in the 12 Months Prior to
the Survey by Area ..................................................................................................... 60
Table 7.6: Percentage of Households Reporting Food Shortage by Cause, Area, and
Farming Status ........................................................................................................... 63

National Panel Survey Wave 4 Report
v
List of Figures
Figure 2.1: Population Pyramids for the 4 NPS Rounds (2008/09, 2010/11, 2012/13 and
2013/14), Tanzania ....................................................................................................... 8
Figure 2.2: Percentage of Households with Access to Improved Sanitation Facilities by
Area ............................................................................................................................ 14
Figure 2.3: Percentage of Households using Electricity for Lighting by Area ............................ 15
Figure 2.4: Percentage of Households using Alternative Fuels for Cooking by Area ................. 16
Figure 3.1: Literacy Rate of the Population Aged 7 – 13 Years .................................................. 18
Figure 3.2: Literacy Rate of the Population of Age 7 – 13 Years ................................................ 18
Figure 3.3: Net Enrolment Rate in Pre-Primary Education by Area ............................................ 20
Figure 3.4: Net Enrolment Rate in Pre-Primary Education by Sex .............................................. 20
Figure 3.5: NER in Primary Education by Area and Sex ............................................................. 21
Figure 3.6: NER in Pre – Primary, Primary and Secondary Education by Orphanhood
Status, Tanzania ......................................................................................................... 24
Figure 4.1: Percentage of Births Attended by Skilled Health Worker by Area ........................... 26
Figure 4.2: Reasons for Client Dissatisfaction Pertaining to Health Services Provision,
Tanzania ..................................................................................................................... 29
Figure 5.1: Average Annual Consumption (real) by Quintile and Area, NPS 2014/15 ............... 36
Figure 5.2: Average Annual Consumption (Real) by Quintile and NPS Round, Tanzania ......... 37
Figure 5.3: Average Annual Consumption (Real) by Quintile and NPS Round, Dar es
Salaam ........................................................................................................................ 37
Figure 5.4: Average Annual Consumption (Real) by Quintile and NPS Round, OtherUrban
Mainland .................................................................................................................... 38
Figure 5.5: Average Annual Consumption (Real) by Quintile and NPS Round, Mainland
Rural ........................................................................................................................... 38
Figure 5.6: Average Annual Consumption (Real) by Quintile and NPS Rounds, Zanzibar ........ 39
Figure 5.7: Lorenz Curves of Consumption – Tanzania, NPS 2, NPS 3 and NPS 4 .................... 41
Figure 5.8: Lorenz Curves of Consumption – Dar es Salaam, NPS 2, NPS 3 and NPS 4 ........... 41
Figure 5.9: Lorenz Curves of Consumption – Other Urban Areas in Mainland, NPS 2,
NPS 3 and NPS 4 ....................................................................................................... 42
Figure 5.10: Labour Force Participation Rate (Percent) among Different Age Groups,
Tanzania ..................................................................................................................... 43
Figure 6.1: Full Year (Masika and Vuli) Total Crop Production (Million Metric Tons),
Tanzania ..................................................................................................................... 48
Figure 7.1: Percent of the Population Experiencing None of the Three Food Security
Indicators by Area ...................................................................................................... 57

National Panel Survey Wave 4 Report
vi
Figure 7.2: Percent of the Population Experiencing All Three Food Security Indicators by
Area ............................................................................................................................ 57
Figure 7.3: Percent of the Population Reporting Food Shortages in Tanzania by Month and
NPS Round ................................................................................................................. 61
Figure 7.4: Percent of the Population Reporting Food Shortages in Rural Areas by Month
and NPS Round .......................................................................................................... 61
Figure 7.5: Percent of the Population Reporting Food Shortages in Urban Areas by Month
and NPS Round .......................................................................................................... 62
Figure 7.6: Percent of the Population that is Food Insecure, by Wealth Quintiles, Tanzania ...... 64

National Panel Survey Wave 4 Report
vii
Foreword
This report presents selected findings from Wave 4 of the Tanzania National Panel Survey (NPS)
that was implemented by the National Bureau of Statistics (NBS) in collaboration with the Office
of the Chief Government Statistician – Zanzibar from October 2014 to November 2015. The NPS is
a national level longitudinal survey designed to provide data from the same households over time in
an attempt to better track national and international development agenda, understand poverty
dynamics and to evaluate policy impacts in the country. The Fourth Wave of the NPS is a follow
up on three previous waves: the first one took place between October 2008 and October 2009; the
second wave was conducted between October 2010 and November 2011; and the third wave was
conducted between October 2012 and November 2013. The first wave of the NPS had a sample of
3,265 households; the second wave had 3,924 households and the third wave had 5,010 households.
In the first three rounds of the NPS, the sample was based on Enumeration Areas from the Tanzania
2002 Population and Housing Census (PHC). Due to availability of the new sampling frame from
the 2012 Population and Housing Census, the sample of the NPS wave 4 was reviewed and
realigned with any changes in administrative boundaries, demographic shifts or updated population
information. A refresh of longitudinal cohorts is typically done to ensure proper representativeness
of estimates while maintaining sufficient primary sample to maintain cohesion within panel
analysis. A nationally representative sub-sample was selected to continue as part of the “Extended
Panel” while an entirely new sample, “Refresh Panel”, was selected to represent national and sub-
national domains, similar to those of the 2008/09 sample, namely Dar es Salaam, Other Urban areas
in Mainland Tanzania, rural Mainland Tanzania, and Zanzibar. Therefore, NPS 4 sample consisted
of 860 originally selected households from 68 clusters (extended panel) surveyed in the previous
rounds and 3,360 new households corresponding to 420 clusters from the latest PHC in 2012. This
new cohort in NPS 2014/2015 will be maintained and tracked in all future rounds between national
censuses.
However, for convenience, this report is based on data from the new households only. A separate
analysis can be done with the extended panel households in order to establish dynamics of different
indicators at national level only.
I wish to thank the Government of United Republic of Tanzania and the Ministry of Finance and
Planning, the European Commission (EC); World Bank / Gates Foundation and other donors
contributing to the Tanzania Statistical Master Plan (TSMP) basket fund for financing both local
and international costs of Wave 4 of the NPS.

National Panel Survey Wave 4 Report
viii
The NBS appreciates technical contributions by World Bank staff: Gero Carletto, Hyong Nguyen,
and Jon Kastelic in implementing the survey. I also wish to thank the NPS Technical Committee as
a whole for their valuable contributions in all aspects of the survey.
Furthermore, I wish to convey my appreciation to all permanent and temporary NBS staff for their
tireless efforts in designing and implementing the survey. My sincere appreciation should also go to
their families for being patient during the long absence of their beloved ones.
Lastly, but not the least, I am even more grateful to the survey respondents who generously
contributed part of their valuable time to be interviewed again in order to provide crucial
information for the country’s planning and policy formulation.
Dr. Albina Chuwa
Director General
National Bureau of Statistics

National Panel Survey Wave 4 Report
1
CHAPTER ONE
Introduction
1.0 Introduction
The National Panel Survey is a nationally representative household survey that collects information
on the living standards of the population including their socio-economic characteristics,
consumption, agricultural production, and non-farm income generating activities. The term “panel”
means that the survey will follow the originally sampled population over time to track the evolution
of its living conditions. The NPS is scheduled to have several rounds; the first round of the survey
(NPS 2008/09) was conducted from October 2008 to October 2009, the second round (NPS
2010/11) was carried out from October 2010 to November 2011, the third round (NPS 2012/13)
took place from October 2012 to November 2013 and the fourth wave was conducted from October
2014 to November 2015.
1.1 Objectives
The NPS was designed to fulfil three main objectives, all of which benefit from the fact that the
NPS 2008/09 can be considered as the baseline and future rounds can be compared against it. The
first objective is to track implementation progress across the three clusters of the then National
Strategy for Growth and Reduction of Poverty (commonly known by its Kiswahili acronym as
MKUKUTA) which include; growth and reduction of poverty; improvement of quality of life and
social wellbeing; and good governance and accountability. Assessing progress across the three
clusters is possible because the NPS allows the estimation of many of these MKUKUTA II
indicators.1 With the phasing out of the MKUKUTA II, the survey will now be aligned to the Five
Years Development Plan, (FYDP) (2016/17 – 2020/21) which integrated frameworks of the first
Five Years Development Plan (2011/12 – 2015/16) and MKUKUTA II (2010/11 – 2014/15).
The second objective is to provide a better understanding of the determinants of poverty reduction.
The panel feature of the survey implies that information on the poverty status of households is
available at different points in time, thus permitting the study of poverty dynamics at the household
level. This is a key advantage of NPS over the usual cross-sectional household surveys, which
allow the monitoring of poverty at the aggregate level, say, by district or by region, but not at the
household level given that they do not follow the same households over time. The third objective of
the NPS is to assess the impact of public policy initiatives. The NPS can be a powerful tool in
evaluating the impact of development policies and programs implemented by the government or
non-governmental institutions. If a person, household or community has been affected by a
1 See MKUKUTA II Monitoring Master Plan and Indicator Information for a detailed list of all indicators.

National Panel Survey Wave 4 Report
2
particular policy and has been sampled in the NPS, the survey may allow the estimation of
indicators that capture that effect. Hence coordination with those who implement these policies is
crucial in order to determine how the impact evaluation can be done and if complementary data are
required. The panel feature of the survey is suitable for investigating the dynamics of many topics
such as the educational progression of children, the labour mobility of the adult population, or the
evolution of agricultural yields.
1.2 Sample Design
The NPS is based on a stratified, multi-stage cluster sample design. The original sampling frame
was from the 2002 Population and Housing Census (PHC), more specifically, the National Master
Sample Frame, which is a list of all populated enumeration areas in the country.
The sample design of the NPS recognizes explicitly four analytical strata: Dar es Salaam, Other
Urban areas in Mainland, rural areas in Mainland and Zanzibar. Within each stratum, clusters were
randomly selected as primary sampling units, with the probability of selection proportional to their
population size. In urban areas, clusters are equivalent to census enumeration areas, while in rural
areas, clusters are equivalent to villages. In the last stage, 8 households were randomly chosen in
each cluster.
The first round of the NPS was also designed to have a panel component with the 2007 Household
Budget Survey (HBS). The panel is only possible in Mainland Tanzania, where 200 of the 350
clusters were drawn from the HBS sample and hence a panel of 1,600 households was expected for
the 2008/09 NPS and the HBS.
NPS rounds 2 and 3 followed the same sample design that was used in the first round, therefore
households kept on increasing due to tracking of split households. However, in the fourth round the
sample design was revisited and the sample was refreshed.
1.3 Panel Sample Trim and Refresh
By design, the NPS seeks to re-interview households over time. Longitudinal surveys, such as the
NPS, permit the monitoring of households over time and explicitly provide the ability to diagnose
potential determinants of any observed changes. This type of survey yields a powerful basis for the
analysis of poverty dynamics, which is not possible in pooled cross-sectional survey designs, which
interview different households across time. However, longitudinal surveys tend to suffer from bias
introduced from households leaving the survey over time; attrition. Although the NPS maintains a
highly successful recapture rate (roughly 96 percent retention at the household level), to minimize
the escalation of this selection bias, a refresh of longitudinal cohorts is typically done to ensure
proper representativeness of estimates while maintaining sufficient primary sample to maintain

National Panel Survey Wave 4 Report
3
cohesion within panel analysis.
The refreshing of a longitudinal sample may also be commissioned to realign the sample with any
changes in administrative boundaries, demographic shifts or updated population information. In the
case of Tanzania, a newly completed 2012 population and housing census providing updated
population figures, along with changed administrative boundaries, emboldens an opportunity to
realign the NPS sample and abate collective bias potentially introduced through attrition.
1.4 Revised Sample Design
To streamline the trimming and refreshing of the NPS sample, the sample design dealt with both as
independent exercises. From the original NPS sample a nationally representative sub-sample was
selected to continue as part of the “Extended Panel” while an entirely new sample, “Refresh Panel”,
was selected to represent national and sub-national domains. The retention of the extended panel
cohort will provide the opportunity to consistently track national progress and assess any potential
differences in the sample group at the national level while additionally offering a robust base for
the study of poverty dynamics over a longer period in the Tanzanian context. The “Refresh Panel”
design, sample selection took full advantage of the availability of the new population census frame
in addition to data previously captured through the NPS. This allowed for optimal sample design,
maximizing efficiency while minimizing the overall sample size. This new cohort will be
maintained in all future NPS rounds between national censuses.
Altogether the NPS baseline sample comprised of 409 clusters and 3,265 households. Table 1
shows the allocation of clusters and households across strata for the NPS baseline sample. A slight
mismatch occurred in some strata between the expected and the actual number of clusters and/or
households. The missing rural cluster in Mainland, which accounts for 8 of the 15 missing
households, was dropped from the final sample because of the poor quality of the data. The
additional 7 missing households refer mostly to panel households between the NPS and the HBS
that could not be located and for which no replacement could be found.
A new sample design for NPS 2014/2015 consisted of a combination of the original NPS sample
and a new NPS sample. A nationally representative sub-sample was selected to continue as part of
the “Extended Panel” while an entirely new sample, “Refresh Panel”, was selected to represent
national and sub-national domains. Similar to the sample in NPS 2008/2009, the sample design
allows analysis at 4 primary domains of inference, namely Dar es Salaam, Other Urban areas on
Mainland Tanzania, rural Mainland Tanzania, and Zanzibar.

National Panel Survey Wave 4 Report
4
Table 1.1: Number of Clusters and Households in the Baseline NPS 2008/09 by Area
Area Clusters Households
Expected Actual Expected Actual
Tanzania 410 409 3,280 3,265
Tanzania Mainland 350 349 2,800 2,786
Dar es Salaam 70 70 560 555
Other Urban 60 60 480 480
Rural 220 219 1,760 1,751
Tanzania Zanzibar 60 60 480 479
The sample design for the “Extended Panel” consisted of 860 households corresponding to 68
clusters from the NPS 2012/2013 sample. Additionally, the sample design for the “Refresh Panel”
consisted of a new selection of 3,360 households corresponding to 420 EAs from the latest PHC in
2012. This new cohort in NPS 2014/2015 will be maintained and tracked in all future rounds
between national censuses. However, during the data collection activities, it was found that one
cluster in Dar es Salaam was no longer there as the houses in it were destroyed to pave the way for
expansion of the road and eventually, 3,352 households from 419 clusters were successfully
interviewed.
Table 1.2: Number of Clusters and Households in New and Extended Samples of NPS 2014/15 by Area
Area New Sample
Extended Sample
Clusters Households Clusters Households
Expected Actual Expected Actual Expected Actual Expected Actual
Tanzania 420 419 3,360 3,352 68 66 860 784
Tanzania Mainland 360 359 2,880 2,872 59 57 759 703
Dar es Salaam 70 69 560 552 13 13 124 108
Other Urban Mainland 68 68 544 544 15 13 212 168
Rural 222 222 1,776 1,776 31 31 423 427
Tanzania Zanzibar 60 60 480 480 9 9 101 81
1.5 Fieldwork
The NPS 2008/09, the baseline for the NPS, was carried out from October 2008 to October 2009.
The fieldwork was implemented over a 12-months period to address concerns about intra-year
seasonality since seasonal fluctuations can affect considerably the living standards of the
population. Table 1.3 indicates that the distribution of the sample within each stratum was fairly
spread across the year.

National Panel Survey Wave 4 Report
5
Table 1.3: Distribution of Households for the NPS 2008/09 Sample by Area and Quarter of Interview
Area
2008 2009
Total October-
December
January-
March
April-
June
July-
September
Tanzania 879 742 642 1,002 3,265
Tanzania Mainland 753 628 547 858 2,786
Dar es Salaam 166 112 135 142 555
Other Urban 93 147 96 144 480
Rural 494 369 316 572 1,751
Tanzania Zanzibar 126 114 95 144 479
Another equally important consideration of the fieldwork would have been to spread the urban and
rural sample evenly within Dar es Salaam and Zanzibar. This is not a concern in Other Urban areas
and rural areas in Mainland given that these two strata are entirely urban and rural respectively. The
proportion of rural households in NPS 2008/09 by stratum and by quarter of the interview is
presented in Appendix C, Table C1. The share of rural households in Dar es Salaam varies
considerably across quarters, but the fact that rural households represent a relatively small
proportion of that stratum suggests that this might not be a critical issue. In Zanzibar, however, the
first 6 months of the fieldwork were devoted only to rural households and the last 6 months were
devoted only to urban households. This oversight did affect not only the precision of the
estimations in Zanzibar but also the comparisons with the Mainland strata. The same fieldwork
pattern in Zanzibar was kept during the NPS 2010/11, that is, comparability over time in that
stratum was considered a preferred alternative than correcting the uneven spread of urban and rural
households over the year. However, this was corrected in round three (NPS 2012/13) and four
(NPS 2014/15) of the NPS as rural and urban households were spread over the 12 months period of
the fieldwork. Subsequent rounds of the NPS will continue to follow this approach.
1.6 Tracking and Attrition
The main feature of the NPS is to track all people present in the previous rounds of the survey, that
is, the NPS is in practice an individual panel survey. Three scenarios are possible: the person stayed
in the same location, the person moved to a nearby location, or the person moved to a distant
location. Enumerators were able to keep the previous schedules for households that either stayed in
the same location or moved to a nearby location. This was possible for the entire sample in round 1
to 3 of the NPS. While the second round of the NPS tracked 97 percent of the original households,
the third round tracked 96 percent of second round. The attrition rate remained low at 3.9 percent in
the third round though slightly higher than that of the first and second rounds of the NPS (3
percent).

National Panel Survey Wave 4 Report
6
However, due to refreshing of the sample in the fourth round identification of attrition rate for the
entire round three of the NPS in relation to round four is not possible. This is only possible for the
extended panel households, that is 860 households. The attrition rate for the extended panel
households is 8 percent.

National Panel Survey Wave 4 Report
7
CHAPTER TWO
Social and Demographic Characteristics of
Households
2.0 Introduction
This chapter presents information on social and demographic characteristics of households and
individuals. The information presented under this chapter includes population distribution by age
and sex, characteristics of households, distribution of households by sex of household head,
household size, and population distribution by marital status. Social aspects discussed in this
chapter are households with access to clean and safe sources of drinking water, percentage of
households with access to basic sanitation facilities, and households with access to modern energy
for lighting and cooking.
2.1 Population Distribution by Age and Sex
Distribution of population by age and sex is the basic way of understanding population change over
time. Understanding population’s age and sex composition gives insight into changing phenomena
and highlights future social and economic challenges. In this regard all four NPS rounds (2008/09,
2010/11, 2012/13 and 2014/15), had questions asking for information on demographic
characteristics of individuals within the household.
Figure 2.1 presents population pyramids showing the percentage of males and females by age
group in each round of NPS. It is clear that the age and sex composition of the population has
largely remained the same across the rounds. All the four population pyramids are bell-shaped
indicating that Tanzania population is characterized by young people aged 0 to 19 years and
steadily decreases with increasing age. Such a population structure is typical of a developing
country like Tanzania.

National Panel Survey Wave 4 Report
8
Figure 2.1: Population Pyramids for the 4 NPS Rounds (2008/09, 2010/11, 2012/13 and 2014/15), Tanzania

National Panel Survey Wave 4 Report
9
2.2 Characteristics of Households
NPS is a survey based on households, particularly private households. A private household defined
as a person or group of persons who reside in the same homestead or compound but not necessarily
in the same dwelling unit, having the same cooking arrangements, and are answerable to the same
household head. A household head is a person acknowledged as such by other household members.
The household characteristics information was collected in all NPS rounds from 2008/09, 2010/11,
2012/13 to 2014/15.
2.3 Distribution of Households by Sex of Household Head
The findings from Table 2.1 show that male-headed households in Tanzania decreased consistently
from 74.6 percent in NPS 2008/09 to 71.2 percent in NPS 2014/15, while that of female-headed
household increased from 25.4 percent to 28.8 percent in the same period. Similarly, households
headed by males in rural areas decreased from 75.6 percent in NPS 2008/09 to 72.7 percent in NPS
2014/15 while that of female-headed household kept on increasing. Households headed by males
and females in urban areas portrayed similar patterns across the four NPS rounds. Generally, in all
NPS rounds, households headed by males are more than households headed by females.
Table 2.1: Percentage Distribution of Households by Sex of Head of Household, Tanzania
Sex of Head of
Household
NPS 2008/09 NPS 2010/11 NPS 2012/13 NPS 2014/15
Ru
ra
l
Urb
an
To
tal
Ru
ra
l
Urb
an
To
tal
Ru
ra
l
Urb
an
To
tal
Ru
ra
l
Urb
an
To
tal
Male 75.6 71.7 74.6 75.3 69.6 73.6 74.2 71.3 73.3 72.7 68.4 71.2
Female 24.4 28.3 25.4 24.7 30.4 26.4 25.8 28.7 26.7 27.3 31.6 28.8
Total 100.0 100.0 100.0 100.0 100.0 100.0 100.0 100.0 100.0 100.0 100.0 100.0
2.4 Household Size
Household size is the average number of persons per private household. This number is obtained by
dividing the total number of persons living in private households by the total number of private
households.
Table 2.2 shows that the average household size for Tanzania according to the NPS 2014/15 is 4.7
which is slightly lower than 4.8 recorded in NPS 2012/13. The trend shows that the average
household size increased from 5.0 persons in NPS 2008/09 to 5.1 persons in NPS 2010/11
thereafter decreased to 4.8 persons in 2012/13 NPS and 4.7 persons in the 2014/15 NPS round.
Generally, households in rural areas have relatively larger household sizes compared to urban areas.

National Panel Survey Wave 4 Report
10
Table 2.2: Percentage Distribution of Households by Area and Number of Usual Residents
Number
Of Usual Residents
NPS 2008/09 NPS 2010/11 NPS 2012/13 NPS 2014/15
Ru
ral
Urb
an
To
tal
Ru
ral
Urb
an
To
tal
Ru
ral
Urb
an
To
tal
Ru
ral
Urb
an
To
tal
1 5.4 12.3 7.2 5.5 13.6 8.0 7.3 16.4 10.1 6.7 11.6 8.4
2 8.9 12.9 9.9 9.4 12.1 10.2 10.6 11.4 10.9 9.9 13.7 11.2
3 13.0 18.4 14.4 10.8 17.2 12.7 12.2 16.7 13.6 15.4 21.3 17.4
4 15.6 16.7 15.9 15.7 14.9 15.5 14.5 16.6 15.2 14.8 17.6 15.8
5 15.3 13.9 14.9 15.6 12.4 14.6 15.3 13.9 14.8 14.4 13.4 14.1
6+ 41.9 25.9 37.7 43.0 29.9 39.0 40.1 25.1 35.4 38.8 22.4 33.1
Total 100.0 100.0 100.0 100. 100 100 100 100 100 100 100 100
Percent of Households 73.7 26.3 100.0 69.3 30.7 100.0 68.8 31.2 100.0 65.5 34.5 100.0
Average Household Size 5.3 4.2 5.0 5.4 4.3 5.1 5.2 4.1 4.8 5.1 4.0 4.7
2.5 Marital Status
Information on marital status is in most cases collected from persons above a certain minimum age,
which is the lower limit of age at first marriage in that particular country. Basing on the law of
marriage in Tanzania, questions on marital status are asked to persons aged 12 years and above.
Seven categories were adopted to describe marital status namely; never married, monogamously
married, polygamously married, living together, separated, divorced and widowed. The data on
marital status for the NPS rounds are disaggregated by rural and urban areas.
Table 2.3 shows that 38.3 percent of the population in NPS 2014/15 was never married, which is
low compared with previous NPS rounds. The trend shows that urban areas have higher proportions
of never married persons than rural areas. One-third of the population (34.8 percent) in NPS
2014/15 are monogamously married which is slightly higher compared with 32.3 percent reported
in NPS 2012/13. In all four NPS rounds, the proportion of monogamously married persons is
slightly higher in rural areas than urban areas. About 2.1 percent of the population in NPS 2014/15
was divorced. The proportion of divorced persons has been increasing over time from 1.1 percent in
2008/09 NPS to 2.1 percent in 2014/15 NPS.

National Panel Survey Wave 4 Report
11
Table 2.3: Percentage Distribution of Population by Marital Status, Tanzania
Marital Status
NPS 2008/09 NPS 2010/11 NPS 2012/13 NPS 2014/15
Ru
ral
Urb
an
To
tal
Ru
ral
Urb
an
To
tal
Ru
ral
Urb
an
To
tal
Ru
ral
Urb
an
To
tal
Monogamously
Married 36.2 31.2 35.0 27.9 27.9 27.9 32.5 31.6 32.3 35.0 34.4 34.8
Polygamous Married 8.5 3.4 7.2 8.5 3.6 7.1 8.3 2.9 6.7 8.4 2.2 6.4
Living Together 5.5 7.8 6.1 13.4 9.6 12.3 8.4 7.5 8.1 8.5 9.7 8.9
Separated 4.0 5.2 4.3 3.8 5.6 4.3 3.7 4.4 3.9 3.5 4.5 3.8
Divorced 1.0 1.4 1.1 1.1 1.7 1.3 1.7 2.1 1.8 2.0 2.4 2.1
Never Married 38.5 45.2 40.2 39.6 46.1 41.4 39.9 46.4 41.8 37.0 40.8 38.3
Widow(er) 6.3 5.8 6.2 5.6 5.6 5.6 5.6 5.1 5.4 5.7 5.8 5.7
2.6 Access to Piped or Protected Water Sources
The source of drinking water is used to ascertain the suitability of water for consumption. Piped
water inside the dwelling, private or public standpipes (taps) and protected wells are considered as
clean sources of drinking water. NPS collects information for this indicator separately for the rainy
and dry seasons.
Table 2.4: Percentage Distribution of Households with Access to Clean Drinking Water by Area and Season
Area
Rainy Season Dry Season
NPS
2008/09
NPS
2010/11
NPS
2012/13
NPS
2014/15
NPS
2008/09
NPS
2010/11
NPS
2012/13
NPS
2014/15
Tanzania 43.2 42.7 45.9 46.0 43.5 50.2 52.9 57.4
Rural 32.8 32.3 35.4 34.5 32.9 39.8 41.6 46.2
Urban 72.5 66.4 69.1 67.8 73.3 73.5 77.7 78.7
Tanzania Mainland 42.2 41.5 44.8 45.0 42.5 49.2 51.9 56.7
Dar es Salaam 77.8 74.6 73.2 65.7 81.1 77.7 78.5 81.6
Other Urban 67.1 62.3 65.2 68.7 67.0 71.2 76.4 77.3
Rural 31.9 30.5 34.3 33.4 31.9 38.4 40.6 45.4
Tanzania Zanzibar 81.3 85.6 87.0 81.3 80.3 84.3 87.6 81.3
Table 2.4 shows that the percentage distribution of households with access to clean drinking water
during the rainy and dry seasons in NPS 2014/15 is 46.0 percent and 57.4 percent respectively. In
all strata except Zanzibar, access to clean drinking water is higher in dry season than in rainy
season. In Zanzibar access to clean drinking water is the same in both seasons. Population in urban
areas is more likely to have access to clean drinking water in both seasons than the population in
rural areas. The proportion of households with access to clean drinking water during the dry
seasons has been increasing from 43.5 percent in 2008/2009 NPS to 57.4 percent in 2014/15 NPS
while during the rainy season it increased slightly from 43.2 percent in NPS 2008/09 to 46.0

National Panel Survey Wave 4 Report
12
percent in NPS 2014/15. However, the proportion of households with access to clean drinking
water in Dar es Salaam during the rainy season declined from 77.8 percent in NPS 2008/09 to 65.7
percent in NPS 2014/15.
2.7 Access to Improved Source of Drinking Water
According to the World Health Organization (WHO), an International Standard of “Improved”
Source of Drinking Water is one that by the nature of its construction and when properly used,
adequately protects the source from outside contamination, particularly faecal matter. These
sources include piped water into dwelling; piped water to yard/plot; public tap or standpipe; tube-
well or borehole; protected dug well; protected spring and rainwater.
Results from NPS 2014/15 show a steady increase in the proportion of households that are
accessing water from improved sources during dry season since the first round of NPS (Table 2.5).
On the other hand, accessibility of water from improved sources during rainy season was stagnant
between NPS 2010/11 and NPS 2012/13 after it had increased sharply from 52.0 percent in NPS
2008/09 to 63.2 percent in NPS 2010/11 and then increased to 68.9 percent in NPS 2014/15. Of all
the domains, Zanzibar stands out with higher percentages of its population accessing water from
improved sources with a consistent access of over 80 percent of the population in all four rounds of
NPS. Within Tanzania Mainland domain, Dar es Salaam has a high access to improved water
sources of from 77.7 and 88.4 percent across all rounds of NPS and during both rainy and dry
seasons. It is followed by Other Urban areas. The rural stratum has the lowest access of between
32.5 to 59.2 percent across all rounds of NPS.
Table 2.5: Proportion of Households with Access to Improved Source of Drinking Water by Area and Season
Area
Rainy Season Dry Season
NPS
2008/09
NPS
2010/11
NPS
2012/13
NPS
2014/15
NPS
2008/09
NPS
2010/11
NPS
2012/13
NPS
2014/15
Tanzania 52.0 63.2 62.7 68.9 43.9 50.4 53.4 58.5
Rural 41.5 54.2 53.1 59.8 33.3 33.3 42.1 47.4
Urban 81.4 83.5 83.9 86.0 73.6 73.8 78.0 79.6
Tanzania Mainland 51.2 62.5 62.0 68.5 42.9 49.5 52.5 57.9
Dar es Salaam 85.4 81.2 81.7 88.4 81.1 77.7 78.7 82.6
Other Urban 77.5 84.0 84.8 85.6 67.5 71.5 76.8 78.2
Rural 40.7 53.1 52.4 59.2 32.5 38.5 41.2 46.6
Tanzania Zanzibar 81.3 85.6 87.8 81.3 80.3 84.6 87.6 81.3

National Panel Survey Wave 4 Report
13
2.8 Access to Basic Sanitation Facilities
Basic sanitation facilities are simply flush or pour toilets, ventilated pit latrines, and simple pit
latrines. Poor sanitation is another principal cause of preventable diseases including diarrhoea,
dysentery and cholera. Improvements in hygiene are generally associated with better health, which
positively affects almost all other activities of the household.
In NPS 2014/15, the findings show that majority of households in Tanzania (87.0 percent) have
access to basic sanitation facilities (Table 2.6). There was no remarkable difference in the access to
basic sanitation facilities between NPS 2014/15 and NPS 2012/13. Access to basic sanitation
facilities in Tanzania is quite high, especially in urban areas. Furthermore, Dar es Salaam reported
the largest percentage of households with access to sanitation facilities in all four NPS rounds.
Table 2.6: Percentage Distribution of Households with Basic Sanitation Facilities by Area
Area NPS 2008/09 NPS 2010/11 NPS 2012/13 NPS 2014/15
Tanzania 89.9 87.1
86.6
87.0
Rural 86.6 83.3
81.8
82.2
Urban 99.3 95.6
97.2
96.0
Tanzania Mainland 90.2 87.3
86.7
87.1
Dar es Salaam 99.2 98.9
98.7
99.0
Other Urban 99.1 94.4
96.4
96.3
Rural 86.9 83.5
81.9
81.9
Tanzania Zanzibar 80.6 78.4
83.4
81.2
2.9 Access to Improved Sanitation Facilities
The World Health Organization defines an "Improved" Sanitation Facility as one that hygienically
separates human excreta from human contact. Such facilities include piped sewer system; septic
tank; flush/pour to pit latrine; ventilated improved pit latrine (VIP); pit latrine with slab;
composting toilet and special case. Starting from 2011/12 NPS round, additional details have been
added to the questionnaire to facilitate international definitions for “improved” sanitation facilities.
The NPS 2008/09 grouped all pit latrines together, while in the subsequent surveys split pit latrines
into those with washable slabs and those with no washable slabs. Any pit latrine qualifies for basic
sanitation; only pit latrines with a washable slab qualify as an improved facility. An additional
qualification for an improved facility concerns sharing the facility with other households. Sharing
the facility disqualifies it from classification as improved.
The difference between access to basic sanitation and improved sanitation is quite apparent. While
87.0 percent of households had access to basic sanitation in NPS 2014/15 (Table 2.6); the

National Panel Survey Wave 4 Report
14
percentage of households with access to improved sanitation in the same period was only 24.2
percent (Figure 2.2). The difference between access to a basic sanitation facility and access to an
improved facility is much less stark for Zanzibar.
Figure 2.2: Percentage of Households with Access to Improved Sanitation Facilities by Area
2.10 Access to Electricity
Access to modern energy services is important for economic development and a household’s well-
being. Having access to electricity for lighting increases the time available for productive work and
study/homework, and helps reduce household air pollution caused by kerosene lanterns.
The proportion of households in Tanzania that use electricity for lighting consistently increased
from 13.0 percent in NPS 2008/09 to 23.5 percent in NPS 2014/15, (demonstrating that Tanzania
has made progress in improving access to electricity. Most of the progress reported in Tanzania
Mainland from 2008/09 to 2014/15 NPS round was contributed by Other Urban areas where the
percentage of households using electricity for lighting consistently increased from 31.4 percent to
53.6 percent during that period. Although an increase is observed from NPS 2008/09 to NPS
2014/15 in the electrification of rural areas in Tanzania, the percentage of rural households using
electricity for lighting is still very low (7.1 percent). Use of electricity for lighting in Zanzibar,
increased from 33.9 percent in 2008/19 to 43.7 percent in the NPS 2012/13, thereafter decreased to
39.4 percent in the NPS 2014/15 (Figure 2.3).

National Panel Survey Wave 4 Report
15
Figure 2.3: Percentage of Households using Electricity for Lighting by Area
2.11 Energy for Cooking Used by Households
Majority of households in Tanzania cook using open fires or stoves that burn solid fuels, such as
coal, wood, or animal dung. Using solid fuels for cooking produces high levels of household air
pollution that is damaging to the health of household members. Additionally, excessive use of some
solid fuels negatively affects the environment through deforestation.
The percentage of households relying on solid fuels in Tanzania remains largely unchanged,
especially in rural areas. There is a small increase in the percentage of urban households that are
using alternatives to solid fuels as energy for cooking, from 4.0 percent in NPS 2008/09 to 9.2
percent in NPS 2014/15. It is worth noting that, the percentage of households using alternative fuels
for cooking has consistently increased in Tanzania Mainland from 1.6 percent in NPS 2008/09 to
3.8 percent in NPS 2014/15. In Zanzibar, the pattern seems to be different, increasing from 1.1
percent in NPS 2008/09 to 4.4 percent in NPS 2012/13 before decreasing to 3.4 percent in the NPS
2014/15 (Figure 2.4).

National Panel Survey Wave 4 Report
16
Figure 2.4: Percentage of Households using Alternative Fuels for Cooking by Area

National Panel Survey Wave 4 Report
17
CHAPTER THREE
Education
3.0 Introduction
Education is a process through which intellectual, physical and moral capacities of individuals are
developed to make them refined members of their society. This chapter presents information on
selected education indicators including Literacy Rates; Net Enrollment Rate at Pre-Primary,
Primary and Secondary Schools; Gross Enrollment Rate in Higher Education; and Average
Household Expenditure on Education.
The National Five Year Development Plan (2016/17 – 2020/21) under the section of education
interventions has articulated challenges and education interventions from pre–primary education to
higher education as well as the expected outcomes during and after the period. In the last three
NPSs (NPS 2010/11, NPS 2012/13 and NPS 2014/15) questions regarding education were included
in the questionnaires so as to trace the trend of the selected education variables overtime.
3.1 Literacy among Population of Age 7 – 13 Years
According to the United Nations Educational, Scientific, and Cultural Organization (UNESCO)
“literacy rate is the percentage of population who can both read and write with understanding a short
simple statement on their everyday lives. Generally, ‘literacy’ also encompasses ‘numeracy’, the
ability to make simple arithmetic calculations”. Literacy represents a prospect for further intellectual
growth and contribution to economic-socio-cultural development of society. In Tanzania official age
for primary school education is 7 to 13 years preceded by two years (5 and 6 years) of pre – primary
education.
At the national level literacy rate has remained the same at 62.8 percent since NPS 2012/13 to
2014/15. However, literacy has declined from 64.6 percent in NPS 2010/11 to 62.8 percent in NPS
2012/13. Rural areas continue to lag behind urban areas across all the three NPS rounds, as urban
areas have considerably higher literacy rates than that of rural areas (Figure 3.1).
In the last three NPS rounds, there is a relatively large percentage of population aged 7 to 13 years
which is literate in Zanzibar compared to Mainland. Furthermore, for all domains, Dar es Salaam
has shown an increasing literacy rate (though at a decreasing rate) between NPS 2010/11 and NPS
2014/15.

National Panel Survey Wave 4 Report
18
Figure 3.1: Literacy Rate of the Population Aged 7 – 13 Years
Males’ literacy rate has shown a decreasing trend over time, whereas females’ literacy rates have
been fluctuating over time. Consistently, females continued to have a higher literacy rate than males
from NPS 2010/11 to NPS 2014/15 (Figure 3.2).
Figure 3.2: Literacy Rate of the Population of Age 7 – 13 Years

National Panel Survey Wave 4 Report
19
3.2 Literacy among Population of Age 7 – 13 Years Currently Attending School
Table 3.1 portrays that literacy rate in Tanzania slightly increased by 0.6 percent from 60.0 percent
recorded in NPS 2012/13 to 60.6 percent recorded in NPS 2014/15. Zanzibar consistently managed
to keep high percentages of literate population aged 7 to 13 years attending school compared to
Mainland throughout the last three NPS rounds.
Literacy rate in urban areas decreased from 81.7 percent in NPS 2010/11 to 78.9 percent in NPS
2014/15. In the rest of the strata the literacy rate has increased between NPS 2012/13 and NPS
2014/15 although it declined between NPS 2010/11 and NPS 2012/13. Despite this pattern of
fluctuation in literacy rate, Dar es Salaam had higher literacy rates in the last three NPS rounds.
However, females continue to have higher literacy rates than males across all three NPS rounds.
Table 3.1: Literacy Rate of the Population of Age 7 – 13 Years Currently Attending School by Area and Sex
Area/Sex NPS 2010/11 NPS 2012/13 NPS 2014/15
Tanzania 63.2 60.0 60.6
Rural 57.8 54.2 54.9
Urban 81.7 79.5 78.9
Mainland 63.1 59.4 60.2
Dar es Salaam 85.5 84.3 86.2
Other Urban 80.8 77.0 75.1
Rural 57.5 53.7 54.5
Zanzibar 67.9 80.7 72.8
Sex
Female 65.6 62.1 63.9
Male 60.7 57.8 57.6
3.3 Net Enrollment Rate at Pre-Primary School
The net enrolment rate (NER) in Pre-Primary Education is the proportion of children age 5 to 6 years
enrolled in Pre-primary schools to the population of children age 5 to 6 years. NER shows the extent of
coverage in a given level of education for children belonging to the official age group corresponding
to a given level of education.
The NER in Pre-Primary Education decreased by 2.1 percent in NPS 2014/15 compared to NPS
2012/13. Improvements in enrollment have occurred in the Mainland and Zanzibar since 2008/09,
most improvement gains came between the NPS 2008/09 and NPS 2012/13. Urban areas reported
higher enrolment rates than rural areas across all NPS rounds. However, in all NPS rounds, except
the 2008/09 round, Zanzibar reported higher NER than Mainland. With the exception of the recent
NPS 2014/15 round, Dar es Salaam had the highest NER compared with other strata in all NPS
rounds (Figure 3.3).

National Panel Survey Wave 4 Report
20
Figure 3.3: Net Enrolment Rate in Pre-Primary Education by Area
The NPS 2014/15 findings show that, females have higher Pre-Primary NER (27.3 percent) than
males (24.7 percent) in all NPS rounds, except for NPS 2012/13 (Figure 3.4).
Figure 3.4: Net Enrolment Rate in Pre-Primary Education by Sex
3.4 Primary School Net Enrollment Rate
Net enrollment rate (NER) in Primary Education is the proportion of children aged 7-13 years who
are enrolled in primary schools to the population of children who are 7-13 years of age.
Table 3.2 shows that in NPS 2014/15 almost three quarters (73.6 percent) of children of age 7 to 13
years were enrolled in primary schools; which is a decrease of 2.7 percentage points compared with
76.3 percent recorded in the NPS 2012/13. The trend shows that NER for primary education

National Panel Survey Wave 4 Report
21
decreased consistently from 82.9 percent in NPS 2008/09 to 73.6 percent in NPS 2014/15. Urban
areas consistently displayed higher NER in primary education than rural areas in all NPS rounds.
Table 3.2: Net Enrolment Rate in Primary Education by Area and Sex
Area / Sex NPS 2008/09 NPS 2010/11 NPS 2012/13 NPS 2014/15
Tanzania 82.9 80.5 76.3 73.6
Rural 81.3 78.7 73.2 71.4
Urban 89.6 86.7 86.8 80.6
Mainland 83.1 80.3 76.0 73.4
Dar es Salaam 85.6 87.0 87.4 84.4
Other Urban 91.1 86.7 86.6 79.2
Rural 81.4 78.4 73.0 71.1
Zanzibar 78.8 85.0 86.0 82.4
Sex
Female 85.5 81.9 79.1 76.7
Male 80.1 79.0 73.4 70.8
Females continue to have a higher NER in primary education than males. Moreover in rural areas
female have a higher primary education NER than males in all NPS rounds (Figure 3.5).
Figure 3.5: NER in Primary Education by Area and Sex
3.5 Secondary School Net Enrollment Rate
The net enrollment rate in Secondary Education is the proportion of children of age 14 to 17 years
who are enrolled in forms 1 to 4 in Secondary schools to the population age 14 to 17 years.

National Panel Survey Wave 4 Report
22
Table 3.3: Net Enrolment in Secondary Education by Area and Sex
Area/sex NPS 2008/09 NPS 2010/11 NPS 2012/13 NPS 2014/15
Tanzania 23.3 28.3 30.0 24.7
Rural 15.6 20.4 21.2 18.4
Urban 49.0 52.0 56.6 41.4
Mainland 22.8 28.0 29.5 24.3
Dar es Salaam 44.5 50.1 54.9 41.6
Other Urban 49.3 52.5 57.8 42.8
Rural 15.2 19.9 20.6 17.8
Zanzibar 39.0 37.2 44.8 37.6
Sex
Female 24.2 29.8 31.7 25.7
Male 22.4 26.7 28.2 23.7
Table 3.3 shows that in NPS 2014/15 almost one-quarter (24.7 percent) of children of age 14 to 17
years were enrolled in secondary schools; which is a decrease of 5.3 percent points compared with
the NPS 2012/13. The trend shows that NER for secondary school increased consistently from
23.3 percent to 30.0 percent between NPS 2008/09 and NPS 2012/13 and then decreased to 24.7
percent in NPS 2014/15. Urban areas consistently displayed a higher NER in secondary education
than rural areas in all NPS rounds. In all NPS rounds females have a higher NER in secondary
school than males.
3.6 Gross Enrollment Rate in Higher Education
The gross enrollment rate (GER) in Higher Education is the ratio between those enrolled in higher
education institutions with respect to those aged 20 to 24 years. Note that this definition differs from
net enrollment rates used in the preceding sections. Table 3.4 presents the gross enrollment rate in
higher education for each round of NPS.
The GER in tertiary education is quite low in the country standing at 5.2 percent in NPS 2014/15
although this is a better rate than that of NPS 2008/09 was just 2.5 percent. Gradually, enrolment
has increased from 2.5 percent in NPS 2008/09 to 5.2 percent in NPS 2014/15. As in other levels of
education, enrollment in tertiary education is higher in urban than in rural areas. Mainland and
Zanzibar displayed almost similar rates of enrollment in the first two rounds of the NPS; 2.5
percent and 2.2 percent respectively in NPS 2008/09; 3.9 percent and 3.1 percent respectively in
NPS 2010/11. However, tertiary GER increased dramatically in Zanzibar in the NPS 2012/13,
while Mainland rates increased at a rate slightly lower than that of Zanzibar (Table 3.4).

National Panel Survey Wave 4 Report
23
Table 3.4: Gross Enrollment in Higher Education Institutions by Area and Sex
Area/sex NPS 2008/09 NPS 2010/11 NPS 2012/13 NPS 2014/15
Tanzania 2.5 3.8 5.1 5.2
Rural 0.6 0.9 3.1 2.0
Urban 7.3 9.6 8.9 10.8
Mainland 2.5 3.9 5.0 5.2
Dar es Salaam 8.8 15.0 13.4 11.3
Other Urban 6.0 6.9 5.7 11.1
Rural 0.6 0.9 3.0 1.9
Zanzibar 2.2 3.1 7.8 4.9
Sex
Female 1.6 3.0 3.4 3.0
Male 3.7 4.7 6.7 8.0
Across strata, Dar es Salaam consistently shows the largest GER while rural areas in the Mainland
show the smallest. A decline in GER was observed in Dar es Salaam from the rate of 13.4 percent in
NPS 2012/13 to 11.3 percent in NPS 2014/15. Unlike to pre – primary, primary and secondary school
levels where females’ enrolment rates were larger than males, in tertiary education males have higher
enrollment rates than females.
3.7 Orphans in School
The aim of the Government of the United Republic of Tanzania is to ensure that all the country’s
most vulnerable children are effectively and efficiently provided with community-based support and
care. The education sector is recognized as having a critical role to play in these efforts, and access to
education is viewed as one of the principal means by which children can be set free from long-term
poverty and vulnerability. An orphan is a child who has lost one or both parents.
Figure 3.6 shows that in NPS 2014/15 almost one quarter (23.6 percent) of orphans of age 6 and 7
were enrolled in pre – primary schools; which is a decrease of 7.6 percent compared with the NPS
2012/13. The trend shows that pre – primary NER for orphans increased from 24.0 percent in NPS
2008/09 to 31.4 percent in NPS 2010/11, was steady in NPS 2012/13, and then decreased to 23.6
percent in NPS 2014/15.
Findings show that in NPS 2014/15, seven in ten orphans of age 7 to 18 years were enrolled in
primary schools. The trend shows that primary NER for orphans had decreased from 84.4 percent in
NPS 2008/09 to 69.0 percent in NPS 2014/15.
In NPS 2014/15, almost one fifth (20.1 percent) of orphans of age 14 to 17 years were enrolled in
secondary schools; which is a decrease of 11.9 percentage points compared with the NPS 2012/13.

National Panel Survey Wave 4 Report
24
The trend shows that secondary NER for orphans increased from 24.1 percent in NPS 2008/09 to
31.6 percent in NPS 2010/11, was steady in NPS 2012/13 then decreased to 20.1 percent in NPS
2014/15.
Figure 3.6: NER in Pre – Primary, Primary and Secondary Education by Orphanhood Status, Tanzania

National Panel Survey Wave 4 Report
25
CHAPTER FOUR
Health and Nutrition
4.0 Introduction
This chapter presents the following health related issues; births attended by skilled health workers,
expenditure on health, client satisfaction with health services and birth registration. It is worth
noting that, the chapter does not focus on health which according to the World Health Organization
(WHO) definition health is referred to as a state of complete physical, mental and social well-being
and not merely the absence of disease or infirmity. However, it also focuses on nutrition
particularly problems associated with inadequate nutrition (malnutrition) including stunting and
wasting in children under 5 years of age.
4.1 Births Attended by a Skilled Health Worker
The proportion of births attended by a skilled health worker is used as a proxy for access to
reproductive health care. In this context doctors, clinical officers, nurses and midwives are
considered to be skilled health workers as they have been trained to provide the necessary
supervision, care and advice to women during pregnancy, labour, and the post-delivery period.
Skilled health workers can successfully manage potential complications during childbirth and
thereby reduce both maternal and infant mortality. However, traditional birth attendants are not
considered skilled personnel, as they have not received the necessary training that can help to
reduce maternal and infant mortality.
The NPS asks all women aged 12 to 49 years if they delivered any children in the 24 months prior
to the survey. It is worth noting that though women may have given birth to more than one child in
the 24 months prior to the survey, the NPS 2015 considered only their most recent births during
that period. For simplicity, those deliveries will be referred to as the total number of deliveries in
the 24 months prior to the survey.
The proportion of births attended by skilled health workers in Tanzania was 69.6 percent in NPS
2014/15.The proportion has been increasing steadily from 59.3 percent in NPS 2008/09 to 69.6
percent in NPS 2014/15.The progressive increase appears to be driven by improved access to
reproductive health care in rural areas, where increases were similarly reported over time. The
proportion of birth attended by skilled health workers in urban areas is significantly higher (91.4
percent) than in rural area (60.3 percent) (Figure 4.1).

National Panel Survey Wave 4 Report
26
Figure 4.1: Percentage of Births Attended by Skilled Health Worker by Area
Rapid expansion of urban centres accompanied by high rural–urban migration may have accounted
for the sharp decline in the proportion of births attended by skilled health workers in urban areas
from 2008/09 NPS round (92.6 percent) to 2010/11 round (86.7 percent). In the NPS 2012/13, the
urban areas’ proportions appeared to increase slightly to previous levels, but declined again in NPS
2014/15. Almost the same trend is observed in Dar es Salaam where there is a slight decline in the
proportion of births attended by skilled health workers between 2008/09 and 2010/11, an increase
in 2012/13 and a decline to almost the 2010/11 level in NPS 2014/15.
Noteworthy patterns within all rounds of the NPS show that urban areas have experienced better
access to reproductive health care than rural areas. Figure 4.1 further shows that the proportion of
births attended by skilled health workers for the Mainland and Zanzibar are almost similar, and as
expected, the proportion in Dar es Salaam is the highest among all strata in each round of the NPS.
4.2 Registration of Births
Registration of vital events such as births assists in the accurate calculation of birth rates and the
associated assessment of infant mortality rates. It can additionally provide information regarding
vaccination needs and it is important for tracking progress towards the health-related Millennium
Development Goals. The cost of registration, distance to registration facilities, and knowledge gaps
regarding the importance of registration can each contribute to low registration rates.
In Table 4.1, the proportion of registered births among those born in the 24 months period prior to
the NPS 2014/15 (83.3 percent) and is higher than the proportion recorded in NPS 2012/13 (73.5
percent). No steady trends are apparent over the four rounds of the NPS in any area of the country.

National Panel Survey Wave 4 Report
27
However, the reported proportion of births registered was higher in NPS 2014/15 than in NPS
2008/09 for each area except Zanzibar and Dar es Salaam.
Table 4.1: Percentage of Births Registered among Those Born in the 24 Months Period Prior to the Survey by
Area
Area
NPS 2008/09 NPS 2010/11 NPS 2012/13 NPS 2014/15
Tanzania 75.4 79.5 73.5 83.3
Rural 71.6 76.0 67.9 78.4
Urban 93.3 91.1 92.2 94.6
Tanzania Mainland 74.8 79.2 82.8 82.8
Dar es Salaam 94.5 95.9 99.4 94.2
Other Urban 92.0 88.6 87.6 94.4
Rural 71.0 75.5 67.4 78.2
Zanzibar 97.1 92.9 96.7 96.8
Urban areas reported a higher proportion of registered births compared to rural areas. Compared to
Other Urban areas, Dar es Salaam reported the highest proportions of registered births in all NPS
rounds except for the 2014/15 round. Although, the proportion of registered births in Zanzibar and
Tanzania Mainland did not follow similar patterns; Zanzibar reported higher proportions of
registered births in each NPS round compared with Tanzania Mainland.
4.3 Satisfaction with Health Services
The 2010/11, 2012/13 and 2014/15 NPS put emphasis on client satisfaction to the services provided
by different health providers in Tanzania (including government, private and religious health
providers) by asking a question aiming at knowing if clients were satisfied with health services
provided in the four weeks before the survey. The survey considered only two health providers
visited by each client by asking the respondent to list up to two visits by order of importance. The
analysis presented here considers only responses from the first provider mentioned by the
respondents.
In NPS the 2014/15, seven in ten individuals (72.7 percent) who visited health facilities stated that
they were satisfied with services provided, which is a slight decrease in satisfaction compared with
NPS 2012/13 (73.7 percent). The survey estimates show that the client satisfaction with health
service provision declined from 75.9 percent in NPS 2010/11 to 73.7 percent in NPS 2012/13 and
then to 72.7 percent in NPS 2014/15 implying that the client dissatisfaction increased over the same
period. Unlike other strata, Zanzibar reported the highest level of satisfaction across all three
surveys (more than 81 percent of the respondents were reported to be satisfied with the health
services provided). The findings also show that rural dwellers in Tanzania are more satisfied with

National Panel Survey Wave 4 Report
28
the health services than urban dwellers. In general, males were more likely to be satisfied with
health services provided compared to females.
Table 4.2: Percentage of Population Expressing Satisfaction with Health Services by Area and Sex
Area / Sex NPS 2010/11 NPS 2012/13 NPS 2014/15
Satisfied Not Satisfied Satisfied Not
Satisfied Satisfied
Not
Satisfied
Tanzania 75.9 24.1 73.7 26.3 72.7 27.3
Rural 79.1 20.9 77.1 22.9 73.8 26.2
Urban 69.2 30.8 66.7 33.3 70.6 29.4
Mainland 75.5 24.5 73.5 26.5 72.5 27.5
Dar es Salaam 58.8 41.2 56.5 43.5 62.4 37.6
Other Urban 74.3 25.7 72.5 27.5 74.3 25.7
Rural 78.7 21.3 77.1 22.9 73.8 26.2
Zanzibar 86.1 13.9 81.2 18.8 82.3 17.7
Sex
Female 76.1 23.9 72.3 27.7 71.4 28.6
Male 75.6 24.4 75.4 24.6 74.5 25.5
4.4 Major Reasons for Client Dissatisfaction Pertaining to Health Services Provision
Clients are not satisfied with the health services provided by different health providers in Tanzania
due to a number of reasons. In the2010/11, 2012/13 and 2014/15 NPS respondents were asked a
question which required them to state the reasons for their dissatisfaction with health services
provision. The reasons reported were long waiting time, too expensive, lack of medicine,
inadequate trained staff, poor tools/building and others but since the first three reasons were the
most reported, the remaining reasons were grouped together under “others” as they constitute only
a very small fraction of the respondents.
In the NPS 2014/15, one third of the respondents (32.5 percent) stated that the cost of health
services is a major reason for their dissatisfaction followed by long waiting time (28.4 percent),
lack of medicine (26.0 percent) and others (13.1 percent). In the NPS 2010/11 the main reason for
client dissatisfaction with the health service provision was long waiting time (34.6 percent), and in
the NPS 2012/13 the reason was too expensive (32.0 percent). In general long waiting time and cost
of the health services have been the main causes for dissatisfaction for NPS 2012/13 and NPS
2014/15 whereas for NPS 2010/11 the main causes of client dissatisfaction were long waiting time
and lack of medicine.

National Panel Survey Wave 4 Report
29
Figure 4.2: Reasons for Client Dissatisfaction Pertaining to Health Services Provision, Tanzania
4.5 Health Spending
The NPS asked respondents how much they spent when they visited health providers in the four
weeks prior to the survey. Majority of respondents (74.1 percent in NPS 2012/13 and 76.4 percent
in NPS 2014/15) spent not more than 10,000 Tanzanian shillings (TZS) on health services in the
period of four weeks (in a month). In general, 87.3 percent of respondents in NPS 2012/13 round
and 89.7 percent in NPS 2014/15 round did not spend more than 20,000 TZS on health services per
month. However, one of the major concerns of the health providers’ clients was the high cost of the
services; meaning that though most of the respondents spent not more than 20,000 Tanzanian
shillings in four weeks, they would like to see these costs being lowered.
Table 4.3: Percentage of Population Spending on Health Services, Tanzania
Expenses (TZS) NPS 2012/13 NPS 2014/15
Less or equal to 10,000 74.1 76.4
10,001-20,000 13.2 13.3
20,001-30,000 4.7 4.1
30,001-40,000 2.3 1.9
40,001-50,000 1.6 1.5
50,001 or above 4.2 2.8
4.6 Under-fives Moderately or Severely Stunted (Height for Age)
According to Comprehensive Food Security and Vulnerability Analysis Guidelines (2009) stunting
is a measure of chronic malnutrition characterized by a slowing in the growth of a child resulting in
a failure of the child to achieve the expected height when compared to a healthy, well nourished
child of the same age. Stunting is associated with a number of long-term factors such as

National Panel Survey Wave 4 Report
30
deficiencies in nutrition (chronically inadequate levels of proteins, energy and/or micronutrients),
frequent infections, and inappropriate feeding practices over an extended period. It is not an
accurate measurement of short-term changes in nutritional status.
Stunting of the children aged less than five years in all rounds of NPS is portrayed in Table 4.4.
According to the table, prevalence of under-five children who were stunted was relatively low in
NPS 2014/15 (34.2 percent) compared with NPS 2008/09 (43.0 percent), 2010/11 (34.8 percent)
and 2012/13 (37.4 percent). Unlike Tanzania Mainland, Zanzibar has recorded smaller proportions
of stunted children in all NPS rounds except for the 2014/15 round. The problem of stunting is
more prevalent in rural areas compared to Other Urban areas, and Dar es Salaam domains of the
Tanzania Mainland. It is worth noting that the male children are more affected by stunting
compared to female children as observed in all NPS rounds (Table 4.4).
Table 4.4: Percentage of Stunting (height for age) of Children Under 5 Years by Area and Sex
Area/Sex NPS 2008/09 NPS 2010/11 NPS 2012/13 NPS 2014/15
Tanzania 43.0 34.8 37.4 34.2
Rural 45.6 37.3 39.3 37.3
Urban 30.2 24.1 29.5 25.4
Mainland 43.2 34.9 37.6 34.1
Dar es Salaam 36.5 21.1 23.8 23.8
Other Urban
(Mainla(
Mainland
)
27.9 24.9 32.2 25.0
Rural 45.9 37.5 39.5 37.4
Zanzibar 30.6 30.4 26.9 38.1
Sex
Female 40.7 34.2 37.8 32.1
Male 45.6 35.3 40.1 36.4
4.7 Wasting
Wasting (low weight for height) is a measurement of acute malnutrition characterized by
considerable weight loss or failure to gain weight, resulting in a child having a weight substantially
below what would be expected of a healthy child of the same height. Wasting indicates current
malnutrition and can change quickly over time; even showing marked seasonal patterns associated
with changes in food availability and disease prevalence.
In NPS 2014/15, 5.1 percent of children under-five years of age in Tanzania were wasted, which is
an increase of 0.9 percentage point compared to NPS 2012/13. In NPS 2008/09, 2.7 percent of
under-five children were found to be wasted. In NPS 2014/15 wasting was more prevalent in urban
areas than in rural areas. With exception of NPS 2014/15 Zanzibar had higher wasting rates than
Mainland in all other NPS rounds. In addition, the findings across all NPS rounds except for the
2008/09 round show that wasting affects female children more than males.

National Panel Survey Wave 4 Report
31
Table 4.5: Percentage of Wasting (weight for height) of Children Under 5 Years by Area and Sex
Area/Sex NPS 2008/09 NPS 2010/11 NPS 2012/13 NPS 2014/15
Tanzania 2.7 6.6 4.2 5.1
Rural 2.9 6.8 4.2 4.8
Urban 1.5 5.9 4.3 6.0
Mainland 2.6 6.5 4.1 5.2
Dar es Salaam 0.9 5.4 3.5 6.7
Other Urban (Mainla(Mainland) 1.3 6.0 4.3 5.9
Rural 2.9 6.7 4.1 4.8
Zanzibar 7.0 9.8 7.7 3.2
Sex
Female 2.7 6.8 4.5 5.4
Male 2.7 6.3 3.9 4.9

National Panel Survey Wave 4 Report
32

National Panel Survey Wave 4 Report
33
CHAPTER FIVE
Growth and Reduction of Poverty
5.0 Introduction
The chapter presents the analysis of some key indicators in poverty reduction strategies and other
socio-economic variables that in general reflect different levels in the country in order to attain
national and global targets. Issues covered under this chapter are inflation, wealth based on real
consumption, inequality and unemployment. An attempt has been made to compare findings from
the NPS 2012/13 with NPS 2014/15. However, it is worth mentioning here that the NPS rounds are
similar in terms of methodology employed (i.e. data collection, processing, etc.). However the
sample involved in the NPS 2014/15 was re-visited thus bringing in substantial number of new
households while some few households were maintained (tracked) from the previous three rounds
of NPS (2008/09, 2010/11 and 2012/13). Furthermore, to facilitate comparison across NPS rounds,
the base year prices are those of the NPS 2010/11.
5.1 Inflation
Inflation is an important measure that reflects the costs of living in a given country. It reveals the
rate at which prices of basket of goods and services are changing from a reference period. Prices of
basic goods and services are to be monitored closely, mainly because unstable prices erode real
value of wages, profits, and consumption. Uncontrolled prices also pose heavy challenges on the
general management of the country’s economy and it discourages investments mainly due to high
inflation rates. Inflation should, therefore, be maintained at reasonably low and stable levels.
It should be noted that the official reference for inflation figures in Tanzania is the Consumer Price
Index (CPI) released monthly. Producing other inflation numbers from the NPS would lead into
dilemma as to which one to use. Using any between CPI and NPS inflation numbers would be left
to one’s self-choice but it is important to make clear the merits and demerits of each.
The first advantage of using the NPS data is that it is possible to produce price indices across urban
and rural strata, and across Mainland and Zanzibar. In contrast, the CPI is mainly an urban price
index that is produced separately for the Mainland and for Zanzibar. A second advantage is that
with the NPS, the weights of the price indices are updated in each round, a feature that might reflect
the consumption pattern of the population more accurately than the CPI weights, which uses
weights from the Household Budget Survey (HBS) conducted every five years. The third
advantage, which is particularly relevant for welfare comparisons, refers to the fact that the NPS
allows the construction of price indices that take into account temporal and spatial price

National Panel Survey Wave 4 Report
34
differences, whereas the CPI reflects only temporal price differences.
On the other hand, the differences and disadvantages are related to data collection issues. The first
difference is that the NPS interviews households in urban and rural areas, while the CPI visits the
same outlets only in urban areas in each region. Another difference is that the CPI collects price
data only. For all food items the NPS gathers information from the households on the amount spent
and on the quantity purchased. A measure of unit values, rather than a measure of prices, is
obtained by dividing the expenditure by the quantity. A major disadvantage is that unit values can
only be calculated for food items because the survey does not collect information on quantities for
non-food items. Last, the third major disadvantage is unit values, unlike CPI prices; NPS also
reflect the mixture of varieties within each commodity. The NPS collects information on 59 food
items, and even though the list could be considered detailed, most of these goods are not
completely homogeneous. In contrast, the CPI bundle could be fairly specific, and it is not unusual
for some items to even refer to a particular brand.
Food price indices based on the NPS are shown in Table 5.1. The left panel of the table displays the
spatial price differences in each round of the NPS. The underlying assumption is that if the cost of a
food bundle in Tanzania stands at 100, then how does the cost change across the country? Rural
areas were less expensive than the National average in NPS 2014/15, while urban areas were more
expensive than the National average. When comparing Mainland with Zanzibar, prices in the
former are similar to those for the entire country, whereas in the latter prices are lower than the
national average. Across strata, Dar es Salaam is the most expensive stratum followed by Other
Urban areas in Mainland. Zanzibar and rural areas in Mainland are the two least expensive strata.
Overall, spatial price differences have revealed a significant change between the two rounds with
an increase in urban areas and a decrease in rural areas. As for Zanzibar prices have almost
remained constant.
The right panel of Table 5.1 shows the inflation between both rounds of the NPS. If the cost of a
food bundle stood at 100 during the NPS 2012/13 (October 2012 to September 2013), what is the
percentage change in the cost of that bundle compared to the NPS 2014/15 (October 2014 to
September 2015)? Food prices have increased by 41 percent between the NPS 2012/13 and the
NPS 2014/15 compared with a 34 percent increase between the NPS 2010/11 and the NPS 2012/13.

National Panel Survey Wave 4 Report
35
Table 5.1: Spatial and Temporal Food Prices
Area
Differences in the cost of living in each
round (spatial price indices)
Increase in the cost of living between
rounds
NPS 2012/13 NPS 2014/15
Inflation between
NPS 2010/11 and
the NPS 2012/13
Inflation between
NPS 2012/13 and
the NPS 2014/15
Tanzania 100 100 0.34 0.41
Urban 92 107 0.34 0.38
Rural 108 89 0.30 0.35
Tanzania Mainland 100 100 0.34 0.41
Dar es Salaam 109 113 0.23 0.37
Other Urban 102 100 0.33 0.38
Rural 93 88 0.36 0.37
Zanzibar 90 91 0.12 0.22
5.2 Wealth Based on Real Consumption
The following section presents the average annual consumption values in real terms for any given
adult equivalent wealth quintile. As nominal consumption in each round of the NPS is adjusted for
temporal and spatial price differences, real consumption is thus expressed in Tanzanian prices
(TZS) and is used for analysis in this section. To facilitate comparison across NPS rounds,
consumption values have been standardized to the base year of NPS 2010/11. Consumption is the
preferred measure of welfare as it is a stable and easy concept for respondents to report on, and thus
more likely to be an accurate measure of living standards than income would offer.
In NPS 2014/15, the highest average annual consumption was observed in Dar es Salaam for each
of the wealth quintiles. The lowest average consumption was typically reported in Mainland rural
areas, with the exception of the richest quintile where the lowest average consumption was detected
in Zanzibar (Figure 5.1). Additional analyses present consumption over time within areas of
Tanzania (Figures 5.2 - 5.6).

National Panel Survey Wave 4 Report
36
Figure 5.1: Average Annual Consumption (real) by Quintile and Area, NPS 2014/15
* Consumption values are standardized to the base year of NPS 2010/11
Figure 5.2 presents average annual consumption in real terms within adult equivalent wealth
quintiles at the national level. Within each quintile, wealth as expressed by total real consumption,
varies considerably across the four rounds of the NPS. The two poorest quintiles experienced
relatively minimal movement over time, experiencing declines only between NPS 2008/09 and
NPS 2012/13 in the poorest quintile and between NPS 2010/11 and NPS 2012/13 in the second
quintile. The third and fourth quintiles again observed relatively minimal movement over time,
with no significant increases or decreases in wealth detected. Considerably larger declines were
observed in the richest quintile, with significant decreases between NPS 2008/09 and each
subsequent NPS round, despite a slight increase in NPS 2012/13. When considering overall
changes between NPS 2008/09 and NPS 2014/15, declines in consumption were only observed in
the poorest and richest quintiles, while increases were detected in the remaining quintiles.
Within each round of the NPS, the largest proportional changes in consumption were observed
between the fourth and fifth (richest) quintiles. Substantially smaller increases within each round
were observed between the two poorest quintiles as well as between the second and third quintiles.
An expansion, upon analysis at the national level, presents the average annual consumption value in
real terms within adult equivalent wealth quantiles for each of the four geographical domains of
inference in Tanzania (Dar es Salaam, Other Urban areas, rural, and Zanzibar) (Figures 5.3 - 5.6).

National Panel Survey Wave 4 Report
37
Figure 5.2: Average Annual Consumption (Real) by Quintile and NPS Round, Tanzania
* Consumption values are standardized to the base year of NPS 2010/11
Unlike the national level, overall decreases in consumption (between NPS 2008/09 and NPS
2014/15) were observed in each wealth quintile in Dar es Salaam, though these decreases were only
significant in the two richest quintiles. In addition, the decrease in consumption between NPS
2012/13 and NPS 2014/15 in the richest quintile is more pronounced in Dar es Salaam than at the
national level (Figure 5.3).
Figure 5.3: Average Annual Consumption (Real) by Quintile and NPS Round, Dar es Salaam
* Consumption values are standardized to the base year of NPS 2010/11
Figure 5.4 presents the average annual consumption in real terms within adult equivalent wealth
quintiles for urban areas of Mainland other than Dar es Salaam. The poorest quintile again
experienced relatively minimal movement over time, with no significant changes detected. A
substantial overall decrease between NPS 2008/09 and other NPS rounds was observed in the
richest quintile, similar to those noted in Dar es Salaam and at the national level.

National Panel Survey Wave 4 Report
38
Figure 5.4: Average Annual Consumption (Real) by Quintile and NPS Round, OtherUrban Mainland
* Consumption values are standardized to the base year of NPS 2010/11
Relatively minimal, insignificant movements were observed over time in the third and fourth
quintiles in rural areas of Mainland Tanzania while other quintiles experienced greater fluctuation.
The only significant changes were all observed in the poorest quintile, between NPS 2012/13 and
NPS 2014/15, NPS 2008/09 and NPS 2012/13, and NPS 2008/09 and NPS 2010/11. Overall
decreases between NPS 2008/09 and NPS 2014/15 were observed in each quintile except the third.
Within each NPS round, the largest proportional changes in consumption were observed between
the fourth and fifth (richest) quintiles (Figure 5.5).
Figure 5.5: Average Annual Consumption (Real) by Quintile and NPS Round, Mainland Rural
* Consumption values are standardized to the base year of NPS 2010/11

National Panel Survey Wave 4 Report
39
Figure 5.6 presents average total annual consumption as reported by households in real terms
within adult equivalent wealth quintiles for Zanzibar. The richest quintile presents the greatest
contrast to the other areas of Tanzania. Though the overall movement between NPS 2008/09 and
NPS 2014/15 was negative, a significant increase in consumption was observed between the first
two NPS rounds in the richest quintile. In addition, Zanzibar reported slight increases in
consumption in each of the quintiles.
Figure 5.6: Average Annual Consumption (Real) by Quintile and NPS Rounds, Zanzibar
* Consumption values are standardized to the base year of NPS 2010/11
5.3 Inequality
Inequality is a measure that reflects how the income is distributed among members of a given
community. In many cases information on one’s income has, for a number of reasons proved to be
of unreliable. For this reason, information on consumption and expenditure is used as a proxy to
income. Consumption is an ideal proxy to income due to the fact that one’s consumption is a
proportion of his/her income. Hence low inequality implies that consumption is equally distributed
among the population, whereas high inequality indicates that consumption is concentrated in a
relatively small group of the population.
The Gini coefficient is the most commonly used single measure of inequality of a population. It
ranges from 0 (meaning that every person has the same consumption) to 1 (meaning that one person
has all the consumption in the country).
The Gini coefficient was 0.39 in the NPS 2012/13 and was 0.37 in the NPS 2014/15 suggesting that
consumption inequality has declined slightly indicating a more equal consumption distribution than
it was in NPS 2012/13. This decline in inequality between the NPS 2012/13 and NPS 2014/15 was

National Panel Survey Wave 4 Report
40
observed in all strata whereby the decline is more apparent in Zanzibar than in the rest of the strata.
The decline in inequality was the smallest in Other Urban areas of the Mainland from 0.35 in NPS
2012/13 to 0.34 in NPS 2014/15. Zanzibar’s consumption inequality declined from 0.33 in NPS
2012/13 to 0.28 in NPS 2014/15. Out of the Mainland strata, in NPS 2014/15 Dar es Salaam had
the lowest consumption inequality (0.29) followed by rural areas (0.32), while Other Urban areas
had the highest inequality of 0.34 (Table 5.2).
Table 5.2: Gini Coefficient
Area
NPS 2010/11
NPS 2012/13
NPS 2014/15
Tanzania 0.37 0.39 0.37
Urban 0.31 0.36 0.33
Rural 0.37 0.34 0.32
Tanzania Mainland 0.37 0.39 0.37
Dar es Salaam 0.32 0.32 0.29
Other Urban 0.35 0.35 0.34
Rural 0.31 0.34 0.32
Zanzibar 0.31 0.33 0.28
The Gini coefficient is based on the Lorenz curve, which is a graphical method of assessing
inequality for the same population over time or across different groups of the population at one
point in time.
The Lorenz curve plots the cumulative percentage of the population in the horizontal axis (ranked
in ascending order of consumption) against the cumulative percentage of consumption in the
vertical axis. The closer the Lorenz curve is to a 45-degree line, the lower the level of inequality is,
while the closer the Lorenz curve is to the horizontal axis, the higher the level of inequality. Figure
5.7 presents Lorenz curves for the NPS 2010/11, NPS 2012/13 and the NPS 2014/15.
From the figure 5.7, the curves portrays a similar pattern to the findings of the Gini coefficients
with the curve for the NPS 2014/15 being closer to the 45-degree line than the curve for NPS
2010/11 and NPS 2012/13 which are relatively closer to the horizontal axis. This suggests that
inequality has declined over time.

National Panel Survey Wave 4 Report
41
Figure 5.7: Lorenz Curves of Consumption – Tanzania, NPS 2, NPS 3 and NPS 4
The Lorenz curves for Dar es Salaam reveal a decline in the inequality between NPS 2012/13 and
NPS 2014/15. The curve for NPS 2014/15 is closer to the 45-degree line than the one for NPS
2012/13.
Figure 5.8: Lorenz Curves of Consumption – Dar es Salaam, NPS 2, NPS 3 and NPS 4

National Panel Survey Wave 4 Report
42
In Other Urban areas, both curves (NPS 2012/13 and NPS 2014/15) are more aligned with the
horizontal axis implying more unequal consumption among Other Urban households compared to
the households in Dar es Salaam.
Figure 5.9: Lorenz Curves of Consumption – Other Urban Areas in Mainland, NPS 2, NPS 3 and NPS 4
5.4 Unemployment
The International Labour Organization’s standards that guide the gathering of information about
labour force participation rate involve individuals whose minimum age is 15 years old. The
reference period for these individuals’ economic activities is 7 days prior to the day of contacting
the targeted individual. Labour force comprises all economically active people, that is, people who
are employed or unemployed. The employed comprises people who worked for at least one hour in
the last seven days for wages, profits, barter, or in the family business for free. In addition it
includes those who did not work at all during the last seven days but have a job to which they will
definitely return to.
Labour force participation rate between the NPS 2012/13 and NPS 2014/15 has increased
throughout all strata as well as most age groups. Labour force participation rate is higher in rural
areas compared with urban areas. The Mainland labour force participation rate is likely to influence
the national average; the Zanzibar part of the United Republic of Tanzania has participation rates
below the national averages across all the rounds of the NPS.

National Panel Survey Wave 4 Report
43
Table 5.3: Labour Force Participation Rate (percent) by Area, Sex and Age Group (age >=15)
Area / Sex / Age Groups NPS 2008/09 NPS 2010/11 NPS 2012/13 NPS 2014/15
Tanzania 77.6 82.6 78.2 80.1
Rural 81.2 86.2 81.0 83.1
Urban 67.1 73.9 71.7 74.0
Mainland 78.0 83.1 78.7 80.5
Dar es Salaam 68.0 72.1 72.4 74.5
Other Urban 68.3 75.0 72.0 73.8
Rural 81.4 87.0 81.4 83.6
Zanzibar 64.1 65.2 62.5 67.3
Sex
Female 75.3 81.3 74.1 76.6
Male 80.1 84.0 82.6 84.0
Age Groups
15-24 57.7 66.1 65.1 67.1
25-34 89.2 93.4 87.0 87.9
35-64 92.1 95.8 90.0 90.4
65+ 67.0 72.0 61.6 61.1
On the other hand, labour force participation rates of youths (age 15 – 24 years), is unsurprisingly
lower than the rest of the age groups except for age group 65+ in NPS 2012/13 and NPS 2014/15.
This is mainly due to the fact that majority of the people in this age category, are students; very few
of them are in the labour market. For all the four NPSs, the participation rate kept increasing with
age until age 65 or above when, as expected, participation in the economic activities by this group
of people becomes lower mainly due old age (Figure 5.10).
Figure 5.10: Labour Force Participation Rate (Percent) among Different Age Groups, Tanzania
Labour force participation rate among persons aged 35 to 64 year was the highest (95.8 percent) in
NPS 2010/11 compared with the other three rounds. Participation rates were generally higher in the

National Panel Survey Wave 4 Report
44
NPS 2010/11 than the rest of the rounds across all the age groups except age group 15 to 24 years
where the highest participation rate was 67.1 percent for NPS 2014/15. On the contrary, NPS
2012/13 recorded the lowest labour force participation rates in all age categories and across all
rounds of NPSs except the age category of 15 to 24 years that recorded the lowest participation rate
of 57.7 percent in NPS 2008/09.
Unemployment is internationally defined as state whereby people fulfill three conditions: (a) did
not work in the last seven days and did not have a job to which they will return to, (b) were
available to work, and (c) were looking for a job. The ILO’s recommendations allow the relaxation
of the condition (c), i.e. looking for a job, especially in countries where a large proportion of the
population is engaged in subsistence agriculture and informal activities and generally have little
knowledge of labour market developments in the rest of the economy. Tanzania is characterized by
these conditions, and therefore uses a relaxed standard definition of unemployment. This approach
will be used in estimation of labour market indicators based on the NPS.
With exception of the NPS 2008/09, unemployment rate was highest in Zanzibar in the subsequent
rounds of NPS, followed by Dar es Salaam. In all rounds of NPS, unemployment rate has
persistently remained above 12 percent in Dar es Salaam and above 16 percent in Zanzibar in the
second, third and fourth rounds of NPS. In the first round of NPS, Zanzibar unemployment rate was
around 8 percent. As in the case of labour force participation rate, the rural stratum has the lowest
unemployment rates (not exceeding 2 percent) in each of the four rounds of NPS.
Concerning unemployment rates by age category, the youth age category (15 – 24 years) has higher
unemployment rates (not less than 5 percent) compared to the rest of the age categories. In the rest
of the age categories (25 to 34, 35 to 64, and 65+ years) and across all rounds of the NPS, the
highest unemployment rate (4.6 percent) was observed during NPS 2014/15 within the age group of
25 to 34 years (Table 5.4).
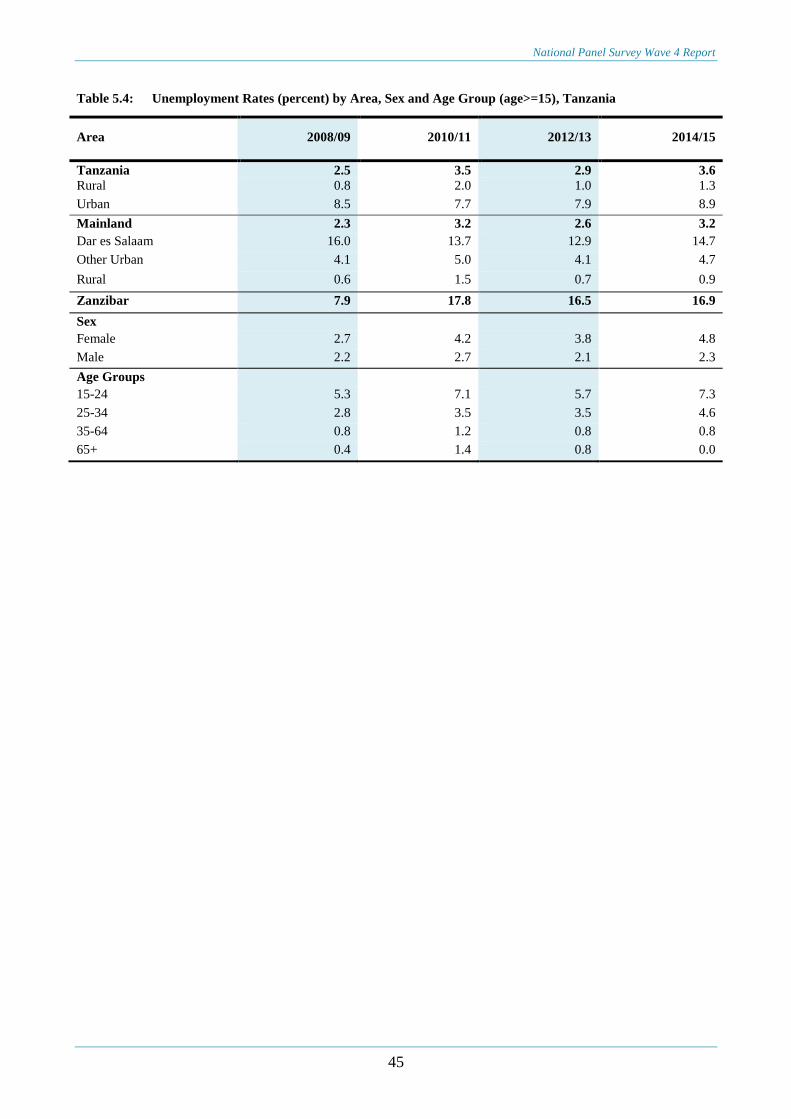
National Panel Survey Wave 4 Report
45
Table 5.4: Unemployment Rates (percent) by Area, Sex and Age Group (age>=15), Tanzania
Area 2008/09 2010/11 2012/13 2014/15
Tanzania 2.5 3.5 2.9 3.6
Rural 0.8 2.0 1.0 1.3
Urban 8.5 7.7 7.9 8.9
Mainland 2.3 3.2 2.6 3.2
Dar es Salaam 16.0 13.7 12.9 14.7
Other Urban 4.1 5.0 4.1 4.7
Rural 0.6 1.5 0.7 0.9
Zanzibar 7.9 17.8 16.5 16.9
Sex
Female 2.7 4.2 3.8 4.8
Male 2.2 2.7 2.1 2.3
Age Groups
15-24 5.3 7.1 5.7 7.3
25-34 2.8 3.5 3.5 4.6
35-64 0.8 1.2 0.8 0.8
65+ 0.4 1.4 0.8 0.0

National Panel Survey Wave 4 Report
46
National Panel Survey Wave 4 Report
47
CHAPTER SIX
Agriculture
6.0 Introduction
This chapter presents information on agriculture. The country’s economy is to a great extent
dependent on agriculture. The agricultural sector encompasses crop production, livestock keeping,
fisheries and forestry. According to the Economic Survey 2015, the agricultural sector contributed
29.0 percent of the National Gross Domestic Product (GDP) of which crop production contributed
15.6 percentage points, livestock 7.9 percentage points, forestry 3.5 percentage points and fisheries
2.1 percentage points. Agriculture is the leading sector in employment. In 2014 it accounted for
66.3 percent of persons with employment in the country (Integrated Labour Force Survey, 2014).
6.1 Households Involved in the Agricultural Sector
Almost seven in 10 households (69 percent) in NPS 2014/15 were cultivating some land (whether
owned or rented). In the NPS 2012/13, 71 percent of households cultivated some land.
Despite the abundance of unutilized land, small-scale subsistence farmers still dominate the
agricultural sector in Tanzania. They cultivate farm plots of 3 hectares on average, and 84 percent
of the farmers own less than 4 hectares of land. The majority are engaged in subsistence farming
with just one-third of the farmers selling some of their crops.
6.2 Changes in Production and Major Crop Yields over Time
Different agro-climatic areas and socio-economic conditions lead to significant differences in
cropping patterns and farming systems. The agriculture sector in Tanzania is dominated by few
main staple crops including maize, paddy, beans, cassava, Irish potatoes, sweet potatoes and
sorghum. However, maize and paddy are the only crops discussed in this chapter because they were
mentioned in the then MKUKUTA Monitoring Master Plan (MMMP).

National Panel Survey Wave 4 Report
48
Figure 6.1: Full Year (Masika and Vuli) Total Crop Production (Million Metric Tons), Tanzania
Findings presented in Figure 6.1 show that 5 million metric tons of maize and 1.4 million metric
tons of paddy were produced in NPS 2014/15. Compared to NPS 2012/13 maize production in
NPS 2014/15 increased by 1.8 million metric tons while that of paddy increased by 0.4 million
metric tons. Production of both crops was the highest in NPS 2014/15 compared with previous
rounds. Generally, findings from all rounds of NPS show that the production of maize is higher
than that of paddy.
Table 6.1: Average Yields of Maize (kg / area planted in hectares) by Type of Plot, Tanzania
Type of Plot
Using Farmer Reported Plot Areas
(Mean)
Using GPS-Based Plot Areas
(Mean)
NPS
2008/09
NPS
2010/11
NPS
2012/13
NPS
2014/15
NPS
2010/11
NPS
2012/13
NPS
2014/15
All Plots 782 794 779 1,064 930 858 1,207
Pure Stand Plots 907 878 893 1,297 1,048 962 1,419
Intercropped Plots 715 742 711 944 858 800 1,103
Plots with Organic Fertilizer 1,012 927 785 1,217 1,014 955 1,272
Plots with Inorganic Fertilizer 1,160 1,179 1,181 1,658 1,349 1,309 2,042
Plots with Any Fertilizer 1,066 1,058 982 1,433 1,170 1,101 1,590
In regards to famers reported plot areas, average yield of maize in all plots was 1,064 kg/ha in NPS
2014/15 compared with 779 kg/ha in NPS 2012/13, which is an increase of 285 kg/ha. For GPS-
based plot area, average yield of maize in all plots was 1,207 kg/ha in NPS 2014/15 compared with
858 kg/ha in NPS 2012/13, which is an increase of 349 kg/ha. Moreover, the average yield of maize
regardless of the type of plot was the highest in NPS 2014/15 compared with previous rounds
(Table 6.1).

National Panel Survey Wave 4 Report
49
Table 6.2: Average Yields of Paddy (kilogram / area planted in hectares) by Type of Plot, Tanzania
Type of Plot
Using Farmer Reported Plot Areas (mean) Using GPS-Based Plot Areas (mean)
NPS
2008/09
NPS
2010/11
NPS
2012/13
NPS
2014/15
NPS
2010/11
NPS
2012/13
NPS
2014/15
All Plots 1,313 1,340 1,277 1,742 1,594 1,379 1,672
Pure Stand Plots 1,438 1,431 1,381 1,832 1,721 1,527 1,809
Intercropped Plots 805 773 684 1,215 944 648 953
Plots with Organic
Fertilizer 1,967 2,412 2,229 1,811 2,733 1,951 1,712
Plots with Inorganic
Fertilizer 1,803 1,894 1,706 2,684 1,873 2,093 2,771
Plots with Any
Fertilizer 1,793 1,908 1,763 2,326 1,893 1,843 2,296
For farmers reported plot areas, the average yield of paddy in all plots was 1,742 kg/ha in NPS
2014/15 compared with 1,277 kg/ha in NPS 2012/13, which is an increase of 465 kg/ha. Likewise,
for GPS-based plot areas, average yield of paddy in all plots was 1,672 kg/ha in NPS 2014/15
compared with 1,379 kg/ha in NPS 2012/13, which is an increase of 293 kg/ha. Additionally, for
famers reported plot areas, it is observed that plots with organic fertilizer have higher average
yields than those with inorganic fertilizer in all NPS rounds except in the 2014/15 round. However,
using GPS-based plot areas, it is observed that plots with inorganic fertilizers reported higher
average yields than those with organic fertilizer in NPS 2012/13 and NPS 2014/15 (Table 6.2).
6.3 Households using Irrigation
According to the National Irrigation Master Plan (NIMP), the irrigation potential in Tanzania is
29.4 million hectares out of which 2.3 million hectares are high potential, 4.8 million hectares are
medium potential and 22.3 million hectares are low potential. Despite this potential, Tanzania’s
agriculture remains largely dependent on rainfall which is not reliable, resulting in low agricultural
performance. Irrigation helps to diversify income and reduce risk as it mitigates vulnerability from
unpredictable rainfall.
Finding presented in Table 6.3 show that in NPS 2014/15 only 3.1 percent of farming households
used irrigation in at least one of their fields, which is slightly lower than that reported in the NPS
2012/13 (3.4 percent). Across all NPS rounds it is observed that paddy fields are more likely to
use irrigation than maize fields. It is clear that in Tanzania, cultivation of crops, using irrigation is
still very low.

National Panel Survey Wave 4 Report
50
Table 6.3: Percentage of Households using Irrigation, Tanzania
Item NPS
2008/09
NPS
2010/11
NPS
2012/13
NPS
2014/15
Share of households using irrigation 4.2 3.4 3.4 3.1
Share of fields using irrigation (surface) 2.0 1.7 1.7 2.0
share of maize fields using irrigation (surface) 1.7 1.5 1.7 1.4
share of paddy fields using irrigation (surface) 4.3 3.6 5.6 2.1
Farming households use different methods of irrigation including flooding, sprinkler, drip
irrigation, bucket/watering can and water hose. Findings in Table 6.4 show that more than half of
farming households (51.0 percent) in NPS 2014/15 used flooding to irrigate crops while one third
(34.0 percent) of them used buckets/watering cans. The proportion of farming households that used
flooding as a means of irrigation decreased by 8 percentage points in NPS 2014/15 compared with
NPS 2012/13, while households that used buckets/watering cans increased by 11 percentage points
in the same period. The proportion of farming households that used flooding as a means of
irrigation decreased steadily between NPS 2010/11 and NPS 2014/15. No farming household used
drip irrigation to irrigate crops in NPS 2012/13 and NPS 2014/15. However, the usage of sprinkler,
drip irrigation and water hose was minimal compared to the usage of flooding and watering cans.
Table 6.4: Percentage of Households using Irrigation by Method, Tanzania
Method of Irrigation NPS 2008/09 NPS 2010/11 NPS 2012/13 NPS 2014/15
Flooding 66.0 69.0 59.0 51.0
Sprinkler 5.0 4.0 2.0 1.0
Drip irrigation 3.0 4.0 0.0 0.0
Bucket/watering can 25.0 16.0 23.0 34.0
Water hose 4.0 4.0 9.0 8.0
Other - 3.0 7.0 6.0
Different sources of water used by farming households for irrigation include wells, boreholes,
pond/tanks, and river/streams. Table 6.5 shows that 64.0 percent of farming households in NPS
2014/15 used rivers/streams as sources of water for irrigation compared with 78.0 percent in NPS
2012/13, which is a decrease of 12.0 percentages points. The proportion of households that used
wells as a source of water for irrigation increased by 2.0 percentages points in NPS 2014/5
compared with NPS 2012/13 (from 11.0 to 13.0 percent).
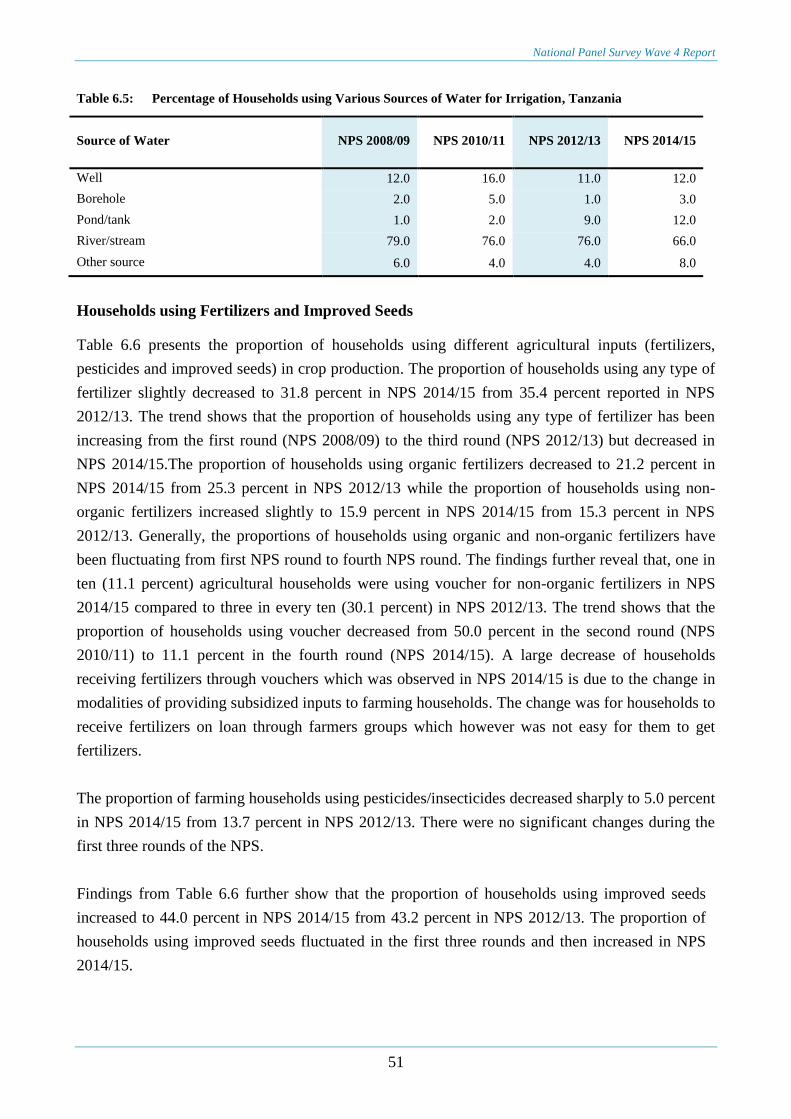
National Panel Survey Wave 4 Report
51
Table 6.5: Percentage of Households using Various Sources of Water for Irrigation, Tanzania
Source of Water NPS 2008/09 NPS 2010/11 NPS 2012/13 NPS 2014/15
Well 12.0 16.0 11.0 12.0
Borehole 2.0 5.0 1.0 3.0
Pond/tank 1.0 2.0 9.0 12.0
River/stream 79.0 76.0 76.0 66.0
Other source 6.0 4.0 4.0 8.0
Households using Fertilizers and Improved Seeds
Table 6.6 presents the proportion of households using different agricultural inputs (fertilizers,
pesticides and improved seeds) in crop production. The proportion of households using any type of
fertilizer slightly decreased to 31.8 percent in NPS 2014/15 from 35.4 percent reported in NPS
2012/13. The trend shows that the proportion of households using any type of fertilizer has been
increasing from the first round (NPS 2008/09) to the third round (NPS 2012/13) but decreased in
NPS 2014/15.The proportion of households using organic fertilizers decreased to 21.2 percent in
NPS 2014/15 from 25.3 percent in NPS 2012/13 while the proportion of households using non-
organic fertilizers increased slightly to 15.9 percent in NPS 2014/15 from 15.3 percent in NPS
2012/13. Generally, the proportions of households using organic and non-organic fertilizers have
been fluctuating from first NPS round to fourth NPS round. The findings further reveal that, one in
ten (11.1 percent) agricultural households were using voucher for non-organic fertilizers in NPS
2014/15 compared to three in every ten (30.1 percent) in NPS 2012/13. The trend shows that the
proportion of households using voucher decreased from 50.0 percent in the second round (NPS
2010/11) to 11.1 percent in the fourth round (NPS 2014/15). A large decrease of households
receiving fertilizers through vouchers which was observed in NPS 2014/15 is due to the change in
modalities of providing subsidized inputs to farming households. The change was for households to
receive fertilizers on loan through farmers groups which however was not easy for them to get
fertilizers.
The proportion of farming households using pesticides/insecticides decreased sharply to 5.0 percent
in NPS 2014/15 from 13.7 percent in NPS 2012/13. There were no significant changes during the
first three rounds of the NPS.
Findings from Table 6.6 further show that the proportion of households using improved seeds
increased to 44.0 percent in NPS 2014/15 from 43.2 percent in NPS 2012/13. The proportion of
households using improved seeds fluctuated in the first three rounds and then increased in NPS
2014/15.

National Panel Survey Wave 4 Report
52
Table 6.6: Percentage of Households Using Fertilizer, Improved Seeds and Pesticides, Tanzania
Item NPS 2008/09 NPS 2010/11 NPS 2012/13 NPS 2014/15
Any fertilizer 30.1 32.6 35.4 31.8
Using organic fertilizers 22.1 21.8 25.3 21.2
Using non-organic fertilizers 12.9 16.8 15.3 15.9
Using vouchers for non-organic fertilizers - 49.5 30.1 11.1
Using pesticides/insecticides 14.7 13.2 13.7 5.0
Improved seeds 21.4 18.0 43.2 44.0
Households using Mechanization and Labour-Saving Technologies
Majority of farming households in Tanzania are small farmers using hand hoes for cultivation.
The low level of mechanization among smallholder farmers leads to low expansion of agricultural
land. Given the abundant land supply, households’ ability to increase production through land
expansion depends on the extent to which they can hire labour or use mechanization (e.g. animal
traction, tractors, power tillers).
Table 6.7: Percentage of Households using Farming Technology by Type, Tanzania
Type of Technology
NPS 2008/09 NPS 2010/11 NPS 2012/13 NPS 2014/15
Own
item
Used
item
Own
item
Used
item
Own
item
Used
item
Own
item
Used
item
Hand hoe 98.0 95.8 96.6 91.6 97.9 95.7 97.8 97.9
Hand powered
sprayer 7.0 12.8 5.9 8.5 6.3 9.7 8.3 13.6
Ox plough 8.7 18.2 9.4 17.9 10.3 22.8 12.9 33.3
Ox seed planter 9.9 19.4 10.5 18.7 11.1 23.3 14.4 32.2
Ox cart 0.1 0.4 0.0 0.1 0.0 0.0 0.1 0.0
Tractor 2.4 7.7 2.4 5.1 2.5 6.3 3.3 8.9
Tractor plough 0.1 2.8 0.2 2.9 0.1 5.0 0.4 6.8
Tractor harrow 0.3 1.4 0.1 2.3 0.1 3.9 0.3 4.7
Sheller/thresher 0.1 0.1 0.0 0.0 0.1 0.2 0.1 0.3
Hand mill 0.5 1.1 0.1 0.1 0.1 0.2 0.2 0.8
Watering can 2.0 1.8 1.2 1.1 0.8 0.9 1.0 0.8
Farm buildings 7.5 7.2 6.8 6.6 5.6 5.1 6.1 5.8
Geri cans/drums 12.7 10.8 3.8 2.3 2.4 2.1 4.6 4.0
Power tiller - - - - 0.2 0.4 0.1 0.5
Other - - 31.7 10.0 31.7 31.3 55.7 53.8
One of the major drawbacks to farmers’ production and average yield is the reliance on hand hoe
in land cultivation. Table 6.7 reveals that the proportion of households owning tractors increased
to 3.3 percent in NPS 2014/15 from 2.5 percent reported in NPS 2012/13. The use of tractors in
land cultivation also increased to 8.9 percent in NPS 2014/15 from 6.3 percent in NPS
2012/13.All NPS rounds reported that more than 96 percent of households owned hand hoes and

National Panel Survey Wave 4 Report
53
more than 91 percent used them for land cultivation. It may further be observed that NPS 2014/15
reported a higher proportion of households using hand hoes than all previous rounds. The
proportion of households that possess animal traction (ox plough, ox seed planter) increased in
NPS 2014/15 compared with NPS 2012/13. Similarly, in the NPS 2014/15, the use of animal
traction increased compared to NPS 2012/13. There is also minimal usage of other farming
technologies including tractor plough, tractor harrow, thresher, watering cans and power tillers. In
general, findings reveal that the majority of households used hand hoes for land cultivation, which
limits cultivated land expansion, leading to low productivity.
Off-farm Income Generating Activities
Income from nonfarm sources increases the level of income in a farming household and therefore
makes the household more secure. Table 6.8 presents the proportion of households with income
from nonfarm sources. More than half (54.0 percent) of farming households earning income from
off-farm activities in NPS 2014/15 earn their income from wages. About a half (49.8 percent) of
farming households earning income from off-farm activities receive their income from self-
employment while four-fifth (80.8 percent) of them receive their income from either sources.
Generally, trends show that the proportion of farming households earning income from nonfarm
sources, have been increasing from the first round (NPS 2008/09). The findings in NPS 2014/15
reveal that farming households in urban areas are more likely to earn income from non-farming
sources than those in rural areas. The same trend is observed in other NPS rounds.
Table 6.8: Percentage of Farm Households Earning Income from Off-farm Activities by Survey, Source and
Area, Tanzania
Survey Source of income Rural Urban All
NPS 2008/9
Wage 34.1 45.0 35.4
Self-employment 34.6 54.7 36.9
Both Wage and Self-
employment 55.0 78.1 57.7
NPS 2010/11
Wage 43.8 50.7 44.8
Self-employment 38.9 60.5 42.1
Both Wage and Self-
employment 65.4 85.6 68.4
NPS 2012/13
Wage 46.4 52.8 47.2
Self-employment 37.2 55.8 39.7
Both Wage and Self-
employment 65.9 83.3 68.2
2014/15
Wage 50.7 60.3 54.0
Self-employment 42.3 64.1 49.8
Both Wage and Self-
employment 74.2 93.2 80.8

National Panel Survey Wave 4 Report
54

National Panel Survey Wave 4 Report
55
CHAPTER SEVEN
Food Security
7.0 Introduction
This section presents information on three food security indicators namely; the proportions of the
population worried about not having enough food, those with diet negatively affected, and
individuals reducing their actual food intake. Food security is the state at which all people, at all
times, have both physical and economic access to sufficient, safe, and nutritious food that meets
their dietary needs and food preferences for an active and healthy life.
The information used to analyse these three indicators refer to the seven days prior to the survey
interview. Only information from NPS 2010/11, NPS 2012/13, and NPS 2014/15 is presented. The
NPS 2008/09 did not cover the food security module.
Table 7.1 shows that from NPS 2012/13 to NPS 2014/15, each of the three indicators increased at
national level by from 1.6 to 3.0 percentage points. However, there was a decline of about 3
percentage points for each of the three indicators between NPS 2010/11 and NPS 2012/13.
Table 7.1: The Percentage of the Population Experiencing Three Food Security Indicators by Area
Area
Worried about not having
enough food Negative changes in diet Reduced food intake
NPS
2010/11
NPS
2012/13
NPS
2014/15
NPS
2010/11
NPS
2012/13
NPS
2014/15
NPS
2010/11
NPS
2012/13
NPS
2014/15
Tanzania 36.0 33.0 34.6 34.0 31.1 34.1 32.2 28.9 31.2
Rural 37.1 33.5 35.3 34.7 32.0 35.0 33.1 29.6 31.8
Urban 32.7 31.7 32.8 31.9 28.7 32.0 29.9 26.9 29.9
Mainland 36.3 33.5 35.0 34.4 31.8 34.9 32.5 29.3 31.6
Dar es Salaam 38.0 34.8 32.9 35.5 35.6 31.4 34.8 30.2 27.5
Other Urban 31.3 31.1 33.8 31.2 26.0 34.7 28.7 26.0 32.1
Rural 37.4 33.9 35.7 35.0 32.5 35.5 33.2 29.9 32.1
Zanzibar 24.8 14.8 18.9 22.3 8.6 7.7 24.1 14.5 18.5
The proportion of the population that worried about not having enough food in the last seven days
prior to the survey increased from 32.9 percent in NPS 2012/13 to 34.5 percent in NPS 2014/15.
Previously, the proportion of the population that felt food insecure had declined from 35.9 percent
in NPS 2010/11 to 32.9 percent in NPS 2012/13, before increasing in NPS 2014/15. Rural
populations are more likely to be worried about food security than those residing in urban areas,
although the gap seems to decrease over time. Relatively lower proportions of the population in

National Panel Survey Wave 4 Report
56
Zanzibar worry about not having enough food than in the Mainland or any of the Mainland strata.
In Dar es Salaam, there was a steady decrease over time in the proportion of the population worried
about food, while an increase was observed in the Other Urban Mainland areas in NPS 2014/15
compared with NPS 2012/13.
At the national level, a notable decrease was observed in the proportion of the population reporting
negative changes in their diet, from 34.0 percent in NPS 2010/11 to 31.1 percent in NPS 2012/13,
followed by an increase in NPS 2014/15(34.1 percent). Zanzibar and Dar es Salaam were the only
domains where this indicator decreased over time; all other areas experienced fluctuations similar
to the national level. Proportions of population reporting negative changes in diet were smaller in
urban than in rural areas. Similarly, they were smaller in Zanzibar than in the Mainland.
The proportion of the population that reduced their food intake decreased from 32.2 percent in NPS
2010/11 to 28.8 percent in NPS 2012/13, then increased to 31.2 percent in NPS 2014/15. In all
three NPS rounds, a noticeable decrease in the proportion of the population reducing their food
intake was observed only in Dar es Salaam. As is the case with each of the previous two indicators,
proportions of population reporting reduced food intake were consistently smaller in urban than
rural areas. Similarly, proportions of the population reporting reduced food intake were smaller in
Zanzibar than in the Mainland (Table 7.1).
While Table 7.1 presents independent estimates of the three primary food security indicators,
Figure 7.1 displays proportions of the population experiencing none of the three indicators and
Figure 7.2 presents proportions of the population experiencing all three indicators. Figure 7.1
shows that at the national level, the proportion of the population experiencing none of the three
food security indicators increased from 54.5 percent in NPS 2010/11 to 59.4 percent in NPS
2012/13, followed by a decrease of 3.6 percentage points to 55.8 percent in NPS 2014/15. There
were no significant movements in either direction for any stratum between NPS 2010/11 and NPS
2012/13 or between NPS 2012/13 and NPS 2014/15. Dar es Salaam was the only stratum that
experienced a steady increase over time in the proportion of the population experiencing none of
the three indicators. Notably, the largest proportions of the population experiencing none of the
indicators were found in Zanzibar in each round of NPS.

National Panel Survey Wave 4 Report
57
Figure 7.1: Percent of the Population Experiencing None of the Three Food Security Indicators by Area
Figure 7.2: Percent of the Population Experiencing All Three Food Security Indicators by Area
Changes over time in the proportion of the population experiencing all three indicators were less
notable than those experiencing none, with the exception of Zanzibar and Dar es Salaam. In both
Zanzibar and Dar es Salaam each of the three indicators decreased significantly between NPS
2010/11 and NPS 2014/15. However, in urban areas other than Dar es Salaam, the proportion of the
population experiencing all three-food security indicators increased over the same period (Figures
7.2).

National Panel Survey Wave 4 Report
58
7.1 Number of Meals
The number of meals taken in a day is an additional indicator of food security. Table 7.2 portrays
the average number of meals taken by adults and children for the three rounds of NPS (NPS
2010/11, NPS 2012/13 and NPS 2014/15). In NPS 2014/15, the average number of meals taken by
children remained the same as that of NPS 2012/13. However, a slight increase was observed in
number of meals taken by children from 2.8 in NPS 2010/11 to 2.9 in NPS 2012/13. The average
number of daily meals taken by adults was 2.7 in both NPS 2014/15 and NPS 2012/13. In NPS
2010/11, the average number of meals taken by adult per day was 2.6 (Table 7.2).
Table 7.2: Average Number of Meals Taken per Day by Adults and Children by Area
Area
Adult
Children
NPS
2010/11
NPS
2012/13
NPS
2014/15
NPS
2010/11
NPS
2012/13
NPS
2014/15
Tanzania 2.6 2.7 2.7 2.8 2.9 2.9
Rural 2.6 2.6 2.7 2.8 2.8 2.9
Urban 2.8 2.9 2.8 2.9 2.9 2.9
Mainland 2.6 2.7 2.7 2.8 2.9 2.9
Dar es Salaam 2.9 2.9 2.9 2.9 2.9 3.0
Other Urban 2.8 2.8 2.8 2.9 2.9 2.9
Rural 2.6 2.6 2.7 2.8 2.9 2.9
Zanzibar 2.6 2.6 2.6 2.7 2.8 2.9
Table 7.3 shows the population distribution by number of meals taken by adults. Food insecurity in
terms of daily meals taken by adults is low and almost similar across the country. In NPS 2014/15,
the proportion of adults taking only one meal was less than one percent (0.6 percent), at two meals
it was 28.2 percent and at three or more meals it was 71.2 percent. The decrease over time in the
proportion of adults taking one or two meals was complimented by the increase in the proportion of
adult taking three or more meals. The proportion of adults eating three or more meals a day
increased significantly at the national level, in rural areas, in the Mainland and in Other Urban
Mainland.

National Panel Survey Wave 4 Report
59
Table 7.3: The Percent of Population by the Average Number of Daily Meals and Area, Adults
Area
1 meal 2 meals 3 or more meals
NPS
2010/11
NPS
2012/13
NPS
2014/15
NPS
2010/11
NPS
2012/13
NPS
2014/15
NPS
2010/11
NPS
2012/13
NPS
2014/15
Tanzania 1.3 1.1 0.6 34.1 32.0 28.2 64.6 66.7 71.2
Rural 1.3 1.5 0.5 41.4 40.2 33.3 57.2 58.3 66.1
Urban 1.1 0.3 0.7 17.6 14.2 18.4 81.3 85.5 80.9
Mainland 1.3 1.1 0.6 34.0 31.9 27.9 64.8 66.9 71.5
Dar es Salaam 0.4 0.1 0.5 12.1 9.6 12.9 87.6 90.3 86.5
Other Urban
MainlandMai
nland
1.4 0.5 0.9 19.7 16.2 19.5 78.9 83.3 79.7
Rural 1.3 1.5 0.5 41.5 40.0 33.5 57.2 58.5 65.9
Zanzibar 1.7 0.1 0.0 39.6 40.9 37.9 58.6 59.0 62.1
In each round, the proportion of adult staking at least three meals per day was considerably larger
in urban than in rural areas. Across strata, the proportion of adults eating three or more meals per
day was substantially larger in Dar es Salaam and Other Urban Mainland higher than in rural
Mainland and Zanzibar (Table7.3).
Table 7.4: The Proportion of Population by the Average Number of Daily Meals and Area, Children (6-59
months)
Area
1 meal 2 meals 3 or more meals
NPS
2010/11
NPS
2012/13
NPS
2014/15
NPS
2010/11
NPS
2012/13
NPS
2014/15
NPS
2010/11
NPS
2012/13
NPS
2014/15
Tanzania 1.5 1.4 0.7 13.4 11.6 7.9 85.1 87.1 91.3
Rural 1.4 1.1 0.6 15.8 13.4 9.4 82.8 85.5 90.0
Urban 1.8 2.3 1.0 5.7 5.6 4.1 92.5 92.1 94.9
Mainland 1.5 1.4 0.7 13.2 11.4 7.8 85.4 87.2 91.5
Dar es Salaam 3.2 2.4 0.7 5.2 3.5 2.5 91.7 94.0 96.8
Other Urban
Mainland 1.3 2.4 1.2 6.0 6.5 3.6 92.8 91.1 95.1
Rural 1.4 1.1 0.6 15.6 13.2 9.5 83.1 85.7 89.9
Zanzibar 2.8 0.1 0.0 22.1 19.4 13.7 75.0 80.5 86.3
In NPS 2014/15, nine in ten children (91.3 percent) of age 6-59 months took three or more meals a
day, while only one in every ten (8.6 percent) children aged 6-59 months took one or two meals a
day (Table 7.4). The proportion of children who ate three or more meals a day increased
significantly at the national level, in rural areas and in Other Urban and rural Mainland. In each
NPS round, the proportion of children taking at least three meals a day is larger in urban than rural
areas. However, the difference between urban and rural areas was substantially smaller for children
than adults. Generally, it is apparent that children were taking a larger number of daily meals than
adults, and that less disparities are observed across geographical domains for children than for
adults (Tables 7.3 and 7.4).

National Panel Survey Wave 4 Report
60
7.2 Food Shortages
An additional food security indicator focuses on food shortages reported at any time in the 12
months period prior to the survey. This indicator presents the frequency of such events, and not the
duration or severity, i.e. a reported shortage may have lasted one day or forty days.
Table 7.5 displays the proportion of the population that did not have enough food to eat some times
in the 12 months prior to the survey. The proportion of the population experiencing food shortages
in the 12 months prior to the survey, increased significantly from 20.6 percent in NPS 2010/11 to
42.6 percent in NPS 2012/13. It remained at about the same level (42.1 percent) in NPS 2014/15.
Table 7.5: Percentage of the Population Experiencing Food Shortage and Average Number of Months of Food
Shortage Experienced in the 12 Months Prior to the Survey by Area
Area
Not enough to eat Average number of months with
food shortage
NPS
2010/11
NPS
2012/13
NPS
2014/15
NPS
2010/11
NPS
2012/13
NPS
2014/15
Tanzania 20.6 42.6 42.1 3.4 3.7 3.4
Rural 21.4 45.8 45.2 3.3 3.6 3.4
Urban 18.3 33.8 34.6 3.7 4.0 3.6
Mainland 20.9 43.7 43.1 3.4 3.7 3.4
Dar es Salaam 18.6 36.4 30.1 4.6 4.8 3.9
Other Urban 18.8 34.3 39.5 3.4 3.4 3.5
Rural 21.7 46.7 46.0 3.2 3.6 3.4
Zanzibar 8.5 6.9 9.8 2.9 4.5 2.5
The proportion of population experiencing food shortages increased significantly in NPS 2012/13
in each area of Tanzania except in Zanzibar. The proportion remained at almost the NPS 2012/13
level in NPS 2014/15 in all areas except Dar es Salaam where it decreased and Other Urban
Mainland and Zanzibar, where it increased. Compared with NPS 2012/13. Zanzibar reported the
smallest proportions of population experiencing food shortages while Rural Mainland reported the
largest proportions in all three rounds.
The average number of months in which household experienced food shortages increased
significantly from 3.4 months in NPS 2010/11 to 3.7 months in NPS 2012/13 and then decreased to
3.4 months in NPS 2014/15. The largest average number of months of food shortages (4.8 months)
was reported in Dar es Salaam in NPS 2012/13. In NPS 2014/15, Zanzibar reported the smallest
number of months of food shortage (2.5 months).
Figure 7.3 displays the proportion of the population reporting food shortage by month for each NPS
round. Each round illustrates a similar cyclical pattern across months of the year; it may be noted

National Panel Survey Wave 4 Report
61
that the proportion of the population reporting food shortages for each month increased over three
rounds for the first six months of the year while there was fluctuation in the remaining six months.
Figure 7.3: Percent of the Population Reporting Food Shortages in Tanzania by Month and NPS Round
Figures 7.4 and 7.5 display similar information for urban and rural areas. In rural areas the
proportions of the population reporting food shortages from January to May was higher in NPS
2014/15 than in NPS 2012/13 but from June to December the situation reversed and the proportions
were higher in NPS 2012/13 than in NPS 2014/15. In urban areas the proportions of population
reporting food shortages from February to July were larger in NPS 2014/15 than in NPS 2012/13
but in January and from August to December the situation reversed and the proportion were larger
in NPS 2012/13 than in NPS 2014/15.
Figure 7.4: Percent of the Population Reporting Food Shortages in Rural Areas by Month and NPS Round

National Panel Survey Wave 4 Report
62
Figure 7.5: Percent of the Population Reporting Food Shortages in Urban Areas by Month and NPS Round
Causes of Food Shortages
Table 7.6 illustrates the main causes of food shortages in Tanzania. In NPS 2010/11 and NPS
2012/13, drought/poor rain was the main cause of food shortages at the national level. However for
NPS 2014/15 the main cause of food shortages was lack of money, the proportion of the population
reporting drought and poor rains as a cause of food shortages decreased from 40.2 percent in NPS
2010/11 to 25.1 percent in NPS 2014/15. In terms of farming status of household the main cause of
food shortages for non-farming households was lack of money whereas for farming households the
main cause was drought/poor rain. Lack of money was also reported as cause of food shortages by
urban households while drought/poor rain was the main cause of food shortages reported by rural
households.

National Panel Survey Wave 4 Report
63
Table 7.6: Percentage of Households Reporting Food Shortage by Cause, Area, and Farming Status
Cause
Ta
nza
nia
Ru
ral
Urb
an
Ma
inla
nd
Da
r es
Sa
laa
m
Oth
er
Urb
an
Oth
er r
ura
l
Za
nzi
ba
r
Ho
use
ho
ld F
arm
ing
Sta
tus
No
n-f
arm
Ho
use
ho
ld
Fa
rm
Ho
use
ho
ld
Drought, poor rains
NPS 2010/11 40.2 45.4 21.0 39.9 2.8 27.2 45.3 65.4 15.4 44.7
NPS 2012/13 37.8 43.0 16.9 37.8 2.4 26.5 43.1 19.7 8.4 43.5
NPS 2014/15 25.1 29.4 9.1 25.2 1.3 12.6 29.5 3.2 5.1 28.9
Crop pest
NPS 2010/11 4.5 5.2 2.1 4.5 0.3 2.7 5.1 7.1 0.0 5.3
NPS 2012/13 2.2 2.5 0.7 2.2 0.0 1.1 2.5 3.0 0.0 2.6
NPS 2014/15 2.2 2.8 0.0 2.3 0.0 0.0 2.9 0.0 0.0 2.7
Small land size
NPS 2010/11 8.3 9.3 4.4 8.3 0.5 5.8 9.3 10.3 2.6 9.3
NPS 2012/13 5.2 6.3 1.2 5.3 0.2 1.8 6.3 1.2 0.8 6.1
NPS 2014/15 8.5 9.9 3.6 8.6 0.0 5.1 9.9 0.0 1.7 9.8
Lack of farm inputs
NPS 2010/11 10.9 12.1 6.5 11 1.7 8.1 12.3 1.7 1.0 12.7
NPS 2012/13 6.7 7.6 3.0 6.7 0.1 5.0 7.6 0 0.5 7.9
NPS 2014/15 10.5 11.1 8.3 10.5 0.5 11.5 11.1 6.8 0.3 12.4
Expensive food
NPS 2010/11 12.1 9.4 21.9 12.2 26.2 20.3 9.5 0.4 27.2 9.3
NPS 2012/13 10.5 8.0 20.6 10.5 24.8 17.8 8.0 6.5 23.3 8.0
NPS 2014/15 8.1 5.9 16.2 8.1 17.7 16.1 5.9 1.0 17.3 6.3
No money
NPS 2010/11 11.3 7.6 25.0 11.3 44.5 18.3 7.5 12.5 27.8 8.3
NPS 2012/13 28.1 23.4 46.6 27.9 58.2 38.7 23.3 63.8 52.3 23.4
NPS 2014/15 35.7 30.1 56.3 35.5 78.1 46.6 30.1 76.8 67.1 29.8
Other
NPS 2010/11 12.7 11 19.2 12.9 24.0 17.5 11.1 2.6 26.0 10.3
NPS 2012/13 9.6 9.2 11.1 9.6 14.3 9.1 9.2 5.8 14.9 8.6
NPS 2014/15 9.8 10.8 6.4 9.8 2.4 8.1 10.7 12.2 8.5 10.1
Lack of money was not a major cause of food shortages in NPS 2010/11 and NPS 20112/13,
though it appears that in the latest round (NPS 2014/15) the limited monetary resources is
considered to be a major cause of for food shortages for all domains, farming and non-farming
households.
7.3 Food Security and Poverty
Figure 7.6 shows the proportion of the population that is food insecure within adult equivalent
wealth quintiles. Food insecure is defined as experiencing all three indicators (i.e. Worried about
not having enough food, Negative changes in diet and Reduced food intake) in the past seven days
prior to the survey. In NPS 2010/11, 33.6 percent of the population in the lowest quintile was food
insecure, decreasing to nearly 31.0 percent in NPS 2012/13, before increasing to 33.0 percent in
NPS 2014/15. A noticeable decrease in the proportion of population that was food insecure was
observed in the highest wealth quintile from 15.7 percent in NPS 2010/11 to 12.5 percent in NPS
2012/13 before stabilizing at around 12.6 percent in NPS 2014/15.

National Panel Survey Wave 4 Report
64
A significant increase over time was observed in the second wealth quintile of the population,
whereby just 19.6 percent of the population was food insecure in NPS 2012/13 compared with 25.1
percent in NPS 2014/15.
Figure 7.6: Percent of the Population that is Food Insecure, by Wealth Quintiles, Tanzania

National Panel Survey Wave 4 Report
65
APPENDICES
Appendix A: Methodology for Consumption Aggregates
This Appendix explains the steps involved in the construction of the consumption measure and describes the
estimation of the nominal household consumption. The methodology used for the NPS2014/2015 is identical
to the methodology used in all three of the previous rounds so that the aggregates are comparable over time.
Section 1 describes the estimation of the nominal household consumption. Section 2 is concerned with the
spatial and temporal price adjustment and Section 3 deals with the household composition adjustment.
1. The Construction of the Consumption Aggregate
Creating the consumption aggregate is guided by theoretical and practical considerations. First, it must be as
comprehensive as possible given the available information. Omitting some components assumes that they do
not contribute to people's welfare or that they do not affect the ranking of the population. Second, market
and non-market transactions are to be included, which means that purchases are not the sole component of
the indicator. Third, expenditure is not consumption. For perishable goods, mostly food, it is usual to assume
that all purchases are consumed. However, for other goods and services, such as housing or durable goods,
corrections have to be made. Fourth, a common reference period should be chosen. Typically each
consumption module in a survey has a different reference period, for instance, education could refer to the
last 12 months, food could refer to the last week, and health could refer to the last month. Following
common practice in Tanzania, consumption will be reported per 28 days.
1.1 Food Component
A few general principles are applied in the construction of this component. First, all possible sources of
consumption are included. This means that the food component comprises not only consumption from
purchases in the market or from meals eaten away from home but also food that was produced by the
household or received as a gift. Second, only food that was actually consumed, as opposed to total food
purchases or total home-produced food, enters into the consumption aggregate. Third, non-purchased
consumed food needs to be valued and included in the welfare measure. The NPS gathers information on the
amount spent on purchases and on the quantity purchased for all food items. A measure of prices, or rather a
measure of unit values, can be obtained by dividing the expenditure by the quantity and can be used to value
own-consumption or food received as a gift.
1.2 Non-food Component
Data on an extensive range of non-food items are available: utilities such as water, kerosene, electricity,
health, transportation, communications, recreation, education, furnishings, personal care, etc. Unlike food,
the NPS only collects data on purchases of non-food items, that is, the survey assumes that the consumption
of non-food goods and services coming from own-production, from gifts or from other sources is negligible
and can be ignored. In addition, the NPS does not gather information on quantities purchased because most
non-food items are too heterogeneous to try to calculate prices.
Each non-food component is associated with a particular reference period, which reflects the frequency of
that purchase or consumption. For instance, expenses on public transportation are collected for the last seven
National Panel Survey Wave 4 Report
66
days, expenses on mobile phones and personal care are collected for the last month, and expenses on
furnishings and small appliances for the last twelve months.
The information about some non-food goods and services needs to be excluded from the consumption
aggregate because those items are not consumption. Payments of mortgages or debts are financial
transactions and not consumption. Losses to theft are neither expenditure nor consumption. Remittances to
other households are expenditures but not consumption. Expenditures on marriages, dowries, births and
funerals are consumption but given their sporadic nature and the fact that the reported amounts are typically
rather large, this consumption is left out to avoid overestimating the true level of welfare of the household.
1.3 Durable Goods
Ownership of durable goods could be an important component of the welfare of the households. Given that
these goods last for many years, the expenditure on purchases is not the proper indicator to consider. The
right measure to estimate, for consumption purposes, is the stream of services that households derive from
all durable goods in their possession over the relevant reference period. This flow of utility is unobservable
but it can be assumed to be proportional to the value of the good. Information on the number of durable
goods owned, their age, and their value (current or original) is required to estimate this component of
consumption. Unfortunately, the NPS only provides data on the number of durable goods owned by the
household. Calculating this consumption component would have involved making assumptions about their
age, their current value and their lifespan. This might have resulted in an extremely imprecise estimation,
thus it was decided to exclude this component from the consumption aggregate.
1.4 Housing
Housing conditions are considered to be an essential part of people's living standards. Nonetheless, in most
developing countries limited or non-existent housing rental markets pose a difficult challenge for the
estimation and inclusion of this component in the consumption aggregate. As in the case of durable goods,
the objective is to measure the flow of services received by the household from occupying its dwelling.
When a household lives in a rented dwelling, and provided rental markets function well, that value would be
the actual rent paid. If enough families rent dwellings, imputations can be made for those families that own
their dwelling. It is common to include a question for homeowners asking them to provide the hypothetical
rent they would pay for renting their dwelling. These self-reported rents can in principle be used to value the
consumption the household gets from occupying its dwelling, but these amounts are not always credible or
usable, particularly in rural areas where very few households rent. If imputed rents cannot be estimated,
actual rents must be excluded from the consumption aggregate for the sake of consistency. The NPS does
not collect information on imputed rents and given that the number of households living in rented dwellings
is fairly small, this component is excluded from the consumption aggregate.
2. Price Adjustment
Nominal consumption of the household must be adjusted for cost-of-living differences. Temporal and spatial
price adjustments are required to adjust consumption to real terms. Temporal differences are associated with
the duration of the fieldwork (TSh 1,000 in October 2012 may not have the same value as in August 2013)
as well as with the different recall periods (TSh 1,000 spent in the last month may not have the same value
as in the last quarter or in the last year). Spatial differences are associated with the location of households
interviewed in the survey (TSh 1,000 in Dar es Salaam may not have the same value as in Ruvuma).

National Panel Survey Wave 4 Report
67
The price index required to adjust nominal consumption could come partly or fully from the NPS. A price
index is a combination of prices and budget shares in a base and a comparison period. The budget shares are
the weights that each commodity has in the index and are equivalent to their share in the cost of the bundle
being analysed. The NPS can provide information on budget shares for all items, but information on prices
(unit values) only for food items. Two possible price indices could be constructed: a price index based only
on food items (the assumption would be that non-food items show the same temporal and spatial differences
than food items) or a price index that takes into account both food and non-food by combining information
from the survey (food prices, food weights and non-food weights) and the official consumer price index
(non-food prices).
Fisher price indices based only on food items are employed to adjust the nominal consumption aggregate for
spatial and temporal price differences. Fisher price indices do a better job than Laspeyres or Paasche price
indices at capturing differences in consumption patterns across domains as a consequence of differences in
relative prices. They also avoid overstating or understating the true inflation (as would be the case with
Laspeyres and Paasche respectively).2Price indices are estimated by stratum and quarter (a period of three
consecutive months) and the base period comprises the entire period of each round of the NPS – that is, price
indices were calculated separately for each round. A price index by stratum and month would have been
ideal, but complications arose with the sample size because in some combinations of stratum and month few
households are interviewed. Price indices by stratum and quarter might not be as precise as price indices by
stratum and month but they provide more robust results. Fisher price indices by stratum and quarter are
constructed using the following formula:
Fi = LiPi
Whereiis a combination of stratum and quarter, L refers to a Laspeyres price index and P refers to a Paasche
price index. The Laspeyres and Paasche price indices are defined as
Li = w0k
k=1
n
åpik
p0k
æ
è ç
ö
ø ÷ ,Pi = wik
k=1
n
åpik
p0k
æ
è ç
ö
ø ÷
-1é
ë
ê ê
ù
û
ú ú
-1
Wherew0k is the average household budget share of item k in the country, wik is the average household
budget share of item k in stratum and quarter i, p0k is the national median price of item k and pik is the
median price of item k in stratum and quarter i.
Food items purchased by at least 10 households by stratum and quarter are included in the construction of
the price indices. Residual or catch-all food categories are also excluded because their unit values effectively
mix several items. The share of the bundle considered for the price indices with respect to total food
consumption is similar in both rounds of the NPS: it stands at around 67% at the national level and goes
from 63% in rural Mainland to more than 80% in Dar es Salaam and Zanzibar. Median unit values are
estimated for the price indices because the median is less sensitive to outliers than the mean.
2See Deaton and Tarozzi (2000).

National Panel Survey Wave 4 Report
68
Table A1: Fisher Food Price Indices by Stratum and Quarter, NPS 2008/08, NPS 2010/11, NPS 2012/13 and NPS
2014/15
Area / NPS 2008-09 Oct-Dec 2008 Jan-Mar 2009 Apr-Jun 2009
2009
Jul-Sep 2009
2009
Dar es Salaam 1.08 1.18 1.20 1.15
Other Urban Mainland 1.00 1.04 1.04 1.04
Rural Mainland 0.92 0.86 0.92 0.96
Zanzibar 1.03 1.06 1.07 1.07
Area / NPS 2010-11 Oct-Dec 2010 Jan-Mar 2011 Apr-Jun 2011
2011
Jul-Sep 2011
2011
Dar es Salaam 1.05 1.11 1.17 1.18
Other Urban Mainland 0.90 0.97 1.06 1.08
Rural Mainland 0.87 0.86 0.98 1.02
Zanzibar 0.89 0.98 1.06 1.07
Area / NPS 2012-13 Oct-Dec 2012 Jan-Mar 2013 Apr-Jun 2013
2011
Jul-Sep 2013
2011
Dar es Salaam 1.12 1.17 1.13 1.07
Other Urban Mainland 0.99 1.04 1.02 0.93
Rural Mainland 0.95 0.94 1.00 0.93
Zanzibar 0.88 0.91 0.93 0.99
Area / NPS 2014-15 Oct-Dec 2014 Jan-Mar 2014 Apr-Jun 2015
2011
Jul-Sep 2015
2011
Dar es Salaam 1.00 1.09 1.17 1.20
Other Urban Mainland 0.93 0.98 1.00 1.04
Rural Mainland 0.93 0.85 0.99 0.90
Zanzibar 0.90 0.88 0.88 1.01
Note: The base period for the NPS 2008/09 is Tanzania October 2008 - September 2009, for the NPS 2010/11 it is Tanzania
October 2010 – September 2011 and for the NPS 2012/13 it is Tanzania October 2012 – September 2013.

National Panel Survey Wave 4 Report
69
2.1 Updating Monetary Figures across Rounds of the NPS
Price indices will also be required to update monetary figures across both rounds of the NPS. The price
indices from Table A1 are used to adjust nominal consumption for cost of living differences within each
round of the NPS. Yet it would not be correct to compare real consumption at NPS 2008/09 prices with real
consumption at NPS 2010/11 prices or NPS 2012/13 prices or NPS 2014/15 prices.
Fisher price indices based only on food items are employed to adjust consumption for spatial and temporal
price differences across rounds of the NPS. It is assumed that non-food goods and services show the same
temporal and spatial price differences across rounds than food items. Price indices are estimated for the
entire country and for the full extent of each round: in the case of the NPS 2014/15, the base period is the 12
months of the NPS 2010/11 and the comparison period is the 12 months of the NPS 2014/15.
Food items purchased by at least 50 households in the country are included in the construction of the price
indices. As with the previous price indices, residual food categories are also excluded and median rather than
mean unit values are used. The share of the bundle considered for the price indices with respect to total food
consumption is similar in both rounds of the NPS: it stands at around 98 percent. The Fisher food price
index between the NPS 2010/11 and the NPS 2014/15 is estimated at 1.41, that is, the cost of an average
food bundle consumed in the country increased by 1.41% between those two rounds of the NPS. This
inflation will be employed to adjust the consumption aggregate and the poverty lines across the NPS
2010/11 and the NPS 2014/15.
3. Household Composition Adjustment
The final step in constructing the welfare indicator involves going from a measure of standard of living
defined at the household level to another at the individual level. Ultimately, the concern is to make
comparisons across individuals and not across households. Two types of adjustments have to be made to
correct for differences in composition and size. The first relates to demographic composition. Household
members have different needs based mainly on their age and sex, although other characteristics can also be
considered. Equivalence scales are the factors that reflect those differences and are used to convert all
household members into “equivalent adults”. For instance, children are thought to need a fraction of what
adults require, thus if a comparison is made between two households with the same total consumption and
equal number of members, but one of them has children while the other comprises only adults, it could be
expected that the former will have a higher individual welfare than the latter. Unfortunately there is no
agreement on a consistent methodology to calculate these scales. Some are based on nutritional grounds, but
while a child may need only 50percentof the food requirements of an adult, it is not clear why the same scale
should be carried over non-food items. It may very well be the case that the same child requires a larger
proportion than the adult in education or clothing.3
The second adjustment focuses on the economies of scale in consumption within the household. The
motivation for this is the fact that some of the goods and services consumed by the household have
characteristics of “public goods”. A good is said to be public when its consumption by a member of the
household does not necessarily prevent another member from consuming it as well. Examples of these goods
could be housing and durable goods. For example, one member watching television does not preclude
another from watching too. Larger households may need to spend less to be as well-off as smaller ones.
3See Deaton and Muellbauer (1986) or Deaton (1997).

National Panel Survey Wave 4 Report
70
Hence, the bigger the share of public goods in total consumption is, the larger the scope for economies of
scale is. On the other hand, private goods cannot be shared among members – once one household member
has consumed them, no other member can. Food is the classic example of a private good and, for instance, in
poor economies, where food represents a sizeable share of the household budget, little room exists for
economies of scale.
Consumption analysis in Tanzania employs an adult-equivalent scale to implement these two adjustments
(see Table A2). In general, children are thought to consume less than adults and women less than men. An
alternative and common practice would have been to use a per capita adjustment for household composition.
This is a special case of both adjustments and implies that children consume as much as adults and there is
no room for economies of scale. In other words, all members within the household consume equal shares of
the total consumption and costs increase in proportion to the number of people in the household. In general,
per capita measures will underestimate the welfare of households with children with respect to families with
no children, and the welfare of large households with respect to families with a small number of members.
Table A2: Adult-equivalent Scale by Gender and Age
Age (years) Male Female
0-2 0.40 0.40
3-4 0.48 0.48
5-6 0.56 0.56
7-8 0.64 0.64
9-10 0.76 0.76
11-12 0.80 0.88
13-14 1.00 1.00
15-18 1.20 1.00
19-59 1.00 0.88
60 or more 0.80 0.72

National Panel Survey Wave 4 Report
71
Table A3: Food Bundle per Adult Equivalent per Day, Tanzania NPS 2014/15
Kilocalories
per kg.
Quantity
per kg.
Kilocalories
provided
Price
per kg.
(TZS)
Value per
day (TZS)
Total per adult equivalent per day
2200
940.0
1 Rice (paddy) 3,610 0.0058 21 304 1.8
2 Rice (husked) 3,640 0.0413 150 1,611 66.6
3 Maize (green, cob) 1,650 0.0160 26 470 7.5
4 Maize (grain) 3,680 0.0258 95 592 15.3
5 Maize (flour) 3,680 0.2624 966 894 234.5
6 Millet and sorghum (grain) 3,450 0.0009 3 588 0.5
7 Millet and sorghum (flour) 3,450 0.0171 59 1,074 18.3
8 Bread 2,610 0.0016 4 2,106 3.5
9 Buns, cakes and biscuits 4,500 0.0057 26 2,040 11.6
10 Macaroni, spaghetti 3,420 0.0004 1 2,030 0.7
11 Other cereal products 3,700 0.0003 1 1,915 0.5
12 Cassava fresh 1,490 0.0290 43 616 17.8
13 Cassava dry/flour 3,440 0.0480 165 537 25.8
14 Sweet potatoes 1,050 0.0596 63 564 33.6
15 Yams/cocoyams 1,180 0.0034 4 346 1.2
16 Irish potatoes 790 0.0077 6 1,020 7.8
17 Cooking bananas, plantains 1,350 0.0315 42 739 23.3
18 Sugar 4,000 0.0135 54 2,147 29.0
19 Sweets 3,750 0.0000 0 12,285 0.4
20 Honey, syrups, jams, marmalade, jellies, canned fruits 4,000 0.0005 2 1,339 0.6
21 Peas, beans, lentils and other pulses 3,330 0.0366 122 1,928 70.6
22 Groundnuts in shell/shelled 5,670 0.0104 59 1,915 20.0
23 Coconuts (mature/immature) 3,760 0.0063 24 1,052 6.7
24 Cashew, almonds and other nuts 5,740 0.0003 2 5,368 1.6
25 Seeds and products from nuts/seeds (excl. Cooking oil) 5,920 0.0001 1 0 0.0
26 Onions, tomatoes, carrots and green pepper, other viungo 240 0.0354 9 1,319 46.7
27 Spinach, cabbage and other green vegetables 170 0.0452 8 827 37.4
28 Canned, dried and wild vegetables 130 0.0098 1 1,108 10.9
29 Ripe bananas 920 0.0060 6 1,072 6.5
30 Citrus fruits (oranges, lemon, tangerines, etc.) 390 0.0030 1 1,015 3.0
31 Mangoes, avocadoes and other fruits 550 0.0204 11 792 16.1
32 Sugarcane 4,000 0.0095 38 369 3.5
33 Goat meat 1,220 0.0037 4 4,703 17.3
34 Beef including minced sausage 1,150 0.0049 6 5,074 25.1
35 Pork including sausages and bacon 1,140 0.0005 1 5,368 2.7
36 Chicken and other poultry 1,390 0.0042 6 3,759 15.9
37 Wild birds and insects 1,390 0.0001 0 5,357 0.6
38 Other domestic/wild meat products 1,370 0.0005 1 2,771 1.4
39 Eggs 1,580 0.0005 1 4,618 2.5
40 Fresh fish and seafood (including dagaa) 820 0.0109 9 3,866 42.3
41 Dried/salted/canned fish and seafood (incl. Dagaa) 2,250 0.0045 10 4,229 18.8
42 Fresh milk 610 0.0218 13 901 19.7
43 Milk products (like cream, cheese, yoghurt etc) 2,170 0.0142 31 1,015 14.4
44 Cooking oil 8,840 0.0101 89 3,501 35.4
45 Butter, margarine, ghee and other fat products 7,190 0.0004 3 6,095 2.4
46 Salt 0 0.0067 0 1,015 6.7
47 Wheat flour 3,400 0.0028 10 1,396 4.0
48 Wheat, barley grain and other cereals 3,400 0.0007 2 2,147 1.6
49 Tea dry 2,970 0.0003 1 11,082 3.4
50 Coffee and cocoa 3,370 0.0001 0 5,879 0.4
51 Bottled/canned soft drinks (soda, juice, water) 450 0.0013 1 1,691 2.3
52 Prepared tea, coffee 20 0.0000 0 846 0.0

National Panel Survey Wave 4 Report
72
Appendix B: Standard Errors and Confidence Intervals for Selected Indicators
GINI COEFFICIENT, CONFIDENCE INTERVALS
Estimate Std. Error [95% Confidence Interval]
No. of
Observations.
NPS1
Tanzania 0.36 0.01 0.35 0.37 3,265
Rural 0.31 0.01 0.30 0.32 2,063
Urban 0.37 0.01 0.36 0.39 1,202
Mainland 0.37 0.01 0.35 0.38 2,786
Dar es Salaam 0.34 0.01 0.32 0.37 555
Other Urban 0.35 0.01 0.33 0.38 480
Rural 0.31 0.01 0.29 0.32 1,751
Zanzibar 0.32 0.01 0.30 0.34 479
NPS2
Tanzania 0.37 0.01 0.36 0.38 3,844
Rural 0.31 0.01 0.30 0.33 2,583
Urban 0.37 0.01 0.35 0.38 1,261
Mainland 0.37 0.01 0.36 0.38 3,311
Dar es Salaam 0.32 0.01 0.30 0.34 624
Other Urban 0.35 0.01 0.33 0.37 634
Rural 0.31 0.01 0.30 0.33 2,053
Zanzibar 0.31 0.01 0.29 0.33 533
NPS3
Tanzania 0.39 0.01 0.38 0.40 4,883
Rural 0.34 0.01 0.33 0.35 3,154
Urban 0.36 0.01 0.34 0.37 1,729
Mainland 0.39 0.01 0.38 0.40 4,294
Dar es Salaam 0.32 0.01 0.30 0.34 742
Other Urban 0.35 0.01 0.33 0.37 850
Rural 0.34 0.01 0.33 0.35 2,702
Zanzibar 0.33 0.02 0.30 0.36 589
NPS 4
Tanzania 0.37 0.01 0.36 0.38 3,344
Rural 0.33 0.01 0.31 0.34 2,090
Urban 0.34 0.01 0.32 0.35 1,254
Mainland 0.37 0.01 0.36 0.38 2,864
Dar es Salaam 0.29 0.01 0.27 0.31 552
Other Urban 0.34 0.01 0.32 0.37 542
Rural 0.33 0.01 0.31 0.34 1,770
Zanzibar 0.28 0.01 0.26 0.31 480
Tanzania 0.37 0.01 0.36 0.38 3,344
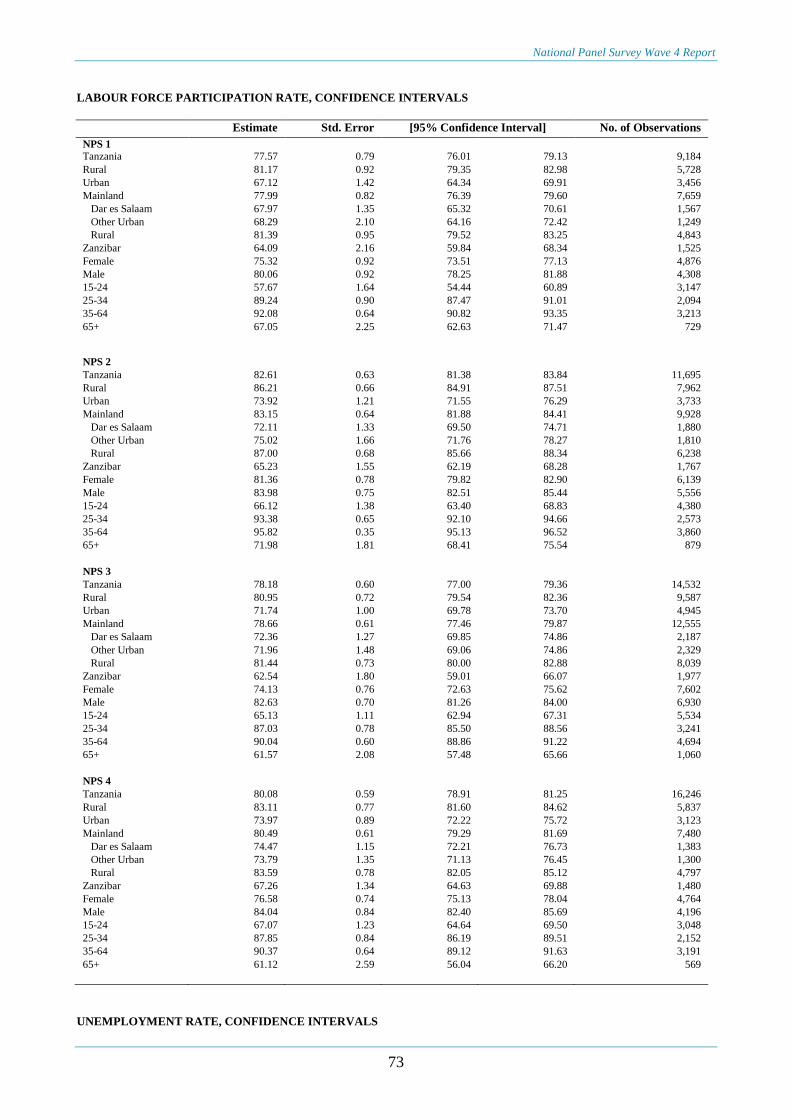
National Panel Survey Wave 4 Report
73
LABOUR FORCE PARTICIPATION RATE, CONFIDENCE INTERVALS
Estimate Std. Error [95% Confidence Interval] No. of Observations
NPS 1
Tanzania 77.57 0.79 76.01 79.13 9,184
Rural 81.17 0.92 79.35 82.98 5,728
Urban 67.12 1.42 64.34 69.91 3,456
Mainland 77.99 0.82 76.39 79.60 7,659
Dar es Salaam 67.97 1.35 65.32 70.61 1,567
Other Urban 68.29 2.10 64.16 72.42 1,249
Rural 81.39 0.95 79.52 83.25 4,843
Zanzibar 64.09 2.16 59.84 68.34 1,525
Female 75.32 0.92 73.51 77.13 4,876
Male 80.06 0.92 78.25 81.88 4,308
15-24 57.67 1.64 54.44 60.89 3,147
25-34 89.24 0.90 87.47 91.01 2,094
35-64 92.08 0.64 90.82 93.35 3,213
65+ 67.05 2.25 62.63 71.47 729
NPS 2
Tanzania 82.61 0.63 81.38 83.84 11,695
Rural 86.21 0.66 84.91 87.51 7,962
Urban 73.92 1.21 71.55 76.29 3,733
Mainland 83.15 0.64 81.88 84.41 9,928
Dar es Salaam 72.11 1.33 69.50 74.71 1,880
Other Urban 75.02 1.66 71.76 78.27 1,810
Rural 87.00 0.68 85.66 88.34 6,238
Zanzibar 65.23 1.55 62.19 68.28 1,767
Female 81.36 0.78 79.82 82.90 6,139
Male 83.98 0.75 82.51 85.44 5,556
15-24 66.12 1.38 63.40 68.83 4,380
25-34 93.38 0.65 92.10 94.66 2,573
35-64 95.82 0.35 95.13 96.52 3,860
65+ 71.98 1.81 68.41 75.54 879
NPS 3
NPS 3
Tanzania 78.18 0.60 77.00 79.36 14,532
Rural 80.95 0.72 79.54 82.36 9,587
Urban 71.74 1.00 69.78 73.70 4,945
Mainland 78.66 0.61 77.46 79.87 12,555
Dar es Salaam 72.36 1.27 69.85 74.86 2,187
Other Urban 71.96 1.48 69.06 74.86 2,329
Rural 81.44 0.73 80.00 82.88 8,039
Zanzibar 62.54 1.80 59.01 66.07 1,977
Female 74.13 0.76 72.63 75.62 7,602
Male 82.63 0.70 81.26 84.00 6,930
15-24 65.13 1.11 62.94 67.31 5,534
25-34 87.03 0.78 85.50 88.56 3,241
35-64 90.04 0.60 88.86 91.22 4,694
65+ 61.57 2.08 57.48 65.66 1,060
NPS 4
NPS 4
Tanzania 80.08 0.59 78.91 81.25 16,246
Rural 83.11 0.77 81.60 84.62 5,837
Urban 73.97 0.89 72.22 75.72 3,123
Mainland 80.49 0.61 79.29 81.69 7,480
Dar es Salaam 74.47 1.15 72.21 76.73 1,383
Other Urban 73.79 1.35 71.13 76.45 1,300
Rural 83.59 0.78 82.05 85.12 4,797
Zanzibar 67.26 1.34 64.63 69.88 1,480
Female 76.58 0.74 75.13 78.04 4,764
Male 84.04 0.84 82.40 85.69 4,196
15-24 67.07 1.23 64.64 69.50 3,048
25-34 87.85 0.84 86.19 89.51 2,152
35-64 90.37 0.64 89.12 91.63 3,191
65+ 61.12 2.59 56.04 66.20 569
UNEMPLOYMENT RATE, CONFIDENCE INTERVALS

National Panel Survey Wave 4 Report
74
Estimate Std. Error [95% Confidence Interval] No. of Observations
NPS 1 Tanzania 2.46 0.22 2.03 2.88 6,729
Rural 0.75 0.16 0.43 1.06 4,552 Urban 8.47 0.75 6.99 9.95 2,177 Mainland 2.32 0.22 1.88 2.75 5,813 Dar es Salaam 16.04 1.30 13.48 18.60 1,069 Other Urban 4.13 0.92 2.31 5.94 846 Rural 0.61 0.16 0.29 0.92 3,898 Zanzibar 7.89 1.29 5.34 10.43 916 Female 2.74 0.28 2.19 3.29 3,358 Male 2.16 0.30 1.58 2.75 3,371 15-24 5.34 0.60 4.16 6.52 1,615 25-34 2.84 0.41 2.04 3.63 1,784 35-64 0.80 0.15 0.51 1.10 2,849 65+ 0.35 0.19 -0.03 0.73 481
NPS 2 Tanzania 3.49 0.31 2.88 4.11 9,295
Rural 1.99 0.26 1.48 2.50 6,586 Urban 7.73 0.88 5.99 9.47 2,709 Mainland 3.15 0.32 2.52 3.77 8,170 Dar es Salaam 13.65 1.49 10.73 16.58 1,365 Other Urban 5.01 1.11 2.83 7.19 1,360 Rural 1.54 0.26 1.03 2.05 5,445 Zanzibar 17.79 1.92 14.01 21.57 1,125 Female 4.25 0.45 3.36 5.13 4,734 Male 2.69 0.29 2.12 3.27 4,561 15-24 7.08 0.84 5.43 8.73 2,753 25-34 3.54 0.47 2.61 4.46 2,344 35-64 1.17 0.22 0.74 1.61 3,604 65+ 1.43 0.58 0.28 2.57 594
NPS 3 Tanzania 2.91 0.23 2.45 3.37 10,991
Rural 1.00 0.16 0.67 1.32 7,508 Urban 7.93 0.66 6.63 9.22 3,483 Mainland 2.58 0.23 2.11 3.04 9,763 Dar es Salaam 12.88 1.21 10.51 15.26 1,575 Other Urban 4.13 0.64 2.88 5.38 1,643 Rural 0.70 0.16 0.38 1.02 6,545 Zanzibar 16.45 1.70 13.12 19.79 1,228 Female 3.75 0.38 3.01 4.49 5,339 Male 2.08 0.21 1.66 2.50 5,652 15-24 5.69 0.53 4.65 6.73 3,475 25-34 3.47 0.49 2.52 4.43 2,751 35-64 0.81 0.14 0.54 1.09 4,152 65+ 0.08 0.07 -0.06 0.22 612
NPS 4
NPS 4
Tanzania 3.59 0.32 2.96 4.23 6,922 Rural 1.26 0.24 0.78 1.73 4,626 Urban 8.89 0.81 7.30 10.48 2,296 Mainland 3.24 0.33 2.60 3.87 5,986 Dar es Salaam 14.71 1.31 12.14 17.28 1,033 Other Urban 4.73 0.90 2.97 6.50 947 Rural 0.92 0.24 0.45 1.39 4,006 Zanzibar 16.95 1.52 13.93 19.97 936 Female 4.82 0.51 3.82 5.83 3,412 Male 2.32 0.32 1.69 2.96 3,510 15-24 7.34 0.81 5.74 8.94 1,966 25-34 4.62 0.62 3.41 5.84 1,832 35-64 0.78 0.19 0.41 1.16 2,792 65+ 3.59 0.32 2.96 4.23 6,922
PERCENTAGE OF HOUSEHOLDS WITH ACCESS TO ELECTRICITY, CONFIDENCE INTERVALS

National Panel Survey Wave 4 Report
75
Estimate Std. Error [95% Confidence Interval] No. of Observations
NPS 1
Tanzania 13.00 0.94 11.16 14.85 3,265
Rural 2.35 0.54 1.28 3.42 2,063
Urban 42.80 2.83 37.23 48.36 1,202
Mainland 12.42 0.96 10.53 14.31 2,786
Dar es Salaam 61.06 3.23 54.71 67.40 555
Other Urban 31.39 4.06 23.40 39.37 480
Rural 2.03 0.55 0.94 3.11 1,751
Zanzibar 33.89 4.01 26.00 41.79 479
NPS 2
Tanzania 17.02 1.06 14.94 19.11 3,846
Rural 5.34 0.80 3.77 6.91 2,583
Urban 43.36 2.66 38.12 48.59 1,263
Mainland 16.39 1.09 14.25 18.53 3,313
Dar es Salaam 68.90 2.71 63.57 74.23 626
Other Urban 32.57 3.41 25.87 39.27 634
Rural 4.19 0.81 2.6 5.79 2,053
Zanzibar 39.74 3.99 31.9 47.59 533
NPS 3
Tanzania 19.82 1.04 17.79 21.86 4,881
Rural 5.23 0.75 3.76 6.71 3,152
Urban 51.92 2.40 47.21 56.64 1,729
Mainland 19.19 1.06 17.11 21.26 4,292
Dar es Salaam 68.82 2.61 63.69 73.95 742
Other Urban 40.95 3.39 34.29 47.61 850
Rural 4.64 0.76 3.14 6.14 2,700
Zanzibar 43.68 4.49 34.85 52.51 589
NPS 4
Tanzania 23.53 1.41 20.77 26.30 3,352
Rural 7.14 1.31 4.56 9.71 2,096
Urban 54.67 2.99 48.79 60.54 1,256
Mainland 23.08 1.44 20.25 25.92 2,872
Dar es Salaam 61.42 4.19 53.17 69.66 552
Other Urban 53.58 4.36 45.01 62.15 544
Rural 5.96 1.32 3.36 8.57 1,776
Zanzibar 39.37 5.44 28.67 50.07 480

National Panel Survey Wave 4 Report
76
PERCENTAGE OF HOUSEHOLDS USING ALTERNATIVE SOURCES OF ENERGY TO WOOD FUEL AS THEIR
MAIN SOURCE OF ENERGY FOR COOKING, CONFIDENCE INTERVALS
Estimate Std. Error [95% Confidence Interval] No. of Observations
NPS 1
Tanzania 1.55 0.26 1.04 2.05 3,265
Rural 0.66 0.23 0.22 1.11 2,063
Urban 4.02 0.74 2.55 5.48 1,202
Mainland 1.56 0.26 1.04 2.08 2,786
Dar es Salaam 7.23 1.55 4.19 10.27 555
Other Urban 2.40 0.84 0.75 4.04 480
Rural 0.69 0.23 0.23 1.14 1,751
Zanzibar 1.09 0.48 0.14 2.03 479
NPS 2
Tanzania 1.76 0.25 1.27 2.24 3,844
Rural 0.44 0.14 0.17 0.72 2,583
Urban 4.73 0.73 3.29 6.17 1,261
Mainland 1.72 0.25 1.23 2.21 3,311
Dar es Salaam 11.11 1.88 7.43 14.8 625
Other Urban 2.17 0.67 0.86 3.48 633
Rural 0.33 0.14 0.07 0.6 2,053
Zanzibar 3.07 1.22 0.68 5.46 533
NPS 3
Tanzania 3.28 0.40 2.49 4.07 4,879
Rural 0.83 0.23 0.38 1.29 3,152
Urban 8.67 1.12 6.46 10.88 1,727
Mainland 3.25 0.41 2.45 4.05 4,290
Dar es Salaam 13.95 2.16 9.70 18.20 740
Other Urban 5.37 1.06 3.29 7.45 850
Rural 0.83 0.24 0.36 1.30 2,700
Zanzibar 4.38 1.93 0.59 8.17 589
NPS 4
Tanzania 3.77 0.47 2.84 4.70 3,352
Rural 0.92 0.25 0.43 1.41 2,096
Urban 9.17 1.26 6.69 11.65 1,256
Mainland 3.78 0.49 2.82 4.73 2,872
Dar es Salaam 12.49 1.79 8.97 16.01 552
Other Urban 7.68 1.86 4.03 11.33 544
Rural 0.83 0.25 0.34 1.32 1,776
Zanzibar 3.44 1.07 1.34 5.54 480

National Panel Survey Wave 4 Report
77
NET ENROLLMENT RATE AT PRE-PRIMARY SCHOOL, CONFIDENCE INTERVALS
Estimate Std. Error [95% Confidence Interval] No. of Observations
NPS 1
Tanzania 20.04 1.59 16.91 23.18 982
Rural 15.81 1.68 12.51 19.12 725
Urban 41.62 4.39 33.00 50.25 257
Mainland 20.13 1.64 16.92 23.35 828
Dar es Salaam 49.01 5.23 38.74 59.29 100
Other Urban 39.24 5.93 27.58 50.89 105
Rural 15.81 1.73 12.42 19.21 623
Zanzibar 16.89 4.00 9.04 24.75 154
Female 20.58 2.31 16.03 25.13 497
Male 19.48 2.00 15.55 23.42 485
NPS 2
Tanzania 25.54 1.78 22.04 29.05 1,203
Rural 20.56 1.95 16.73 24.38 895
Urban 42.59 4.1 34.53 50.64 308
Mainland 25.47 1.83 21.88 29.06 1,040
Dar es Salaam 53.28 4.57 44.3 62.26 152
Other Urban 38.48 5.43 27.81 49.15 148
Rural 20.35 2.00 16.41 24.29 740
Zanzibar 28.28 4.38 19.68 36.88 163
Female 27.18 2.48 22.31 32.05 607
Male 23.85 2.23 19.46 28.24 596
NPS 3
Tanzania 27.89 1.72 24.50 31.27 1,329
Rural 22.20 1.81 18.63 25.76 981
Urban 48.95 3.34 42.39 55.51 348
Mainland 27.62 1.77 24.15 31.09 1,161
Dar es Salaam 60.77 5.04 50.87 70.67 143
Other Urban 43.43 4.66 34.27 52.60 174
Rural 21.87 1.85 18.24 25.51 844
Zanzibar 37.39 5.10 27.36 47.41 168
Female 27.19 2.03 23.20 31.19 679
Male 28.63 2.42 23.87 33.39 650
NPS 4
Tanzania 25.92 1.92 22.14 29.69 972
Rural 19.95 2.01 16.00 23.89 736
Urban 48.75 4.03 40.83 56.67 236
Mainland 25.48 1.97 21.61 29.36 823
Dar es Salaam 46.05 5.30 35.62 56.47 70
Other Urban 52.08 5.80 40.68 63.49 108
Rural 19.55 2.03 15.55 23.54 645
Zanzibar 39.65 5.47 28.89 50.41 149
Female 27.27 1.95 22.23 29.88 461
Male 24.71 8.15 7.55 39.60 511

National Panel Survey Wave 4 Report
78
PRIMARY SCHOOL NET ENROLLMENT RATE, CONFIDENCE INTERVALS
Estimate Std. Error [95% Confidence Interval] No. of Observations
NPS 1
Tanzania 82.92 0.98 81.00 84.84 3,138
Rural 81.30 1.17 79.00 83.61 2,208
Urban 89.60 1.24 87.15 92.04 930
Mainland 83.05 1.00 81.08 85.03 2,594
Dar es Salaam 85.62 1.81 82.05 89.19 344
Other Urban 91.07 1.61 87.90 94.24 393
Rural 81.44 1.20 79.08 83.81 1,857
Zanzibar 78.78 3.20 72.49 85.07 544
Female 85.52 1.14 83.28 87.76 1,599
Male 80.13 1.31 77.56 82.71 1,539
NPS 2
Tanzania 80.47 0.97 78.55 82.38 3,665
Rural 78.66 1.16 76.37 80.95 2,756
Urban 86.69 1.47 83.79 89.58 909
Mainland 80.33 1.00 78.35 82.30 3,109
Dar es Salaam 86.95 1.73 83.56 90.34 408
Other Urban 86.65 1.89 82.94 90.36 495
Rural 78.42 1.20 76.06 80.79 2,206
Zanzibar 85.01 1.93 81.21 88.81 556
Female 81.88 1.26 79.40 84.35 1,860
Male 78.96 1.19 76.62 81.30 1,805
NPS 3
Tanzania 76.31 1.19 73.97 78.65 4,415
Rural 73.22 1.44 70.38 76.06 3,234
Urban 86.84 1.24 84.40 89.27 1,181
Mainland 76.03 1.22 73.62 78.43 3,849
Dar es Salaam 87.38 2.16 83.13 91.63 475
Other Urban 86.55 1.54 83.53 89.57 586
Rural 72.94 1.47 70.05 75.84 2,788
Zanzibar 86.04 2.19 81.73 90.35 566
Female 79.08 1.34 76.44 81.73 2,242
Male 73.39 1.54 70.37 76.42 2,173
NPS 4
Tanzania 73.63 1.74 70.21 77.05 3,114
Rural 71.37 1.98 67.48 75.26 2,290
Urban 80.60 3.71 73.30 87.90 824
Mainland 73.36 1.79 69.85 76.88 2,612
Dar es Salaam 84.37 1.98 80.48 88.25 283
Other Urban 79.21 5.82 67.78 90.65 362
Rural 71.06 2.01 67.12 75.01 1,967
Zanzibar 82.41 3.72 75.11 89.72 502
Female 76.72 2.00 71.79 80.65 1,528
Male 70.82 2.03 66.83 74.82 1,586

National Panel Survey Wave 4 Report
79
SECONDARY SCHOOL NET ENROLLMENT RATE, CONFIDENCE INTERVALS
Estimate Std. Error [95% Confidence Interval] No. of Observations
NPS 1
Tanzania 23.29 1.42 20.50 26.07 1,631
Rural 15.58 1.39 12.85 18.31 1,084
Urban 48.95 3.27 42.53 55.37 547
Mainland 22.80 1.46 19.93 25.66 1,351
Dar es Salaam 44.53 4.04 36.58 52.48 207
Other Urban 49.33 4.32 40.83 57.83 236
Rural 15.15 1.43 12.35 17.96 908
Zanzibar 39.01 3.80 31.54 46.49 280
Female 24.25 1.96 20.40 28.09 802
Male 22.42 1.72 19.05 25.79 829
NPS 2
Tanzania 28.26 1.55 25.22 31.30 1,980
Rural 20.44 1.64 17.21 23.66 1,449
Urban 52.00 2.81 46.48 57.53 531
Mainland 27.98 1.59 24.85 31.11 1,665
Dar es Salaam 50.08 4.52 41.19 58.97 223
Other Urban 52.47 3.5 45.58 59.36 304
Rural 19.86 1.7 16.52 23.20 1,138
Zanzibar 37.20 4.2 28.94 45.46 315
Female 29.77 2.06 25.71 33.83 989
Male 26.69 1.94 22.87 30.51 991
NPS 3
Tanzania 29.95 1.44 27.11 32.78 2,305
Rural 21.16 1.55 18.11 24.20 1,637
Urban 56.44 2.54 51.44 61.43 668
Mainland 29.46 1.48 26.55 32.38 1,963
Dar es Salaam 54.32 4.50 45.47 63.18 251
Other Urban 57.82 3.24 51.46 64.18 354
Rural 20.56 1.58 17.45 23.68 1,358
Zanzibar 44.56 4.18 36.34 52.78 342
Female 31.64 1.76 28.19 35.09 1,179
Male 28.18 1.95 24.35 32.02 1,126
NPS 4
Tanzania 24.67 1.54 21.63 27.70 1,437
Rural 18.40 1.74 14.97 21.83 1,028
Urban 41.41 2.94 35.64 47.18 409
Mainland 24.30 1.58 21.19 27.41 1,207
Dar es Salaam 41.64 4.45 32.89 50.39 162
Other Urban 42.82 4.11 34.74 50.91 182
Rural 17.77 1.77 14.29 21.25 863
Zanzibar 37.61 4.88 28.03 47.20 230
Female 25.72 2.18 21.43 30.00 705
Male 23.70 1.96 19.85 27.55 732

National Panel Survey Wave 4 Report
80
GROSS ENROLLMENT RATE IN HIGHER EDUCATION, CONFIDENCE INTERVALS
Estimate Std. Error [95% Confidence Interval] No. of Observations
NPS 1
Tanzania 2.52 0.49 1.55 3.49 16,217
Rural 0.61 0.31 0.00 1.21 10,781
Urban 7.30 1.49 4.36 10.23 5,436
Mainland 2.53 0.51 1.53 3.53 13,545
Dar es Salaam 8.81 2.19 4.5 13.13 2,336
Other Urban 6.04 2.10 1.90 10.17 2,061
Rural 0.63 0.32 0.0 1.25 9,148
Zanzibar 2.15 0.95 0.28 4.03 2,672
Female 1.57 0.47 0.64 2.50 8,451
Male 3.68 0.85 2.02 5.35 7,766
NPS 2
Tanzania 3.83 0.57 2.70 4.95 20,062
Rural 0.92 0.33 0.28 1.56 14,309
Urban 9.64 1.53 6.65 12.64 5,753
Mainland 3.86 0.59 2.69 5.02 17,067
Dar es Salaam 14.95 3.14 8.79 21.12 2,821
Other Urban 6.86 1.67 3.58 10.14 2,869
Rural 0.86 0.34 0.20 1.53 11,377
Zanzibar 3.05 1.08 0.92 5.19 2,995
Female 2.97 0.64 1.70 4.24 10,344
Male 4.71 0.85 3.05 6.38 9,718
NPS 3
Tanzania 5.11 0.80 3.54 6.68 24,664
Rural 3.08 0.91 1.30 4.87 17,061
Urban 8.91 1.33 6.29 11.53 7,603
Mainland 5.03 0.82 3.42 6.63 21,425
Dar es Salaam 13.43 2.32 8.87 18.00 3,265
Other Urban 5.66 1.52 2.67 8.64 3,652
Rural 3.03 0.94 1.19 4.87 14,508
Zanzibar 7.74 3.05 1.75 13.73 3,239
Female 3.43 0.76 1.94 4.92 12,700
Male 6.68 1.08 4.57 8.80 11,964
NPS 4
Tanzania 5.16 0.92 3.35 6.97 16,246
Rural 2.02 0.59 0.87 3.18 11,143
Urban 10.77 2.22 6.40 15.15 5,103
Mainland 5.17 0.95 3.30 7.03 13,622
Dar es Salaam 11.29 2.92 5.56 17.03 2,092
Other Urban 11.05 3.32 4.52 17.58 2,163
Rural 1.89 0.60 0.71 3.06 9,367
Zanzibar 4.90 1.59 1.78 8.03 2,624
Female 3.03 0.72 1.62 4.45 8,370
Male 8.01 1.54 4.99 11.04 7,876
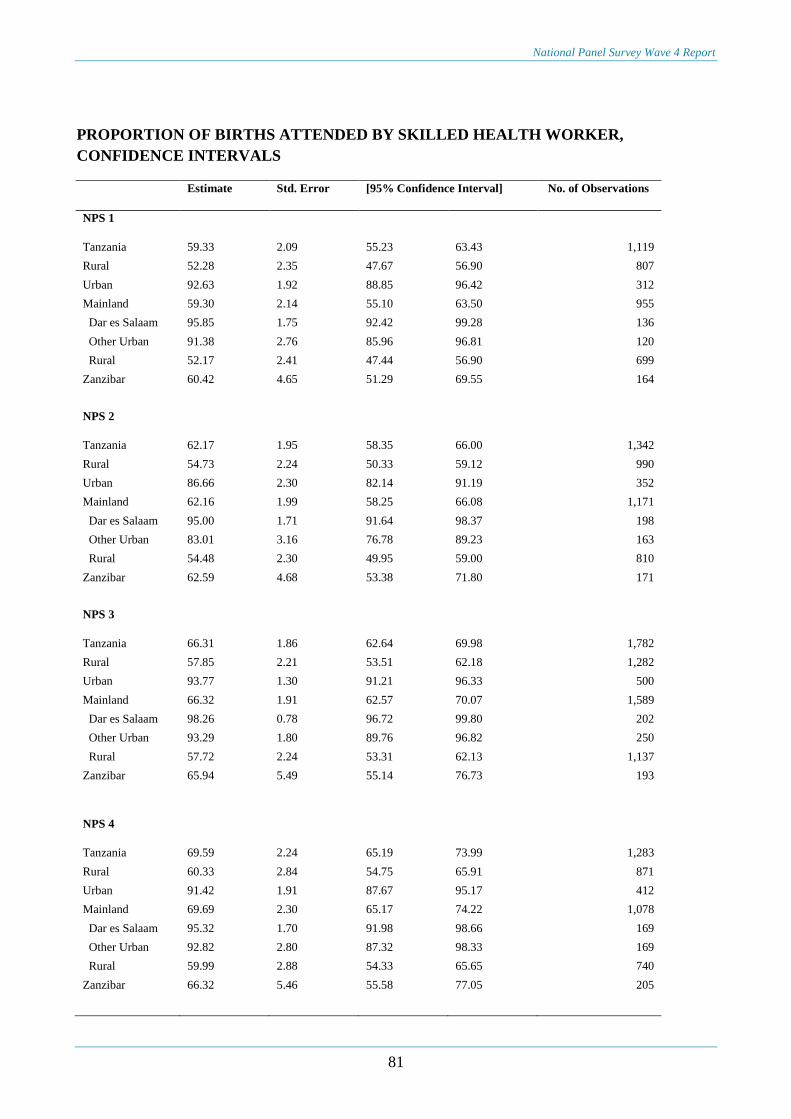
National Panel Survey Wave 4 Report
81
PROPORTION OF BIRTHS ATTENDED BY SKILLED HEALTH WORKER,
CONFIDENCE INTERVALS
Estimate Std. Error [95% Confidence Interval] No. of Observations
NPS 1
Tanzania 59.33 2.09 55.23 63.43 1,119
Rural 52.28 2.35 47.67 56.90 807
Urban 92.63 1.92 88.85 96.42 312
Mainland 59.30 2.14 55.10 63.50 955
Dar es Salaam 95.85 1.75 92.42 99.28 136
Other Urban 91.38 2.76 85.96 96.81 120
Rural 52.17 2.41 47.44 56.90 699
Zanzibar 60.42 4.65 51.29 69.55 164
NPS 2
Tanzania 62.17 1.95 58.35 66.00 1,342
Rural 54.73 2.24 50.33 59.12 990
Urban 86.66 2.30 82.14 91.19 352
Mainland 62.16 1.99 58.25 66.08 1,171
Dar es Salaam 95.00 1.71 91.64 98.37 198
Other Urban 83.01 3.16 76.78 89.23 163
Rural 54.48 2.30 49.95 59.00 810
Zanzibar 62.59 4.68 53.38 71.80 171
NPS 3
Tanzania 66.31 1.86 62.64 69.98 1,782
Rural 57.85 2.21 53.51 62.18 1,282
Urban 93.77 1.30 91.21 96.33 500
Mainland 66.32 1.91 62.57 70.07 1,589
Dar es Salaam 98.26 0.78 96.72 99.80 202
Other Urban 93.29 1.80 89.76 96.82 250
Rural 57.72 2.24 53.31 62.13 1,137
Zanzibar 65.94 5.49 55.14 76.73 193
NPS 4
Tanzania 69.59 2.24 65.19 73.99 1,283
Rural 60.33 2.84 54.75 65.91 871
Urban 91.42 1.91 87.67 95.17 412
Mainland 69.69 2.30 65.17 74.22 1,078
Dar es Salaam 95.32 1.70 91.98 98.66 169
Other Urban 92.82 2.80 87.32 98.33 169
Rural 59.99 2.88 54.33 65.65 740
Zanzibar 66.32 5.46 55.58 77.05 205

National Panel Survey Wave 4 Report
82
PERCENTAGE OF CHILDREN UNDER 5 YEARS WITH LOW HEIGHT-FOR-AGE (STUNTED), CONFIDENCE
INTERVALS
Estimate Std. Error [95% Confidence Interval] No. of Observations
NPS 1
Tanzania 43.02 1.57 39.93 46.11 1,994 Rural 45.59 1.82 42.02 49.16 1,482 Urban 30.16 2.55 25.15 35.18 512 Mainland 43.24 1.6 40.09 46.38 1,782 Dar es Salaam 36.46 3.47 29.64 43.27 229 Other Urban 27.9 3.28 21.45 34.35 225 Rural 45.85 1.85 42.21 49.49 1,328 Zanzibar 30.55 3.67 23.33 37.76 212 Female 40.72 1.88 37.02 44.41 1,036 Male 45.56 2.02 41.59 49.52 958 0-5 months 27.86 4.97 18.09 37.62 100 6-11 31.17 4.10 23.11 39.23 194 12-23 48.27 3.08 42.22 54.32 411 24-35 52.86 2.91 47.14 58.59 431 36-47 40.86 2.9 35.16 46.56 448 48-59 months 38.85 2.88 33.18 44.52 410
NPS 2
Tanzania 34.76 1.38 32.04 37.47 2,583 Rural 37.25 1.58 34.13 40.36 2,011 Urban 24.11 2.63 18.93 29.29 572 Mainland 34.85 1.41 32.08 37.62 2,294 Dar es Salaam 21.07 2.98 15.21 26.93 262 Other Urban 24.90 3.42 18.17 31.62 306 Rural 37.45 1.62 34.26 40.64 1,726 Zanzibar 30.36 3.34 23.80 36.92 289 Female 34.21 1.78 30.72 37.70 1,299 Male 35.32 1.68 32.01 38.62 1,284 0-5 months 12.92 2.41 8.18 17.66 260 6-11 19.91 2.84 14.32 25.50 289 12-23 41.85 2.73 36.48 47.22 547 24-35 46.53 2.53 41.55 51.51 521 36-47 35.99 2.76 30.55 41.42 487 48-59 months 33.02 2.67 27.77 38.28 479
NPS 3 Tanzania 37.40 1.17 35.09 39.71 3,145
Rural 39.30 1.38 36.60 42.01 2,388 Urban 29.51 2.23 25.13 33.90 757 Mainland 37.60 1.20 35.25 39.95 2,873 Dar es Salaam 23.77 3.08 17.72 29.83 290 Other Urban 32.20 3.00 26.30 38.10 409 Rural 39.48 1.40 36.74 42.22 2,174 Zanzibar 26.93 3.35 20.34 33.52 272 Female 34.75 1.48 31.85 37.66 1,575 Male 40.08 1.65 36.85 43.31 1,570 0-5 months 12.98 2.51 8.04 17.91 309 6-11 27.73 3.46 20.93 34.53 332 12-23 47.66 2.33 43.07 52.25 631 24-35 47.79 2.48 42.91 52.67 683 36-47 38.56 2.46 33.73 43.39 589 48-59 months 30.81 2.23 26.42 35.19 601
NPS 4
Tanzania 34.22 1.39 31.48 36.95 2,300 Rural 37.34 1.65 34.09 40.59 1,642 Urban 25.38 2.46 20.56 30.21 658 Mainland 34.14 1.42 31.36 36.93 2,074 Dar es Salaam 23.80 2.74 18.42 29.17 276 Other Urban 25.01 3.69 17.76 32.25 299 Rural 37.41 1.67 34.14 40.69 1,499 Zanzibar 38.12 3.49 31.26 44.98 226 Female 32.07 1.75 28.64 35.51 1,150 Male 36.39 1.89 32.68 40.10 1,150 0-5 months 10.97 2.18 6.69 15.25 216 6-11 26.54 3.47 19.72 33.36 268 12-23 42.93 3.02 37.01 48.86 507 24-35 43.34 2.83 37.77 48.91 471 36-47 33.36 2.78 27.90 38.81 420 48-59 months 31.33 2.99 25.46 37.20 418

National Panel Survey Wave 4 Report
83
PERCENTAGE OF CHILDREN UNDER 5 YEARS WITH LOW WEIGHT-FOR-HEIGHT (WASTED), CONFIDENCE
INTERVALS
Estimate Std. Error [95% Confidence Interval] No. of Observation
NPS 1
Tanzania 2.70 0.42 1.86 3.54 1,992 Rural 2.95 0.50 1.97 3.93 1,480 Urban 1.46 0.58 0.32 2.61 512 Mainland 2.63 0.43 1.78 3.47 1,780 Dar es Salaam 0.91 0.64 -0.35 2.17 229 Other Urban 1.32 0.77 -0.18 2.83 225 Rural 2.92 0.51 1.92 3.91 1,326 Zanzibar 6.96 2.41 2.22 11.70 212 Female 2.72 0.55 1.64 3.79 1,035 Male 2.68 0.59 1.53 3.83 957 0-5 months 3.29 2.73 2.08 8.65 98 6-11 5.88 2.03 1.90 9.87 194 12-23 2.52 1.03 0.50 4.54 411 24-35 1.62 0.64 0.36 2.87 431 36-47 2.65 0.81 1.06 4.24 448 48-59 months 2.51 0.80 0.94 4.08 410
NPS 2
Tanzania 6.59 0.65 5.31 7.86 2,579 Rural 6.76 0.74 5.30 8.22 2,007 Urban 5.87 1.20 3.52 8.22 572 Mainland 6.52 0.66 5.22 7.82 2,290 Dar es Salaam 5.38 1.55 2.33 8.42 262 Other Urban 6.00 1.52 3.01 8.99 306 Rural 6.68 0.76 5.19 8.17 1,722 Zanzibar 9.84 1.98 5.95 13.73 289 Female 6.83 0.88 5.10 8.56 1,297 Male 6.34 0.83 4.72 7.96 1,282 0-5 months 12.71 2.43 7.93 17.48 257 6-11 11.92 2.50 7.00 16.84 288 12-23 7.67 1.69 4.35 10.99 547 24-35 4.14 0.96 2.25 6.03 521 36-47 3.63 0.89 1.87 5.38 487 48-59 months 4.92 1.18 2.60 7.23 479
NPS 3 Tanzania 4.20 0.40 3.42 4.98 3,139
Rural 4.17 0.45 3.28 5.07 2,385 Urban 4.29 0.76 2.80 5.79 754 Mainland 4.13 0.40 3.34 4.92 2,867 Dar es Salaam 3.47 1.16 1.19 5.75 288 Other Urban 4.28 0.97 2.38 6.18 408 Rural 4.15 0.46 3.25 5.06 2,171 Zanzibar 7.68 2.61 2.55 12.81 272 Female 4.47 0.60 3.29 5.66 1,570 Male 3.92 0.49 2.96 4.87 1,569 0-5 months 10.99 1.92 7.22 14.75 308 6-11 11.26 1.94 7.44 15.07 331 12-23 4.65 0.99 2.70 6.59 628 24-35 2.27 0.70 0.90 3.65 683 36-47 0.99 0.42 0.16 1.81 589 48-59 months 2.44 0.76 0.96 3.93 600
NPS 4 Tanzania 5.14 0.55 4.06 6.22 2,295 Rural 4.83 0.62 3.61 6.05 1,637 Urban 6.00 1.15 3.74 8.26 658 Mainland 5.17 0.56 4.07 6.27 2,069 Dar es Salaam 6.68 1.63 3.47 9.90 276 Other Urban 5.93 1.64 2.71 9.15 299 Rural 4.82 0.63 3.59 6.05 1,494 Zanzibar 3.17 1.22 0.77 5.56 226 Female 5.36 0.78 3.82 6.89 1,148 Male 4.92 0.78 3.38 6.46 1,147 0-5 months 11.68 2.63 6.51 16.85 213 6-11 8.27 1.94 4.45 12.09 268 12-23 5.70 1.26 3.22 8.18 507 24-35 3.21 0.96 1.32 5.09 471 36-47 2.36 0.77 0.85 3.88 419 48-59 months 4.16 1.26 1.67 6.64 417

National Panel Survey Wave 4 Report
84
PERCENTAGE OF CHILDREN UNDER 5 YEARS WITH WEIGHT–FOR-AGE (UNDERWEIGHT), CONFIDENCE
INTERVALS
Estimate Std. Error [95% Confidence Interval] No. of Observations
NPS 1
Tanzania 15.92 1.06 13.83 18.01 1,999 Rural 17.13 1.23 14.71 19.56 1,485 Urban 9.82 1.69 6.50 13.15 514 Mainland 15.87 1.08 13.74 17.99 1,786 Dar es Salaam 9.08 2.17 4.81 13.35 230 Other Urban 9.44 2.22 5.07 13.82 225 Rural 17.19 1.26 14.72 19.66 1,331 Zanzibar 18.80 2.85 13.20 24.40 213 Female 15.08 1.32 12.48 17.68 1,037 Male 16.84 1.45 13.98 19.69 962 0-5 months 6.49 3.17 0.26 12.73 101 6-11 15.15 3.08 9.08 21.21 194 12-23 14.70 2.24 10.29 19.11 414 24-35 16.24 2.22 11.87 20.60 432 36-47 19.08 2.14 14.88 23.28 448 48-59 months 16.36 2.16 12.12 20.60 410
NPS 2
Tanzania 13.56 0.9 11.78 15.34 2,602 Rural 14.59 1.04 12.53 16.64 2,026 Urban 9.19 1.58 6.09 12.30 576 Mainland 13.46 0.92 11.65 15.27 2,307 Dar es Salaam 10.04 2.41 5.29 14.78 265 Other Urban 8.73 1.98 4.83 12.63 307 Rural 14.51 1.07 12.41 16.61 1,735 Zanzibar 18.50 2.34 13.90 23.10 295 Female 12.94 1.16 10.66 15.21 1,311 Male 14.20 1.20 11.84 16.55 1,291 0-5 months 4.68 1.53 1.68 7.68 271 6-11 13.36 2.48 8.49 18.22 291 12-23 14.99 2.01 11.03 18.94 549 24-35 14.63 1.70 11.29 17.98 521 36-47 15.32 1.91 11.56 19.07 491 48-59 months 14.04 1.73 10.63 17.45 479
NPS 3 Tanzania 12.52 0.83 10.89 14.15 3,152
Rural 13.30 0.97 11.40 15.21 2,394 Urban 9.28 1.29 6.74 11.82 758 Mainland 14.94 3.09 8.87 21.02 2,880 Dar es Salaam 6.73 1.80 3.19 10.27 292 Other Urban 10.11 1.72 6.72 13.49 408 Rural 13.28 0.98 11.35 15.20 2,180 Zanzibar 14.94 3.09 8.87 21.02 272 Female 12.52 1.16 10.23 14.81 1,575 Male 12.52 0.98 10.60 14.44 1,577 0-5 months 5.90 1.67 2.62 9.18 312 6-11 11.37 2.05 7.35 15.39 334 12-23 14.84 1.71 11.48 18.20 629 24-35 16.34 1.84 12.73 19.95 685 36-47 10.37 1.48 7.46 13.28 591 48-59 months 11.79 1.66 8.54 15.05 601
NPS 4 Tanzania 13.42 0.93 11.59 15.25 2,304
Rural 13.81 1.12 11.61 16.01 1,643 Urban 12.33 1.63 9.13 15.53 661 Mainland 13.36 0.95 11.50 15.22 2,078 Dar es Salaam 11.82 2.44 7.01 16.62 278 Other Urban 12.19 2.25 7.77 16.62 300 Rural 13.81 1.13 11.59 16.03 1,500 Zanzibar 16.68 3.59 9.63 23.73 226 Female 11.62 1.13 9.39 13.85 1,151 Male 15.25 1.35 12.59 17.90 1,153 0-5 months 6.35 1.79 2.83 9.87 219 6-11 11.19 2.17 6.92 15.46 269 12-23 15.41 2.22 11.05 19.77 507 24-35 15.12 2.11 10.96 19.27 472 36-47 12.25 2.07 8.18 16.32 419 48-59 months 15.49 2.13 11.31 19.67 418

National Panel Survey Wave 4 Report
85
HOUSEHOLDS WITH ACCESS TO SAFE DRINKING WATER – RAINY SEASON, CONFIDENCE INTERVALS
Estimate Std. Error [95% Confidence Interval] No. of Observations
NPS 1
Tanzania 43.26 1.88 39.56 46.96 3,265
Rural 32.80 2.26 28.36 37.24 2,063
Urban 72.54 3.11 66.43 78.66 1,202
Mainland 42.20 1.93 38.41 46.00 2,786
Dar es Salaam 77.79 3.33 71.24 84.34 555
Other Urban 67.14 4.42 58.46 75.83 480
Rural 31.89 2.32 27.33 36.45 1,751
Zanzibar 81.27 4.37 72.69 89.85 479
NPS 2
Tanzania 42.74 1.71 39.38 46.09 3,843
Rural 32.25 1.91 28.49 36.02 2,583
Urban 66.42 3.11 60.31 72.53 1,260
Mainland 41.54 1.75 38.10 44.98 3,310
Dar es Salaam 74.64 2.68 69.37 79.91 624
Other Urban 62.25 4.16 54.07 70.44 633
Rural 30.46 1.98 26.57 34.35 2,053
Zanzibar 85.58 3.36 78.98 92.18 533
NPS 3
Tanzania 45.91 1.68 42.61 49.21 4,880
Rural 35.37 2.03 31.38 39.36 3,152
Urban 69.11 2.52 64.16 74.05 1,728
Mainland 44.81 1.72 41.43 48.19 4,291
Dar es Salaam 73.20 2.55 68.18 78.22 741
Other Urban 65.18 3.83 57.65 72.71 850
Rural 34.31 2.07 30.25 38.37 2,700
Zanzibar 87.02 3.46 80.21 93.82 589
NPS 4
Tanzania 45.97 1.94 42.16 49.78 3,352
Rural 34.47 2.43 29.69 39.26 2,096
Urban 67.80 3.05 61.80 73.79 1,256
Mainland 44.97 1.99 41.06 48.88 2,872
Dar es Salaam 65.70 3.72 58.38 73.02 552
Other Urban 68.72 4.62 59.64 77.79 544
Rural 33.44 2.47 28.58 38.30 1,776
Zanzibar 81.28 4.50 72.42 90.13 480

National Panel Survey Wave 4 Report
86
HOUSEHOLDS WITH ACCESS TO SAFE DRINKING WATER – DRY SEASON, CONFIDENCE INTERVALS
Estimate Std. Error [95% Confidence Interval] No. of Observations
NPS 1
Tanzania 43.53 1.87 39.85 47.21 3,265
Rural 32.89 2.23 28.50 37.27 2,063
Urban 73.31 3.14 67.14 79.48 1,202
Mainland 42.51 1.92 38.74 46.28 2,786
Dar es Salaam 81.11 2.99 75.24 86.99 555
Other Urban 67.03 4.54 58.11 75.95 480
Rural 31.93 2.29 27.43 36.44 1,751
Zanzibar 80.26 4.42 71.56 88.95 479
NPS 2
Tanzania 50.19 1.81 46.63 53.74 3,842
Rural 39.84 2.12 35.68 44.01 2,582
Urban 73.54 2.76 68.11 78.98 1,260
Mainland 49.23 1.85 45.59 52.88 3,310
Dar es Salaam 77.71 2.40 73.00 82.42 624
Other Urban 71.16 3.73 63.83 78.49 633
Rural 38.36 2.19 34.05 42.68 2,053
Zanzibar 84.30 3.46 77.50 91.11 532
NPS 3
Tanzania 52.85 1.60 49.71 56.00 4,881
Rural 41.55 1.99 37.64 45.46 3,152
Urban 77.72 1.85 74.09 81.35 1,729
Mainland 51.92 1.64 48.70 55.15 4,292
Dar es Salaam 78.46 2.48 73.59 83.34 742
Other Urban 76.39 2.71 71.07 81.72 850
Rural 40.60 2.03 36.61 44.58 2,700
Zanzibar 87.65 3.38 81.01 94.28 589
NPS 4
Tanzania 57.39 2.08 53.29 61.49 3,352
Rural 46.18 2.72 40.83 51.54 2,096
Urban 78.67 3.03 72.73 84.62 1,256
Mainland 56.72 2.14 52.51 60.92 2,872
Dar es Salaam 81.57 3.42 74.84 88.30 552
Other Urban 77.31 4.67 68.13 86.49 544
Rural 45.36 2.77 39.91 50.80 1,776
Zanzibar 81.28 4.50 72.42 90.13 480

National Panel Survey Wave 4 Report
87
PERCENTAGE OF HOUSEHOLDS WITH BASIC SANITATION FACILITIES, CONFIDENCE INTERVALS
Estimate Std. Error [95% Confidence Interval]
No. of
Observations
NPS 1
Tanzania 89.93 1.02 87.92 91.94 3,265
Rural 86.57 1.38 83.87 89.28 2,063
Urban 99.33 0.30 98.73 99.92 1,202
Mainland 90.19 1.04 88.14 92.24 2,786
Dar es Salaam 99.20 0.38 98.45 99.95 555
Other Urban 99.14 0.45 98.26 100.02 480
Rural 86.93 1.41 84.16 89.71 1,751
Zanzibar 80.59 4.00 72.73 88.45 479
NPS 2
Tanzania 87.06 0.98 85.14 88.98 3,844
Rural 83.27 1.33 80.67 85.88 2,583
Urban 95.62 0.90 93.85 97.39 1,261
Mainland 87.30 1.00 85.34 89.26 3,311
Dar es Salaam 98.93 0.45 98.05 99.82 625
Other Urban 94.40 1.23 91.99 96.82 633
Rural 83.47 1.37 80.77 86.16 2,053
Zanzibar 78.45 3.80 70.98 85.91 533
NPS 3
Tanzania 86.59 1.03 84.56 88.62 4,881
Rural 81.79 1.41 79.02 84.56 3,152
Urban 97.16 0.54 96.10 98.22 1,729
Mainland 86.68 1.05 84.60 88.75 4,292
Dar es Salaam 98.73 0.46 97.82 99.64 742
Other Urban 96.42 0.83 94.79 98.05 850
Rural 81.91 1.44 79.09 84.74 2,700
Zanzibar 83.39 3.52 76.46 90.32 589
NPS 4
Tanzania 86.97 1.19 84.64 89.31 3,352
Rural 82.21 1.64 78.99 85.42 2,096
Urban 96.03 1.58 92.92 99.13 1,256
Mainland 87.14 1.21 84.75 89.52 2,872
Dar es Salaam 99.00 0.45 98.12 99.88 552
Other Urban 96.30 2.59 91.20 101.39 544
Rural 81.93 1.67 78.65 85.20 1,776
Zanzibar 81.22 5.04 71.32 91.12 480

National Panel Survey Wave 4 Report
88
PERCENTAGE OF HOUSEHOLDS WITH IMPROVED SANITATION FACILITIES, CONFIDENCE INTERVALS
Estimate Std. Error [95% Confidence Interval]
No. of
Observations
NPS 1
Tanzania 21.91 1.07 19.79 24.02 3,265
Rural 8.79 0.99 6.85 10.72 2,063
Urban 58.62 2.84 53.03 64.21 1,202
Mainland 21.32 1.10 19.16 23.48 2,786
Dar es Salaam 92.29 1.54 89.26 95.32 555
Other Urban 41.09 4.01 33.20 48.98 480
Rural 8.10 1.00 6.12 10.07 1,751
Zanzibar 42.84 4.21 34.56 51.12 479
NPS 2
Tanzania 25.36 1.08 23.24 27.49 3,844
Rural 11.84 1.03 9.81 13.87 2,583
Urban 55.91 2.60 50.81 61.02 1,261
Mainland 24.67 1.10 22.50 26.85 3,311
Dar es Salaam 90.38 1.40 87.64 93.12 625
Other Urban 41.83 3.17 35.60 48.06 633
Rural 10.45 1.05 8.38 12.52 2,053
Zanzibar 50.06 4.33 41.54 58.58 533
NPS 3
Tanzania 29.54 1.23 27.13 31.95 4,881
Rural 14.23 1.17 11.94 16.53 3,152
Urban 63.22 2.58 58.14 68.30 1,729
Mainland 28.78 1.25 26.32 31.24 4,292
Dar es Salaam 90.83 1.26 88.36 93.30 742
Other Urban 45.14 3.60 38.07 52.21 850
Rural 13.59 1.19 11.25 15.92 2,700
Zanzibar 58.18 4.28 49.76 66.59 589
NPS 4
Tanzania 24.77 1.25 22.33 27.22 3,352
Rural 22.05 1.36 19.38 24.73 2,096
Urban 29.94 2.50 25.03 34.85 1,256
Mainland 23.51 1.27 21.03 26.00 2,872
Dar es Salaam 31.30 3.69 24.05 38.55 552
Other Urban 26.46 3.47 19.65 33.28 544
Rural 21.05 1.37 18.35 23.75 1,776
Zanzibar 69.31 4.90 59.69 78.94 480

National Panel Survey Wave 4 Report
89
AVERAGE YIELDS OF MAIZE (KG / AREA PLANTED IN HECTARES), CONFIDENCE INTERVALS
Estimate Std. Error [95% Confidence Interval] No. of
Observations
NPS1 FARMER REPORTED PLOT AREA All Plots 782.46 18.28 746.61 818.30 1,816 Pure Stand Plots 906.80 34.37 839.31 974.30 600 Intercropped Plots 714.70 21.05 673.40 755.99 1,216 Plots with Organic Fertilizer 1,011.61 59.02 895.38 1,127.85 256 Plots with Inorganic Fertilizer 1,159.77 53.87 1,053.73 1,265.80 283 Plots with Any Fertilizer 1,066.49 42.61 982.76 1,150.22 476 NPS2
FARMER REPORTED PLOT AREA All Plots 794.35 15.83 763.32 825.39 2,189 Pure Stand Plots 877.97 28.04 822.94 933.01 775 Intercropped Plots 742.34 17.77 705.31 779.37 1,414 Plots with Organic Fertilizer 927.34 46.71 835.39 1,019.29 287 Plots with Inorganic Fertilizer 1,178.58 46.57 1,087.03 1,270.13 413 Plots with Any Fertilizer 1,058.37 34.74 990.16 1,126.59 627 GPS-BASED PLOT AREA All Plots 929.94 21.32 888.14 971.75 1,879 Pure Stand Plots 1,047.66 37.59 973.85 1,121.47 663 Intercropped Plots 858.00 25.49 807.00 908.01 1,216 Plots with Organic Fertilizer 1,014.26 58.14 899.80 1,128.73 274 Plots with Inorganic Fertilizer 1,349.23 58.74 1,233.72 1,464.75 363 Plots with Any Fertilizer 1,170.39 43.86 1,084.23 1,256.54 569 NPS3
FARMER REPORTED PLOT AREA All Plots 779.10 15.09 749.51 808.69 2,734 Pure Stand Plots 893.29 27.73 838.87 947.71 955 Intercropped Plots 710.99 17.49 676.69 745.28 1,779 Plots with Organic Fertilizer 785.24 38.11 710.33 860.15 426 Plots with Inorganic Fertilizer 1,180.97 47.15 1,088.29 1,273.64 448 Plots with Any Fertilizer 982.04 32.99 917.28 1,046.79 795 GPS-BASED PLOT AREA All Plots 858.28 18.92 821.18 895.38 2,276 Pure Stand Plots 961.50 33.58 895.58 1,027.43 769 Intercropped Plots 799.63 22.69 755.12 844.14 1,507 Plots with Organic Fertilizer 955.49 50.59 856.03 1,054.94 395 Plots with Inorganic Fertilizer 1,308.53 62.10 1,186.44 1,430.63 380 Plots with Any Fertilizer 1,101.10 41.81 1,019.01 1,183.20 701
NPS4
FARMER REPORTED PLOT AREA All Plots 1,063.88 24.05 1,016.71 1,111.05 1,976 Pure Stand Plots 1,297.09 46.74 1,205.30 1,388.88 621 Intercropped Plots 9,43.58 27.05 8,90.52 9,96.65 1,355 Plots with Organic Fertilizer 1,216.71 64.52 1,089.76 1,343.65 315 Plots with Inorganic Fertilizer 1,658.18 78.69 1,503.37 1,812.98 322 Plots with Any Fertilizer 1,432.76 53.09 1,328.49 1,537.03 582 GPS-BASED PLOT AREA All Plots 1,206.57 33.62 1,140.62 1,272.53 1,480 Pure Stand Plots 1,418.95 68.60 1,284.12 1,553.78 444 Intercropped Plots 1,103.38 37.28 1,030.21 1,176.54 1,036 Plots with Organic Fertilizer 1,271.98 76.98 1,120.45 1,423.51 283 Plots with Inorganic Fertilizer 2,041.82 111.13 1,822.92 2,260.73 244 Plots with Any Fertilizer 1,589.94 69.94 1,452.51 1,727.37 477
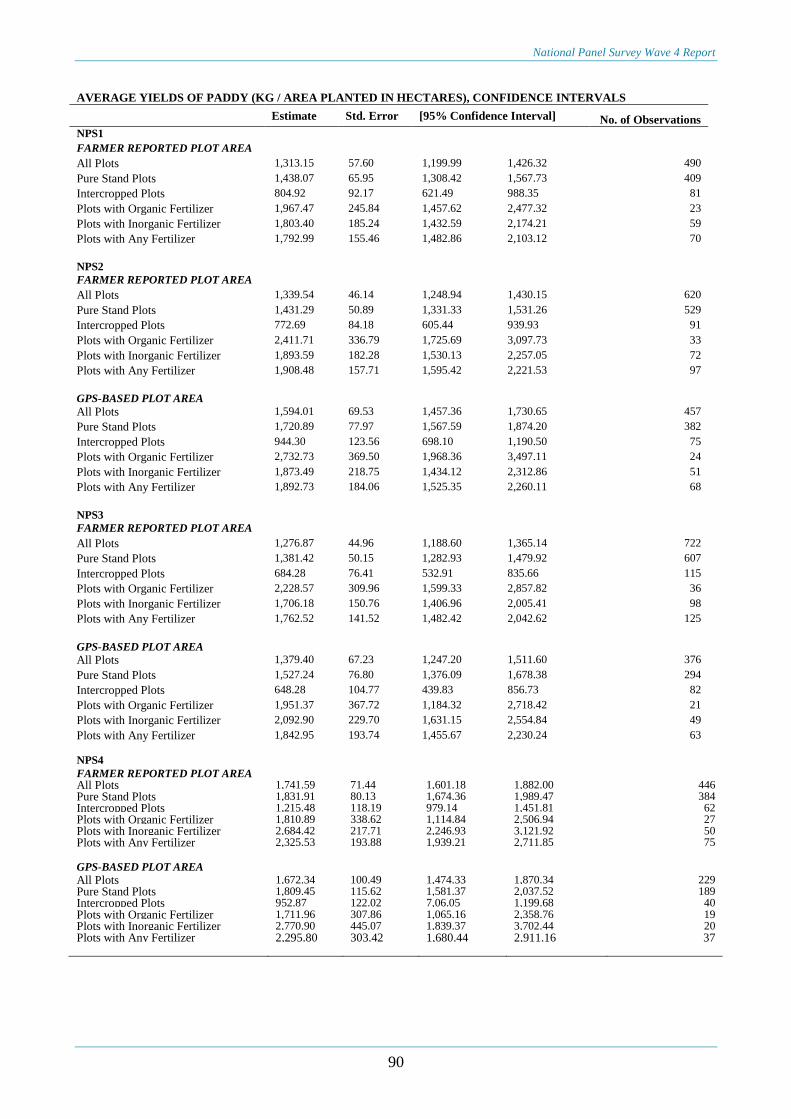
National Panel Survey Wave 4 Report
90
AVERAGE YIELDS OF PADDY (KG / AREA PLANTED IN HECTARES), CONFIDENCE INTERVALS
Estimate Std. Error [95% Confidence Interval] No. of Observations
NPS1
FARMER REPORTED PLOT AREA
All Plots 1,313.15 57.60 1,199.99 1,426.32 490
Pure Stand Plots 1,438.07 65.95 1,308.42 1,567.73 409
Intercropped Plots 804.92 92.17 621.49 988.35 81
Plots with Organic Fertilizer 1,967.47 245.84 1,457.62 2,477.32 23
Plots with Inorganic Fertilizer 1,803.40 185.24 1,432.59 2,174.21 59
Plots with Any Fertilizer 1,792.99 155.46 1,482.86 2,103.12 70
NPS2
FARMER REPORTED PLOT AREA
All Plots 1,339.54 46.14 1,248.94 1,430.15 620
Pure Stand Plots 1,431.29 50.89 1,331.33 1,531.26 529
Intercropped Plots 772.69 84.18 605.44 939.93 91
Plots with Organic Fertilizer 2,411.71 336.79 1,725.69 3,097.73 33
Plots with Inorganic Fertilizer 1,893.59 182.28 1,530.13 2,257.05 72
Plots with Any Fertilizer 1,908.48 157.71 1,595.42 2,221.53 97
GPS-BASED PLOT AREA
All Plots 1,594.01 69.53 1,457.36 1,730.65 457
Pure Stand Plots 1,720.89 77.97 1,567.59 1,874.20 382
Intercropped Plots 944.30 123.56 698.10 1,190.50 75
Plots with Organic Fertilizer 2,732.73 369.50 1,968.36 3,497.11 24
Plots with Inorganic Fertilizer 1,873.49 218.75 1,434.12 2,312.86 51
Plots with Any Fertilizer 1,892.73 184.06 1,525.35 2,260.11 68
NPS3
FARMER REPORTED PLOT AREA
All Plots 1,276.87 44.96 1,188.60 1,365.14 722
Pure Stand Plots 1,381.42 50.15 1,282.93 1,479.92 607
Intercropped Plots 684.28 76.41 532.91 835.66 115
Plots with Organic Fertilizer 2,228.57 309.96 1,599.33 2,857.82 36
Plots with Inorganic Fertilizer 1,706.18 150.76 1,406.96 2,005.41 98
Plots with Any Fertilizer 1,762.52 141.52 1,482.42 2,042.62 125
GPS-BASED PLOT AREA
All Plots 1,379.40 67.23 1,247.20 1,511.60 376
Pure Stand Plots 1,527.24 76.80 1,376.09 1,678.38 294
Intercropped Plots 648.28 104.77 439.83 856.73 82
Plots with Organic Fertilizer 1,951.37 367.72 1,184.32 2,718.42 21
Plots with Inorganic Fertilizer 2,092.90 229.70 1,631.15 2,554.84 49
Plots with Any Fertilizer 1,842.95 193.74 1,455.67 2,230.24 63
NPS4
FARMER REPORTED PLOT AREA All Plots 1,741.59 71.44 1,601.18 1,882.00 446 Pure Stand Plots 1,831.91 80.13 1,674.36 1,989.47 384 Intercropped Plots 1,215.48 118.19 979.14 1,451.81 62 Plots with Organic Fertilizer 1,810.89 338.62 1,114.84 2,506.94 27 Plots with Inorganic Fertilizer 2,684.42 217.71 2,246.93 3,121.92 50 Plots with Any Fertilizer 2,325.53 193.88 1,939.21 2,711.85 75
GPS-BASED PLOT AREA
All Plots 1,672.34 100.49 1,474.33 1,870.34 229 Pure Stand Plots 1,809.45 115.62 1,581.37 2,037.52 189 Intercropped Plots 952.87 122.02 7,06.05 1,199.68 40 Plots with Organic Fertilizer 1,711.96 307.86 1,065.16 2,358.76 19 Plots with Inorganic Fertilizer 2,770.90 445.07 1,839.37 3,702.44 20 Plots with Any Fertilizer 2,295.80 303.42 1,680.44 2,911.16 37

National Panel Survey Wave 4 Report
91
PERCENTAGE OF HOUSEHOLDS AND FIELDS USING IRRIGATION, CONFIDENCE INTERVALS
Estimate Std.
Error [95% Confidence Interval]
No. of
Observations
NPS1
Share of households using irrigation 4.15 0.42 3.33 5.00 2,214
Share of fields using irrigation (surface) 2.03 0.19 1.66 2.40 5,582
share of maize fields using irrigation (surface) 1.67 0.26 1.18 2.18 2,535
share of paddy fields using irrigation (surface) 4.28 0.84 2.64 5.92 586
NPS2
Share of households using irrigation 3.43 0.37 2.72 4.15 2,479
Share of fields using irrigation (surface) 1.74 0.17 1.42 2.08 6,133
share of maize fields using irrigation (surface) 1.54 0.23 1.10 1.99 2,965
share of paddy fields using irrigation (surface) 3.62 0.70 2.25 5.00 710
NPS3
Share of households using irrigation 3.43 0.33 2.78 4.07 3,090
Share of fields using irrigation (surface) 1.68 0.15 1.39 1.96 7,697
share of maize fields using irrigation (surface) 1.70 0.21 1.29 2.12 3,687
share of paddy fields using irrigation (surface) 5.61 0.78 4.07 7.15 861
NPS4
Share of households using irrigation 3.08 0.39 2.33 3.84 2,012
Share of fields using irrigation (surface) 2.02 0.22 1.58 2.46 3,912
share of maize fields using irrigation (surface) 1.35 0.25 0.86 1.85 2,085
share of paddy fields using irrigation (surface) 2.05 0.64 0.79 3.31 491
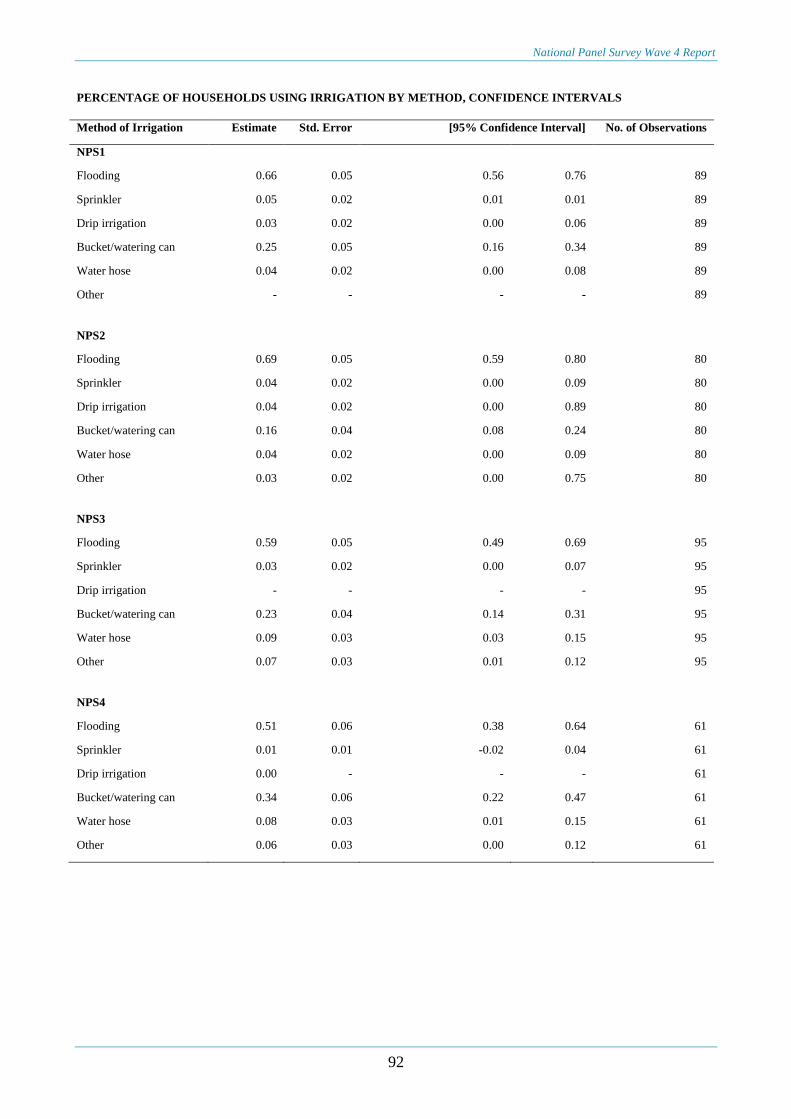
National Panel Survey Wave 4 Report
92
PERCENTAGE OF HOUSEHOLDS USING IRRIGATION BY METHOD, CONFIDENCE INTERVALS
Method of Irrigation Estimate Std. Error [95% Confidence Interval] No. of Observations
NPS1
Flooding 0.66 0.05 0.56 0.76 89
Sprinkler 0.05 0.02 0.01 0.01 89
Drip irrigation 0.03 0.02 0.00 0.06 89
Bucket/watering can 0.25 0.05 0.16 0.34 89
Water hose 0.04 0.02 0.00 0.08 89
Other - - - - 89
NPS2
Flooding 0.69 0.05 0.59 0.80 80
Sprinkler 0.04 0.02 0.00 0.09 80
Drip irrigation 0.04 0.02 0.00 0.89 80
Bucket/watering can 0.16 0.04 0.08 0.24 80
Water hose 0.04 0.02 0.00 0.09 80
Other 0.03 0.02 0.00 0.75 80
NPS3
Flooding 0.59 0.05 0.49 0.69 95
Sprinkler 0.03 0.02 0.00 0.07 95
Drip irrigation - - - - 95
Bucket/watering can 0.23 0.04 0.14 0.31 95
Water hose 0.09 0.03 0.03 0.15 95
Other 0.07 0.03 0.01 0.12 95
NPS4
Flooding 0.51 0.06 0.38 0.64 61
Sprinkler 0.01 0.01 -0.02 0.04 61
Drip irrigation 0.00 - - - 61
Bucket/watering can 0.34 0.06 0.22 0.47 61
Water hose 0.08 0.03 0.01 0.15 61
Other 0.06 0.03 0.00 0.12 61

National Panel Survey Wave 4 Report
93
PROPORTION OF HOUSEHOLDS USING VARIOUS SOURCES OF WATER FOR IRRIGATION, CONFIDENCE
INTERVALS
Source of Water Estimate Std. Error [95% Confidence Interval] No. of Observations
NPS1
Well 0.12 0.03 0.05 0.19 89
Borehole 0.02 0.01 -0.01 0.04 89
Pond/tank 0.01 0.01 -0.01 0.04 89
River/stream 0.79 0.04 0.71 0.88 89
Other source 0.06 0.02 0.01 0.11 89
NPS2
Well 0.16 0.04 0.08 0.24 80
Borehole 0.05 0.02 0 0.09 80
Pond/tank 0.02 0.02 -0.01 0.06 80
River/stream 0.76 0.05 0.66 0.85 80
Other source 0.04 0.02 -0.01 0.09 80
NPS3
Well 0.11 0.03 0.04 0.17 95
Borehole 0.01 0.01 -0.01 0.03 95
Pond/tank 0.09 0.03 0.03 0.14 95
River/stream 0.76 0.04 0.67 0.84 95
Other source 0.04 0.02 0.00 0.08 95
NPS4
Well 0.12 0.04 0.04 0.21 61
Borehole 0.03 0.02 -0.01 0.08 61
Pond/tank 0.12 0.04 0.04 0.21 61
River/stream 0.66 0.06 0.54 0.78 61
Other source 0.08 0.04 0.01 0.15 61

National Panel Survey Wave 4 Report
94
PROPORTION OF HOUSEHOLDS USING FERTILIZERS, SEEDS AND PESTICIDES, CONFIDENCE INTERVALS
Percentage of households using at least: Estimate Std. Error [95% Confidence Interval] No. of Observations
Any fertilizer 30.06 0.97 28.16 31.98 2,214
Using organic fertilizers 22.11 0.88 20.38 23.84 2,214
Using non-organic fertilizers 12.86 0.71 11.46 14.25 2,214
Using vouchers for non-organic fertilizers - - - - 304
Using pesticides/insecticides 14.68 0.75 13.21 16.16 2,214
Improved seeds 21.37 0.89 19.63 23.10 2,137
NPS2
Any fertilizer 32.58 0.94 30.73 34.42 2,479
Using organic fertilizers 21.75 0.83 20.13 23.38 2,479
Using non-organic fertilizers 16.80 0.75 15.33 18.28 2,479
Using vouchers for non-organic fertilizers 49.51 2.48 44.63 54.38 408
Using pesticides/insecticides 13.16 0.67 11.83 14.50 2,479
Improved seeds 17.96 0.79 16.41 19.51 2,356
NPS3
Any fertilizer 35.44 0.86 33.75 37.12 3,090
Using organic fertilizers 25.30 0.78 23.77 26.84 3,090
Using non-organic fertilizers 15.32 0.65 14.05 16.59 3,090
Using vouchers for non-organic fertilizers 30.13 2.13 25.94 34.32 464
Using pesticides/insecticides 13.68 0.62 12.47 14.89 3,090
Improved seeds 43.25 0.92 41.45 45.05 2,904
NPS4
Any fertilizer 0.32 0.01 0.30 0.34 2,012
Using organic fertilizers 0.21 0.01 0.19 0.23 2,012
Using non-organic fertilizers 0.16 0.01 0.14 0.18 2,012
Using vouchers for non-organic fertilizers 0.11 0.02 0.08 0.15 303
Using pesticides/insecticides 0.05 0.00 0.04 0.06 2,012
Improved seeds 0.44 0.01 0.42 0.46 1,812

National Panel Survey Wave 4 Report
95
PERCENTAGE OF HOUSEHOLDS EXPERIENCING EROSION, CONFIDENCE INTERVALS
Estimate Std.
Error
[95% Confidence
Interval]
No. of
Observations
NPS1
Proportion of households with at least one field subject to
erosion 24.46 0.91 22.66 26.25 2214
Cause of erosion
Wind 2.34 0.69 0.97 3.70 476
Rain 93.66 1.11 91.46 95.86 476
Animals 3.48 0.84 1.83 5.13 476
Cultivation that does not comply with soil conservation 1.07 0.47 0.14 2.00 476
Others 0.25 0.23 -0.20 0.71 476
NPS2
Proportion of households with at least one field subject to
erosion 22.74 0.84 21.09 24.39 2479
Cause of erosion
Wind 1.30 0.50 0.31 2.29 509
Rain 97.14 0.74 95.69 98.60 509
Animals 1.28 0.50 0.30 2.26 509
Cultivation that does not comply with soil conservation 0.35 0.26 -0.17 0.86 509
Others 0.39 0.27 -0.15 0.93 509
NPS3
Proportion of households with at least one field subject to
erosion 18.76 0.70 17.38 20.13 3090
Cause of erosion
Wind 1.39 0.53 0.36 2.42 499
Rain 96.62 0.81 95.04 98.22 499
Animals 0.68 0.37 -0.04 1.41 499
Cultivation that does not comply with soil conservation -
Others 0.90 0.43 0.09 1.79 499
NPS4
Proportion of households with at least one field subject to
erosion 0.22 0.01 0.21 0.24 2,012
Cause of erosion
Wind 0.02 0.01 0.00 0.03 425
Rain 0.98 0.01 0.96 0.99 425
Animals 0.01 0.00 0.00 0.02 425
Cultivation that does not comply with soil conservation 0.00 - - - 425
Others 0.00 0.00 0.00 0.01 425

National Panel Survey Wave 4 Report
96
PROPORTION OF HOUSEHOLDS USING EROSION CONTROL METHODS, CONFIDENCE INTERVALS
Estimate Std. Error [95% Confidence Interval] No. of
Observations
NPS1
Households using erosion control 0.26 0.01 0.24 0.27 2,214
Type of erosion control
Terraces 0.43 0.02 0.39 0.48 477
Erosion Control Bunds 0.30 0.02 0.26 0.35 477
Gabions/sandbags 0.03 0.01 0.01 0.04 477
Vetiver grass 0.06 0.01 0.04 0.08 477
Tree belts 0.09 0.01 0.06 0.11 477
Water harvest bunds 0.19 0.02 0.15 0.22 477
Drainage ditch 0.30 0.02 0.26 0.35 477
Dam 0.01 0.00 0.00 0.02 477
NPS2
Households using erosion control 0.16 0.01 0.15 0.18 2,479
Type of erosion control
Terraces 0.60 0.03 0.55 0.66 351
Erosion Control Bunds 0.02 0.01 0.00 0.03 351
Gabions/sandbags 0.02 0.01 0.01 0.04 351
Vetiver grass 0.05 0.01 0.03 0.08 351
Tree belts 0.09 0.02 0.06 0.12 351
Water harvest bunds 0.14 0.02 0.11 0.18 351
Drainage ditch 0.22 0.02 0.18 0.26 351
Dam 0.00 0.00 0.00 0.01 351
NPS3
Households using erosion control 0.12 0.01 0.11 0.14 3,090
Type of erosion control
Terraces 0.39 0.03 0.34 0.45 329
Erosion Control Bunds 0.30 0.03 0.25 0.35 329
Gabions/sandbags 0.01 0.00 0.00 0.01 329
Vetiver grass 0.03 0.01 0.01 0.05 329
Tree belts 0.05 0.01 0.03 0.08 329
Water harvest bunds 0.13 0.02 0.09 0.17 329
Drainage ditch 0.22 0.02 0.18 0.27 329
Dam 0.00 0.00 0.00 0.00 329
NPS4
Households using erosion control 0.18 0.01 0.16 0.20 2,012
Type of erosion control
Terraces 0.41 0.03 0.36 0.47 336
Erosion Control Bunds 0.21 0.02 0.17 0.26 336
Gabions/sandbags 0.00 0.00 0.00 0.01 336
Vetiver grass 0.03 0.01 0.01 0.05 336
Tree belts 0.06 0.01 0.04 0.09 336
Water harvest bunds 0.22 0.02 0.18 0.27 336
Drainage ditch 0.15 0.02 0.11 0.18 336
Dam 0.00 - - - 336

National Panel Survey Wave 4 Report
97
PERCENTAGE OF HOUSEHOLDS USING FARMING TECHNOLOGY – OWN ITEM, CONFIDENCE INTERVALS
Estimate Std. Error [95% Confidence Interval]
No. of
Observations NPS1
Hand hoe 98.04 0.29 97.48 98.61 2,312 Hand powered sprayer 6.99 0.53 5.94 8.02 2,312
Ox plough 8.68 0.59 7.53 9.83 2,312
Ox seed planter 9.94 0.52 8.72 11.16 2,312 Ox cart 0.11 0.07 -0.03 0.02 2,312
Tractor 2.43 0.32 1.80 3.06 2,312
Tractor plough 0.14 0.08 -0.01 0.29 2,312 Tractor harrow 0.27 0.11 0.06 0.48 2,312
Sheller/thresher 0.05 0.05 -0.04 0.15 2,312
Hand mill 0.48 0.14 0.20 0.76 2,312 Watering can 1.97 0.29 1.40 2.53 2,312
Farm buildings 7.50 0.55 6.42 8.58 2,312
Geri cans/drums 12.71 0.69 11.35 14.07 2,312 Power tiller - - - - 2,312
Other - - - - 2,312
NPS2
Hand hoe 96.61 0.35 95.93 97.29 2,729 Hand powered sprayer 5.88 0.45 5.00 6.76 2,729
Ox plough 9.36 0.56 8.27 10.46 2,729
Ox seed planter 10.50 0.59 9.35 11.66 2,729 Ox cart 0.02 0.03 -0.03 0.07 2,729
Tractor 2.36 0.29 1.79 2.93 2,729
Tractor plough 0.21 0.09 0.03 0.38 2,729 Tractor harrow 0.13 0.07 -0.07 0.26 2,729
Sheller/thresher 0.02 0.03 -0.03 0.07 2,729
Hand mill 0.14 0.07 0.00 0.28 2,729 Watering can 1.21 0.21 0.80 1.62 2,729
Farm buildings 6.85 0.48 4.90 7.79 2,729
Geri cans/drums 3.79 0.37 3.07 4.50 2,729 Power tiller -
Other 10.55 0.59 9.39 11.70 2,729
NPS3
Hand hoe 97.87 0.25 93.38 98.37 3,261
Hand powered sprayer 6.26 0.42 5.42 7.09 3,261
Ox plough 10.26 0.53 9.22 11.31 3,261
Ox seed planter 11.14 0.55 10.06 12.22 3,261
Ox cart 0.03 0.03 -0.03 0.10 3,261
Tractor 2.54 0.28 2.00 3.01 3,261
Tractor plough 0.08 0.05 -0.02 0.17 3,261
Tractor harrow 0.06 0.04 -0.02 0.14 3,261
Sheller/thresher 0.08 0.04 -0.01 0.01 3,261
Hand mill 0.05 0.04 0.00 0.13 3,261
Watering can 0.79 0.15 0.48 1.09 3,261
Farm buildings 5.61 0.40 0.48 0.64 3,261
Geri cans/drums 2.44 0.27 0.19 0.30 3,261
Power tiller 0.21 0.08 0.06 0.37 3,261
Other 31.68 0.81 30.08 33.27 3,261
NPS4
Hand hoe 97.75 0.32 97.12 98.39 2,092
Hand powered sprayer 8.32 0.60 7.14 9.51 2,092
Ox plough 12.92 0.73 11.48 14.36 2,092
Ox seed planter 14.39 0.77 12.88 15.89 2,092
Ox cart 0.05 0.05 -0.05 0.15 2,092
Tractor 3.28 0.39 2.52 4.04 2,092
Tractor plough 0.35 0.13 0.10 0.61 2,092
Tractor harrow 0.30 0.12 0.07 0.54 2,092
Sheller/thresher 0.08 0.06 -0.04 0.19 2,092
Hand mill 0.21 0.10 0.01 0.41 2,092
Watering can 0.95 0.21 0.54 1.37 2,092
Farm buildings 6.09 0.52 5.07 7.12 2,092
Geri cans/drums 4.64 0.46 3.73 5.54 2,092
Power tiller 0.05 0.11 0.17 0.60 2,092
Other 55.67 1.09 53.54 57.80 2,092

National Panel Survey Wave 4 Report
98
PERCENTAGE OF HOUSEHOLDS USING FARMING TECHNOLOGY – USED ITEM, CONFIDENCE INTERVALS
Estimate Std. Error [95% Confidence Interval] No. of Observations
NPS1
Hand hoe 95.76 0.42 94.93 96.58 2,312
Hand powered sprayer 12.83 0.70 11.47 14.20 2,312
Ox plough 18.17 0.80 16.59 19.74 2,312
Ox seed planter 19.36 0.82 17.75 20.97 2,312
Ox cart 0.40 0.12 0.13 0.62 2,312
Tractor 7.66 0.66 6.57 8.75 2,312
Tractor plough 2.81 0.34 2.13 3.48 2,312
Tractor harrow 1.40 0.24 0.94 1.90 2,312
Sheller/thresher 0.11 0.07 -0.03 0.24 2,312
Hand mill 1.09 0.22 0.67 1.52 2,312
Watering can 1.81 0.28 1.27 2.36 2,312
Farm buildings 7.21 0.54 6.16 8.27 2,312
Geri cans/drums 10.80 0.65 9.53 12.07 2,312
Power tiller - - - - 2,312
Other - - - - 2,312
NPS2
Hand hoe 91.62 0.53 90.58 92.66 2,729
Hand powered sprayer 8.53 0.53 7.48 9.58 2,729
Ox plough 17.85 0.73 16.41 19.29 2,729
Ox seed planter 18.65 0.75 17.19 20.11 2,729
Ox cart 0.05 0.04 -0.04 0.14 2,729
Tractor 5.l1 0.42 4.31 5.97 2,729
Tractor plough 2.92 0.32 2.28 3.55 2,729
Tractor harrow 2.32 0.29 1.76 2.89 2,729
Sheller/thresher 0.01 0.-02 -0.03 0.05 2,729
Hand mill 0.12 0.07 -0.01 0.25 2,729
Watering can 1.11 0.20 0.71 1.50 2,729
Farm buildings 6.59 0.48 4.55 7.43 2,729
Geri cans/drums 2.31 0.29 1.75 2.88 2,729
Power tiller - - - - 2,729
Other 9.97 0.57 8.85 11.10 2,729
NPS3
Hand hoe 95.68 0.36 94.98 96.38 3,261 Hand powered sprayer 9.72 0.52 8.70 10.73 3,261 Ox plough 22.78 0.73 21.33 24.22 3,261 Ox seed planter 23.30 0.74 21.85 24.76 3,261 Ox cart 0.03 0.03 -0.02 0.09 3,261 Tractor 6.31 0.43 5.48 7.15 3,261 Tractor plough 5.03 0.38 4.28 5.78 3,261 Tractor harrow 3.90 0.34 0.32 0.46 3,261 Sheller/thresher 0.15 0.07 0.02 0.29 3,261 Hand mill 0.16 0.07 0.02 0.30 3,261 Watering can 0.87 0.16 0.55 1.19 3,261 Farm buildings 5.12 0.39 4.36 5.88 3,261 Geri cans/drums 2.06 0.25 1.57 2.55 3,261 Power tiller 0.39 0.11 0.17 0.60 3,261 Other 31.30 0.81 29.71 32.89 3,261
NPS4
Hand hoe 97.94 0.31 97.33 98.55 2,092 Hand powered sprayer 13.63 0.75 12.16 15.10 2,092 Ox plough 33.33 1.03 31.31 35.35 2,092 Ox seed planter 32.23 1.02 30.22 34.23 2,092 Ox cart 0.00 - - - 2,092 Tractor 8.93 0.62 7.71 10.15 2,092 Tractor plough 6.79 0.55 5.71 7.87 2,092 Tractor harrow 4.75 0.47 3.84 5.66 2,092 Sheller/thresher 0.30 0.12 0.06 0.53 2,092 Hand mill 0.76 0.19 0.38 1.13 2,092 Watering can 0.84 0.20 0.45 1.23 2,092 Farm buildings 5.80 0.51 4.79 6.80 2,092 Geri cans/drums 3.98 0.43 3.14 4.82 2,092 Power tiller 0.51 0.05 -0.05 0.15 2,092
Other 53.84 1.09 51.70 55.98 2,092

National Panel Survey Wave 4 Report
99
PERCENTAGE OF FARM HOUSEHOLDS EARNING INCOME FROM OFF-FARM ACTIVITIES, CONFIDENCE
INTERVALS
Percentage of Households Earning Income
From: Estimate
Std.
Error [95% Confidence Interval]
No. of
Observations
NPS1
Rural
Wage 24.14 1.07 32.05 32.25 1,961
Self-Employment 34.56 1.07 32.46 36.67 1,961
Either 54.99 1.12 52.79 57.19 1,961
Urban
Wage 45.04 2.65 39.83 50.26 353
Self-Employment 54.73 2.65 49.52 59.95 353
Either 78.09 2.20 73.76 82.43 353
All
Wage 35.40 0.99 33.45 37.35 2,314
Self-Employment 36.89 1.00 34.92 38.86 2,314
Either 57.66 1.02 55.64 59.67 2,314
NPS2
Rural
Wage 43.79 1.07 41.69 45.88 2,157
Self-Employment 38.94 1.05 36.89 41.01 2,157
Either 65.43 1.02 63.42 67.43 2,157
Urban
Wage 50.74 2.55 45.73 55.76 385
Self-Employment 60.51 2.49 55.61 65.42 385
Either 85.62 1.79 82.09 89.14 385
All
Wage 44.82 0.99 42.88 46.75 2,542
Self-Employment 42.14 0.98 40.22 44.06 2,542
Either 68.41 0.92 66.61 70.22 2,542
NPS3
Rural
Wage 46.37 0.97 44.46 48.27 2,637
Self-Employment 37.20 0.94 35.35 39.04 2,637
Either 65.87 0.92 64.06 67.68 2,537
Urban
Wage 52.80 2.17 58.53 57.06 530
Self-Employment 55.81 2.16 51.57 60.05 530
Either 83.26 1.62 80.07 86.45 530
All
Wage 47.24 0.88 45.50 48.98 3,167
Self-Employment 39.72 0.87 38.02 41.43 3,167
Either 68.23 0.83 66.61 69.85 3,167
NPS4
Rural
Wage 50.68 1.09 48.54 52.83 2,096
Self-Employment 42.32 1.08 40.21 44.44 2,096
Either 74.25 0.96 72.37 76.12 2,096
Urban
Wage 60.28 1.38 57.57 62.99 1,256
Self-Employment 64.09 1.35 61.43 66.77 1,256
Either 93.18 0.71 91.78 94.57 1,256
All
Wage 53.99 0.86 52.31 55.68 3,352
Self-Employment 49.83 0.86 48.14 51.53 3,352
Either 80.78 0.68 79.44 82.11 3,352

National Panel Survey Wave 4 Report
100
PROPORTION OF HOUSEHOLDS THAT SOLD THEIR HARVEST, EXPERIENCED LOSSES AND STORED CROPS,
CONFIDENCE INTERVALS
Estimate
Std.
Error [95% Confidence Interval]
No. of
Observations
NPS1
Proportion of households who sell at least part of
their harvest 0.59 0.11 0.57 0.61 2,061
Proportion of households selling maize 0.27 0.01 0.25 0.29 1,536
Proportion of households selling paddy 0.51 0.23 0.46 0.55 459
Proportion of households who experienced loss of
crops 0.20 0.01 0.18 0.21 2,061
Proportion of households who stored at least part
of harvest 0.40 0.01 0.38 0.42 2,061
NPS2
Proportion of households who sell at least part of
their harvest 0.61 0.01 0.59 0.63 2,350
Proportion of households selling maize 0.33 0.01 0.31 0.35 1,901
Proportion of households selling paddy 0.57 0.02 0.53 0.61 584
Proportion of households who experienced loss of
crops 0.11 0.01 0.10 0.12 2,350
Proportion of households who stored at least part
of harvest 0.30 0.01 0.28 0.32 2,350
NPS3
Proportion of households who sell at least part of
their harvest 0.61 0.01 0.59 0.63 2,888
Proportion of households selling maize 0.29 0.01 0.27 0.31 2,368
Proportion of households selling paddy 0.54 0.18 0.51 0.58 726
Proportion of households who experienced loss of
crops 0.07 0.00 0.06 0.08 2,888
Proportion of households who stored at least part
of harvest 0.30 0.01 0.28 0.31 2,888
NPS4
Proportion of households who sell at least part of
their harvest 0.65 0.01 0.63 0.67 1,912
Proportion of households selling maize 0.36 0.01 0.34 0.38 1,658
Proportion of households selling paddy 0.55 0.02 0.50 0.59 433
Proportion of households who experienced loss of
crops 0.07 0.01 0.06 0.08 1,912
Proportion of households who stored at least part
of harvest 0.44 0.01 0.42 0.46 1,912

National Panel Survey Wave 4 Report
101
FOOD SECURITY DURING THE LAST SEVEN DAYS, NPS2 AND NPS 3, CONFIDENCE INTERVALS
Estimate Std. Error [95% Confidence Interval]
No. of Observations
NPS 2
Worried about not having enough food
Tanzania 35.97 1.50 33.03 38.90 3,844
Rural 37.12 1.80 33.58 40.66 2,583
Urban 32.66 2.22 28.29 37.02 1,261
Mainland 36.30 1.54 33.28 39.32 3,311
Dar es Salaam 37.99 3.19 31.73 44.26 625
Other Urban 31.35 2.84 25.76 36.93 633
Rural 37.41 1.86 33.74 41.07 2,053
Zanzibar 24.81 3.04 18.83 30.79 533
Negative changes in diet
Tanzania 34.01 1.35 31.35 36.67 3,843
Rural 34.73 1.60 31.58 37.88 2,583
Urban 31.94 2.08 27.85 36.04 1,260
Mainland 34.36 1.39 31.63 37.09 3,310
Dar es Salaam 35.48 2.84 29.90 41.06 624
Other Urban 31.25 2.65 26.04 36.45 633
Rural 35.05 1.66 31.79 38.31 2,053
Zanzibar 22.31 2.60 17.20 27.43 533
Reduced food intake
Tanzania 32.23 1.35 29.57 34.88 3,844
Rural 33.06 1.62 29.86 36.25 2,583
Urban 29.85 1.96 25.99 33.71 1,261
Mainland 32.47 1.39 29.75 35.20 3,311
Dar es Salaam 34.76 2.88 29.09 40.43 625
Other Urban 28.69 2.51 23.75 33.63 633
Rural 33.21 1.68 29.91 36.52 2,053
Zanzibar 24.09 2.95 18.28 29.89 533
NPS 3 Worried about not having enough food
Tanzania 33.01 1.20 30.52 35.49 4,879
Rural 33.46 1.58 30.52 5.49 3,151
Urban 31.74 1.65 28.51 34.98 1,728
Mainland 33.54 1.30 30.99 36.09 4,290
Dar es Salaam 34.79 2.66 29.57 40.02 741
Other Urban 31.10 2.14 26.89 35.31 850
Rural 33.93 1.61 30.75 37.10 2,699
Zanzibar 14.78 2.77 9.33 20.24 589
Negative changes in diet
Tanzania 31.09 1.21 28.71 33.47 4,881
Rural 31.96 1.47 29.06 34.86 3,152
Urban 28.69 1.61 25.53 31.85 1,729
Mainland 31.75 1.24 29.31 34.20 4,292
Dar es Salaam 35.56 2.66 30.32 40.80 742
Other Urban 26.00 2.07 21.92 30.06 850
Rural 32.54 1.51 29.58 35.50 2,700
Zanzibar 8.63 2.38 3.96 13.30 533
Reduced food intake
Tanzania 28.88 1.16 26.60 31.16 4,881
Rural 29.61 1.45 26.77 32.46 3,152
Urban 26.86 1.60 23.71 30.00 1,729
Mainland 29.31 1.19 26.97 31.65 4,292
Dar es Salaam 30.20 2.56 25.17 35.24 742
Other Urban 26.02 2.13 21.84 30.21 850
Rural 29.92 1.48 27.01 32.83 2,700
Zanzibar 14.48 2.44 9.68 19.27 589 Worried about not having enough food
Tanzania 34.55 1.33 31.93 37.16 3352
Rural 35.26 1.7 31.91 38.61 2096
Urban 32.83 1.94 29.01 36.65 1256
Mainland 35.04 1.37 32.35 37.73 2872
Dar es Salaam 32.93 2.49 28.02 37.83 552
Other Urban 33.76 2.9 28.05 39.46 544
Rural 35.67 1.74 32.26 39.09 1776
Zanzibar 18.91 2.96 13.09 24.74 480
Negative changes in die
Tanzania 34.11 1.26 31.64 36.59 3350
Rural 34.98 1.59 31.85 38.11 2094
Urban 32.04 1.98 28.15 35.93 1257
Mainland 34.94 1.3 32.39 37.49 2870
Dar es Salaam 31.38 2.65 26.17 36.6 552
Other Urban 34.68 2.89 29 40.36 544
Rural 35.54 1.62 32.35 38.73 1774
Zanzibar 7.65 1.94 3.84 11.46 480
Reduced food intake
Tanzania 31.23 1.34 28.6 33.86 3351
Rural 31.77 1.72 28.39 35.14 2095
Urban 29.94 1.95 26.11 33.78 1256
Mainland 31.63 1.38 28.92 34.34 2872
Dar es Salaam 27.55 2.36 22.9 32.2 552
Other Urban 32.06 2.96 26.24 37.89 544
Rural 32.13 1.75 28.69 35.57 1776
Rural 32.13 1.75 28.69 35.57 1776
Zanzibar 18.47 2.98 12.61 24.33 479
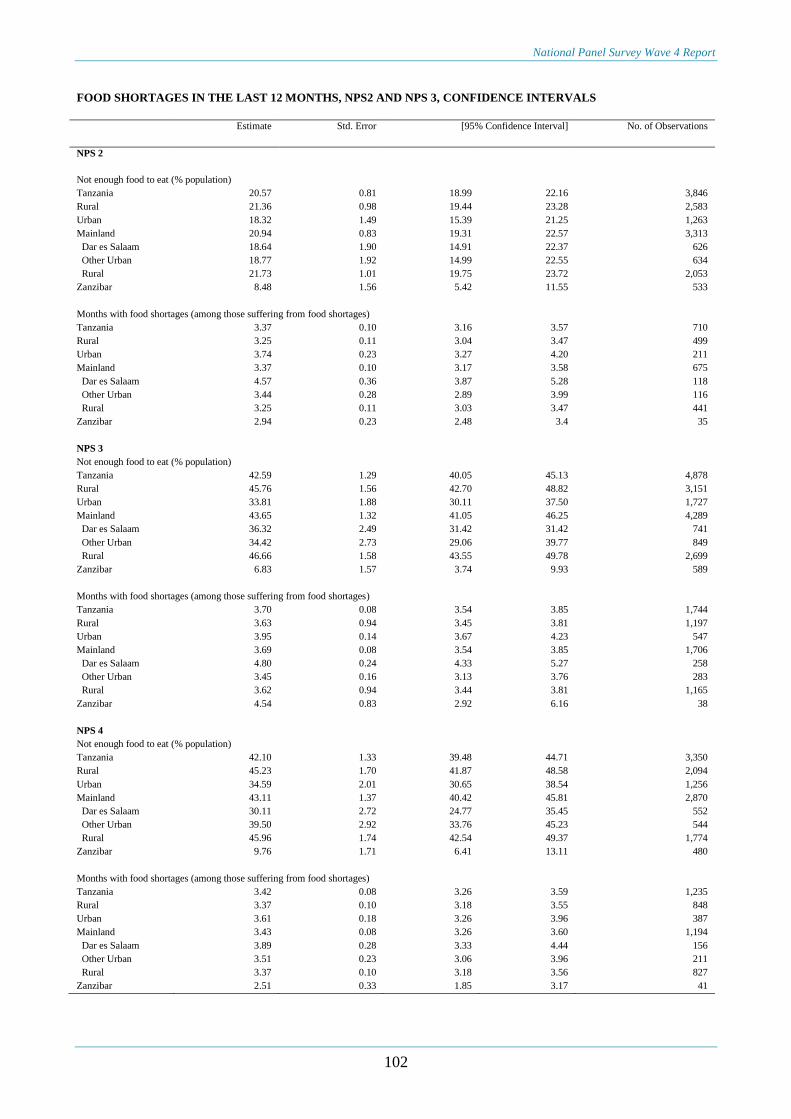
National Panel Survey Wave 4 Report
102
FOOD SHORTAGES IN THE LAST 12 MONTHS, NPS2 AND NPS 3, CONFIDENCE INTERVALS
Estimate Std. Error [95% Confidence Interval] No. of Observations
NPS 2
Not enough food to eat (% population)
Tanzania 20.57 0.81 18.99 22.16 3,846
Rural 21.36 0.98 19.44 23.28 2,583
Urban 18.32 1.49 15.39 21.25 1,263
Mainland 20.94 0.83 19.31 22.57 3,313
Dar es Salaam 18.64 1.90 14.91 22.37 626
Other Urban 18.77 1.92 14.99 22.55 634
Rural 21.73 1.01 19.75 23.72 2,053
Zanzibar 8.48 1.56 5.42 11.55 533
Months with food shortages (among those suffering from food shortages)
Tanzania 3.37 0.10 3.16 3.57 710
Rural 3.25 0.11 3.04 3.47 499
Urban 3.74 0.23 3.27 4.20 211
Mainland 3.37 0.10 3.17 3.58 675
Dar es Salaam 4.57 0.36 3.87 5.28 118
Other Urban 3.44 0.28 2.89 3.99 116
Rural 3.25 0.11 3.03 3.47 441
Zanzibar 2.94 0.23 2.48 3.4 35
NPS 3
Not enough food to eat (% population)
Tanzania 42.59 1.29 40.05 45.13 4,878
Rural 45.76 1.56 42.70 48.82 3,151
Urban 33.81 1.88 30.11 37.50 1,727
Mainland 43.65 1.32 41.05 46.25 4,289
Dar es Salaam 36.32 2.49 31.42 31.42 741
Other Urban 34.42 2.73 29.06 39.77 849
Rural 46.66 1.58 43.55 49.78 2,699
Zanzibar 6.83 1.57 3.74 9.93 589
Months with food shortages (among those suffering from food shortages)
Tanzania 3.70 0.08 3.54 3.85 1,744
Rural 3.63 0.94 3.45 3.81 1,197
Urban 3.95 0.14 3.67 4.23 547
Mainland 3.69 0.08 3.54 3.85 1,706
Dar es Salaam 4.80 0.24 4.33 5.27 258
Other Urban 3.45 0.16 3.13 3.76 283
Rural 3.62 0.94 3.44 3.81 1,165
Zanzibar 4.54 0.83 2.92 6.16 38
NPS 4
Not enough food to eat (% population)
Tanzania 42.10 1.33 39.48 44.71 3,350
Rural 45.23 1.70 41.87 48.58 2,094
Urban 34.59 2.01 30.65 38.54 1,256
Mainland 43.11 1.37 40.42 45.81 2,870
Dar es Salaam 30.11 2.72 24.77 35.45 552
Other Urban 39.50 2.92 33.76 45.23 544
Rural 45.96 1.74 42.54 49.37 1,774
Zanzibar 9.76 1.71 6.41 13.11 480
Months with food shortages (among those suffering from food shortages)
Tanzania 3.42 0.08 3.26 3.59 1,235
Rural 3.37 0.10 3.18 3.55 848
Urban 3.61 0.18 3.26 3.96 387
Mainland 3.43 0.08 3.26 3.60 1,194
Dar es Salaam 3.89 0.28 3.33 4.44 156
Other Urban 3.51 0.23 3.06 3.96 211
Rural 3.37 0.10 3.18 3.56 827
Zanzibar 2.51 0.33 1.85 3.17 41

National Panel Survey Wave 4 Report
103
Appendix C: Additional Tables
Table C1: Proportion of Rural Households by Stratum According to Quarter of Interview
October- January- April- July-
December March June September
2008 2009 2009 2009 Total
Tanzania 71 69 53 59 63
Dar es Salaam 0 29 18 11 13
Other Urban
Other UrbanRural
0 0 0 0 0
Rural
Rural
100 100 100 100 100
Zanzibar
Zanzibar
100 100 0 0 50
Table C2: NPS Sample Size by Round
NPS1 NPS2 NPS3 NPS4
Total (a) 3,265 3,924 5,010 3,360
Excess NPS2 with respect to NPS1 (b1) - 78 89 -
Excess NPS3 with respect to NPS2 (b2) - - 38 -
Sample for analysis (c) = (a) - (b1) - (b2) 3,265 3,846 4,883 3,352
Note: Excess households refer to households excluded from the analysis because their current members do not include any
household member from the previous round, that is, only non-household members were tracked.

National Panel Survey Wave 4 Report
104
Persons involved in the 2014/15 National Panel Survey (NPS)
Survey Managers: Dr. Albina Chuwa / Aldegunda Komba
Survey Coordinator: Emilian Karugendo
Field Coordinator: Mlemba Abassy
Tracking Coordinator: David Danda
Assistant Data Manager: George Mwiza
Quality Control: Jocyline Rwehumbiza / Hellen Mtove / Sylvia Meku
North Team Central Team
Supervisors Joseph Meela Gideon Mokiwa
Enumerators August Elias Doris Kalumuna
Grace Muta Edes Mbelano
Frank Mhando Grace Wella
Hellen Hilary Wignus Mwangosi
Rashid Kamwe Peter Kapinga
Esmail Naftali
Data entrant Done Jones Manfred Mlimanyika
Driver Zuberi Godfrey Mtoni
Lake Team South Team
Supervisors Sylvester Zenobius Dotto Alley
Enumerators Emmanuel Getorare Baraka Pearson
Erick Kaoka Tulalava Mwanga
Thomas Dennis Elizeus Norvati
Muhsin Katabaro HibaHiba
Piara John William Sanga
Data Entrant David Ngirwa Hamisi Sozigwa
Driver Michael Madembwe JumaGwau
East Team Dar es Salaam
Supervisor Mwantumu Athumani Reginald Kessy Enumerators Peter Idana Augustino Mathew Colman Nyaki Hamdani Mosha Humphrey Mwakajila Mary Nyinda Jamila Maumba Amina Zidiheri Benjamin Tesha Judith Honest Albina Gabriel Data Entrant Joseph Mgonja Wende Safari Driver Baraka Nyambelwa Rajab Kinanda Zanzibar Tracking I Supervisor Saleh M. Saleh Mariam Edmund Enumerators Omari Kitambo Thomas Lukindo Abdilhamid M. RukiaRajabu Said S. Masoud Juma Mzee Data Entrant Ramadhan Ali Hassan Robert Christian Driver Shomari Matewele Tracking II Supervisor Eliaranya Lema Enumerators Samuel Mande Judith Jacob Data Entrant Daniel Jimbuka Driver Maloba Kisanga


National Bureau of Statistics
18 Kivukoni Road
P.O. Box 796,
11992 Dar es Salaam.
Tel: +255 22 2122722/3
Fax: +255 22 2130852
Email: [email protected]
Website: www.nbs.go.tz
Tanzania