Embed Size (px)
Citation preview
TANZANIADIGITAL PATHWAYS TO FINANCIAL INCLUSION
2015 SURVEY REPORT
MARCH 2015
PUTTING THE USER FRONT AND CENTER
TANZANIA
The Financial Inclusion Insights (FII) program responds to the need identified by multiple stakeholders for
timely, demand-side data and practical insights into digital financial services (DFS), including mobile money,
and the potential for their expanded use among the poor.
The FII team conducts regular survey and qualitative research in Kenya, Tanzania, Uganda, Nigeria, India, Pakistan, Bangladesh and Indonesia to:
• Track access to and demand for financial services generally, and the uptake and use of DFS specifically;
• Measure adoption and use of DFS among key target groups (females, BOP, rural, unbanked, etc.);
• Identify drivers and barriers to further adoption of DFS;
• Evaluate the agent experience and the performance of mobile money agents; and
• Produce actionable, forward-looking insights to support product and service development and delivery, based on rigorous FII data.
The FII program is managed by InterMedia. Visit the FII Resource Center to learn more: www.finclusion.org.
2
CONTENTS
TANZANIA
3
1. Executive Summary 4
2. Changes to the Tanzanian Financial Inclusion Ecosystem in 2013-2014 10
3. Context: Consumer Profile 16
4. Tanzanians’ Mobile Phone Use 23
5. Tanzanians’ Financial Behaviors 28
6. Uptake and Use of Mobile Financial Services 40
7. Use of Banking Services in Tanzania 53
8. Uptake and Use of Nonbank Financial Services 58
9. Special Topics: The Gender Story 61
10. Special Topics: Cross-country Indicators 67
11. Methodology and Research Description 69
12. Glossary 72
TANZANIA
4
EXECUTIVE SUMMARY
TANZANIA
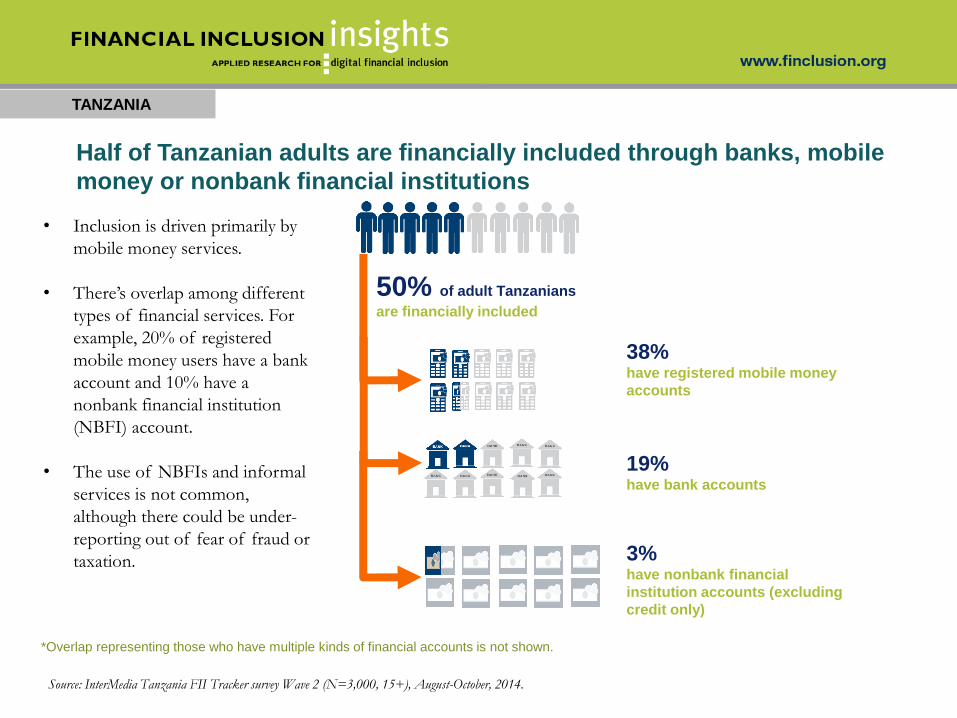
Half of Tanzanian adults are financially included through banks, mobile
money or nonbank financial institutions
50% of adult Tanzanians
are financially included
19% have bank accounts
3% have nonbank financial
institution accounts (excluding
credit only)
38% have registered mobile money
accounts
*Overlap representing those who have multiple kinds of financial accounts is not shown.
• Inclusion is driven primarily by
mobile money services.
• There’s overlap among different
types of financial services. For
example, 20% of registered
mobile money users have a bank
account and 10% have a
nonbank financial institution
(NBFI) account.
• The use of NBFIs and informal
services is not common,
although there could be under-
reporting out of fear of fraud or
taxation.
Source: InterMedia Tanzania FII Tracker survey Wave 2 (N=3,000, 15+), August-October, 2014.
TANZANIA
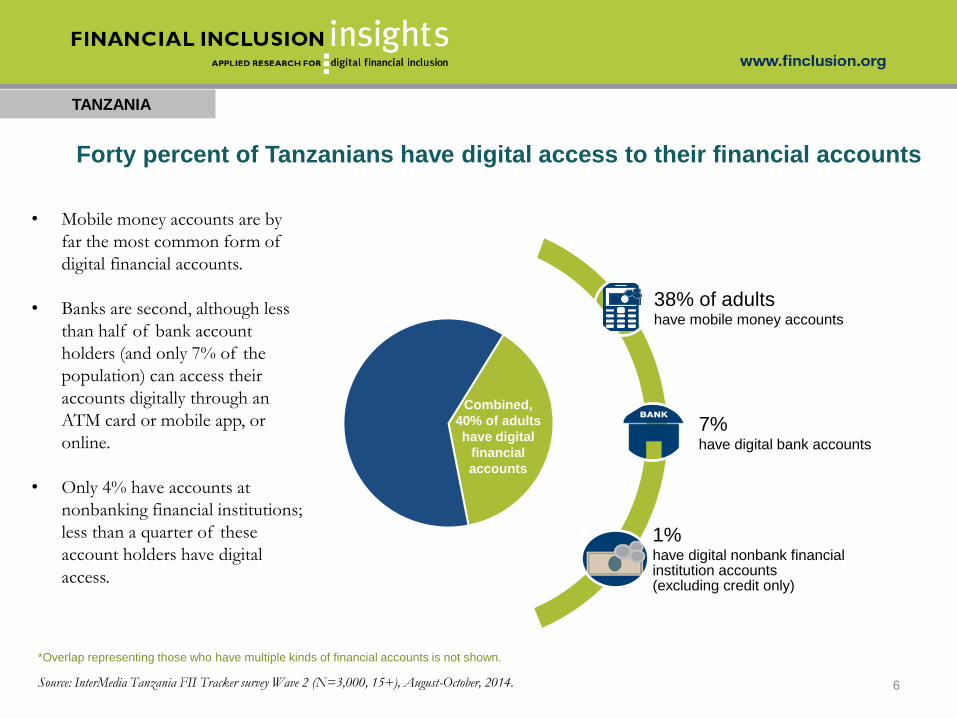
Forty percent of Tanzanians have digital access to their financial accounts
6
39.3 % of adult Bangladeshis have full-service
financial accounts
38% of adults have mobile money accounts
7%have digital bank accounts
1%have digital nonbank financial institution accounts (excluding credit only)
Combined,
40% of adults
have digital
financial
accounts
*Overlap representing those who have multiple kinds of financial accounts is not shown.
• Mobile money accounts are by
far the most common form of
digital financial accounts.
• Banks are second, although less
than half of bank account
holders (and only 7% of the
population) can access their
accounts digitally through an
ATM card or mobile app, or
online.
• Only 4% have accounts at
nonbanking financial institutions;
less than a quarter of these
account holders have digital
access.
Source: InterMedia Tanzania FII Tracker survey Wave 2 (N=3,000, 15+), August-October, 2014.

TANZANIA
50%47%
11% 10% 8%
48%44%
38%
60%
51%
26%21%
16%
44%38%
34%
Access to abank account orMM account or
both*
Registered bankor MM account
or both
Access to abank account*
Bank accountholders*
Active bankaccountholders*
Access to anMM account
MM accountholders
Active MMaccount holders
2013 2014
Bank and mobile-money (MM) account access and use: 2013 vs. 2014*(Shown: Percentage of Tanzanian adults who fall into each category, 2013 (W1) N=2,997, 2014 (W2) N=3,000)
Mobile moneyBanks
*Differences in waves are significant at the 95% confidence level for access to a bank account, bank account holders, mobile money account holders and active mobile money account
holders. Categories are not mutually exclusive.
Source: InterMedia Tanzania FII Tracker surveys Wave 1 (N=2,997, 15+), November 2013-March 2014, and Wave 2 (N=3,000, 15+), August-October, 2014.
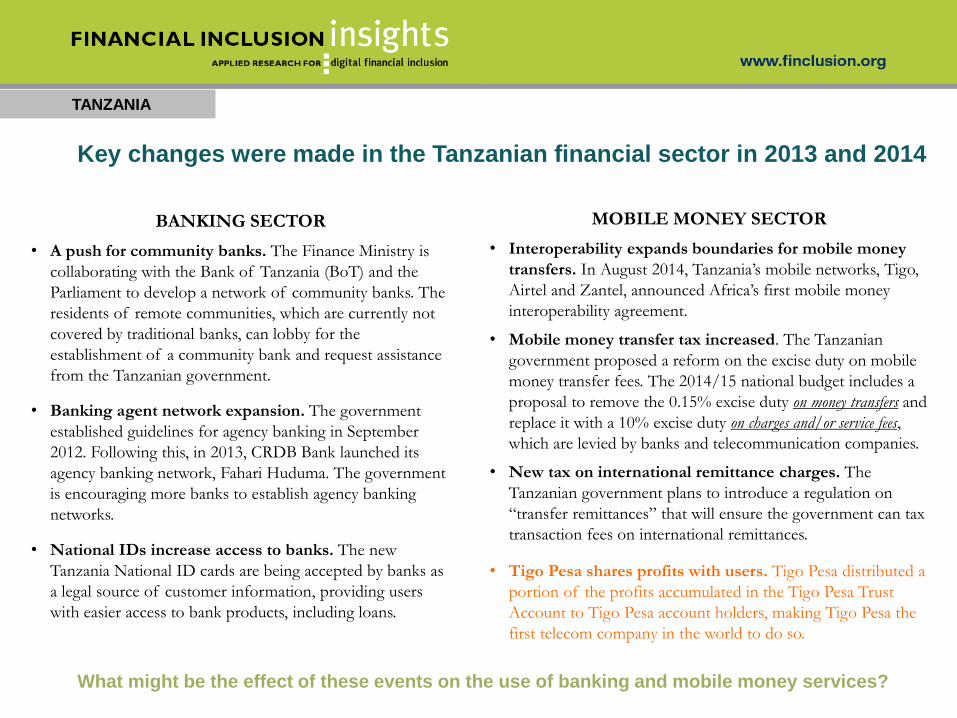
MOBILE MONEY SECTOR
• Interoperability expands boundaries for mobile money
transfers. In August 2014, Tanzania’s mobile networks, Tigo,
Airtel and Zantel, announced Africa’s first mobile money
interoperability agreement.
• Mobile money transfer tax increased. The Tanzanian
government proposed a reform on the excise duty on mobile
money transfer fees. The 2014/15 national budget includes a
proposal to remove the 0.15% excise duty on money transfers and
replace it with a 10% excise duty on charges and/or service fees,
which are levied by banks and telecommunication companies.
• New tax on international remittance charges. The
Tanzanian government plans to introduce a regulation on
“transfer remittances” that will ensure the government can tax
transaction fees on international remittances.
• Tigo Pesa shares profits with users. Tigo Pesa distributed a
portion of the profits accumulated in the Tigo Pesa Trust
Account to Tigo Pesa account holders, making Tigo Pesa the
first telecom company in the world to do so.
TANZANIA
Key changes were made in the Tanzanian financial sector in 2013 and 2014
BANKING SECTOR
• A push for community banks. The Finance Ministry is
collaborating with the Bank of Tanzania (BoT) and the
Parliament to develop a network of community banks. The
residents of remote communities, which are currently not
covered by traditional banks, can lobby for the
establishment of a community bank and request assistance
from the Tanzanian government.
• Banking agent network expansion. The government
established guidelines for agency banking in September
2012. Following this, in 2013, CRDB Bank launched its
agency banking network, Fahari Huduma. The government
is encouraging more banks to establish agency banking
networks.
• National IDs increase access to banks. The new
Tanzania National ID cards are being accepted by banks as
a legal source of customer information, providing users
with easier access to bank products, including loans.
What might be the effect of these events on the use of banking and mobile money services?
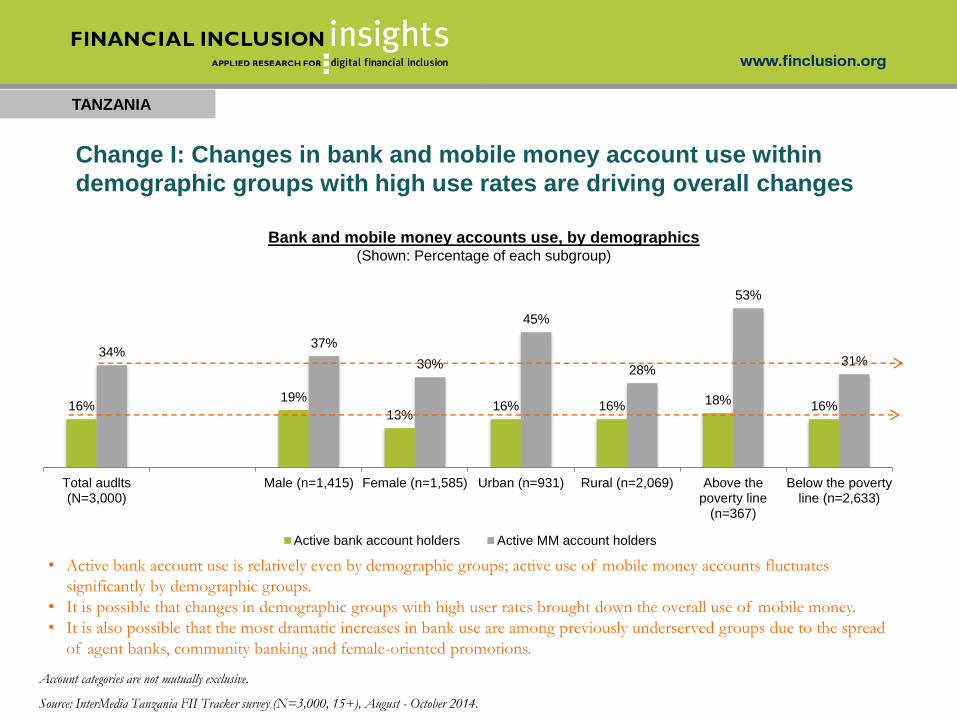
16%19%
13%16% 16% 18% 16%
34%37%
30%
45%
28%
53%
31%
Total audlts(N=3,000)
Male (n=1,415) Female (n=1,585) Urban (n=931) Rural (n=2,069) Above thepoverty line
(n=367)
Below the povertyline (n=2,633)
Active bank account holders Active MM account holders
TANZANIA
Account categories are not mutually exclusive.
Source: InterMedia Tanzania FII Tracker survey (N=3,000, 15+), August - October 2014.
Bank and mobile money accounts use, by demographics(Shown: Percentage of each subgroup)
Change I: Changes in bank and mobile money account use within
demographic groups with high use rates are driving overall changes
• Active bank account use is relatively even by demographic groups; active use of mobile money accounts fluctuates
significantly by demographic groups.
• It is possible that changes in demographic groups with high user rates brought down the overall use of mobile money.
• It is also possible that the most dramatic increases in bank use are among previously underserved groups due to the spread
of agent banks, community banking and female-oriented promotions.
TANZANIA
Account categories are not mutually exclusive.
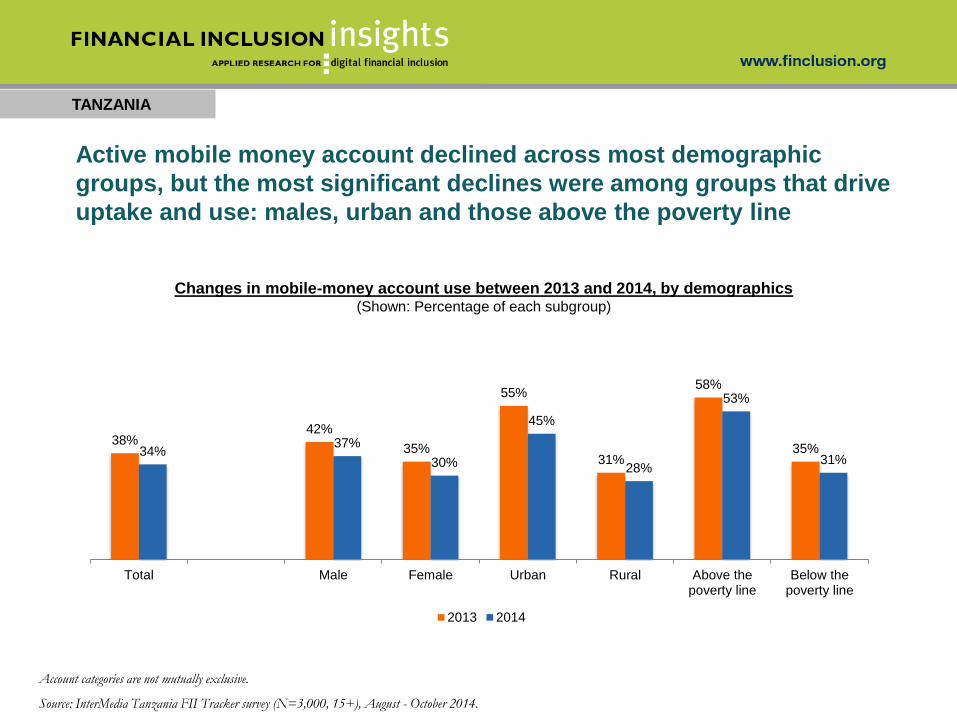
Source: InterMedia Tanzania FII Tracker survey (N=3,000, 15+), August - October 2014.
Changes in mobile-money account use between 2013 and 2014, by demographics(Shown: Percentage of each subgroup)
Active mobile money account declined across most demographic
groups, but the most significant declines were among groups that drive
uptake and use: males, urban and those above the poverty line
38%42%
35%
55%
31%
58%
35%34%37%
30%
45%
28%
53%
31%
Total Male Female Urban Rural Above thepoverty line
Below thepoverty line
2013 2014
TANZANIA
Account categories are not mutually exclusive.
Source: InterMedia Tanzania FII Tracker survey (N=3,000, 15+), August - October 2014.
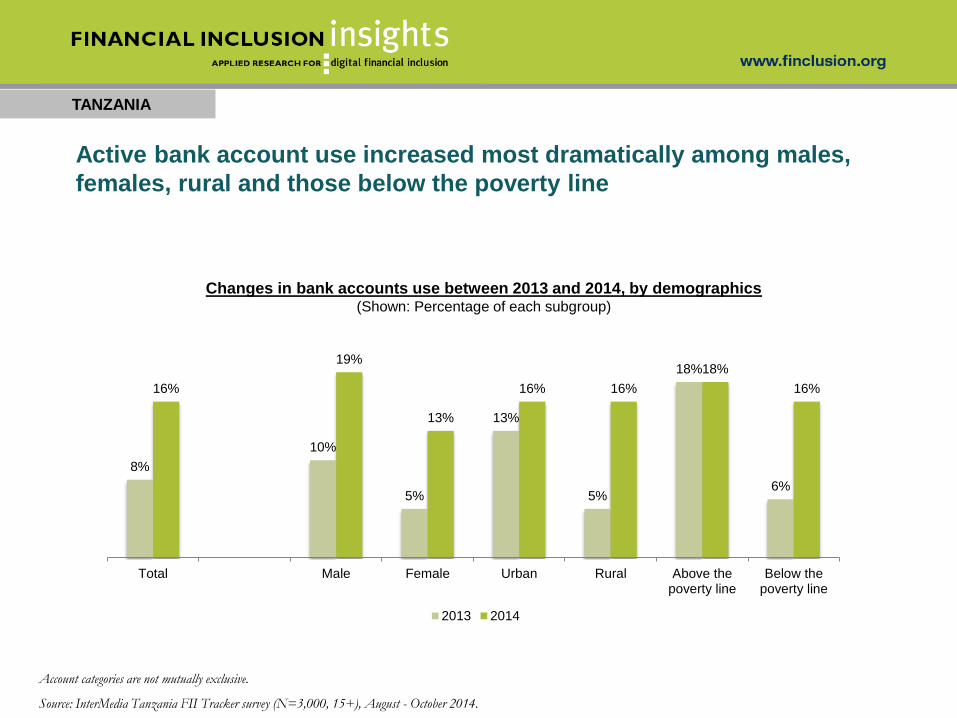
Changes in bank accounts use between 2013 and 2014, by demographics(Shown: Percentage of each subgroup)
Active bank account use increased most dramatically among males,
females, rural and those below the poverty line
8%
10%
5%
13%
5%
18%
6%
16%
19%
13%
16% 16%
18%
16%
Total Male Female Urban Rural Above thepoverty line
Below thepoverty line
2013 2014
TANZANIA
12
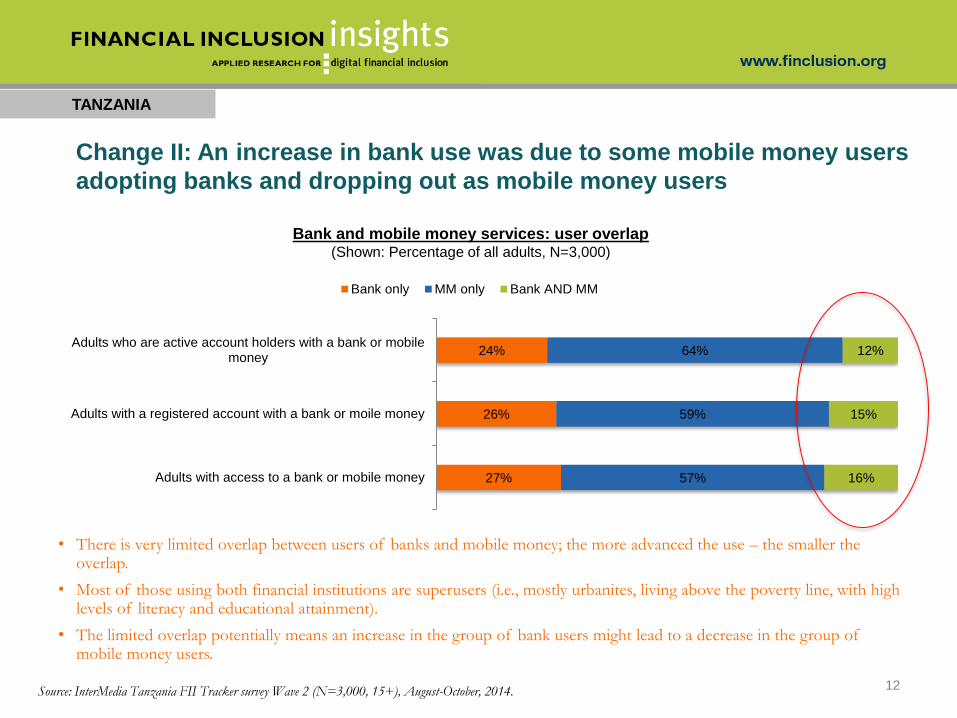
Bank and mobile money services: user overlap(Shown: Percentage of all adults, N=3,000)
Source: InterMedia Tanzania FII Tracker survey Wave 2 (N=3,000, 15+), August-October, 2014.
Change II: An increase in bank use was due to some mobile money users
adopting banks and dropping out as mobile money users
• There is very limited overlap between users of banks and mobile money; the more advanced the use – the smaller the overlap.
• Most of those using both financial institutions are superusers (i.e., mostly urbanites, living above the poverty line, with high levels of literacy and educational attainment).
• The limited overlap potentially means an increase in the group of bank users might lead to a decrease in the group of mobile money users.
27%
26%
24%
57%
59%
64%
16%
15%
12%
Adults with access to a bank or mobile money
Adults with a registered account with a bank or moile money
Adults who are active account holders with a bank or mobilemoney
Bank only MM only Bank AND MM
TANZANIA
Account categories are not mutually exclusive.
Source: InterMedia Tanzania FII Tracker survey (N=3,000, 15+), August - October 2014.
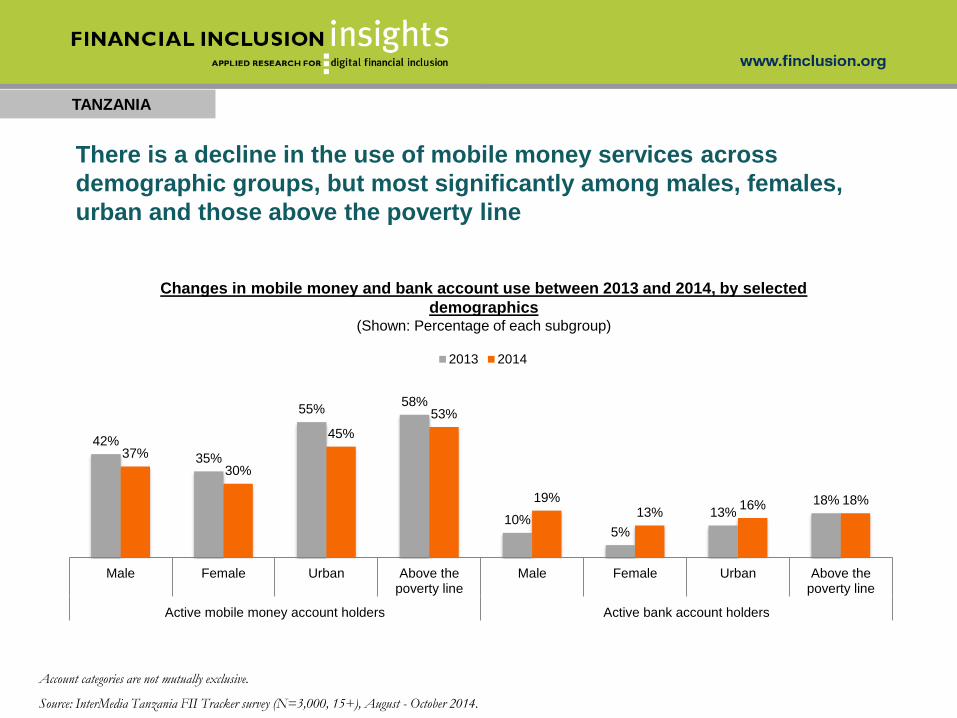
Changes in mobile money and bank account use between 2013 and 2014, by selected
demographics(Shown: Percentage of each subgroup)
There is a decline in the use of mobile money services across
demographic groups, but most significantly among males, females,
urban and those above the poverty line
42%
35%
55%58%
10%5%
13%18%
37%
30%
45%
53%
19%13%
16% 18%
Male Female Urban Above thepoverty line
Male Female Urban Above thepoverty line
Active mobile money account holders Active bank account holders
2013 2014
TANZANIA
14
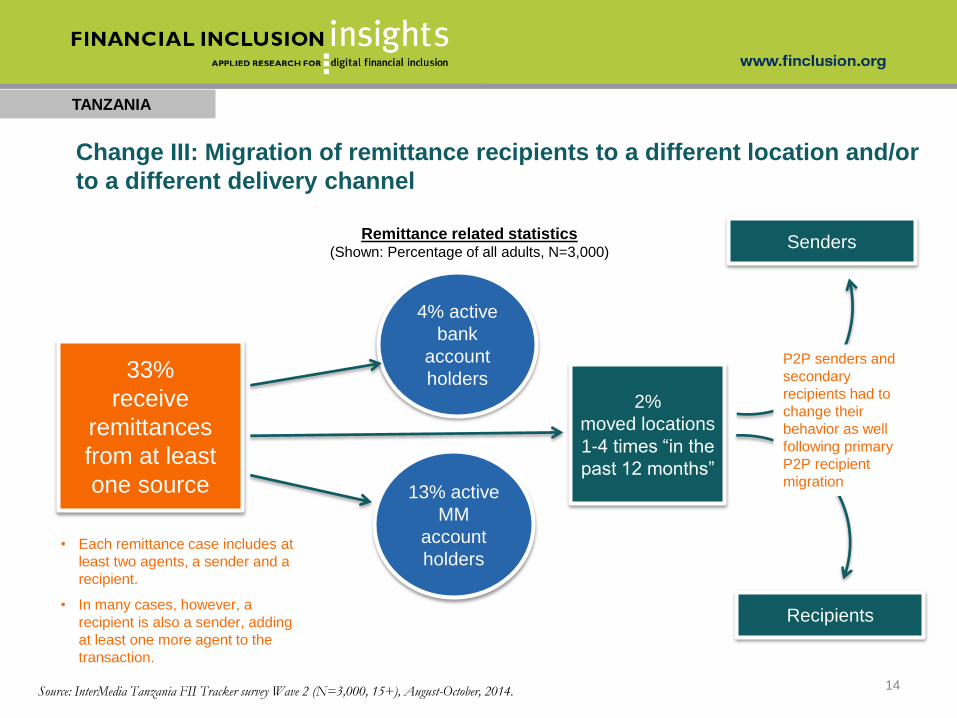
Remittance related statistics(Shown: Percentage of all adults, N=3,000)
Source: InterMedia Tanzania FII Tracker survey Wave 2 (N=3,000, 15+), August-October, 2014.
Change III: Migration of remittance recipients to a different location and/or
to a different delivery channel
• Each remittance case includes at
least two agents, a sender and a
recipient.
• In many cases, however, a
recipient is also a sender, adding
at least one more agent to the
transaction.
33%
receive
remittances
from at least
one source
4% active
bank
account
holders
13% active
MM
account
holders
2%
moved locations
1-4 times “in the
past 12 months”
Senders
Recipients
P2P senders and
secondary
recipients had to
change their
behavior as well
following primary
P2P recipient
migration
TANZANIA
15
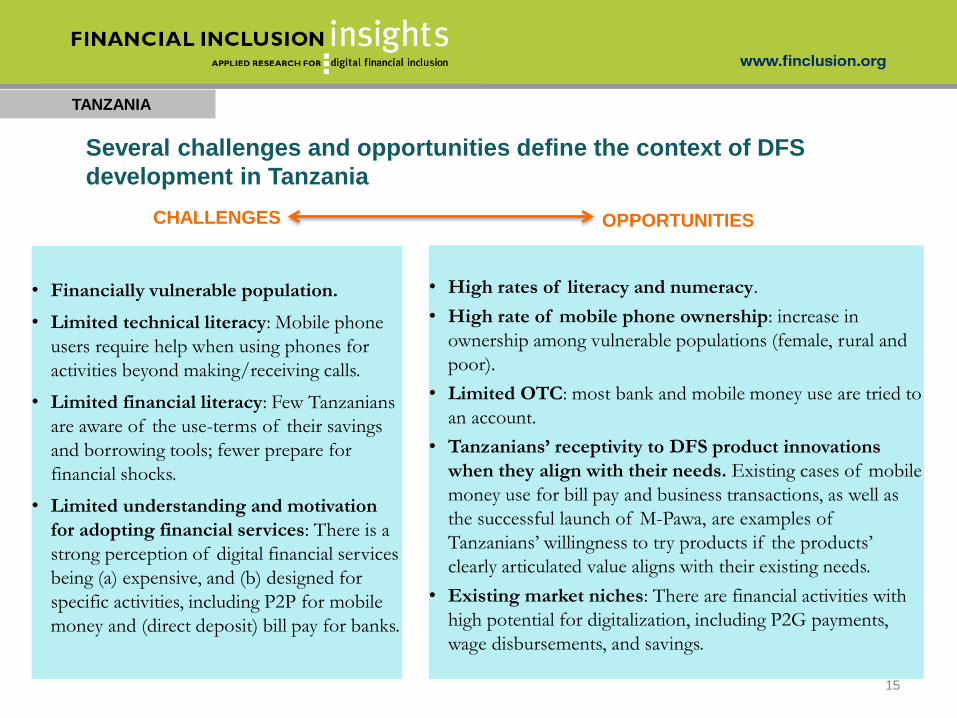
• Financially vulnerable population.
• Limited technical literacy: Mobile phone
users require help when using phones for
activities beyond making/receiving calls.
• Limited financial literacy: Few Tanzanians
are aware of the use-terms of their savings
and borrowing tools; fewer prepare for
financial shocks.
• Limited understanding and motivation
for adopting financial services: There is a
strong perception of digital financial services
being (a) expensive, and (b) designed for
specific activities, including P2P for mobile
money and (direct deposit) bill pay for banks.
Several challenges and opportunities define the context of DFS
development in Tanzania
CHALLENGES OPPORTUNITIES
• High rates of literacy and numeracy.
• High rate of mobile phone ownership: increase in
ownership among vulnerable populations (female, rural and
poor).
• Limited OTC: most bank and mobile money use are tried to
an account.
• Tanzanians’ receptivity to DFS product innovations
when they align with their needs. Existing cases of mobile
money use for bill pay and business transactions, as well as
the successful launch of M-Pawa, are examples of
Tanzanians’ willingness to try products if the products’
clearly articulated value aligns with their existing needs.
• Existing market niches: There are financial activities with
high potential for digitalization, including P2G payments,
wage disbursements, and savings.
TANZANIA
16
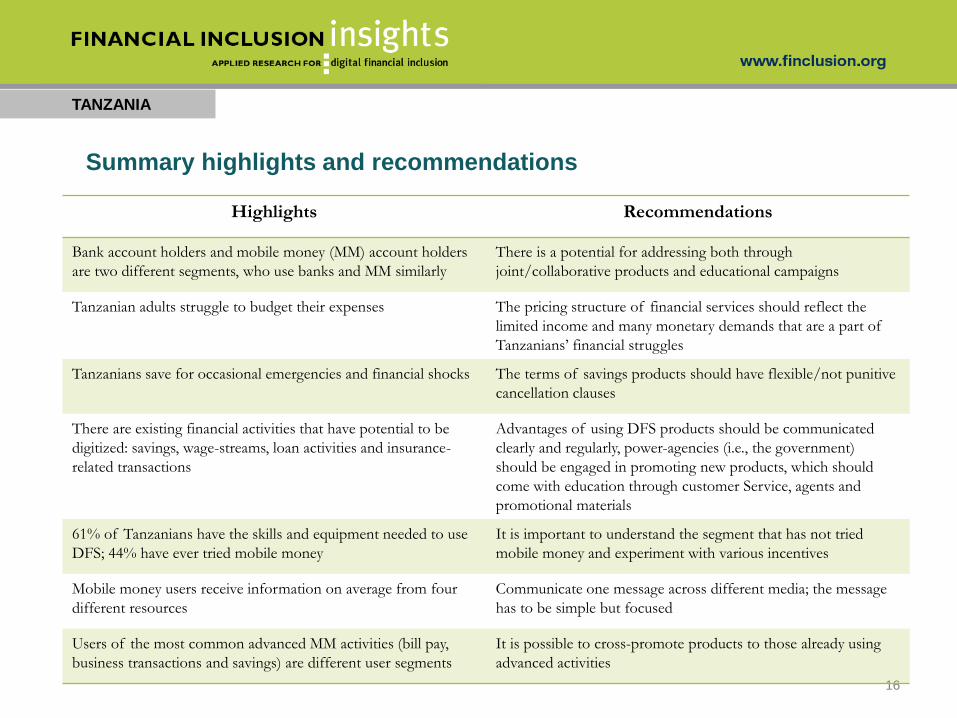
Summary highlights and recommendations
Highlights Recommendations
Bank account holders and mobile money (MM) account holders
are two different segments, who use banks and MM similarly
There is a potential for addressing both through
joint/collaborative products and educational campaigns
Tanzanian adults struggle to budget their expenses The pricing structure of financial services should reflect the
limited income and many monetary demands that are a part of
Tanzanians’ financial struggles
Tanzanians save for occasional emergencies and financial shocks The terms of savings products should have flexible/not punitive
cancellation clauses
There are existing financial activities that have potential to be
digitized: savings, wage-streams, loan activities and insurance-
related transactions
Advantages of using DFS products should be communicated
clearly and regularly, power-agencies (i.e., the government)
should be engaged in promoting new products, which should
come with education through customer Service, agents and
promotional materials
61% of Tanzanians have the skills and equipment needed to use
DFS; 44% have ever tried mobile money
It is important to understand the segment that has not tried
mobile money and experiment with various incentives
Mobile money users receive information on average from four
different resources
Communicate one message across different media; the message
has to be simple but focused
Users of the most common advanced MM activities (bill pay,
business transactions and savings) are different user segments
It is possible to cross-promote products to those already using
advanced activities
TANZANIA
17
CHANGES TO THE TANZANIAN
FINANCIAL INCLUSION
ECOSYSTEM IN 2013-2014
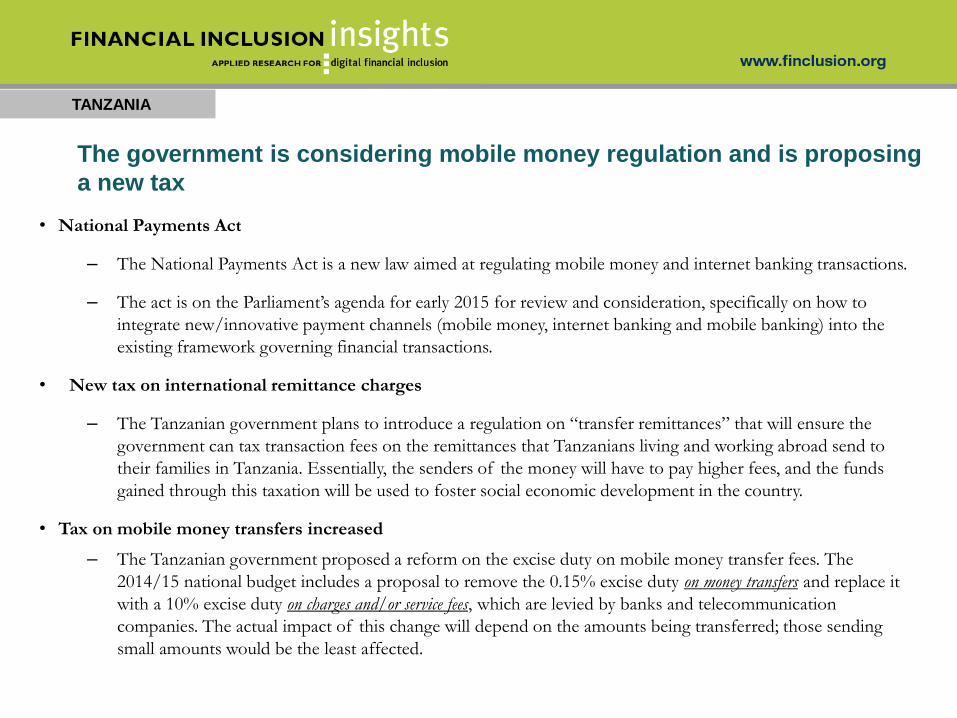
• National Payments Act
– The National Payments Act is a new law aimed at regulating mobile money and internet banking transactions.
– The act is on the Parliament’s agenda for early 2015 for review and consideration, specifically on how to
integrate new/innovative payment channels (mobile money, internet banking and mobile banking) into the
existing framework governing financial transactions.
• New tax on international remittance charges
– The Tanzanian government plans to introduce a regulation on “transfer remittances” that will ensure the
government can tax transaction fees on the remittances that Tanzanians living and working abroad send to
their families in Tanzania. Essentially, the senders of the money will have to pay higher fees, and the funds
gained through this taxation will be used to foster social economic development in the country.
• Tax on mobile money transfers increased
– The Tanzanian government proposed a reform on the excise duty on mobile money transfer fees. The
2014/15 national budget includes a proposal to remove the 0.15% excise duty on money transfers and replace it
with a 10% excise duty on charges and/or service fees, which are levied by banks and telecommunication
companies. The actual impact of this change will depend on the amounts being transferred; those sending
small amounts would be the least affected.
TANZANIA
The government is considering mobile money regulation and is proposing
a new tax
• Interoperability expands the boundaries for mobile money transfers.
– In August 2014, Tanzania’s mobile networks, Tigo, Airtel and Zantel, announced Africa’s first mobile money
interoperability agreement allowing mobile money customers to transfer cash to each other regardless of
which of the three provider networks they use.
• Mobile money agents lead in profitability among agents in other EA countries.
– Mobile money agents in Tanzania reportedly make a substantial profit, with 49 percent earning at least $100
per month in profits compared with only 40 percent in Uganda (Agent Network Accelerator Survey in
Tanzania, 2013, Microsave).
• A new entrant in the telecom space is launched, as the number of mobile money users grows.
– Smart Telecom was launched in the Tanzania market in April 2014 and will introduce Smart Mobile Money
in 2015.
– Vodacom reports adding as many as 150,000 M-Pesa customers a month, while Tigo Tanzania reports an
addition of over 1 million mobile money users in the year 2013-2014.
• Tigo Pesa shares profits with users.
– Tigo Pesa will distribute a portion of the profits accumulated in the Tigo Pesa Trust Account to Tigo Pesa
account holders, making Tigo Pesa the first telecom company in the world to do so. This move will likely
result in a spike in uptake of the Tigo Pesa mobile money services with some users getting a second and
third account, and some switching from other providers to Tigo Pesa.
TANZANIA
Tanzania’s telecoms become interoperable amidst increasing numbers of
offers and users in the sector
The government encourages expansion of banking coverage
• A push for community banks is being made.
– The Tanzanian government understands that access to banks is an important element in efforts to fight
poverty and improve the welfare of its citizens. However, establishing formal bank branches in remote
areas is a costly and time-consuming process. Hence, the Finance Ministry is collaborating with the Bank
of Tanzania (BoT) and the Parliament to develop a network of community banks. The residents of remote
communities, which are currently not covered by traditional banks, can lobby for the establishment of a
community bank and request assistance from the Tanzanian government. The role of the BoT and the
Parliament is to establish a legal framework and the licensing procedure to ensure that community banks
are in compliance with the overall Tanzanian financial rules and regulations.
• The field is set for banking agent expansion.
– The government established guidelines for agency banking in September 2012. Following this, in 2013,
CRDB Bank launched its agency banking network, Fahari Huduma. The government is encouraging more
banks to establish agency banking networks. Since banking agents are mobile, having an extended banking
agent network helps banks significantly increase their coverage of rural and remote areas at a lower cost
than would be required to establish brick-and-mortar bank branches.
• National IDs are increasing access to banks.
– The new Tanzania National ID cards are being accepted by banks as a legal source of customer
information, providing users with easier access to bank products, including loans.
TANZANIA
Tigo Pesa leads in digital space innovations
• Value-added products and service innovations increase.
– In May 2014, Vodacom Tanzania and Commercial Bank of Africa launched a banking
service called M-Pawa allowing Tanzanians to have an interest-bearing savings account and
borrow money via their mobile phones.
– Tigo Tanzania launched Tigo Wekeza (Tigo Invests), the world’s first mobile money service
that allows customers to earn interest on their balances, which is deposited to their accounts
via automatic cash returns. The product was unveiled in September 2014.
– In August 2014, Equity Bank launched its latest innovation, EAZZY 24/7 mobile banking, a
platform that allows customers to access banking services using their mobile. The service is
accessible through Vodacom, Airtel, Tigo and Zantel.
TANZANIA
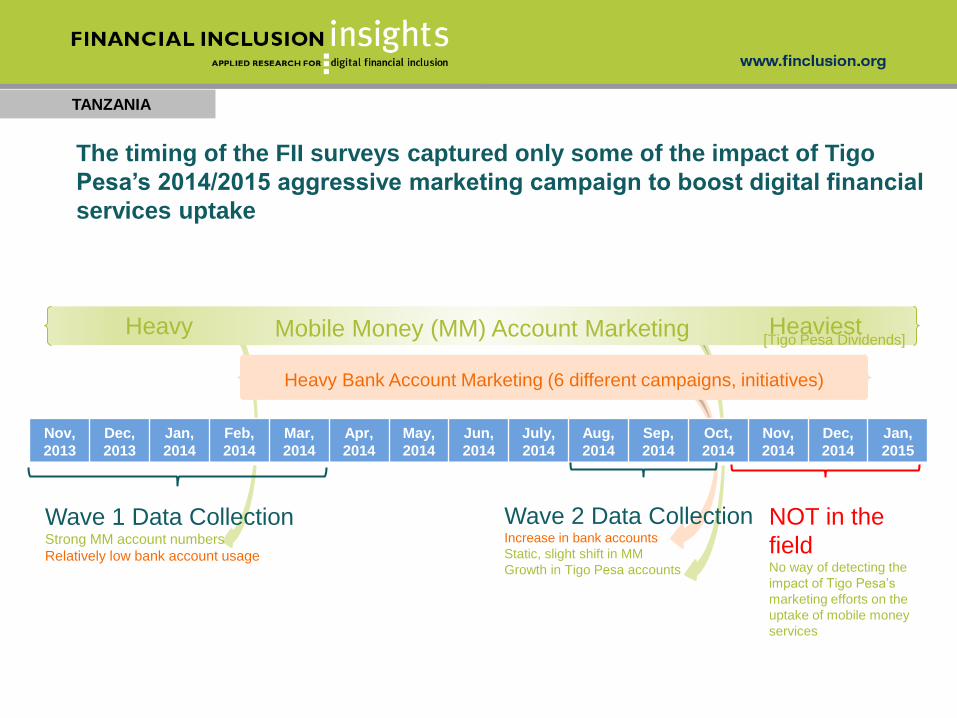
Mobile Money (MM) Account Marketing
TANZANIA
Nov,
2013
Dec,
2013
Jan,
2014
Feb,
2014
Mar,
2014
Apr,
2014
May,
2014
Jun,
2014
July,
2014
Aug,
2014
Sep,
2014
Oct,
2014
Nov,
2014
Dec,
2014
Jan,
2015
Wave 1 Data CollectionStrong MM account numbers
Relatively low bank account usage
Wave 2 Data CollectionIncrease in bank accounts
Static, slight shift in MM
Growth in Tigo Pesa accounts
Heavy Bank Account Marketing (6 different campaigns, initiatives)
Heavy Heaviest[Tigo Pesa Dividends]
NOT in the
fieldNo way of detecting the
impact of Tigo Pesa’s
marketing efforts on the
uptake of mobile money
services
The timing of the FII surveys captured only some of the impact of Tigo
Pesa’s 2014/2015 aggressive marketing campaign to boost digital financial
services uptake

CONTEXT: CONSUMER PROFILE
TANZANIA
23
TANZANIA
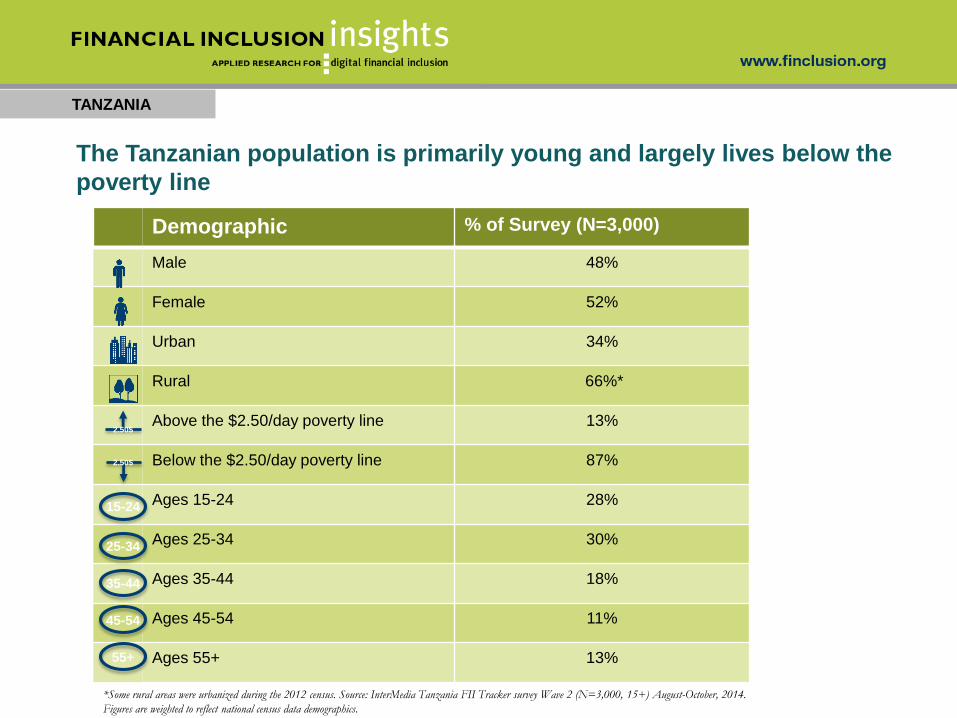
The Tanzanian population is primarily young and largely lives below the
poverty line
Demographic % of Survey (N=3,000)
Male 48%
Female 52%
Urban 34%
Rural 66%*
Above the $2.50/day poverty line 13%
Below the $2.50/day poverty line 87%
Ages 15-24 28%
Ages 25-34 30%
Ages 35-44 18%
Ages 45-54 11%
Ages 55+ 13%
2.50$
2.50$
15-24
25-34
35-44
45-54
55+
*Some rural areas were urbanized during the 2012 census. Source: InterMedia Tanzania FII Tracker survey Wave 2 (N=3,000, 15+) August-October, 2014.
Figures are weighted to reflect national census data demographics.
TANZANIA
25
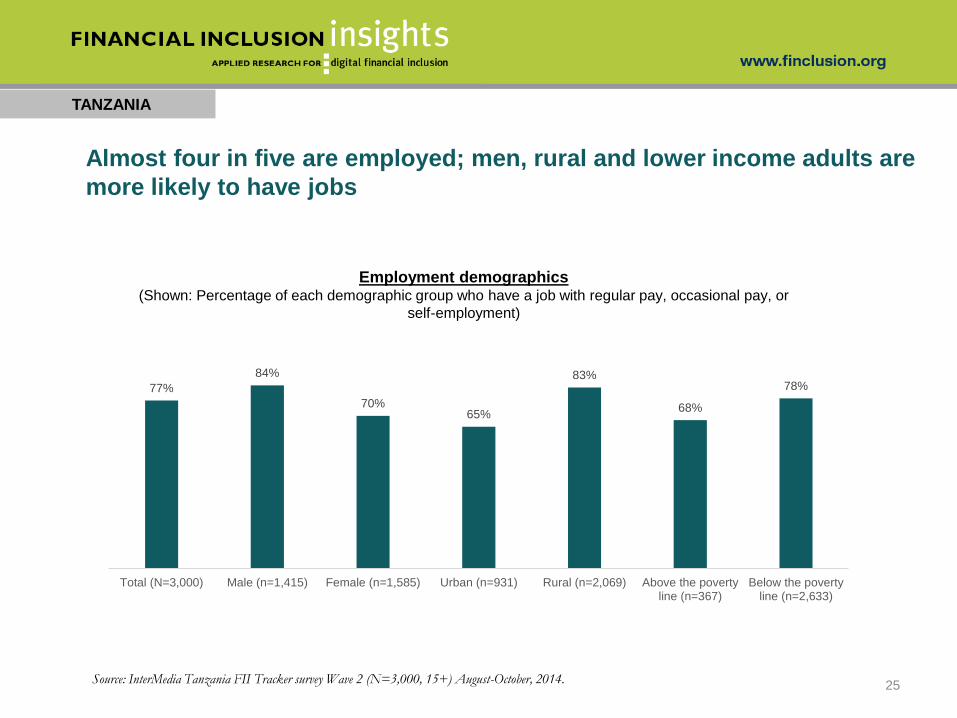
Almost four in five are employed; men, rural and lower income adults are
more likely to have jobs
Employment demographics(Shown: Percentage of each demographic group who have a job with regular pay, occasional pay, or
self-employment)
77%
84%
70%65%
83%
68%
78%
Total (N=3,000) Male (n=1,415) Female (n=1,585) Urban (n=931) Rural (n=2,069) Above the povertyline (n=367)
Below the povertyline (n=2,633)
Source: InterMedia Tanzania FII Tracker survey Wave 2 (N=3,000, 15+) August-October, 2014.
TANZANIA
26
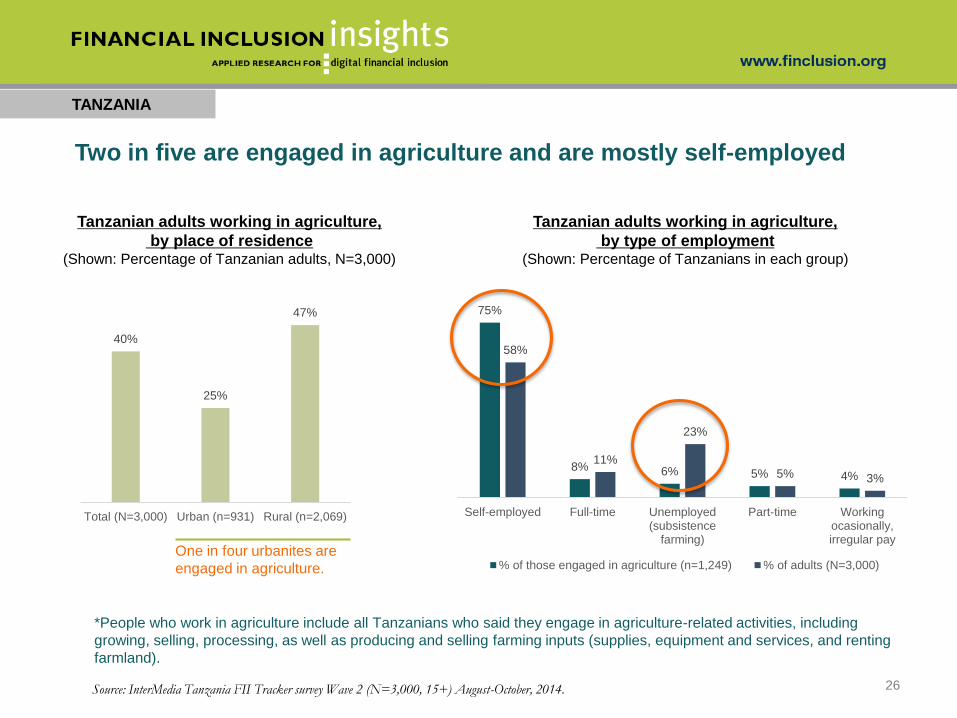
Two in five are engaged in agriculture and are mostly self-employed
Tanzanian adults working in agriculture,
by type of employment(Shown: Percentage of Tanzanians in each group)
Tanzanian adults working in agriculture,
by place of residence(Shown: Percentage of Tanzanian adults, N=3,000)
40%
25%
47%
Total (N=3,000) Urban (n=931) Rural (n=2,069)
One in four urbanites are
engaged in agriculture.
*People who work in agriculture include all Tanzanians who said they engage in agriculture-related activities, including
growing, selling, processing, as well as producing and selling farming inputs (supplies, equipment and services, and renting
farmland).
Source: InterMedia Tanzania FII Tracker survey Wave 2 (N=3,000, 15+) August-October, 2014.
75%
8% 6% 5% 4%
58%
11%
23%
5% 3%
Self-employed Full-time Unemployed(subsistence
farming)
Part-time Workingocasionally,irregular pay
% of those engaged in agriculture (n=1,249) % of adults (N=3,000)
TANZANIA
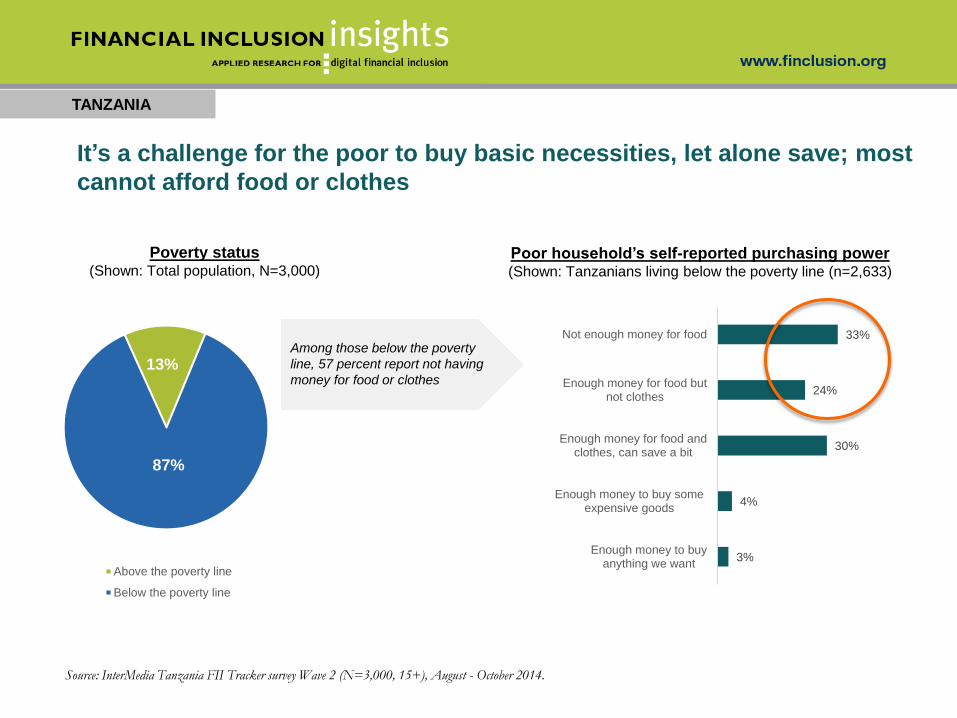
It’s a challenge for the poor to buy basic necessities, let alone save; most
cannot afford food or clothes
Poor household’s self-reported purchasing power (Shown: Tanzanians living below the poverty line (n=2,633)
Poverty status (Shown: Total population, N=3,000)
Source: InterMedia Tanzania FII Tracker survey Wave 2 (N=3,000, 15+), August - October 2014.
Among those below the poverty
line, 57 percent report not having
money for food or clothes13%
87%
Above the poverty line
Below the poverty line
3%
4%
30%
24%
33%
Enough money to buyanything we want
Enough money to buy someexpensive goods
Enough money for food andclothes, can save a bit
Enough money for food butnot clothes
Not enough money for food
TANZANIA
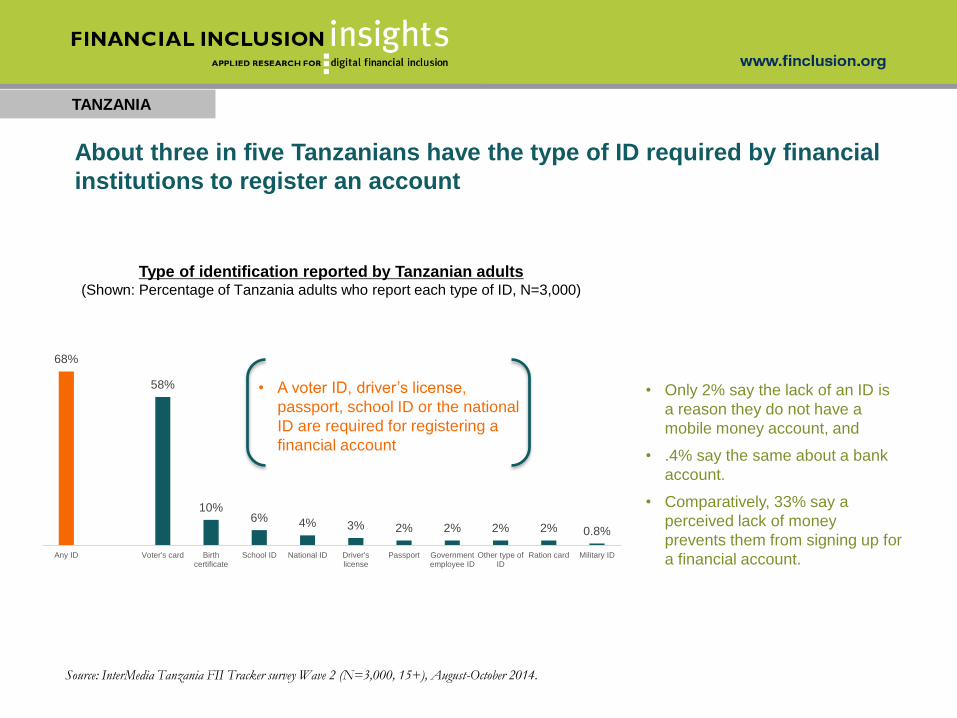
Type of identification reported by Tanzanian adults(Shown: Percentage of Tanzania adults who report each type of ID, N=3,000)
68%
58%
10%6% 4% 3% 2% 2% 2% 2% 0.8%
Any ID Voter's card Birthcertificate
School ID National ID Driver'slicense
Passport Governmentemployee ID
Other type ofID
Ration card Military ID
• Only 2% say the lack of an ID is
a reason they do not have a
mobile money account, and
• .4% say the same about a bank
account.
• Comparatively, 33% say a
perceived lack of money
prevents them from signing up for
a financial account.
Source: InterMedia Tanzania FII Tracker survey Wave 2 (N=3,000, 15+), August-October 2014.
About three in five Tanzanians have the type of ID required by financial
institutions to register an account
• A voter ID, driver’s license,
passport, school ID or the national
ID are required for registering a
financial account
TANZANIA
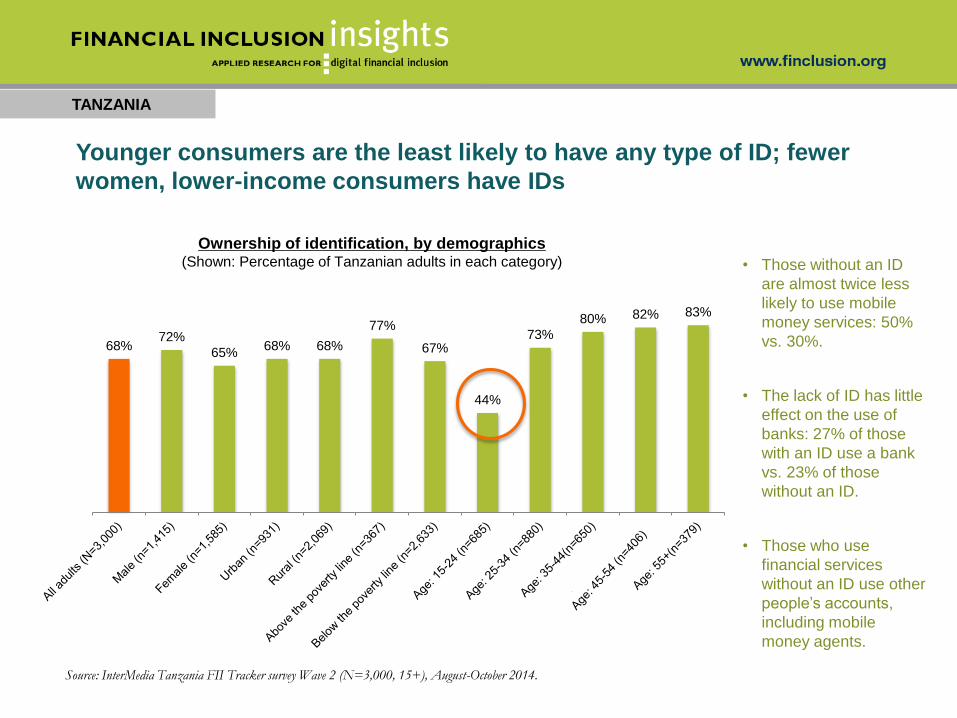
Younger consumers are the least likely to have any type of ID; fewer
women, lower-income consumers have IDs
Ownership of identification, by demographics(Shown: Percentage of Tanzanian adults in each category)
Source: InterMedia Tanzania FII Tracker survey Wave 2 (N=3,000, 15+), August-October 2014.
68%72%
65%68% 68%
77%
67%
44%
73%
80% 82% 83%
• Those without an ID
are almost twice less
likely to use mobile
money services: 50%
vs. 30%.
• The lack of ID has little
effect on the use of
banks: 27% of those
with an ID use a bank
vs. 23% of those
without an ID.
• Those who use
financial services
without an ID use other
people’s accounts,
including mobile
money agents.
TANZANIANS' MOBILE PHONE USE
TANZANIA
30
TANZANIA
31
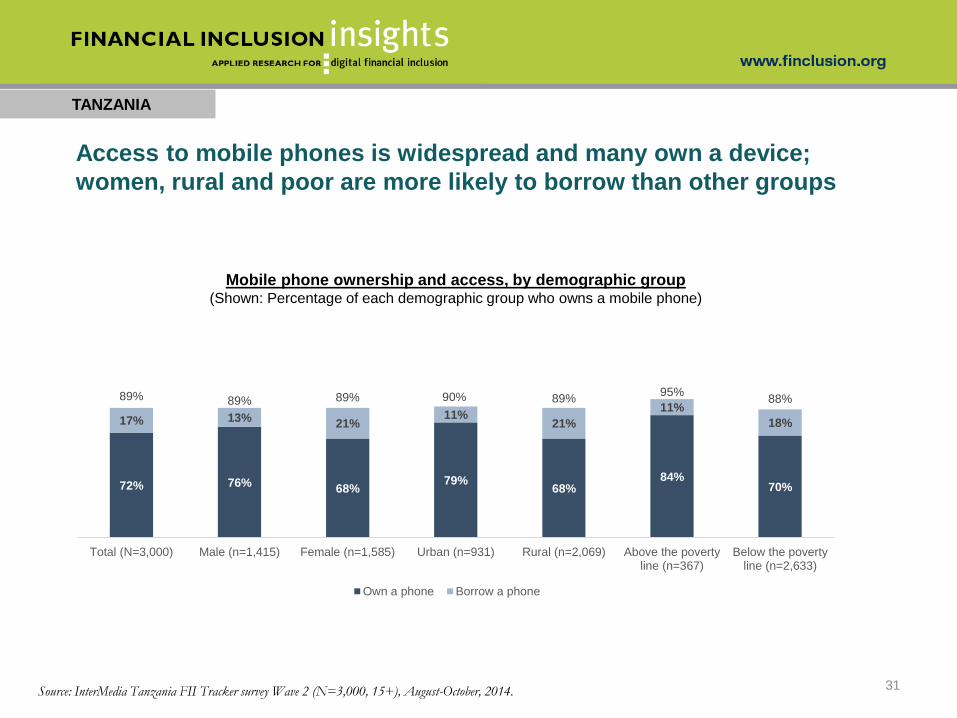
Access to mobile phones is widespread and many own a device;
women, rural and poor are more likely to borrow than other groups
Mobile phone ownership and access, by demographic group(Shown: Percentage of each demographic group who owns a mobile phone)
Source: InterMedia Tanzania FII Tracker survey Wave 2 (N=3,000, 15+), August-October, 2014.
72% 76%68%
79%68%
84%70%
17% 13%21%
11%21%
11%
18%
89% 89% 89% 90% 89%95%
88%
Total (N=3,000) Male (n=1,415) Female (n=1,585) Urban (n=931) Rural (n=2,069) Above the povertyline (n=367)
Below the povertyline (n=2,633)
Own a phone Borrow a phone
TANZANIA
32
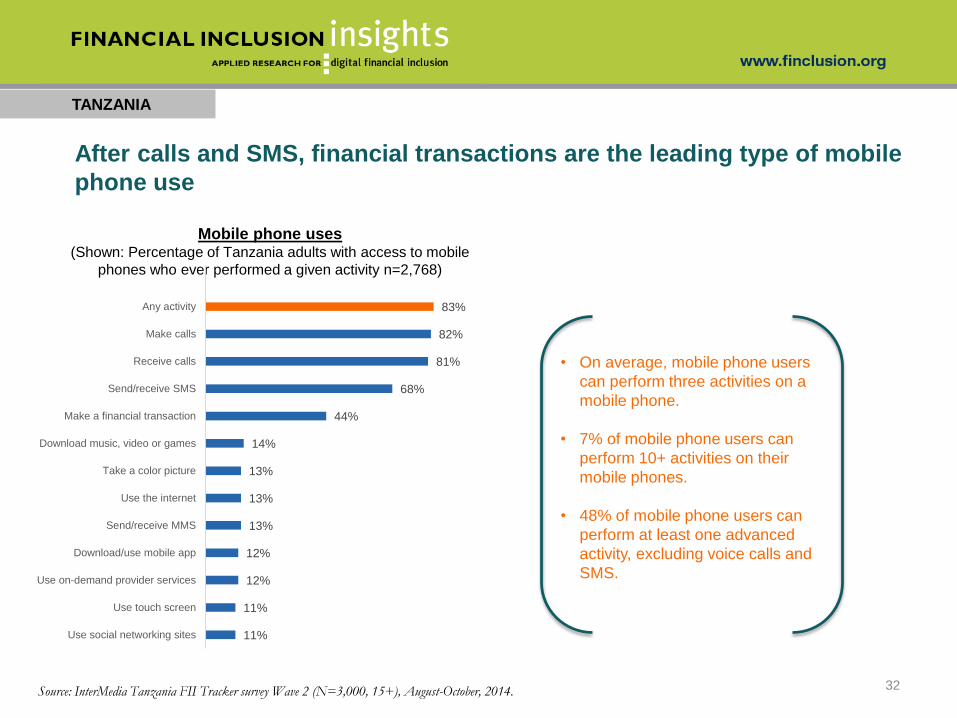
After calls and SMS, financial transactions are the leading type of mobile
phone use
Mobile phone uses(Shown: Percentage of Tanzania adults with access to mobile
phones who ever performed a given activity n=2,768)
11%
11%
12%
12%
13%
13%
13%
14%
44%
68%
81%
82%
83%
Use social networking sites
Use touch screen
Use on-demand provider services
Download/use mobile app
Send/receive MMS
Use the internet
Take a color picture
Download music, video or games
Make a financial transaction
Send/receive SMS
Receive calls
Make calls
Any activity
Source: InterMedia Tanzania FII Tracker survey Wave 2 (N=3,000, 15+), August-October, 2014.
• On average, mobile phone users
can perform three activities on a
mobile phone.
• 7% of mobile phone users can
perform 10+ activities on their
mobile phones.
• 48% of mobile phone users can
perform at least one advanced
activity, excluding voice calls and
SMS.
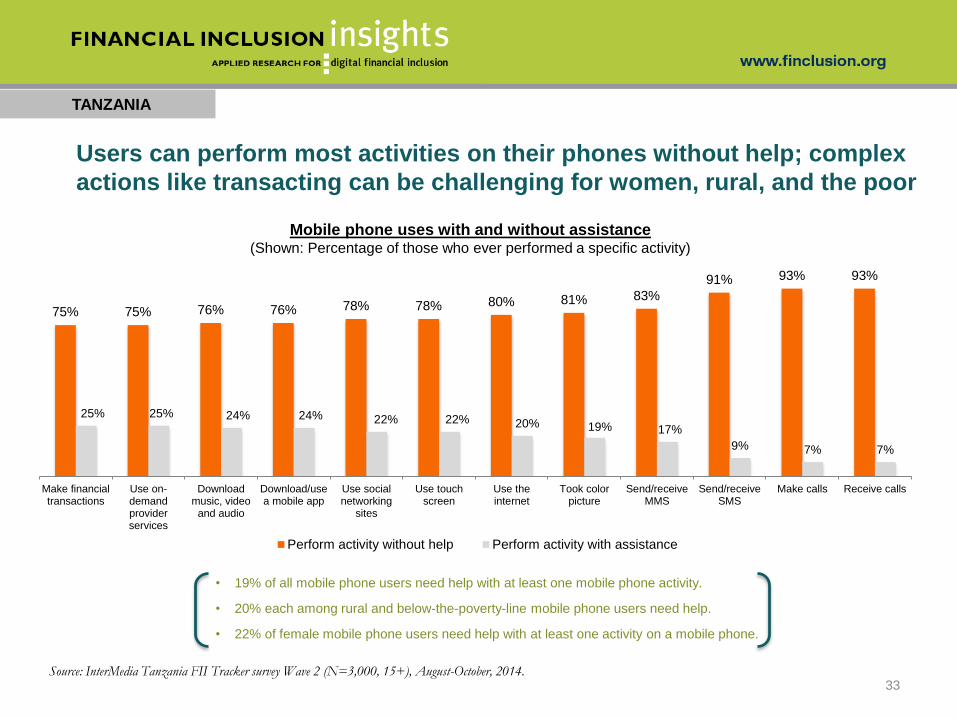
Users can perform most activities on their phones without help; complex
actions like transacting can be challenging for women, rural, and the poor
TANZANIA
33
Mobile phone uses with and without assistance(Shown: Percentage of those who ever performed a specific activity)
Source: InterMedia Tanzania FII Tracker survey Wave 2 (N=3,000, 15+), August-October, 2014.
75% 75% 76% 76% 78% 78% 80% 81% 83%
91% 93% 93%
25% 25% 24% 24% 22% 22% 20% 19% 17%
9% 7% 7%
Make financialtransactions
Use on-demandproviderservices
Downloadmusic, video
and audio
Download/usea mobile app
Use socialnetworking
sites
Use touchscreen
Use theinternet
Took colorpicture
Send/receiveMMS
Send/receiveSMS
Make calls Receive calls
Perform activity without help Perform activity with assistance
• 19% of all mobile phone users need help with at least one mobile phone activity.
• 20% each among rural and below-the-poverty-line mobile phone users need help.
• 22% of female mobile phone users need help with at least one activity on a mobile phone.
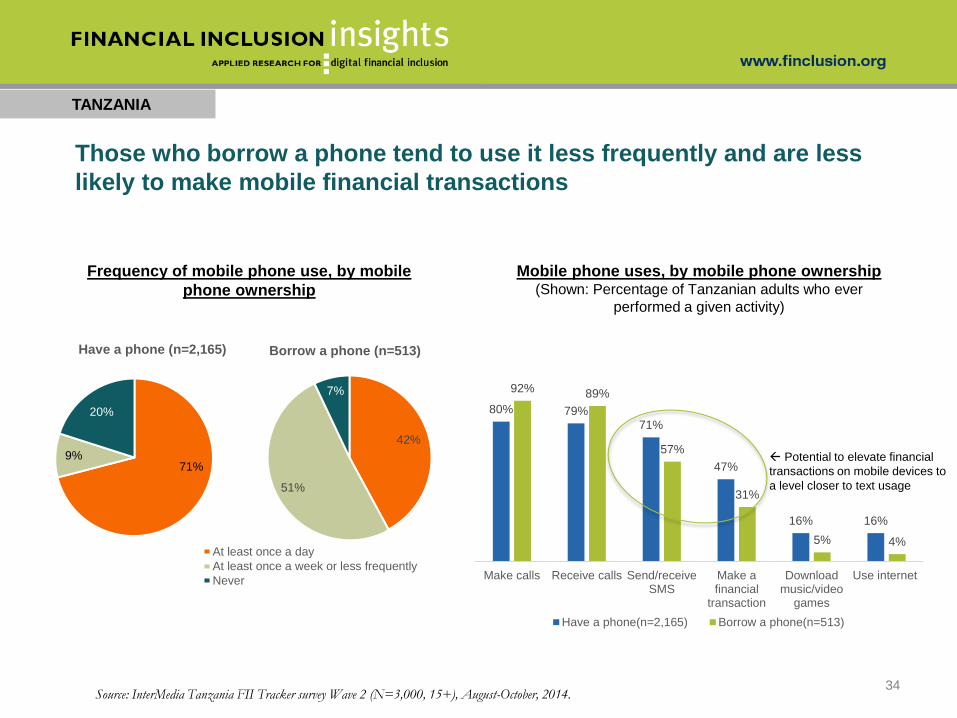
42%
51%
7%
Borrow a phone (n=513)
At least once a day
At least once a week or less frequently
Never
TANZANIA
34
Those who borrow a phone tend to use it less frequently and are less
likely to make mobile financial transactions
71%9%
20%
Have a phone (n=2,165)
Frequency of mobile phone use, by mobile
phone ownership
Source: InterMedia Tanzania FII Tracker survey Wave 2 (N=3,000, 15+), August-October, 2014.
80% 79%71%
47%
16% 16%
92% 89%
57%
31%
5% 4%
Make calls Receive calls Send/receiveSMS
Make afinancial
transaction
Downloadmusic/video
games
Use internet
Have a phone(n=2,165) Borrow a phone(n=513)
Mobile phone uses, by mobile phone ownership(Shown: Percentage of Tanzanian adults who ever
performed a given activity)
Potential to elevate financial
transactions on mobile devices to
a level closer to text usage
TANZANIA
35
TANZANIANS' FINANCIAL BEHAVIORS
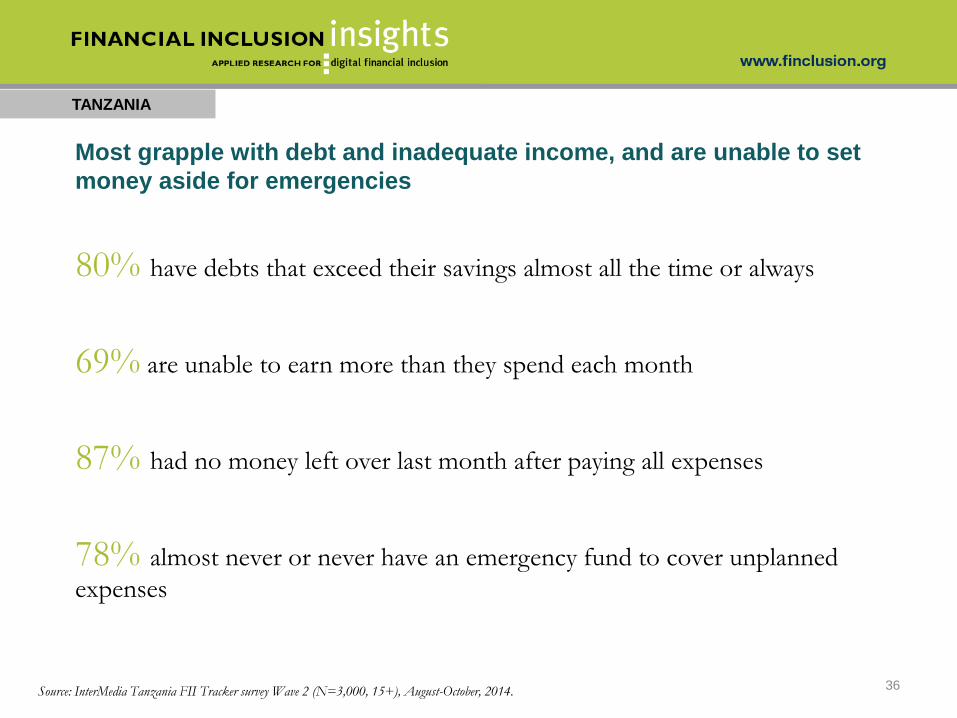
Most grapple with debt and inadequate income, and are unable to set
money aside for emergencies
TANZANIA
80% have debts that exceed their savings almost all the time or always
69% are unable to earn more than they spend each month
87% had no money left over last month after paying all expenses
78% almost never or never have an emergency fund to cover unplanned
expenses
36Source: InterMedia Tanzania FII Tracker survey Wave 2 (N=3,000, 15+), August-October, 2014.
TANZANIA
37
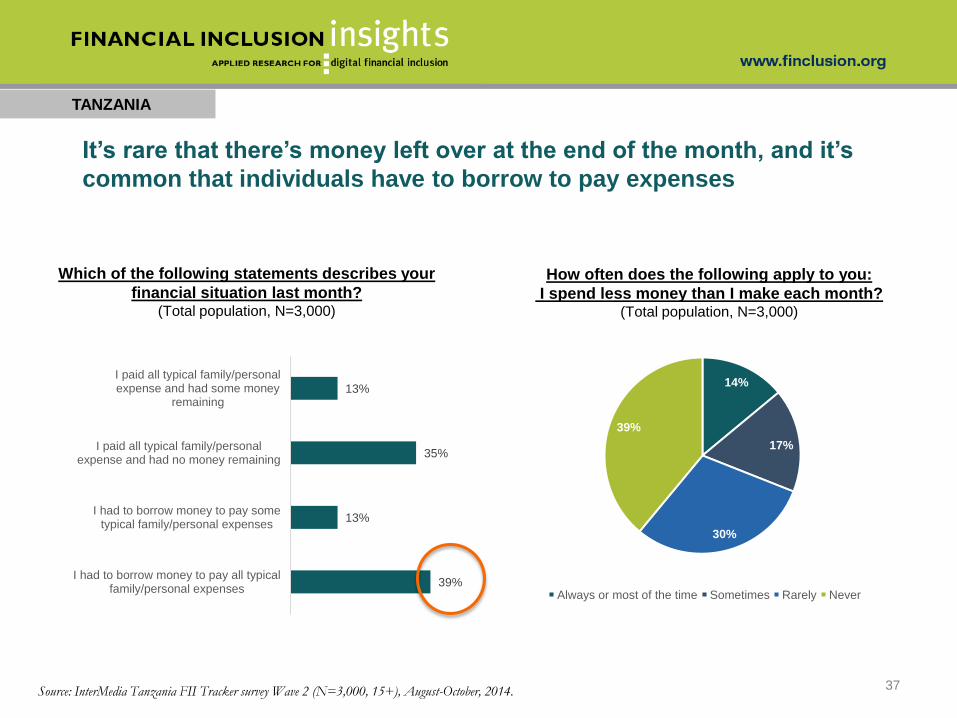
39%
13%
35%
13%
I had to borrow money to pay all typicalfamily/personal expenses
I had to borrow money to pay sometypical family/personal expenses
I paid all typical family/personalexpense and had no money remaining
I paid all typical family/personalexpense and had some money
remaining
14%
17%
30%
39%
Always or most of the time Sometimes Rarely Never
How often does the following apply to you:
I spend less money than I make each month?(Total population, N=3,000)
Which of the following statements describes your
financial situation last month?(Total population, N=3,000)
Source: InterMedia Tanzania FII Tracker survey Wave 2 (N=3,000, 15+), August-October, 2014.
It’s rare that there’s money left over at the end of the month, and it’s
common that individuals have to borrow to pay expenses
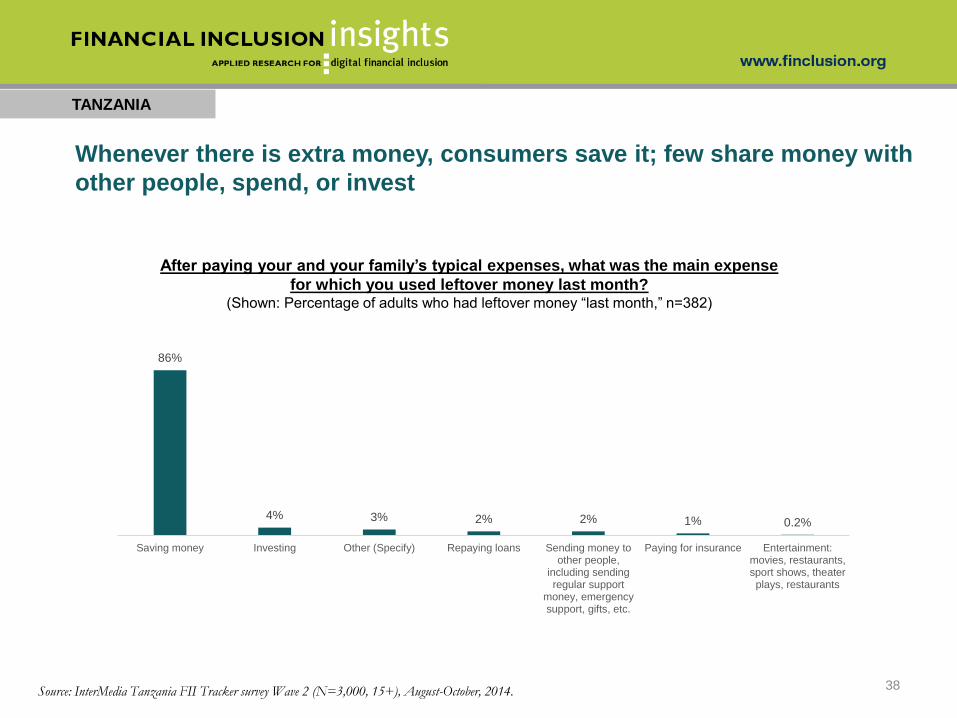
Whenever there is extra money, consumers save it; few share money with
other people, spend, or invest
TANZANIA
38
86%
4% 3% 2% 2% 1% 0.2%
Saving money Investing Other (Specify) Repaying loans Sending money toother people,
including sendingregular support
money, emergencysupport, gifts, etc.
Paying for insurance Entertainment:movies, restaurants,sport shows, theaterplays, restaurants
After paying your and your family’s typical expenses, what was the main expense
for which you used leftover money last month?(Shown: Percentage of adults who had leftover money “last month,” n=382)
Source: InterMedia Tanzania FII Tracker survey Wave 2 (N=3,000, 15+), August-October, 2014.
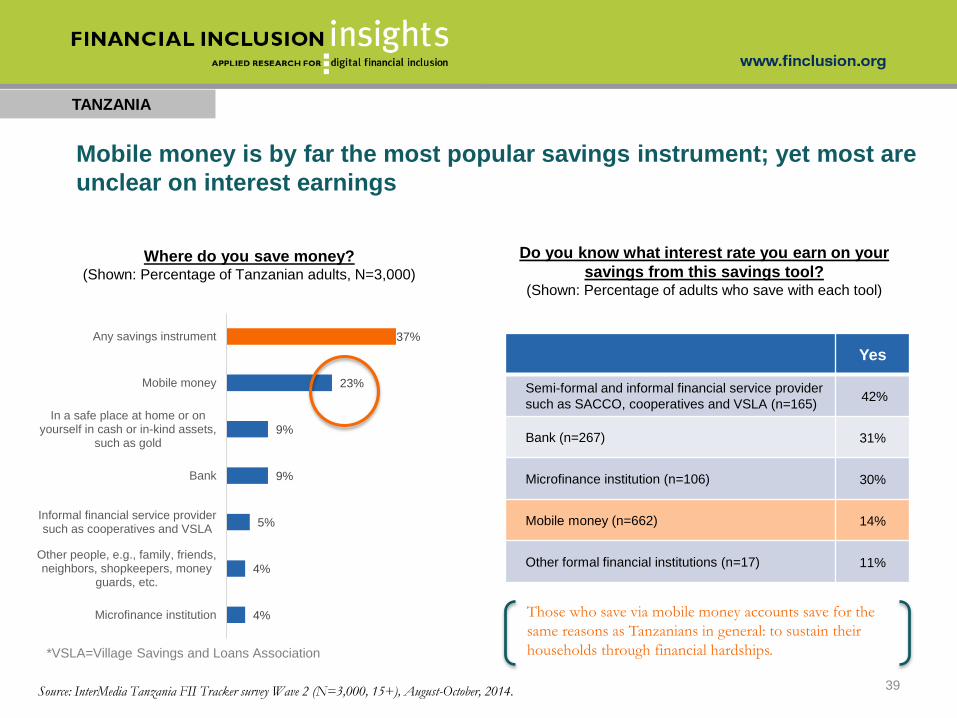
Mobile money is by far the most popular savings instrument; yet most are
unclear on interest earnings
TANZANIA
39
Yes
Semi-formal and informal financial service provider
such as SACCO, cooperatives and VSLA (n=165)42%
Bank (n=267) 31%
Microfinance institution (n=106) 30%
Mobile money (n=662) 14%
Other formal financial institutions (n=17) 11%
Do you know what interest rate you earn on your
savings from this savings tool?(Shown: Percentage of adults who save with each tool)
Source: InterMedia Tanzania FII Tracker survey Wave 2 (N=3,000, 15+), August-October, 2014.
4%
4%
5%
9%
9%
23%
37%
Microfinance institution
Other people, e.g., family, friends,neighbors, shopkeepers, money
guards, etc.
Informal financial service providersuch as cooperatives and VSLA
Bank
In a safe place at home or onyourself in cash or in-kind assets,
such as gold
Mobile money
Any savings instrument
Where do you save money?(Shown: Percentage of Tanzanian adults, N=3,000)
Those who save via mobile money accounts save for the
same reasons as Tanzanians in general: to sustain their
households through financial hardships.*VSLA=Village Savings and Loans Association
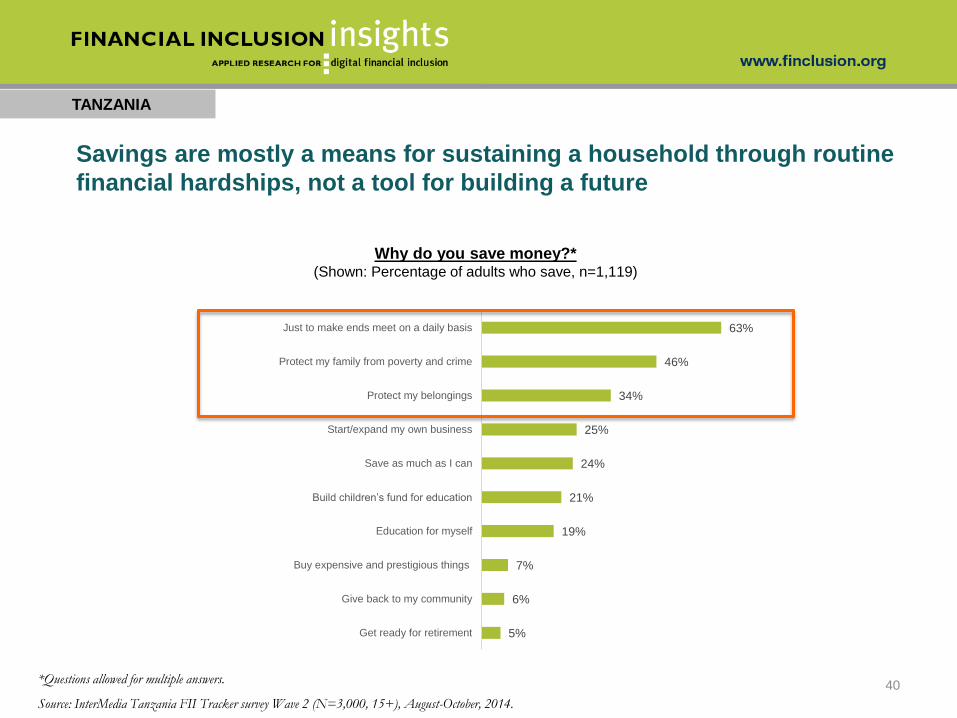
Savings are mostly a means for sustaining a household through routine
financial hardships, not a tool for building a future
TANZANIA
40
5%
6%
7%
19%
21%
24%
25%
34%
46%
63%
Get ready for retirement
Give back to my community
Buy expensive and prestigious things
Education for myself
Build children’s fund for education
Save as much as I can
Start/expand my own business
Protect my belongings
Protect my family from poverty and crime
Just to make ends meet on a daily basis
Why do you save money?*(Shown: Percentage of adults who save, n=1,119)
*Questions allowed for multiple answers.
Source: InterMedia Tanzania FII Tracker survey Wave 2 (N=3,000, 15+), August-October, 2014.
TANZANIA
41
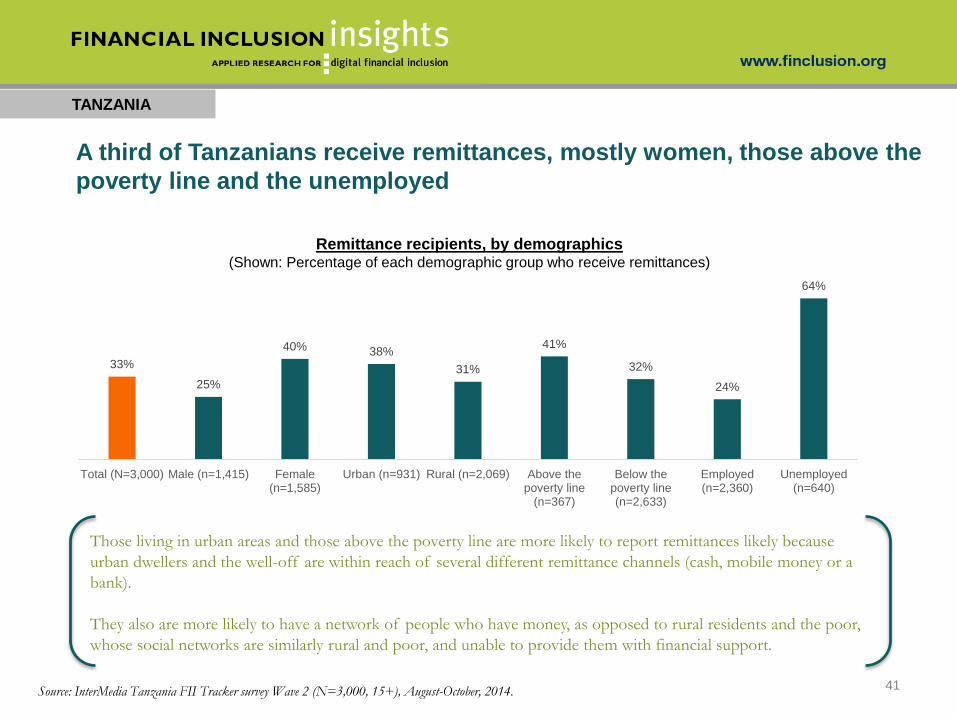
33%
25%
40% 38%
31%
41%
32%
24%
64%
Total (N=3,000) Male (n=1,415) Female(n=1,585)
Urban (n=931) Rural (n=2,069) Above thepoverty line
(n=367)
Below thepoverty line(n=2,633)
Employed(n=2,360)
Unemployed(n=640)
Remittance recipients, by demographics(Shown: Percentage of each demographic group who receive remittances)
Those living in urban areas and those above the poverty line are more likely to report remittances likely because
urban dwellers and the well-off are within reach of several different remittance channels (cash, mobile money or a
bank).
They also are more likely to have a network of people who have money, as opposed to rural residents and the poor,
whose social networks are similarly rural and poor, and unable to provide them with financial support.
Source: InterMedia Tanzania FII Tracker survey Wave 2 (N=3,000, 15+), August-October, 2014.
A third of Tanzanians receive remittances, mostly women, those above the
poverty line and the unemployed
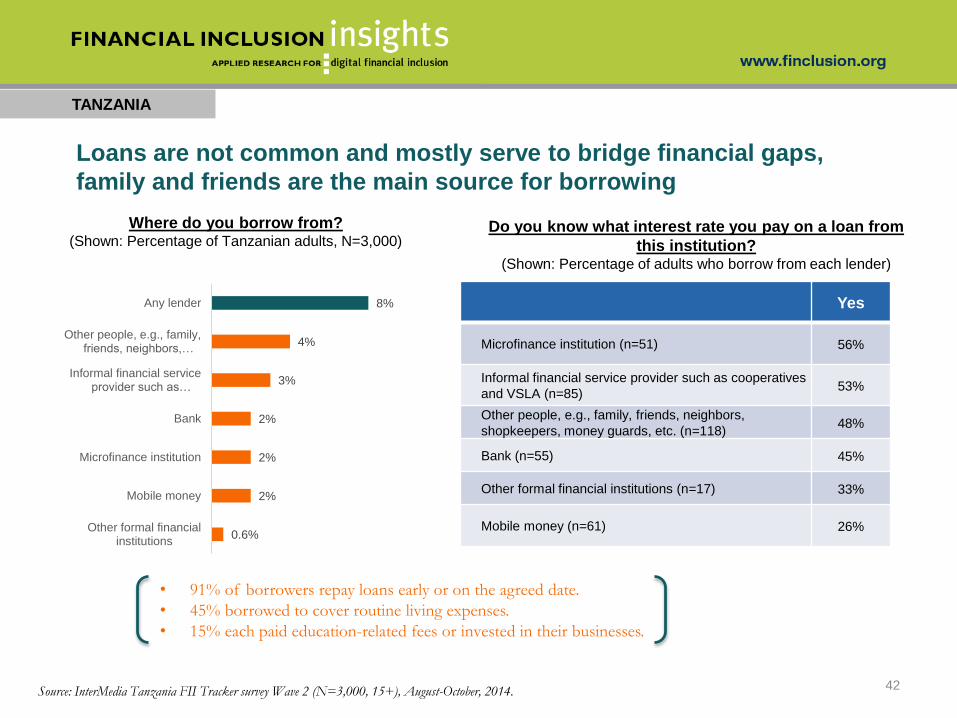
Loans are not common and mostly serve to bridge financial gaps,
family and friends are the main source for borrowing
TANZANIA
42
0.6%
2%
2%
2%
3%
4%
8%
Other formal financialinstitutions
Mobile money
Microfinance institution
Bank
Informal financial serviceprovider such as…
Other people, e.g., family,friends, neighbors,…
Any lender
Where do you borrow from?(Shown: Percentage of Tanzanian adults, N=3,000)
Source: InterMedia Tanzania FII Tracker survey Wave 2 (N=3,000, 15+), August-October, 2014.
Yes
Microfinance institution (n=51) 56%
Informal financial service provider such as cooperatives
and VSLA (n=85)53%
Other people, e.g., family, friends, neighbors,
shopkeepers, money guards, etc. (n=118)48%
Bank (n=55) 45%
Other formal financial institutions (n=17) 33%
Mobile money (n=61) 26%
Do you know what interest rate you pay on a loan from
this institution?(Shown: Percentage of adults who borrow from each lender)
• 91% of borrowers repay loans early or on the agreed date.
• 45% borrowed to cover routine living expenses.
• 15% each paid education-related fees or invested in their businesses.
TANZANIA
43
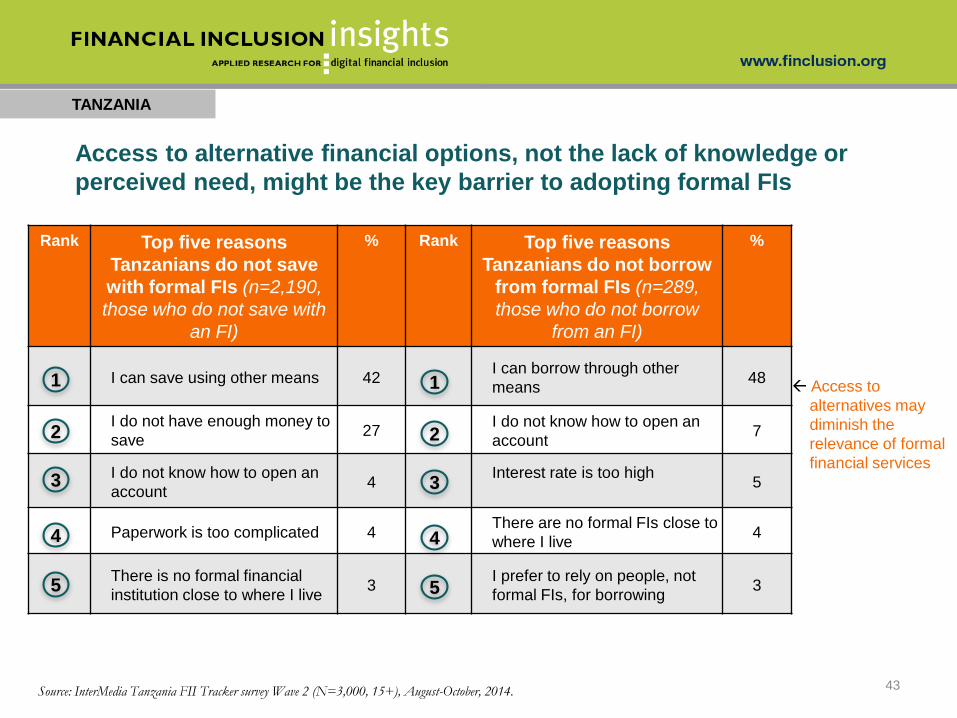
Rank Top five reasons
Tanzanians do not save
with formal FIs (n=2,190,
those who do not save with
an FI)
% Rank Top five reasons
Tanzanians do not borrow
from formal FIs (n=289,
those who do not borrow
from an FI)
%
I can save using other means 42I can borrow through other
means48
I do not have enough money to
save27
I do not know how to open an
account7
I do not know how to open an
account4
Interest rate is too high5
Paperwork is too complicated 4There are no formal FIs close to
where I live4
There is no formal financial
institution close to where I live3
I prefer to rely on people, not
formal FIs, for borrowing3
1
2
3
4
5
1
2
3
4
5
Access to alternative financial options, not the lack of knowledge or
perceived need, might be the key barrier to adopting formal FIs
Source: InterMedia Tanzania FII Tracker survey Wave 2 (N=3,000, 15+), August-October, 2014.
Access to
alternatives may
diminish the
relevance of formal
financial services
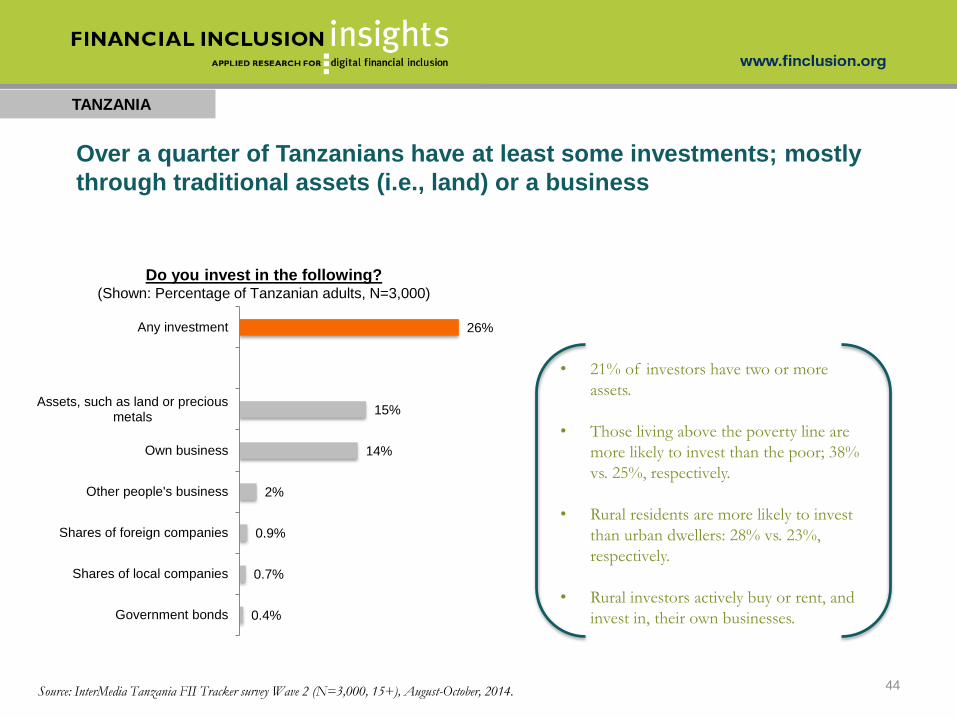
Over a quarter of Tanzanians have at least some investments; mostly
through traditional assets (i.e., land) or a business
TANZANIA
44
Do you invest in the following?(Shown: Percentage of Tanzanian adults, N=3,000)
Source: InterMedia Tanzania FII Tracker survey Wave 2 (N=3,000, 15+), August-October, 2014.
• 21% of investors have two or more
assets.
• Those living above the poverty line are
more likely to invest than the poor; 38%
vs. 25%, respectively.
• Rural residents are more likely to invest
than urban dwellers: 28% vs. 23%,
respectively.
• Rural investors actively buy or rent, and
invest in, their own businesses.0.4%
0.7%
0.9%
2%
14%
15%
26%
Government bonds
Shares of local companies
Shares of foreign companies
Other people's business
Own business
Assets, such as land or preciousmetals
Any investment
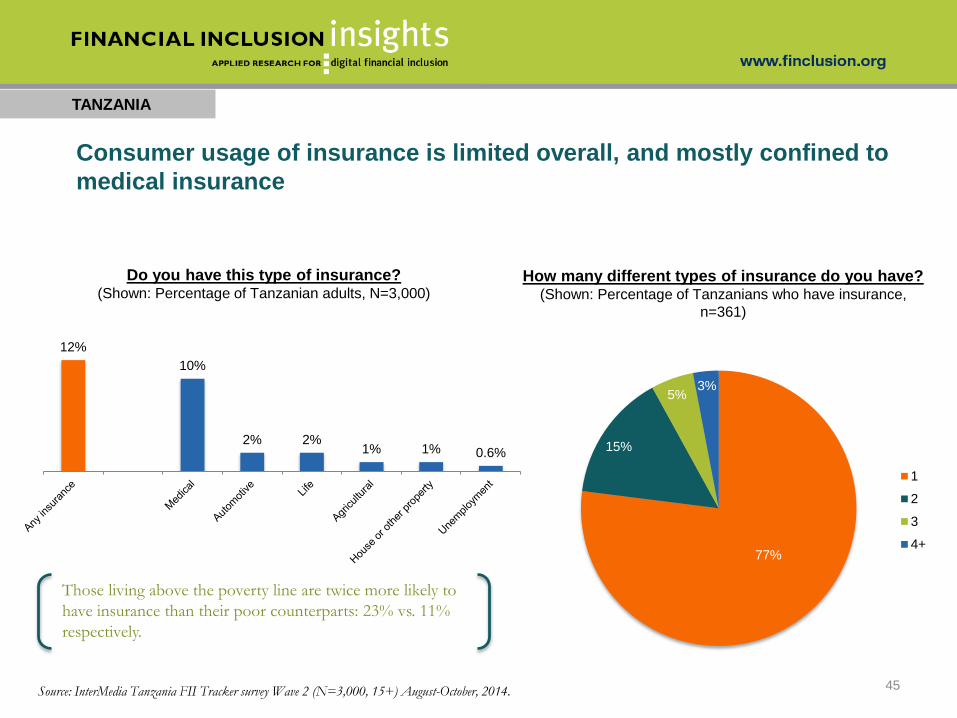
Consumer usage of insurance is limited overall, and mostly confined to
medical insurance
TANZANIA
45
Do you have this type of insurance?(Shown: Percentage of Tanzanian adults, N=3,000)
Source: InterMedia Tanzania FII Tracker survey Wave 2 (N=3,000, 15+) August-October, 2014.
Those living above the poverty line are twice more likely to
have insurance than their poor counterparts: 23% vs. 11%
respectively.
How many different types of insurance do you have?(Shown: Percentage of Tanzanians who have insurance,
n=361)
12%
10%
2% 2%1% 1% 0.6%
77%
15%
5%3%
1
2
3
4+
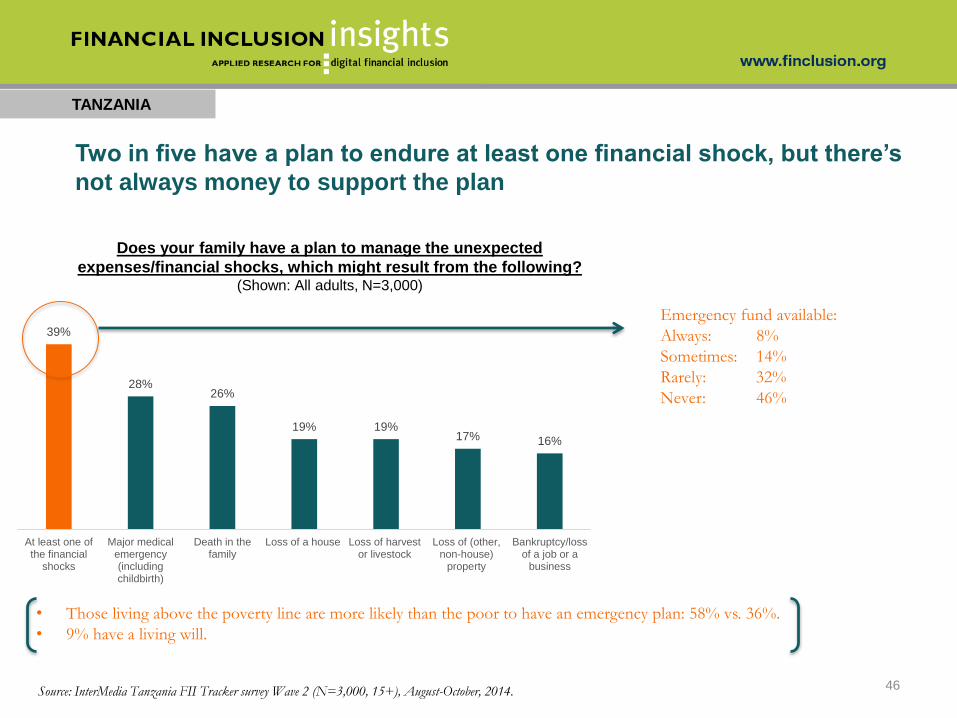
Two in five have a plan to endure at least one financial shock, but there’s
not always money to support the plan
TANZANIA
46
39%
28%26%
19% 19%17% 16%
At least one ofthe financial
shocks
Major medicalemergency(includingchildbirth)
Death in thefamily
Loss of a house Loss of harvestor livestock
Loss of (other,non-house)
property
Bankruptcy/lossof a job or a
business
Does your family have a plan to manage the unexpected
expenses/financial shocks, which might result from the following?(Shown: All adults, N=3,000)
• Those living above the poverty line are more likely than the poor to have an emergency plan: 58% vs. 36%.
• 9% have a living will.
Emergency fund available:
Always: 8%
Sometimes: 14%
Rarely: 32%
Never: 46%
Source: InterMedia Tanzania FII Tracker survey Wave 2 (N=3,000, 15+), August-October, 2014.
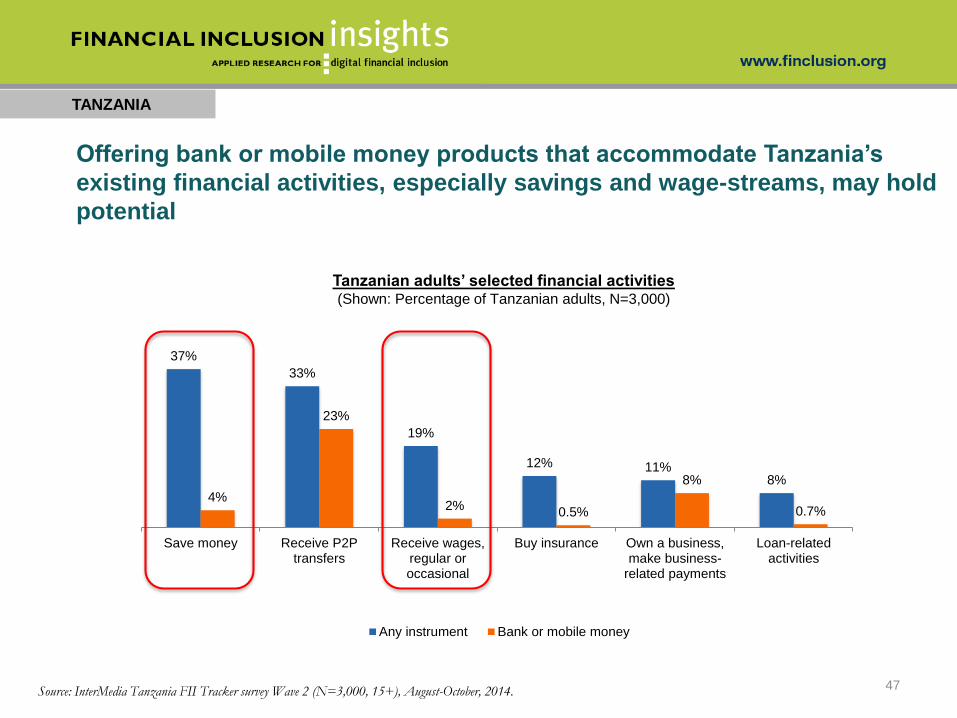
Offering bank or mobile money products that accommodate Tanzania’s
existing financial activities, especially savings and wage-streams, may hold
potential
TANZANIA
47Source: InterMedia Tanzania FII Tracker survey Wave 2 (N=3,000, 15+), August-October, 2014.
Tanzanian adults’ selected financial activities(Shown: Percentage of Tanzanian adults, N=3,000)
37%
33%
19%
12% 11%8%
4%
23%
2%0.5%
8%
0.7%
Save money Receive P2Ptransfers
Receive wages,regular oroccasional
Buy insurance Own a business,make business-
related payments
Loan-relatedactivities
Any instrument Bank or mobile money
UPTAKE AND USE OF MOBILE
FINANCIAL SERVICES
TANZANIA
48
TANZANIA
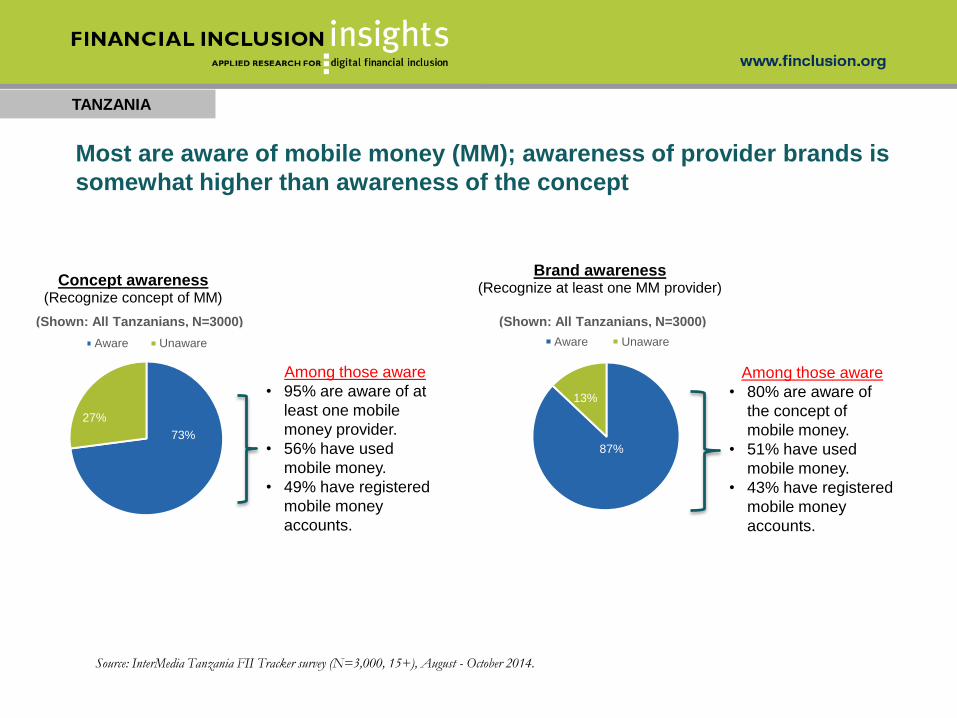
Most are aware of mobile money (MM); awareness of provider brands is
somewhat higher than awareness of the concept
73%
27%
Concept awareness(Recognize concept of MM)
Aware Unaware
87%
13%
Brand awareness(Recognize at least one MM provider)
Aware Unaware
(Shown: All Tanzanians, N=3000)
Among those aware
• 95% are aware of at
least one mobile
money provider.
• 56% have used
mobile money.
• 49% have registered
mobile money
accounts.
Among those aware
• 80% are aware of
the concept of
mobile money.
• 51% have used
mobile money.
• 43% have registered
mobile money
accounts.
Source: InterMedia Tanzania FII Tracker survey (N=3,000, 15+), August - October 2014.
(Shown: All Tanzanians, N=3000)
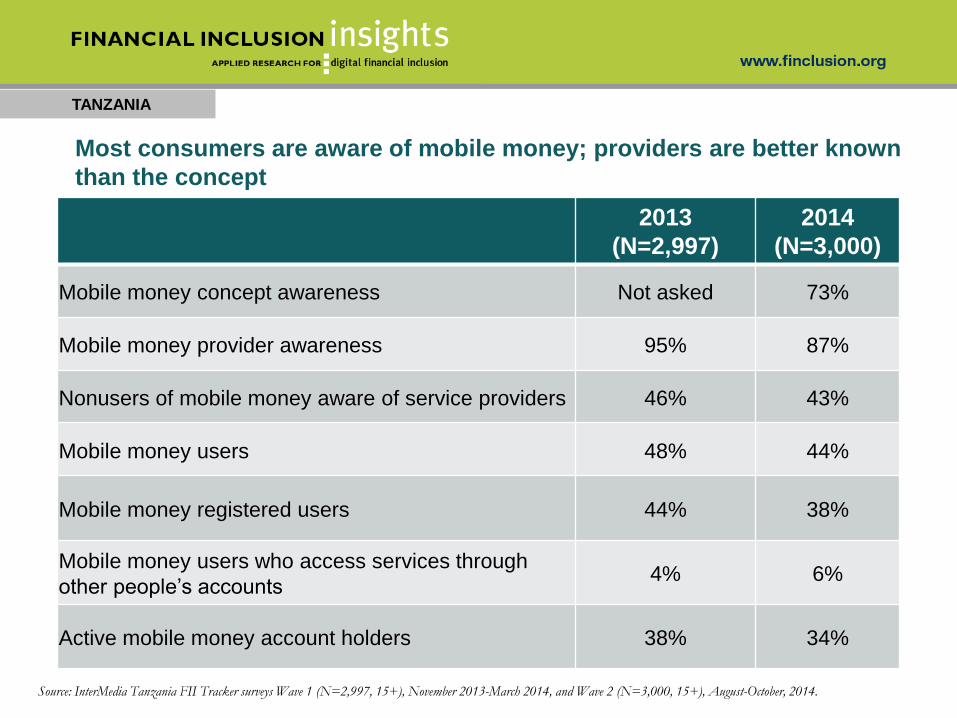
Most consumers are aware of mobile money; providers are better known
than the concept
2013
(N=2,997)
2014
(N=3,000)
Mobile money concept awareness Not asked 73%
Mobile money provider awareness 95% 87%
Nonusers of mobile money aware of service providers 46% 43%
Mobile money users 48% 44%
Mobile money registered users 44% 38%
Mobile money users who access services through
other people’s accounts4% 6%
Active mobile money account holders 38% 34%
TANZANIA
Source: InterMedia Tanzania FII Tracker surveys Wave 1 (N=2,997, 15+), November 2013-March 2014, and Wave 2 (N=3,000, 15+), August-October, 2014.
TANZANIA
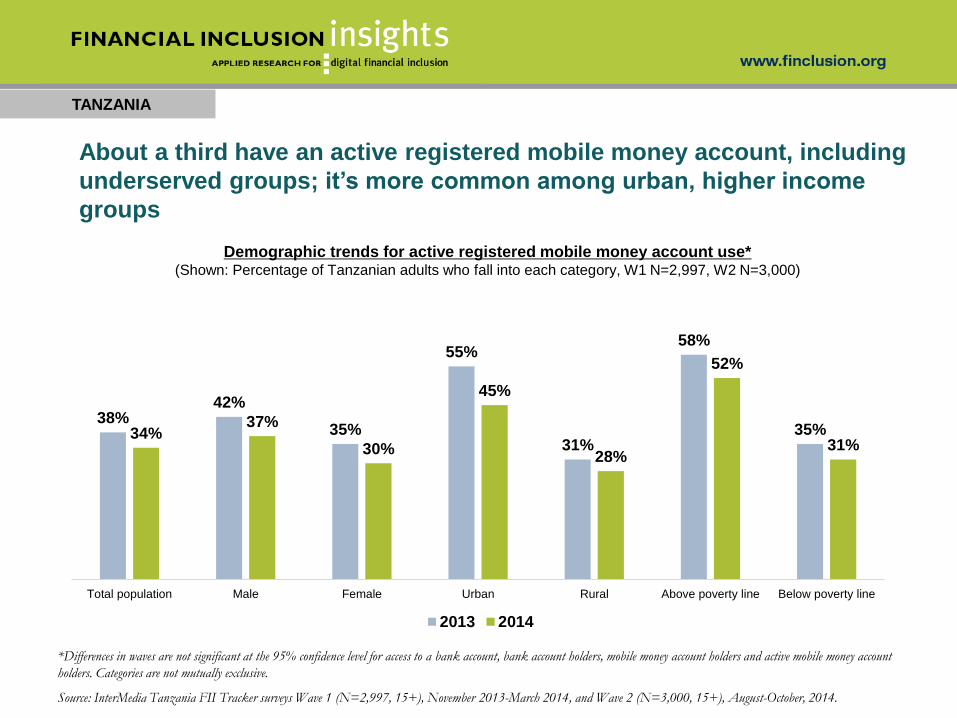
38%42%
35%
55%
31%
58%
35%34%37%
30%
45%
28%
52%
31%
Total population Male Female Urban Rural Above poverty line Below poverty line
2013 2014
About a third have an active registered mobile money account, including
underserved groups; it’s more common among urban, higher income
groups
Demographic trends for active registered mobile money account use* (Shown: Percentage of Tanzanian adults who fall into each category, W1 N=2,997, W2 N=3,000)
*Differences in waves are not significant at the 95% confidence level for access to a bank account, bank account holders, mobile money account holders and active mobile money account
holders. Categories are not mutually exclusive.
Source: InterMedia Tanzania FII Tracker surveys Wave 1 (N=2,997, 15+), November 2013-March 2014, and Wave 2 (N=3,000, 15+), August-October, 2014.
TANZANIA
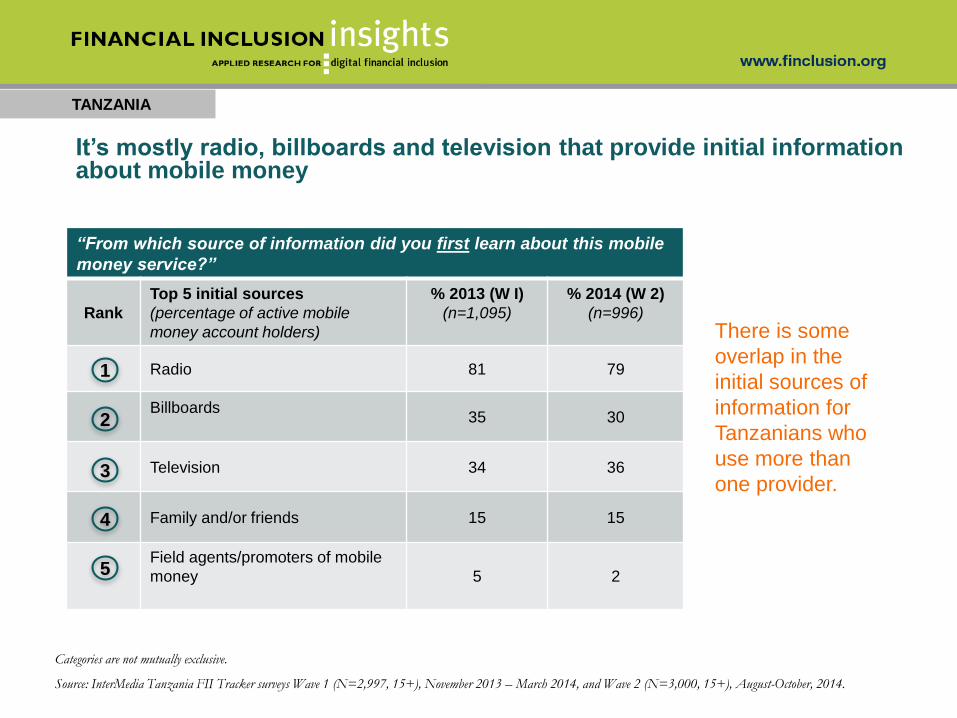
It’s mostly radio, billboards and television that provide initial information about mobile money
“From which source of information did you first learn about this mobile
money service?”
Rank
Top 5 initial sources
(percentage of active mobile
money account holders)
% 2013 (W I)
(n=1,095)
% 2014 (W 2)
(n=996)
Radio 81 79
Billboards35 30
Television 34 36
Family and/or friends 15 15
Field agents/promoters of mobile
money 5 2
1
2
3
4
5
Categories are not mutually exclusive.
Source: InterMedia Tanzania FII Tracker surveys Wave 1 (N=2,997, 15+), November 2013 – March 2014, and Wave 2 (N=3,000, 15+), August-October, 2014.
There is some
overlap in the
initial sources of
information for
Tanzanians who
use more than
one provider.
TANZANIA
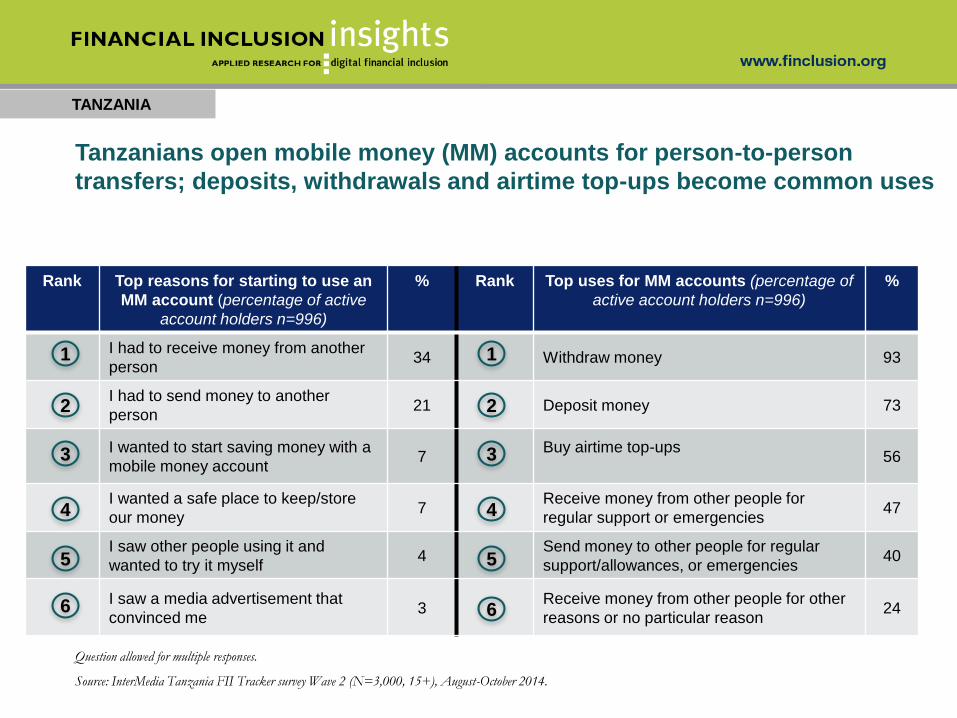
Rank Top reasons for starting to use an
MM account (percentage of active
account holders n=996)
% Rank Top uses for MM accounts (percentage of
active account holders n=996)
%
I had to receive money from another
person34 Withdraw money 93
I had to send money to another
person21 Deposit money 73
I wanted to start saving money with a
mobile money account7
Buy airtime top-ups56
I wanted a safe place to keep/store
our money7
Receive money from other people for
regular support or emergencies47
I saw other people using it and
wanted to try it myself4
Send money to other people for regular
support/allowances, or emergencies40
I saw a media advertisement that
convinced me3
Receive money from other people for other
reasons or no particular reason24
1
2
3
4
5
6
Question allowed for multiple responses.
Source: InterMedia Tanzania FII Tracker survey Wave 2 (N=3,000, 15+), August-October 2014.
1
2
3
4
5
6
Tanzanians open mobile money (MM) accounts for person-to-person
transfers; deposits, withdrawals and airtime top-ups become common uses
TANZANIA
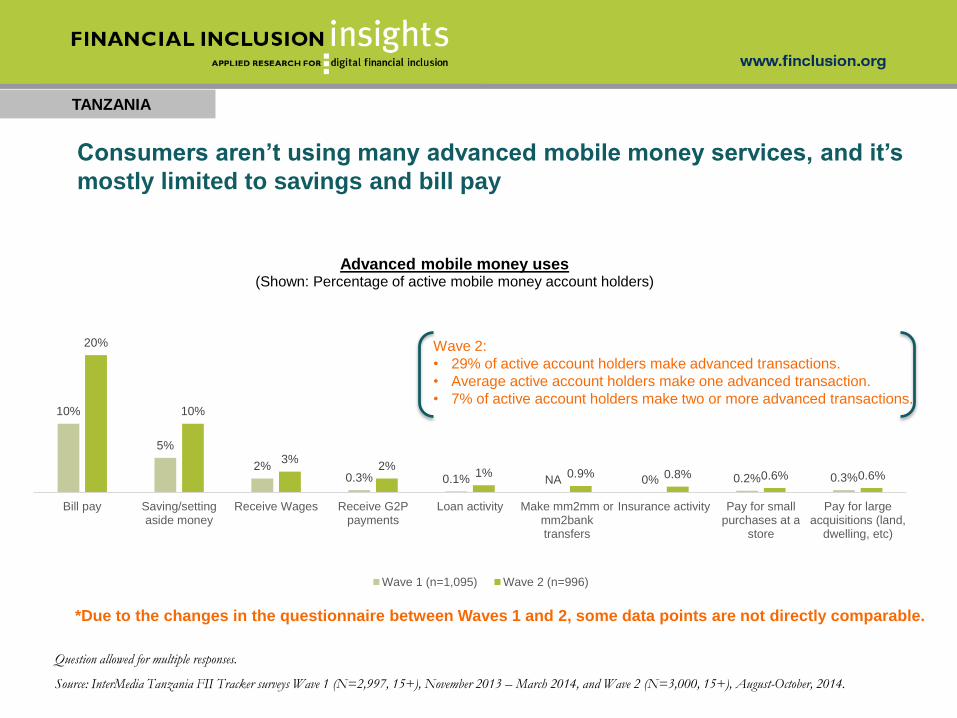
*Due to the changes in the questionnaire between Waves 1 and 2, some data points are not directly comparable.
Consumers aren’t using many advanced mobile money services, and it’s
mostly limited to savings and bill pay
Question allowed for multiple responses.
Source: InterMedia Tanzania FII Tracker surveys Wave 1 (N=2,997, 15+), November 2013 – March 2014, and Wave 2 (N=3,000, 15+), August-October, 2014.
10%
5%
2%0.3% 0.1% NA 0% 0.2% 0.3%
20%
10%
3%2%
1% 0.9% 0.8% 0.6% 0.6%
Bill pay Saving/settingaside money
Receive Wages Receive G2Ppayments
Loan activity Make mm2mm ormm2banktransfers
Insurance activity Pay for smallpurchases at a
store
Pay for largeacquisitions (land,
dwelling, etc)
Advanced mobile money uses(Shown: Percentage of active mobile money account holders)
Wave 1 (n=1,095) Wave 2 (n=996)
Wave 2:
• 29% of active account holders make advanced transactions.
• Average active account holders make one advanced transaction.
• 7% of active account holders make two or more advanced transactions.
TANZANIA
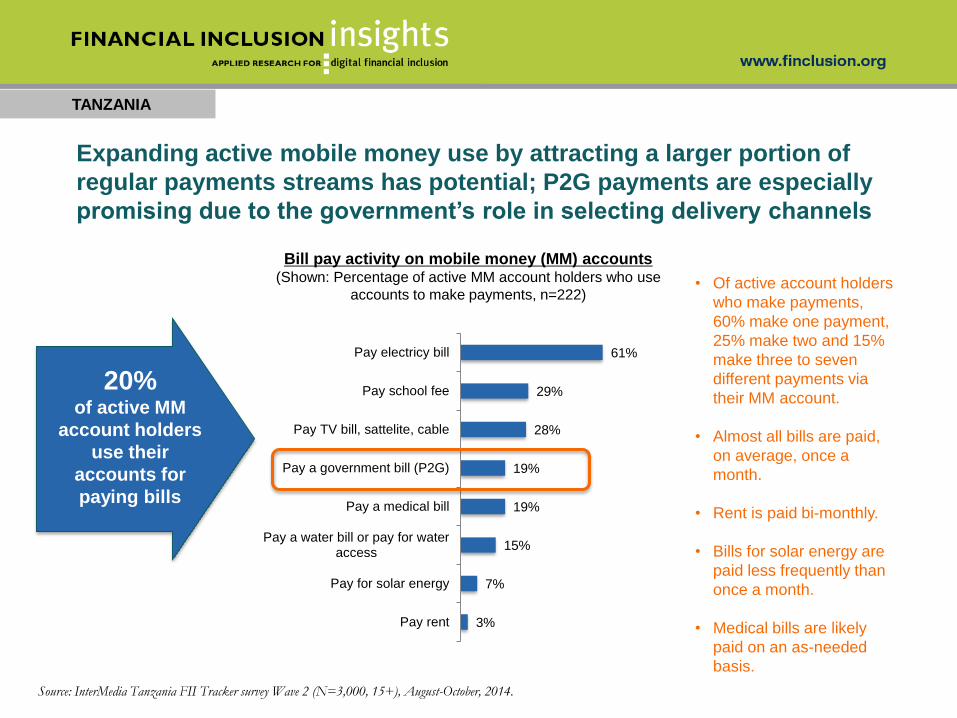
Expanding active mobile money use by attracting a larger portion of
regular payments streams has potential; P2G payments are especially
promising due to the government’s role in selecting delivery channels
Bill pay activity on mobile money (MM) accounts (Shown: Percentage of active MM account holders who use
accounts to make payments, n=222)
Source: InterMedia Tanzania FII Tracker survey Wave 2 (N=3,000, 15+), August-October, 2014.
20% of active MM
account holders
use their
accounts for
paying bills
3%
7%
15%
19%
19%
28%
29%
61%
Pay rent
Pay for solar energy
Pay a water bill or pay for wateraccess
Pay a medical bill
Pay a government bill (P2G)
Pay TV bill, sattelite, cable
Pay school fee
Pay electricy bill
• Of active account holders
who make payments,
60% make one payment,
25% make two and 15%
make three to seven
different payments via
their MM account.
• Almost all bills are paid,
on average, once a
month.
• Rent is paid bi-monthly.
• Bills for solar energy are
paid less frequently than
once a month.
• Medical bills are likely
paid on an as-needed
basis.
TANZANIA
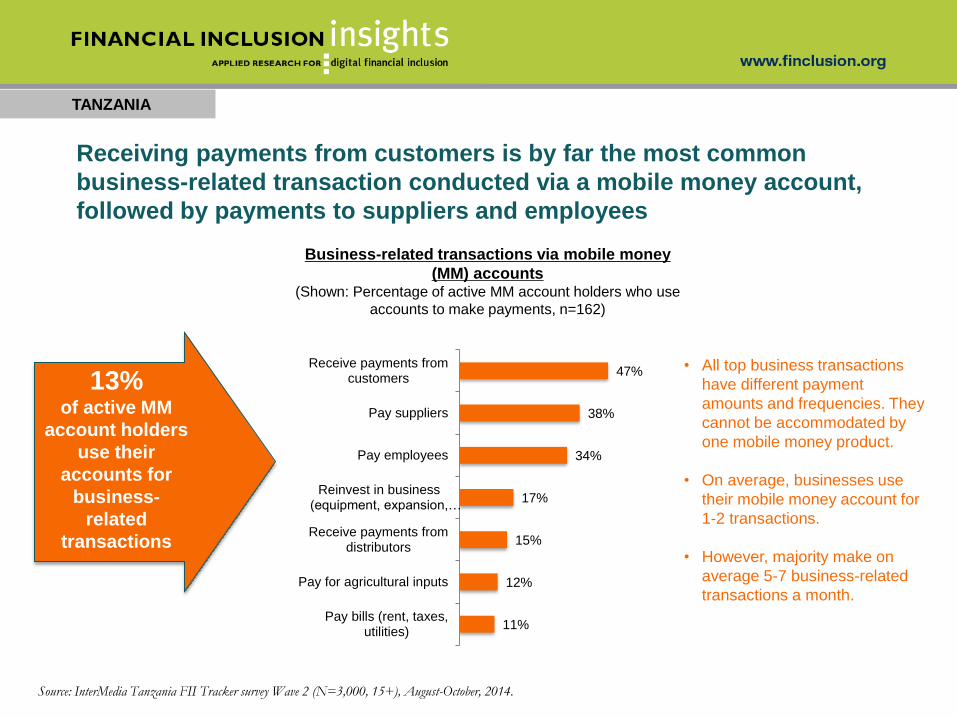
Receiving payments from customers is by far the most common
business-related transaction conducted via a mobile money account,
followed by payments to suppliers and employees
Business-related transactions via mobile money
(MM) accounts (Shown: Percentage of active MM account holders who use
accounts to make payments, n=162)
Source: InterMedia Tanzania FII Tracker survey Wave 2 (N=3,000, 15+), August-October, 2014.
13% of active MM
account holders
use their
accounts for
business-
related
transactions
11%
12%
15%
17%
34%
38%
47%
Pay bills (rent, taxes,utilities)
Pay for agricultural inputs
Receive payments fromdistributors
Reinvest in business(equipment, expansion,…
Pay employees
Pay suppliers
Receive payments fromcustomers
• All top business transactions
have different payment
amounts and frequencies. They
cannot be accommodated by
one mobile money product.
• On average, businesses use
their mobile money account for
1-2 transactions.
• However, majority make on
average 5-7 business-related
transactions a month.
TANZANIA
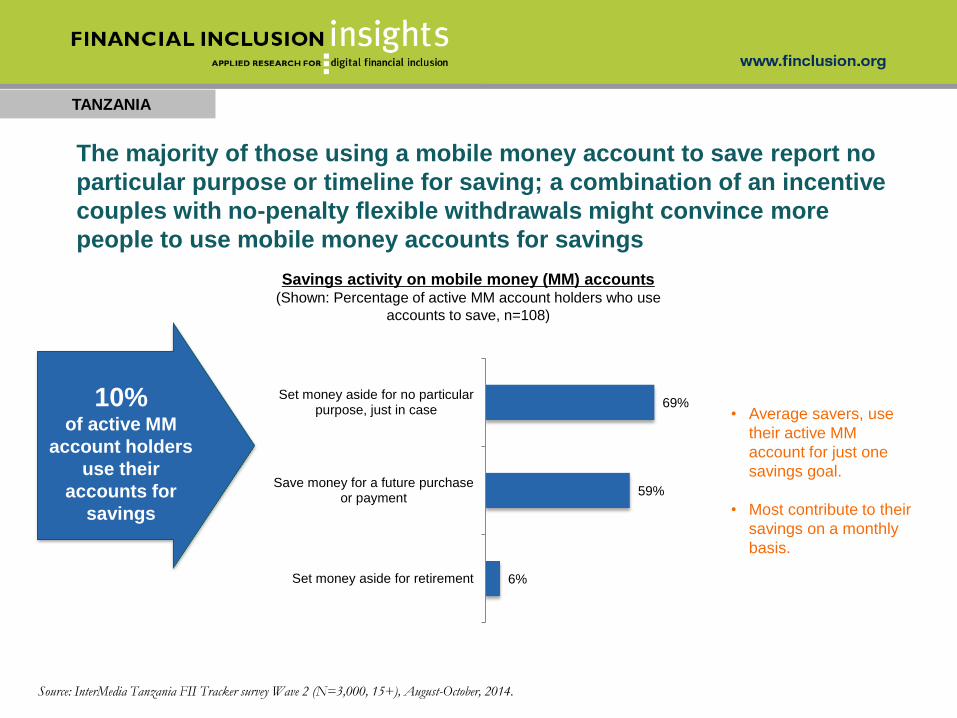
The majority of those using a mobile money account to save report no
particular purpose or timeline for saving; a combination of an incentive
couples with no-penalty flexible withdrawals might convince more
people to use mobile money accounts for savings
Savings activity on mobile money (MM) accounts (Shown: Percentage of active MM account holders who use
accounts to save, n=108)
Source: InterMedia Tanzania FII Tracker survey Wave 2 (N=3,000, 15+), August-October, 2014.
10% of active MM
account holders
use their
accounts for
savings
6%
59%
69%
Set money aside for retirement
Save money for a future purchaseor payment
Set money aside for no particularpurpose, just in case • Average savers, use
their active MM
account for just one
savings goal.
• Most contribute to their
savings on a monthly
basis.
TANZANIA
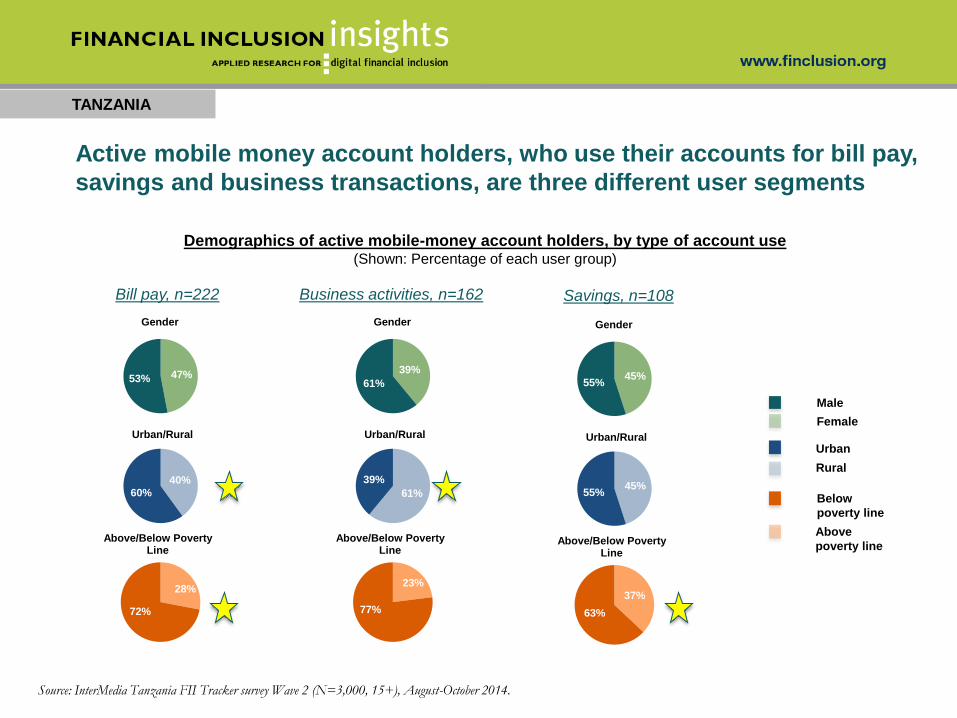
Active mobile money account holders, who use their accounts for bill pay,
savings and business transactions, are three different user segments
Source: InterMedia Tanzania FII Tracker survey Wave 2 (N=3,000, 15+), August-October 2014.
Demographics of active mobile-money account holders, by type of account use(Shown: Percentage of each user group)
45%55%
Gender
45%55%
Urban/Rural
37%
63%
Above/Below Poverty Line
Male
Female
Urban
Rural
Above
poverty line
Below
poverty line
47%53%
Gender
40%
60%
Urban/Rural
28%
72%
Above/Below Poverty Line
39%
61%
Gender
61%
39%
Urban/Rural
23%
77%
Above/Below Poverty Line
Bill pay, n=222 Business activities, n=162 Savings, n=108
TANZANIA
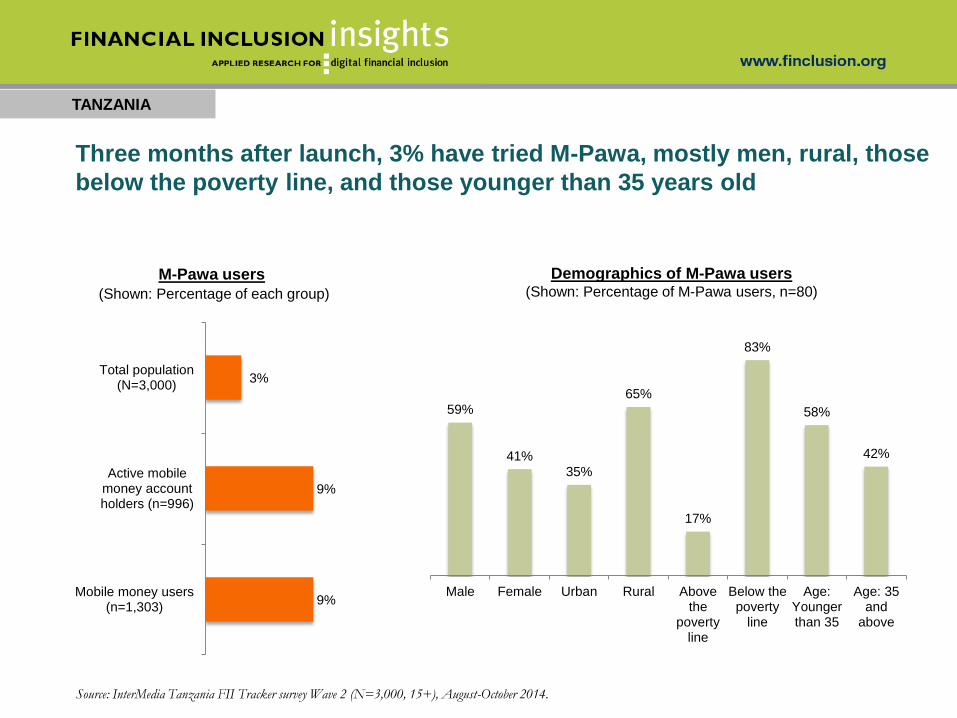
Three months after launch, 3% have tried M-Pawa, mostly men, rural, those
below the poverty line, and those younger than 35 years old
Source: InterMedia Tanzania FII Tracker survey Wave 2 (N=3,000, 15+), August-October 2014.
9%
9%
3%
Mobile money users(n=1,303)
Active mobilemoney accountholders (n=996)
Total population(N=3,000)
Demographics of M-Pawa users(Shown: Percentage of M-Pawa users, n=80)
M-Pawa users
(Shown: Percentage of each group)
59%
41%
35%
65%
17%
83%
58%
42%
Male Female Urban Rural Abovethe
povertyline
Below thepoverty
line
Age:Youngerthan 35
Age: 35and
above
MOBILE FINANCIAL SERVICES: USER
SEGMENTATION
TANZANIA
60
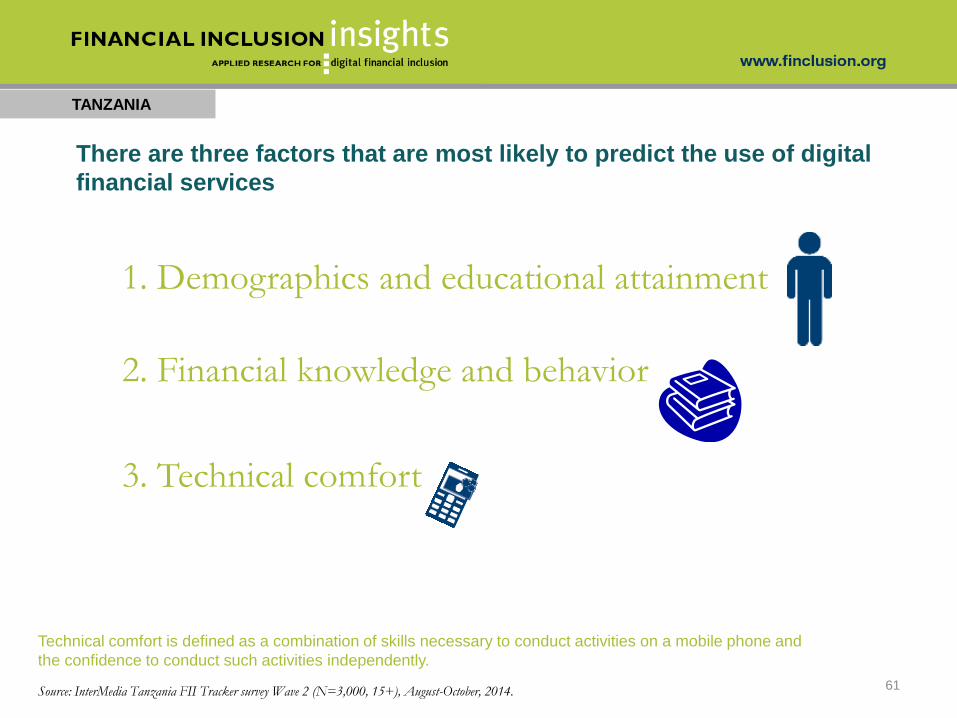
There are three factors that are most likely to predict the use of digital
financial services
TANZANIA
1. Demographics and educational attainment
2. Financial knowledge and behavior
3. Technical comfort
61
Technical comfort is defined as a combination of skills necessary to conduct activities on a mobile phone and
the confidence to conduct such activities independently.
Source: InterMedia Tanzania FII Tracker survey Wave 2 (N=3,000, 15+), August-October, 2014.
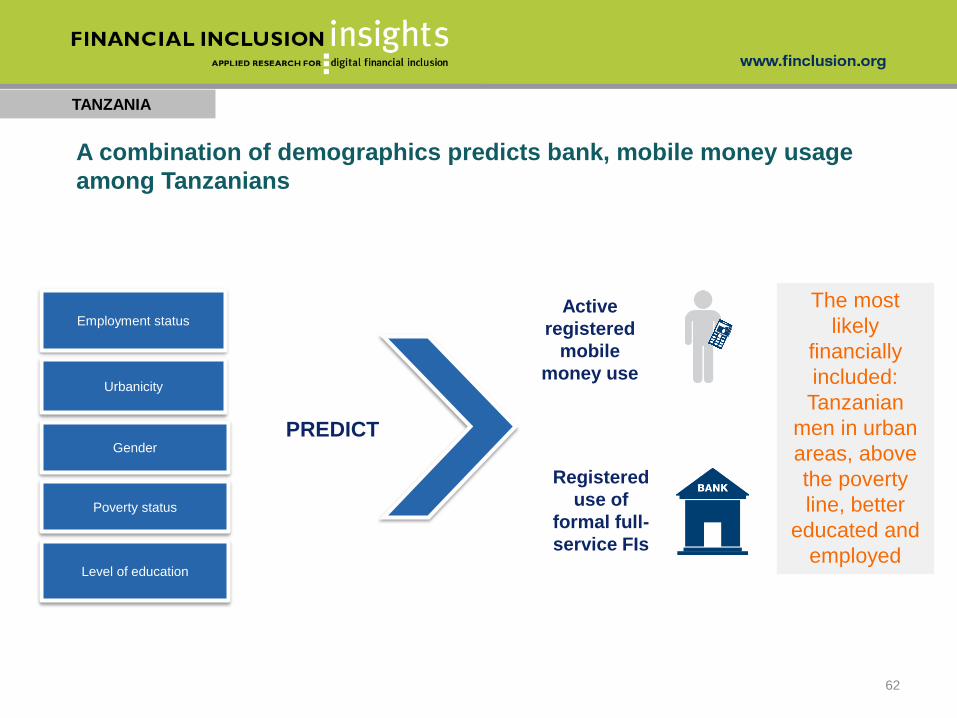
A combination of demographics predicts bank, mobile money usage
among Tanzanians
TANZANIA
62
The most
likely
financially
included:
Tanzanian
men in urban
areas, above
the poverty
line, better
educated and
employed
Active
registered
mobile
money use
Poverty status
PREDICT
Registered
use of
formal full-
service FIs
Level of education
Gender
Urbanicity
Employment status
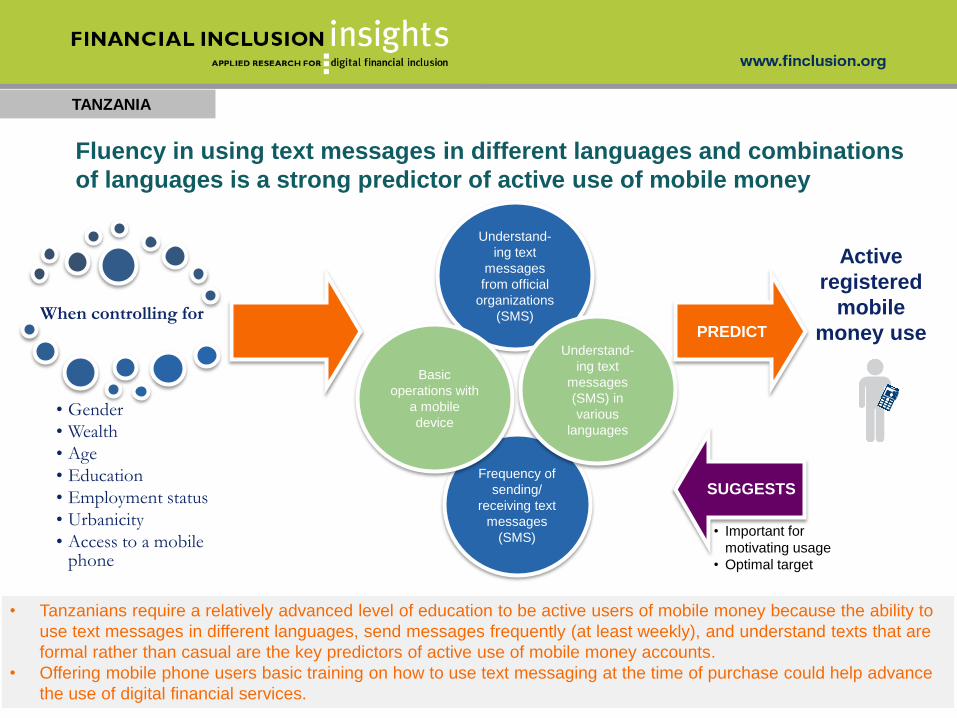
TANZANIA
When controlling for
• Gender
• Wealth
• Age
• Education
• Employment status
• Urbanicity
• Access to a mobile phone
Active
registered
mobile
money use
• Tanzanians require a relatively advanced level of education to be active users of mobile money because the ability to
use text messages in different languages, send messages frequently (at least weekly), and understand texts that are
formal rather than casual are the key predictors of active use of mobile money accounts.
• Offering mobile phone users basic training on how to use text messaging at the time of purchase could help advance
the use of digital financial services.
Understand-
ing text
messages
from official
organizations
(SMS)
Frequency of
sending/
receiving text
messages
(SMS)
Fluency in using text messages in different languages and combinations
of languages is a strong predictor of active use of mobile money
Basic
operations with
a mobile
device
Understand-
ing text
messages
(SMS) in
various
languages
PREDICT
• Important for
motivating usage
• Optimal target
SUGGESTS
TANZANIA
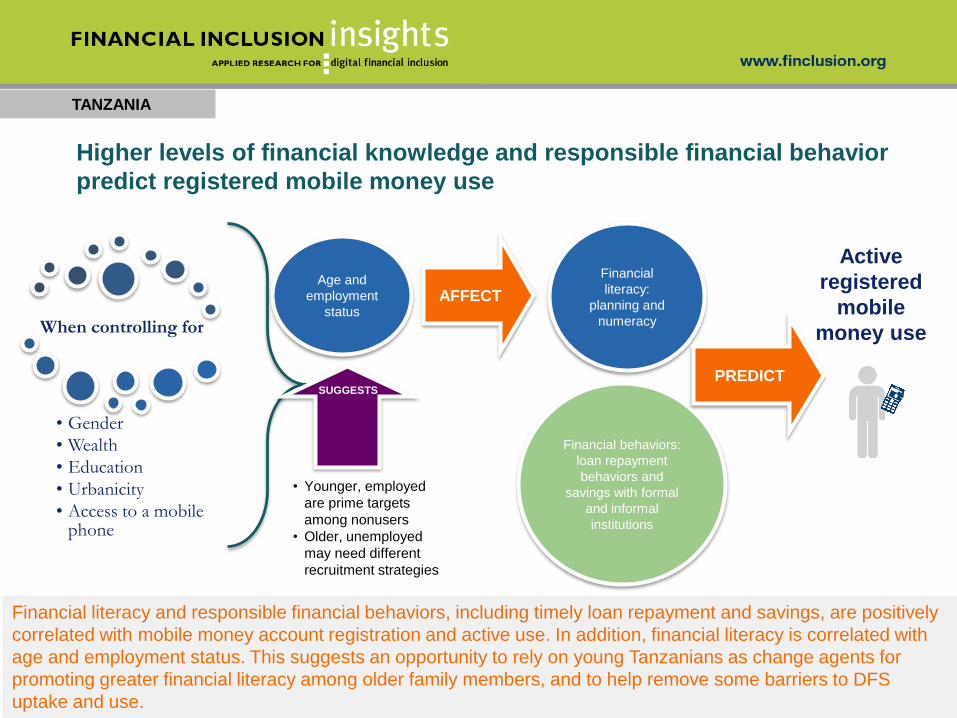
Higher levels of financial knowledge and responsible financial behavior
predict registered mobile money use
Financial literacy and responsible financial behaviors, including timely loan repayment and savings, are positively
correlated with mobile money account registration and active use. In addition, financial literacy is correlated with
age and employment status. This suggests an opportunity to rely on young Tanzanians as change agents for
promoting greater financial literacy among older family members, and to help remove some barriers to DFS
uptake and use.
Active
registered
mobile
money useWhen controlling for
• Gender
• Wealth
• Education
• Urbanicity
• Access to a mobile phone
Financial
literacy:
planning and
numeracy
Financial behaviors:
loan repayment
behaviors and
savings with formal
and informal
institutions
AFFECT
PREDICT
Age and
employment
status
• Younger, employed
are prime targets
among nonusers
• Older, unemployed
may need different
recruitment strategies
SUGGESTS
TANZANIA
Source: InterMedia Tanzania FII Tracker survey Wave 2 (N=3,000, 15+), August-October, 2014.
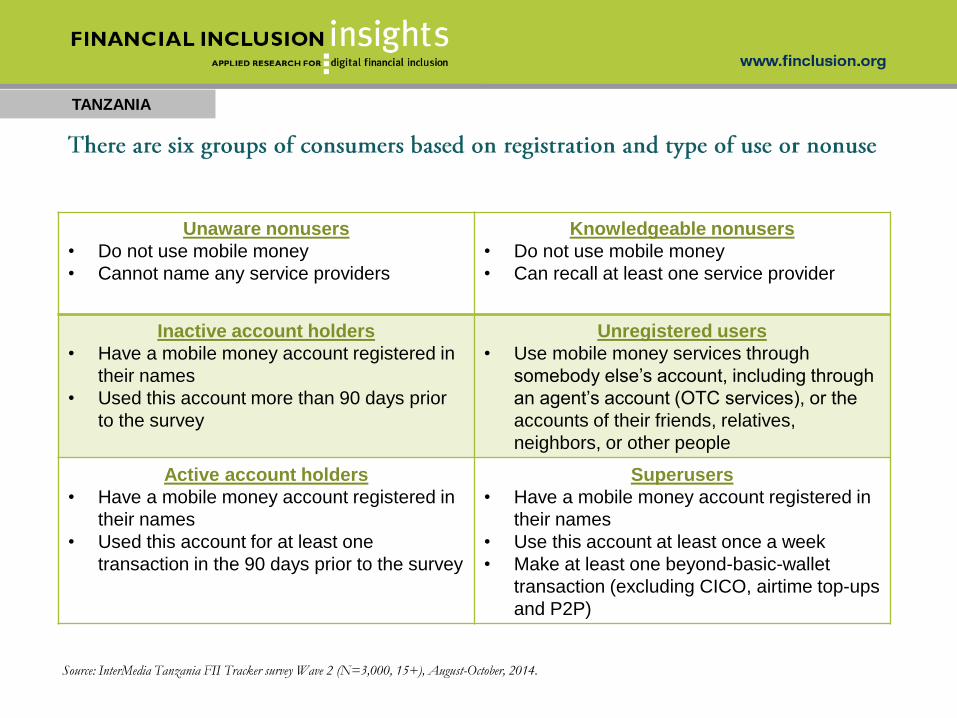
Unaware nonusers
• Do not use mobile money
• Cannot name any service providers
Knowledgeable nonusers
• Do not use mobile money
• Can recall at least one service provider
Inactive account holders
• Have a mobile money account registered in
their names
• Used this account more than 90 days prior
to the survey
Unregistered users
• Use mobile money services through
somebody else’s account, including through
an agent’s account (OTC services), or the
accounts of their friends, relatives,
neighbors, or other people
Active account holders
• Have a mobile money account registered in
their names
• Used this account for at least one
transaction in the 90 days prior to the survey
Superusers
• Have a mobile money account registered in
their names
• Use this account at least once a week
• Make at least one beyond-basic-wallet
transaction (excluding CICO, airtime top-ups
and P2P)
TANZANIA
Source: InterMedia Tanzania FII Tracker survey Wave 2 (N=3,000, 15+), August-October 2014.
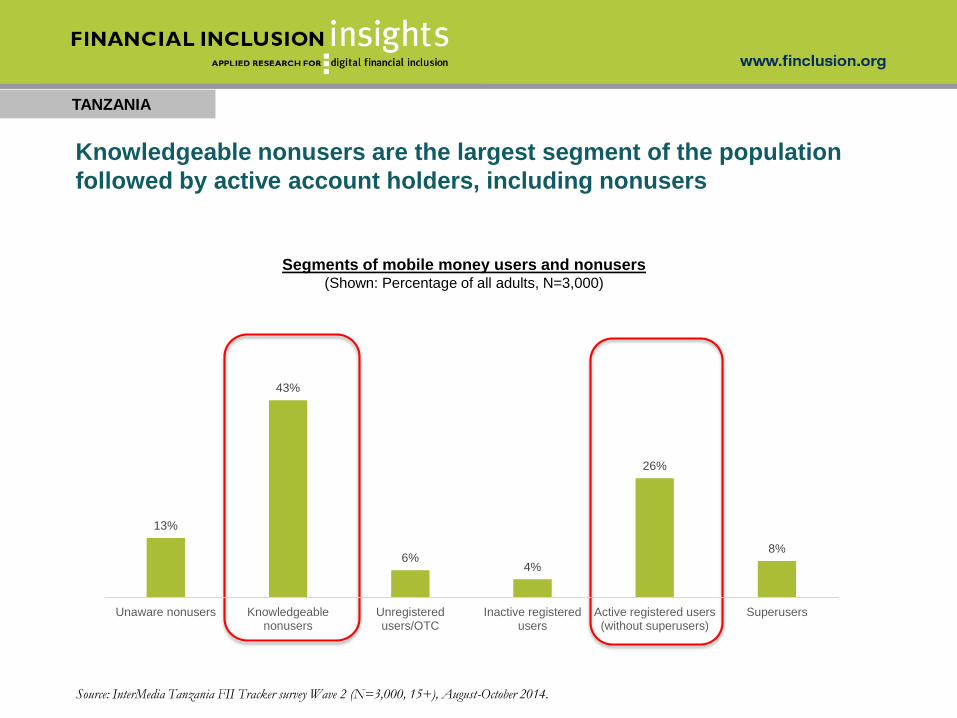
Segments of mobile money users and nonusers(Shown: Percentage of all adults, N=3,000)
Knowledgeable nonusers are the largest segment of the population
followed by active account holders, including nonusers
13%
43%
6%4%
26%
8%
Unaware nonusers Knowledgeablenonusers
Unregisteredusers/OTC
Inactive registeredusers
Active registered users(without superusers)
Superusers
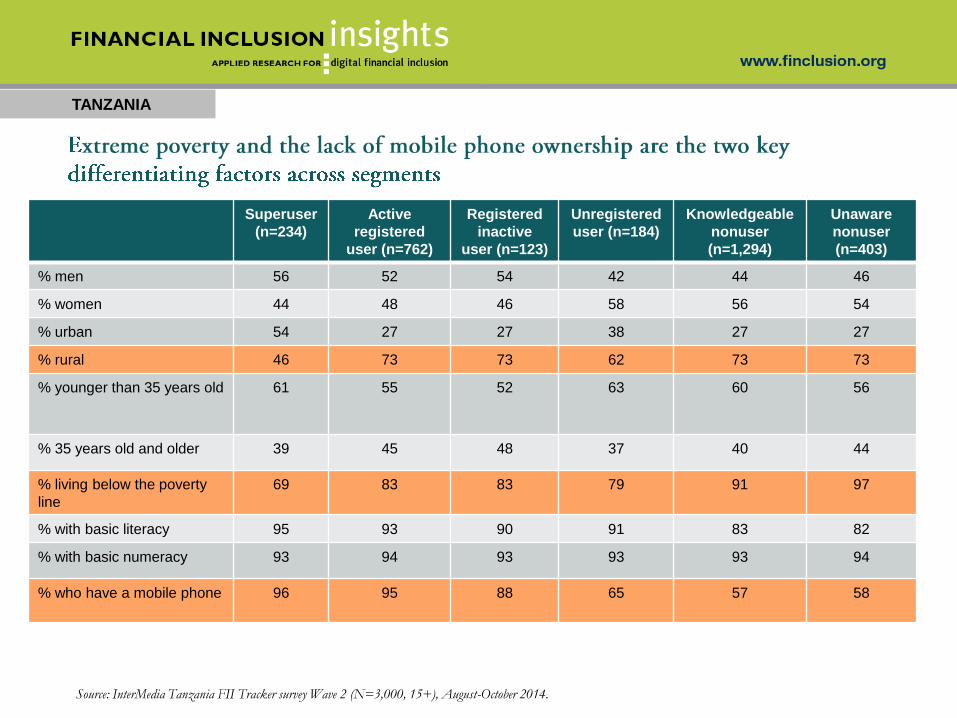
TANZANIA
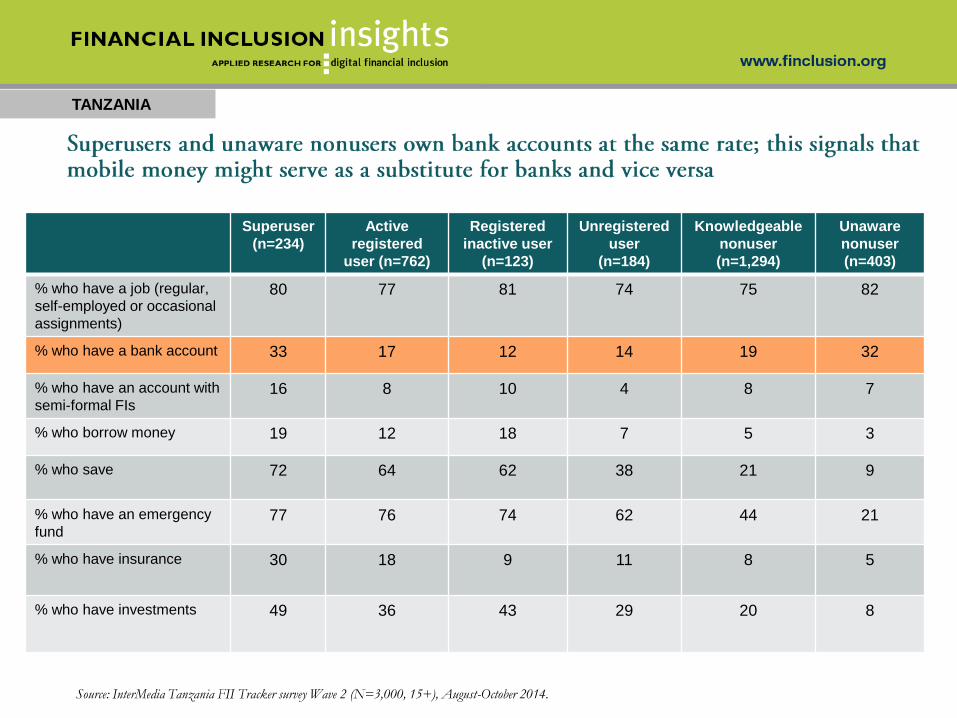
Superuser
(n=234)
Active
registered
user (n=762)
Registered
inactive
user (n=123)
Unregistered
user (n=184)
Knowledgeable
nonuser
(n=1,294)
Unaware
nonuser
(n=403)
% men 56 52 54 42 44 46
% women 44 48 46 58 56 54
% urban 54 27 27 38 27 27
% rural 46 73 73 62 73 73
% younger than 35 years old 61 55 52 63 60 56
% 35 years old and older 39 45 48 37 40 44
% living below the poverty
line
69 83 83 79 91 97
% with basic literacy 95 93 90 91 83 82
% with basic numeracy 93 94 93 93 93 94
% who have a mobile phone 96 95 88 65 57 58
Source: InterMedia Tanzania FII Tracker survey Wave 2 (N=3,000, 15+), August-October 2014.
TANZANIA
Superuser
(n=234)
Active
registered
user (n=762)
Registered
inactive user
(n=123)
Unregistered
user
(n=184)
Knowledgeable
nonuser
(n=1,294)
Unaware
nonuser
(n=403)
% who have a job (regular,
self-employed or occasional
assignments)
80 77 81 74 75 82
% who have a bank account 33 17 12 14 19 32
% who have an account with
semi-formal FIs16 8 10 4 8 7
% who borrow money 19 12 18 7 5 3
% who save 72 64 62 38 21 9
% who have an emergency
fund77 76 74 62 44 21
% who have insurance 30 18 9 11 8 5
% who have investments 49 36 43 29 20 8
Source: InterMedia Tanzania FII Tracker survey Wave 2 (N=3,000, 15+), August-October 2014.
ZOOMING IN ON USERS BY PROVIDER
TANZANIA
69
TANZANIA
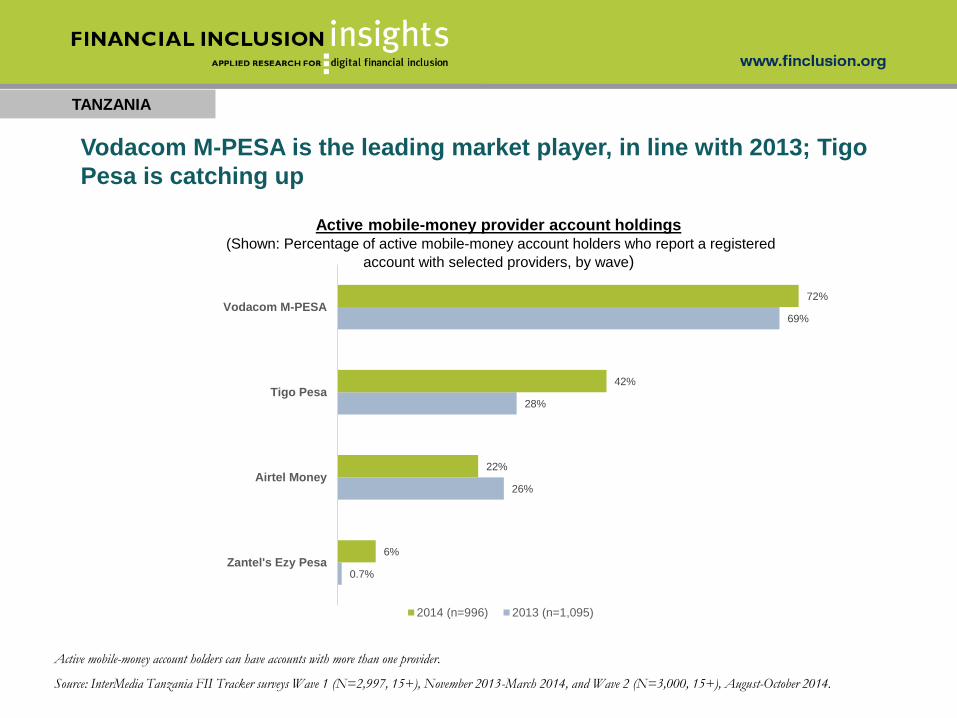
Vodacom M-PESA is the leading market player, in line with 2013; Tigo
Pesa is catching up
0.7%
26%
28%
69%
6%
22%
42%
72%
Zantel's Ezy Pesa
Airtel Money
Tigo Pesa
Vodacom M-PESA
Active mobile-money provider account holdings(Shown: Percentage of active mobile-money account holders who report a registered
account with selected providers, by wave)
2014 (n=996) 2013 (n=1,095)
Active mobile-money account holders can have accounts with more than one provider.
Source: InterMedia Tanzania FII Tracker surveys Wave 1 (N=2,997, 15+), November 2013-March 2014, and Wave 2 (N=3,000, 15+), August-October 2014.
TANZANIA
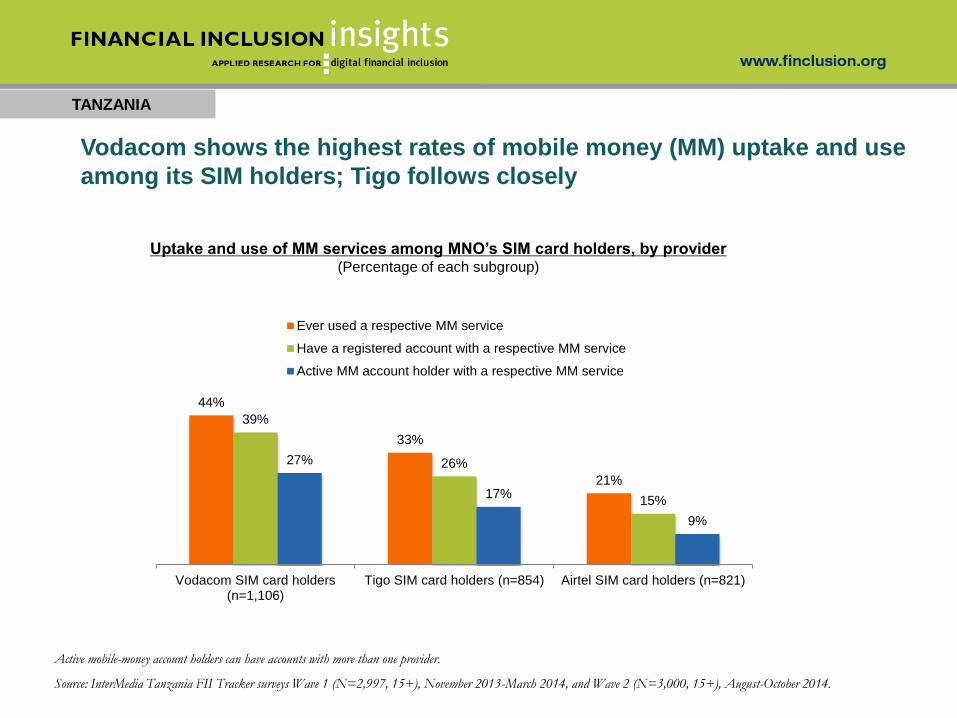
Vodacom shows the highest rates of mobile money (MM) uptake and use
among its SIM holders; Tigo follows closely
Active mobile-money account holders can have accounts with more than one provider.
Source: InterMedia Tanzania FII Tracker surveys Wave 1 (N=2,997, 15+), November 2013-March 2014, and Wave 2 (N=3,000, 15+), August-October 2014.
Uptake and use of MM services among MNO’s SIM card holders, by provider(Percentage of each subgroup)
44%
33%
21%
39%
26%
15%
27%
17%
9%
Vodacom SIM card holders(n=1,106)
Tigo SIM card holders (n=854) Airtel SIM card holders (n=821)
Ever used a respective MM service
Have a registered account with a respective MM service
Active MM account holder with a respective MM service
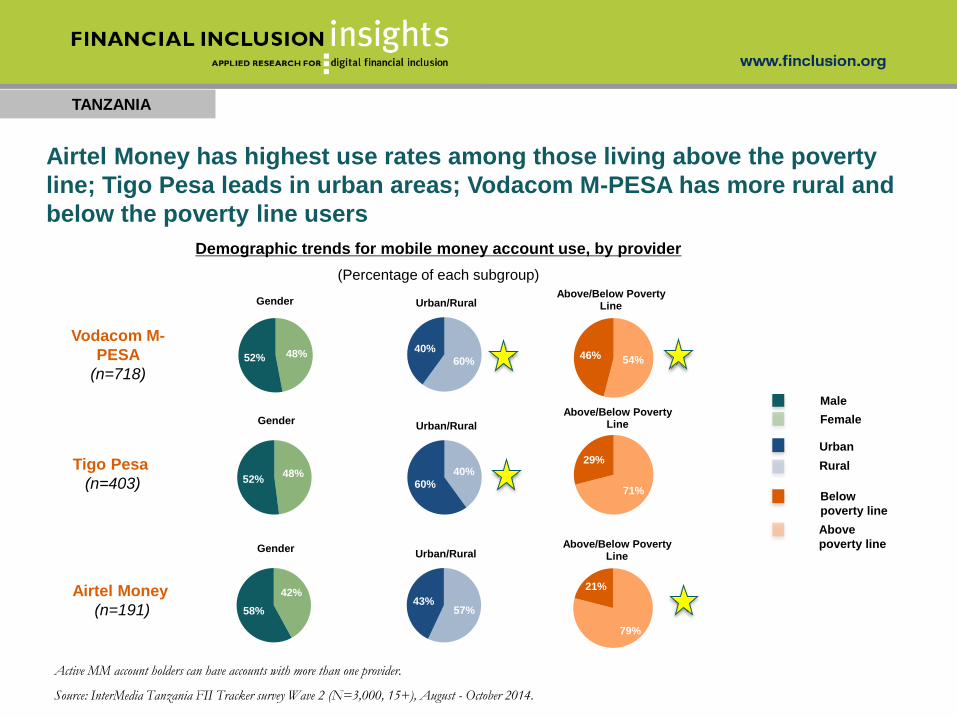
71%
29%
Above/Below Poverty Line
TANZANIA
48%52%
Gender
48%52%
Gender
60%
40%
Urban/Rural
54%46%
Above/Below Poverty Line
40%
60%
Urban/Rural
Male
Female
Urban
Rural
Above
poverty line
Below
poverty line
Vodacom M-
PESA
(n=718)
Tigo Pesa
(n=403)
Airtel Money has highest use rates among those living above the poverty
line; Tigo Pesa leads in urban areas; Vodacom M-PESA has more rural and
below the poverty line users
Active MM account holders can have accounts with more than one provider.
Source: InterMedia Tanzania FII Tracker survey Wave 2 (N=3,000, 15+), August - October 2014.
Demographic trends for mobile money account use, by provider
(Percentage of each subgroup)
42%
58%
Gender
57%43%
Urban/Rural
79%
21%
Above/Below Poverty Line
Airtel Money
(n=191)

TANZANIA
Airtel Money agents are the most visible, followed by Vodacom M-Pesa
agents; Tigo Pesa users have highest visibility of Tigo Pesa agents
Active mobile-money account holders can have accounts with more than one provider.
Source: InterMedia Tanzania FII Tracker surveys Wave 1 (N=2,997, 15+), November 2013-March 2014, and Wave 2 (N=3,000, 15+), August-October 2014.
Which mobile money agent is the closest to where you live, regardless of whether you use this agent?(Percentage of each subgroup)
82%
72%
63%
72%72% 72% 70%
Tigo Pesa MM user (n=527) Vodacom M-Pesa user (n=873) Airtel Money user (n=331)
Tigo Pesa agent Vodacom M-Pesa agent Airtel Money agent
USE OF BANKING SERVICES IN TANZANIA
TANZANIA
74
TANZANIA
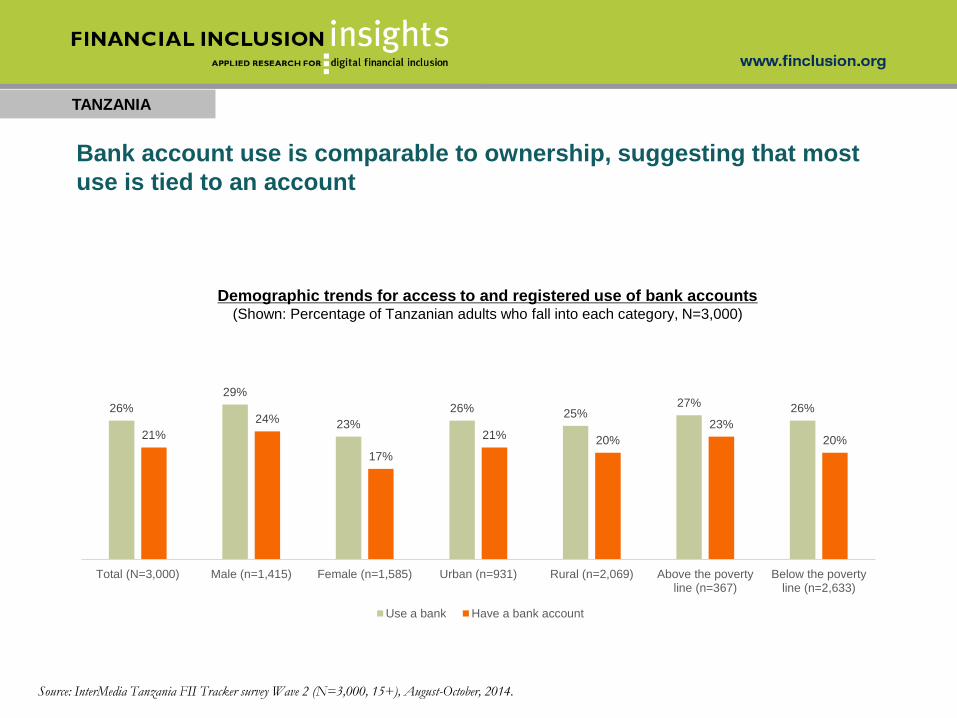
Bank account use is comparable to ownership, suggesting that most
use is tied to an account
26%
29%
23%
26% 25%27% 26%
21%
24%
17%
21% 20%
23%
20%
Total (N=3,000) Male (n=1,415) Female (n=1,585) Urban (n=931) Rural (n=2,069) Above the povertyline (n=367)
Below the povertyline (n=2,633)
Use a bank Have a bank account
Demographic trends for access to and registered use of bank accounts (Shown: Percentage of Tanzanian adults who fall into each category, N=3,000)
Source: InterMedia Tanzania FII Tracker survey Wave 2 (N=3,000, 15+), August-October, 2014.
TANZANIA
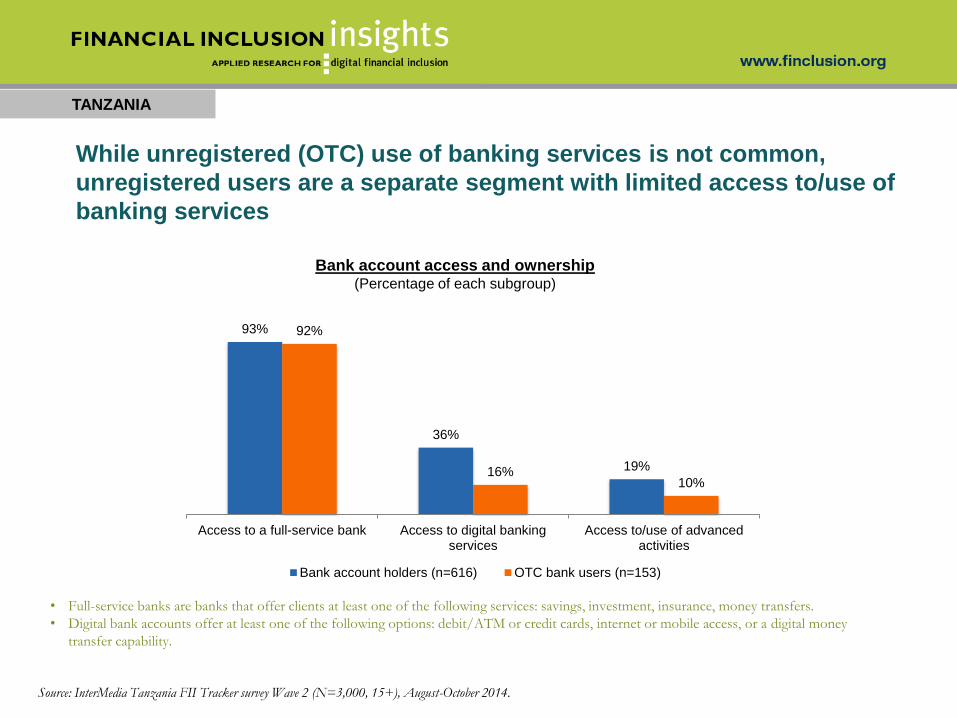
While unregistered (OTC) use of banking services is not common,
unregistered users are a separate segment with limited access to/use of
banking services
Bank account access and ownership(Percentage of each subgroup)
• Full-service banks are banks that offer clients at least one of the following services: savings, investment, insurance, money transfers.
• Digital bank accounts offer at least one of the following options: debit/ATM or credit cards, internet or mobile access, or a digital money
transfer capability.
Source: InterMedia Tanzania FII Tracker survey Wave 2 (N=3,000, 15+), August-October 2014.
93%
36%
19%
92%
16%10%
Access to a full-service bank Access to digital bankingservices
Access to/use of advancedactivities
Bank account holders (n=616) OTC bank users (n=153)
TANZANIA
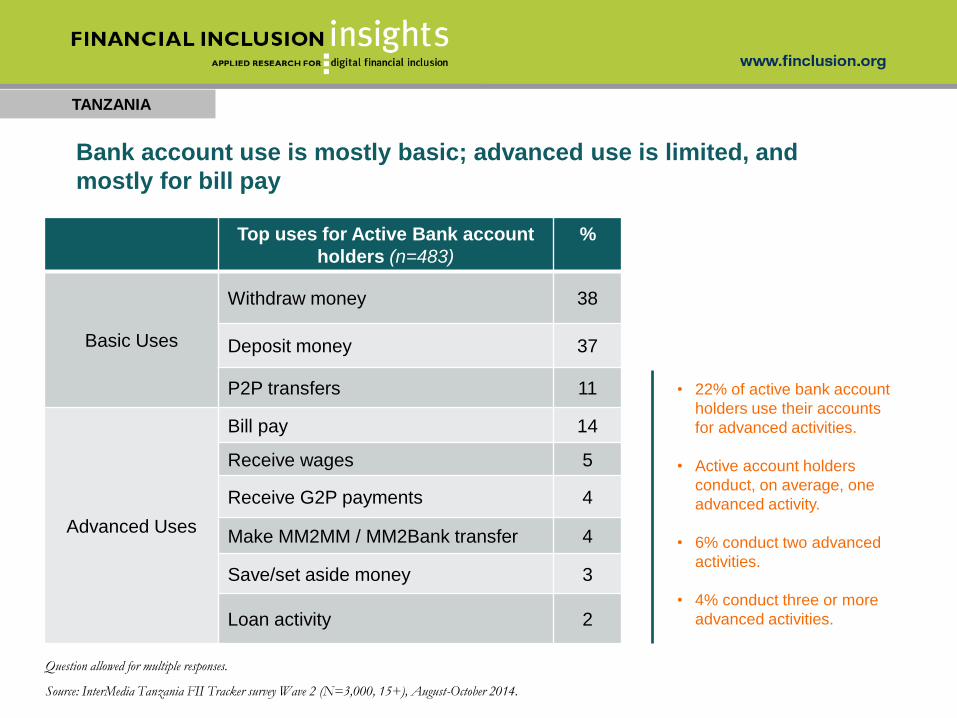
Top uses for Active Bank account
holders (n=483)
%
Basic Uses
Withdraw money 38
Deposit money 37
P2P transfers 11
Advanced Uses
Bill pay 14
Receive wages 5
Receive G2P payments 4
Make MM2MM / MM2Bank transfer 4
Save/set aside money 3
Loan activity 2
Question allowed for multiple responses.
Source: InterMedia Tanzania FII Tracker survey Wave 2 (N=3,000, 15+), August-October 2014.
Bank account use is mostly basic; advanced use is limited, and
mostly for bill pay
• 22% of active bank account
holders use their accounts
for advanced activities.
• Active account holders
conduct, on average, one
advanced activity.
• 6% conduct two advanced
activities.
• 4% conduct three or more
advanced activities.
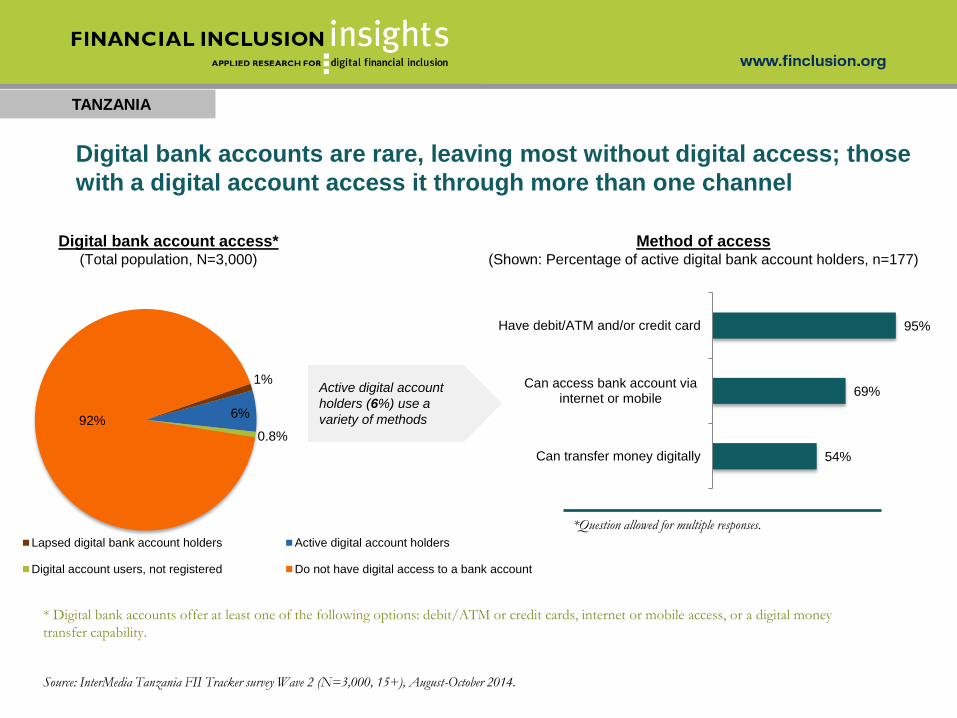
1%
6%
0.8%
92%
Lapsed digital bank account holders Active digital account holders
Digital account users, not registered Do not have digital access to a bank account
TANZANIA
Digital bank accounts are rare, leaving most without digital access; those
with a digital account access it through more than one channel
Method of access (Shown: Percentage of active digital bank account holders, n=177)
Digital bank account access* (Total population, N=3,000)
* Digital bank accounts offer at least one of the following options: debit/ATM or credit cards, internet or mobile access, or a digital money
transfer capability.
Source: InterMedia Tanzania FII Tracker survey Wave 2 (N=3,000, 15+), August-October 2014.
Active digital account
holders (6%) use a
variety of methods
54%
69%
95%
Can transfer money digitally
Can access bank account viainternet or mobile
Have debit/ATM and/or credit card
*Question allowed for multiple responses.
TANZANIA
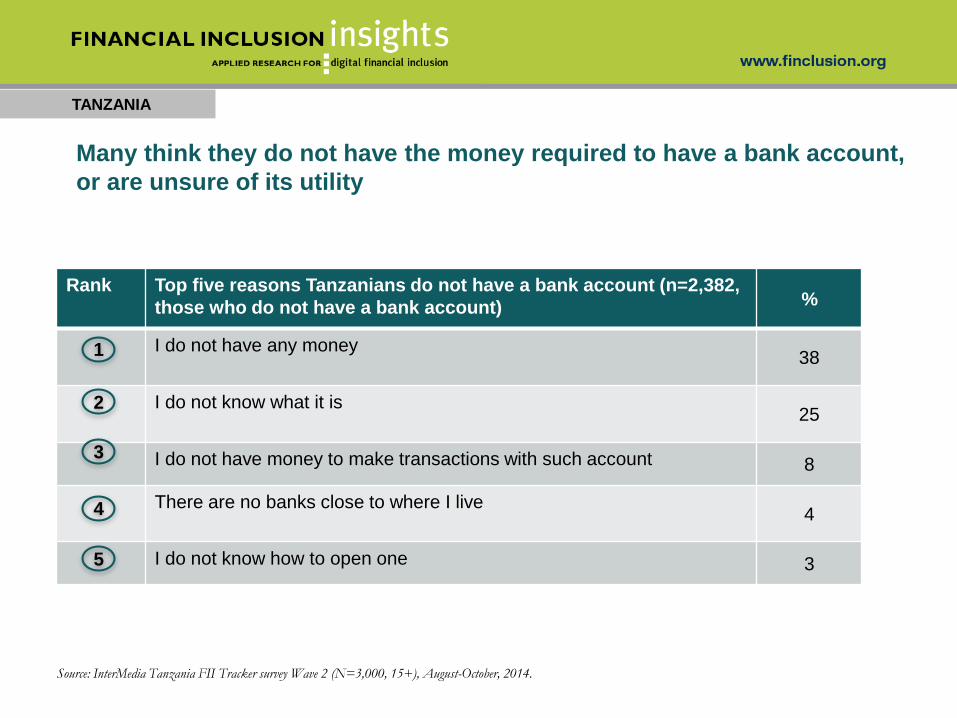
Rank Top five reasons Tanzanians do not have a bank account (n=2,382,
those who do not have a bank account) %
I do not have any money38
I do not know what it is25
I do not have money to make transactions with such account 8
There are no banks close to where I live 4
I do not know how to open one 3
Source: InterMedia Tanzania FII Tracker survey Wave 2 (N=3,000, 15+), August-October, 2014.
1
2
3
4
5
Many think they do not have the money required to have a bank account,
or are unsure of its utility
UPTAKE AND USE OF NONBANK
FINANCIAL SERVICES
TANZANIA
80
TANZANIA
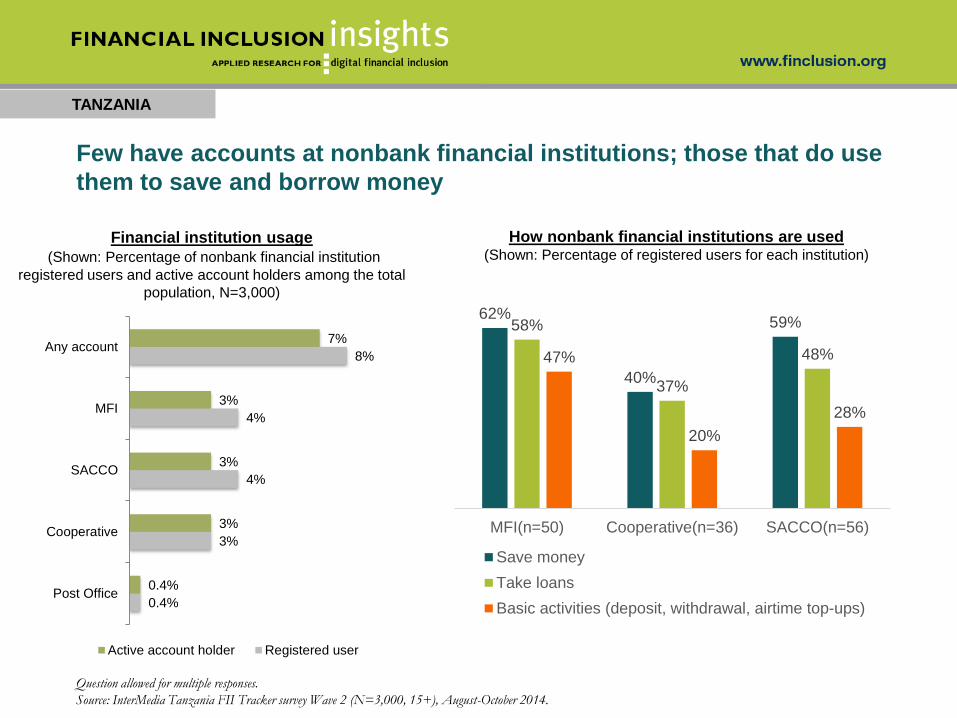
Few have accounts at nonbank financial institutions; those that do use
them to save and borrow money
How nonbank financial institutions are used(Shown: Percentage of registered users for each institution)
Financial institution usage
(Shown: Percentage of nonbank financial institution
registered users and active account holders among the total
population, N=3,000)
Question allowed for multiple responses.
Source: InterMedia Tanzania FII Tracker survey Wave 2 (N=3,000, 15+), August-October 2014.
62%
40%
59%58%
37%
48%47%
20%
28%
MFI(n=50) Cooperative(n=36) SACCO(n=56)
Save money
Take loans
Basic activities (deposit, withdrawal, airtime top-ups)0.4%
3%
4%
4%
8%
0.4%
3%
3%
3%
7%
Post Office
Cooperative
SACCO
MFI
Any account
Active account holder Registered user
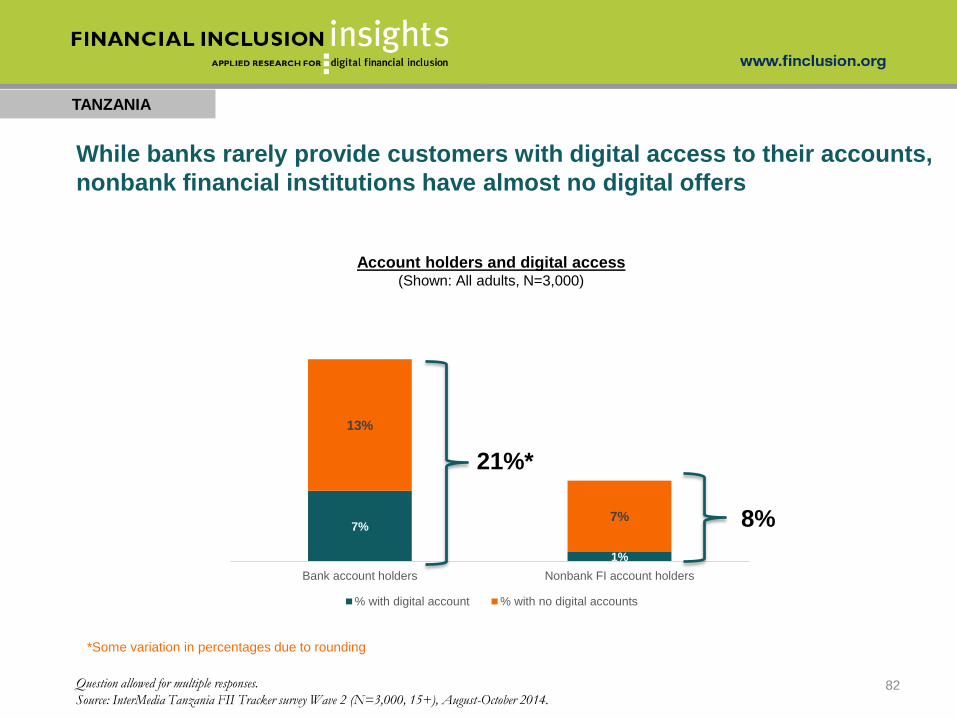
7%
1%
13%
7%
Bank account holders Nonbank FI account holders
% with digital account % with no digital accounts
TANZANIA
While banks rarely provide customers with digital access to their accounts,
nonbank financial institutions have almost no digital offers
82
Account holders and digital access(Shown: All adults, N=3,000)
Question allowed for multiple responses.
Source: InterMedia Tanzania FII Tracker survey Wave 2 (N=3,000, 15+), August-October 2014.
21%*
8%
*Some variation in percentages due to rounding
SPECIAL TOPICS: THE GENDER STORY
TANZANIA
83
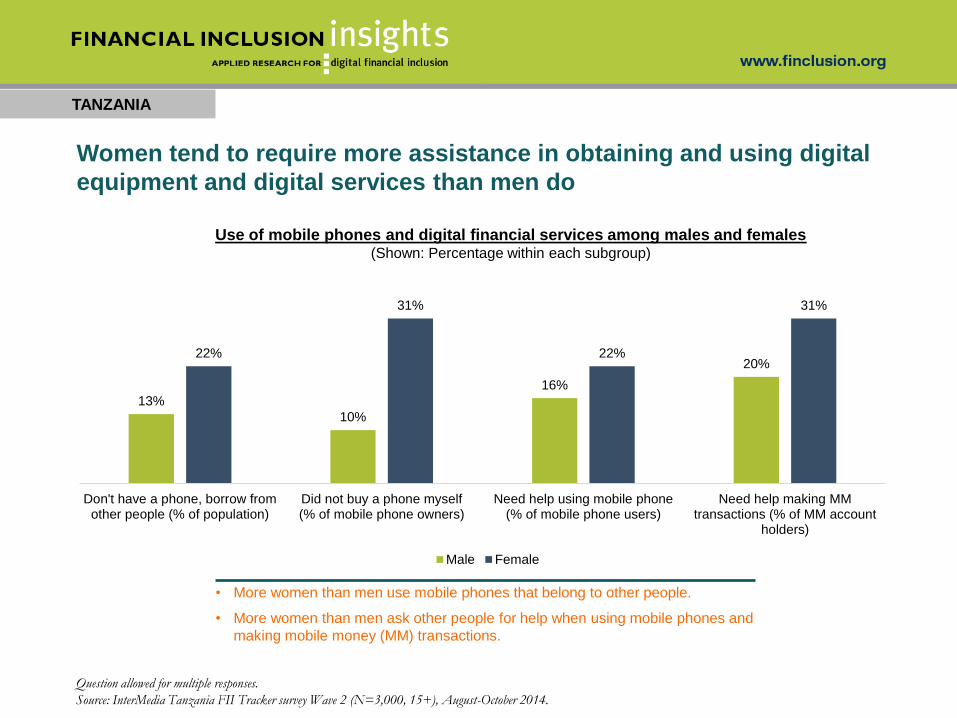
TANZANIA
• More women than men use mobile phones that belong to other people.
• More women than men ask other people for help when using mobile phones and
making mobile money (MM) transactions.
Women tend to require more assistance in obtaining and using digital
equipment and digital services than men do
Question allowed for multiple responses.
Source: InterMedia Tanzania FII Tracker survey Wave 2 (N=3,000, 15+), August-October 2014.
13%
10%
16%
20%22%
31%
22%
31%
Don't have a phone, borrow fromother people (% of population)
Did not buy a phone myself(% of mobile phone owners)
Need help using mobile phone(% of mobile phone users)
Need help making MMtransactions (% of MM account
holders)
Male Female
Use of mobile phones and digital financial services among males and females(Shown: Percentage within each subgroup)
TANZANIA
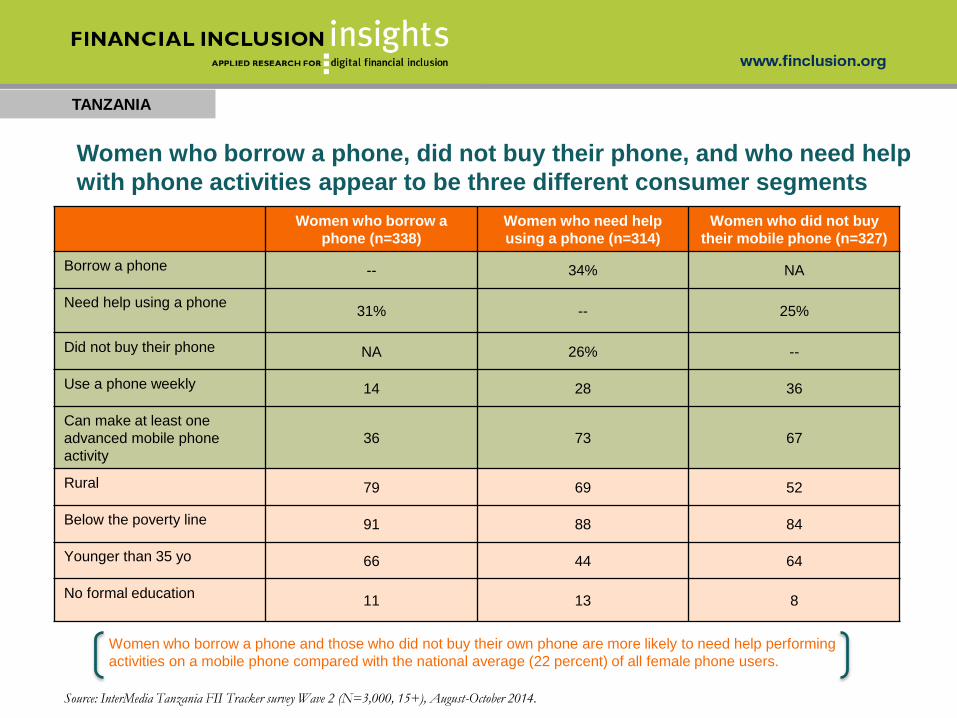
Women who borrow a phone and those who did not buy their own phone are more likely to need help performing
activities on a mobile phone compared with the national average (22 percent) of all female phone users.
Women who borrow a phone, did not buy their phone, and who need help
with phone activities appear to be three different consumer segments
Source: InterMedia Tanzania FII Tracker survey Wave 2 (N=3,000, 15+), August-October 2014.
Women who borrow a
phone (n=338)
Women who need help
using a phone (n=314)
Women who did not buy
their mobile phone (n=327)
Borrow a phone -- 34% NA
Need help using a phone31% -- 25%
Did not buy their phone NA 26% --
Use a phone weekly 14 28 36
Can make at least one
advanced mobile phone
activity
36 73 67
Rural 79 69 52
Below the poverty line 91 88 84
Younger than 35 yo 66 44 64
No formal education11 13 8
TANZANIA
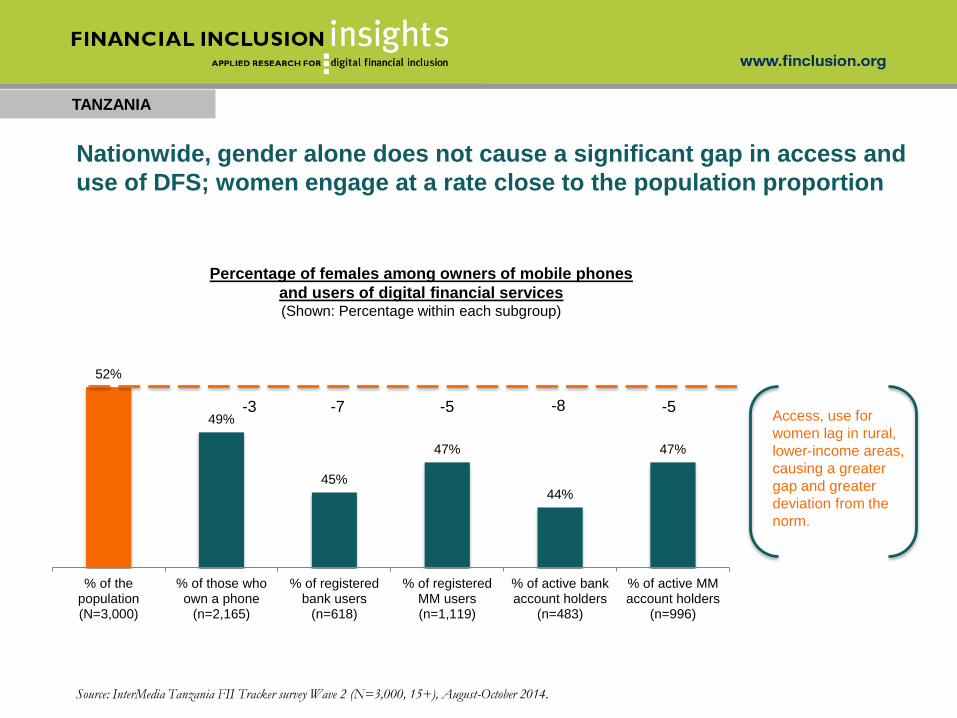
Nationwide, gender alone does not cause a significant gap in access and
use of DFS; women engage at a rate close to the population proportion
Source: InterMedia Tanzania FII Tracker survey Wave 2 (N=3,000, 15+), August-October 2014.
Percentage of females among owners of mobile phones
and users of digital financial services(Shown: Percentage within each subgroup)
52%
49%
45%
47%
44%
47%
% of thepopulation(N=3,000)
% of those whoown a phone
(n=2,165)
% of registeredbank users
(n=618)
% of registeredMM users(n=1,119)
% of active bankaccount holders
(n=483)
% of active MMaccount holders
(n=996)
Access, use for
women lag in rural,
lower-income areas,
causing a greater
gap and greater
deviation from the
norm.
-3 -5-7 -5-8
TANZANIA
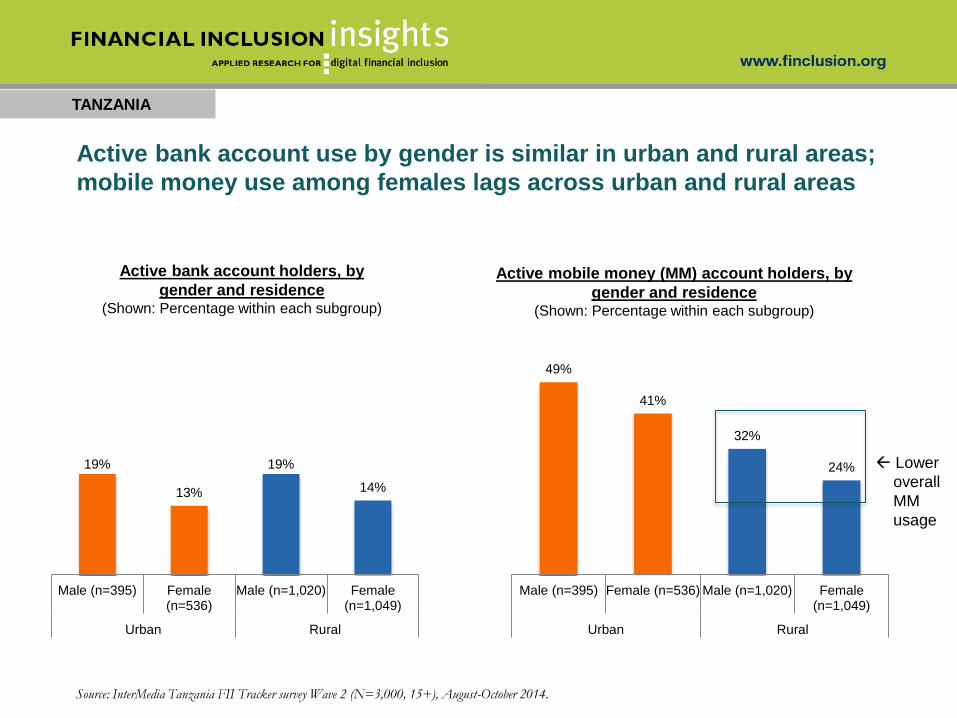
Active bank account use by gender is similar in urban and rural areas;
mobile money use among females lags across urban and rural areas
Source: InterMedia Tanzania FII Tracker survey Wave 2 (N=3,000, 15+), August-October 2014.
Active bank account holders, by
gender and residence(Shown: Percentage within each subgroup)
Active mobile money (MM) account holders, by
gender and residence(Shown: Percentage within each subgroup)
19%
13%
19%
14%
Male (n=395) Female(n=536)
Male (n=1,020) Female(n=1,049)
Urban Rural
49%
41%
32%
24%
Male (n=395) Female (n=536) Male (n=1,020) Female(n=1,049)
Urban Rural
Lower
overall
MM
usage
TANZANIA
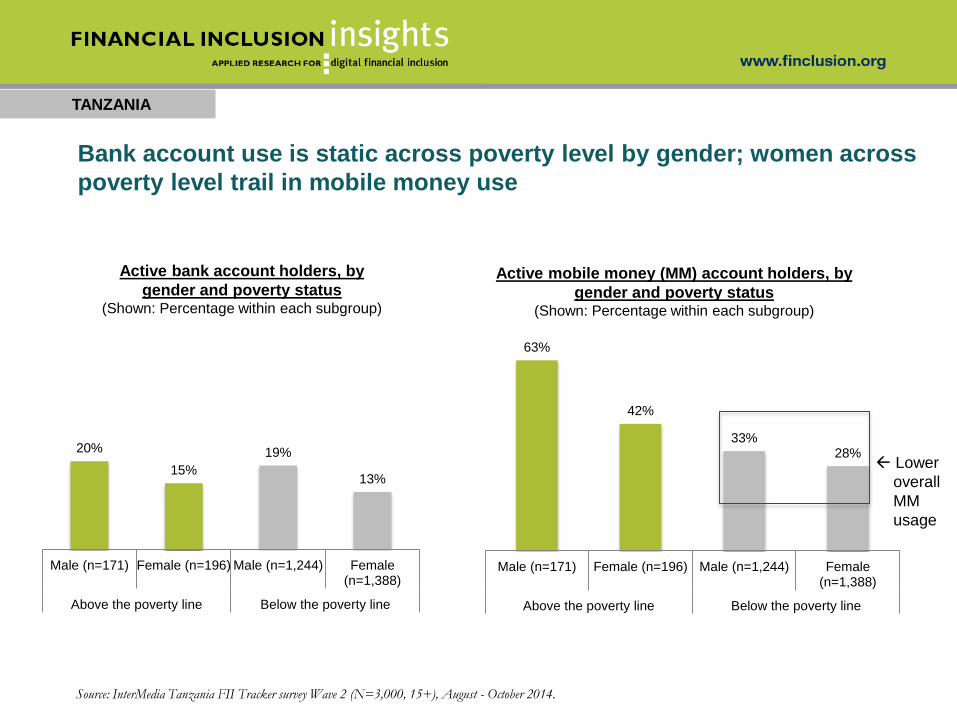
Bank account use is static across poverty level by gender; women across
poverty level trail in mobile money use
Source: InterMedia Tanzania FII Tracker survey Wave 2 (N=3,000, 15+), August - October 2014.
Active bank account holders, by
gender and poverty status(Shown: Percentage within each subgroup)
Active mobile money (MM) account holders, by
gender and poverty status(Shown: Percentage within each subgroup)
63%
42%
33%28%
Male (n=171) Female (n=196) Male (n=1,244) Female(n=1,388)
Above the poverty line Below the poverty line
20%
15%
19%
13%
Male (n=171) Female (n=196) Male (n=1,244) Female(n=1,388)
Above the poverty line Below the poverty line
Lower
overall
MM
usage
SPECIAL TOPICS:
CROSS-COUNTRY INDICATORS
TANZANIA
89
TANZANIA
90
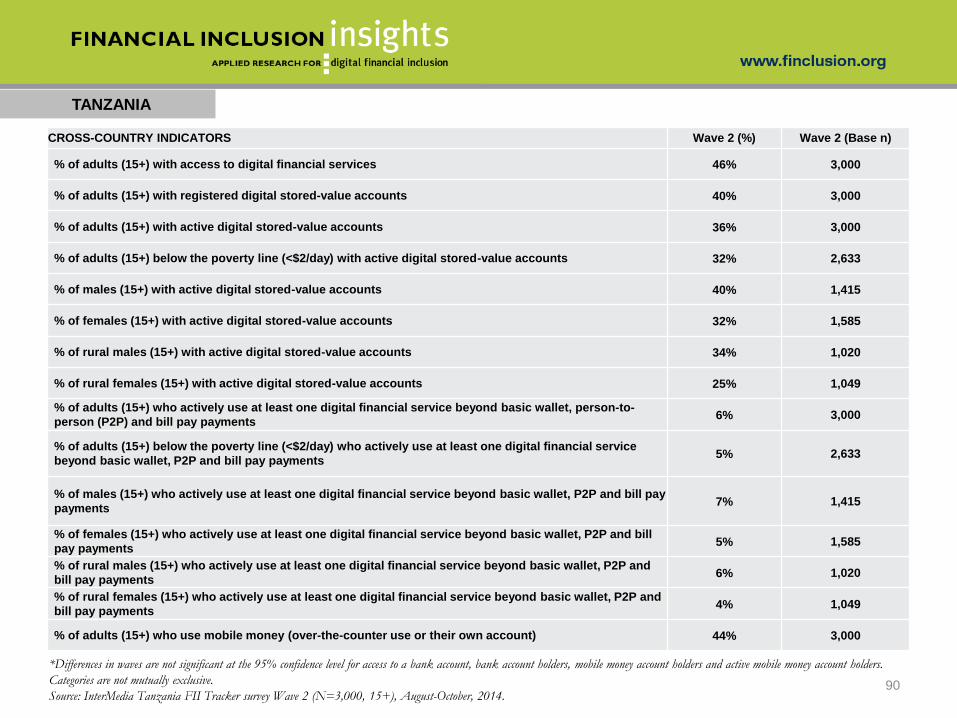
CROSS-COUNTRY INDICATORS Wave 2 (%) Wave 2 (Base n)
% of adults (15+) with access to digital financial services 46% 3,000
% of adults (15+) with registered digital stored-value accounts 40% 3,000
% of adults (15+) with active digital stored-value accounts 36% 3,000
% of adults (15+) below the poverty line (<$2/day) with active digital stored-value accounts 32% 2,633
% of males (15+) with active digital stored-value accounts 40% 1,415
% of females (15+) with active digital stored-value accounts 32% 1,585
% of rural males (15+) with active digital stored-value accounts 34% 1,020
% of rural females (15+) with active digital stored-value accounts 25% 1,049
% of adults (15+) who actively use at least one digital financial service beyond basic wallet, person-to-
person (P2P) and bill pay payments6% 3,000
% of adults (15+) below the poverty line (<$2/day) who actively use at least one digital financial service
beyond basic wallet, P2P and bill pay payments5% 2,633
% of males (15+) who actively use at least one digital financial service beyond basic wallet, P2P and bill pay
payments7% 1,415
% of females (15+) who actively use at least one digital financial service beyond basic wallet, P2P and bill
pay payments5% 1,585
% of rural males (15+) who actively use at least one digital financial service beyond basic wallet, P2P and
bill pay payments6% 1,020
% of rural females (15+) who actively use at least one digital financial service beyond basic wallet, P2P and
bill pay payments4% 1,049
% of adults (15+) who use mobile money (over-the-counter use or their own account) 44% 3,000
*Differences in waves are not significant at the 95% confidence level for access to a bank account, bank account holders, mobile money account holders and active mobile money account holders.
Categories are not mutually exclusive.
Source: InterMedia Tanzania FII Tracker survey Wave 2 (N=3,000, 15+), August-October, 2014.
METHODOLOGY AND
RESEARCH DESCRIPTION
TANZANIA
91
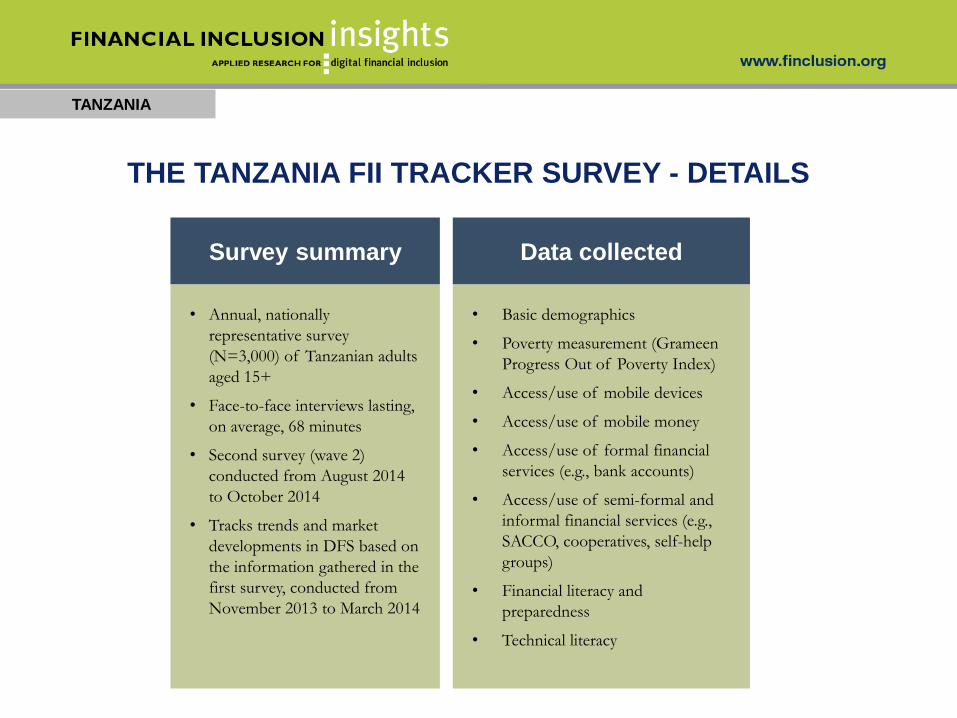
THE TANZANIA FII TRACKER SURVEY - DETAILS
Data collected
• Basic demographics
• Poverty measurement (Grameen
Progress Out of Poverty Index)
• Access/use of mobile devices
• Access/use of mobile money
• Access/use of formal financial
services (e.g., bank accounts)
• Access/use of semi-formal and
informal financial services (e.g.,
SACCO, cooperatives, self-help
groups)
• Financial literacy and
preparedness
• Technical literacy
TANZANIA
Survey summary
• Annual, nationally
representative survey
(N=3,000) of Tanzanian adults
aged 15+
• Face-to-face interviews lasting,
on average, 68 minutes
• Second survey (wave 2)
conducted from August 2014
to October 2014
• Tracks trends and market
developments in DFS based on
the information gathered in the
first survey, conducted from
November 2013 to March 2014
SAMPLING APPROACH
Target population, sample size and sampling frame
The sample size for this study was 3,000 Tanzanian adults (15+), which allowed for cost-effective representation of the population at the
country level as well as by key subgroups, including by sex, age and urban/rural residence. The survey sample distribution was based on the
2012 census.
Sample design and allocation
InterMedia used a multistage, stratified, clustered and randomized sampling methodology that included proportional distribution of the
sample (3,000 interviews) across Tanzania’s 30 regions, stratified by urban and rural populations.
Selection of Enumeration Areas/Primary Sampling Units (PSUs)
Enumeration areas (EAs)/Villages – the smallest administrative units as defined by the 2012 Tanzanian Population and Housing Census –
were the primary sampling units (PSUs) for the study. Within each region, all districts, and then all wards within each district, were listed and
stratified first into urban and rural. Within each strata, wards were then sampled using a probability proportionate to population size approach
(PPPS). Following, individual urban and rural EAs/villages were listed and selected also using a probability proportionate to population size
approach (PPPS).
Sampling Start-Points, Households and Respondents
• One start-point within each EA was chosen by randomly selecting from a list of local landmarks identified by village elders.
• Households (see Glossary) were selected using a random route walk, standardized skip pattern and process for substitution.
• One respondent per household was selected using the Kish grid method and relevant consent for eligible respondents under 18 years of age
was obtained.
GLOSSARY
TANZANIA
94
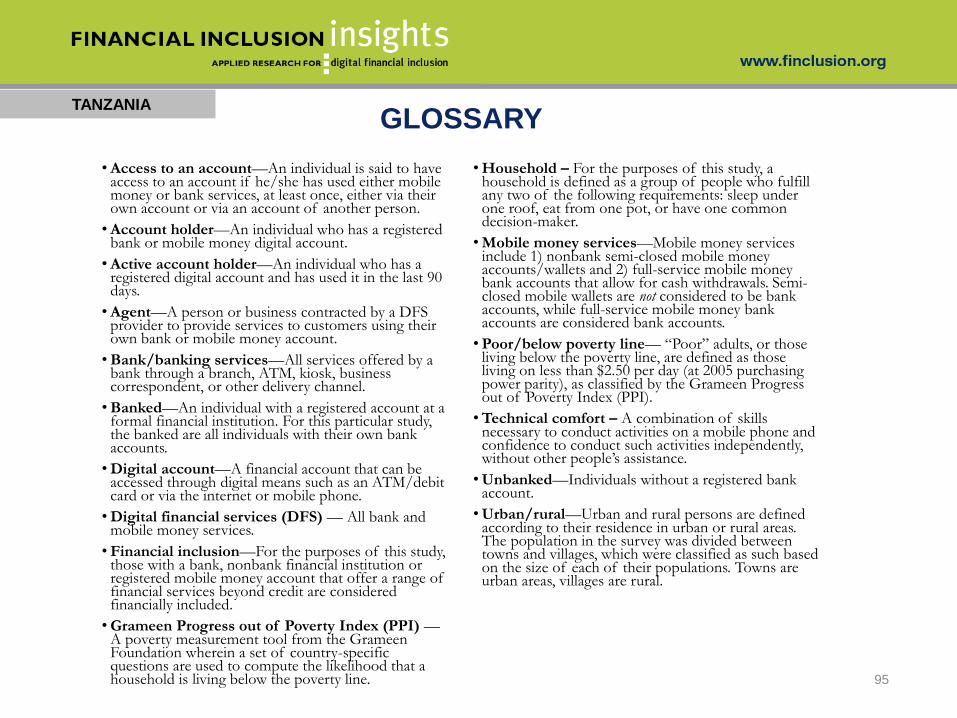
GLOSSARY TANZANIA
• Access to an account—An individual is said to have access to an account if he/she has used either mobile money or bank services, at least once, either via their own account or via an account of another person.
• Account holder—An individual who has a registered bank or mobile money digital account.
• Active account holder—An individual who has a registered digital account and has used it in the last 90 days.
• Agent—A person or business contracted by a DFS provider to provide services to customers using their own bank or mobile money account.
• Bank/banking services—All services offered by a bank through a branch, ATM, kiosk, business correspondent, or other delivery channel.
• Banked—An individual with a registered account at a formal financial institution. For this particular study, the banked are all individuals with their own bank accounts.
• Digital account—A financial account that can be accessed through digital means such as an ATM/debit card or via the internet or mobile phone.
• Digital financial services (DFS) — All bank and mobile money services.
• Financial inclusion—For the purposes of this study, those with a bank, nonbank financial institution or registered mobile money account that offer a range of financial services beyond credit are considered financially included.
• Grameen Progress out of Poverty Index (PPI) —A poverty measurement tool from the Grameen Foundation wherein a set of country-specific questions are used to compute the likelihood that a household is living below the poverty line.
• Household – For the purposes of this study, a household is defined as a group of people who fulfill any two of the following requirements: sleep under one roof, eat from one pot, or have one common decision-maker.
• Mobile money services—Mobile money services include 1) nonbank semi-closed mobile money accounts/wallets and 2) full-service mobile money bank accounts that allow for cash withdrawals. Semi-closed mobile wallets are not considered to be bank accounts, while full-service mobile money bank accounts are considered bank accounts.
• Poor/below poverty line— “Poor” adults, or those living below the poverty line, are defined as those living on less than $2.50 per day (at 2005 purchasing power parity), as classified by the Grameen Progress out of Poverty Index (PPI).
• Technical comfort – A combination of skills necessary to conduct activities on a mobile phone and confidence to conduct such activities independently, without other people’s assistance.
• Unbanked—Individuals without a registered bank account.
• Urban/rural—Urban and rural persons are defined according to their residence in urban or rural areas. The population in the survey was divided between towns and villages, which were classified as such based on the size of each of their populations. Towns are urban areas, villages are rural.
95