Embed Size (px)
Citation preview
By Chad Cooper, Southwestern Energy Company
>>> # create a new list>>> a = [‘zero’,’one’,’two’,’three’]>>> # indexing is zero-based>>> print a[0]‘zero’>>> # iterate through the list, print out members>>> for b in a:... print b...‘zero’‘one’‘two’‘three’
Listing 1: Iterating through a list
Tapping Into the Power of PythonData mining, data processing, logging, and e-mails
The Python programming language, first introduced in 1991, has made its way to the forefront of GIS programming in recent years. As a high-level programming language, Python offers clear syntax; readability; very strong and dynamic typing; automatic garbage collection; extensive standard libraries and third-party libraries for tackling virtually any task; a helpful, friendly user community; and, of course, an open-source license. So what does all of this mean to GIS users? Several things. If you already have some programming experience with other languages, Python will be very easy for you to learn. If you have virtually no programming experience, you don’t have to get a bachelor’s degree in computer science to learn Python. Its strict adherence to structured form that uses indentation and white space to delimit statement blocks and its use of simple English keywords make Python incredibly easy for novices to read and understand. If you need help, you can find it in the form of online tutorials, blogs, forums—you name it. Also, it appears that with the imminent release of ArcGIS 9.3 in mid-2008, ESRI has committed to using Python as its preferred language for geoprocessing scripting. Moreover, the extensive standard modules—as well as a plethora of third-party modules available under the open-source license—make Python, as a geoprocessing platform, capable of doing anything. That’s right, I said Python can do anything. Unfortunately, I don’t have enough time to enumerate all of Python’s strengths nor do I have an unlimited word count for this article, so I can’t tell you everything Python can do. However, this article provides some highlights: lists and dictionaries, data mining, text file processing, logging process results to log files, and sending simple e-mails. All these capabilities can come in quite handy.
Lists and Dictionaries—Your New Best FriendsIt is often said the list is Python’s workhorse data type and for good reason. Lists come in handy for many tasks. In particular, they work well as iterators. Lists are ordered collections of arbitrary objects in which each object resides in its own location (or index) within the list as shown in Listing 1. Using a simple for-loop, it is easy to iterate through a list and print its members to standard output at a command prompt (stdout). List iterations will be demonstrated in greater detail later in this article.
Old-school GIS users are intimately familiar with lookup tables. Python’s version of a lookup table is called a dictionary. In Python, a dictionary is a built-in data type that defines one-to-one relationships between keys and values. Using a Python dictionary is similar to looking up a definition in a glossary: the word is the key and its definition is the value. Listing 2 shows a simple dictionary of land-use keys and values. This demonstration may seem trivial, but lists and dictionaries are the building blocks for bigger and better things to come.
Fetching Datasets from the WebThe text file we will use for the remainder of this tutorial is located on the Web. Sure, we could open a Web browser, navigate to the site, and download the data by right-clicking on each file and saving it locally, but that is so 1999, isn’t it? Instead, let’s look at how we might fetch data from the Web using Python and the urllib module from the standard library as shown in Listing 3.
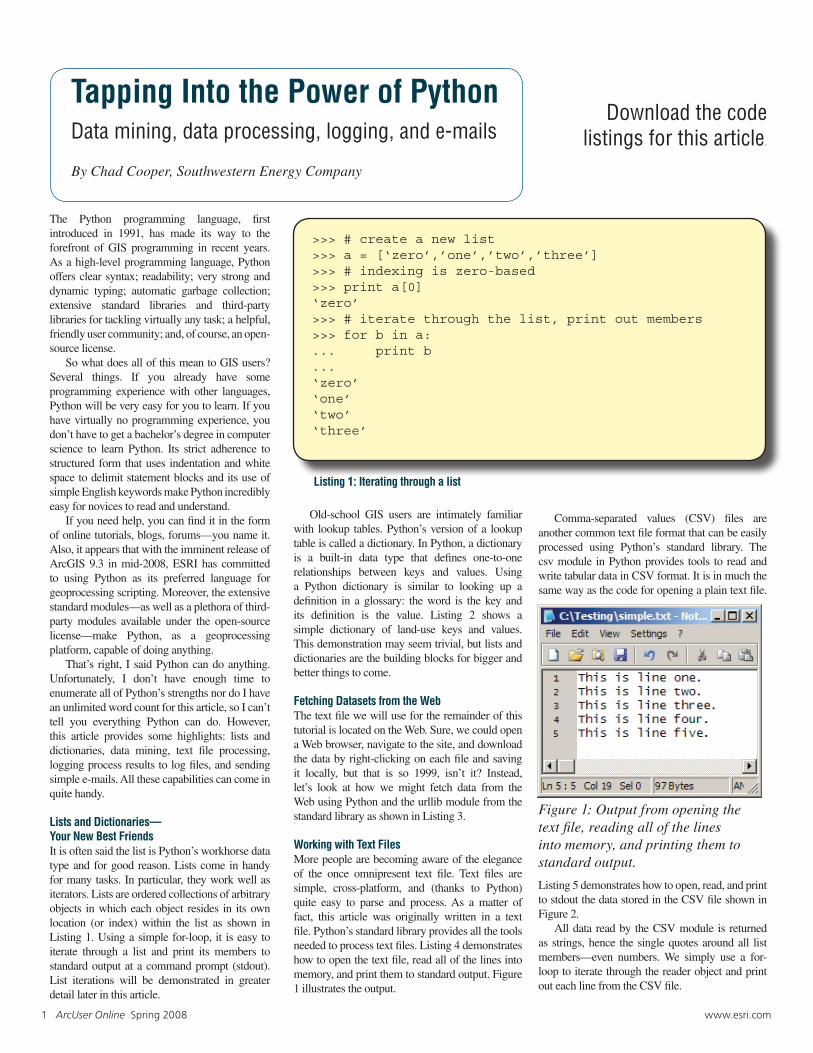
Working with Text FilesMore people are becoming aware of the elegance of the once omnipresent text file. Text files are simple, cross-platform, and (thanks to Python) quite easy to parse and process. As a matter of fact, this article was originally written in a text file. Python’s standard library provides all the tools needed to process text files. Listing 4 demonstrates how to open the text file, read all of the lines into memory, and print them to standard output. Figure 1 illustrates the output.
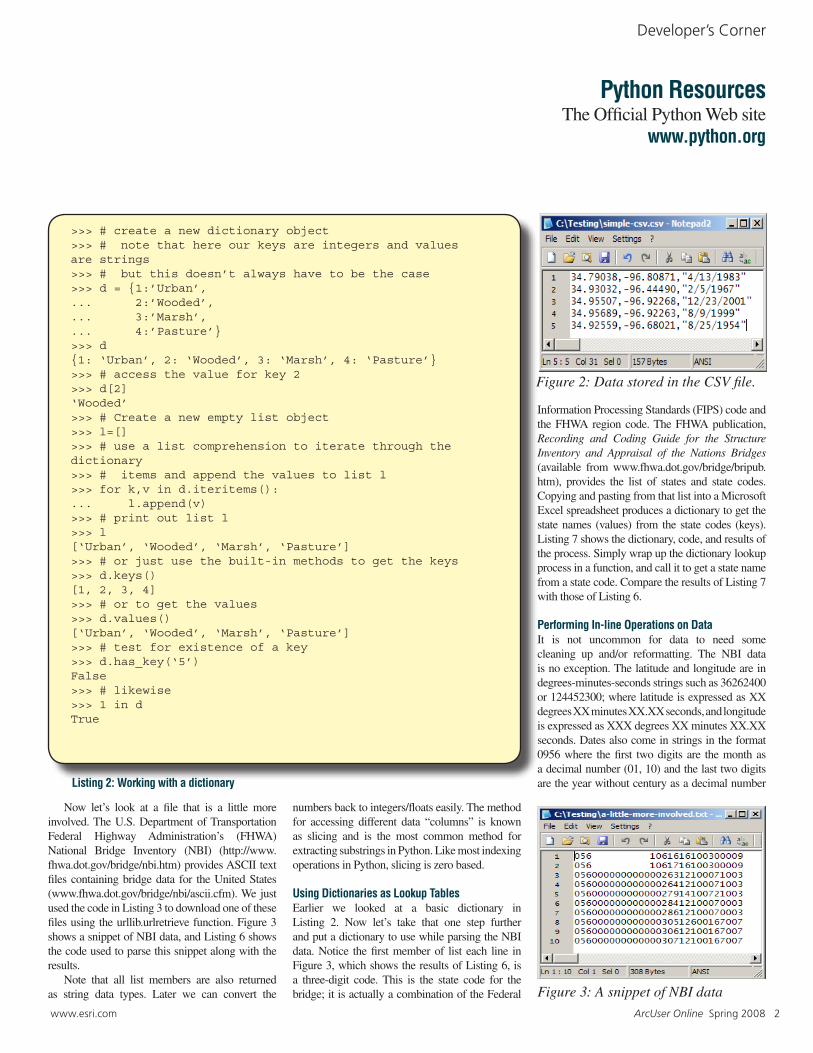
Comma-separated values (CSV) files are another common text file format that can be easily processed using Python’s standard library. The csv module in Python provides tools to read and write tabular data in CSV format. It is in much the same way as the code for opening a plain text file.
Listing 5 demonstrates how to open, read, and print to stdout the data stored in the CSV file shown in Figure 2. All data read by the CSV module is returned as strings, hence the single quotes around all list members—even numbers. We simply use a for-loop to iterate through the reader object and print out each line from the CSV file.
Figure 1: Output from opening the text file, reading all of the lines into memory, and printing them to standard output.
Download the code listings for this article.
1 ArcUser Online Spring 2008 www.esri.com
>>> # create a new dictionary object>>> # note that here our keys are integers and values are strings>>> # but this doesn’t always have to be the case>>> d = {1:’Urban’,... 2:’Wooded’,... 3:’Marsh’,... 4:’Pasture’}>>> d{1: ‘Urban’, 2: ‘Wooded’, 3: ‘Marsh’, 4: ‘Pasture’}>>> # access the value for key 2>>> d[2]‘Wooded’>>> # Create a new empty list object>>> l=[]>>> # use a list comprehension to iterate through the dictionary>>> # items and append the values to list l>>> for k,v in d.iteritems():... l.append(v)>>> # print out list l>>> l[‘Urban’, ‘Wooded’, ‘Marsh’, ‘Pasture’]>>> # or just use the built-in methods to get the keys>>> d.keys()[1, 2, 3, 4]>>> # or to get the values>>> d.values()[‘Urban’, ‘Wooded’, ‘Marsh’, ‘Pasture’]>>> # test for existence of a key>>> d.has_key(‘5’)False>>> # likewise>>> 1 in dTrue
Listing 2: Working with a dictionary
Figure 2: Data stored in the CSV file.
www.esri.com ArcUser Online Spring 2008 2
Python ResourcesThe Official Python Web site
www.python.org
Developer’s Corner
Figure 3: A snippet of NBI data
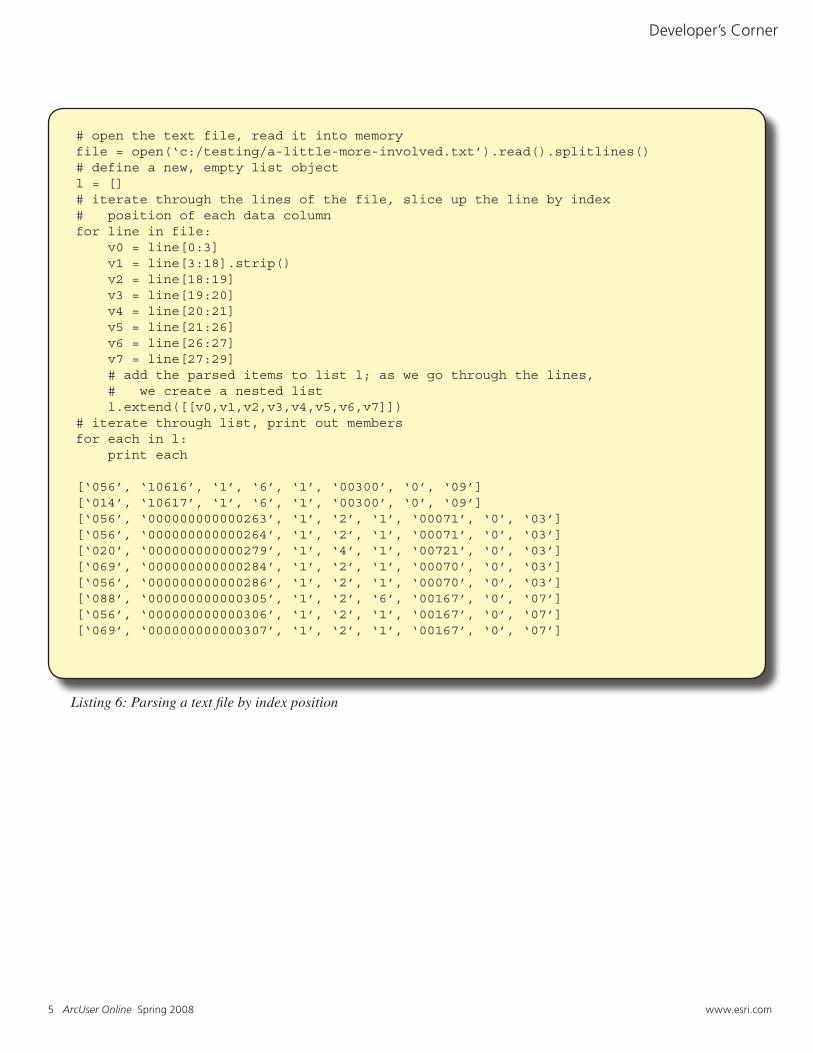
Now let’s look at a file that is a little more involved. The U.S. Department of Transportation Federal Highway Administration’s (FHWA) National Bridge Inventory (NBI) (http://www.fhwa.dot.gov/bridge/nbi.htm) provides ASCII text files containing bridge data for the United States (www.fhwa.dot.gov/bridge/nbi/ascii.cfm). We just used the code in Listing 3 to download one of these files using the urllib.urlretrieve function. Figure 3 shows a snippet of NBI data, and Listing 6 shows the code used to parse this snippet along with the results. Note that all list members are also returned as string data types. Later we can convert the
numbers back to integers/floats easily. The method for accessing different data “columns” is known as slicing and is the most common method for extracting substrings in Python. Like most indexing operations in Python, slicing is zero based.
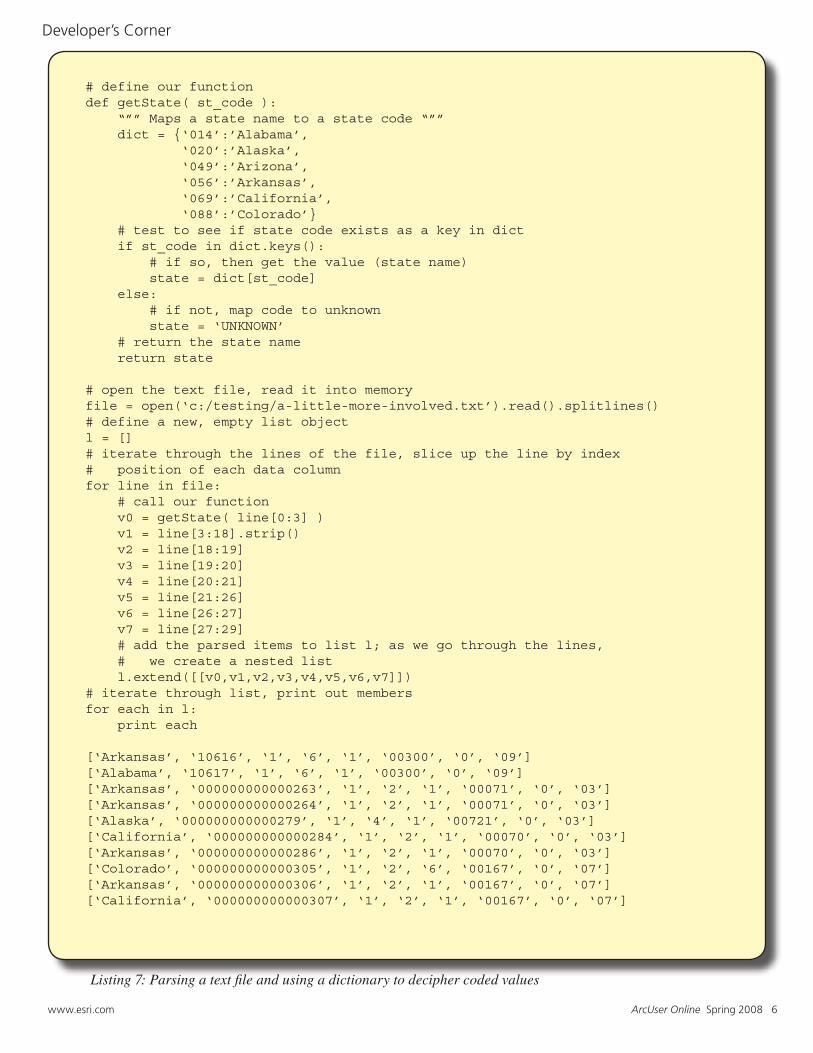
Using Dictionaries as Lookup TablesEarlier we looked at a basic dictionary in Listing 2. Now let’s take that one step further and put a dictionary to use while parsing the NBI data. Notice the first member of list each line in Figure 3, which shows the results of Listing 6, is a three-digit code. This is the state code for the bridge; it is actually a combination of the Federal
Information Processing Standards (FIPS) code and the FHWA region code. The FHWA publication, Recording and Coding Guide for the Structure Inventory and Appraisal of the Nations Bridges (available from www.fhwa.dot.gov/bridge/bripub.htm), provides the list of states and state codes. Copying and pasting from that list into a Microsoft Excel spreadsheet produces a dictionary to get the state names (values) from the state codes (keys). Listing 7 shows the dictionary, code, and results of the process. Simply wrap up the dictionary lookup process in a function, and call it to get a state name from a state code. Compare the results of Listing 7 with those of Listing 6.
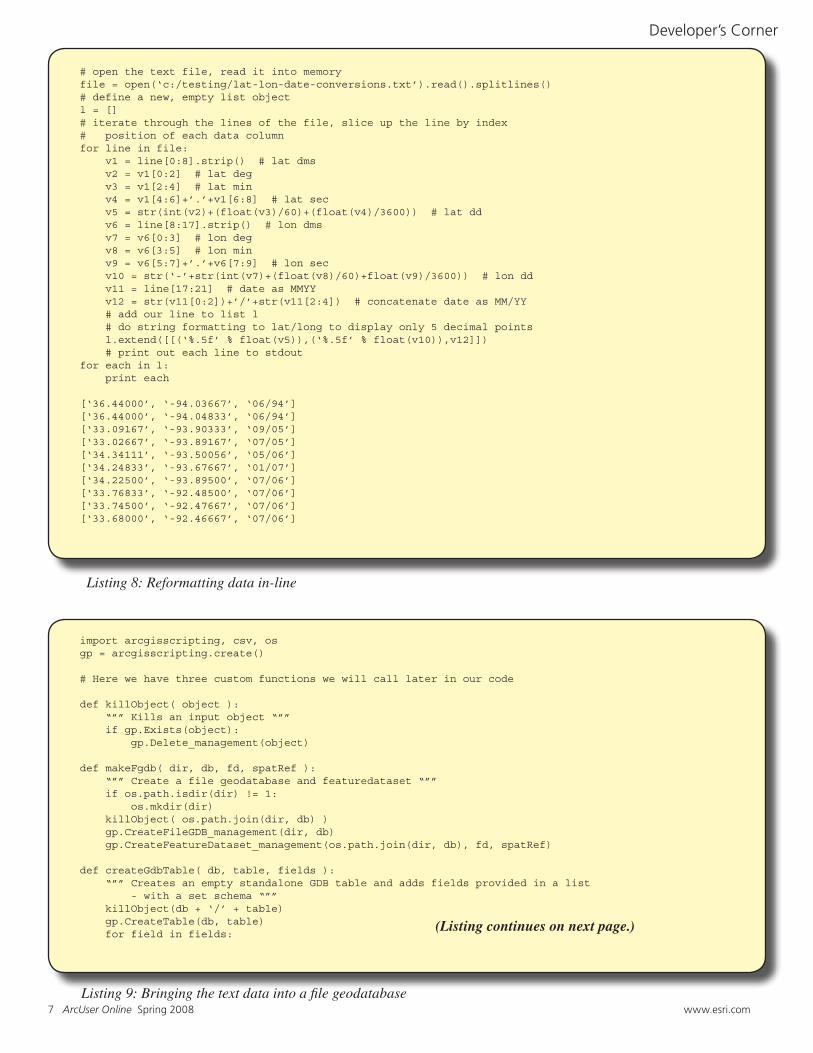
Performing In-line Operations on DataIt is not uncommon for data to need some cleaning up and/or reformatting. The NBI data is no exception. The latitude and longitude are in degrees-minutes-seconds strings such as 36262400 or 124452300; where latitude is expressed as XX degrees XX minutes XX.XX seconds, and longitude is expressed as XXX degrees XX minutes XX.XX seconds. Dates also come in strings in the format 0956 where the first two digits are the month as a decimal number (01, 10) and the last two digits are the year without century as a decimal number
>>> # in its simplest form - fetch one file and save it locally>>> import urllib>>> urllib.urlretrieve(‘http://www.fhwa.dot.gov/bridge/nbi/2007/AR07.txt’,\ ’C:/testing/nbi/ar07.txt’)(‘C:/testing/nbi/ar07.txt’, <httplib.HTTPMessage instance at 0x733e68>)>>> # more advanced, iterate through a list to fetch multiple files>>> url = ‘http://www.fhwa.dot.gov/bridge/nbi/2007/’>>> # let’s grab 3 files - Arkansas, Oklahoma, and Missouri>>> files = [‘ar’,’ok’,’mo’]>>> for file in files:... urllib.urlretrieve(url + file + ‘07.txt’, ‘C:/testing/nbi/’\ + file + ‘07.txt’)...(‘C:/testing/nbi/ar07.txt’, <httplib.HTTPMessage instance at 0x73a418>)(‘C:/testing/nbi/ok07.txt’, <httplib.HTTPMessage instance at 0x73a0d0>)(‘C:/testing/nbi/mo07.txt’, <httplib.HTTPMessage instance at 0x73a418>)
Listing 3: Fetching files from the Web
>>> # open the text file, read all of the lines into memory>>> file = open(‘C:/testing/simple.txt’).read().splitlines()>>> # print file contents to stdout line by line>>> for line in file:... print line...This is line one.This is line two.This is line three.This is line four.This is line five
Listing 4: Reading a simple text file
Developer’s Corner
3 ArcUser Online Spring 2008 www.esri.com
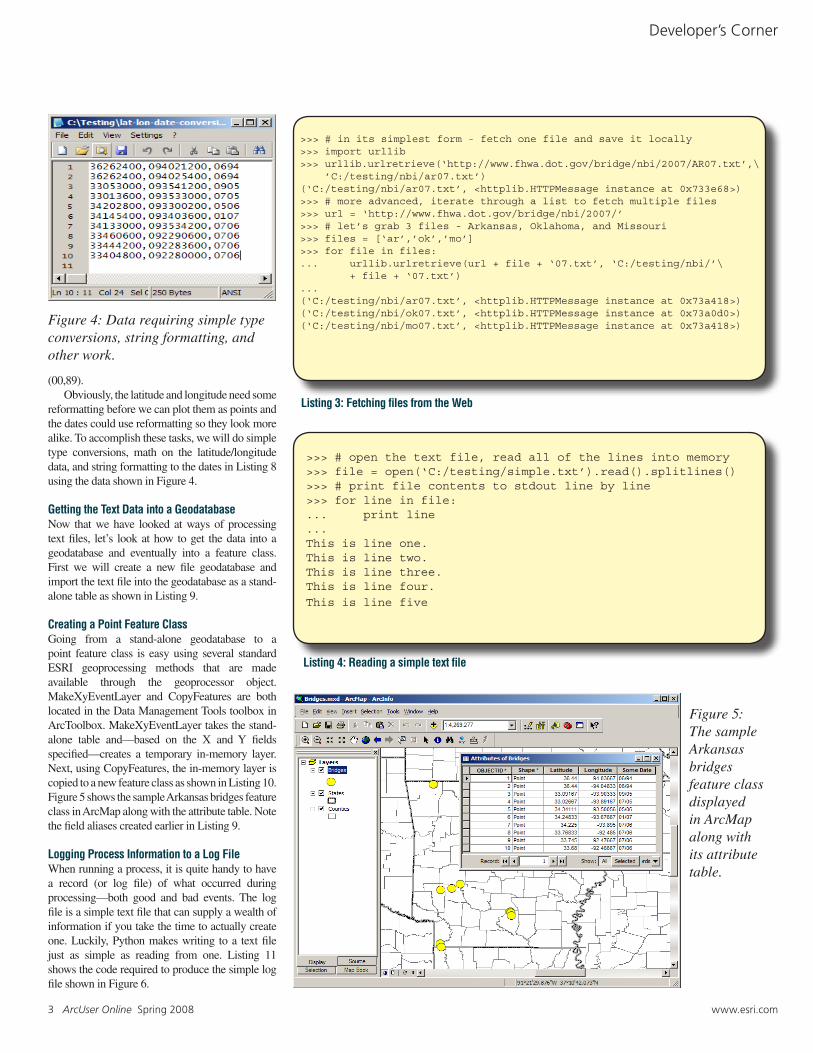
Figure 4: Data requiring simple type conversions, string formatting, and other work.
(00,89). Obviously, the latitude and longitude need some reformatting before we can plot them as points and the dates could use reformatting so they look more alike. To accomplish these tasks, we will do simple type conversions, math on the latitude/longitude data, and string formatting to the dates in Listing 8 using the data shown in Figure 4.
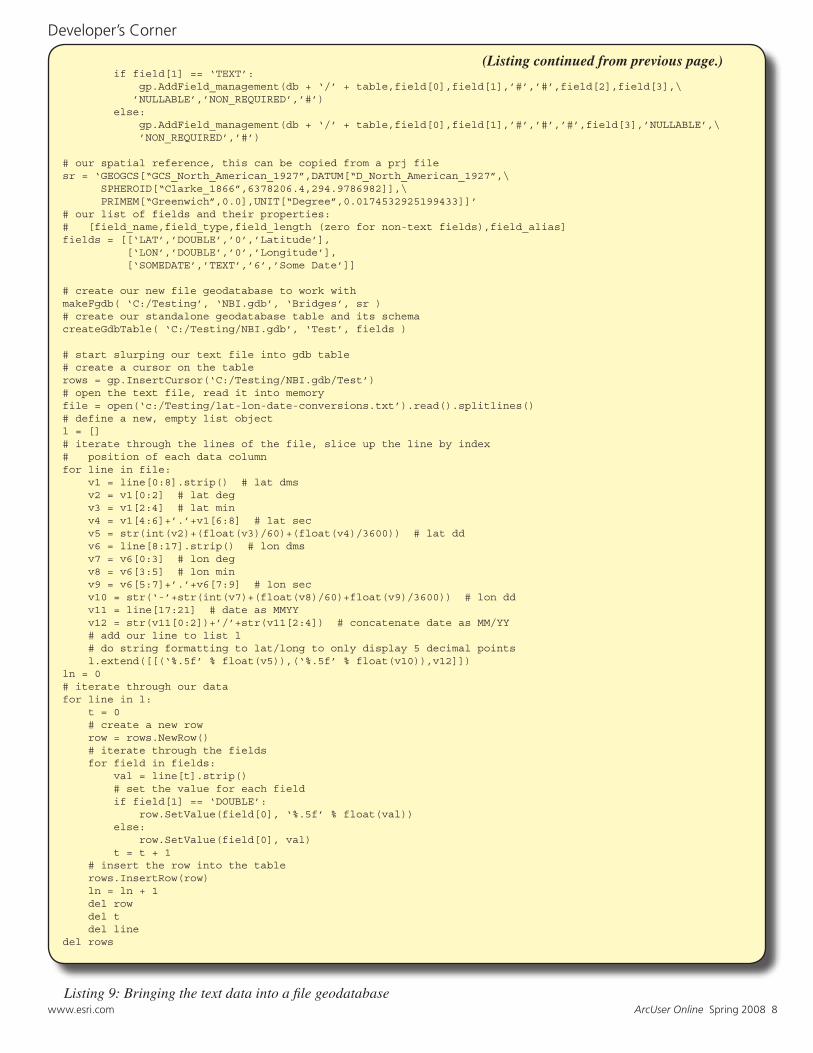
Getting the Text Data into a GeodatabaseNow that we have looked at ways of processing text files, let’s look at how to get the data into a geodatabase and eventually into a feature class. First we will create a new file geodatabase and import the text file into the geodatabase as a stand-alone table as shown in Listing 9.
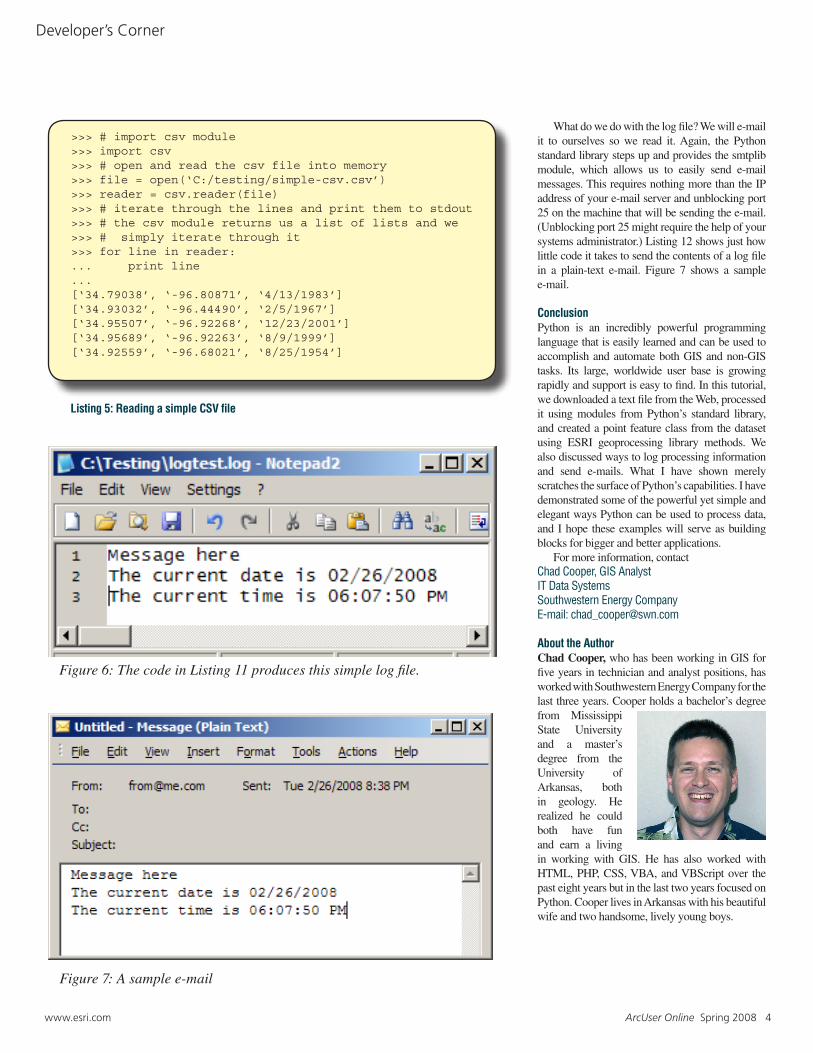
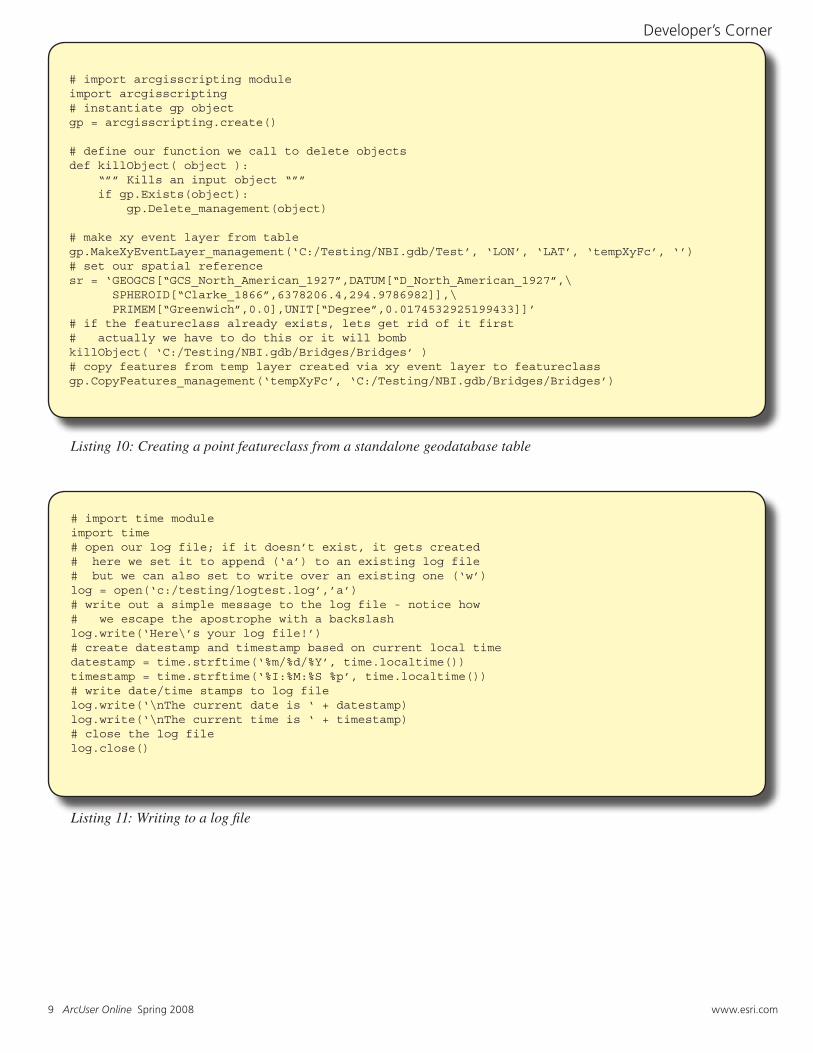
Creating a Point Feature ClassGoing from a stand-alone geodatabase to a point feature class is easy using several standard ESRI geoprocessing methods that are made available through the geoprocessor object. MakeXyEventLayer and CopyFeatures are both located in the Data Management Tools toolbox in ArcToolbox. MakeXyEventLayer takes the stand-alone table and—based on the X and Y fields specified—creates a temporary in-memory layer. Next, using CopyFeatures, the in-memory layer is copied to a new feature class as shown in Listing 10. Figure 5 shows the sample Arkansas bridges feature class in ArcMap along with the attribute table. Note the field aliases created earlier in Listing 9.
Logging Process Information to a Log FileWhen running a process, it is quite handy to have a record (or log file) of what occurred during processing—both good and bad events. The log file is a simple text file that can supply a wealth of information if you take the time to actually create one. Luckily, Python makes writing to a text file just as simple as reading from one. Listing 11 shows the code required to produce the simple log file shown in Figure 6.
Figure 5: The sample Arkansas bridges feature class displayed in ArcMap along with its attribute table.
>>> # import csv module>>> import csv>>> # open and read the csv file into memory>>> file = open(‘C:/testing/simple-csv.csv’)>>> reader = csv.reader(file)>>> # iterate through the lines and print them to stdout>>> # the csv module returns us a list of lists and we>>> # simply iterate through it>>> for line in reader:... print line...[‘34.79038’, ‘-96.80871’, ‘4/13/1983’][‘34.93032’, ‘-96.44490’, ‘2/5/1967’][‘34.95507’, ‘-96.92268’, ‘12/23/2001’][‘34.95689’, ‘-96.92263’, ‘8/9/1999’][‘34.92559’, ‘-96.68021’, ‘8/25/1954’]
Listing 5: Reading a simple CSV file
www.esri.com ArcUser Online Spring 2008 4
Figure 7: A sample e-mail
Developer’s Corner
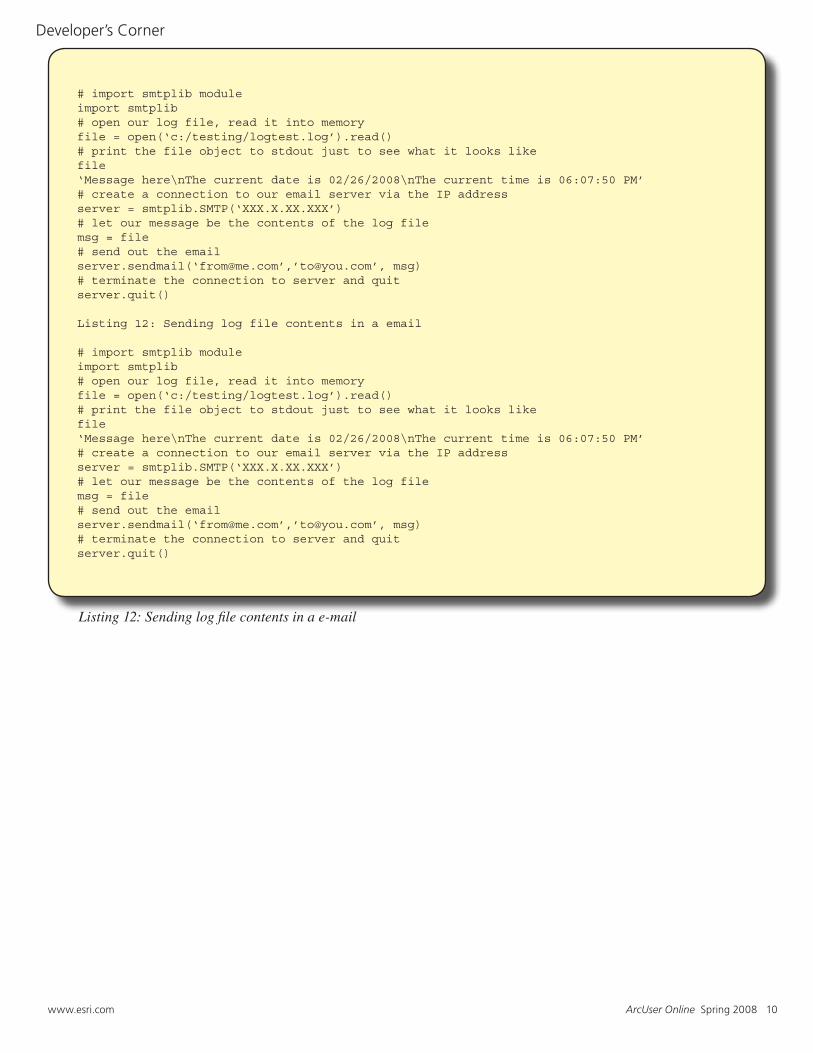
What do we do with the log file? We will e-mail it to ourselves so we read it. Again, the Python standard library steps up and provides the smtplib module, which allows us to easily send e-mail messages. This requires nothing more than the IP address of your e-mail server and unblocking port 25 on the machine that will be sending the e-mail. (Unblocking port 25 might require the help of your systems administrator.) Listing 12 shows just how little code it takes to send the contents of a log file in a plain-text e-mail. Figure 7 shows a sample e-mail.
ConclusionPython is an incredibly powerful programming language that is easily learned and can be used to accomplish and automate both GIS and non-GIS tasks. Its large, worldwide user base is growing rapidly and support is easy to find. In this tutorial, we downloaded a text file from the Web, processed it using modules from Python’s standard library, and created a point feature class from the dataset using ESRI geoprocessing library methods. We also discussed ways to log processing information and send e-mails. What I have shown merely scratches the surface of Python’s capabilities. I have demonstrated some of the powerful yet simple and elegant ways Python can be used to process data, and I hope these examples will serve as building blocks for bigger and better applications. For more information, contactChad Cooper, GIS AnalystIT Data SystemsSouthwestern Energy CompanyE-mail: [email protected]
About the AuthorChad Cooper, who has been working in GIS for five years in technician and analyst positions, has worked with Southwestern Energy Company for the last three years. Cooper holds a bachelor’s degree from Mississippi State University and a master’s degree from the University of Arkansas, both in geology. He realized he could both have fun and earn a living in working with GIS. He has also worked with HTML, PHP, CSS, VBA, and VBScript over the past eight years but in the last two years focused on Python. Cooper lives in Arkansas with his beautiful wife and two handsome, lively young boys.
Figure 6: The code in Listing 11 produces this simple log file.
# open the text file, read it into memoryfile = open(‘c:/testing/a-little-more-involved.txt’).read().splitlines()# define a new, empty list objectl = []# iterate through the lines of the file, slice up the line by index# position of each data columnfor line in file: v0 = line[0:3] v1 = line[3:18].strip() v2 = line[18:19] v3 = line[19:20] v4 = line[20:21] v5 = line[21:26] v6 = line[26:27] v7 = line[27:29] # add the parsed items to list l; as we go through the lines, # we create a nested list l.extend([[v0,v1,v2,v3,v4,v5,v6,v7]])# iterate through list, print out membersfor each in l: print each [‘056’, ‘10616’, ‘1’, ‘6’, ‘1’, ‘00300’, ‘0’, ‘09’][‘014’, ‘10617’, ‘1’, ‘6’, ‘1’, ‘00300’, ‘0’, ‘09’][‘056’, ‘000000000000263’, ‘1’, ‘2’, ‘1’, ‘00071’, ‘0’, ‘03’][‘056’, ‘000000000000264’, ‘1’, ‘2’, ‘1’, ‘00071’, ‘0’, ‘03’][‘020’, ‘000000000000279’, ‘1’, ‘4’, ‘1’, ‘00721’, ‘0’, ‘03’][‘069’, ‘000000000000284’, ‘1’, ‘2’, ‘1’, ‘00070’, ‘0’, ‘03’][‘056’, ‘000000000000286’, ‘1’, ‘2’, ‘1’, ‘00070’, ‘0’, ‘03’][‘088’, ‘000000000000305’, ‘1’, ‘2’, ‘6’, ‘00167’, ‘0’, ‘07’][‘056’, ‘000000000000306’, ‘1’, ‘2’, ‘1’, ‘00167’, ‘0’, ‘07’][‘069’, ‘000000000000307’, ‘1’, ‘2’, ‘1’, ‘00167’, ‘0’, ‘07’]
Listing 6: Parsing a text file by index position
5 ArcUser Online Spring 2008 www.esri.com
Developer’s Corner
# define our functiondef getState( st_code ): “”” Maps a state name to a state code “”” dict = {‘014’:’Alabama’, ‘020’:’Alaska’, ‘049’:’Arizona’, ‘056’:’Arkansas’, ‘069’:’California’, ‘088’:’Colorado’} # test to see if state code exists as a key in dict if st_code in dict.keys(): # if so, then get the value (state name) state = dict[st_code] else: # if not, map code to unknown state = ‘UNKNOWN’ # return the state name return state
# open the text file, read it into memoryfile = open(‘c:/testing/a-little-more-involved.txt’).read().splitlines()# define a new, empty list objectl = []# iterate through the lines of the file, slice up the line by index# position of each data columnfor line in file: # call our function v0 = getState( line[0:3] ) v1 = line[3:18].strip() v2 = line[18:19] v3 = line[19:20] v4 = line[20:21] v5 = line[21:26] v6 = line[26:27] v7 = line[27:29] # add the parsed items to list l; as we go through the lines, # we create a nested list l.extend([[v0,v1,v2,v3,v4,v5,v6,v7]])# iterate through list, print out membersfor each in l: print each
[‘Arkansas’, ‘10616’, ‘1’, ‘6’, ‘1’, ‘00300’, ‘0’, ‘09’][‘Alabama’, ‘10617’, ‘1’, ‘6’, ‘1’, ‘00300’, ‘0’, ‘09’][‘Arkansas’, ‘000000000000263’, ‘1’, ‘2’, ‘1’, ‘00071’, ‘0’, ‘03’][‘Arkansas’, ‘000000000000264’, ‘1’, ‘2’, ‘1’, ‘00071’, ‘0’, ‘03’][‘Alaska’, ‘000000000000279’, ‘1’, ‘4’, ‘1’, ‘00721’, ‘0’, ‘03’][‘California’, ‘000000000000284’, ‘1’, ‘2’, ‘1’, ‘00070’, ‘0’, ‘03’][‘Arkansas’, ‘000000000000286’, ‘1’, ‘2’, ‘1’, ‘00070’, ‘0’, ‘03’][‘Colorado’, ‘000000000000305’, ‘1’, ‘2’, ‘6’, ‘00167’, ‘0’, ‘07’][‘Arkansas’, ‘000000000000306’, ‘1’, ‘2’, ‘1’, ‘00167’, ‘0’, ‘07’][‘California’, ‘000000000000307’, ‘1’, ‘2’, ‘1’, ‘00167’, ‘0’, ‘07’]
Listing 7: Parsing a text file and using a dictionary to decipher coded values
www.esri.com ArcUser Online Spring 2008 6
Developer’s Corner
# open the text file, read it into memoryfile = open(‘c:/testing/lat-lon-date-conversions.txt’).read().splitlines()# define a new, empty list objectl = []# iterate through the lines of the file, slice up the line by index# position of each data columnfor line in file: v1 = line[0:8].strip() # lat dms v2 = v1[0:2] # lat deg v3 = v1[2:4] # lat min v4 = v1[4:6]+’.’+v1[6:8] # lat sec v5 = str(int(v2)+(float(v3)/60)+(float(v4)/3600)) # lat dd v6 = line[8:17].strip() # lon dms v7 = v6[0:3] # lon deg v8 = v6[3:5] # lon min v9 = v6[5:7]+’.’+v6[7:9] # lon sec v10 = str(‘-’+str(int(v7)+(float(v8)/60)+float(v9)/3600)) # lon dd v11 = line[17:21] # date as MMYY v12 = str(v11[0:2])+’/’+str(v11[2:4]) # concatenate date as MM/YY # add our line to list l # do string formatting to lat/long to display only 5 decimal points l.extend([[(‘%.5f’ % float(v5)),(‘%.5f’ % float(v10)),v12]]) # print out each line to stdoutfor each in l: print each [‘36.44000’, ‘-94.03667’, ‘06/94’][‘36.44000’, ‘-94.04833’, ‘06/94’][‘33.09167’, ‘-93.90333’, ‘09/05’][‘33.02667’, ‘-93.89167’, ‘07/05’][‘34.34111’, ‘-93.50056’, ‘05/06’][‘34.24833’, ‘-93.67667’, ‘01/07’][‘34.22500’, ‘-93.89500’, ‘07/06’][‘33.76833’, ‘-92.48500’, ‘07/06’][‘33.74500’, ‘-92.47667’, ‘07/06’][‘33.68000’, ‘-92.46667’, ‘07/06’]
Listing 8: Reformatting data in-line
import arcgisscripting, csv, osgp = arcgisscripting.create()
# Here we have three custom functions we will call later in our code
def killObject( object ): “”” Kills an input object “”” if gp.Exists(object): gp.Delete_management(object)
def makeFgdb( dir, db, fd, spatRef ): “”” Create a file geodatabase and featuredataset “”” if os.path.isdir(dir) != 1: os.mkdir(dir) killObject( os.path.join(dir, db) ) gp.CreateFileGDB_management(dir, db) gp.CreateFeatureDataset_management(os.path.join(dir, db), fd, spatRef) def createGdbTable( db, table, fields ): “”” Creates an empty standalone GDB table and adds fields provided in a list - with a set schema “”” killObject(db + ‘/’ + table) gp.CreateTable(db, table) for field in fields:
Listing 9: Bringing the text data into a file geodatabase
(Listing continues on next page.)
Developer’s Corner
7 ArcUser Online Spring 2008 www.esri.com
if field[1] == ‘TEXT’: gp.AddField_management(db + ‘/’ + table,field[0],field[1],’#’,’#’,field[2],field[3],\ ’NULLABLE’,’NON_REQUIRED’,’#’) else: gp.AddField_management(db + ‘/’ + table,field[0],field[1],’#’,’#’,’#’,field[3],’NULLABLE’,\ ’NON_REQUIRED’,’#’)
# our spatial reference, this can be copied from a prj filesr = ‘GEOGCS[“GCS_North_American_1927”,DATUM[“D_North_American_1927”,\ SPHEROID[“Clarke_1866”,6378206.4,294.9786982]],\ PRIMEM[“Greenwich”,0.0],UNIT[“Degree”,0.0174532925199433]]’# our list of fields and their properties:# [field_name,field_type,field_length (zero for non-text fields),field_alias]fields = [[‘LAT’,’DOUBLE’,’0’,’Latitude’], [‘LON’,’DOUBLE’,’0’,’Longitude’], [‘SOMEDATE’,’TEXT’,’6’,’Some Date’]] # create our new file geodatabase to work withmakeFgdb( ‘C:/Testing’, ‘NBI.gdb’, ‘Bridges’, sr )# create our standalone geodatabase table and its schemacreateGdbTable( ‘C:/Testing/NBI.gdb’, ‘Test’, fields )
# start slurping our text file into gdb table# create a cursor on the tablerows = gp.InsertCursor(‘C:/Testing/NBI.gdb/Test’)# open the text file, read it into memoryfile = open(‘c:/Testing/lat-lon-date-conversions.txt’).read().splitlines()# define a new, empty list objectl = []# iterate through the lines of the file, slice up the line by index# position of each data columnfor line in file: v1 = line[0:8].strip() # lat dms v2 = v1[0:2] # lat deg v3 = v1[2:4] # lat min v4 = v1[4:6]+’.’+v1[6:8] # lat sec v5 = str(int(v2)+(float(v3)/60)+(float(v4)/3600)) # lat dd v6 = line[8:17].strip() # lon dms v7 = v6[0:3] # lon deg v8 = v6[3:5] # lon min v9 = v6[5:7]+’.’+v6[7:9] # lon sec v10 = str(‘-’+str(int(v7)+(float(v8)/60)+float(v9)/3600)) # lon dd v11 = line[17:21] # date as MMYY v12 = str(v11[0:2])+’/’+str(v11[2:4]) # concatenate date as MM/YY # add our line to list l # do string formatting to lat/long to only display 5 decimal points l.extend([[(‘%.5f’ % float(v5)),(‘%.5f’ % float(v10)),v12]])ln = 0# iterate through our datafor line in l: t = 0 # create a new row row = rows.NewRow() # iterate through the fields for field in fields: val = line[t].strip() # set the value for each field if field[1] == ‘DOUBLE’: row.SetValue(field[0], ‘%.5f’ % float(val)) else: row.SetValue(field[0], val) t = t + 1 # insert the row into the table rows.InsertRow(row) ln = ln + 1 del row del t del linedel rows
Listing 9: Bringing the text data into a file geodatabasewww.esri.com ArcUser Online Spring 2008 8
(Listing continued from previous page.)
Developer’s Corner
# import arcgisscripting moduleimport arcgisscripting# instantiate gp objectgp = arcgisscripting.create()
# define our function we call to delete objectsdef killObject( object ): “”” Kills an input object “”” if gp.Exists(object): gp.Delete_management(object)
# make xy event layer from tablegp.MakeXyEventLayer_management(‘C:/Testing/NBI.gdb/Test’, ‘LON’, ‘LAT’, ‘tempXyFc’, ‘’)# set our spatial referencesr = ‘GEOGCS[“GCS_North_American_1927”,DATUM[“D_North_American_1927”,\ SPHEROID[“Clarke_1866”,6378206.4,294.9786982]],\ PRIMEM[“Greenwich”,0.0],UNIT[“Degree”,0.0174532925199433]]’# if the featureclass already exists, lets get rid of it first# actually we have to do this or it will bombkillObject( ‘C:/Testing/NBI.gdb/Bridges/Bridges’ )# copy features from temp layer created via xy event layer to featureclassgp.CopyFeatures_management(‘tempXyFc’, ‘C:/Testing/NBI.gdb/Bridges/Bridges’)
Listing 10: Creating a point featureclass from a standalone geodatabase table
# import time moduleimport time# open our log file; if it doesn’t exist, it gets created# here we set it to append (‘a’) to an existing log file# but we can also set to write over an existing one (‘w’)log = open(‘c:/testing/logtest.log’,’a’)# write out a simple message to the log file - notice how# we escape the apostrophe with a backslashlog.write(‘Here\’s your log file!’)# create datestamp and timestamp based on current local timedatestamp = time.strftime(‘%m/%d/%Y’, time.localtime())timestamp = time.strftime(‘%I:%M:%S %p’, time.localtime())# write date/time stamps to log filelog.write(‘\nThe current date is ‘ + datestamp)log.write(‘\nThe current time is ‘ + timestamp)# close the log filelog.close()
Listing 11: Writing to a log file
Developer’s Corner
9 ArcUser Online Spring 2008 www.esri.com
# import smtplib moduleimport smtplib# open our log file, read it into memoryfile = open(‘c:/testing/logtest.log’).read()# print the file object to stdout just to see what it looks likefile‘Message here\nThe current date is 02/26/2008\nThe current time is 06:07:50 PM’# create a connection to our email server via the IP addressserver = smtplib.SMTP(‘XXX.X.XX.XXX’)# let our message be the contents of the log filemsg = file# send out the emailserver.sendmail(‘[email protected]’,’[email protected]’, msg)# terminate the connection to server and quitserver.quit()
Listing 12: Sending log file contents in a email
# import smtplib moduleimport smtplib# open our log file, read it into memoryfile = open(‘c:/testing/logtest.log’).read()# print the file object to stdout just to see what it looks likefile‘Message here\nThe current date is 02/26/2008\nThe current time is 06:07:50 PM’# create a connection to our email server via the IP addressserver = smtplib.SMTP(‘XXX.X.XX.XXX’)# let our message be the contents of the log filemsg = file# send out the emailserver.sendmail(‘[email protected]’,’[email protected]’, msg)# terminate the connection to server and quitserver.quit()
Listing 12: Sending log file contents in a e-mail
www.esri.com ArcUser Online Spring 2008 10
Developer’s Corner