Embed Size (px)
Citation preview

TARGET DETECTION BY RADAR USING
LINEAR FREQUENCY MODULATION
Thesis submitted in partial fulfillment of the requirements for the degree of
Bachelor of Technology
In
Electronics and Communication Engineering
By
Goutam Acharya (110EI0234)
Swayangsiddha Pandey(110EC0177)
Department of Electronics and Communication Engineering
National Institute of Technology, Rourkela
Rourkela - 769008, Odisha, India
May 2014

TARGET DETECTION BY RADAR USING
LINEAR FREQUENCY MODULATION
Dissertation submitted in
May 2014
To the department of
Electronics and Communication Engineering
Of
National Institute of Technology, Rourkela
In partial fulfillment for the requirements of the degree of
Bachelor of Technology
By
Goutam Acharya (110EI0234)
Swayangsiddha Pandey (110EC0177)
Under the supervision of
Prof. Ajit Kumar Sahoo
Department of Electronics and Communication Engineering
National Institute of Technology, Rourkela
Rourkela - 769008, Odisha, India
May 2014

Department of Electronics and Communication Engineering
National Institute of Technology, Rourkela
Rourkela-769008, Odisha, India
CERTIFICATE
This is to certify that the work on the thesis entitled Target Detection by Radar using Linear
Frequency Modulation by Goutam Acharya and Swayangsiddha Pandey is a record of original
research work carried out under my supervision and guidance for the partial fulfillment of the
requirements for the degree of Bachelor in Technology in the department of Electronics and
Communication Engineering, National Institute of Technology, Rourkela.
Place: NIT Rourkela Prof. Ajit Kumar Sahoo
Date: May, 2014 Professor, ECE Department
NIT, Rourkela, Odisha
ACKNOWLEDGEMENT
First and foremost, I would like to express my sincerest of gratitude towards my project supervisor
and guide Prof. Ajit Kumar Sahoo for his advice during my project work. He has perennially
encouraged me to stay focused on achieving my goal. His observations and insights helped me to
establish the overall direction of the research and to move forward with investigation in depth. He
has helped me greatly and been a source of knowledge.
I would like to extend my thanks to our HOD, Prof. Sukhdev Meher and to all the professors of
the department for their support.
I would like to thank administrative and technical staff members of the Department who have been
kind enough to advise and help me in their respective roles.
Last, but not the least, I would like to acknowledge the love, support and motivation I received
from my parents and therefore I dedicate this thesis to my family.
Goutam Acharya (110EI0234)
Swayangsiddha Pandey (110EC0177)

ABSTRACT
Range Detection is the maximum distance across which a target can detect a target. Range
Resolution is the ability of the Radar to distinguish between two closely spaced targets. Range
Resolution can be enhanced by using short duration pulses. But using short duration pulses results
in less Range Detection. To overcome these shortcomings pulse compression techniques are used.
We use a Linear Frequency Modulated (LFM) Wave for pulse compression purposes as it gives a
wide operating bandwidth. It involves two types of correlation processes: matched filter processing
and stretch processing. Matched Filter is used for narrow band and Stretch Processor is used for
wide-band signals. In this thesis we have analyzed both these processes and the effects of Time-
Bandwidth Product, change in Doppler Frequency and effect of different kinds of windows on the
LFM wave. Also masking effect is observed on the echo of a distant target due to the echo of a
nearby target. The various methods to remove the masking effect are inspected.

CONTENTS
CERTIFICATE
ACKNOWLEDGEMENT
ABSTRACT
1. INTRODUCTION 1
1.1 BASIC RADAR 2
1.2 RANGE OF A TARGET 3
1.3 RADAR DESIGN 4
1.3.1 RANGE RESOLUTION 4
1.3.2 RANGE DETECTION 4
1.3.3 DESIGNING THE TRANSMITTER 4
1.4 OBJECTIVE OF THE THESIS 5
1.5 ORGANIZATION OF THE THESIS 5
1.6 CONCLUSION 5
2. PULSE COMPRESSION 6
2.1 PULSE COMPRESSION INTRODUCTION 7
2.2 LINEAR FREQUENCY MODULATION 8
2.3 MATCHED FILTER 10
2.3.1 MATCHED FILTER BASICS 10
2.4 AMBIGUITY FUNCTION 12
2.4.1 MATCHED FILTER RESPONSE FOR NARROW BAND-PASS SIGNAL 12
2.4.2 MATCHED FILTER FOR DOPPLER SHIFTED SIGNALS 12
2.5 WINDOW FUNCTIONS 15
2.5.1 RECTANGULAR WINDOW 15
2.5.2 HANNING WINDOW 15
2.5.3 HAMMING WINDOW 15
2.5.4 KAISER WINDOW 16
2.5.5 BLACKMANHARRIS WINDOW 16
2.6 DETECTION OF TARGET 21
2.7 DOPPLER EFFECT ON LFM SIGNALS 22
2.8 CONCLUSION 27

3. STRETCH PROCESSING 28
3.1 INTRODUCTION 29
3.2 STRETCH PROCESSOR CONFIGURATION 30
3.3 CONCLUSION 32
4. MASKING EFFECT 33
4.1 MASKING EFFECT INTRODUCTION 34
4.2 METHODS TO REMOVE MASKING EFFECT 34
4.3 MASKING EFFECT REMOVAL USING RANGE DOPPLER FUNCTION 35
4.4 MASKING EFFECT REMOVAL USING STRETCH PROCESSING 35
4.4.1 LINEAR INTERPOLATION METHOD 35
4.4.2 POLY-PHASE METHOD 36
4.4.3 SPECTRUM BASED METHOD 36
4.5 CONCLUSION 39
5. CONCLUSION AND FUTURE WORK 40
5.1 CONCLUSION 41
5.2 FUTURE WORK 41
6. REFERENCES 42

LIST OF FIGURES
Fig 1.1- Basic Principle of Radar 2
Fig 1.2- A Radar Pulse 3
Fig 1.3- Transmitter and Receiver Signals 4
Fig 2.1- Block diagram of a radar antenna 6
Fig 2.2- Increasing Frequency(Upchirp) 7
Fig 2.3- Decreasing Frequency(Downchirp) 7
Fig 2.4- Relationship between frequency and Time in LFM wave 8
Fig 2.5- Unmodulated Pulse matched filter response 8
Fig 2.6- Frequency modulated pulse matched filter pulse 8
Fig 2.7- Matched Filter response 9
Fig 2.8- Real Part of LFM waveform 12
Fig 2.9- Imaginary Part of LFM waveform 12
Fig 2.10- Frequency Spectrum of LFM waveform 13
Fig 2.11- LFM signal of TBP 50 through a Hanning window 16
Fig 2.12- LFM signal of TBP 500 through a Hanning window 16
Fig 2.13- LFM signal of TBP 50 through a Hamming window 17
Fig 2.14- LFM signal of TBP 500 through a Hamming window 17
Fig 2.15- LFM signal of TBP 50 through a Kaiser window 18
Fig 2.16- LFM signal of TBP 500 through a Kaiser window 18

Fig 2.17- LFM signal of TBP 50 through a Blackmanharris window 19
Fig 2.18- LFM signal of TBP 500 through a Blackmanharris window 19
Fig 2.19- Detection of 3 targets using a LFM wave 20
Fig 2.20- Detection of 3 targets using a LFM wave passed through a Kaiser window 21
Fig 2.21- Detection of 3 targets using a LFM wave passed through a Hamming window 21
Fig 2.22- LFM signal having fd/B=0.1 passed through a Hanning window 22
Fig 2.23- LFM signal having fd/B=0.2 passed through a Hanning window 22
Fig 2.24- LFM signal having fd/B=0.1 passed through a Hamming window 23
Fig 2.25- LFM signal having fd/B=0.2 passed through a Hamming window 23
Fig 2.26- LFM signal having fd/B=0.1 passed through a Kaiser window 24
Fig 2.27- LFM signal having fd/B=0.2 passed through a Kaiser window 24
Fig 2.28- LFM signal having fd/B=0.1 passed through a Rectangular window 25
Fig 2.29- LFM signal having fd/B=0.2 passed through a Rectangular window 25
Fig 3.1- Block Diagram for a Stretch Processor 28
Fig 3.2- Uncompressed Echo of Stretch Processing for 3 targets 31
Fig 3.3- Detection of targets 31
Fig 4.1- Masked output using only matched filter 37
Fig 4.2- Unmasked output using only matched filter 37
Fig 4.3- Masked output using matched filter and stretch processing 38
Fig 4.4- Unmasked output using matched filter and stretch processing 38
LIST OF TABLES
Table 2.1- PSR values with respect to TBP for different windows 21
Table 2.2- PSR values for various fd/B values for different windows 27
Table 3.1- Simulation Parameters for Stretch Processing 30
Table 4.1- Simulation Parameters for Masking Effect 36

1 CHAPTER 1: INTRODUCTION
TARGET DETECTION BY RADAR USING LINEAR FREQUENCY MODULATION |
CHAPTER 1
INTRODUCTION

2 CHAPTER 1: INTRODUCTION
TARGET DETECTION BY RADAR USING LINEAR FREQUENCY MODULATION |
1.1 BASIC RADAR
Radar is an acronym for RAdio Detection and Ranging. It is an electromagnetic system used for
detecting and locating objects by transmitting the signals and receiving the transmitted signals
from the objects within its range. The echoes received are used to extract information about the
target such as range, angular position, velocity and other characteristics. The reflected energy that
is returned to the radar not only indicates the presence of a target, but by comparing the received
echo signal with the transmitted signal, various information can be extracted regarding the target[4].
The basic principle of radar is shown is Figure 1.1. A transmitter generates a signal (a short pulse
or sine wave) that is radiated into the space through a antenna. A part of the transmitted signal is
intercepted by the target object and is reflected back in many directions. The reflected signal is
collected by the antenna of the radar which inputs it to a receiver. Processing occurs to detect the
presence of the target and to determine its location. A single antenna is generally used on a time-
shared basis for both transmitting and receiving where the radar signal is a continuous series of
pulses. Range can be measured by calculating the time the signal takes to travel to the target and
return back.
Fig 1.1- Basic Principle of Radar

3 CHAPTER 1: INTRODUCTION
TARGET DETECTION BY RADAR USING LINEAR FREQUENCY MODULATION |
1.2 RANGE OF A TARGET The range to a target is determined by the time it takes for a radar signal to travel to the target and
back. Suppose TR is the time taken by the signal to travel to a target situated at a distance R and
back. Thus the total time taken is given by
TR=2R/c
Where c is the speed of light, c=3 x 10⁸ m/s.
Thus the range to the target is
R=cTR/2
1.2.1 Maximum Unambiguous Range
Once a signal is radiated into space sufficient time has to elapse to allow all echo signals to return
before the next pulse is transmitted. If the time between signals is too short, an echo signal from a
long range object may arrive after the transmission of the next pulse. Such an echo may be
misleading. Maximum unambiguous range is given by
Run=cTp/2
Where Tp is the pulse repetition period
Fig 1.2-A Radar Pulse
Two important factors must be taken into consideration before designing a Radar
1. Range Resolution
2. Range Detection

4 CHAPTER 1: INTRODUCTION
TARGET DETECTION BY RADAR USING LINEAR FREQUENCY MODULATION |
1.3 RADAR DESIGN
1.3.1 Range Resolution
It is the ability of the Radar to detect and distinguish between two closely spaced targets. Range
resolution depends on the pulse width of the transmitted pulse. The range resolution is given by
Rres=𝑐
2𝐵
Where B is the bandwidth of the transmitted pulse
Hence smaller the bandwidth of the transmitted pulse the greater is the range resolution.
1.3.2 Range Detection
It is the ability of the RADAR to detect objects within a long range. The greater the distance of the
object the RADAR can detect the better the Range Detection. The maximum range detection
depends on the strength of the received echo. The radiated pulse should have a high energy to
receive a high strength echo.
1.3.3 Designing the transmitter
A very short pulse requires high peak power to get the adequate energy for large distance
transmission. However to handle a high peak power pulse the radar equipment becomes heavier
and sparking occurs in the antenna instruments. A pulse having a low peak power and a longer
duration has to be used at the transmitter for a good range detection. At the receiver end, the echo
should have a short width and high peak power for a better range resolution[4].
Fig 1.3-Transmitter and Receiver Signals
Hence pulse compression is carried out.

5 CHAPTER 1: INTRODUCTION
TARGET DETECTION BY RADAR USING LINEAR FREQUENCY MODULATION |
1.4 OBJECTIVE OF THE THESIS
Pulse compression through various correlation operators and their response to wide-band
and narrow-band signals
Analyzing the LFM signal considering the time bandwidth product, Doppler Effect and effect
of windows.
Masking effect removal using matched filter and stretch processor.
1.5 ORGANIZATION OF THESIS Chapter 2- this chapter analyses the pulse compression through linear frequency modulation
in depth. It examines the matched filter response on a LFM wave, effect of windows, and
effect of Doppler shift on LFM waves.
Chapter 3-this chapter discusses the stretch processing technique in pulse compression.
Stretch processing is mainly used in case of wide-band signal.
Chapter 4- this chapter tell us about the masking effect and the various methods to remove it.
It discusses the stretch processing technique for masking effect removal
Chapter 5- It concludes the thesis and tells us about the future work on the topic
1.5 CONCLUSION
The introduction to Radar is given. The equations for range and the maximum unambiguous range
is given. The various factors to be considered while designing an antenna is mentioned and the
type of pulse required for each case is discussed. After considering all the factors the need for pulse
compression is shown. The objective of the thesis is also discussed.

6 CHAPTER 2: PULSE COMPRESSION
TARGET DETECTION BY RADAR USING LINEAR FREQUENCY MODULATION |
Chapter 2
Pulse Compression

7 CHAPTER 2: PULSE COMPRESSION
TARGET DETECTION BY RADAR USING LINEAR FREQUENCY MODULATION |
2.1 PULSE COMPRESSION INTRODUCTION
Pulse Compression technique is continuously used in Radars and Sonars and echography to
increase the range resolution, range detection as well as increase the signal-to-noise ratio
(SNR). This is achieved by modulating the transmitted pulse and then correlating the received
pulse with the transmitted signal[1].
Fig 2.1-Block diagram of a radar antenna
Several methods of pulse compression of pulse compression have been used in the past. The most
common and popular among them is the Linear Frequency Modulation (LFM) which was invented
by R.H Dickie in 1945. The other popular pulse compression techniques include Costas codes,
Binary-phase codes, poly-phase codes and non-linear frequency modulation.
8 CHAPTER 2: PULSE COMPRESSION
TARGET DETECTION BY RADAR USING LINEAR FREQUENCY MODULATION |
2.2 LINEAR FREQUENCY MODULATION
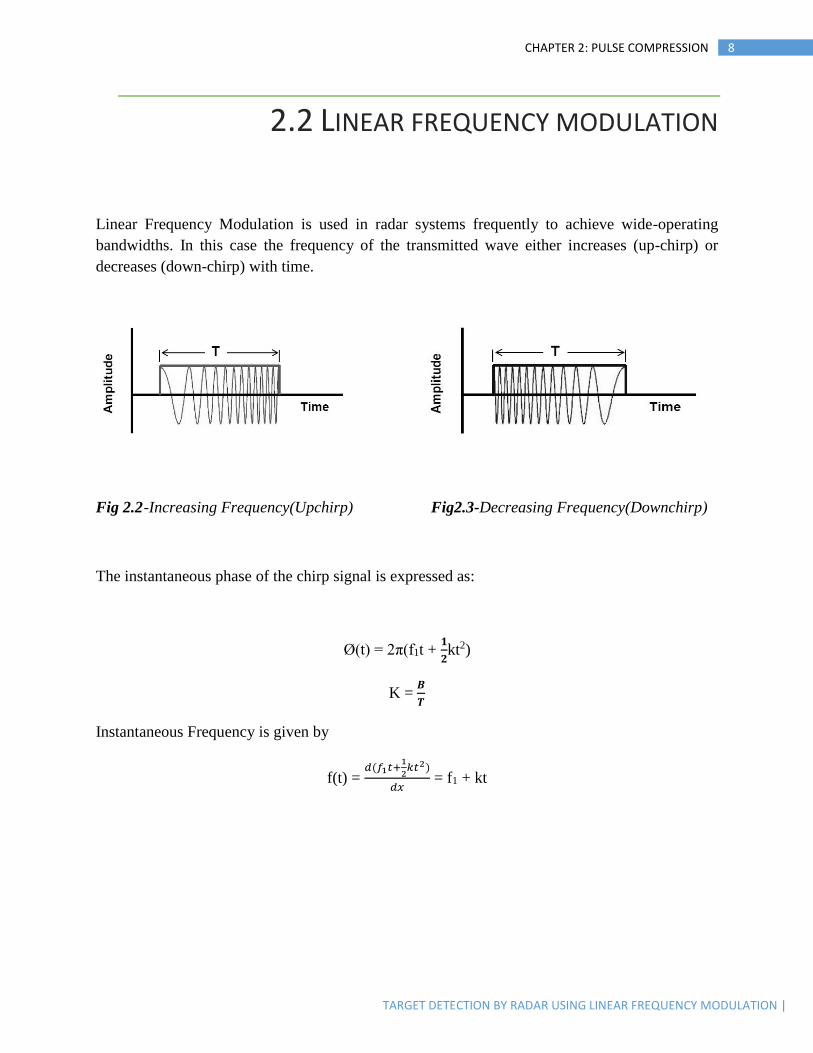
Linear Frequency Modulation is used in radar systems frequently to achieve wide-operating
bandwidths. In this case the frequency of the transmitted wave either increases (up-chirp) or
decreases (down-chirp) with time.
Fig 2.2 -Increasing Frequency(Upchirp) Fig2.3-Decreasing Frequency(Downchirp)
The instantaneous phase of the chirp signal is expressed as:
Ø(t) = 2π(f1t + 𝟏
𝟐kt2)
K = 𝑩
𝑻
Instantaneous Frequency is given by
f(t) = 𝑑(𝑓1𝑡+
1
2𝑘𝑡2)
𝑑𝑥 = f1 + kt

9 CHAPTER 2: PULSE COMPRESSION
TARGET DETECTION BY RADAR USING LINEAR FREQUENCY MODULATION |
Fig 2.4-Relationship between frequency and Time in LFM wave
Frequency increases linearly with time and hence is called as Linear Frequency Modulation. The
response of an unmodulated pulse and an LFM pulse are shown below
Fig 2.5-Unmodulated Pulse matched filter response
Fig 2.6-Frequency modulated pulse matched filter pulse
10 CHAPTER 2: PULSE COMPRESSION
TARGET DETECTION BY RADAR USING LINEAR FREQUENCY MODULATION |
2.3 MATCHED FILTER
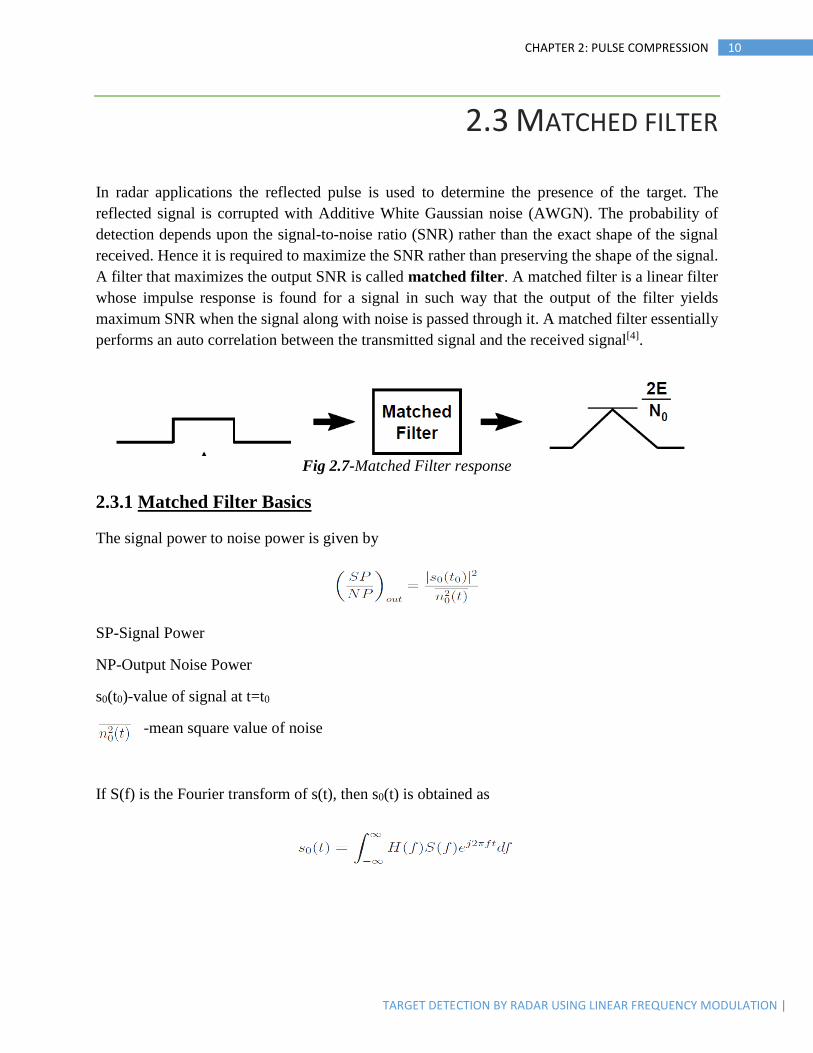
In radar applications the reflected pulse is used to determine the presence of the target. The
reflected signal is corrupted with Additive White Gaussian noise (AWGN). The probability of
detection depends upon the signal-to-noise ratio (SNR) rather than the exact shape of the signal
received. Hence it is required to maximize the SNR rather than preserving the shape of the signal.
A filter that maximizes the output SNR is called matched filter. A matched filter is a linear filter
whose impulse response is found for a signal in such way that the output of the filter yields
maximum SNR when the signal along with noise is passed through it. A matched filter essentially
performs an auto correlation between the transmitted signal and the received signal[4].
Fig 2.7-Matched Filter response
2.3.1 Matched Filter Basics
The signal power to noise power is given by
SP-Signal Power
NP-Output Noise Power
s0(t0)-value of signal at t=t0
-mean square value of noise
If S(f) is the Fourier transform of s(t), then s0(t) is obtained as

11 CHAPTER 2: PULSE COMPRESSION
TARGET DETECTION BY RADAR USING LINEAR FREQUENCY MODULATION |
The value of s0(t) at t=t0 is
Substituting we get
Using Schwarz inequality, the numerator can be written as
the equality holds good when
where K1 is an arbitrary constant and ∗ stands for complex conjugate. Using the equality sign which
corresponds to maximum SNR output we get
It is obvious that the maximum SNR is a function of the energy of the signal but not the shape.
Taking inverse Fourier transform of the impulse response of matched filter is obtained as
Taking Convolution the equation for s0(t) is obtained as the auto-correlation of the sent signal
Thus it is observed that the matched filter essentially performs the auto-correlation between the
transmitted signal and the received signal.

12 CHAPTER 2: PULSE COMPRESSION
TARGET DETECTION BY RADAR USING LINEAR FREQUENCY MODULATION |
2.4 AMBIGUITY FUNCTION
2.4.1 Matched Filter Response of Narrow band-pass signals
The output of the matched filter is obtained as
It is observed that the matched filter output of narrow band-pass signal has a complex envelope
u0(t) which is obtained by passing the complex envelope u(t) through its own matched filter.
2.4.2 Matched filter response of a Doppler shifted signal
The output is obtained as
This is the Ambiguity Function (AF)
The Ambiguity Function describes the output of the matched filter when the input signal is delayed
by 𝜏 and Doppler shifted by fd relative to the values for which the matched filter is designed.
13 CHAPTER 2: PULSE COMPRESSION
TARGET DETECTION BY RADAR USING LINEAR FREQUENCY MODULATION |
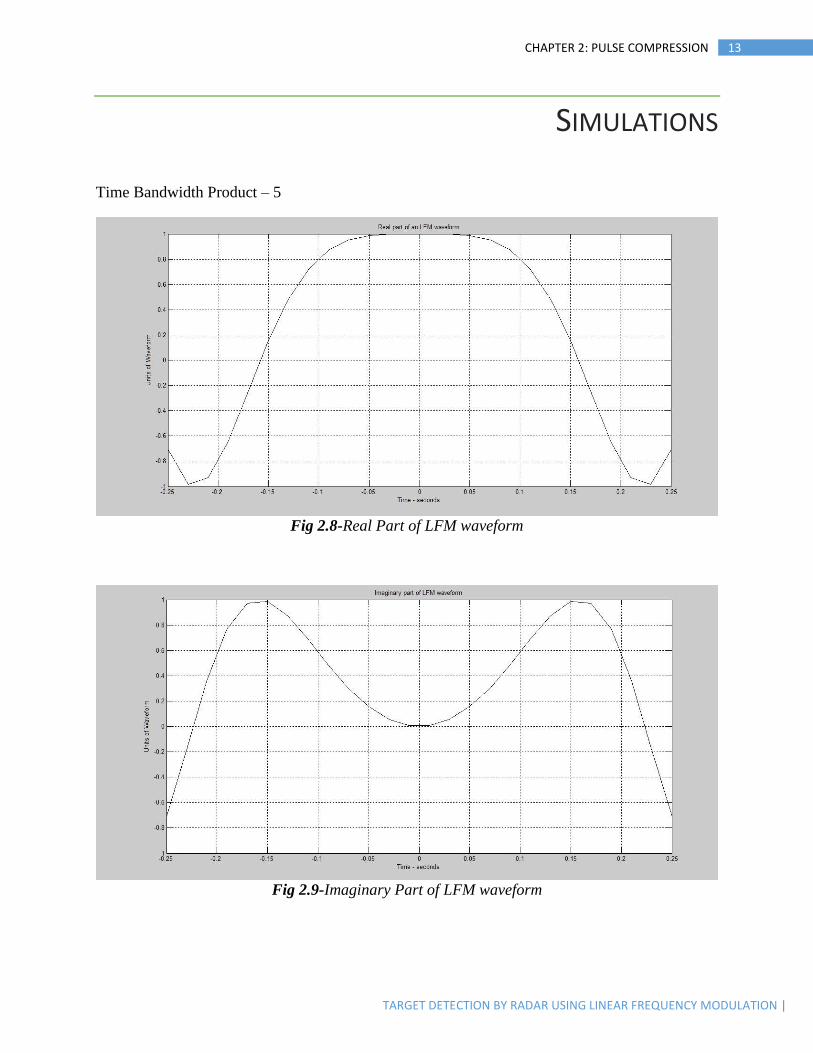
SIMULATIONS
Time Bandwidth Product – 5
Fig 2.8-Real Part of LFM waveform
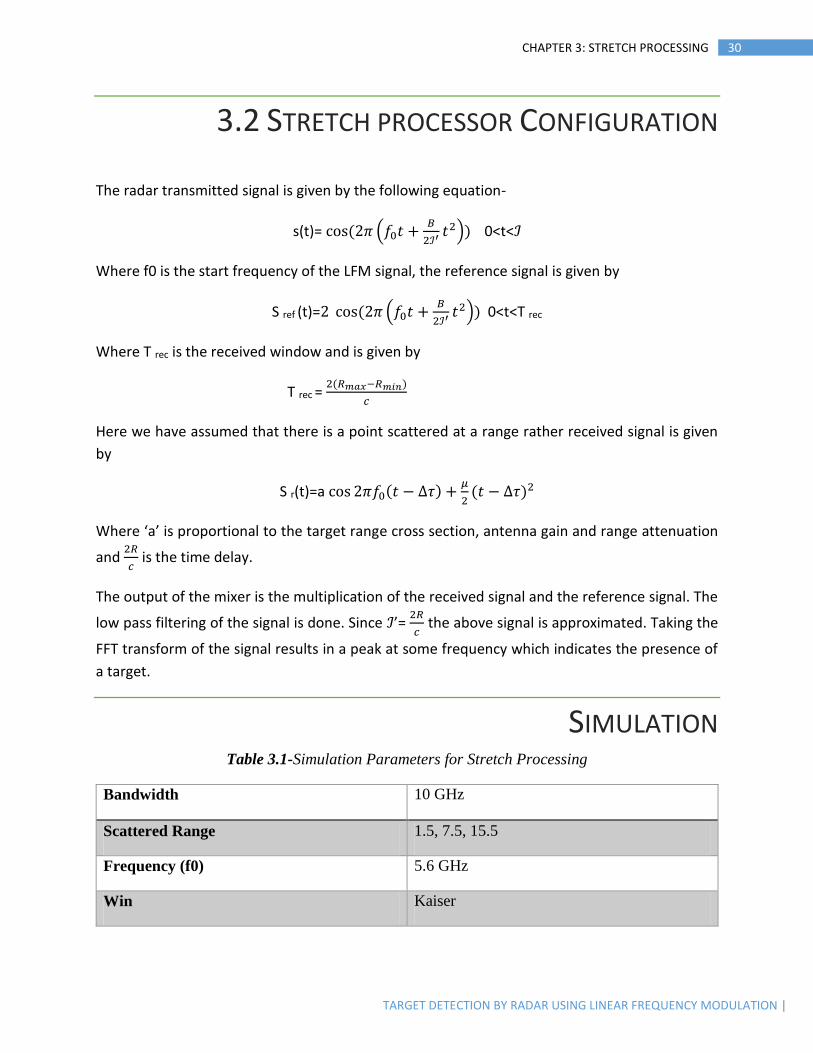
Fig 2.9-Imaginary Part of LFM waveform

14 CHAPTER 2: PULSE COMPRESSION
TARGET DETECTION BY RADAR USING LINEAR FREQUENCY MODULATION |
Fig 2.10-Frequency Spectrum of LFM waveform

15 CHAPTER 2: PULSE COMPRESSION
TARGET DETECTION BY RADAR USING LINEAR FREQUENCY MODULATION |
2.5 WINDOW FUNCTIONS
Windows are expressions which have a specific value within a given range and have a value of
zero outside the range. One example is a rectangular window which has a constant value inside
the interval and have a zero value outside. When the window function is multiplied with the given
signal they only give a value where they overlap and give zero outside.
The LFM wave was introduced in the following 5 windows
2.5.1 Rectangular Window
The rectangular window has a constant value over its length.
w(n)=1.0 for n=0, 1, 2, ….. , N-1
where N is the length of the window and w is the window value.
It just limits the signal to a given finite range.
2.5.2 Hanning Window
The hanning window looks like the half cycle of a cosine wave. It is given by the equation.
w(n)=0.5-0.5cos2𝜋𝑛
𝑁
For n=0,1,2, … , N-1
where N is the window length and w is the window value.
2.5.3 Hamming Window
The Hamming window is similar to a Hanning window. The equation is given by
w(n)=0.54-0.4cos2𝜋𝑛
𝑁
For n=0,1,2,….,N-1

16 CHAPTER 2: PULSE COMPRESSION
TARGET DETECTION BY RADAR USING LINEAR FREQUENCY MODULATION |
2.5.4 Kaiser Window
The Kaiser window is a more flexible smoothing window whose shape can be changed using the
parameter β. w=Kaiser(L, beta) returns a L-point Kaiser window in the column vector w. β
parameter affects the side-lobe attenuation of the Fourier transform window.
2.5.5 Blackmanharris Window
The BlackmanHarris does window sampling using a ‘sflag’. This can either be periodic or
symmetric. The periodic flag is generally used for Fourier transform so that spectral analysis can
be done. The equation is given by
w(n)=a0-a1cos2𝜋𝑛
𝑁 + a2cos
2𝜋2𝑛
𝑁 – a3cos
2𝜋3𝑛
𝑁
where –N/2<n<N/2 and window length is given by L=N+1.
Peak Side-lobe Ratio (PSR)
It is given by
PSR = 10 log10𝑃𝑒𝑎𝑘 𝐿𝑜𝑏𝑒 𝑃𝑜𝑤𝑒𝑟
𝑆𝑖𝑑𝑒 𝐿𝑜𝑏𝑒 𝑃𝑜𝑤𝑒𝑟
Simulation Results
The LFM signal with a time-bandwidth product of 50 and 500 was taken and passed through the
above 4 windows and the simulation was viewed using MATLAB.

17 CHAPTER 2: PULSE COMPRESSION
TARGET DETECTION BY RADAR USING LINEAR FREQUENCY MODULATION |
SIMULATIONS
Fig 2.11-LFM signal of TBP 50 through a Hanning window
Fig 2.12- LFM signal of TBP 500 through a Hanning window

18 CHAPTER 2: PULSE COMPRESSION
TARGET DETECTION BY RADAR USING LINEAR FREQUENCY MODULATION |
Fig 2.13- LFM signal of TBP 50 through a Hamming window
Fig 2.14- LFM signal of TBP 500 through a Hamming window

19 CHAPTER 2: PULSE COMPRESSION
TARGET DETECTION BY RADAR USING LINEAR FREQUENCY MODULATION |
Fig 2.15- LFM signal of TBP 50 through a Kaiser window
Fig 2.16- LFM signal of TBP 500 through a Kaiser window

20 CHAPTER 2: PULSE COMPRESSION
TARGET DETECTION BY RADAR USING LINEAR FREQUENCY MODULATION |
Fig 2.17- LFM signal of TBP 50 through a Blackmanharris window
Fig 2.18- LFM signal of TBP 500 through a Blackmanharris window

21 CHAPTER 2: PULSE COMPRESSION
TARGET DETECTION BY RADAR USING LINEAR FREQUENCY MODULATION |
Table 2.1: PSR values with respect to TBP for different windows
WINDOW TYPE PSR WITH TBP 50 PSR WITH TBP 500
Hanning -46 -46.5
Hamming -50 -50.5
Kaiser -33 -34
Blackmanharris -118 -130
Inferences
We can observe that the Blackmanharris window gives the best PSR and hence is best
suited for ide-lobe reduction and rectangular window has the worst PSR value and is
unsuitable for side-lobe reduction.
TBP values least affects the side-lobe reduction while using windows. In higher order
cosine windows like the Blackmanharris window the effect of TBP on PSR value is large.
The value of β used in a Kaiser window gives the relation between side-lobe level and the
main lobe width. Higher values of β gives better side-lobe reduction but also result in
widening of the main lobe. Widening of the main lobe leads to reduction in range
resolution.
2.6 DETECTION OF TARGET Simulation Results
The LFM signal was used to detect three targets and the received echo was allowed to pass through
3 windows.
Fig 2.19- Detection of 3 targets using a LFM wave

22 CHAPTER 2: PULSE COMPRESSION
TARGET DETECTION BY RADAR USING LINEAR FREQUENCY MODULATION |
Fig 2.20-Detection of 3 targets using a LFM wave passed through a Kaiser window
Fig 2.21- Detection of 3 targets using a LFM wave passed through a Hamming window
2.7 DOPPLER EFFECT ON LFM SIGNALS The Doppler Effect is observed in signals when there is a moving target. Radars use the Doppler
frequency shift to extract information about the velocity of the target. The Doppler frequency is
given by fd in the ambiguity function of the matched filter
ℵ(𝜏, fd)=∫ 𝑢(𝑡). 𝑢 ∗ (𝑡 − 𝜏)∞
−∞𝑒𝑖2𝑓𝜋𝑓𝑑𝑡 ⅆ𝑡
The Doppler Effect is checked by passing the signal through the windows and studying the change
in PSR. The LFM signal was passed through the four windows with varying Doppler frequency
and the results were studied.

23 CHAPTER 2: PULSE COMPRESSION
TARGET DETECTION BY RADAR USING LINEAR FREQUENCY MODULATION |
SIMULATIONS
Fig 2.22-LFM signal having fd/B=0.1 passed through a Hanning window
Fig 2.23- LFM signal having fd/B=0.2 passed through a Hanning window

24 CHAPTER 2: PULSE COMPRESSION
TARGET DETECTION BY RADAR USING LINEAR FREQUENCY MODULATION |
Fig 2.24- LFM signal having fd/B=0.1 passed through a Hamming window
Fig 2.25- LFM signal having fd/B=0.2 passed through a Hamming window

25 CHAPTER 2: PULSE COMPRESSION
TARGET DETECTION BY RADAR USING LINEAR FREQUENCY MODULATION |
Fig 2.26- LFM signal having fd/B=0.1 passed through a Kaiser window
Fig 2.27- LFM signal having fd/B=0.2 passed through a Kaiser window

26 CHAPTER 2: PULSE COMPRESSION
TARGET DETECTION BY RADAR USING LINEAR FREQUENCY MODULATION |
Fig 2.28- LFM signal having fd/B=0.1 passed through a Rectangular window
Fig 2.29- LFM signal having fd/B=0.2 passed through a Rectangular window

27 CHAPTER 2: PULSE COMPRESSION
TARGET DETECTION BY RADAR USING LINEAR FREQUENCY MODULATION |
Table 2.2-PSR values for various fd/B values for different windows
Inferences
PSR value decreased with increase in the Doppler Effect when passed through the windows
(Kaiser, Hanning, Hamming and Rectangular).
We see that the rectangular window gives the worst value of PSR and hence is unsuitable
for use while the Hamming window gives the best PSR value and can be used for detection
of the target velocity through the Doppler Effect.
2.8 CONCLUSION
Linear Frequency Modulation is used for Radar Pulse Compression Techniques because it
provides a wide operating bandwidth. It is one of the popular used methods for pulse compression.
The design of matched filter was reviewed and it was found that performing the auto-correlation
between the transmitted signal and the received signal gives the maximum SNR. To obtain side-
lobe reduction windowing techniques was used. The LFM signal was passed through 5 windows
and the relationship between PSR and TBP product was observed. We found that the PSR value
increased with increase in TBP. We also observed that the Blackmanharris window provided the
best PSR value and thus is the best suited window for side-lobe reduction. Besides the Doppler
Effect on the PSR value was also studied.
Window Type PSR (fd/B=0.1) PSR (fd/B=0.2)
Hanning -31 -30
Hamming -38 -32
Kaiser -24 -20
Rectangular -15 -12

28 CHAPTER 3: STRETCH PROCESSING
TARGET DETECTION BY RADAR USING LINEAR FREQUENCY MODULATION |
CHAPTER 3
STRETCH PROCESSING

29 CHAPTER 3: STRETCH PROCESSING
TARGET DETECTION BY RADAR USING LINEAR FREQUENCY MODULATION |
3.1 INTRODUCTION
Stretch processing or “active correlation” provides high range resolution in pulse compression.
Normally it is used for LFM waveforms having high bandwidth. Stretch Processing is used to
process large bandwidth signals using narrowband techniques. Stretch processing has simple
requirements like a analog to digital converter a and a FFT processor. During processing, first we
have to mix the received signal with the replica of transmitted signal. After this we give the output
to the ADC converter. Finally narrowband filters are used.
When we have targets at a close range, then the output of LPF have constant tones corresponding
to the respective target’s position. It converts time delay into frequency. This is because mixing
the received signal with reference signal and then performing low pass filtering is same as
subtracting received frequency chirp from replica.
The Block Diagram for Stretch Processor is given
Fig 3.1-Block Diagram for a Stretch Processor
The main parts in the block diagram are a mixer, a spectrum analyzer, a LFM generator and a
timing circuit
30 CHAPTER 3: STRETCH PROCESSING
TARGET DETECTION BY RADAR USING LINEAR FREQUENCY MODULATION |
3.2 STRETCH PROCESSOR CONFIGURATION
The radar transmitted signal is given by the following equation-
s(t)= cos(2𝜋 (𝑓0𝑡 +𝐵
2ℐ′ 𝑡2)) 0<t<ℐ
Where f0 is the start frequency of the LFM signal, the reference signal is given by
S ref (t)=2 cos(2𝜋 (𝑓0𝑡 +𝐵
2ℐ′ 𝑡2)) 0<t<T rec
Where T rec is the received window and is given by
T rec = 2(𝑅𝑚𝑎𝑥−𝑅𝑚𝑖𝑛)
𝑐
Here we have assumed that there is a point scattered at a range rather received signal is given
by
S r(t)=a cos 2𝜋𝑓0(𝑡 − ∆𝜏) +𝜇
2(𝑡 − ∆𝜏)2
Where ‘a’ is proportional to the target range cross section, antenna gain and range attenuation
and 2𝑅
𝑐 is the time delay.
The output of the mixer is the multiplication of the received signal and the reference signal. The
low pass filtering of the signal is done. Since ℐ’= 2𝑅
𝑐 the above signal is approximated. Taking the
FFT transform of the signal results in a peak at some frequency which indicates the presence of
a target.
SIMULATION Table 3.1-Simulation Parameters for Stretch Processing
Bandwidth 10 GHz
Scattered Range 1.5, 7.5, 15.5
Frequency (f0) 5.6 GHz
Win Kaiser

31 CHAPTER 3: STRETCH PROCESSING
TARGET DETECTION BY RADAR USING LINEAR FREQUENCY MODULATION |
Fig 3.2-Uncompressed Echo of Stretch Processing for 3 targets
Fig 3.3-Detection of targets

32 CHAPTER 3: STRETCH PROCESSING
TARGET DETECTION BY RADAR USING LINEAR FREQUENCY MODULATION |
3.3 CONCLUSION
A stretch processing helps the signal processor to get rid of its bandwidth problem by rejecting all-
range processing to obtain a narrow-band processor. In case of a matched filter we search for
targets over the entire pulse repetition interval (PRI). However in stretch processing we are
confined to a range extent that is smaller than the uncompressed pulse duration. We can’t use
stretch processing for search applications because it requires looking for targets spread over a large
range. We could however use stretch processing for track purposes where we already know the
location of the target but want to obtain a more accurate measurement for it.

33 CHAPTER 4: MASKING EFFECT
TARGET DETECTION BY RADAR USING LINEAR FREQUENCY MODULATION |
CHAPTER 4
MASKING EFFECT

34 CHAPTER 4: MASKING EFFECT
TARGET DETECTION BY RADAR USING LINEAR FREQUENCY MODULATION |
4.1 MASKING EFFECT INTRODUCTION
When noise is present in radar signal processing we have to perform correlation between
transmitted and received signals. The received signals collected from the nearby targets usually
generate very high side lobes in the above correlation function. The signals received from long
distance targets are weak. The weaker echoes are masked by the strong echoes of nearby targets.
This effect is known as Masking Effect.
Masking effect can be minimized or removed by different methods. Doppler shift is one of the old
methods for removing masking effect. However it doesn’t remove all strong echoes completely.
We can use method based on signal stretch processing, which gives an improved result than the
previous described methods. We can detect weak targets in the presence of the strong echoes.
In practical situation, in addition to other targets the weather clutter echoes and ground clutter
echoes are also present at receiver signal. In pulse radar the noise reflected echoes are separated in
time. When these are characterized in integration time the clutter and target echoes overlap causing
interference known as masking effect.
For single target detection we use matched filter which is tuned to range and velocity of the target.
So in case of multiple targets it can’t be possible. When the matched filter is tuned to the nearby
target echo from far target is considered as noise, so it becomes difficult to track it. If we tune the
matched filter with far target the strong echoes increases the noise level.
4.2 METHODS TO REMOVE MASKING EFFECT
Removal of ground clutter and weather cutter from the received signal .we can use adaptive
lattice filter for this purpose.
Elimination of nonzero Doppler clutter. For this we can produce a model of the target
echoes having non-zero Doppler frequency and subtract from received signal.
We can have target echo modelling by considering the time shift and Doppler shift of
transmitted signal. This method is used for comparatively slow moving targets.

35 CHAPTER 4: MASKING EFFECT
TARGET DETECTION BY RADAR USING LINEAR FREQUENCY MODULATION |
4.3 MASKING EFFECT REMOVAL USING RANGE
DOPPLER FUNCTION
Initially we have to calculate the range Doppler cross-correlation function. Then in second step we
have to find maximum of the Doppler cross-correlation function and thus locate the strongest
echoes. The coordinates of maximum help in estimation of the target velocity and range and
modelling of strong target echo. We have to subtract the modelled signal from the received signal.
This resulting signal consists of all noise signal and weak echoes which have to be processed
further using adaptive echo cancellation till all the noise floor is delivered and echoes are removed.
All the calculations are done in time domain. For better quality of cancellation there should be
better resampling of reference signal.
In the third stage cancellation of strong echoes are covered in frequency domain. Here we subtract
the product of estimated complex amplitude and normalized strong echo from the received signal.
For this purpose we sort the strong echoes accordingly from strongest to weakest.
In the final and fourth stage the range Doppler cross coefficient is estimated and the weak targets
are detected. This procedure is effective for point targets and applicable for medium and low range
resolution radar. For high range resolution we have to implement stretch processing in point
cancellation method.
4.4 MASKING EFFECT REMOVAL USING STRETCH
PROCESSING
4.4.1 Linear Interpolation Method
Here we calculate the linear combinations of adjacent original samples for the computation
of new samples. It is one of the simplest re-sampling methods, known as method of curve
fitting. It is very fast but has poor accuracy.

36 CHAPTER 4: MASKING EFFECT
TARGET DETECTION BY RADAR USING LINEAR FREQUENCY MODULATION |
4.4.2 Poly-phase method
It uses poly phase filter which is effective way of upsampling by an integer N and
simultaneously downsampling by another integer factor M. They obtain a stretch factor
M/N which is usually close to 1. Firstly from an oversampled point set we calculate sample
values using simple poly phase resampler. Secondly we use a simple linear interpolation
for finding more accurate value at a required point between samples.
4.4.3 Spectrum based method
This method is based on the conversion of signal to spectral domain and making
manipulation in the domain. After manipulation spectrum is converted back to time
domain. This method allow resampling factor of N/M. It uses an efficient IFFT algorithm.
If the resampling factor can’t be expressed as a ratio of two integer then chirp z transform
resampling method is used.
Table 4.1- Simulation Parameters for Masking Effect
Bandwidth 0.1 GHz
Scatter Range 20, 100
Radar Cross-Section 2, 0.05
Time Period 5 µs

37 CHAPTER 4: MASKING EFFECT
TARGET DETECTION BY RADAR USING LINEAR FREQUENCY MODULATION |
SIMULATION
Fig 4.1-Masked output using only matched filter
Fig 4.2-Unmasked output using only matched filter

38 CHAPTER 4: MASKING EFFECT
TARGET DETECTION BY RADAR USING LINEAR FREQUENCY MODULATION |
Fig 4.3- Masked output using matched filter and stretch processing
Fig 4.4- Unmasked output using matched filter and stretch processing

39 CHAPTER 4: MASKING EFFECT
TARGET DETECTION BY RADAR USING LINEAR FREQUENCY MODULATION |
4.5 CONCLUSION
In radar pulse compression we have used both Matched filter and Stretch processing. Both are
suitable for side lobe reduction and improving SNR value. But Matched filter is generally used for
narrowband signal and Stretch processing is used for wideband signal. In case of stretch processors
give up all range processing to get the narrow band signal processors whereas match filter look for
targets in entire waveform pulse repetition interval(PRI). So we can’t use stretch processing for
search purpose as it requires look for a large range extend. Instead we use it for tracking as we
already know the range approximately. Matched filter can also be used for wideband signal but
only up to a certain range.

40 CHAPTER 5: CONCLUSION AND FUTURE WORK
TARGET DETECTION BY RADAR USING LINEAR FERQUENCY MODULATION |
CHAPTER 5
CONCLUSION AND FUTURE WORK

41 CHAPTER 5: CONCLUSION AND FUTURE WORK
TARGET DETECTION BY RADAR USING LINEAR FERQUENCY MODULATION |
5.1 CONCLUSION
From the thesis we saw that pulse compression could be achieved using two methods; using a
matched filter or through stretch processing. Matched Filter performs a correlation between the
received signal and the replica of the transmitted signal. Stretch Processing converted the time
delay between the signals into frequency. Stretch Processing is preferred because it gives enhanced
range resolution. It also provides better side-lobe reduction than matched filter processing.
Besides the effect of windows on the LFM signals was studied. The LFM wave was passed through
5 windows
1. Rectangular Window 2. Hanning Window 3. Hamming Window
4. Kaiser Window 5. Blackmanharris Window
We also noticed that the better side-lobe reduction was achieved by using the Blackmanharris
window.
Masking Effect was examined. Masking Effect is observed when strong echoes of a nearby target
mask the weaker echoes from distant targets. The various methods to remove masking effect were
discussed and the stretch processing method to remove masking effect was implemented.
5.2 FUTURE WORK
Pulse Compression was achieved through linear frequency modulation. Other techniques for pulse
compression can be implemented. Phase-coded Modulation methods can also be used for
achieving pulse compression. Costas Codes, Baker Codes etc. are used for this purpose. Besides
non-linear frequency modulation technique can also be implemented.

42 REFERENCES
TARGET DETECTION THROUGH RADAR USING LINEAR FREQUENCY MODULATION |
REFERENCES
[1]Mahafza R. Bassem, Radar Systems Analysis and Design using MATLAB, 2nd Ed.Ch.5, 7,
New York: Chapman & Hall/CRC
[2] Ozdemir Caner, Inverse Synthetic Aperture Radar Imaging with MATLAB Algorithms,
Ch.3, New Jersey: John Wiley & Sons.
[3] David K.Barton, Radar System Analysis and Modeling, Ch.5 and 8, Norwood: Artech House.
[4] Sahoo A.K. (2012). Development of Radar Pulse Compression Techniques Using
Computational Intelligence Tools. Ph.D. Thesis. NIT Rourkela.
[5] Schlutz M. (2009). Synthetic Aperture Radar Imaging Simulated in MATLAB. M.S.Thesis.:
California Polytechnic State University.
[6] Kulpa K., Misiurewicz J.: ‘Stretch processing for long integration time passive covert radar’.
Proc. 2006 CIE Int. Conf. Radar, Shanghai, China, 2006, pp. 496–499 Cao
[7] Yunhe, Zhang Shouhong, Wang Hongxian, Gao Zhaozhao.: ‘Wideband Adaptive Sidelobe
Cancellation Based on Stretch processing’, Signal Processing, 2006 8th International Conference
Vol.1, 2006
[8] Torres J A, Davis R M, J D R Kramer, et al. “Efficient wideband jammer nulling when using
stretch processing”, IEEE Tran AES. 36 Vol. 4: pp 1167-1178, 2000.
[9]. Misiurewicz J. Kulpa K.: ‘Stretch processing for masking effect removal in noise radar’, IET
Proc. , Radar Sonar Navig., 2008, Vol. 2, No. 4, pp. 274–283
[10]M. N. Cohen, M. R. Fox, and J. M. Baden, “Minimum peak sidelobe pulse compression
codes,” in Proc. IEEE Int. Radar Conf., pp. 633-639, 1990.

43 REFERENCES
TARGET DETECTION THROUGH RADAR USING LINEAR FREQUENCY MODULATION |
[11] F. Hu, P. Z. Fan, M. Darnell and F. Jin, “Binary sequences with good aperiodic autocorrelation
functions obtained by neural network search,” Electron. Lett., vol. 33, no. 8, pp. 688-690, Apr.
1997.
[12]S. Wang, “Efficient heuristic method of search for binary sequences with good aperiodic
autocorrelations,” Electron. Lett., vol. 44, no. 12, pp. 731-732, June 2008.
[13] B. Militzer, M. Zamparelli and D. Beule, “Evolutionary search for low autocorrelated binary
sequences,” IEEE Trans. on Evol. Comput., vol. 2, no. 1, pp. 34-39, Apr. 1998.
[14] X. Deng and P. Fan, “New binary sequences with good aperiodic autocorrelations obtained
by evolutionary algorithm,” IEEE Comm. Lett., vol. 3, no. 10, pp. 288-290, Oct. 1999.
[15] K. R. Rajeswari and N. Gangatharan, “Algorithm for design of pulse compression radar
codes,” Electron. lett., vol. 39, no. 11, pp. 865-867, May 2003.
[16] M.J.E. Golay, “The merit factor of long low autocorrelation binary sequences,” IEEE Trans.
on Inf. Theory, vol. IT-28, no. 3, pp. 543-549, May 1982.
[17] Holland J.H., Adaptation in Natural and Artificial Systems., University of Michigan Press,
Ann Arbor, 1975.