Embed Size (px)
Citation preview
1 1 Copyright Magnet 2009
Target Report
Engineering/Technology vs. Total
All Professionals - South African Edition
Copyright Magnet 2011
Magnet Professional Survey 2011

2
Magnet Business Concept
Magnet‟s Business Concept
“Our Business Concept is to assist companies and organisations in becoming more
attractive employers through creating and strengthening their Employer Brand.
We Help Companies:
Understand their image, audience and competitors,
Decide their desired brand position,
Plan their communication activities,
Act by reaching the talent market through publications and events
3
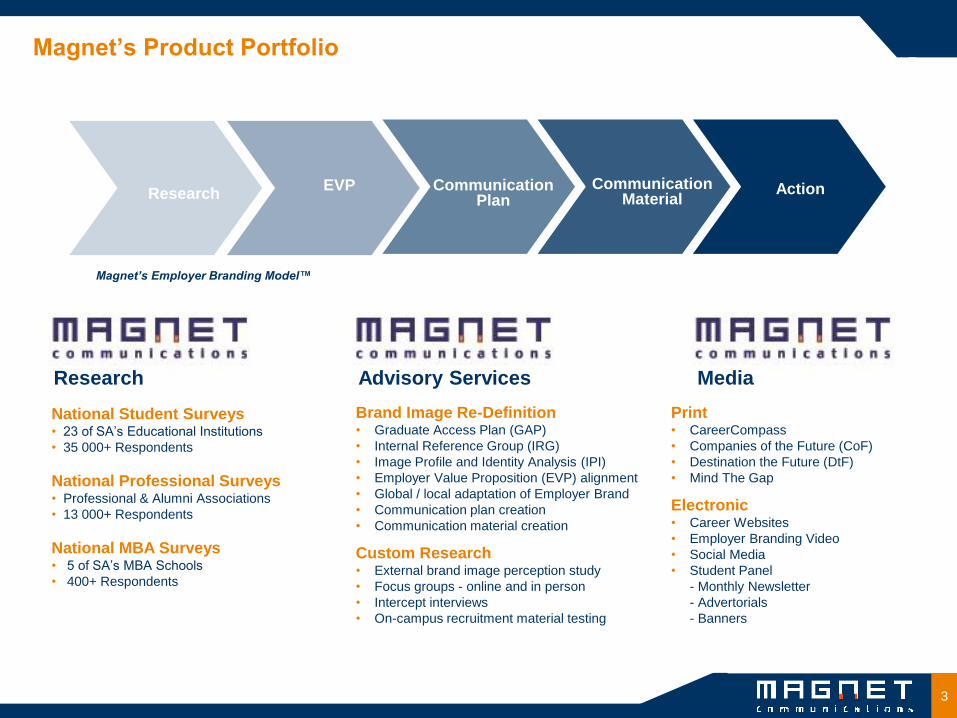
Magnet’s Product Portfolio
National Student Surveys • 23 of SA‟s Educational Institutions
• 35 000+ Respondents
National Professional Surveys • Professional & Alumni Associations
• 13 000+ Respondents
National MBA Surveys • 5 of SA‟s MBA Schools
• 400+ Respondents
Brand Image Re-Definition • Graduate Access Plan (GAP)
• Internal Reference Group (IRG)
• Image Profile and Identity Analysis (IPI)
• Employer Value Proposition (EVP) alignment
• Global / local adaptation of Employer Brand
• Communication plan creation
• Communication material creation
Custom Research • External brand image perception study
• Focus groups - online and in person
• Intercept interviews
• On-campus recruitment material testing
Magnet’s Employer Branding Model™
Research EVP Communication
Plan Communication
Material Action
Research Advisory Services Media
Print • CareerCompass
• Companies of the Future (CoF)
• Destination the Future (DtF)
• Mind The Gap
Electronic • Career Websites
• Employer Branding Video
• Social Media
• Student Panel
- Monthly Newsletter
- Advertorials
- Banners

4 4
Magnet: A Global Perspective
On a global level, Magnet works with Universum, the global leader in Employer Branding. Universum partners with
1,500 universities to conduct research on the career and employer preferences of top talent. Universum annually
surveys over 350,000 students and 100,000 professionals worldwide through standardised research. The group head
office is located in Stockholm and the regional head offices are located in Philadelphia (America), Cologne (Europe)
and Shanghai (Asia).
5
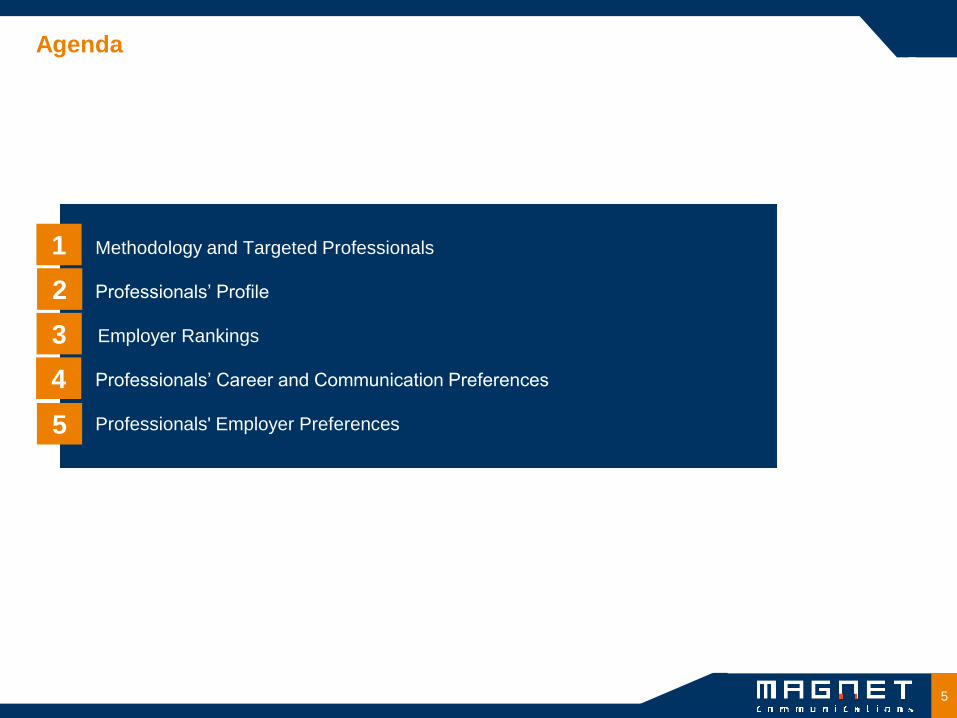
Agenda
Methodology and Targeted Professionals
Professionals‟ Profile
Employer Rankings
Professionals‟ Career and Communication Preferences
Professionals' Employer Preferences
1
2
3
4
5

6 6 Copyright Magnet 2010
Magnet Professional Survey 2011
Engineering/Technology vs. Total
All Professionals - South African Edition
Copyright Magnet 2011
Methodology and targeted professionals
1 Target Report
7
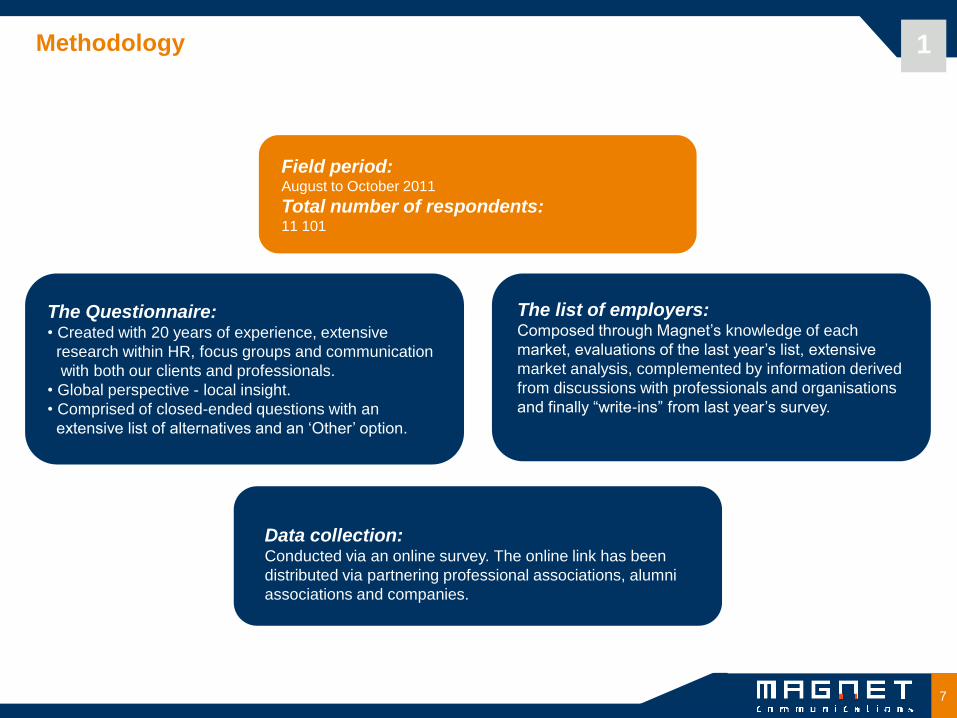
Methodology
Field period: August to October 2011
Total number of respondents: 11 101
The list of employers: Composed through Magnet‟s knowledge of each
market, evaluations of the last year‟s list, extensive
market analysis, complemented by information derived
from discussions with professionals and organisations
and finally “write-ins” from last year‟s survey.
Data collection: Conducted via an online survey. The online link has been
distributed via partnering professional associations, alumni
associations and companies.
The Questionnaire: • Created with 20 years of experience, extensive
research within HR, focus groups and communication
with both our clients and professionals.
• Global perspective - local insight.
• Comprised of closed-ended questions with an
extensive list of alternatives and an „Other‟ option.
1
8
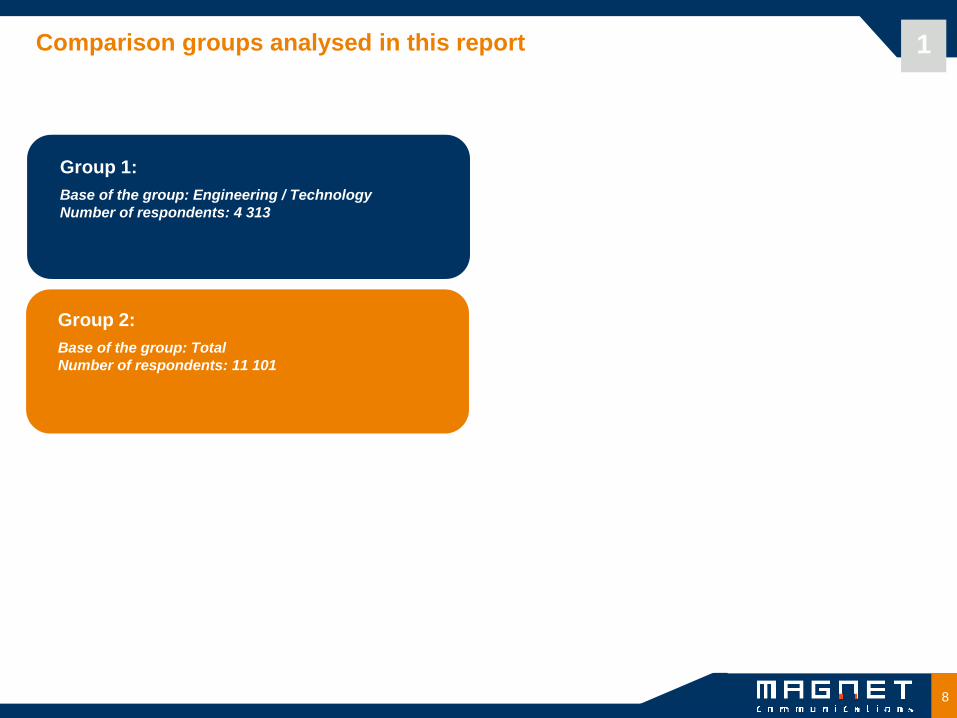
Comparison groups analysed in this report
Group 1:
Base of the group: Engineering / Technology
Number of respondents: 4 313
Group 2:
Base of the group: Total
Number of respondents: 11 101
1
9
9 Copyright Magnet 2010
Magnet Professional Survey 2011
Engineering/Technology vs. Total
All Professionals - South African Edition
Copyright Magnet 2011
Professionals’ Profile
2 Target Report
10
Professionals’ Profile
Topics:
Factors differentiating the selected target groups:
• General Profile
• Educational Profile
• Professional Profile
2
Think about:
• What characterises the professionals?
• Which professionals are within your primary target groups?
• How do the groups differ from each other?
11
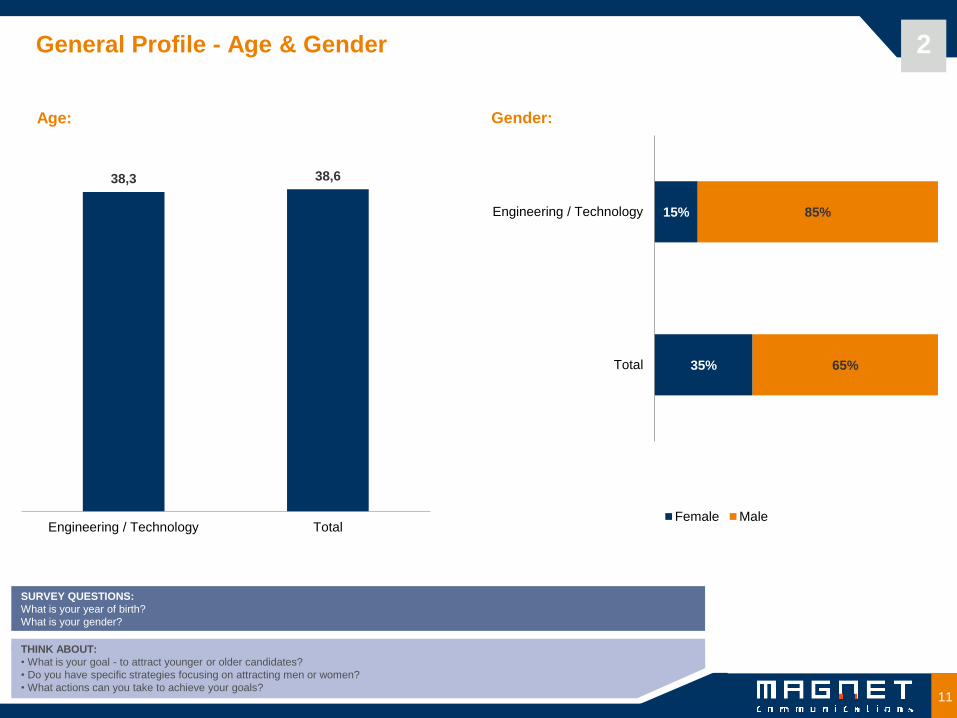
General Profile - Age & Gender 2
SURVEY QUESTIONS:
What is your year of birth?
What is your gender?
THINK ABOUT:
• What is your goal - to attract younger or older candidates?
• Do you have specific strategies focusing on attracting men or women?
• What actions can you take to achieve your goals?
Age: Gender:
38,638,3
TotalEngineering / Technology
15%
35%
85%
65%
Engineering / Technology
Total
Female Male
12
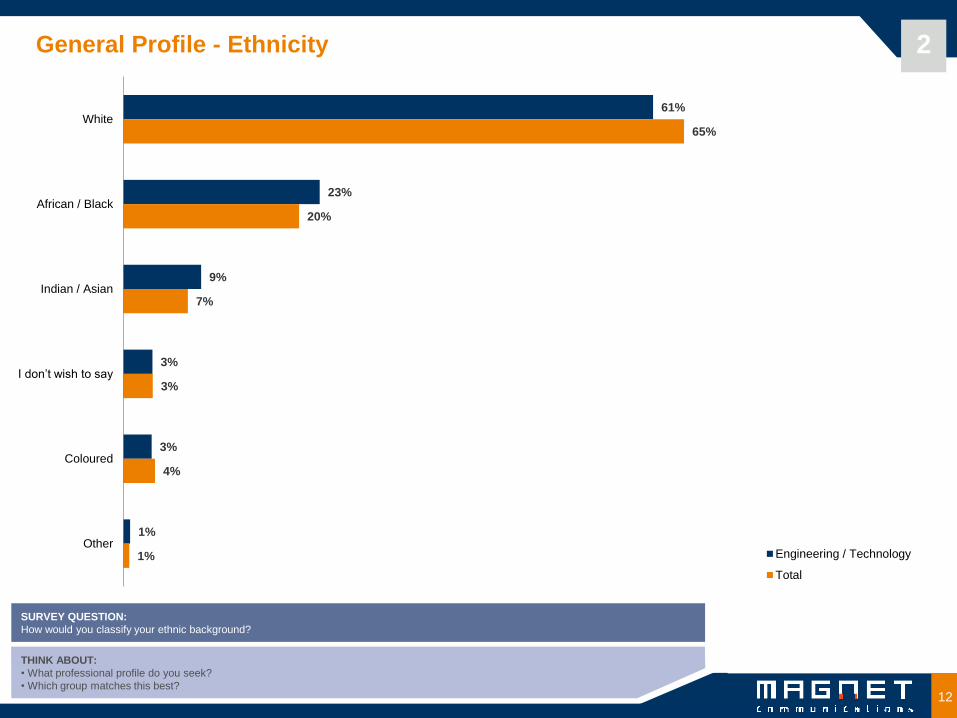
General Profile - Ethnicity 2
SURVEY QUESTION:
How would you classify your ethnic background?
THINK ABOUT:
• What professional profile do you seek?
• Which group matches this best?
61%
23%
9%
3%
3%
1%
65%
20%
7%
3%
4%
1%
White
African / Black
Indian / Asian
I don‟t wish to say
Coloured
OtherEngineering / Technology
Total
13
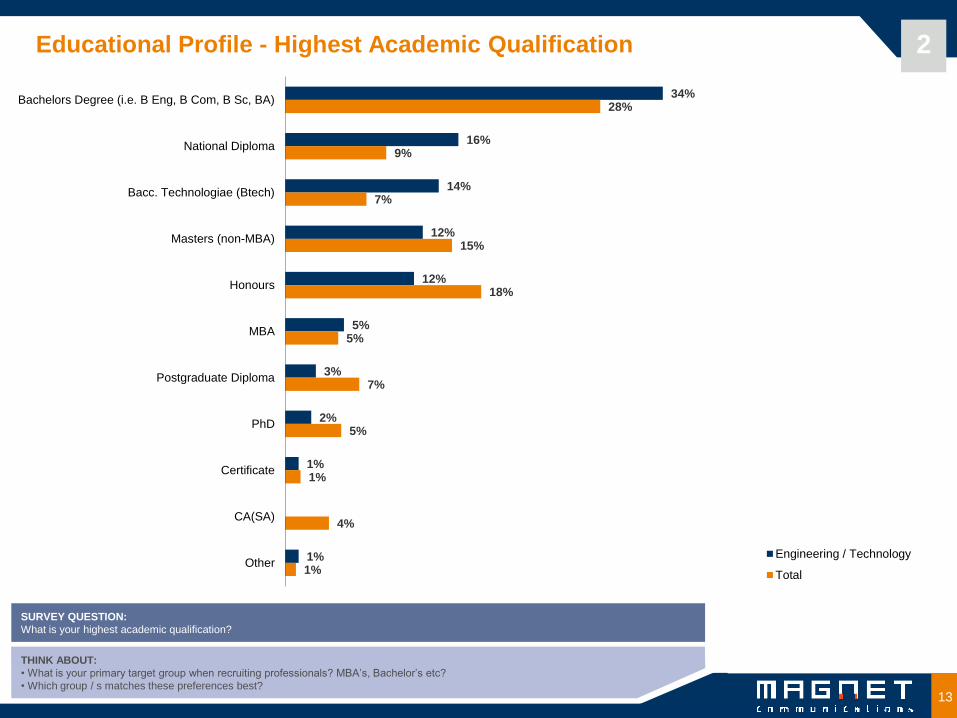
Educational Profile - Highest Academic Qualification 2
SURVEY QUESTION:
What is your highest academic qualification?
THINK ABOUT:
• What is your primary target group when recruiting professionals? MBA‟s, Bachelor‟s etc?
• Which group / s matches these preferences best?
34%
16%
14%
12%
12%
5%
3%
2%
1%
1%
28%
9%
7%
15%
18%
5%
7%
5%
1%
4%
1%
Bachelors Degree (i.e. B Eng, B Com, B Sc, BA)
National Diploma
Bacc. Technologiae (Btech)
Masters (non-MBA)
Honours
MBA
Postgraduate Diploma
PhD
Certificate
CA(SA)
OtherEngineering / Technology
Total
14
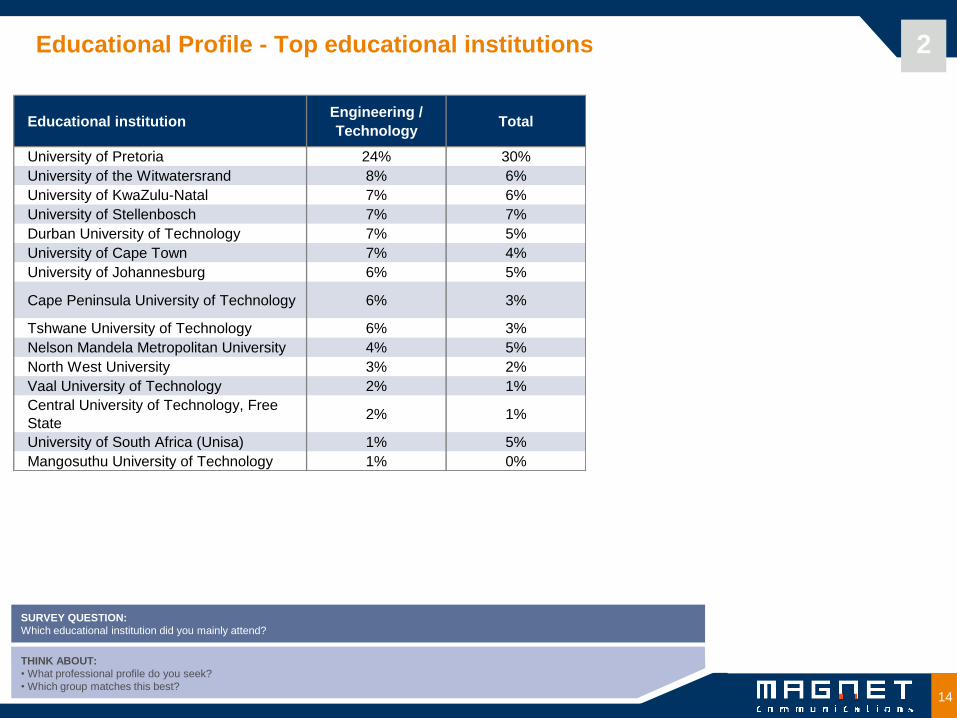
Educational Profile - Top educational institutions
SURVEY QUESTION:
Which educational institution did you mainly attend?
THINK ABOUT:
• What professional profile do you seek?
• Which group matches this best?
Educational institutionEngineering /
TechnologyTotal
University of Pretoria 24% 30%
University of the Witwatersrand 8% 6%
University of KwaZulu-Natal 7% 6%
University of Stellenbosch 7% 7%
Durban University of Technology 7% 5%
University of Cape Town 7% 4%
University of Johannesburg 6% 5%
Cape Peninsula University of Technology 6% 3%
Tshwane University of Technology 6% 3%
Nelson Mandela Metropolitan University 4% 5%
North West University 3% 2%
Vaal University of Technology 2% 1%
Central University of Technology, Free
State2% 1%
University of South Africa (Unisa) 1% 5%
Mangosuthu University of Technology 1% 0%
2
15
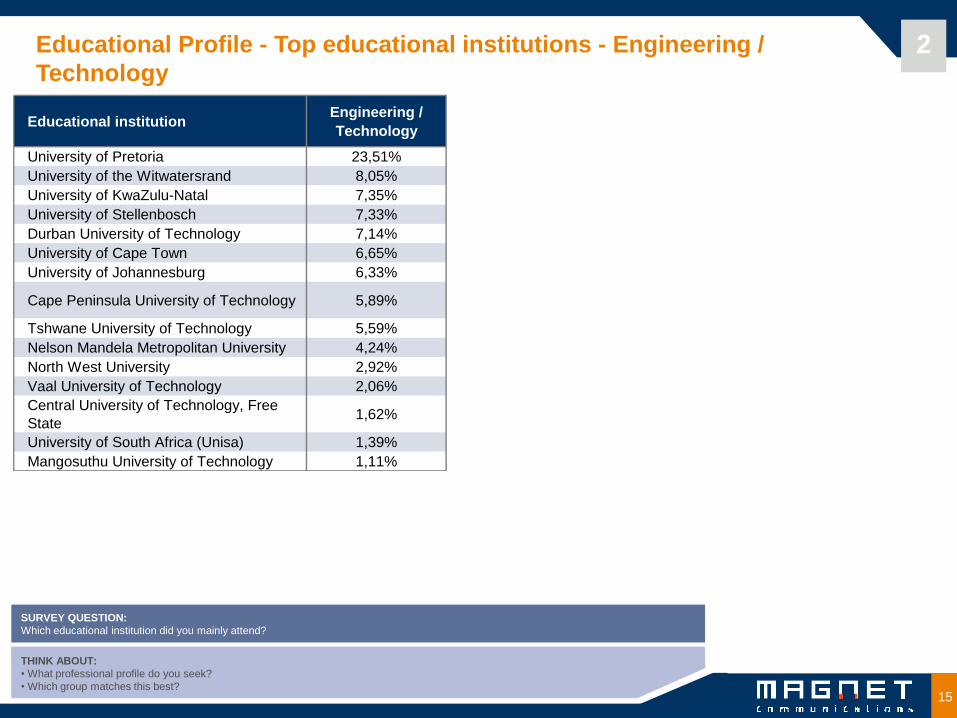
SURVEY QUESTION:
Which educational institution did you mainly attend?
THINK ABOUT:
• What professional profile do you seek?
• Which group matches this best?
Educational Profile - Top educational institutions - Engineering /
Technology
Educational institutionEngineering /
Technology
University of Pretoria 23,51%
University of the Witwatersrand 8,05%
University of KwaZulu-Natal 7,35%
University of Stellenbosch 7,33%
Durban University of Technology 7,14%
University of Cape Town 6,65%
University of Johannesburg 6,33%
Cape Peninsula University of Technology 5,89%
Tshwane University of Technology 5,59%
Nelson Mandela Metropolitan University 4,24%
North West University 2,92%
Vaal University of Technology 2,06%
Central University of Technology, Free
State1,62%
University of South Africa (Unisa) 1,39%
Mangosuthu University of Technology 1,11%
2
16
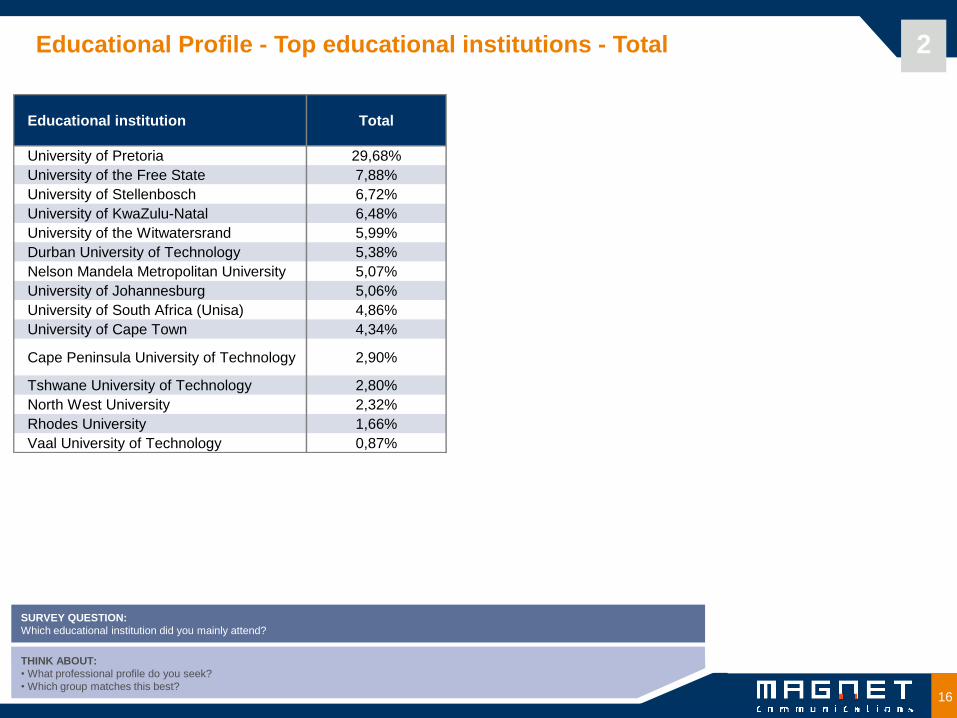
SURVEY QUESTION:
Which educational institution did you mainly attend?
THINK ABOUT:
• What professional profile do you seek?
• Which group matches this best?
Educational Profile - Top educational institutions - Total
Educational institution Total
University of Pretoria 29,68%
University of the Free State 7,88%
University of Stellenbosch 6,72%
University of KwaZulu-Natal 6,48%
University of the Witwatersrand 5,99%
Durban University of Technology 5,38%
Nelson Mandela Metropolitan University 5,07%
University of Johannesburg 5,06%
University of South Africa (Unisa) 4,86%
University of Cape Town 4,34%
Cape Peninsula University of Technology 2,90%
Tshwane University of Technology 2,80%
North West University 2,32%
Rhodes University 1,66%
Vaal University of Technology 0,87%
2
17
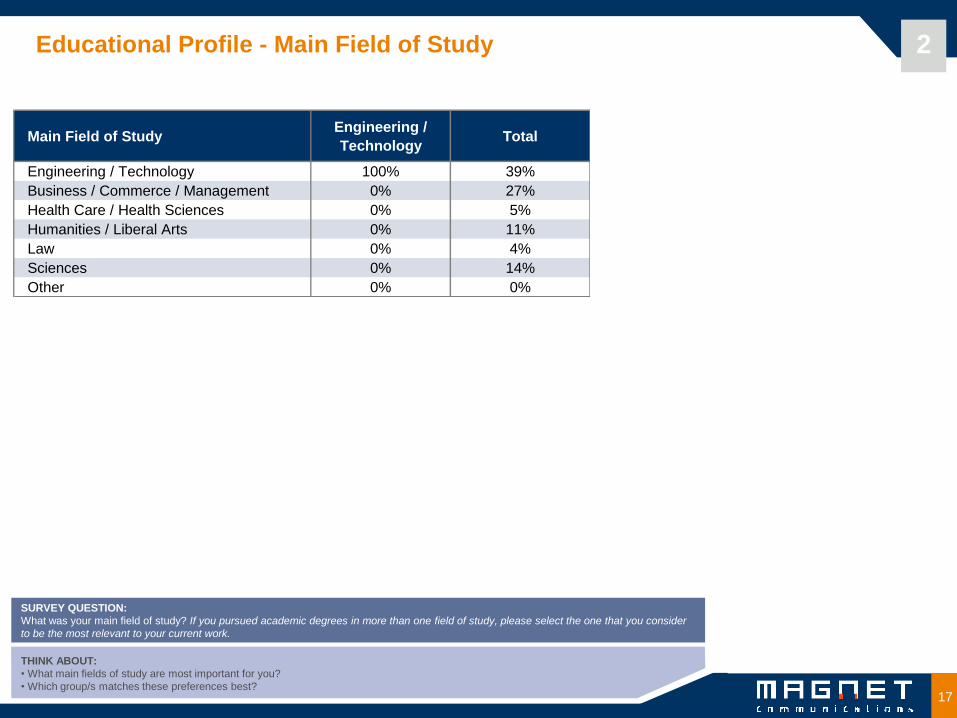
Educational Profile - Main Field of Study 2
SURVEY QUESTION:
What was your main field of study? If you pursued academic degrees in more than one field of study, please select the one that you consider
to be the most relevant to your current work.
THINK ABOUT:
• What main fields of study are most important for you?
• Which group/s matches these preferences best?
Main Field of StudyEngineering /
TechnologyTotal
Engineering / Technology 100% 39%
Business / Commerce / Management 0% 27%
Health Care / Health Sciences 0% 5%
Humanities / Liberal Arts 0% 11%
Law 0% 4%
Sciences 0% 14%
Other 0% 0%
18
2
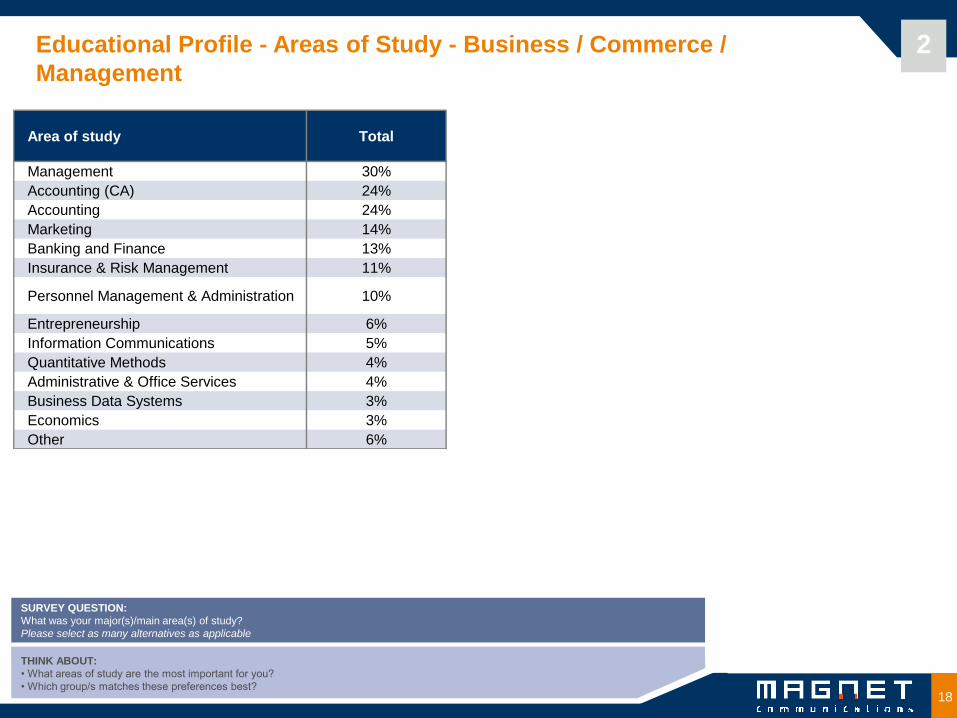
SURVEY QUESTION:
What was your major(s)/main area(s) of study?
Please select as many alternatives as applicable
THINK ABOUT:
• What areas of study are the most important for you?
• Which group/s matches these preferences best?
Educational Profile - Areas of Study - Business / Commerce /
Management
Area of study Total
Management 30%
Accounting (CA) 24%
Accounting 24%
Marketing 14%
Banking and Finance 13%
Insurance & Risk Management 11%
Personnel Management & Administration 10%
Entrepreneurship 6%
Information Communications 5%
Quantitative Methods 4%
Administrative & Office Services 4%
Business Data Systems 3%
Economics 3%
Other 6%

19
2
SURVEY QUESTION:
What was your major(s)/main area(s) of study?
Please select as many alternatives as applicable
THINK ABOUT:
• What areas of study are the most important for you?
• Which group/s matches these preferences best?
Educational Profile - Areas of Study - Engineering / Technology
Area of studyEngineering /
TechnologyTotal
Civil Engineering & Technology 32% 32%
Electrical Engineering & Technology 24% 24%
Mechanical Engineering & Technology 19% 19%
Chemical Engineering & Technology 8% 8%
Computer Engineering & Technology 7% 7%
Industrial Engineering & Technology 4% 4%
Metallurgical Engineering & Technology 3% 3%
Architecture & Environmental Design 3% 3%
Mining Engineering & Technology 2% 2%
Other 4% 4%
20
2
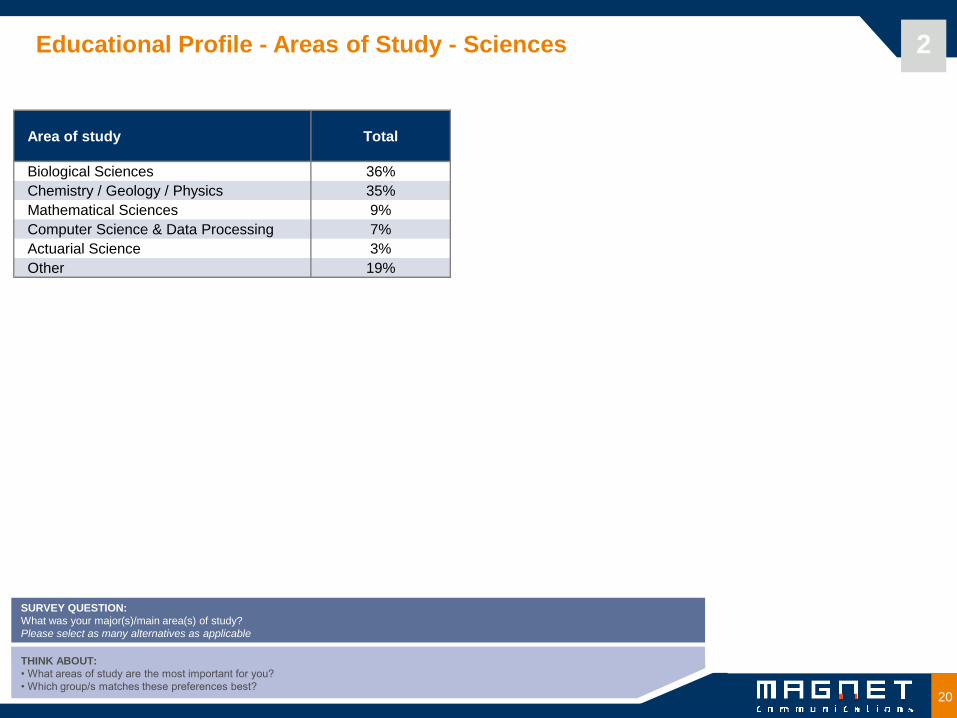
SURVEY QUESTION:
What was your major(s)/main area(s) of study?
Please select as many alternatives as applicable
THINK ABOUT:
• What areas of study are the most important for you?
• Which group/s matches these preferences best?
Educational Profile - Areas of Study - Sciences
Area of study Total
Biological Sciences 36%
Chemistry / Geology / Physics 35%
Mathematical Sciences 9%
Computer Science & Data Processing 7%
Actuarial Science 3%
Other 19%
21
2
SURVEY QUESTION:
What was your major(s)/main area(s) of study?
Please select as many alternatives as applicable
THINK ABOUT:
• What areas of study are the most important for you?
• Which group/s matches these preferences best?
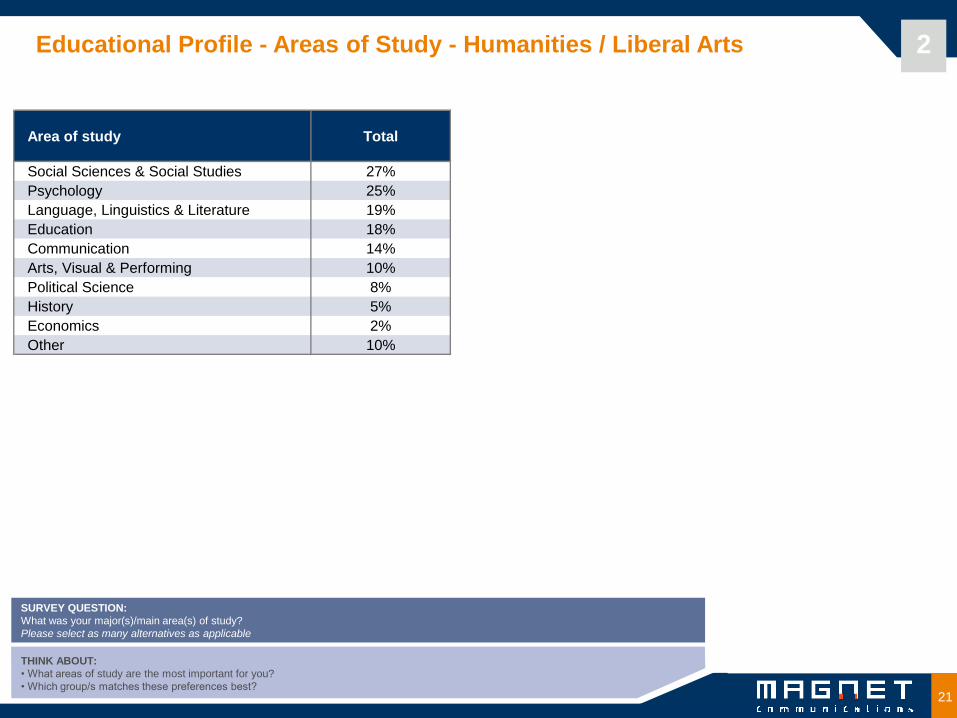
Educational Profile - Areas of Study - Humanities / Liberal Arts
Area of study Total
Social Sciences & Social Studies 27%
Psychology 25%
Language, Linguistics & Literature 19%
Education 18%
Communication 14%
Arts, Visual & Performing 10%
Political Science 8%
History 5%
Economics 2%
Other 10%
22
2
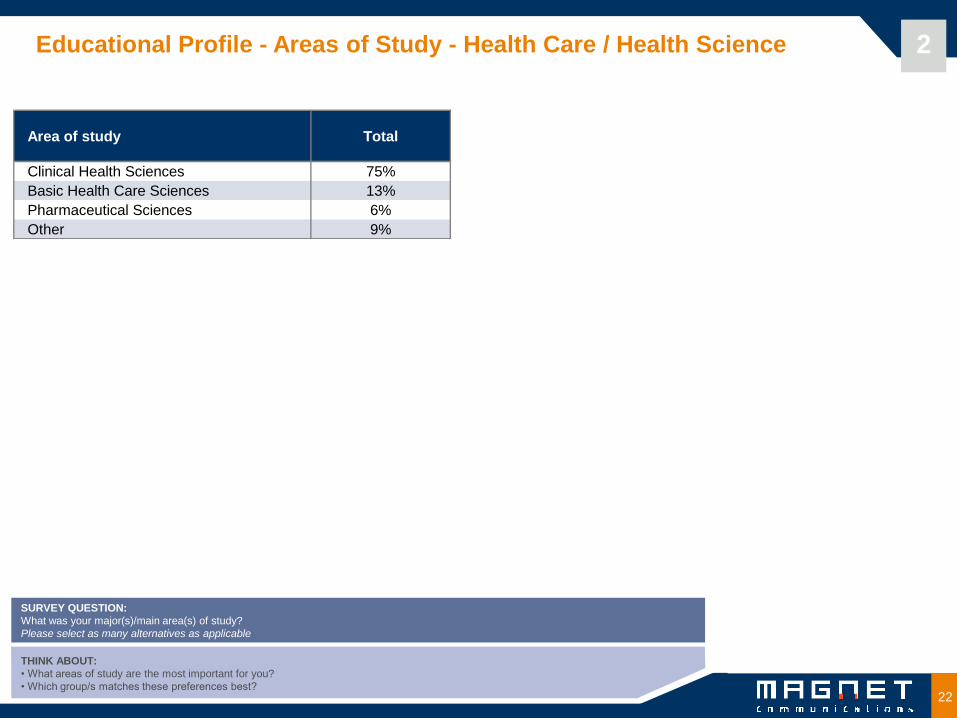
SURVEY QUESTION:
What was your major(s)/main area(s) of study?
Please select as many alternatives as applicable
THINK ABOUT:
• What areas of study are the most important for you?
• Which group/s matches these preferences best?
Educational Profile - Areas of Study - Health Care / Health Science
Area of study Total
Clinical Health Sciences 75%
Basic Health Care Sciences 13%
Pharmaceutical Sciences 6%
Other 9%
23
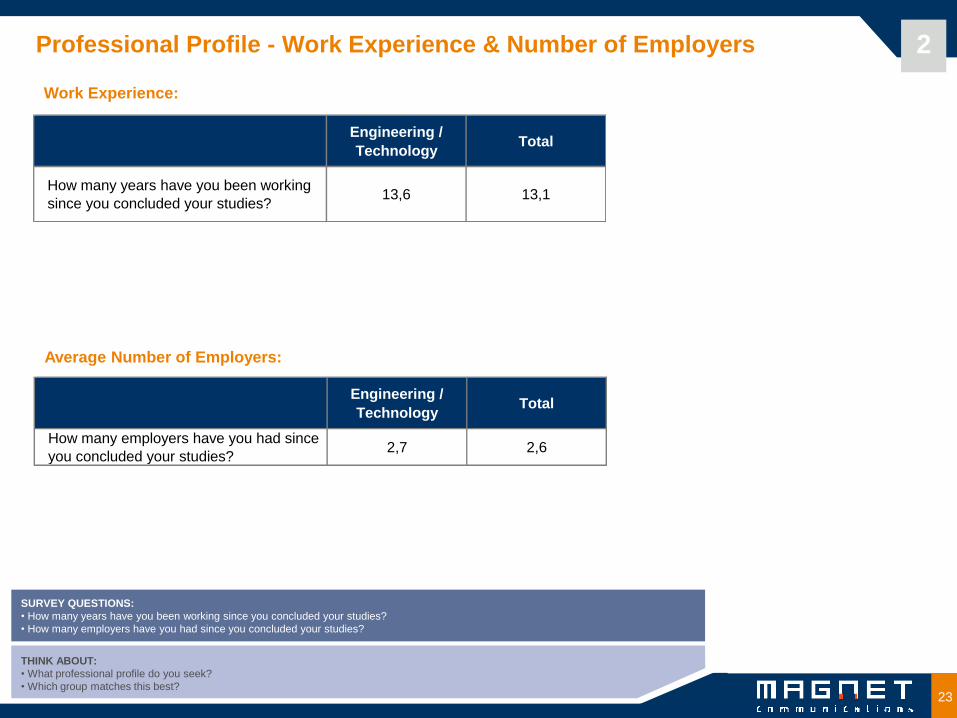
Professional Profile - Work Experience & Number of Employers 2
THINK ABOUT:
• What professional profile do you seek?
• Which group matches this best?
SURVEY QUESTIONS:
• How many years have you been working since you concluded your studies?
• How many employers have you had since you concluded your studies?
Engineering /
TechnologyTotal
How many years have you been working
since you concluded your studies?13,6 13,1
Work Experience:
Engineering /
TechnologyTotal
How many employers have you had since
you concluded your studies?2,7 2,6
Average Number of Employers:
24
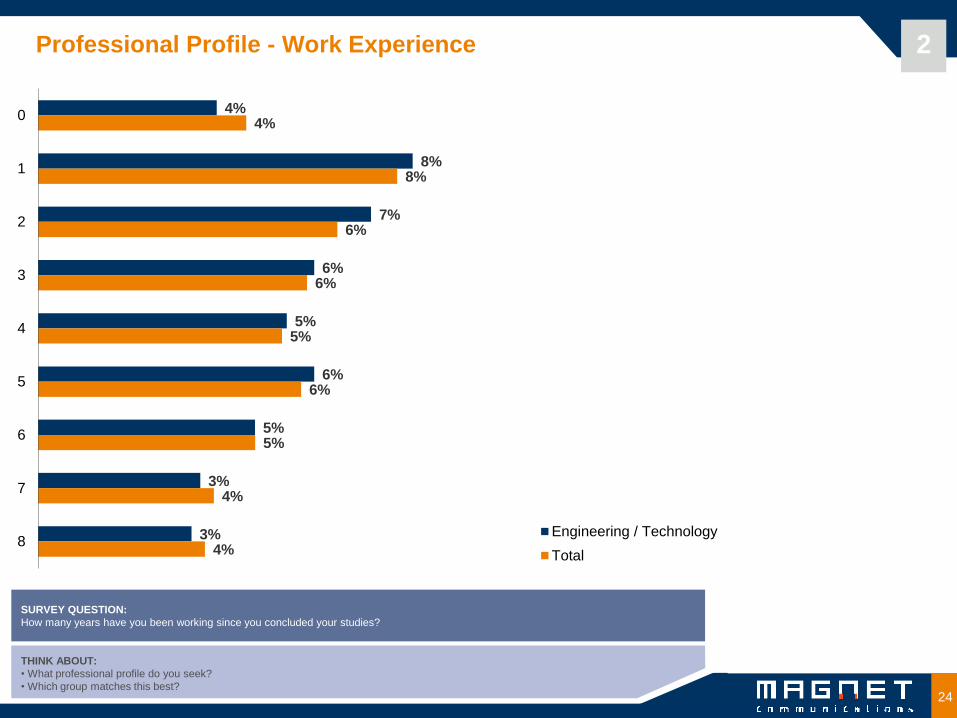
Professional Profile - Work Experience 2
THINK ABOUT:
• What professional profile do you seek?
• Which group matches this best?
SURVEY QUESTION:
How many years have you been working since you concluded your studies?
4%
8%
7%
6%
5%
6%
5%
3%
3%
4%
8%
6%
6%
5%
6%
5%
4%
4%
0
1
2
3
4
5
6
7
8Engineering / Technology
Total
25
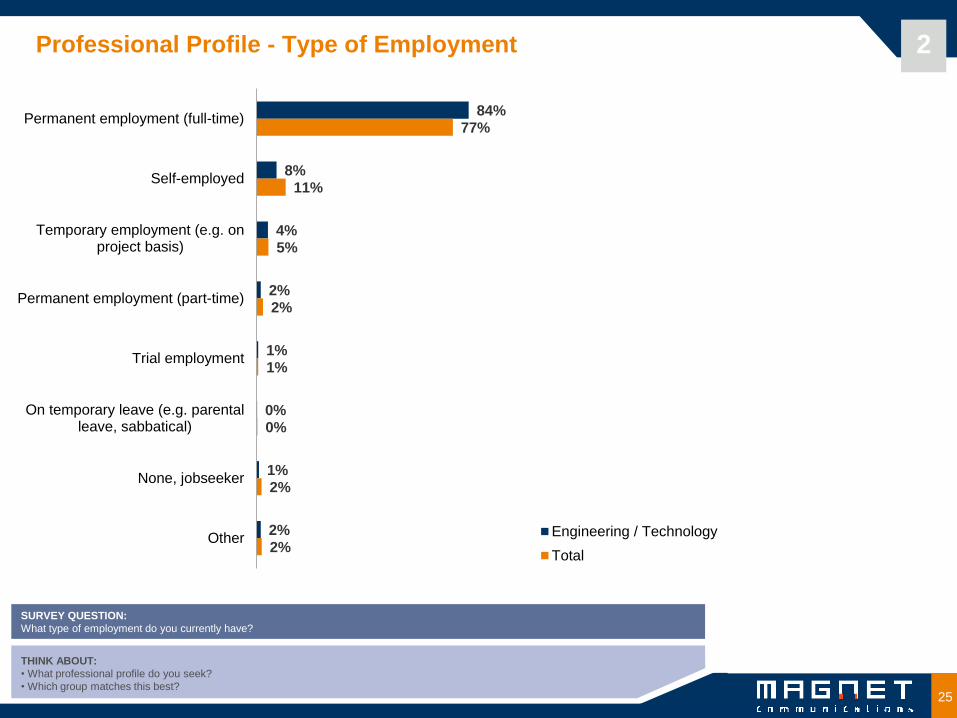
Professional Profile - Type of Employment 2
SURVEY QUESTION:
What type of employment do you currently have?
THINK ABOUT:
• What professional profile do you seek?
• Which group matches this best?
84%
8%
4%
2%
1%
0%
1%
2%
77%
11%
5%
2%
1%
0%
2%
2%
Permanent employment (full-time)
Self-employed
Temporary employment (e.g. onproject basis)
Permanent employment (part-time)
Trial employment
On temporary leave (e.g. parentalleave, sabbatical)
None, jobseeker
Other Engineering / Technology
Total

26
Professional Profile - Current Industry - Top 20 2
SURVEY QUESTION:
In which industry do you currently work?
THINK ABOUT:
• What professional profile do you ideally seek?
• Which group matches this best?
IndustryEngineering /
TechnologyTotal
Engineering consulting 30% 12%
Engineering / manufacturing 10% 5%
Mining 9% 6%
Construction 8% 4%
Energy / power 6% 3%
Chemical / petroleum 5% 3%
Government 4% 5%
Telecommunications 3% 2%
Aerospace / defense 2% 1%
Academic research 2% 4%
Transportation / distribution / logistics 2% 1%
Utilities 2% 1%
Metals 1% 1%
Automotive 1% 1%
Education / teaching 1% 6%
Public Service 1% 2%
Computer software 1% 1%
Financial services 1% 7%
IT consulting 1% 1%
Electronics 1% 0%

27
2
SURVEY QUESTION:
In which industry do you currently work?
THINK ABOUT:
• What professional profile do you ideally seek?
• Which group matches this best?
Professional Profile - Current Industry - Engineering /
Technology
IndustryEngineering /
Technology
Engineering consulting 30%
Engineering / manufacturing 10%
Mining 9%
Construction 8%
Energy / power 6%
Chemical / petroleum 5%
Government 4%
Telecommunications 3%
Aerospace / defense 2%
Academic research 2%
Transportation / distribution / logistics 2%
Utilities 2%
Metals 1%
Automotive 1%
Education / teaching 1%
Public Service 1%
Computer software 1%
Financial services 1%
IT consulting 1%
Electronics 1%
28
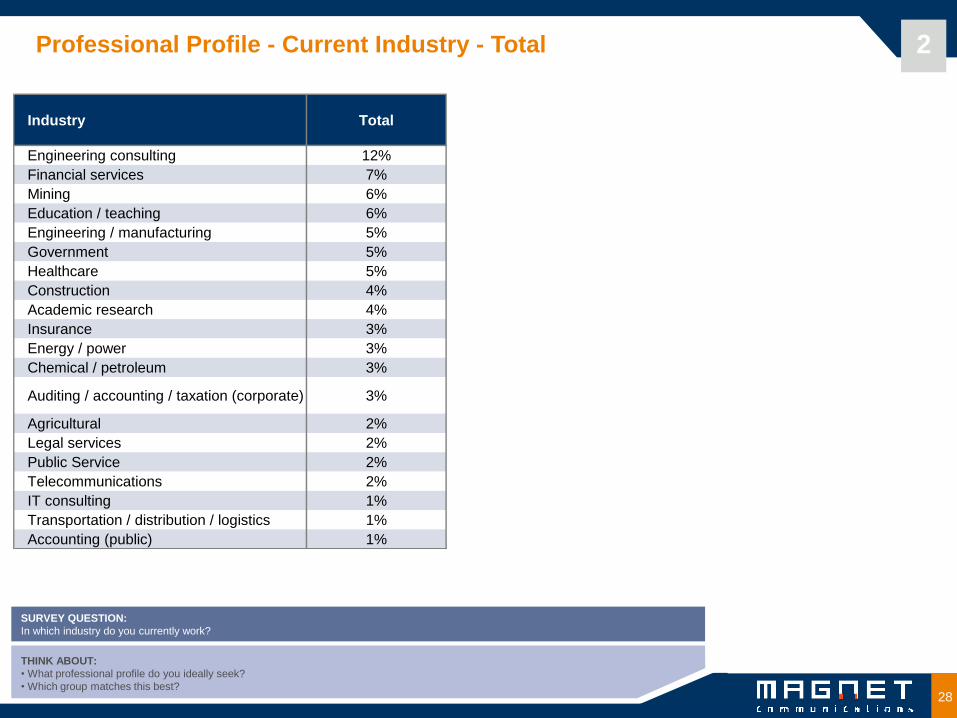
2
SURVEY QUESTION:
In which industry do you currently work?
THINK ABOUT:
• What professional profile do you ideally seek?
• Which group matches this best?
Professional Profile - Current Industry - Total
Industry Total
Engineering consulting 12%
Financial services 7%
Mining 6%
Education / teaching 6%
Engineering / manufacturing 5%
Government 5%
Healthcare 5%
Construction 4%
Academic research 4%
Insurance 3%
Energy / power 3%
Chemical / petroleum 3%
Auditing / accounting / taxation (corporate) 3%
Agricultural 2%
Legal services 2%
Public Service 2%
Telecommunications 2%
IT consulting 1%
Transportation / distribution / logistics 1%
Accounting (public) 1%
29
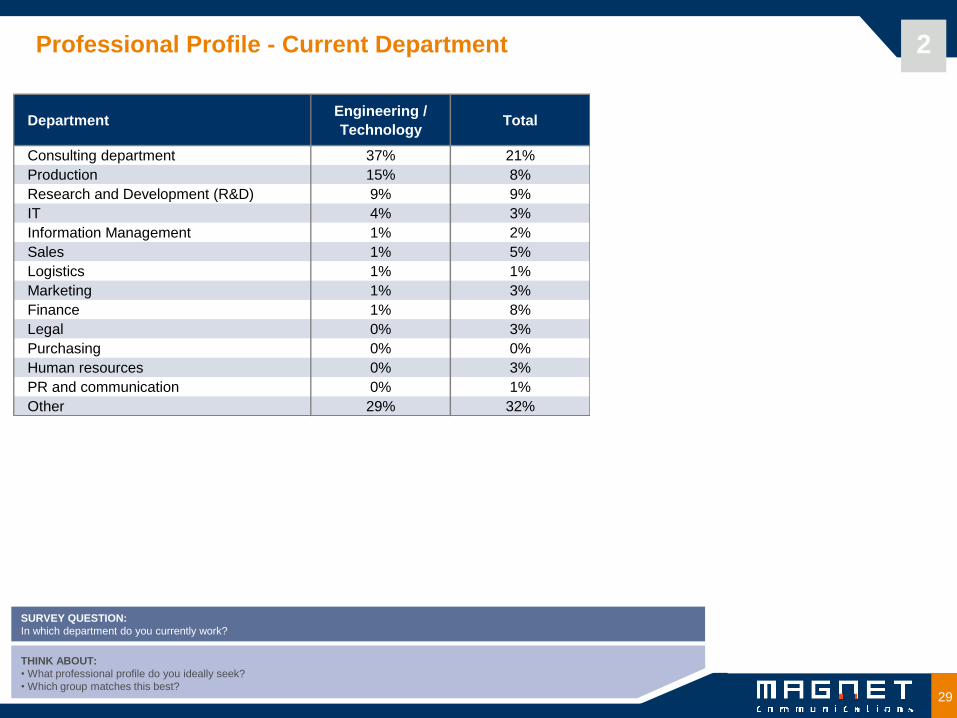
Professional Profile - Current Department 2
SURVEY QUESTION:
In which department do you currently work?
THINK ABOUT:
• What professional profile do you ideally seek?
• Which group matches this best?
DepartmentEngineering /
TechnologyTotal
Consulting department 37% 21%
Production 15% 8%
Research and Development (R&D) 9% 9%
IT 4% 3%
Information Management 1% 2%
Sales 1% 5%
Logistics 1% 1%
Marketing 1% 3%
Finance 1% 8%
Legal 0% 3%
Purchasing 0% 0%
Human resources 0% 3%
PR and communication 0% 1%
Other 29% 32%

30
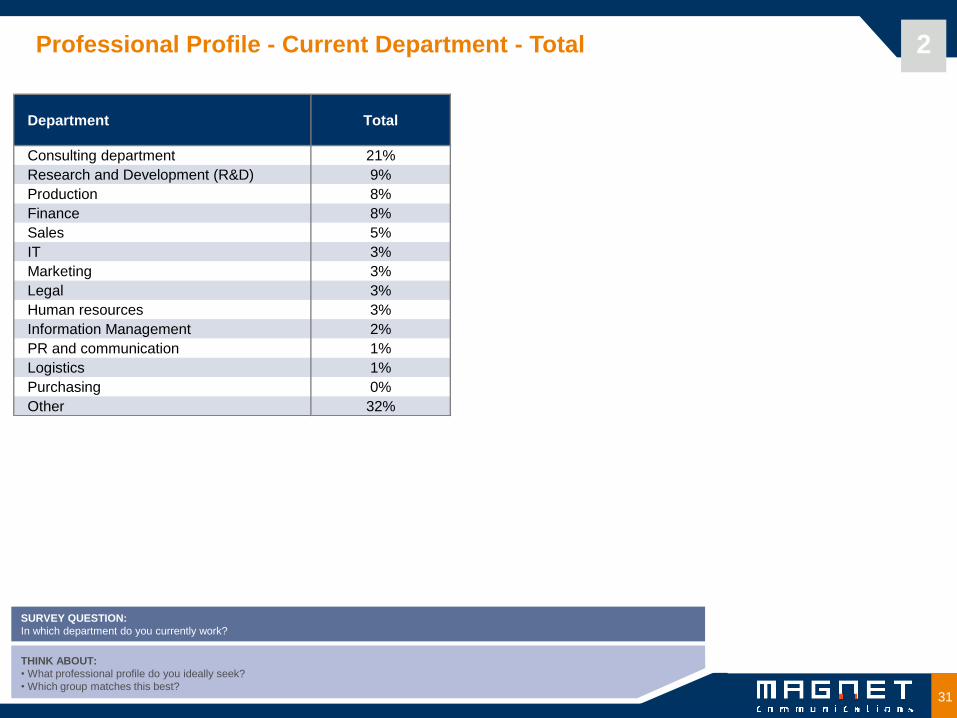
2
SURVEY QUESTION:
In which department do you currently work?
THINK ABOUT:
• What professional profile do you ideally seek?
• Which group matches this best?
Professional Profile - Current Department - Engineering / Technology
DepartmentEngineering /
Technology
Consulting department 37%
Production 15%
Research and Development (R&D) 9%
IT 4%
Information Management 1%
Sales 1%
Logistics 1%
Marketing 1%
Finance 1%
Legal 0%
Purchasing 0%
Human resources 0%
PR and communication 0%
Other 29%
31
2
SURVEY QUESTION:
In which department do you currently work?
THINK ABOUT:
• What professional profile do you ideally seek?
• Which group matches this best?
Professional Profile - Current Department - Total
Department Total
Consulting department 21%
Research and Development (R&D) 9%
Production 8%
Finance 8%
Sales 5%
IT 3%
Marketing 3%
Legal 3%
Human resources 3%
Information Management 2%
PR and communication 1%
Logistics 1%
Purchasing 0%
Other 32%
32
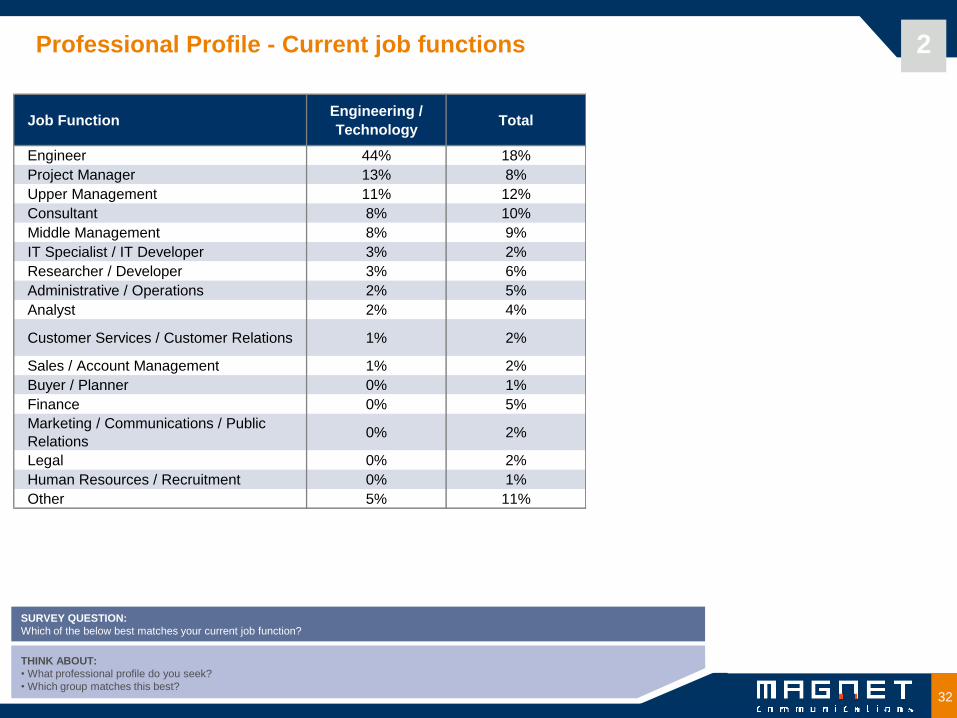
Professional Profile - Current job functions
SURVEY QUESTION:
Which of the below best matches your current job function?
THINK ABOUT:
• What professional profile do you seek?
• Which group matches this best?
2
Job FunctionEngineering /
TechnologyTotal
Engineer 44% 18%
Project Manager 13% 8%
Upper Management 11% 12%
Consultant 8% 10%
Middle Management 8% 9%
IT Specialist / IT Developer 3% 2%
Researcher / Developer 3% 6%
Administrative / Operations 2% 5%
Analyst 2% 4%
Customer Services / Customer Relations 1% 2%
Sales / Account Management 1% 2%
Buyer / Planner 0% 1%
Finance 0% 5%
Marketing / Communications / Public
Relations0% 2%
Legal 0% 2%
Human Resources / Recruitment 0% 1%
Other 5% 11%

33
Professional Profile - Regions
SURVEY QUESTION:
In which region do you currently live?
THINK ABOUT:
• What professional profile do you seek?
• Which group matches this best?
2
RegionEngineering /
TechnologyTotal
Gauteng 48% 49%
Western Cape 15% 15%
KwaZulu-Natal 12% 11%
Mpumalanga 7% 4%
Eastern Cape 6% 6%
Living abroad 3% 5%
North West 3% 2%
Free State 3% 4%
Limpopo 2% 2%
Northern Cape 1% 1%
Other 1% 1%
34
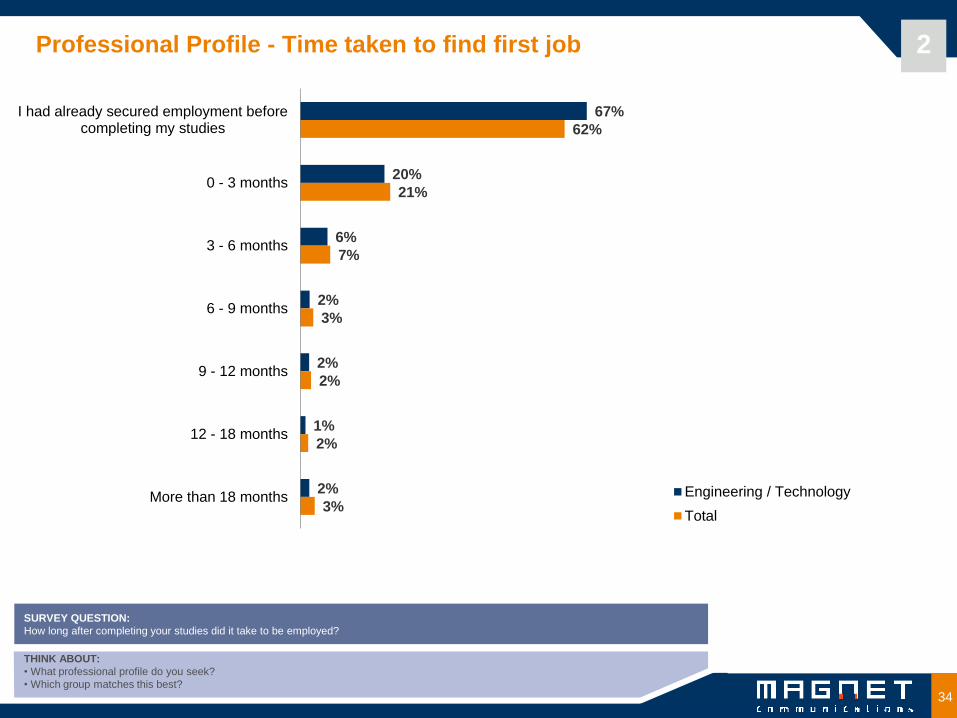
Professional Profile - Time taken to find first job 2
THINK ABOUT:
• What professional profile do you seek?
• Which group matches this best?
SURVEY QUESTION:
How long after completing your studies did it take to be employed?
67%
20%
6%
2%
2%
1%
2%
62%
21%
7%
3%
2%
2%
3%
I had already secured employment beforecompleting my studies
0 - 3 months
3 - 6 months
6 - 9 months
9 - 12 months
12 - 18 months
More than 18 months Engineering / Technology
Total
35
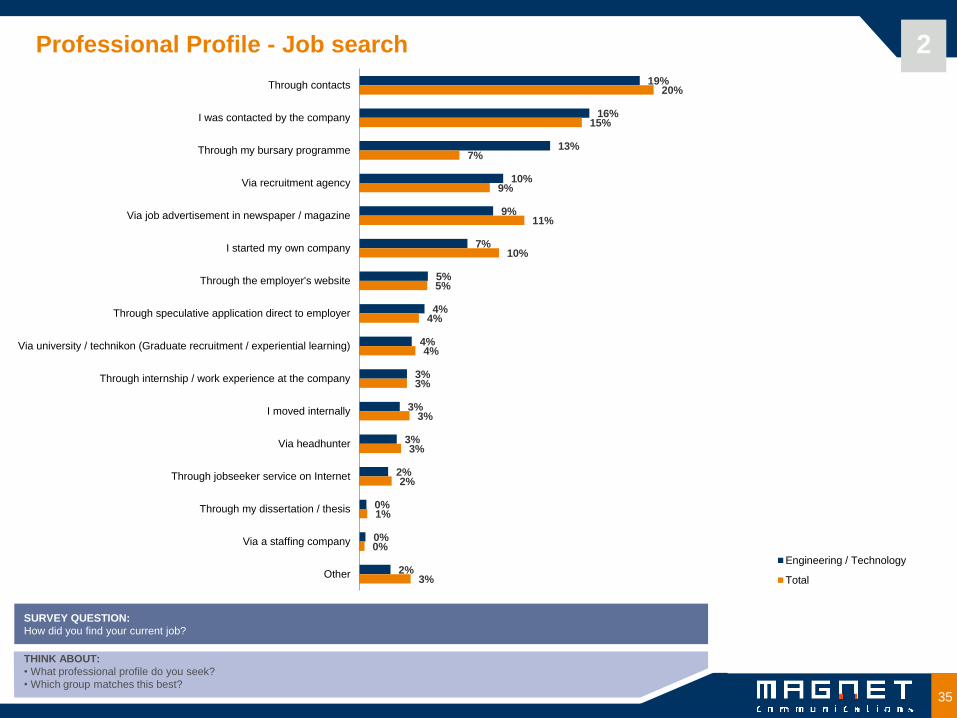
Professional Profile - Job search 2
THINK ABOUT:
• What professional profile do you seek?
• Which group matches this best?
SURVEY QUESTION:
How did you find your current job?
19%
16%
13%
10%
9%
7%
5%
4%
4%
3%
3%
3%
2%
0%
0%
2%
20%
15%
7%
9%
11%
10%
5%
4%
4%
3%
3%
3%
2%
1%
0%
3%
Through contacts
I was contacted by the company
Through my bursary programme
Via recruitment agency
Via job advertisement in newspaper / magazine
I started my own company
Through the employer's website
Through speculative application direct to employer
Via university / technikon (Graduate recruitment / experiential learning)
Through internship / work experience at the company
I moved internally
Via headhunter
Through jobseeker service on Internet
Through my dissertation / thesis
Via a staffing company
Other
Engineering / Technology
Total
36
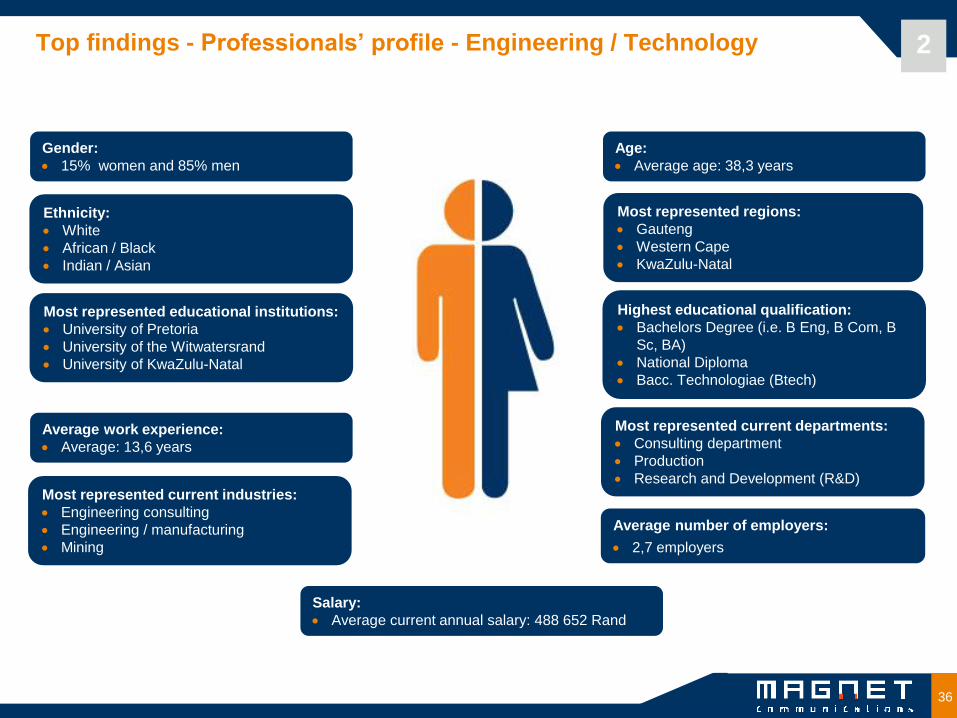
Age:
Average age: 38,3 years
Most represented educational institutions:
University of Pretoria
University of the Witwatersrand
University of KwaZulu-Natal
Salary:
Average current annual salary: 488 652 Rand
Top findings - Professionals’ profile - Engineering / Technology
Gender:
15% women and 85% men
Average work experience:
Average: 13,6 years
Highest educational qualification:
Bachelors Degree (i.e. B Eng, B Com, B
Sc, BA)
National Diploma
Bacc. Technologiae (Btech)
Most represented regions:
Gauteng
Western Cape
KwaZulu-Natal
Ethnicity:
White
African / Black
Indian / Asian
Most represented current industries:
Engineering consulting
Engineering / manufacturing
Mining
Average number of employers:
2,7 employers
Most represented current departments:
Consulting department
Production
Research and Development (R&D)
2

37
Age:
Average age: 38,6 years
Most represented educational institutions:
University of Pretoria
University of the Free State
University of Stellenbosch
Salary:
Average current annual salary: 448 469 Rand
Top findings - Professionals’ profile - Total
Gender:
35% women and 65% men
Average work experience:
Average: 13,1 years
Highest educational qualification:
Bachelors Degree (i.e. B Eng, B Com, B
Sc, BA)
Honours
Masters (non-MBA)
Most represented regions:
Gauteng
Western Cape
KwaZulu-Natal
Ethnicity:
White
African / Black
Indian / Asian
Most represented current industries:
Engineering consulting
Financial services
Mining
Average number of employers:
2,6 employers
Most represented current departments:
Consulting department
Research and Development (R&D)
Production
2
38 38 Copyright Magnet 2010
Magnet Professional Survey 2011
Engineering/Technology vs. Total
All Professionals - South African Edition
Copyright Magnet 2011
Employer Rankings
3 Target Report
39
Employer rankings
Think about:
• How do the groups differ?
• How can you improve your position? What actions can be taken?
• Do you have to improve your visibility or focus on building a stronger Employer Brand?
• What are your goals for next year? Set up achievable goals!
3
Topics:
• Ideal Employer Ranking
• Considered Employer Ranking
• Potential Applicants‟ Ranking

40
Ideal Employer Ranking (Top 30) - Engineering / Technology 3
SURVEY QUESTION:
Please select five employers from the list below for which you would most like to work, your five Ideal Employers.
EmployerRank
2011
Percent
2011
Rank
2010Employer
Rank
2011
Percent
2011
Rank
2010
BHP Billiton 1 13,36% 2 BKS Group 16 5,70% 14
Sasol 2 12,92% 1 Exxaro 17 5,15% 34
Eskom 3 12,60% 5 Rio Tinto Group 18 5,10% 21
CSIR 4 10,30% 3 Transnet 19 4,86% 28
Aurecon 5 9,31% 9 Denel 20 4,79% 24
Anglo American 6 9,05% 6 De Beers 21 4,65% 18
South African Breweries 7 8,92% 4 SSI 22 4,52% 30
Google 8 8,60% 10 PetroSA 23 4,50% 17
Hatch South Africa 9 7,40% 11 Grinaker-LTA 24 4,45% 18
KV3 Engineers 10 7,19% 8 Kumba Iron Ore 25 4,39% 37
Anglo Platinum 11 7,01% 12 Siemens Southern Africa 26 4,34% 15
BMW South Africa 12 6,75% 13 Arcus GIBB 27 4,26% 32
Murray & Roberts 13 6,62% 7 McKinsey & Company 28 4,18% 36
Group Five 14 6,01% 15 Vodacom 29 4,05% 27
Arup 15 5,88% 20 Mercedes-Benz South Africa 30 3,97% 22

41
Ideal Employer Ranking (Top 30) - Total 3
SURVEY QUESTION:
Please select five employers from the list below for which you would most like to work, your five Ideal Employers.
EmployerRank
2011
Percent
2011
Rank
2010Employer
Rank
2011
Percent
2011
Rank
2010
South African Breweries 1 9,48% 1 Aurecon 16 4,54% 41
BHP Billiton 2 9,45% 5 Unilever 17 4,49% 14
Google 3 9,43% 2 De Beers 18 4,43% 20
Sasol 4 9,00% 4 McKinsey & Company 19 3,77% 24
CSIR 5 8,34% 10 Rio Tinto Group 19 3,77% 52
Anglo American 6 7,61% 8 Discovery 21 3,72% 18
Eskom 7 7,55% 12 MTN 22 3,65% 19
Investec 8 7,03% 3 Rand Merchant Bank 23 3,63% 15
BMW South Africa 9 6,53% 11 Murray & Roberts 24 3,49% 27
Coca-Cola South Africa 10 5,89% 6 Transnet 25 3,41% 40
Anglo Platinum 11 5,17% 22Dept. of Higher Education &
Training26 3,39% 37
Allan Gray 12 5,05% 7 Exxaro 27 3,38% 67
Woolworths 13 4,78% 9Development Bank of Southern
Africa28 3,37% -
Mercedes-Benz South Africa 14 4,77% 16 Hatch South Africa 29 3,31% 49
Vodacom 15 4,59% 13 Nestlé South Africa 30 3,30% 32
42
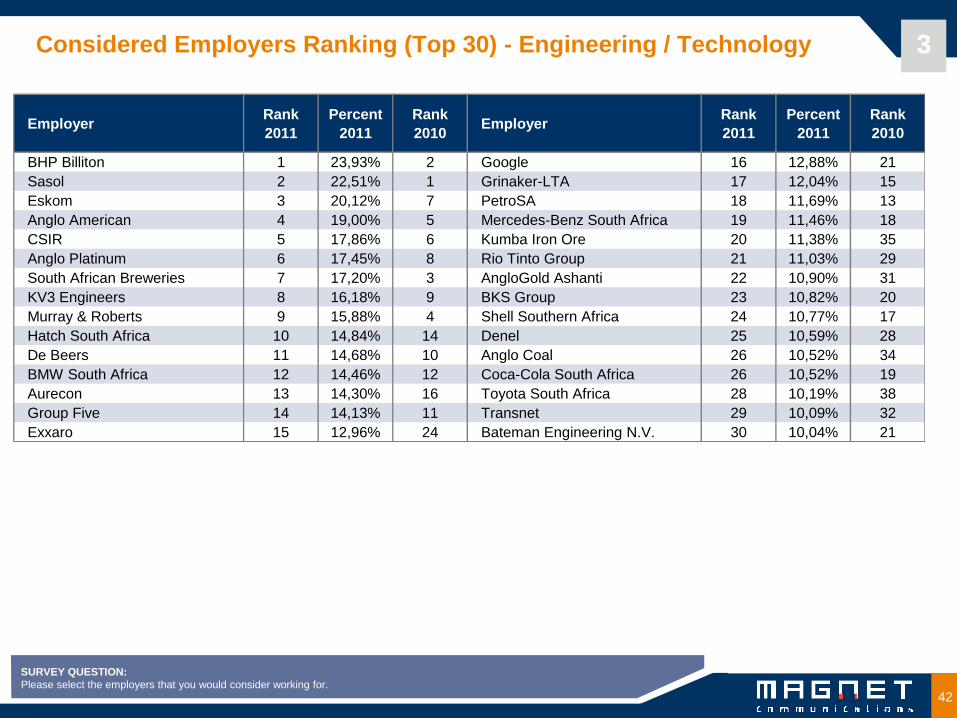
Considered Employers Ranking (Top 30) - Engineering / Technology 3
SURVEY QUESTION:
Please select the employers that you would consider working for.
EmployerRank
2011
Percent
2011
Rank
2010Employer
Rank
2011
Percent
2011
Rank
2010
BHP Billiton 1 23,93% 2 Google 16 12,88% 21
Sasol 2 22,51% 1 Grinaker-LTA 17 12,04% 15
Eskom 3 20,12% 7 PetroSA 18 11,69% 13
Anglo American 4 19,00% 5 Mercedes-Benz South Africa 19 11,46% 18
CSIR 5 17,86% 6 Kumba Iron Ore 20 11,38% 35
Anglo Platinum 6 17,45% 8 Rio Tinto Group 21 11,03% 29
South African Breweries 7 17,20% 3 AngloGold Ashanti 22 10,90% 31
KV3 Engineers 8 16,18% 9 BKS Group 23 10,82% 20
Murray & Roberts 9 15,88% 4 Shell Southern Africa 24 10,77% 17
Hatch South Africa 10 14,84% 14 Denel 25 10,59% 28
De Beers 11 14,68% 10 Anglo Coal 26 10,52% 34
BMW South Africa 12 14,46% 12 Coca-Cola South Africa 26 10,52% 19
Aurecon 13 14,30% 16 Toyota South Africa 28 10,19% 38
Group Five 14 14,13% 11 Transnet 29 10,09% 32
Exxaro 15 12,96% 24 Bateman Engineering N.V. 30 10,04% 21
43
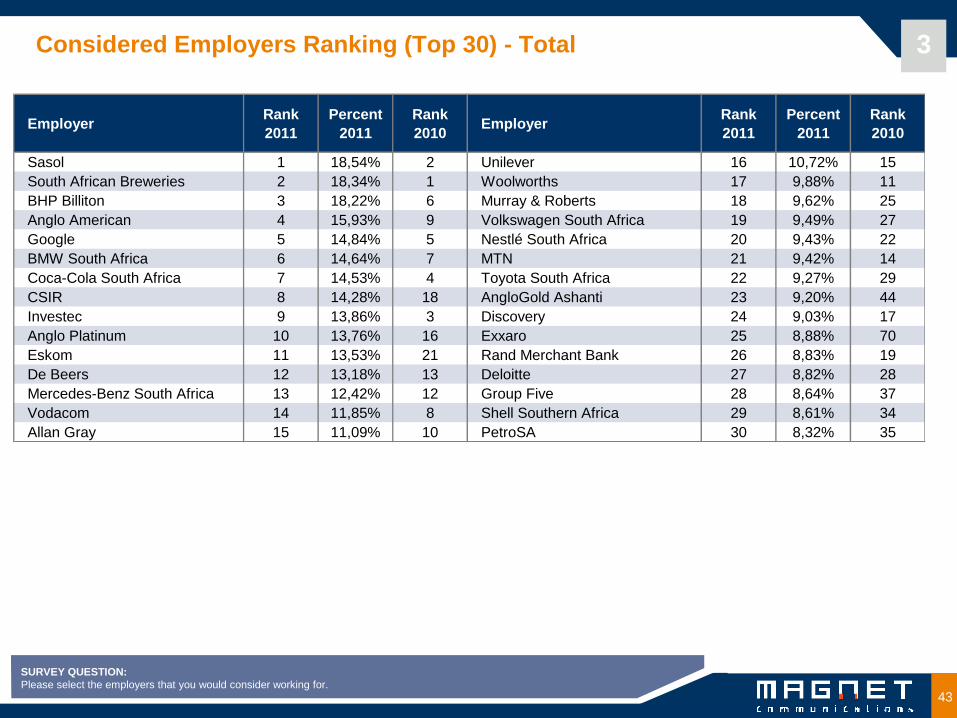
Considered Employers Ranking (Top 30) - Total 3
SURVEY QUESTION:
Please select the employers that you would consider working for.
EmployerRank
2011
Percent
2011
Rank
2010Employer
Rank
2011
Percent
2011
Rank
2010
Sasol 1 18,54% 2 Unilever 16 10,72% 15
South African Breweries 2 18,34% 1 Woolworths 17 9,88% 11
BHP Billiton 3 18,22% 6 Murray & Roberts 18 9,62% 25
Anglo American 4 15,93% 9 Volkswagen South Africa 19 9,49% 27
Google 5 14,84% 5 Nestlé South Africa 20 9,43% 22
BMW South Africa 6 14,64% 7 MTN 21 9,42% 14
Coca-Cola South Africa 7 14,53% 4 Toyota South Africa 22 9,27% 29
CSIR 8 14,28% 18 AngloGold Ashanti 23 9,20% 44
Investec 9 13,86% 3 Discovery 24 9,03% 17
Anglo Platinum 10 13,76% 16 Exxaro 25 8,88% 70
Eskom 11 13,53% 21 Rand Merchant Bank 26 8,83% 19
De Beers 12 13,18% 13 Deloitte 27 8,82% 28
Mercedes-Benz South Africa 13 12,42% 12 Group Five 28 8,64% 37
Vodacom 14 11,85% 8 Shell Southern Africa 29 8,61% 34
Allan Gray 15 11,09% 10 PetroSA 30 8,32% 35
44
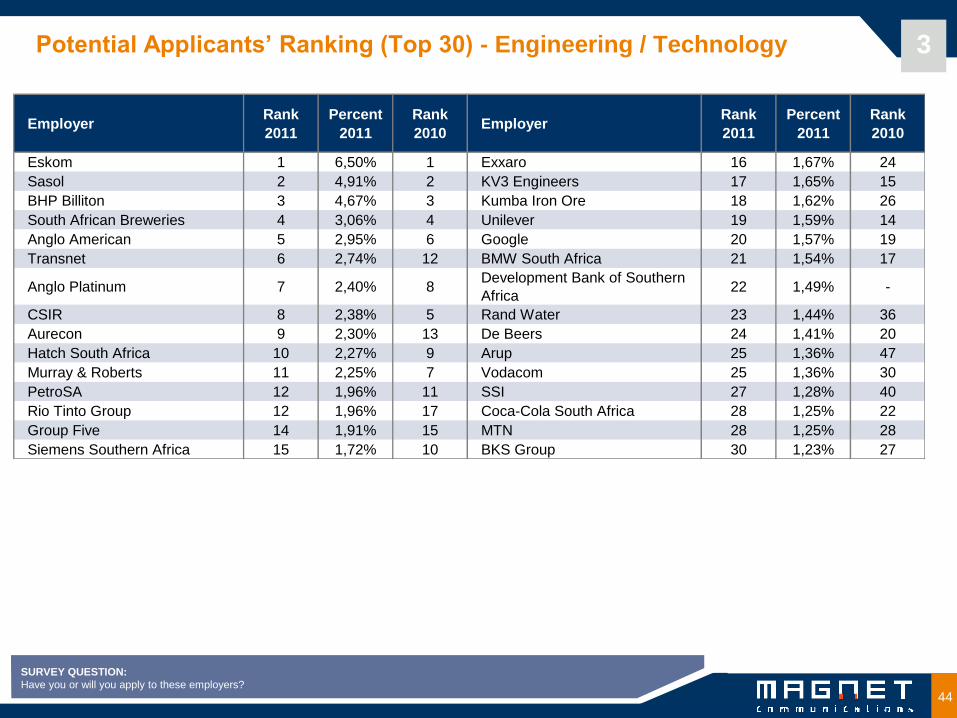
Potential Applicants’ Ranking (Top 30) - Engineering / Technology 3
SURVEY QUESTION:
Have you or will you apply to these employers?
EmployerRank
2011
Percent
2011
Rank
2010Employer
Rank
2011
Percent
2011
Rank
2010
Eskom 1 6,50% 1 Exxaro 16 1,67% 24
Sasol 2 4,91% 2 KV3 Engineers 17 1,65% 15
BHP Billiton 3 4,67% 3 Kumba Iron Ore 18 1,62% 26
South African Breweries 4 3,06% 4 Unilever 19 1,59% 14
Anglo American 5 2,95% 6 Google 20 1,57% 19
Transnet 6 2,74% 12 BMW South Africa 21 1,54% 17
Anglo Platinum 7 2,40% 8Development Bank of Southern
Africa22 1,49% -
CSIR 8 2,38% 5 Rand Water 23 1,44% 36
Aurecon 9 2,30% 13 De Beers 24 1,41% 20
Hatch South Africa 10 2,27% 9 Arup 25 1,36% 47
Murray & Roberts 11 2,25% 7 Vodacom 25 1,36% 30
PetroSA 12 1,96% 11 SSI 27 1,28% 40
Rio Tinto Group 12 1,96% 17 Coca-Cola South Africa 28 1,25% 22
Group Five 14 1,91% 15 MTN 28 1,25% 28
Siemens Southern Africa 15 1,72% 10 BKS Group 30 1,23% 27
45
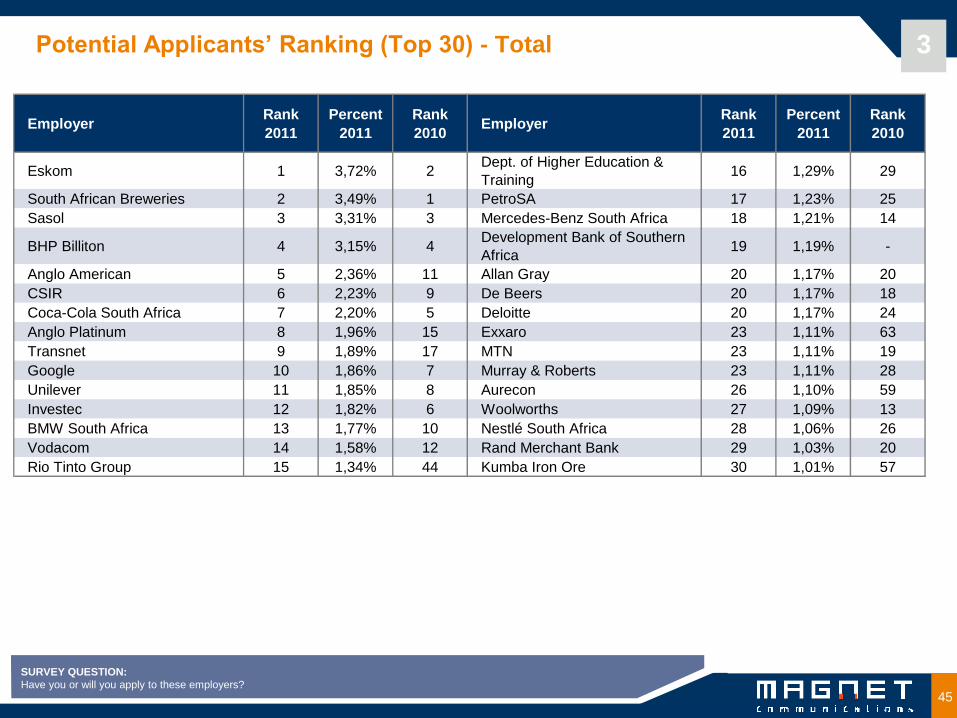
Potential Applicants’ Ranking (Top 30) - Total 3
SURVEY QUESTION:
Have you or will you apply to these employers?
EmployerRank
2011
Percent
2011
Rank
2010Employer
Rank
2011
Percent
2011
Rank
2010
Eskom 1 3,72% 2Dept. of Higher Education &
Training16 1,29% 29
South African Breweries 2 3,49% 1 PetroSA 17 1,23% 25
Sasol 3 3,31% 3 Mercedes-Benz South Africa 18 1,21% 14
BHP Billiton 4 3,15% 4Development Bank of Southern
Africa19 1,19% -
Anglo American 5 2,36% 11 Allan Gray 20 1,17% 20
CSIR 6 2,23% 9 De Beers 20 1,17% 18
Coca-Cola South Africa 7 2,20% 5 Deloitte 20 1,17% 24
Anglo Platinum 8 1,96% 15 Exxaro 23 1,11% 63
Transnet 9 1,89% 17 MTN 23 1,11% 19
Google 10 1,86% 7 Murray & Roberts 23 1,11% 28
Unilever 11 1,85% 8 Aurecon 26 1,10% 59
Investec 12 1,82% 6 Woolworths 27 1,09% 13
BMW South Africa 13 1,77% 10 Nestlé South Africa 28 1,06% 26
Vodacom 14 1,58% 12 Rand Merchant Bank 29 1,03% 20
Rio Tinto Group 15 1,34% 44 Kumba Iron Ore 30 1,01% 57
46
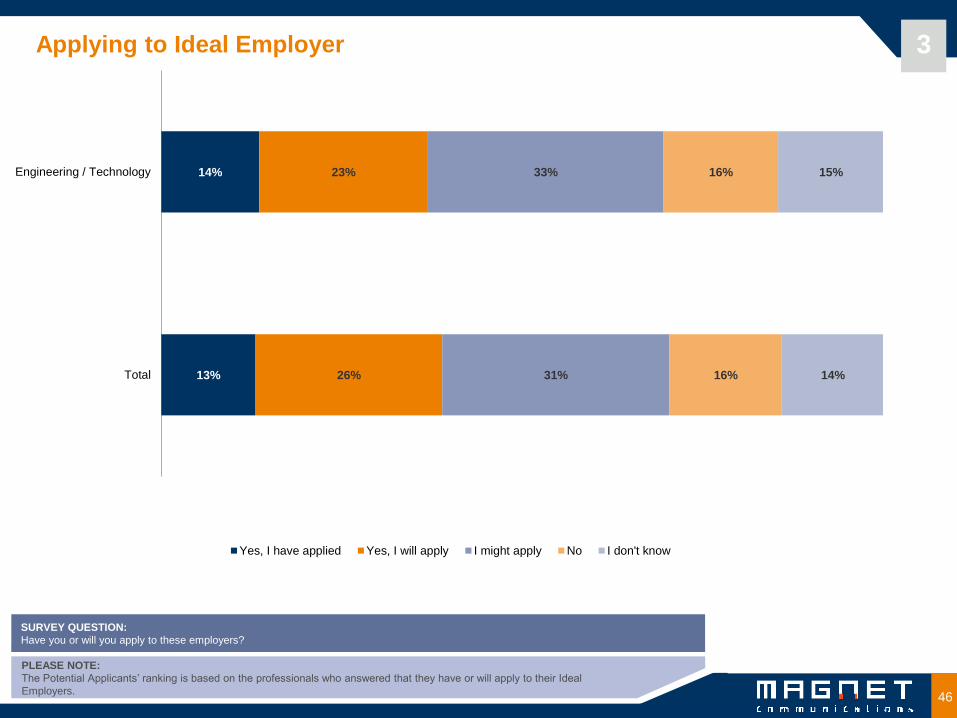
Applying to Ideal Employer
PLEASE NOTE:
The Potential Applicants‟ ranking is based on the professionals who answered that they have or will apply to their Ideal
Employers.
SURVEY QUESTION:
Have you or will you apply to these employers?
3
14%
13%
23%
26%
33%
31%
16%
16%
15%
14%
Engineering / Technology
Total
Yes, I have applied Yes, I will apply I might apply No I don't know
47
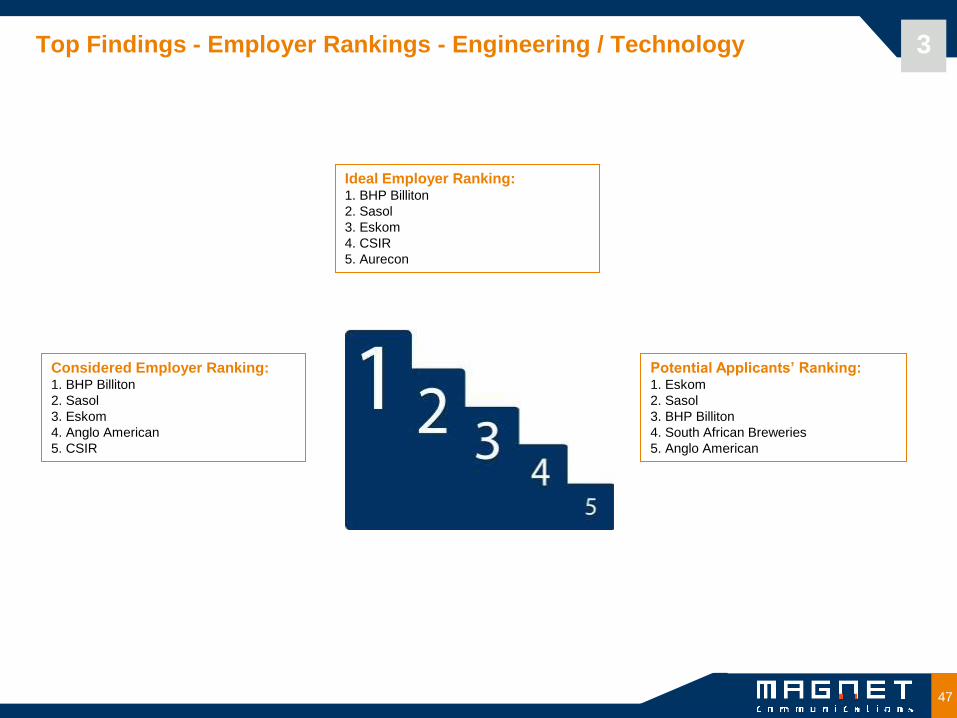
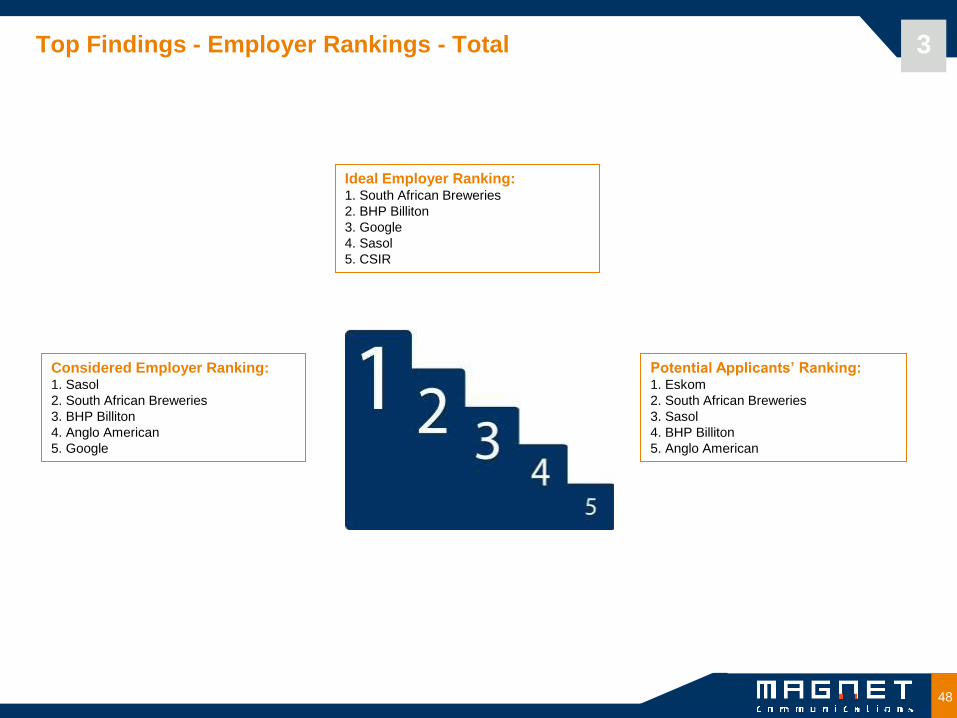
Top Findings - Employer Rankings - Engineering / Technology 3
Ideal Employer Ranking: 1. BHP Billiton
2. Sasol
3. Eskom
4. CSIR
5. Aurecon
Considered Employer Ranking: 1. BHP Billiton
2. Sasol
3. Eskom
4. Anglo American
5. CSIR
Potential Applicants’ Ranking: 1. Eskom
2. Sasol
3. BHP Billiton
4. South African Breweries
5. Anglo American
48
Top Findings - Employer Rankings - Total 3
Ideal Employer Ranking: 1. South African Breweries
2. BHP Billiton
3. Google
4. Sasol
5. CSIR
Considered Employer Ranking: 1. Sasol
2. South African Breweries
3. BHP Billiton
4. Anglo American
5. Google
Potential Applicants’ Ranking: 1. Eskom
2. South African Breweries
3. Sasol
4. BHP Billiton
5. Anglo American
49 49 Copyright Magnet 2010
Magnet Professional Survey 2011
Engineering/Technology vs. Total
All Professionals - South African Edition
Copyright Magnet 2011
Professionals’ Career & Communication Preferences
4 Target Report
50
Professionals’ career & communication preferences
Think about:
• Which industries are most popular amongst the targeted professionals? Is your industry an issue for your attractiveness?
• What are the professionals’ career goals? Can you provide them with the opportunity to achieve these goals? Is this communicated to
them?
• What do professionals want in their compensation package and how does this compare to what they actually have?
• How interested are professionals in changing employers, how frequently have they applied for another job? Have they applied for
jobs internally or externally and what were their main reasons for this?
4
Topics:
• Preferred Industries
• Preferred Departments
• Career Goals
• Salary
• Compensation Package
• Mobility & Retention
• Preferred & Actual Communication Channels
• Publications & Websites
• Social networks / communities
51
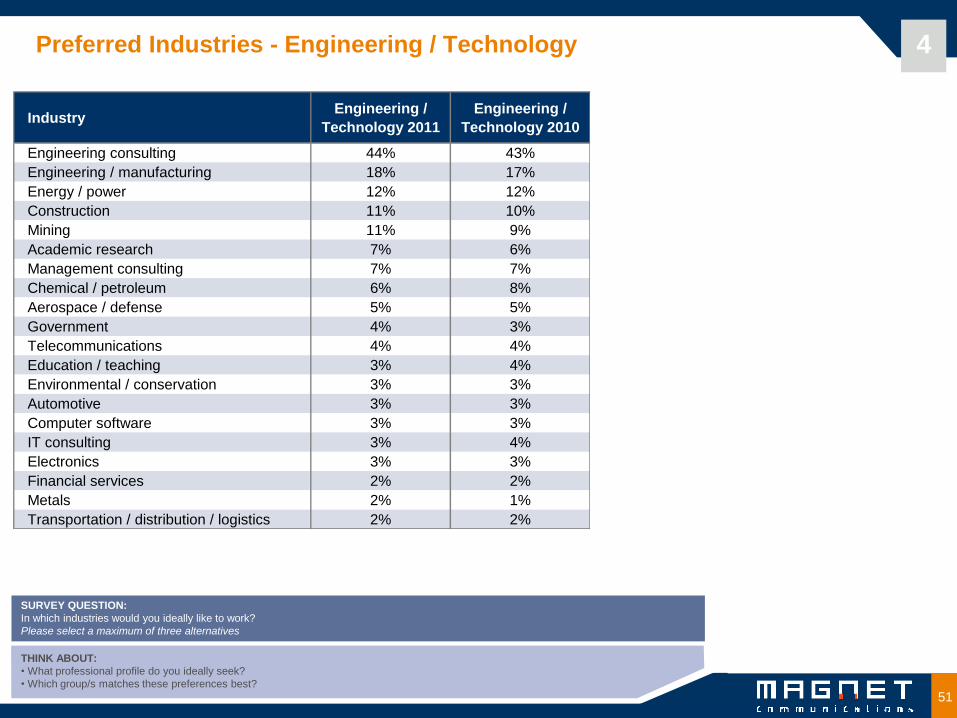
Preferred Industries - Engineering / Technology 4
THINK ABOUT:
• What professional profile do you ideally seek?
• Which group/s matches these preferences best?
SURVEY QUESTION:
In which industries would you ideally like to work?
Please select a maximum of three alternatives
IndustryEngineering /
Technology 2011
Engineering /
Technology 2010
Engineering consulting 44% 43%
Engineering / manufacturing 18% 17%
Energy / power 12% 12%
Construction 11% 10%
Mining 11% 9%
Academic research 7% 6%
Management consulting 7% 7%
Chemical / petroleum 6% 8%
Aerospace / defense 5% 5%
Government 4% 3%
Telecommunications 4% 4%
Education / teaching 3% 4%
Environmental / conservation 3% 3%
Automotive 3% 3%
Computer software 3% 3%
IT consulting 3% 4%
Electronics 3% 3%
Financial services 2% 2%
Metals 2% 1%
Transportation / distribution / logistics 2% 2%

52
Preferred Industries - Total 4
THINK ABOUT:
• What professional profile do you ideally seek?
• Which group/s matches these preferences best?
SURVEY QUESTION:
In which industries would you ideally like to work?
Please select a maximum of three alternatives
Industry Total 2011 Total 2010
Engineering consulting 18% 14%
Academic research 12% 10%
Education / teaching 9% 9%
Financial services 8% 9%
Engineering / manufacturing 8% 7%
Management consulting 8% 8%
Mining 8% 5%
Energy / power 6% 5%
Healthcare 6% 6%
Environmental / conservation 6% 4%
Construction 5% 4%
Government 5% 5%
Agricultural 4% 3%
Marketing / advertising 4% 4%
Chemical / petroleum 3% 4%
Investment management 3% 4%
Auditing / accounting / taxation (corporate) 3% 5%
Investment banking 3% 4%
Entertainment / media / public relations 3% 4%
Hotel / restaurant / tourism / hospitality 3% 4%
53
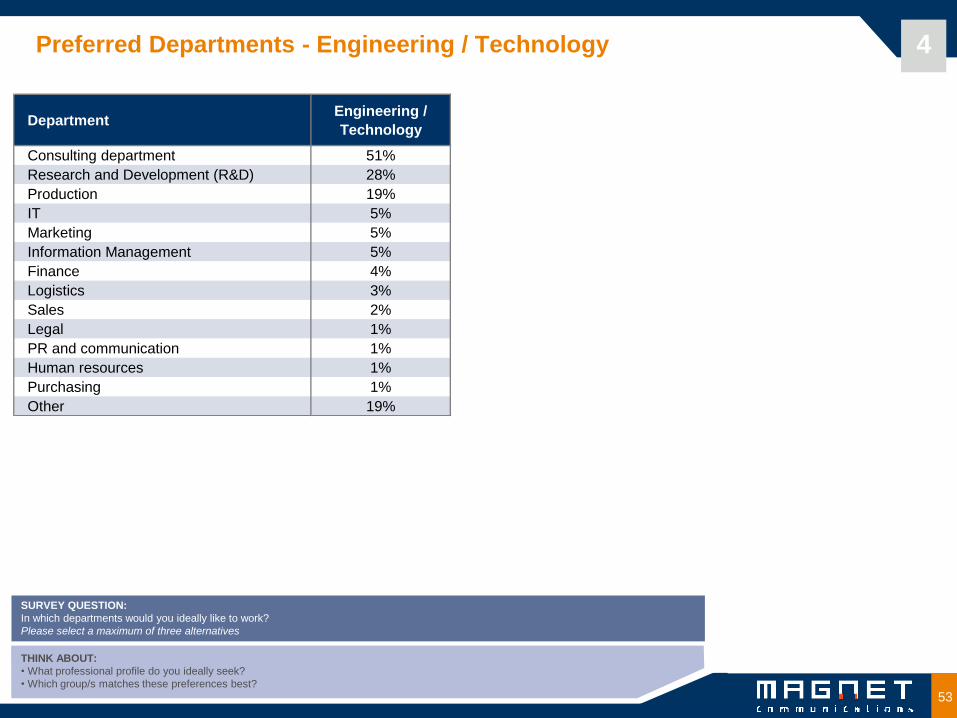
Preferred Departments - Engineering / Technology 4
THINK ABOUT:
• What professional profile do you ideally seek?
• Which group/s matches these preferences best?
SURVEY QUESTION:
In which departments would you ideally like to work?
Please select a maximum of three alternatives
DepartmentEngineering /
Technology
Consulting department 51%
Research and Development (R&D) 28%
Production 19%
IT 5%
Marketing 5%
Information Management 5%
Finance 4%
Logistics 3%
Sales 2%
Legal 1%
PR and communication 1%
Human resources 1%
Purchasing 1%
Other 19%
54
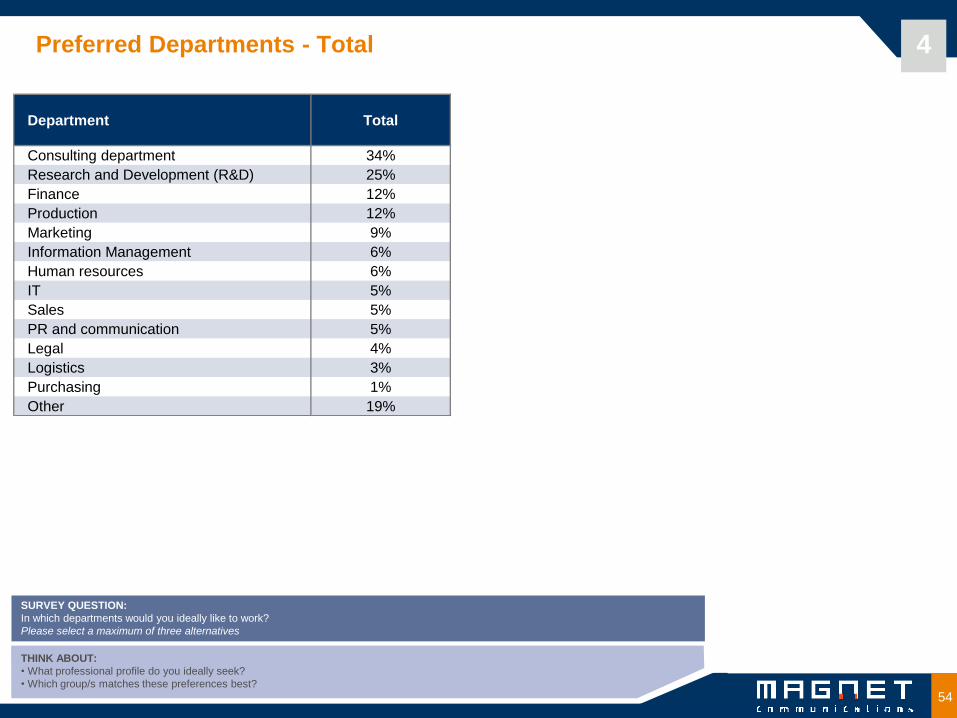
Preferred Departments - Total 4
THINK ABOUT:
• What professional profile do you ideally seek?
• Which group/s matches these preferences best?
SURVEY QUESTION:
In which departments would you ideally like to work?
Please select a maximum of three alternatives
Department Total
Consulting department 34%
Research and Development (R&D) 25%
Finance 12%
Production 12%
Marketing 9%
Information Management 6%
Human resources 6%
IT 5%
Sales 5%
PR and communication 5%
Legal 4%
Logistics 3%
Purchasing 1%
Other 19%
55
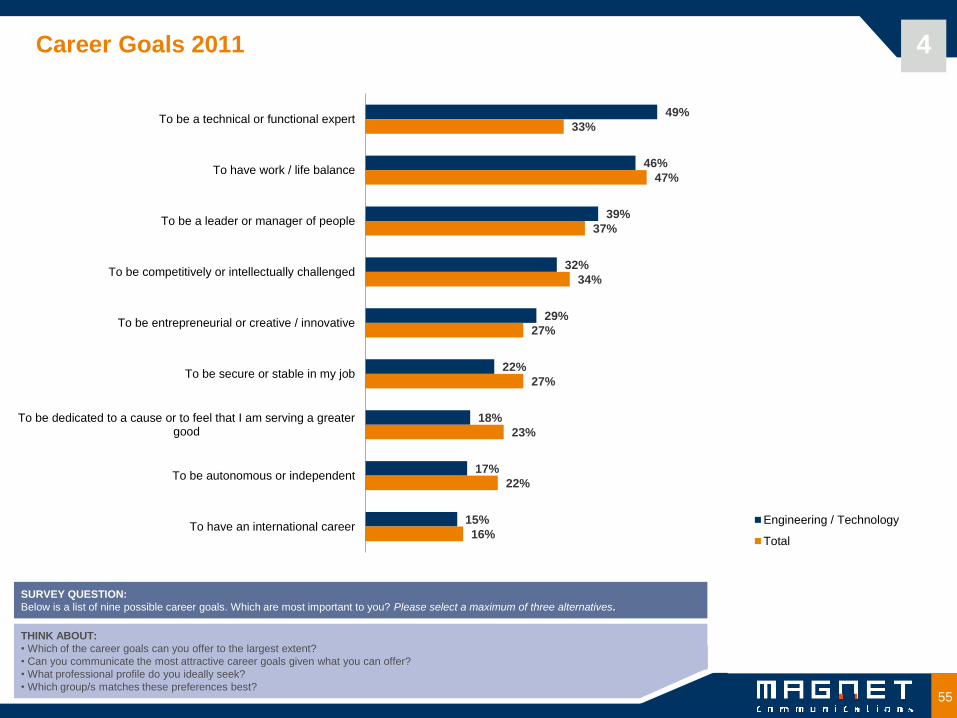
Career Goals 2011 4
SURVEY QUESTION:
Below is a list of nine possible career goals. Which are most important to you? Please select a maximum of three alternatives
THINK ABOUT:
• Which of the career goals can you offer to the largest extent?
• Can you communicate the most attractive career goals given what you can offer?
• What professional profile do you ideally seek?
• Which group/s matches these preferences best?
SURVEY QUESTION:
Below is a list of nine possible career goals. Which are most important to you? Please select a maximum of three alternatives.
49%
46%
39%
32%
29%
22%
18%
17%
15%
33%
47%
37%
34%
27%
27%
23%
22%
16%
To be a technical or functional expert
To have work / life balance
To be a leader or manager of people
To be competitively or intellectually challenged
To be entrepreneurial or creative / innovative
To be secure or stable in my job
To be dedicated to a cause or to feel that I am serving a greatergood
To be autonomous or independent
To have an international careerEngineering / Technology
Total

56
Career Goals 2010
SURVEY QUESTION:
Below is a list of nine possible career goals. Which are most important to you? Please select a maximum of three alternatives.
THINK ABOUT:
• Which of the career goals can you offer to the largest extent?
• Can you communicate the most attractive career goals given what you can offer?
• What professional profile do you ideally seek?
• Which group/s matches these preferences best?
4
49%
47%
37%
33%
28%
21%
17%
16%
16%
53%
28%
37%
36%
25%
26%
17%
20%
22%
To have work / life balance
To be a technical or functional expert
To be a leader or manager of people
To be competitively or intellectually challenged
To be entrepreneurial or creative / innovative
To be secure or stable in my job
To have an international career
To be autonomous or independent
To be dedicated to a cause or to feel that I am serving a greatergood
Engineering / Technology
Total
57
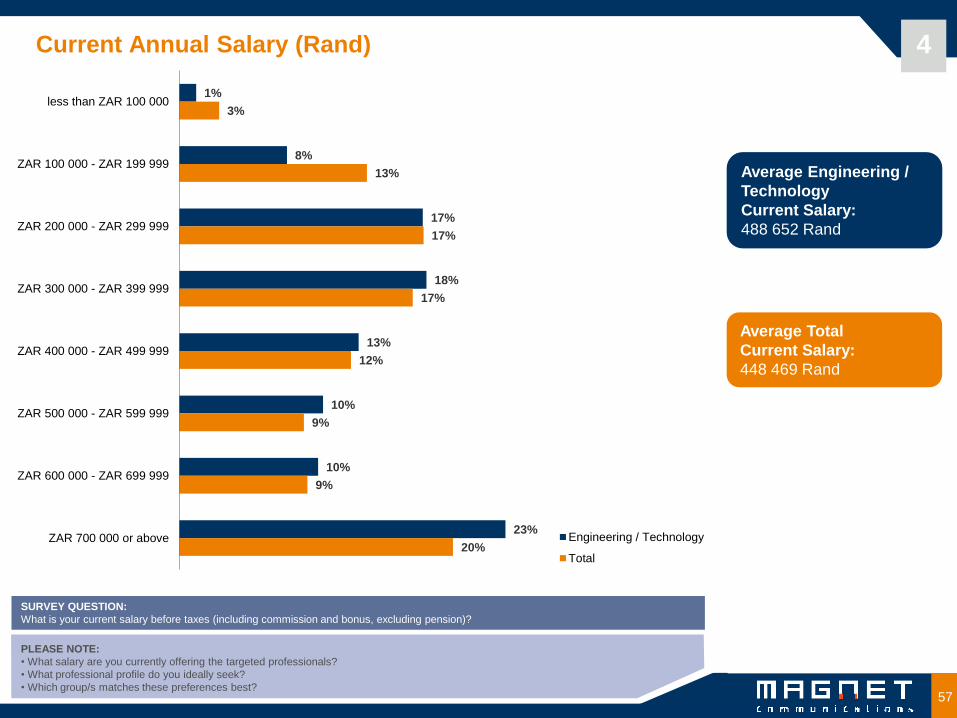
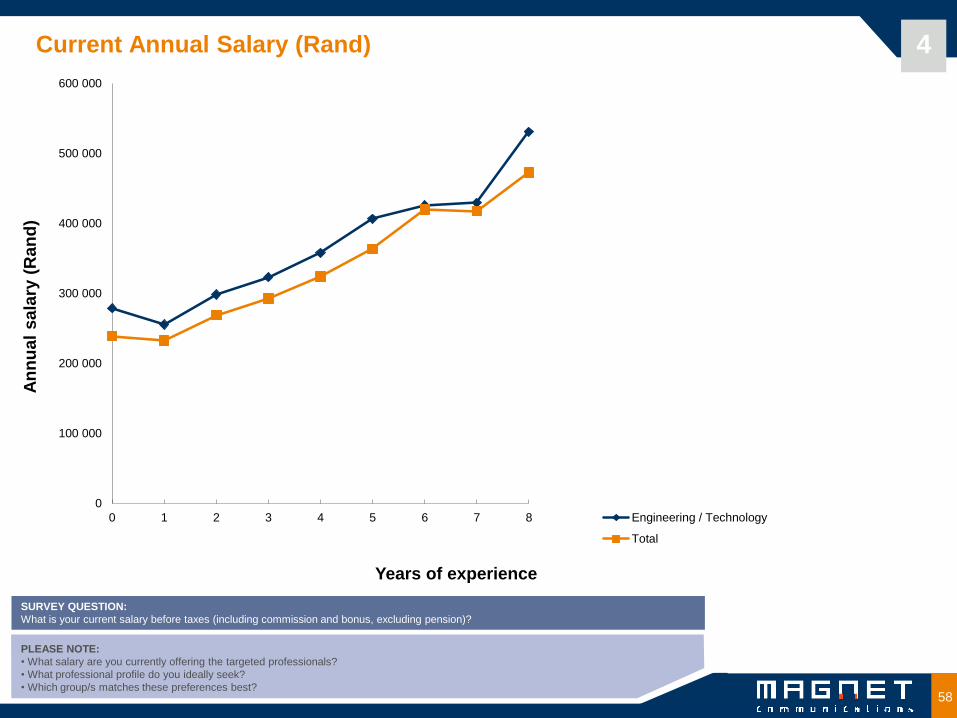
Current Annual Salary (Rand) 4
PLEASE NOTE:
• What salary are you currently offering the targeted professionals?
• What professional profile do you ideally seek?
• Which group/s matches these preferences best?
SURVEY QUESTION:
What is your current salary before taxes (including commission and bonus, excluding pension)?
Average Engineering /
Technology
Current Salary:
488 652 Rand
Average Total
Current Salary:
448 469 Rand
1%
8%
17%
18%
13%
10%
10%
23%
3%
13%
17%
17%
12%
9%
9%
20%
less than ZAR 100 000
ZAR 100 000 - ZAR 199 999
ZAR 200 000 - ZAR 299 999
ZAR 300 000 - ZAR 399 999
ZAR 400 000 - ZAR 499 999
ZAR 500 000 - ZAR 599 999
ZAR 600 000 - ZAR 699 999
ZAR 700 000 or above Engineering / Technology
Total
58
Current Annual Salary (Rand) 4
PLEASE NOTE:
• What salary are you currently offering the targeted professionals?
• What professional profile do you ideally seek?
• Which group/s matches these preferences best?
SURVEY QUESTION:
What is your current salary before taxes (including commission and bonus, excluding pension)?
An
nu
al
sala
ry (
Ran
d)
Years of experience
0
100 000
200 000
300 000
400 000
500 000
600 000
0 1 2 3 4 5 6 7 8 Engineering / Technology
Total
59
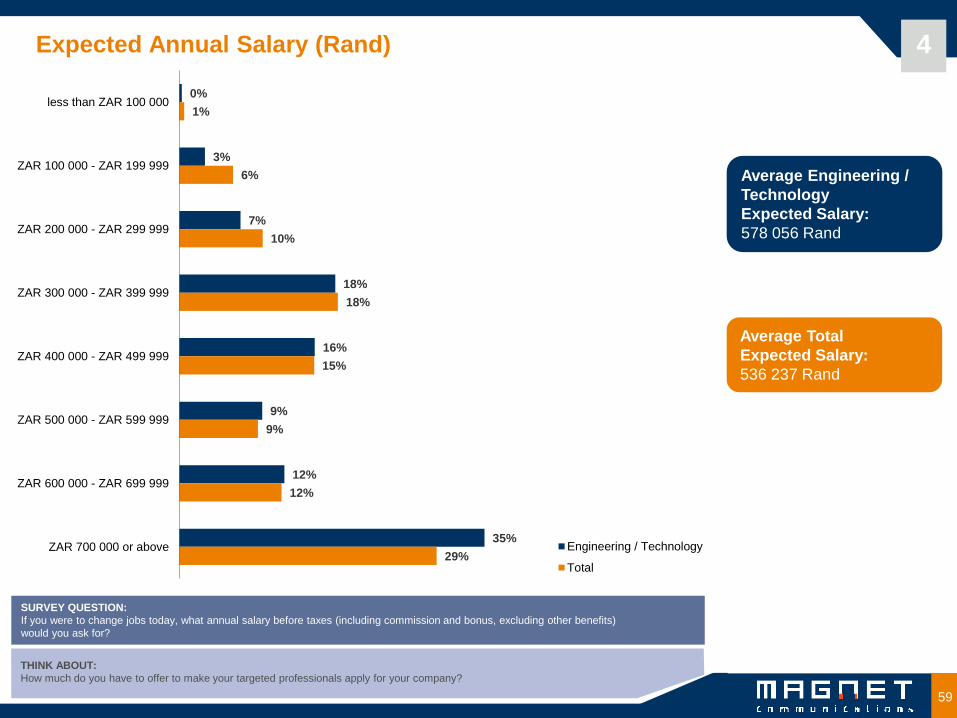
Expected Annual Salary (Rand)
SURVEY QUESTION:
If you were to change jobs today, what annual salary before taxes (including commission and bonus, excluding other benefits)
would you ask for?
THINK ABOUT:
How much do you have to offer to make your targeted professionals apply for your company?
4
Average Engineering /
Technology
Expected Salary:
578 056 Rand
Average Total
Expected Salary:
536 237 Rand
0%
3%
7%
18%
16%
9%
12%
35%
1%
6%
10%
18%
15%
9%
12%
29%
less than ZAR 100 000
ZAR 100 000 - ZAR 199 999
ZAR 200 000 - ZAR 299 999
ZAR 300 000 - ZAR 399 999
ZAR 400 000 - ZAR 499 999
ZAR 500 000 - ZAR 599 999
ZAR 600 000 - ZAR 699 999
ZAR 700 000 or above Engineering / Technology
Total

60
Expected Annual Salary (Rand) 4
SURVEY QUESTION:
If you were to change jobs today, what annual salary before taxes (including commission and bonus, excluding other benefits)
would you ask for?
THINK ABOUT:
How much do you have to offer to make your targeted professionals apply for your company?
An
nu
al
sala
ry (
Ran
d)
Years of experience
0
100 000
200 000
300 000
400 000
500 000
600 000
700 000
0 1 2 3 4 5 6 7 8 Engineering / Technology
Total
61
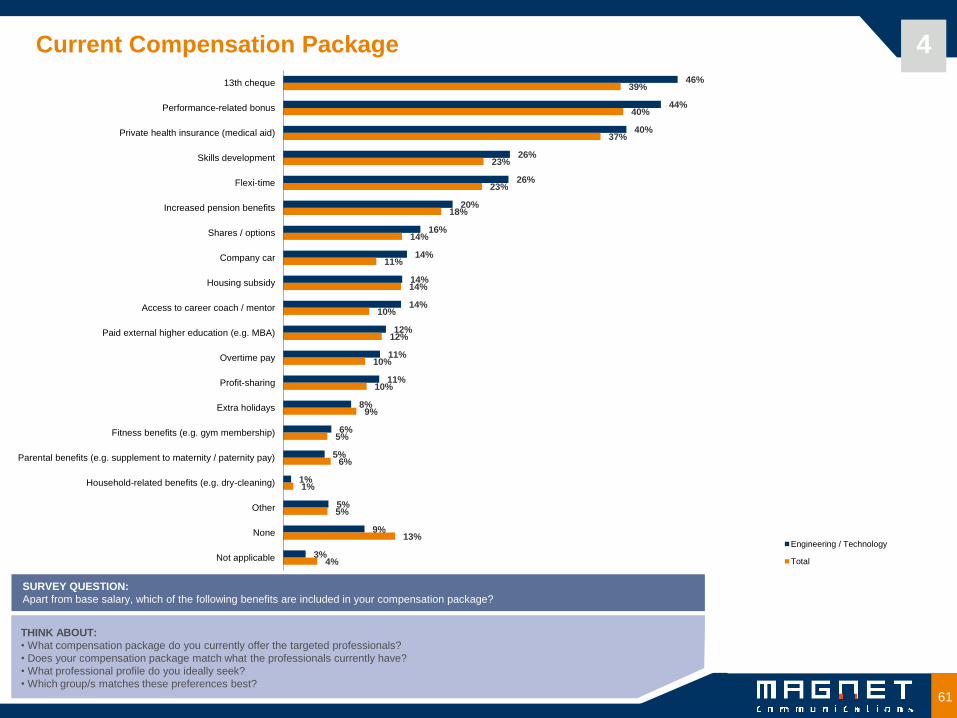
Current Compensation Package 4
THINK ABOUT:
• What compensation package do you currently offer the targeted professionals?
• Does your compensation package match what the professionals currently have?
• What professional profile do you ideally seek?
• Which group/s matches these preferences best?
SURVEY QUESTION:
Apart from base salary, which of the following benefits are included in your compensation package?
46%
44%
40%
26%
26%
20%
16%
14%
14%
14%
12%
11%
11%
8%
6%
5%
1%
5%
9%
3%
39%
40%
37%
23%
23%
18%
14%
11%
14%
10%
12%
10%
10%
9%
5%
6%
1%
5%
13%
4%
13th cheque
Performance-related bonus
Private health insurance (medical aid)
Skills development
Flexi-time
Increased pension benefits
Shares / options
Company car
Housing subsidy
Access to career coach / mentor
Paid external higher education (e.g. MBA)
Overtime pay
Profit-sharing
Extra holidays
Fitness benefits (e.g. gym membership)
Parental benefits (e.g. supplement to maternity / paternity pay)
Household-related benefits (e.g. dry-cleaning)
Other
None
Not applicable
Engineering / Technology
Total
62
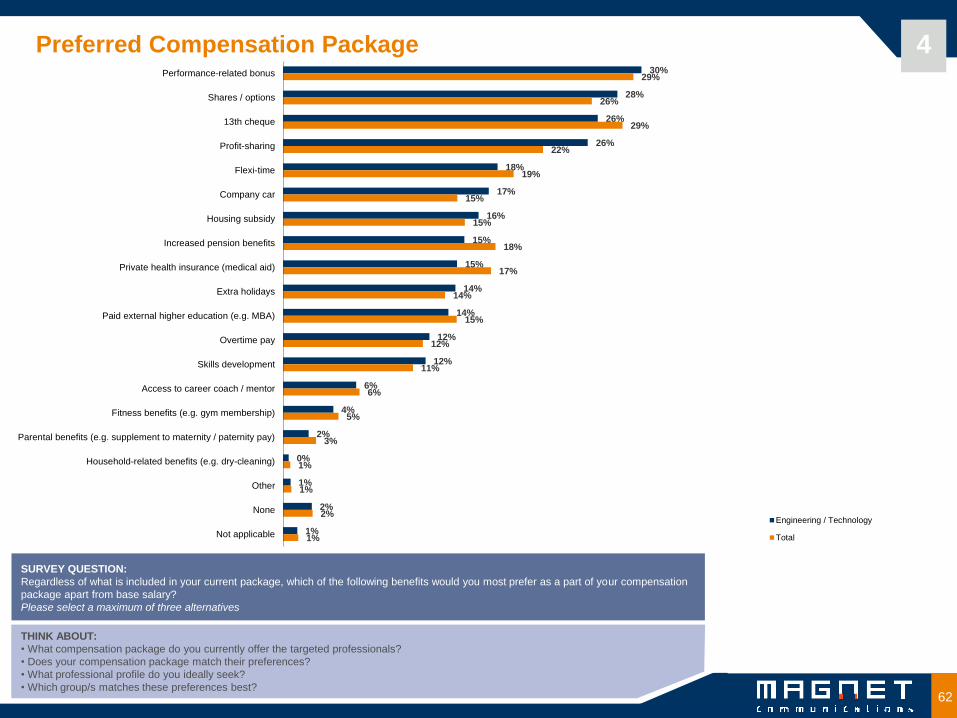
Preferred Compensation Package 4
SURVEY QUESTION:
Regardless of what is included in your current package, which of the following benefits would you most prefer as a part of your compensation
package apart from base salary?
Please select a maximum of three alternatives
THINK ABOUT:
• What compensation package do you currently offer the targeted professionals?
• Does your compensation package match their preferences?
• What professional profile do you ideally seek?
• Which group/s matches these preferences best?
30%
28%
26%
26%
18%
17%
16%
15%
15%
14%
14%
12%
12%
6%
4%
2%
0%
1%
2%
1%
29%
26%
29%
22%
19%
15%
15%
18%
17%
14%
15%
12%
11%
6%
5%
3%
1%
1%
2%
1%
Performance-related bonus
Shares / options
13th cheque
Profit-sharing
Flexi-time
Company car
Housing subsidy
Increased pension benefits
Private health insurance (medical aid)
Extra holidays
Paid external higher education (e.g. MBA)
Overtime pay
Skills development
Access to career coach / mentor
Fitness benefits (e.g. gym membership)
Parental benefits (e.g. supplement to maternity / paternity pay)
Household-related benefits (e.g. dry-cleaning)
Other
None
Not applicable
Engineering / Technology
Total
63
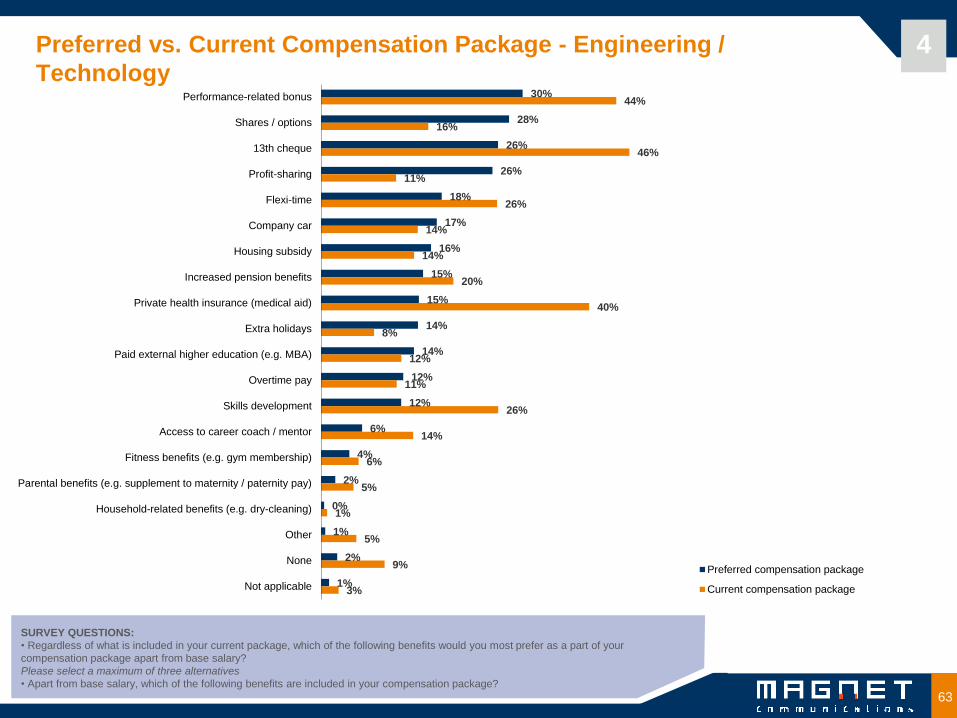
Preferred vs. Current Compensation Package - Engineering /
Technology 4
SURVEY QUESTIONS:
• Regardless of what is included in your current package, which of the following benefits would you most prefer as a part of your
compensation package apart from base salary?
Please select a maximum of three alternatives
• Apart from base salary, which of the following benefits are included in your compensation package?
30%
28%
26%
26%
18%
17%
16%
15%
15%
14%
14%
12%
12%
6%
4%
2%
0%
1%
2%
1%
44%
16%
46%
11%
26%
14%
14%
20%
40%
8%
12%
11%
26%
14%
6%
5%
1%
5%
9%
3%
Performance-related bonus
Shares / options
13th cheque
Profit-sharing
Flexi-time
Company car
Housing subsidy
Increased pension benefits
Private health insurance (medical aid)
Extra holidays
Paid external higher education (e.g. MBA)
Overtime pay
Skills development
Access to career coach / mentor
Fitness benefits (e.g. gym membership)
Parental benefits (e.g. supplement to maternity / paternity pay)
Household-related benefits (e.g. dry-cleaning)
Other
None
Not applicable
Preferred compensation package
Current compensation package
64
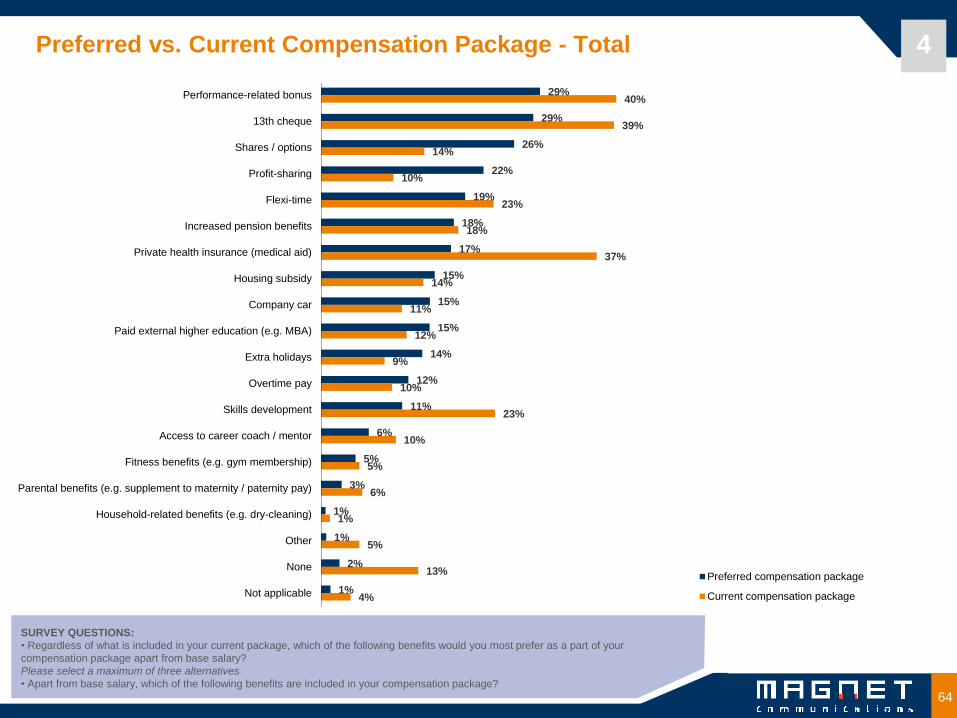
Preferred vs. Current Compensation Package - Total 4
SURVEY QUESTIONS:
• Regardless of what is included in your current package, which of the following benefits would you most prefer as a part of your
compensation package apart from base salary?
Please select a maximum of three alternatives
• Apart from base salary, which of the following benefits are included in your compensation package?
29%
29%
26%
22%
19%
18%
17%
15%
15%
15%
14%
12%
11%
6%
5%
3%
1%
1%
2%
1%
40%
39%
14%
10%
23%
18%
37%
14%
11%
12%
9%
10%
23%
10%
5%
6%
1%
5%
13%
4%
Performance-related bonus
13th cheque
Shares / options
Profit-sharing
Flexi-time
Increased pension benefits
Private health insurance (medical aid)
Housing subsidy
Company car
Paid external higher education (e.g. MBA)
Extra holidays
Overtime pay
Skills development
Access to career coach / mentor
Fitness benefits (e.g. gym membership)
Parental benefits (e.g. supplement to maternity / paternity pay)
Household-related benefits (e.g. dry-cleaning)
Other
None
Not applicable
Preferred compensation package
Current compensation package
65
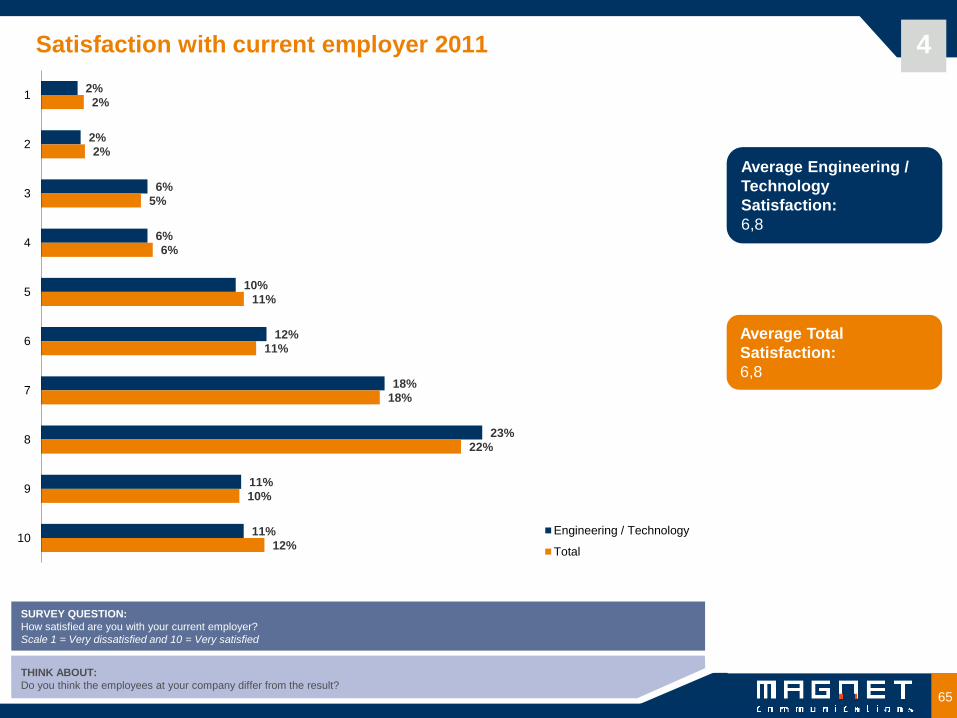
Satisfaction with current employer 2011
SURVEY QUESTION:
How satisfied are you with your current employer?
Scale 1 = Very dissatisfied and 10 = Very satisfied
THINK ABOUT:
Do you think the employees at your company differ from the result?
4
Average Engineering /
Technology
Satisfaction:
6,8
Average Total
Satisfaction:
6,8
2%
2%
6%
6%
10%
12%
18%
23%
11%
11%
2%
2%
5%
6%
11%
11%
18%
22%
10%
12%
1
2
3
4
5
6
7
8
9
10Engineering / Technology
Total
66
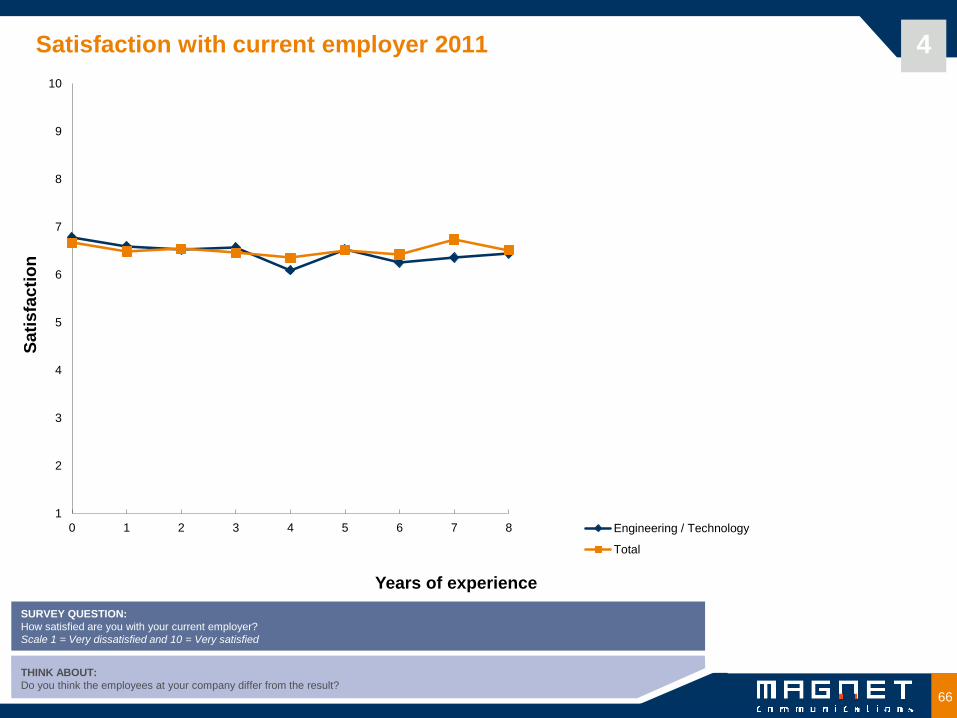
Satisfaction with current employer 2011
SURVEY QUESTION:
How satisfied are you with your current employer?
Scale 1 = Very dissatisfied and 10 = Very satisfied
THINK ABOUT:
Do you think the employees at your company differ from the result?
4 S
ati
sfa
cti
on
Years of experience
1
2
3
4
5
6
7
8
9
10
0 1 2 3 4 5 6 7 8 Engineering / Technology
Total
67
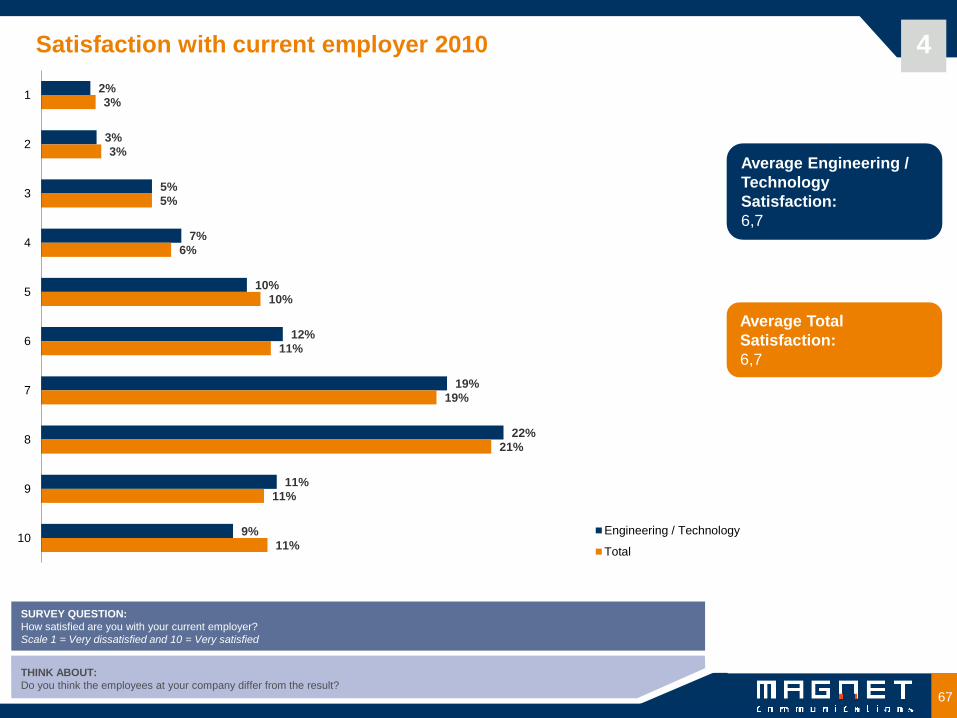
Satisfaction with current employer 2010
SURVEY QUESTION:
How satisfied are you with your current employer?
Scale 1 = Very dissatisfied and 10 = Very satisfied
THINK ABOUT:
Do you think the employees at your company differ from the result?
4
Average Engineering /
Technology
Satisfaction:
6,7
Average Total
Satisfaction:
6,7
2%
3%
5%
7%
10%
12%
19%
22%
11%
9%
3%
3%
5%
6%
10%
11%
19%
21%
11%
11%
1
2
3
4
5
6
7
8
9
10Engineering / Technology
Total
68
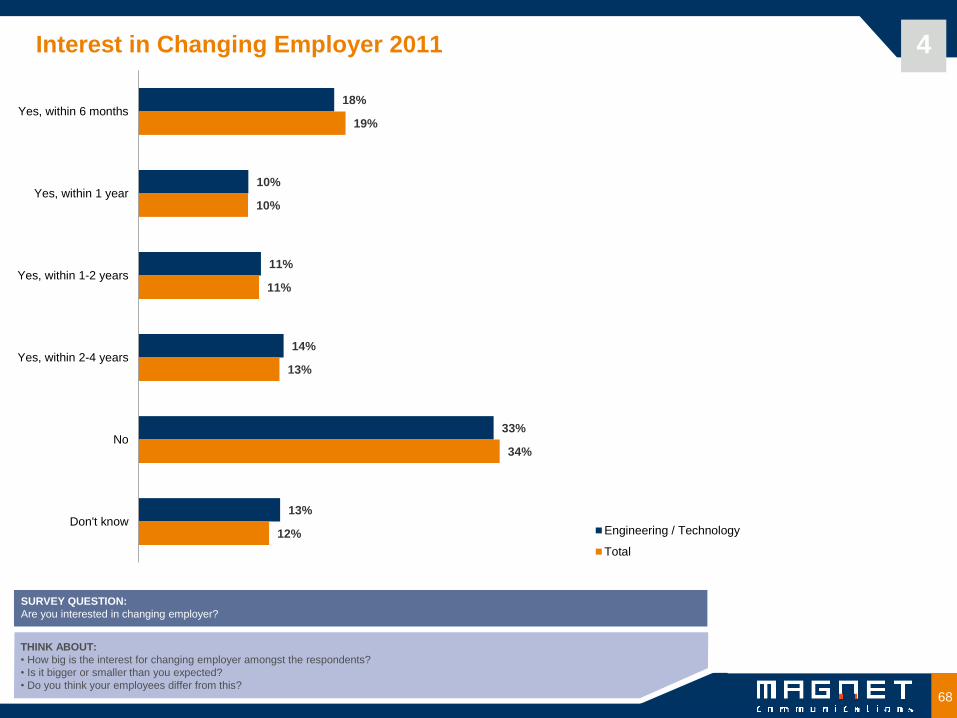
Interest in Changing Employer 2011 4
SURVEY QUESTION:
Are you interested in changing employer?
THINK ABOUT:
• How big is the interest for changing employer amongst the respondents?
• Is it bigger or smaller than you expected?
• Do you think your employees differ from this?
18%
10%
11%
14%
33%
13%
19%
10%
11%
13%
34%
12%
Yes, within 6 months
Yes, within 1 year
Yes, within 1-2 years
Yes, within 2-4 years
No
Don't knowEngineering / Technology
Total
69
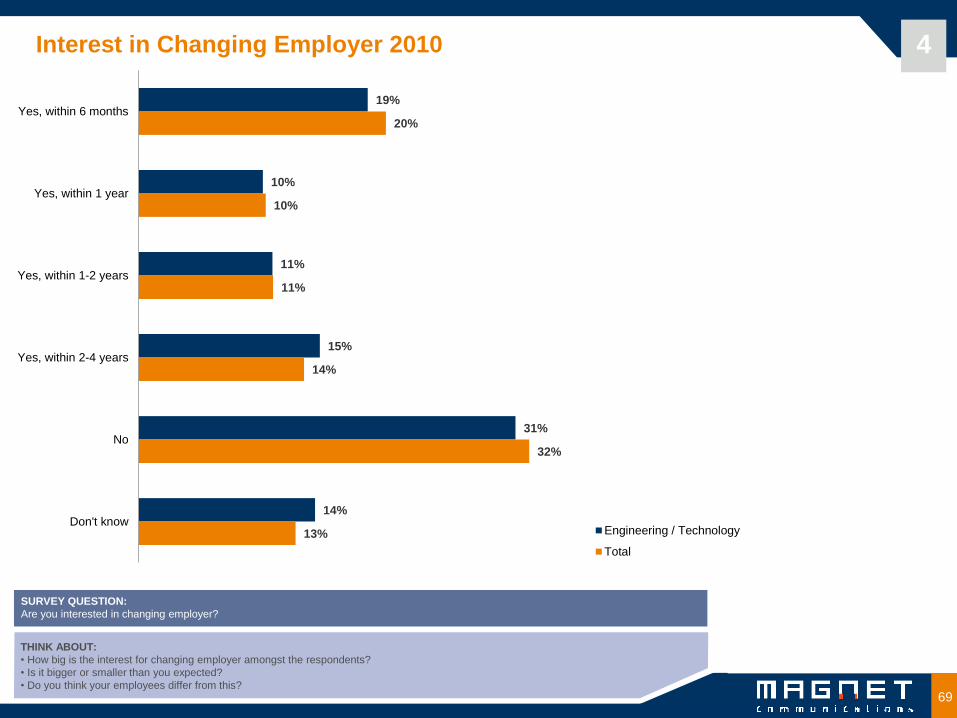
Interest in Changing Employer 2010 4
SURVEY QUESTION:
Are you interested in changing employer?
THINK ABOUT:
• How big is the interest for changing employer amongst the respondents?
• Is it bigger or smaller than you expected?
• Do you think your employees differ from this?
19%
10%
11%
15%
31%
14%
20%
10%
11%
14%
32%
13%
Yes, within 6 months
Yes, within 1 year
Yes, within 1-2 years
Yes, within 2-4 years
No
Don't knowEngineering / Technology
Total
70
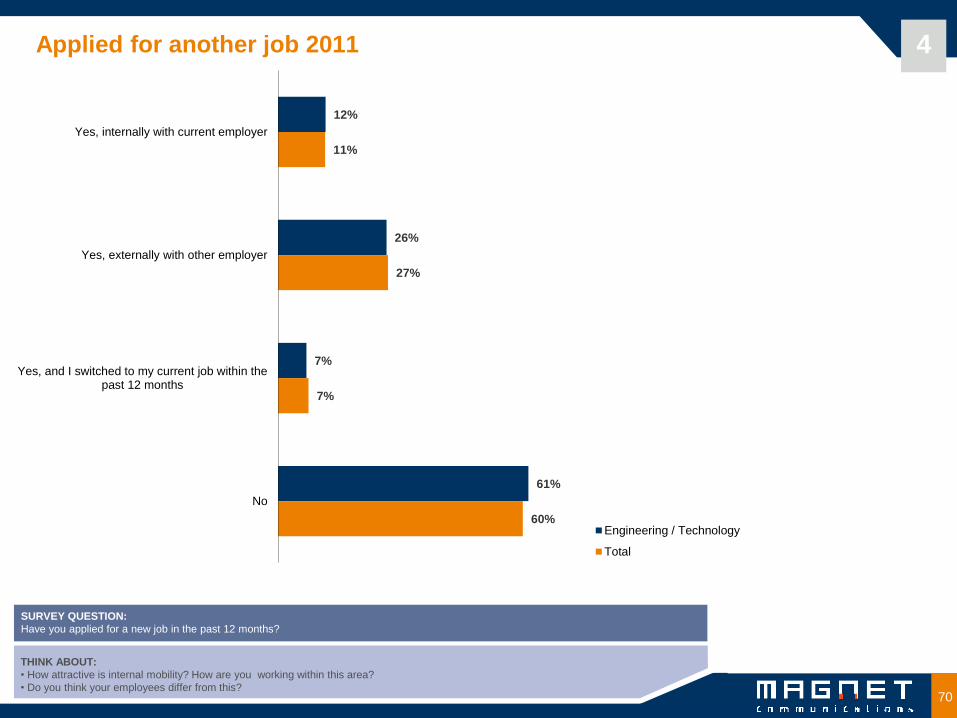
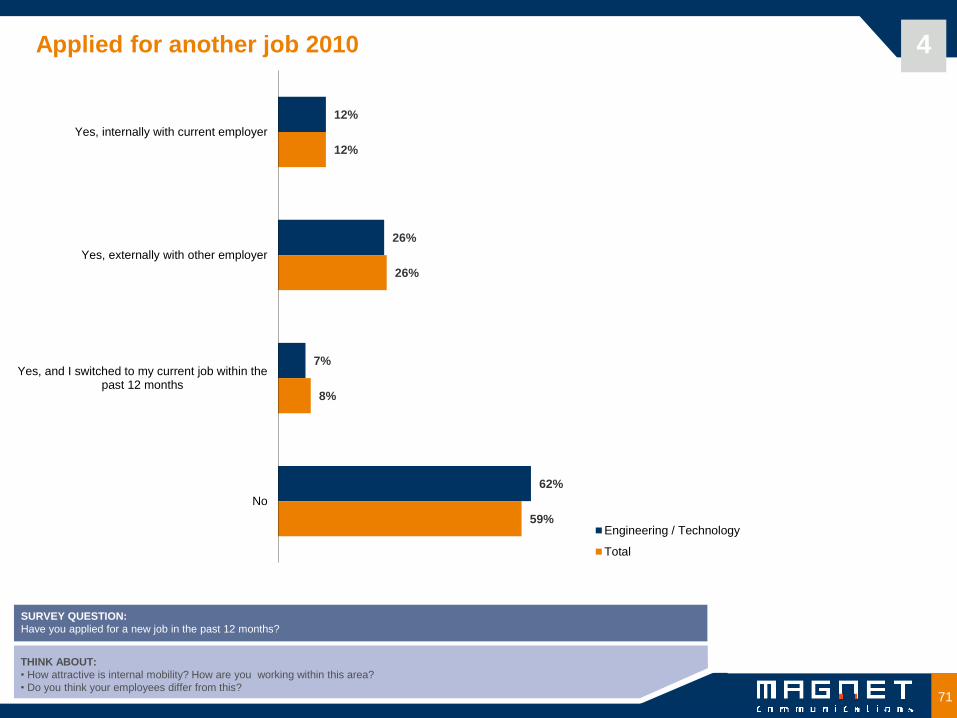
Applied for another job 2011 4
SURVEY QUESTION:
Have you applied for a new job in the past 12 months?
THINK ABOUT:
• How attractive is internal mobility? How are you working within this area?
• Do you think your employees differ from this?
12%
26%
7%
61%
11%
27%
7%
60%
Yes, internally with current employer
Yes, externally with other employer
Yes, and I switched to my current job within thepast 12 months
No
Engineering / Technology
Total
71
Applied for another job 2010 4
SURVEY QUESTION:
Have you applied for a new job in the past 12 months?
THINK ABOUT:
• How attractive is internal mobility? How are you working within this area?
• Do you think your employees differ from this?
12%
26%
7%
62%
12%
26%
8%
59%
Yes, internally with current employer
Yes, externally with other employer
Yes, and I switched to my current job within thepast 12 months
No
Engineering / Technology
Total
72
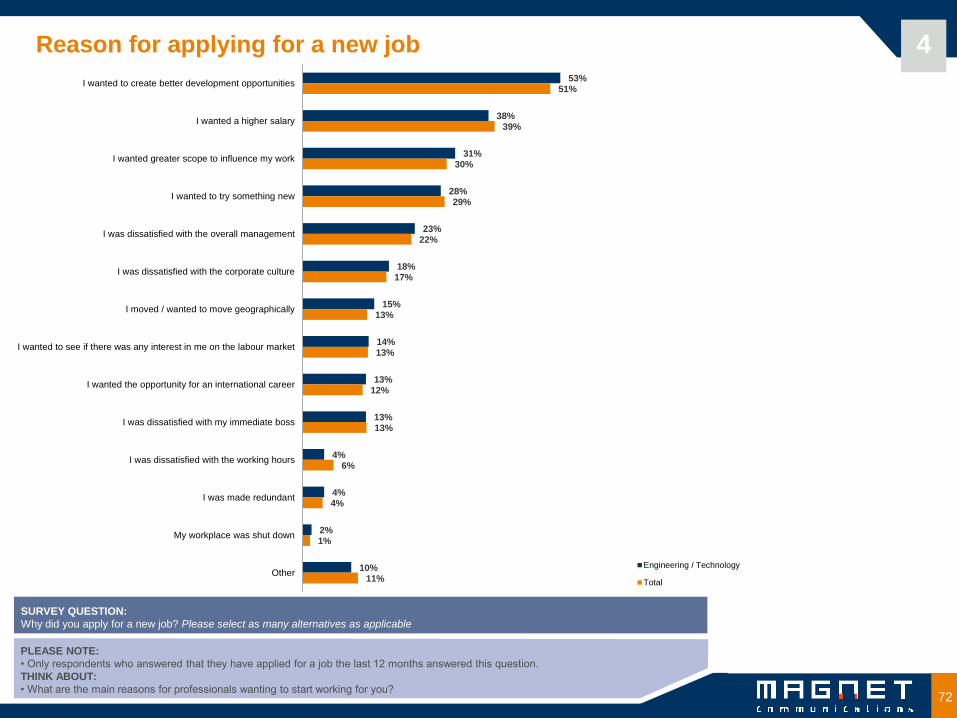
Reason for applying for a new job 4
SURVEY QUESTION:
Why did you apply for a new job? Please select as many alternatives as applicable
PLEASE NOTE:
• Only respondents who answered that they have applied for a job the last 12 months answered this question.
THINK ABOUT:
• What are the main reasons for professionals wanting to start working for you?
53%
38%
31%
28%
23%
18%
15%
14%
13%
13%
4%
4%
2%
10%
51%
39%
30%
29%
22%
17%
13%
13%
12%
13%
6%
4%
1%
11%
I wanted to create better development opportunities
I wanted a higher salary
I wanted greater scope to influence my work
I wanted to try something new
I was dissatisfied with the overall management
I was dissatisfied with the corporate culture
I moved / wanted to move geographically
I wanted to see if there was any interest in me on the labour market
I wanted the opportunity for an international career
I was dissatisfied with my immediate boss
I was dissatisfied with the working hours
I was made redundant
My workplace was shut down
OtherEngineering / Technology
Total
73
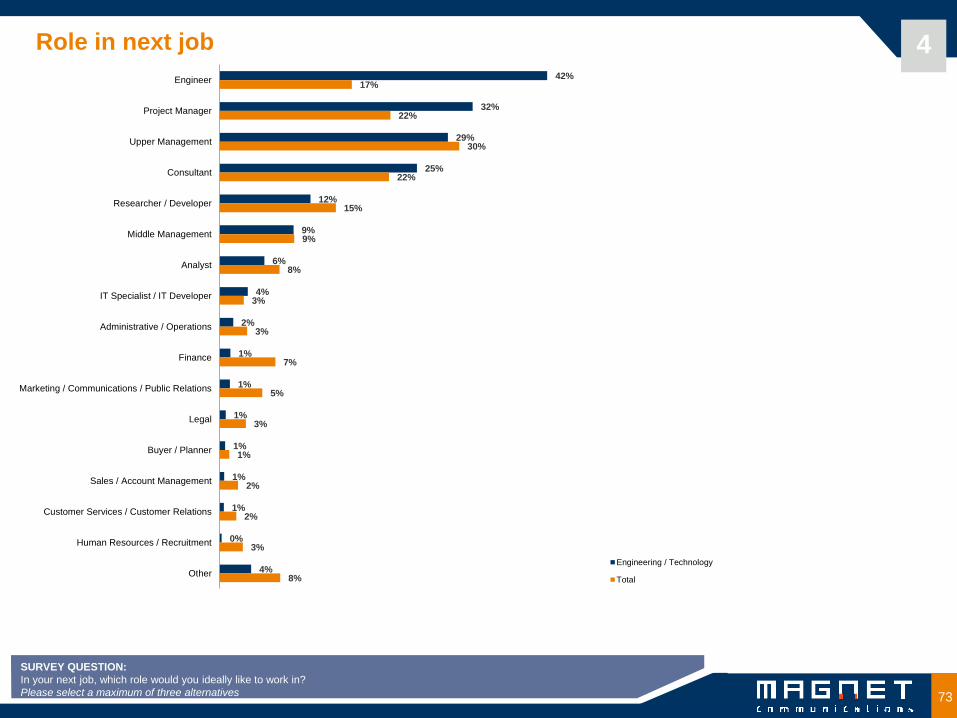
Role in next job 4
SURVEY QUESTION:
In your next job, which role would you ideally like to work in?
Please select a maximum of three alternatives
42%
32%
29%
25%
12%
9%
6%
4%
2%
1%
1%
1%
1%
1%
1%
0%
4%
17%
22%
30%
22%
15%
9%
8%
3%
3%
7%
5%
3%
1%
2%
2%
3%
8%
Engineer
Project Manager
Upper Management
Consultant
Researcher / Developer
Middle Management
Analyst
IT Specialist / IT Developer
Administrative / Operations
Finance
Marketing / Communications / Public Relations
Legal
Buyer / Planner
Sales / Account Management
Customer Services / Customer Relations
Human Resources / Recruitment
Other
Engineering / Technology
Total
74
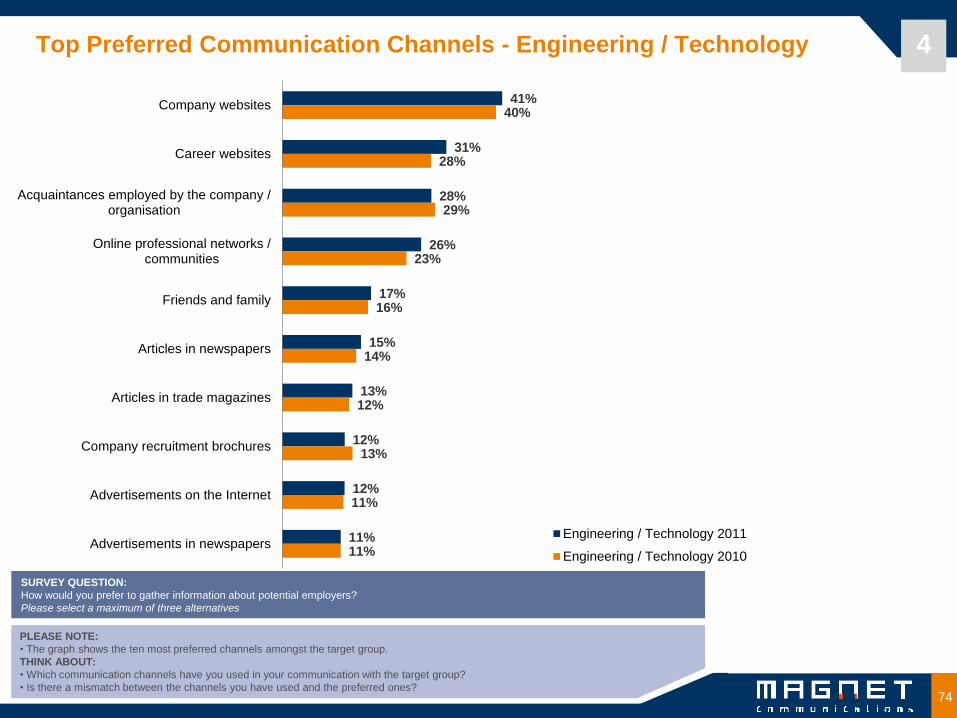
Top Preferred Communication Channels - Engineering / Technology 4
SURVEY QUESTION:
How would you prefer to gather information about potential employers?
Please select a maximum of three alternatives
PLEASE NOTE:
• The graph shows the ten most preferred channels amongst the target group.
THINK ABOUT:
• Which communication channels have you used in your communication with the target group?
• Is there a mismatch between the channels you have used and the preferred ones?
41%
31%
28%
26%
17%
15%
13%
12%
12%
11%
40%
28%
29%
23%
16%
14%
12%
13%
11%
11%
Company websites
Career websites
Acquaintances employed by the company /organisation
Online professional networks /communities
Friends and family
Articles in newspapers
Articles in trade magazines
Company recruitment brochures
Advertisements on the Internet
Advertisements in newspapersEngineering / Technology 2011
Engineering / Technology 2010
75
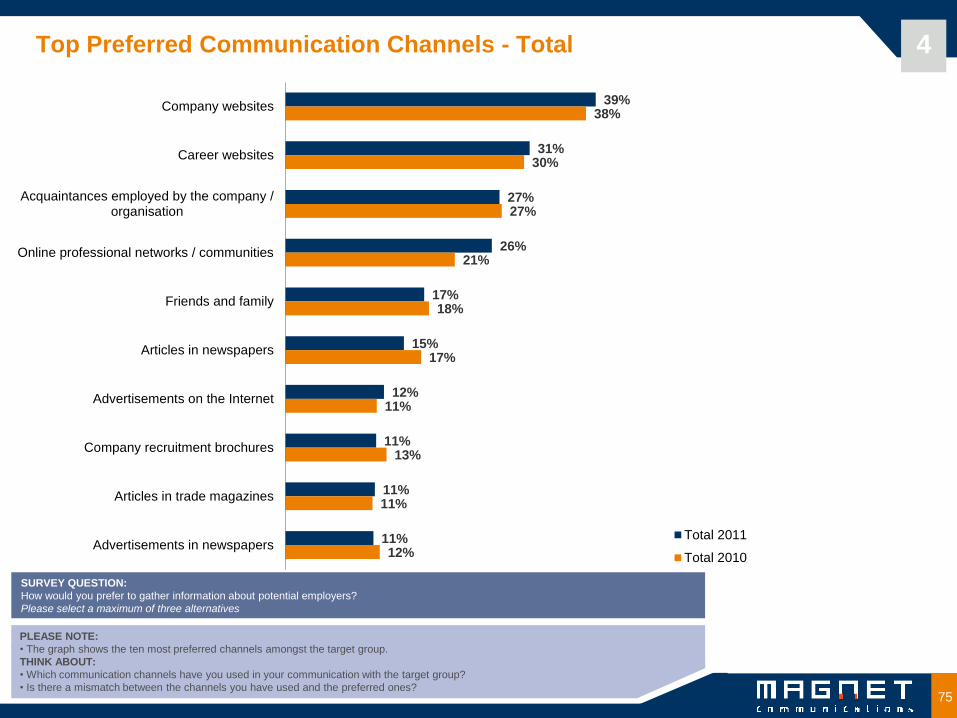
Top Preferred Communication Channels - Total 4
SURVEY QUESTION:
How would you prefer to gather information about potential employers?
Please select a maximum of three alternatives
PLEASE NOTE:
• The graph shows the ten most preferred channels amongst the target group.
THINK ABOUT:
• Which communication channels have you used in your communication with the target group?
• Is there a mismatch between the channels you have used and the preferred ones?
39%
31%
27%
26%
17%
15%
12%
11%
11%
11%
38%
30%
27%
21%
18%
17%
11%
13%
11%
12%
Company websites
Career websites
Acquaintances employed by the company /organisation
Online professional networks / communities
Friends and family
Articles in newspapers
Advertisements on the Internet
Company recruitment brochures
Articles in trade magazines
Advertisements in newspapersTotal 2011
Total 2010
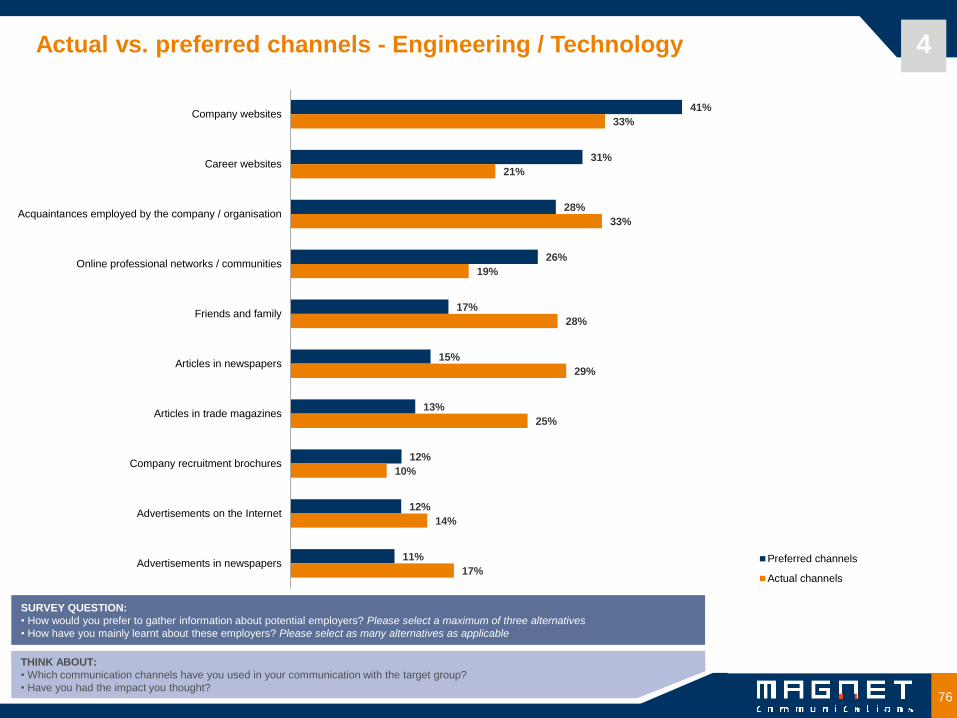
76
SURVEY QUESTION:
• How would you prefer to gather information about potential employers? Please select a maximum of three alternatives
• How have you mainly learnt about these employers? Please select as many alternatives as applicable
THINK ABOUT:
• Which communication channels have you used in your communication with the target group?
• Have you had the impact you thought?
4 Actual vs. preferred channels - Engineering / Technology
41%
31%
28%
26%
17%
15%
13%
12%
12%
11%
33%
21%
33%
19%
28%
29%
25%
10%
14%
17%
Company websites
Career websites
Acquaintances employed by the company / organisation
Online professional networks / communities
Friends and family
Articles in newspapers
Articles in trade magazines
Company recruitment brochures
Advertisements on the Internet
Advertisements in newspapers Preferred channels
Actual channels
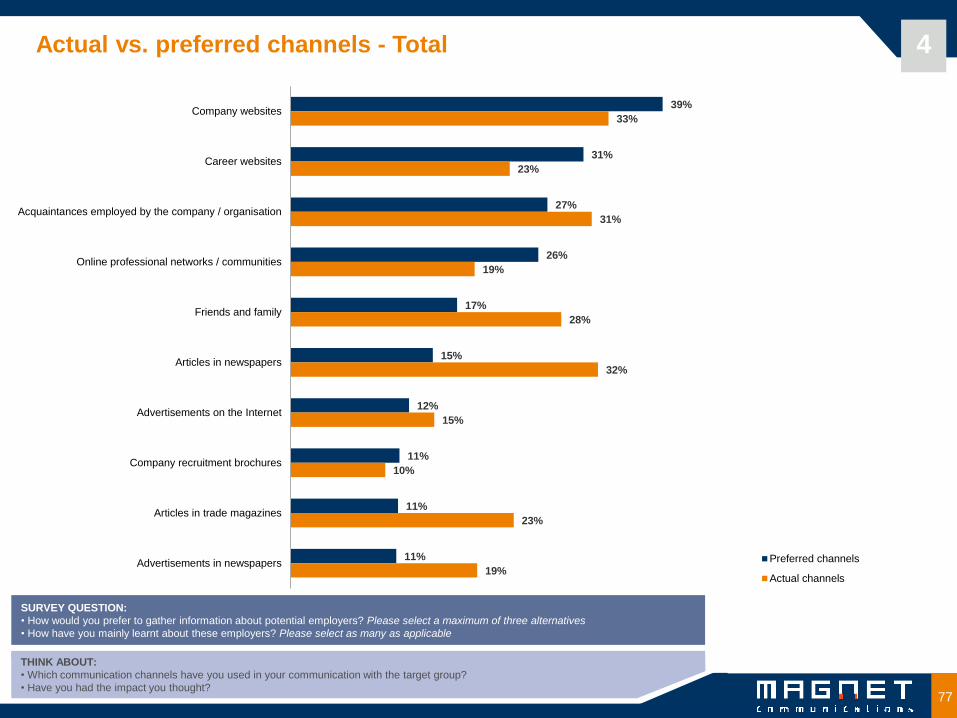
77
SURVEY QUESTION:
• How would you prefer to gather information about potential employers? Please select a maximum of three alternatives
• How have you mainly learnt about these employers? Please select as many as applicable
THINK ABOUT:
• Which communication channels have you used in your communication with the target group?
• Have you had the impact you thought?
4 Actual vs. preferred channels - Total
39%
31%
27%
26%
17%
15%
12%
11%
11%
11%
33%
23%
31%
19%
28%
32%
15%
10%
23%
19%
Company websites
Career websites
Acquaintances employed by the company / organisation
Online professional networks / communities
Friends and family
Articles in newspapers
Advertisements on the Internet
Company recruitment brochures
Articles in trade magazines
Advertisements in newspapers Preferred channels
Actual channels
78
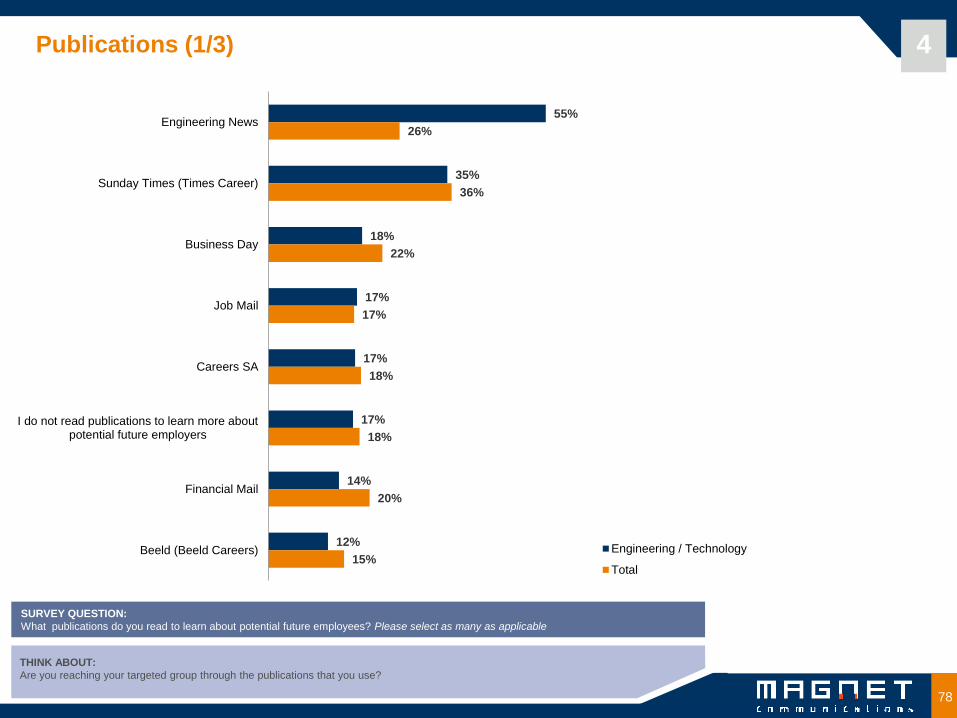
Publications (1/3) 4
SURVEY QUESTION:
What publications do you read to learn about potential future employees? Please select as many as applicable
THINK ABOUT:
Are you reaching your targeted group through the publications that you use?
55%
35%
18%
17%
17%
17%
14%
12%
26%
36%
22%
17%
18%
18%
20%
15%
Engineering News
Sunday Times (Times Career)
Business Day
Job Mail
Careers SA
I do not read publications to learn more aboutpotential future employers
Financial Mail
Beeld (Beeld Careers) Engineering / Technology
Total
79
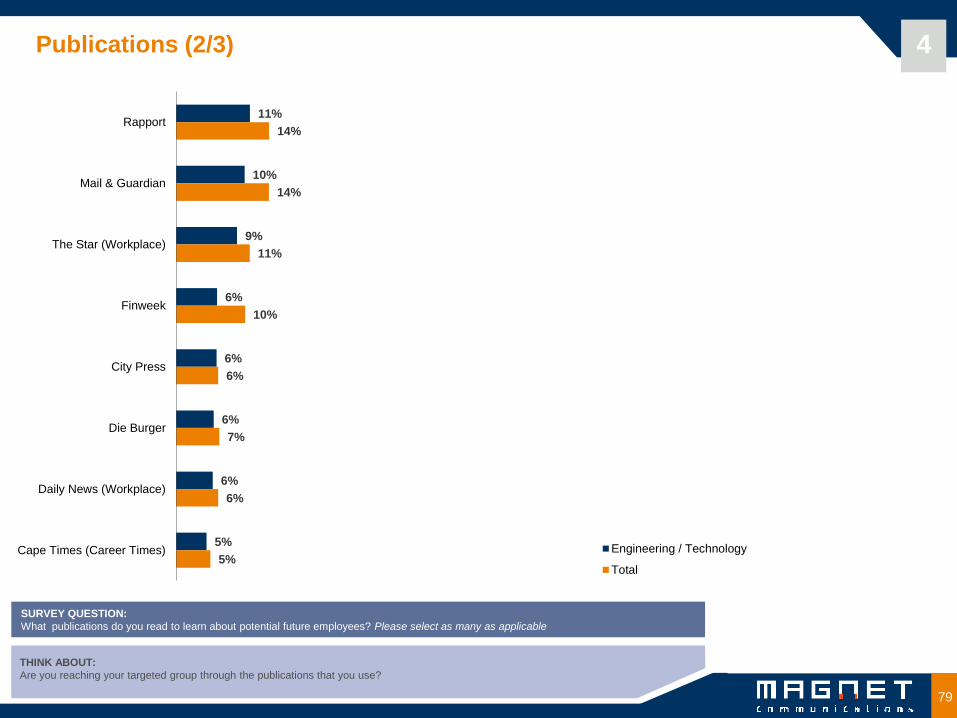
Publications (2/3) 4
SURVEY QUESTION:
What publications do you read to learn about potential future employees? Please select as many as applicable
THINK ABOUT:
Are you reaching your targeted group through the publications that you use?
11%
10%
9%
6%
6%
6%
6%
5%
14%
14%
11%
10%
6%
7%
6%
5%
Rapport
Mail & Guardian
The Star (Workplace)
Finweek
City Press
Die Burger
Daily News (Workplace)
Cape Times (Career Times) Engineering / Technology
Total

80
Publications (3/3) 4
SURVEY QUESTION:
What publications do you read to learn about potential future employees? Please select as many as applicable
THINK ABOUT:
Are you reaching your targeted group through the publications that you use?
4%
3%
3%
2%
0%
0%
0%
6%
4%
3%
2%
2%
1%
6%
0%
6%
Cape Argus (Job Shop / Weekend Argus)
Sowetan
Citizen
Mecury (Jobfinder)
Insig
Accountancy SA
Destination The Future
Other Engineering / Technology
Total
81
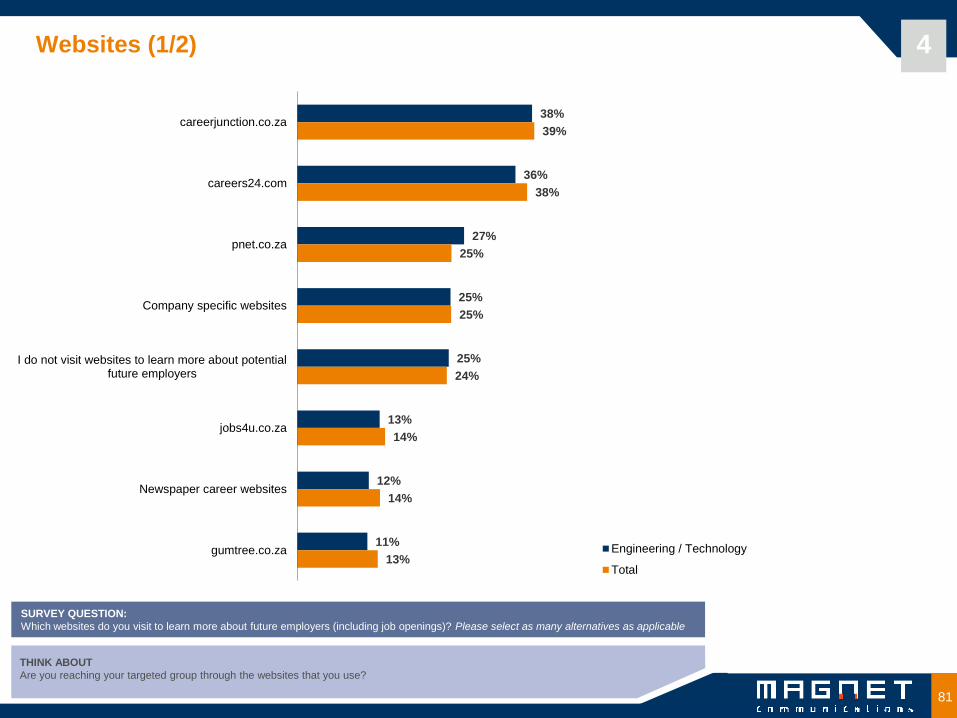
Websites (1/2) 4
SURVEY QUESTION:
Which websites do you visit to learn more about future employers (including job openings)? Please select as many alternatives as applicable
THINK ABOUT
Are you reaching your targeted group through the websites that you use?
38%
36%
27%
25%
25%
13%
12%
11%
39%
38%
25%
25%
24%
14%
14%
13%
careerjunction.co.za
careers24.com
pnet.co.za
Company specific websites
I do not visit websites to learn more about potentialfuture employers
jobs4u.co.za
Newspaper career websites
gumtree.co.za Engineering / Technology
Total
82
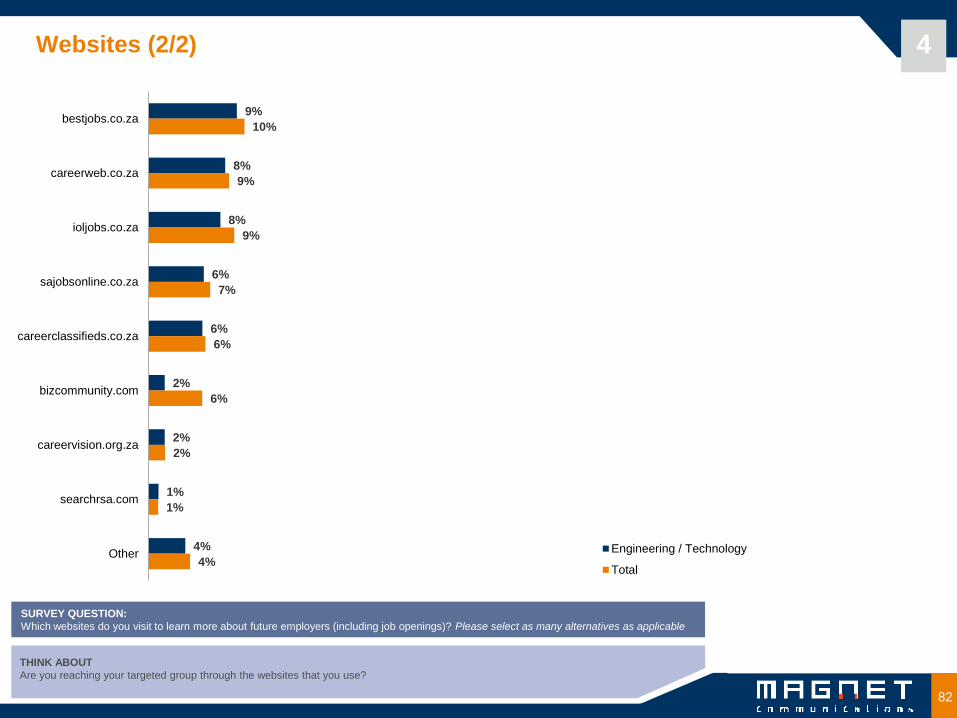
Websites (2/2) 4
SURVEY QUESTION:
Which websites do you visit to learn more about future employers (including job openings)? Please select as many alternatives as applicable
THINK ABOUT
Are you reaching your targeted group through the websites that you use?
9%
8%
8%
6%
6%
2%
2%
1%
4%
10%
9%
9%
7%
6%
6%
2%
1%
4%
bestjobs.co.za
careerweb.co.za
ioljobs.co.za
sajobsonline.co.za
careerclassifieds.co.za
bizcommunity.com
careervision.org.za
searchrsa.com
Other Engineering / Technology
Total
83
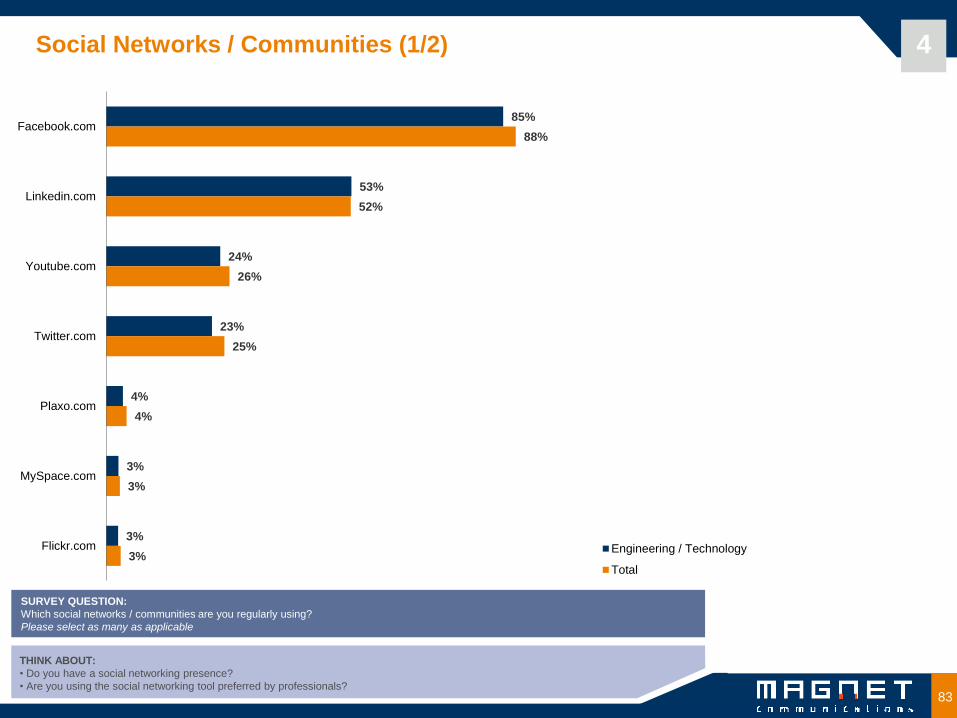
Social Networks / Communities (1/2) 4
SURVEY QUESTION:
Which social networks / communities are you regularly using?
Please select as many as applicable
THINK ABOUT:
• Do you have a social networking presence?
• Are you using the social networking tool preferred by professionals?
85%
53%
24%
23%
4%
3%
3%
88%
52%
26%
25%
4%
3%
3%
Facebook.com
Linkedin.com
Youtube.com
Twitter.com
Plaxo.com
MySpace.com
Flickr.com Engineering / Technology
Total
84
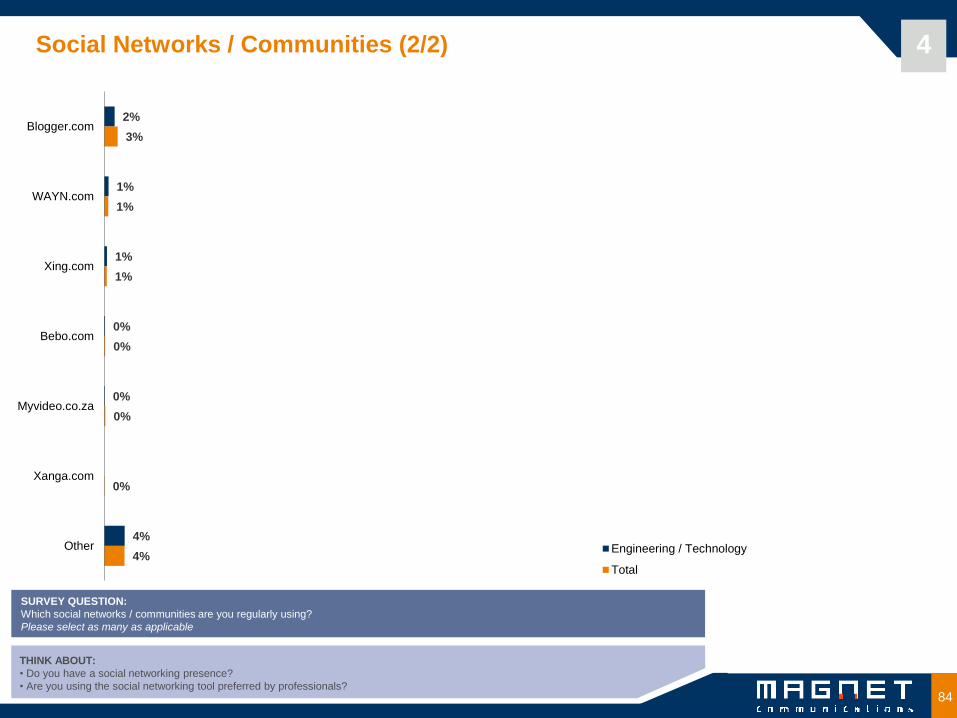
Social Networks / Communities (2/2) 4
SURVEY QUESTION:
Which social networks / communities are you regularly using?
Please select as many as applicable
THINK ABOUT:
• Do you have a social networking presence?
• Are you using the social networking tool preferred by professionals?
2%
1%
1%
0%
0%
4%
3%
1%
1%
0%
0%
0%
4%
Blogger.com
WAYN.com
Xing.com
Bebo.com
Myvideo.co.za
Xanga.com
Other Engineering / Technology
Total
85
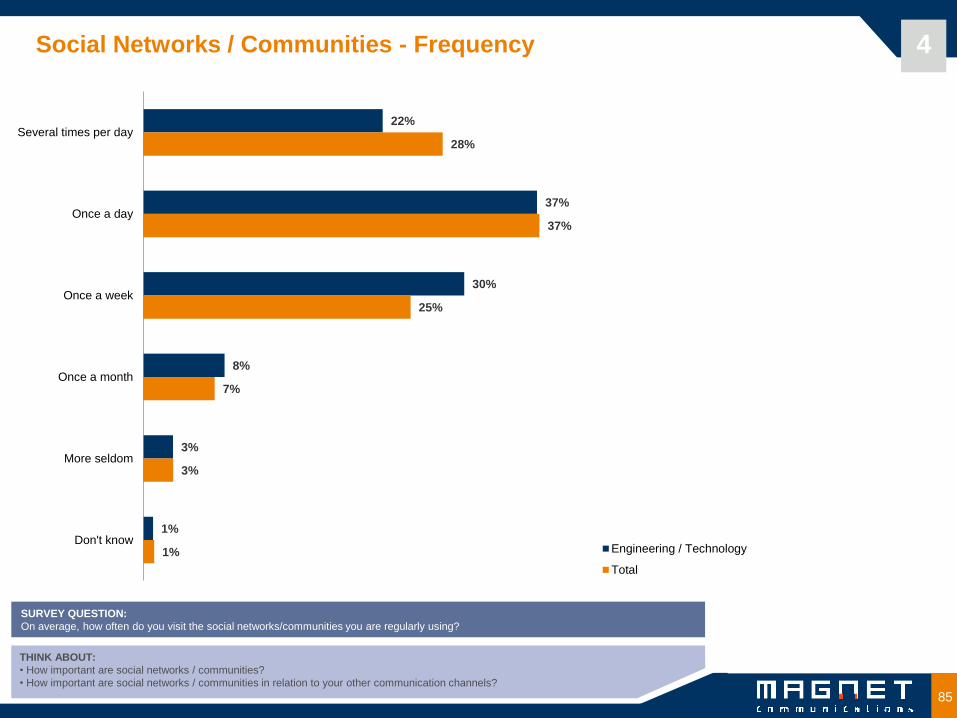
Social Networks / Communities - Frequency 4
SURVEY QUESTION:
On average, how often do you visit the social networks/communities you are regularly using?
THINK ABOUT:
• How important are social networks / communities?
• How important are social networks / communities in relation to your other communication channels?
22%
37%
30%
8%
3%
1%
28%
37%
25%
7%
3%
1%
Several times per day
Once a day
Once a week
Once a month
More seldom
Don't knowEngineering / Technology
Total
86
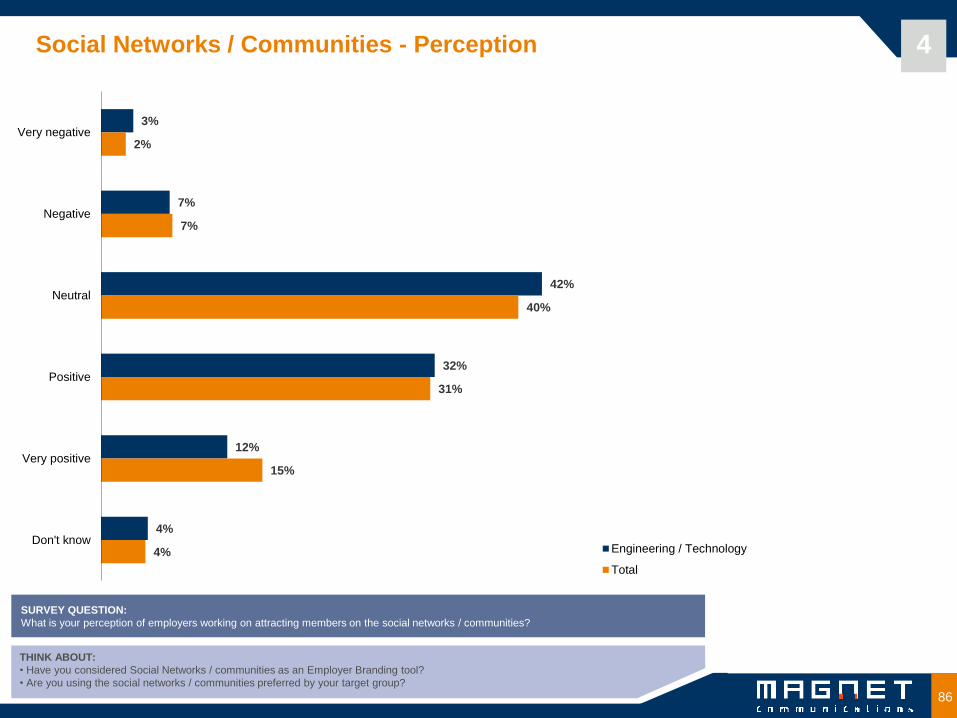
Social Networks / Communities - Perception 4
SURVEY QUESTION:
What is your perception of employers working on attracting members on the social networks / communities?
THINK ABOUT:
• Have you considered Social Networks / communities as an Employer Branding tool?
• Are you using the social networks / communities preferred by your target group?
3%
7%
42%
32%
12%
4%
2%
7%
40%
31%
15%
4%
Very negative
Negative
Neutral
Positive
Very positive
Don't knowEngineering / Technology
Total
87 87 Copyright Magnet 2010
Magnet Professional Survey 2011
Engineering/Technology vs. Total
All Professionals - South African Edition
Copyright Magnet 2011
Professionals' Employer Preferences
5 Target Report
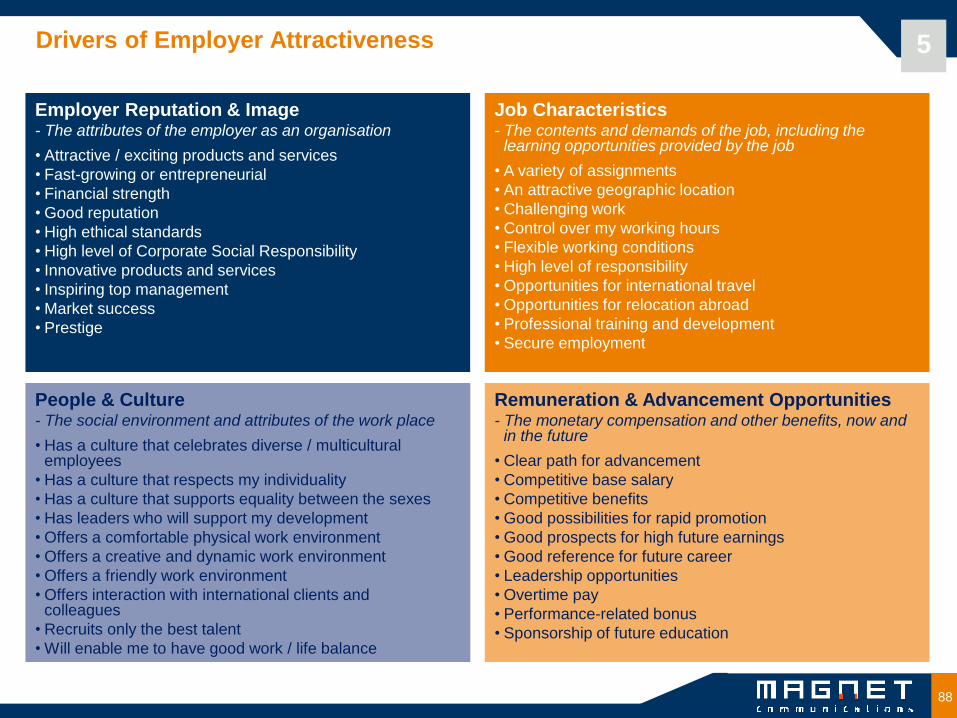
Drivers of Employer Attractiveness 5
88
Employer Reputation & Image - The attributes of the employer as an organisation
• Attractive / exciting products and services
• Fast-growing or entrepreneurial
• Financial strength
• Good reputation
• High ethical standards
• High level of Corporate Social Responsibility
• Innovative products and services
• Inspiring top management
• Market success
• Prestige
Remuneration & Advancement Opportunities - The monetary compensation and other benefits, now and
in the future
• Clear path for advancement
• Competitive base salary
• Competitive benefits
• Good possibilities for rapid promotion
• Good prospects for high future earnings
• Good reference for future career
• Leadership opportunities
• Overtime pay
• Performance-related bonus
• Sponsorship of future education
Job Characteristics - The contents and demands of the job, including the
learning opportunities provided by the job
• A variety of assignments
• An attractive geographic location
• Challenging work
• Control over my working hours
• Flexible working conditions
• High level of responsibility
• Opportunities for international travel
• Opportunities for relocation abroad
• Professional training and development
• Secure employment
People & Culture - The social environment and attributes of the work place
• Has a culture that celebrates diverse / multicultural employees
• Has a culture that respects my individuality
• Has a culture that supports equality between the sexes
• Has leaders who will support my development
• Offers a comfortable physical work environment
• Offers a creative and dynamic work environment
• Offers a friendly work environment
• Offers interaction with international clients and colleagues
• Recruits only the best talent
• Will enable me to have good work / life balance

89
Professionals' employer preferences
Think about:
• Compare your current employer brand and employer value proposition with the survey results. Are the components you
focus on important and attractive to professionals? Or are you wasting time and money communicating things not that
important to them?
• Are there other attributes that are attractive to professionals that you can deliver? Should these be included in your
external communication?
• As in any branding effort, you need to keep in mind that the preferences and goals vary greatly amongst different sub-
segments.
Topics:
• Importance of the Drivers of Employer Attractiveness
• Importance of the attributes within each driver:
- Employer Reputation & Image
- Job Characteristics
- People & Culture
- Remuneration & Advancement Opportunities
5
90
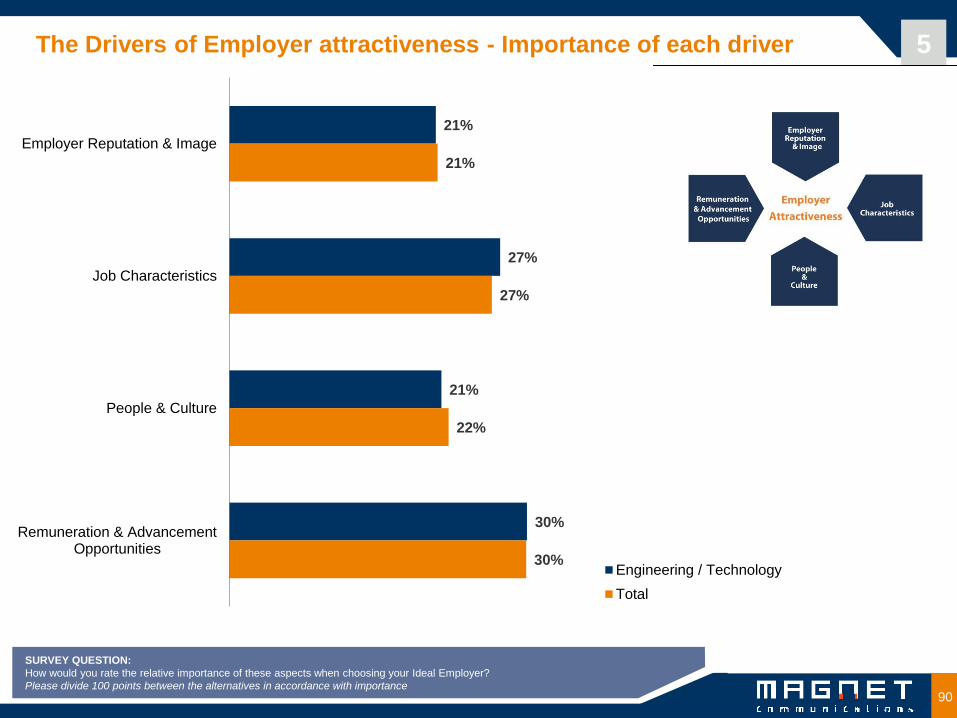
The Drivers of Employer attractiveness - Importance of each driver
SURVEY QUESTION:
How would you rate the relative importance of these aspects when choosing your Ideal Employer?
Please divide 100 points between the alternatives in accordance with importance
5
21%
27%
21%
30%
21%
27%
22%
30%
Employer Reputation & Image
Job Characteristics
People & Culture
Remuneration & AdvancementOpportunities
Engineering / Technology
Total
91
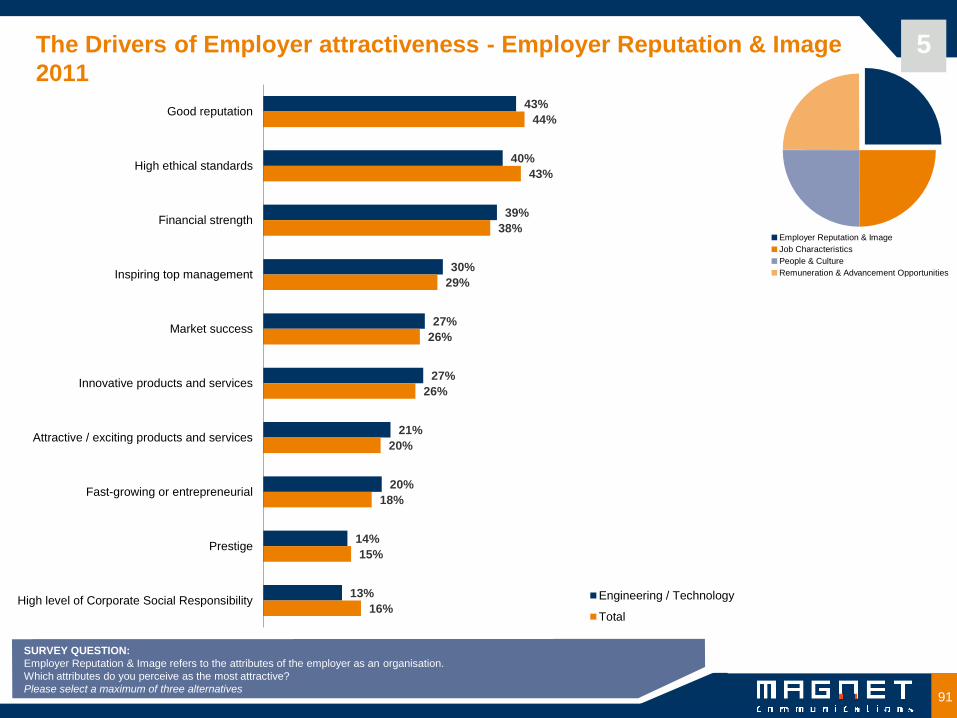
SURVEY QUESTION:
Employer Reputation & Image refers to the attributes of the employer as an organisation.
Which attributes do you perceive as the most attractive?
Please select a maximum of three alternatives
The Drivers of Employer attractiveness - Employer Reputation & Image
2011 5
Employer Reputation & Image
Job Characteristics
People & Culture
Remuneration & Advancement Opportunities
43%
40%
39%
30%
27%
27%
21%
20%
14%
13%
44%
43%
38%
29%
26%
26%
20%
18%
15%
16%
Good reputation
High ethical standards
Financial strength
Inspiring top management
Market success
Innovative products and services
Attractive / exciting products and services
Fast-growing or entrepreneurial
Prestige
High level of Corporate Social Responsibility Engineering / Technology
Total
92
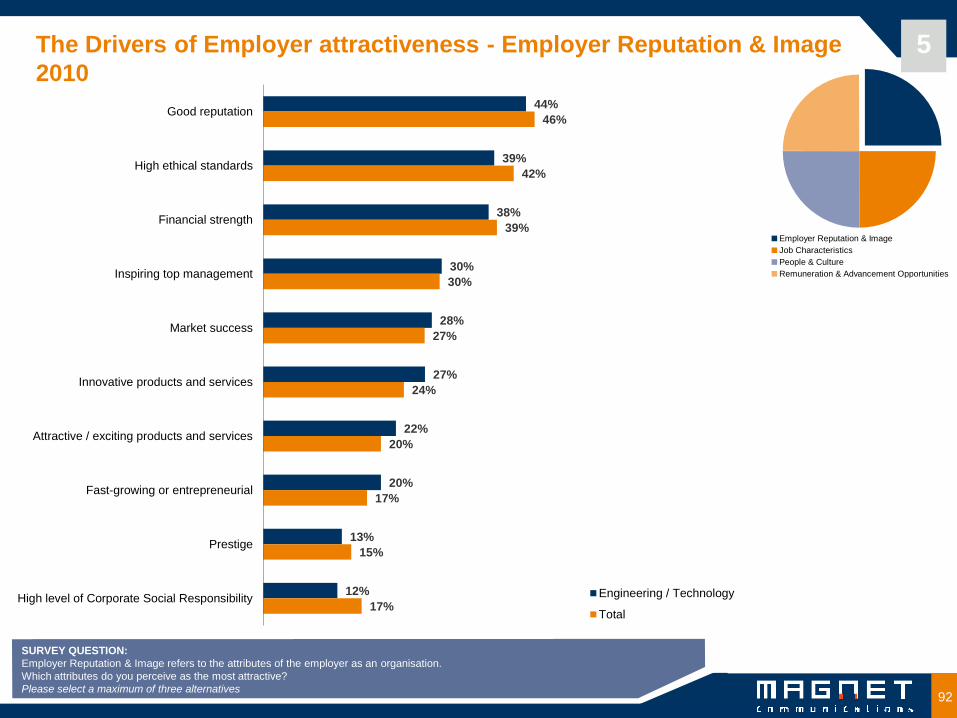
5 The Drivers of Employer attractiveness - Employer Reputation & Image
2010
Employer Reputation & Image
Job Characteristics
People & Culture
Remuneration & Advancement Opportunities
SURVEY QUESTION:
Employer Reputation & Image refers to the attributes of the employer as an organisation.
Which attributes do you perceive as the most attractive?
Please select a maximum of three alternatives
44%
39%
38%
30%
28%
27%
22%
20%
13%
12%
46%
42%
39%
30%
27%
24%
20%
17%
15%
17%
Good reputation
High ethical standards
Financial strength
Inspiring top management
Market success
Innovative products and services
Attractive / exciting products and services
Fast-growing or entrepreneurial
Prestige
High level of Corporate Social Responsibility Engineering / Technology
Total
93
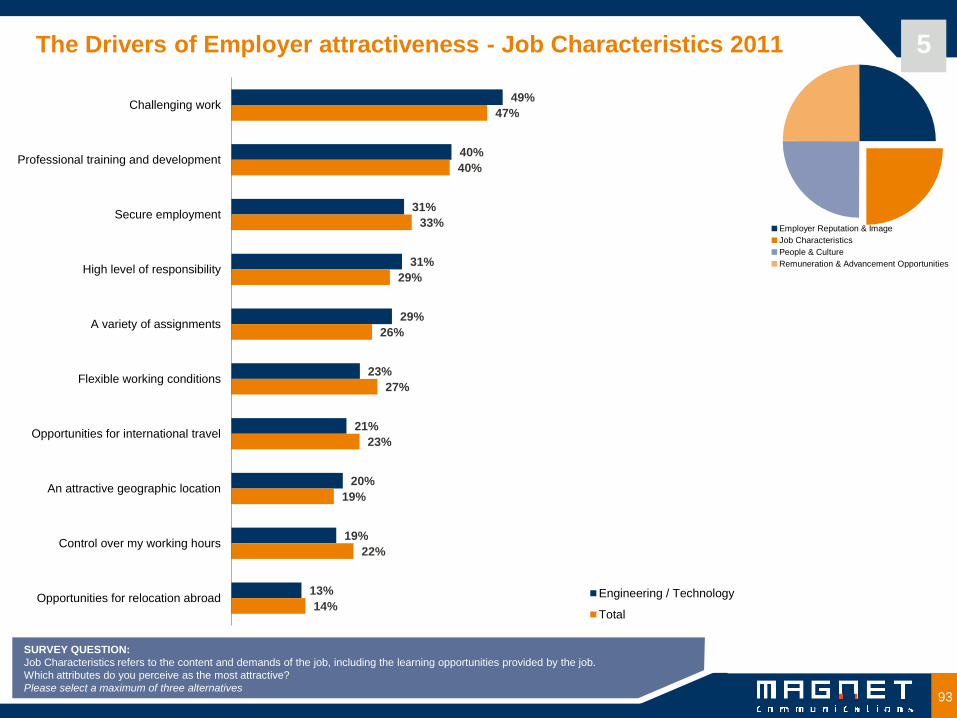
SURVEY QUESTION:
Job Characteristics refers to the content and demands of the job, including the learning opportunities provided by the job.
Which attributes do you perceive as the most attractive?
Please select a maximum of three alternatives
The Drivers of Employer attractiveness - Job Characteristics 2011 5
Employer Reputation & Image
Job Characteristics
People & Culture
Remuneration & Advancement Opportunities
49%
40%
31%
31%
29%
23%
21%
20%
19%
13%
47%
40%
33%
29%
26%
27%
23%
19%
22%
14%
Challenging work
Professional training and development
Secure employment
High level of responsibility
A variety of assignments
Flexible working conditions
Opportunities for international travel
An attractive geographic location
Control over my working hours
Opportunities for relocation abroad Engineering / Technology
Total
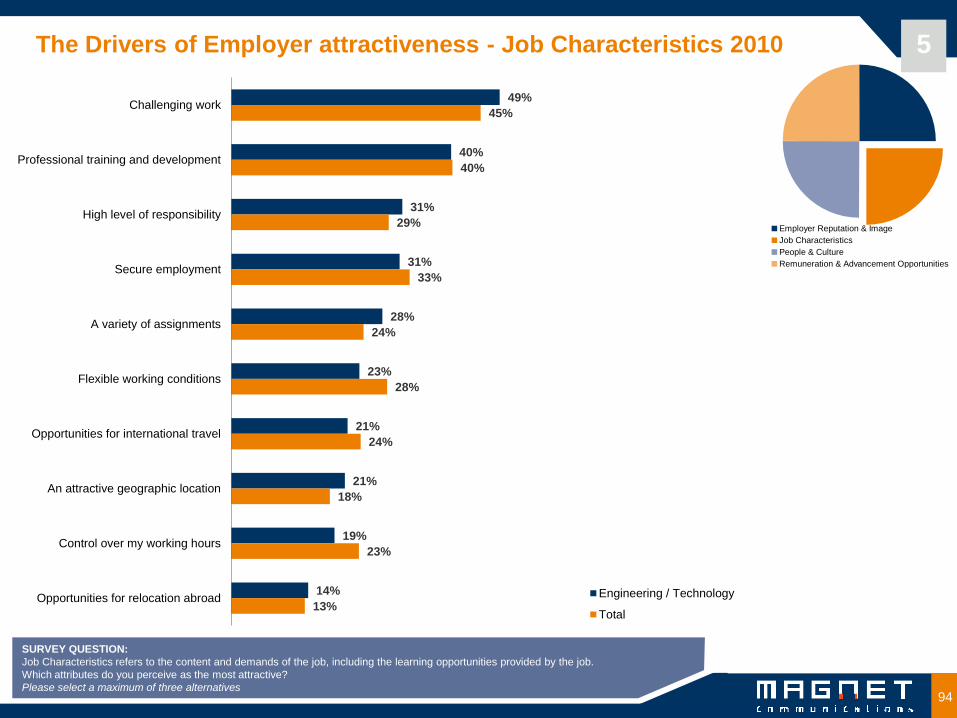
94
SURVEY QUESTION:
Job Characteristics refers to the content and demands of the job, including the learning opportunities provided by the job.
Which attributes do you perceive as the most attractive?
Please select a maximum of three alternatives
5 The Drivers of Employer attractiveness - Job Characteristics 2010
Employer Reputation & Image
Job Characteristics
People & Culture
Remuneration & Advancement Opportunities
49%
40%
31%
31%
28%
23%
21%
21%
19%
14%
45%
40%
29%
33%
24%
28%
24%
18%
23%
13%
Challenging work
Professional training and development
High level of responsibility
Secure employment
A variety of assignments
Flexible working conditions
Opportunities for international travel
An attractive geographic location
Control over my working hours
Opportunities for relocation abroad Engineering / Technology
Total
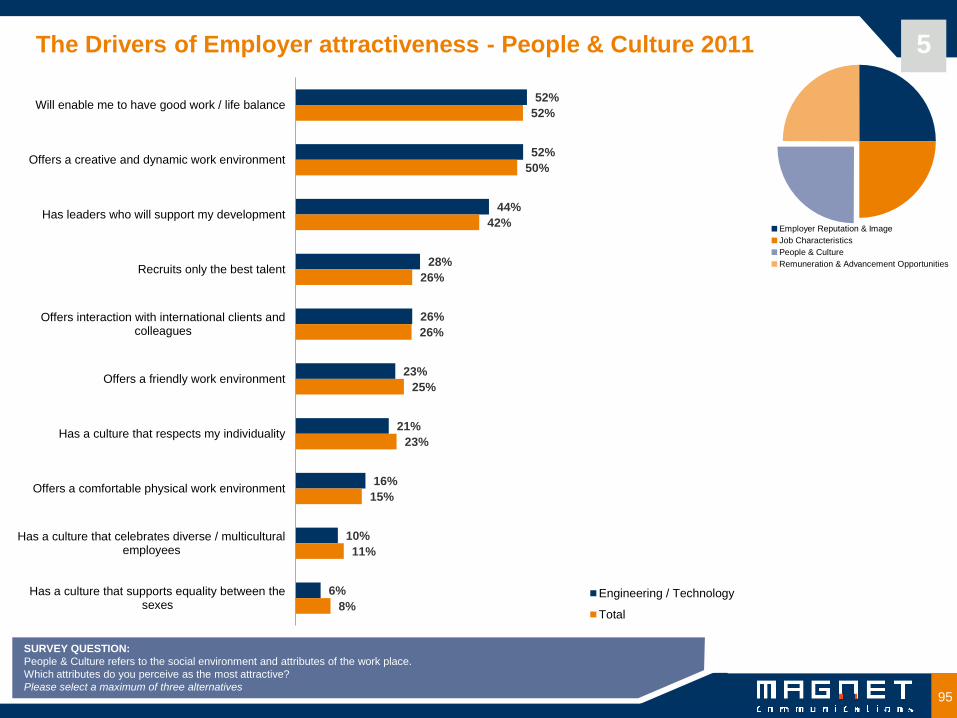
95
The Drivers of Employer attractiveness - People & Culture 2011 5
SURVEY QUESTION:
People & Culture refers to the social environment and attributes of the work place.
Which attributes do you perceive as the most attractive?
Please select a maximum of three alternatives
Employer Reputation & Image
Job Characteristics
People & Culture
Remuneration & Advancement Opportunities
52%
52%
44%
28%
26%
23%
21%
16%
10%
6%
52%
50%
42%
26%
26%
25%
23%
15%
11%
8%
Will enable me to have good work / life balance
Offers a creative and dynamic work environment
Has leaders who will support my development
Recruits only the best talent
Offers interaction with international clients andcolleagues
Offers a friendly work environment
Has a culture that respects my individuality
Offers a comfortable physical work environment
Has a culture that celebrates diverse / multiculturalemployees
Has a culture that supports equality between thesexes
Engineering / Technology
Total
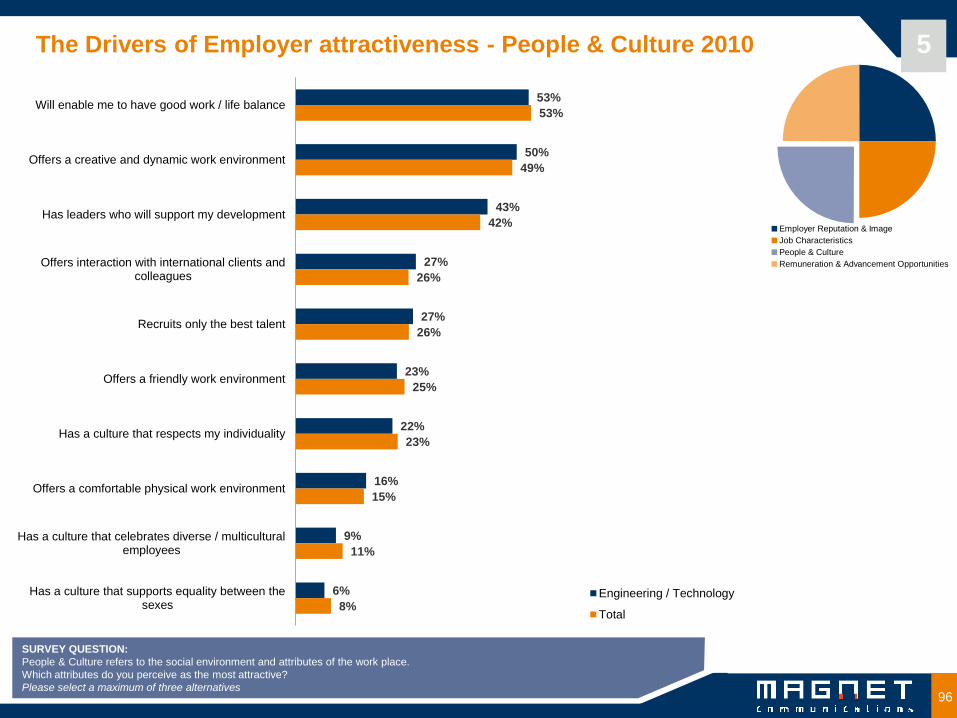
96
5 The Drivers of Employer attractiveness - People & Culture 2010
Employer Reputation & Image
Job Characteristics
People & Culture
Remuneration & Advancement Opportunities
SURVEY QUESTION:
People & Culture refers to the social environment and attributes of the work place.
Which attributes do you perceive as the most attractive?
Please select a maximum of three alternatives
53%
50%
43%
27%
27%
23%
22%
16%
9%
6%
53%
49%
42%
26%
26%
25%
23%
15%
11%
8%
Will enable me to have good work / life balance
Offers a creative and dynamic work environment
Has leaders who will support my development
Offers interaction with international clients andcolleagues
Recruits only the best talent
Offers a friendly work environment
Has a culture that respects my individuality
Offers a comfortable physical work environment
Has a culture that celebrates diverse / multiculturalemployees
Has a culture that supports equality between thesexes
Engineering / Technology
Total
97
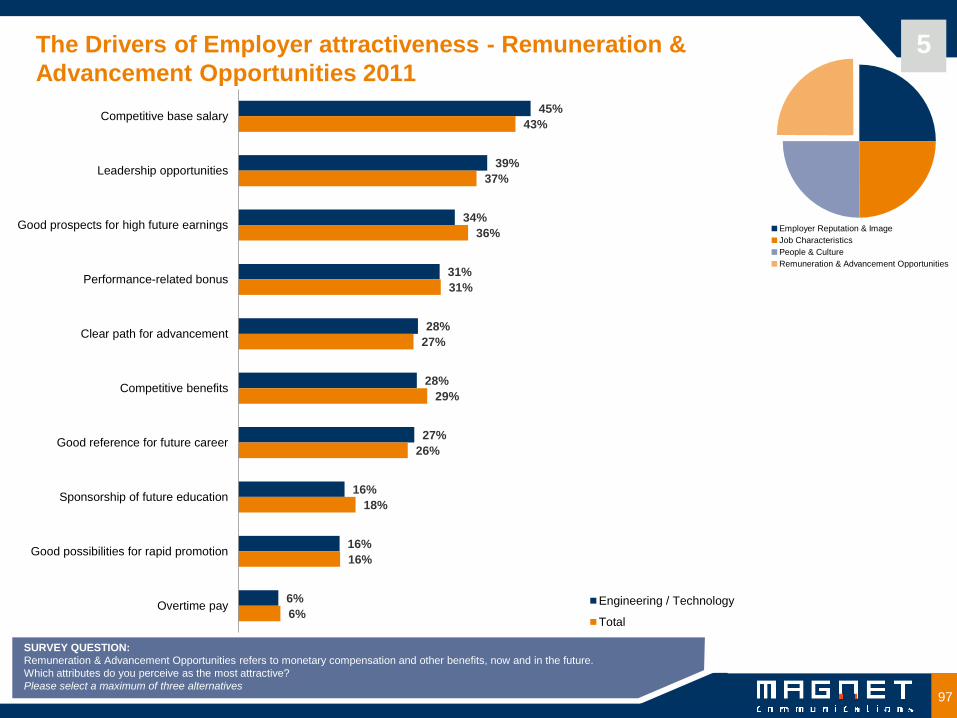
The Drivers of Employer attractiveness - Remuneration &
Advancement Opportunities 2011 5
SURVEY QUESTION:
Remuneration & Advancement Opportunities refers to monetary compensation and other benefits, now and in the future.
Which attributes do you perceive as the most attractive?
Please select a maximum of three alternatives
Employer Reputation & Image
Job Characteristics
People & Culture
Remuneration & Advancement Opportunities
45%
39%
34%
31%
28%
28%
27%
16%
16%
6%
43%
37%
36%
31%
27%
29%
26%
18%
16%
6%
Competitive base salary
Leadership opportunities
Good prospects for high future earnings
Performance-related bonus
Clear path for advancement
Competitive benefits
Good reference for future career
Sponsorship of future education
Good possibilities for rapid promotion
Overtime pay Engineering / Technology
Total
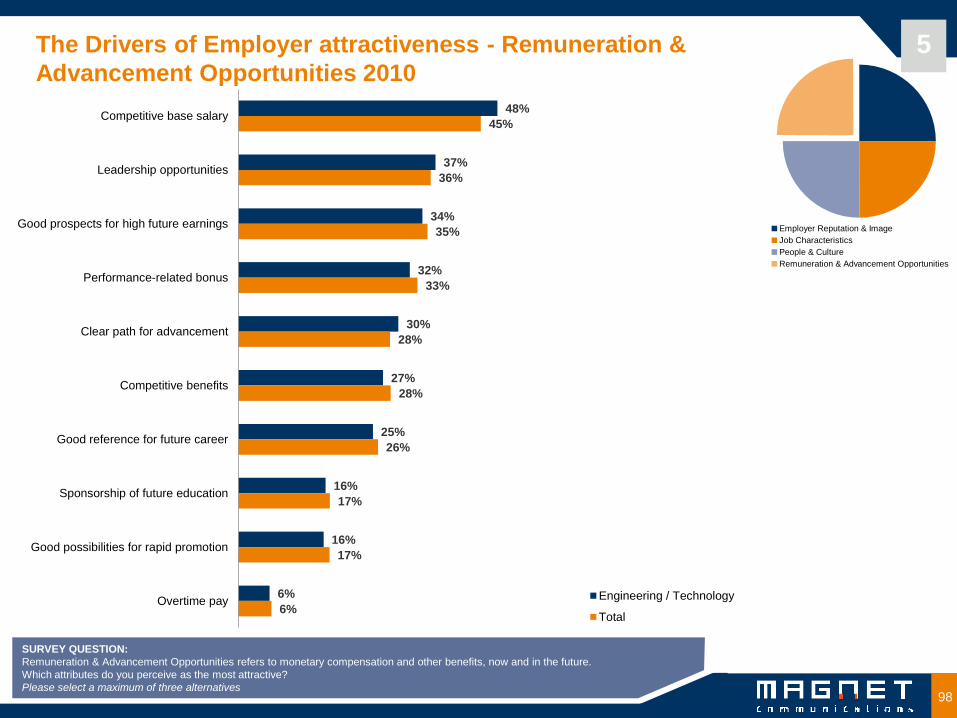
98
SURVEY QUESTION:
Remuneration & Advancement Opportunities refers to monetary compensation and other benefits, now and in the future.
Which attributes do you perceive as the most attractive?
Please select a maximum of three alternatives
5 The Drivers of Employer attractiveness - Remuneration &
Advancement Opportunities 2010
Employer Reputation & Image
Job Characteristics
People & Culture
Remuneration & Advancement Opportunities
48%
37%
34%
32%
30%
27%
25%
16%
16%
6%
45%
36%
35%
33%
28%
28%
26%
17%
17%
6%
Competitive base salary
Leadership opportunities
Good prospects for high future earnings
Performance-related bonus
Clear path for advancement
Competitive benefits
Good reference for future career
Sponsorship of future education
Good possibilities for rapid promotion
Overtime pay Engineering / Technology
Total
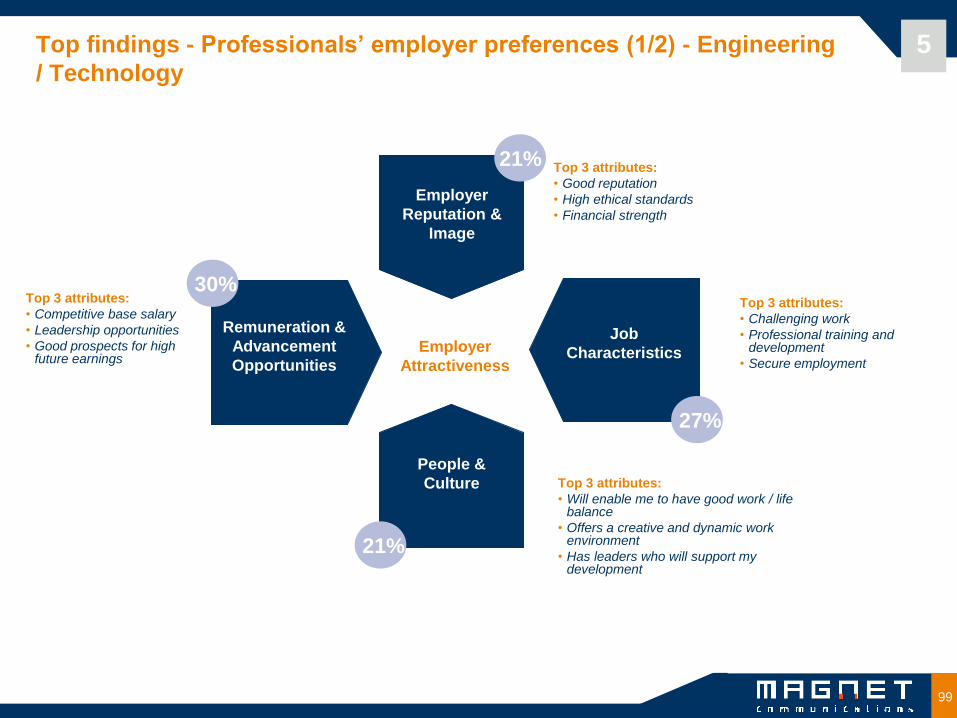
99
Top findings - Professionals’ employer preferences (1/2) - Engineering
/ Technology
Top 3 attributes:
• Good reputation
• High ethical standards
• Financial strength
Top 3 attributes:
• Challenging work
• Professional training and development
• Secure employment
Top 3 attributes:
• Will enable me to have good work / life balance
• Offers a creative and dynamic work environment
• Has leaders who will support my development
Top 3 attributes:
• Competitive base salary
• Leadership opportunities
• Good prospects for high future earnings
Remuneration &
Advancement
Opportunities
Job
Characteristics
People &
Culture
Employer
Reputation &
Image
Employer
Attractiveness
5
21%
30%
21%
27%
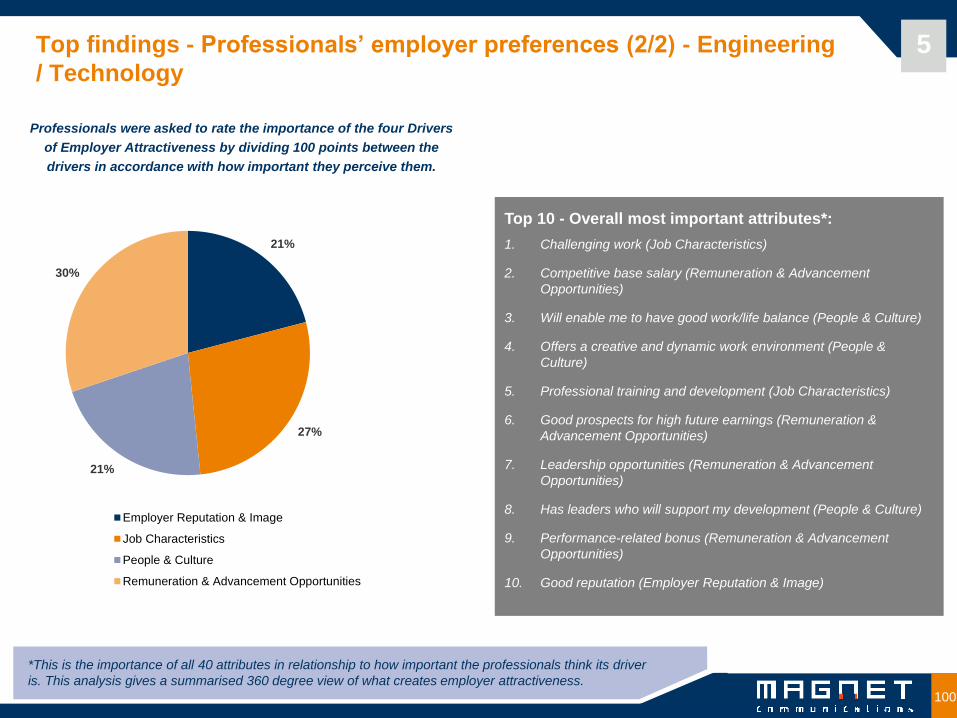
100
Top 10 - Overall most important attributes*:
1. Challenging work (Job Characteristics)
2. Competitive base salary (Remuneration & Advancement
Opportunities)
3. Will enable me to have good work/life balance (People & Culture)
4. Offers a creative and dynamic work environment (People &
Culture)
5. Professional training and development (Job Characteristics)
6. Good prospects for high future earnings (Remuneration &
Advancement Opportunities)
7. Leadership opportunities (Remuneration & Advancement
Opportunities)
8. Has leaders who will support my development (People & Culture)
9. Performance-related bonus (Remuneration & Advancement
Opportunities)
10. Good reputation (Employer Reputation & Image)
Professionals were asked to rate the importance of the four Drivers
of Employer Attractiveness by dividing 100 points between the
drivers in accordance with how important they perceive them.
5 Top findings - Professionals’ employer preferences (2/2) - Engineering
/ Technology
*This is the importance of all 40 attributes in relationship to how important the professionals think its driver
is. This analysis gives a summarised 360 degree view of what creates employer attractiveness.
21%
27%
21%
30%
Employer Reputation & Image
Job Characteristics
People & Culture
Remuneration & Advancement Opportunities
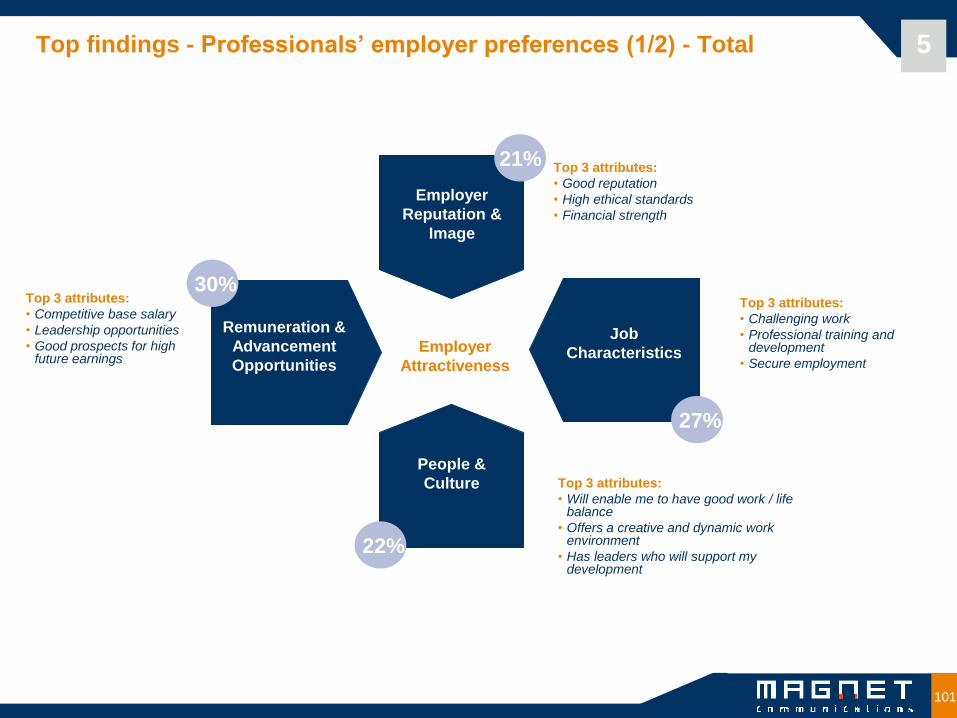
101
Top findings - Professionals’ employer preferences (1/2) - Total 5
Top 3 attributes:
• Good reputation
• High ethical standards
• Financial strength
Top 3 attributes:
• Challenging work
• Professional training and development
• Secure employment
Top 3 attributes:
• Will enable me to have good work / life balance
• Offers a creative and dynamic work environment
• Has leaders who will support my development
Top 3 attributes:
• Competitive base salary
• Leadership opportunities
• Good prospects for high future earnings
Remuneration &
Advancement
Opportunities
Job
Characteristics
People &
Culture
Employer
Reputation &
Image
Employer
Attractiveness
21%
30%
22%
27%
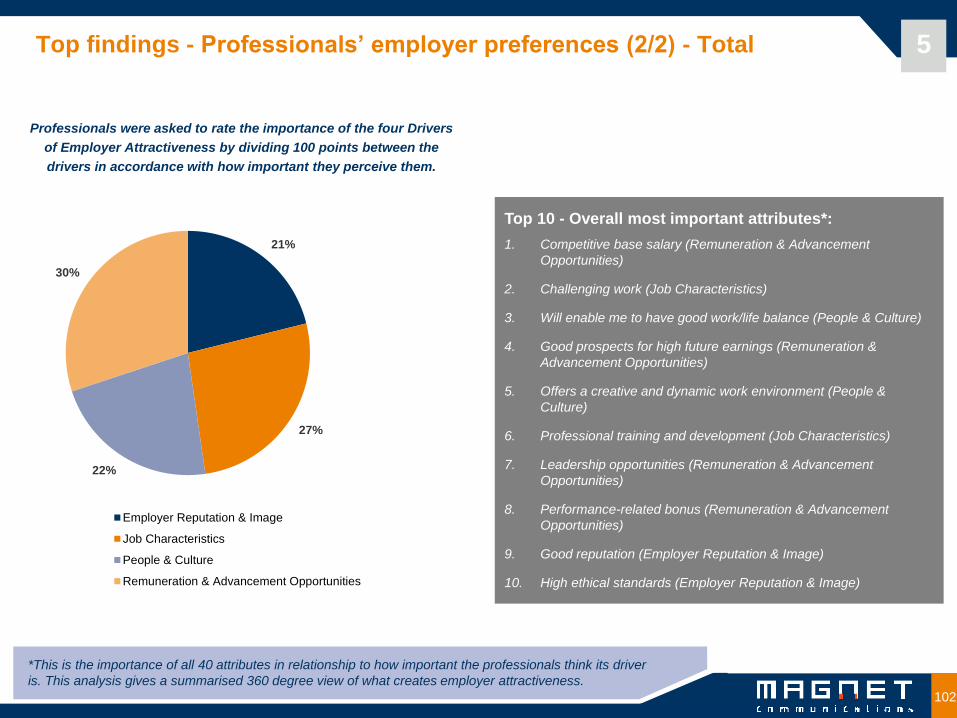
102
Professionals were asked to rate the importance of the four Drivers
of Employer Attractiveness by dividing 100 points between the
drivers in accordance with how important they perceive them.
5 Top findings - Professionals’ employer preferences (2/2) - Total
Top 10 - Overall most important attributes*:
1. Competitive base salary (Remuneration & Advancement
Opportunities)
2. Challenging work (Job Characteristics)
3. Will enable me to have good work/life balance (People & Culture)
4. Good prospects for high future earnings (Remuneration &
Advancement Opportunities)
5. Offers a creative and dynamic work environment (People &
Culture)
6. Professional training and development (Job Characteristics)
7. Leadership opportunities (Remuneration & Advancement
Opportunities)
8. Performance-related bonus (Remuneration & Advancement
Opportunities)
9. Good reputation (Employer Reputation & Image)
10. High ethical standards (Employer Reputation & Image)
*This is the importance of all 40 attributes in relationship to how important the professionals think its driver
is. This analysis gives a summarised 360 degree view of what creates employer attractiveness.
21%
27%
22%
30%
Employer Reputation & Image
Job Characteristics
People & Culture
Remuneration & Advancement Opportunities
103
Klicka här för att ändra format på bakgrundstexten
Nivå två
• Nivå tre
• Nivå fyra
• Nivå fem
103 Copyright Magnet 2010
Magnet Professional Survey 2011
Engineering/Technology vs. Total
All Professionals - South African Edition
Copyright Magnet 2011
Target Report
Thank you!