Embed Size (px)
Citation preview
Targeting the Poor
Johan A. Mistiaen (World Bank)Presentation at Joint Poverty Assessment Workshop
Nairobi - May 19, 2005
Towards evidence-based implementation
OutlineIntegrating Data Sources - GISWhat is GIS?Potential Uses of Integrated GIS Data BasesTargeting Examples in EducationTargeting who?The big picture – are public expenditures targeted to the poor?How to build Integrated GIS Data Bases
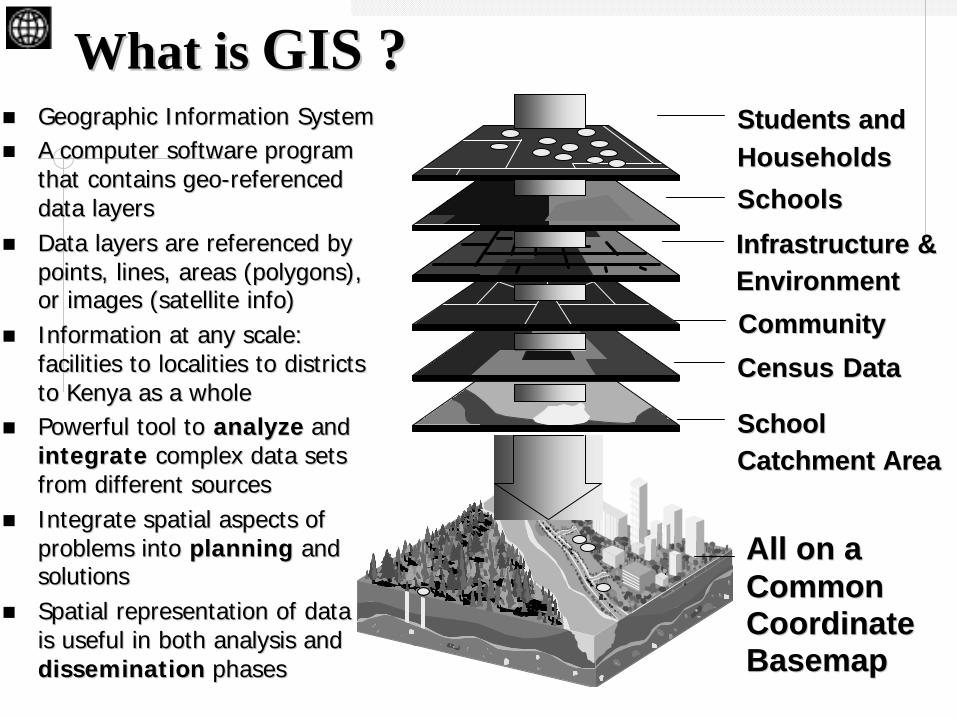
Students andStudents andHouseholdsHouseholds
SchoolsSchools
Infrastructure &Infrastructure &EnvironmentEnvironment
CommunityCommunity
SchoolSchoolCatchment Catchment AreaArea
CensusCensus DataData
All on a All on a Common Common CoordinateCoordinateBasemapBasemap
nn Geographic Information SystemGeographic Information Systemnn A computer software program A computer software program
that contains geothat contains geo--referenced referenced data layersdata layers
nn Data layers are referenced by Data layers are referenced by points, lines, areas (polygons), points, lines, areas (polygons), or images (satellite info)or images (satellite info)
nn Information at any scale: Information at any scale: facilities to localities to districts facilities to localities to districts to Kenya as a wholeto Kenya as a whole
nn Powerful tool to Powerful tool to analyze analyze andandintegrateintegrate complex data sets complex data sets from different sources from different sources
nn Integrate spatial aspects of Integrate spatial aspects of problems into problems into planningplanning and and solutionssolutions
nn Spatial representation of data Spatial representation of data is useful in both analysis and is useful in both analysis and disseminationdissemination phases phases
What isWhat is GIS ?GIS ?
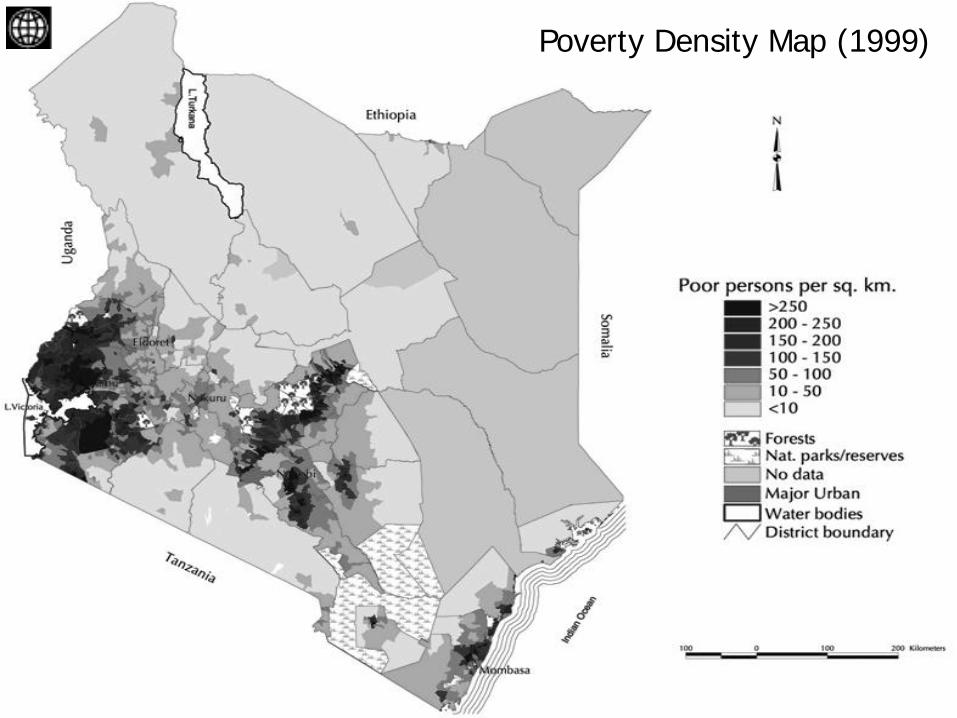
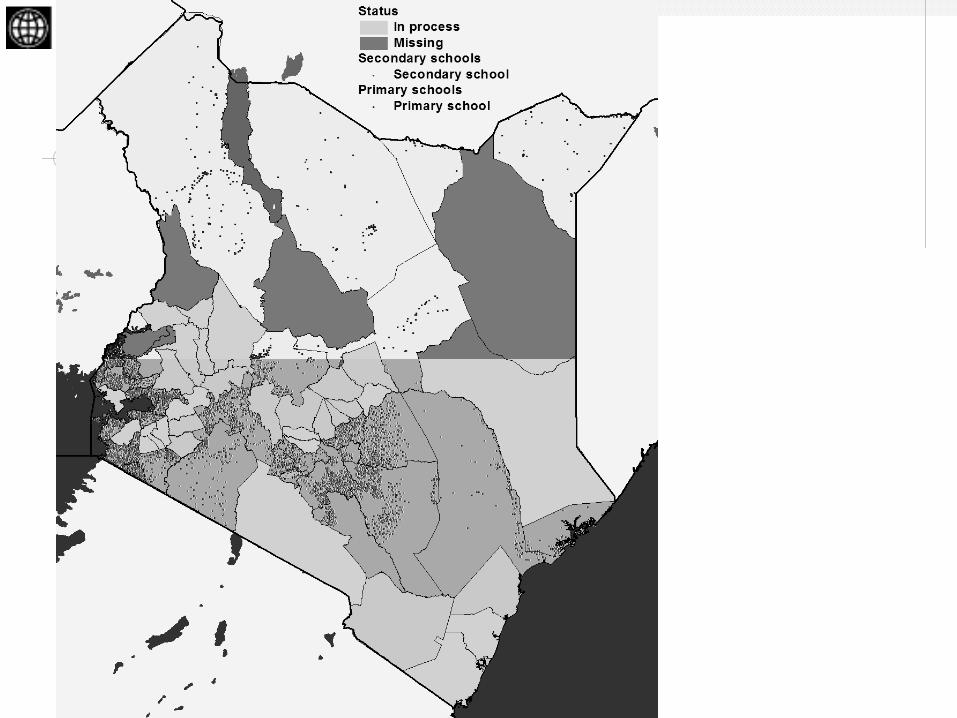
Poverty Density Map (1999)
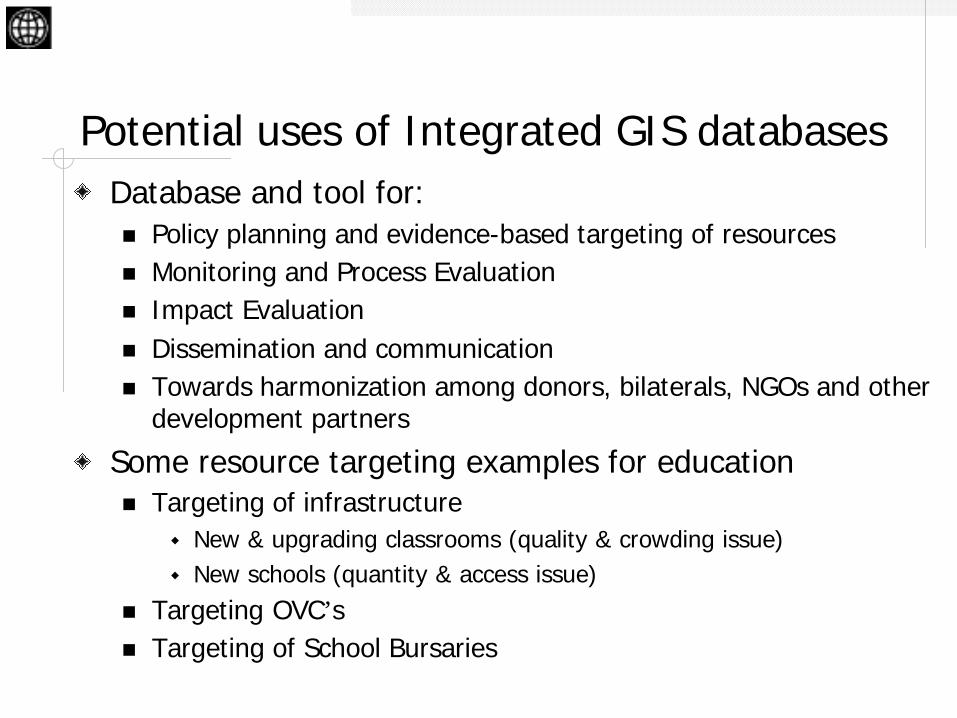
Potential uses of Integrated GIS databasesDatabase and tool for: n Policy planning and evidence-based targeting of resourcesn Monitoring and Process Evaluationn Impact Evaluationn Dissemination and communicationn Towards harmonization among donors, bilaterals, NGOs and other
development partners
Some resource targeting examples for education n Targeting of infrastructure
w New & upgrading classrooms (quality & crowding issue)w New schools (quantity & access issue)
n Targeting OVC’s n Targeting of School Bursaries
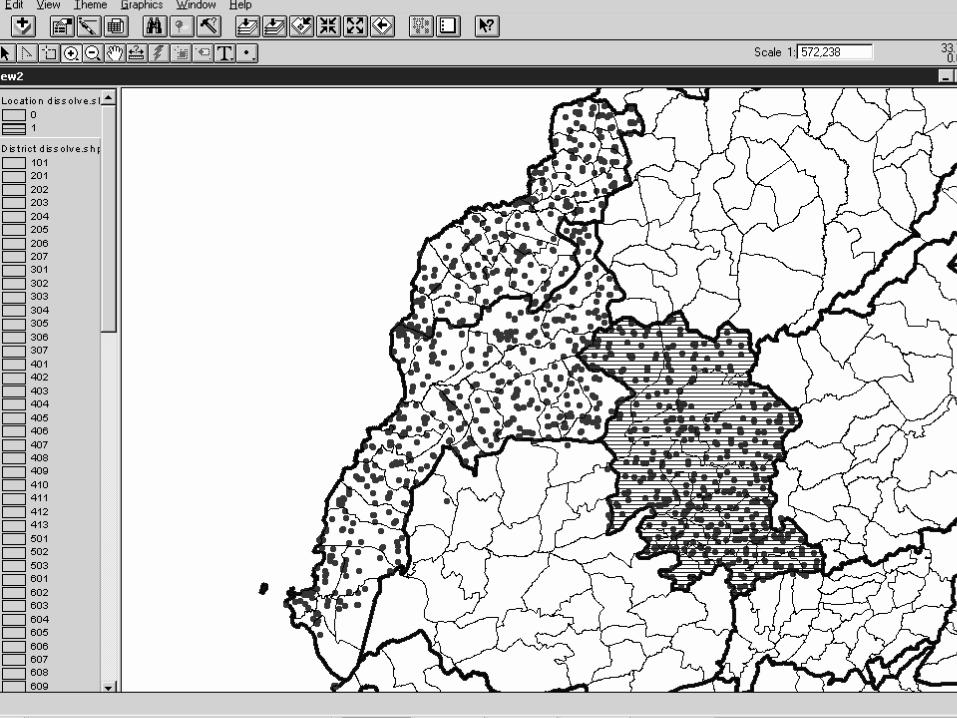
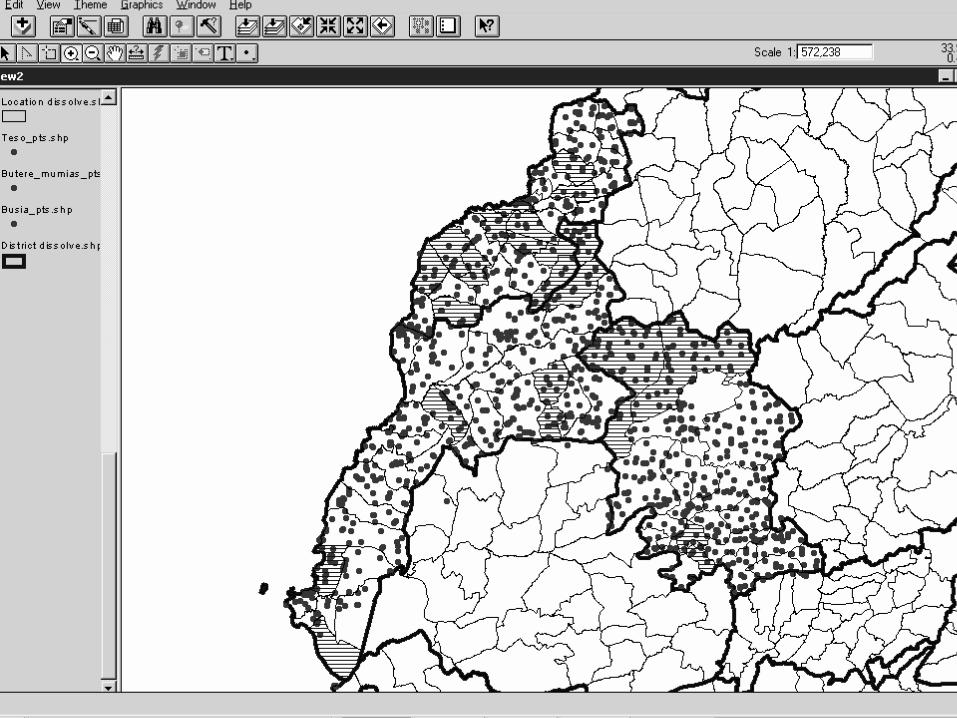
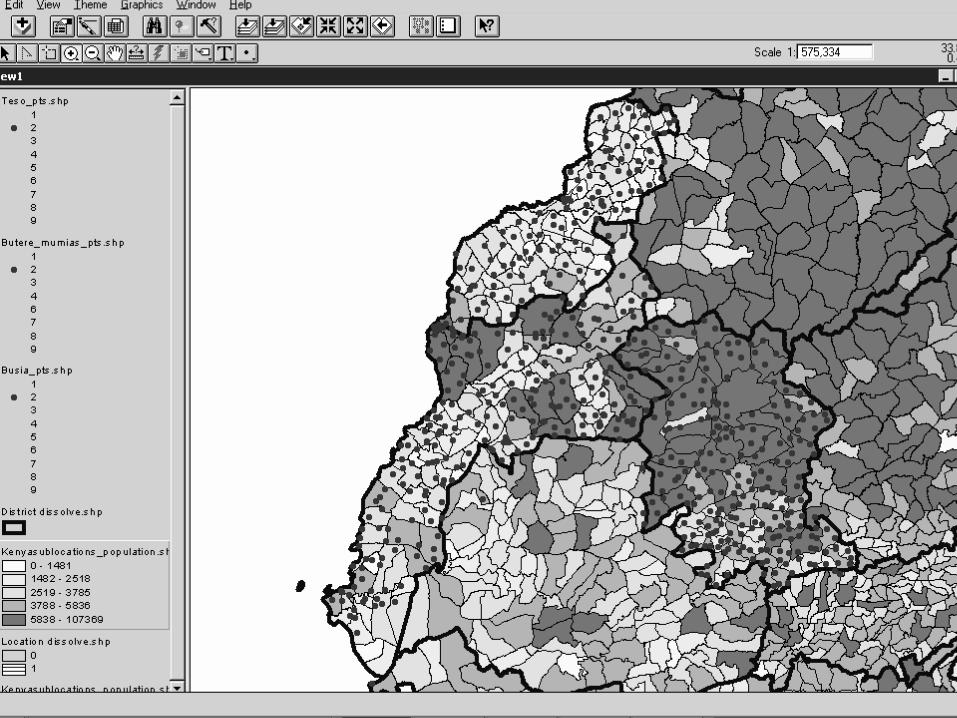
Targeting Example: Where to build new classrooms?
School census data (2003) integrated with maps:n Example for 3 districts
Geographic Targeting Rule Based on simple outcome indicator:n Ratio of number of enrolled pupils per classroom
(quality adjusted) per schooln Compute geographic averages of the indicator
2 Simulations:n Target at District Leveln Target at Location level
Targeting Example: Where to build new classrooms? (cont.)
Imagine only funds to target 1 Districts and only 3 Districts in Kenya…District-Level Simulation:n Butere-Mumias has highest crowding indicator
(relative to Busia and Teso)n Uniformly allocate funds to all schools in Butere-
Mumias
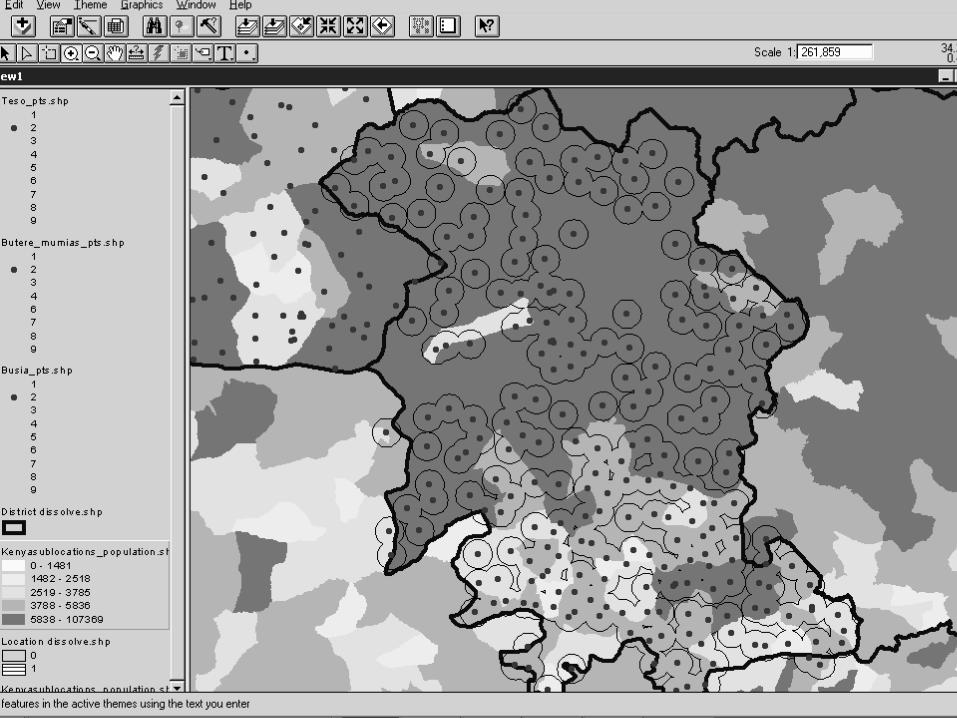
Rationale for Targeting at the Location-Leveln “Leakage”: not all schools in Butere-Mumias are over-
crowdedn “Coverage”: some schools in Busia and Teso have
over-crowding indicator that are worse than the average school in Butere-Mumias
05
010
015
0
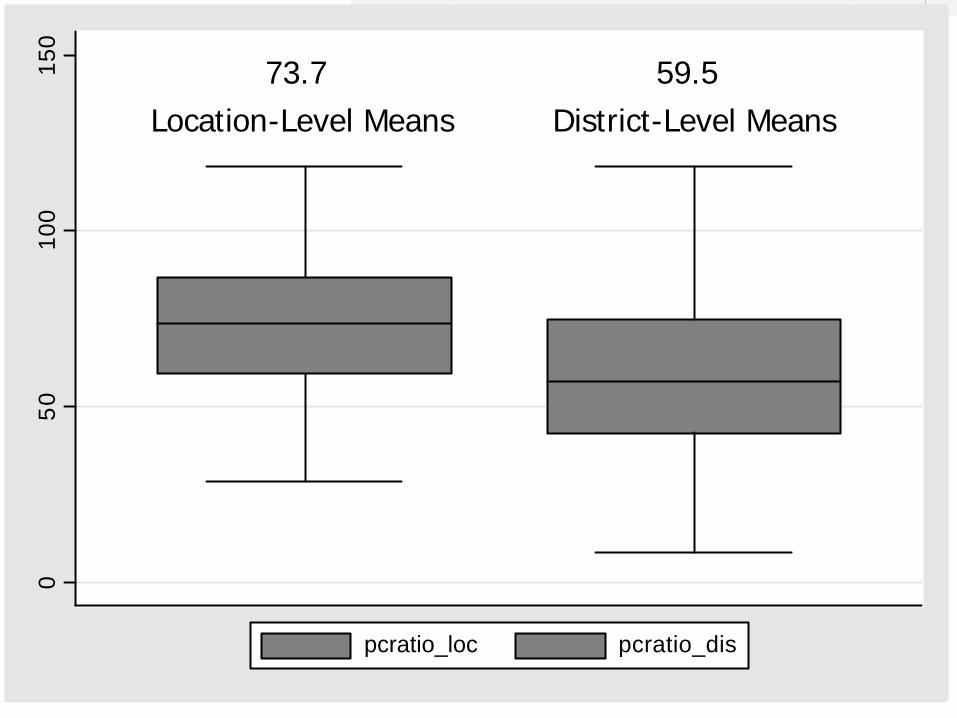
pcratio_loc pcratio_dis
Location-Level Means District-Level Means73.7 59.5
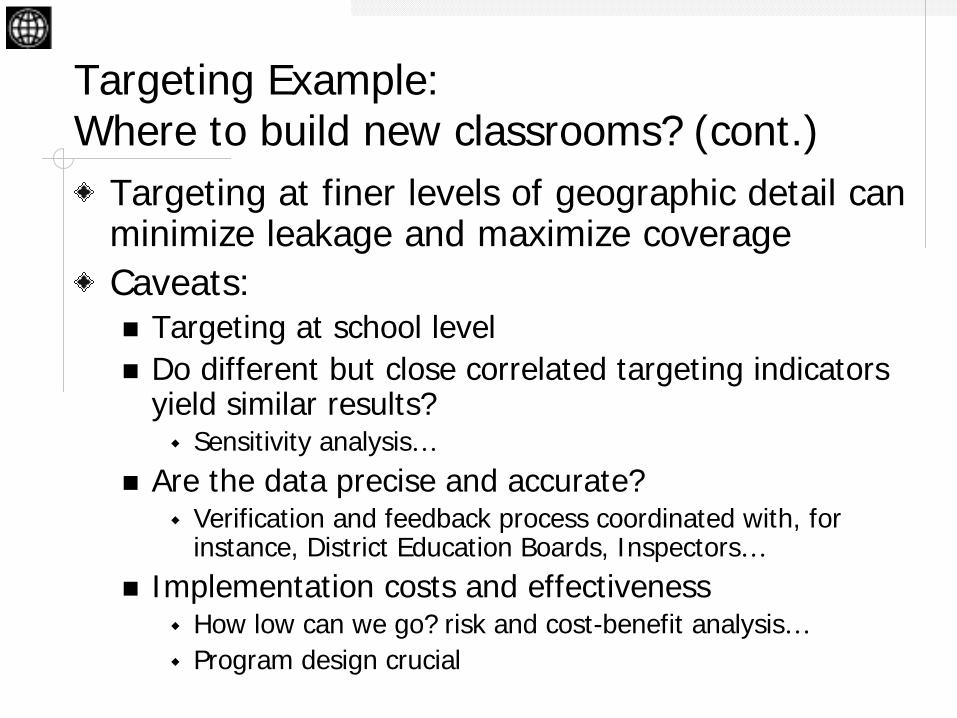
Targeting Example: Where to build new classrooms? (cont.)
Targeting at finer levels of geographic detail can minimize leakage and maximize coverageCaveats:n Targeting at school leveln Do different but close correlated targeting indicators
yield similar results? w Sensitivity analysis…
n Are the data precise and accurate?w Verification and feedback process coordinated with, for
instance, District Education Boards, Inspectors…n Implementation costs and effectiveness
w How low can we go? risk and cost-benefit analysis…w Program design crucial
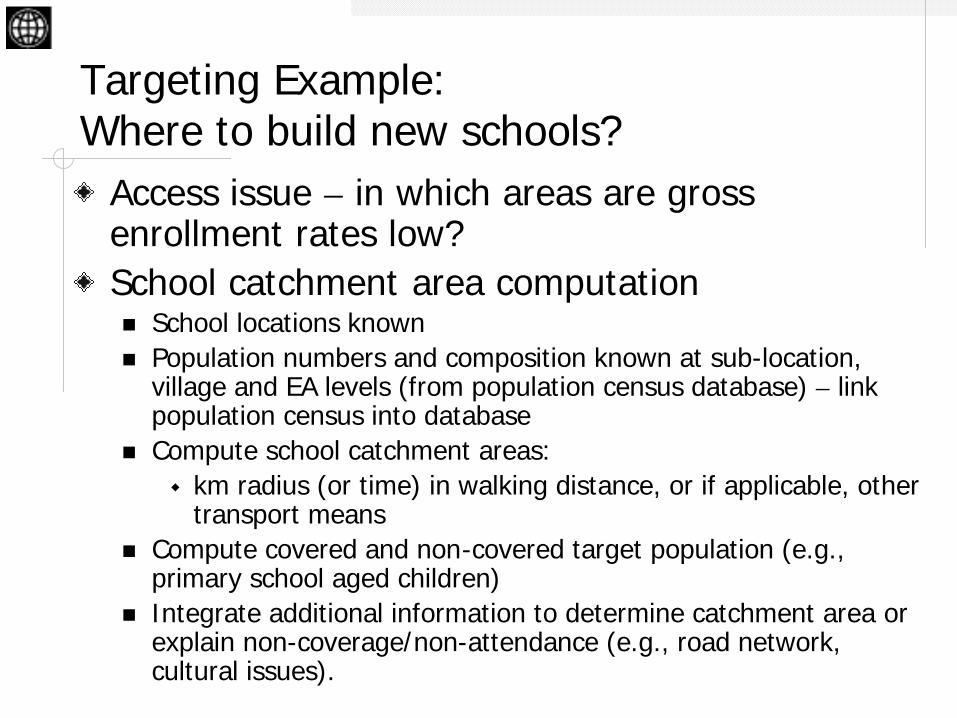
Targeting Example: Where to build new schools?
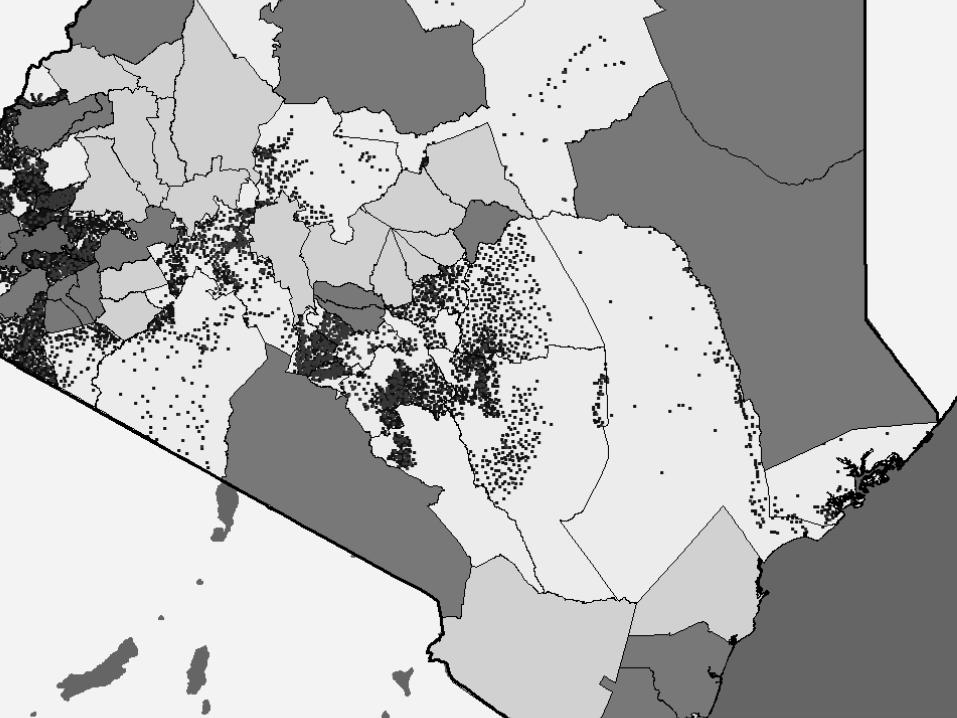
Access issue – in which areas are gross enrollment rates low?School catchment area computationn School locations knownn Population numbers and composition known at sub-location,
village and EA levels (from population census database) – link population census into database
n Compute school catchment areas: w km radius (or time) in walking distance, or if applicable, other
transport meansn Compute covered and non-covered target population (e.g.,
primary school aged children)n Integrate additional information to determine catchment area or
explain non-coverage/non-attendance (e.g., road network, cultural issues).
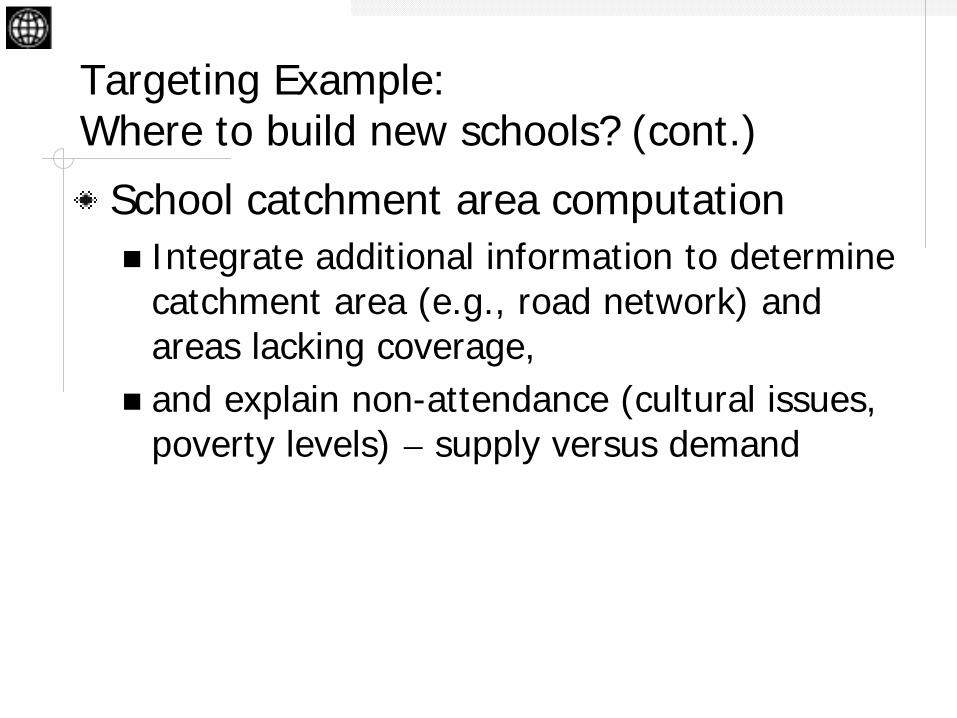
Targeting Example: Where to build new schools? (cont.)
School catchment area computationn Integrate additional information to determine
catchment area (e.g., road network) and areas lacking coverage,
n and explain non-attendance (cultural issues, poverty levels) – supply versus demand
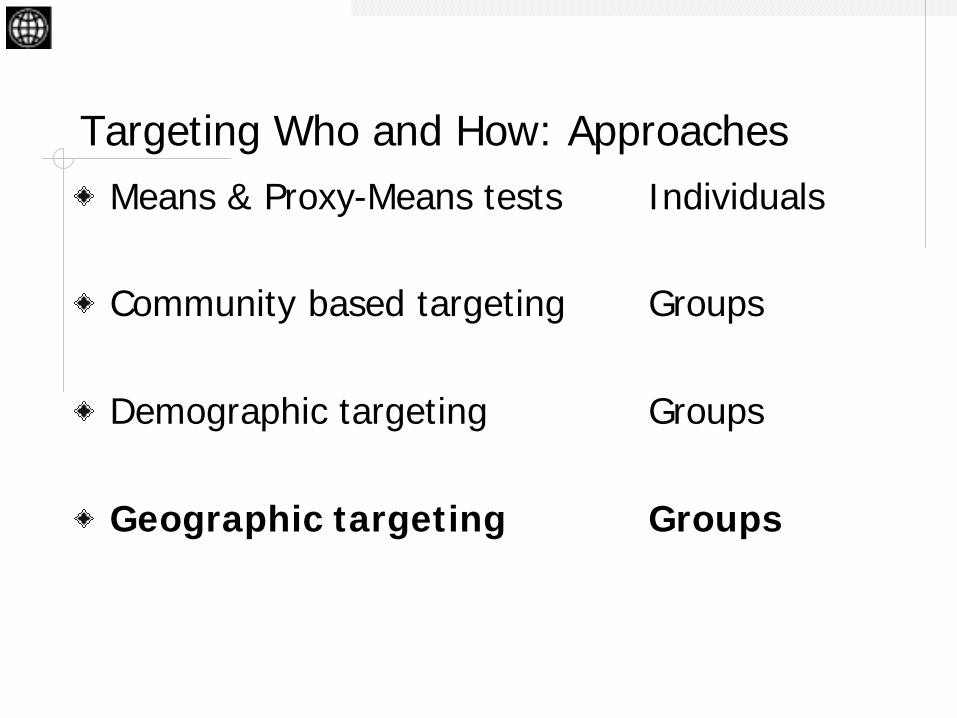
Targeting Who and How: ApproachesMeans & Proxy-Means tests Individuals
Community based targeting Groups
Demographic targeting Groups
Geographic targeting Groups
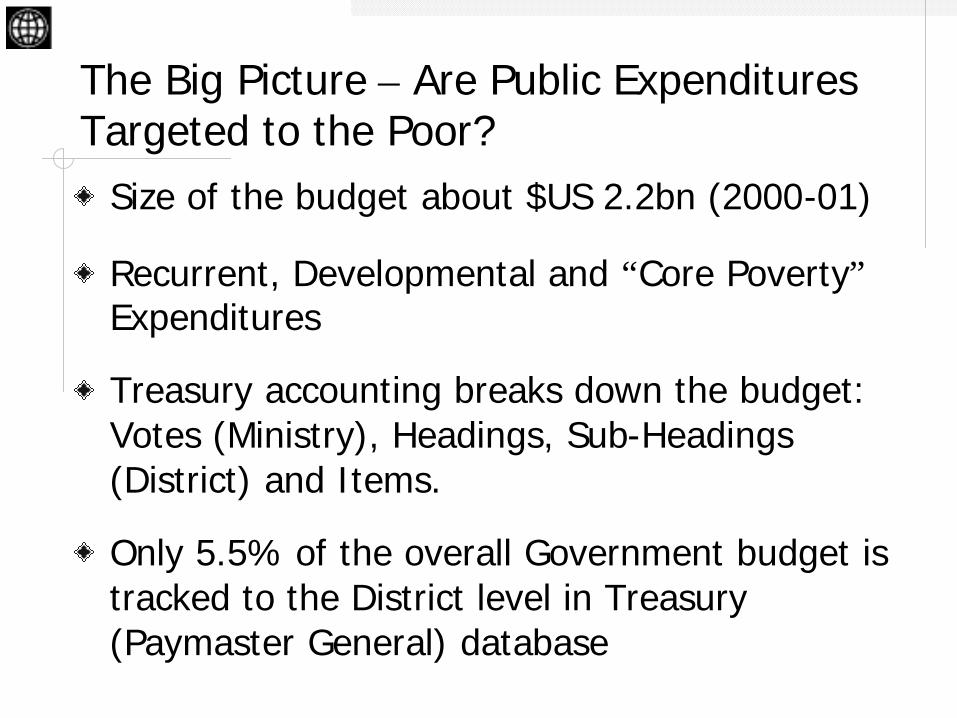
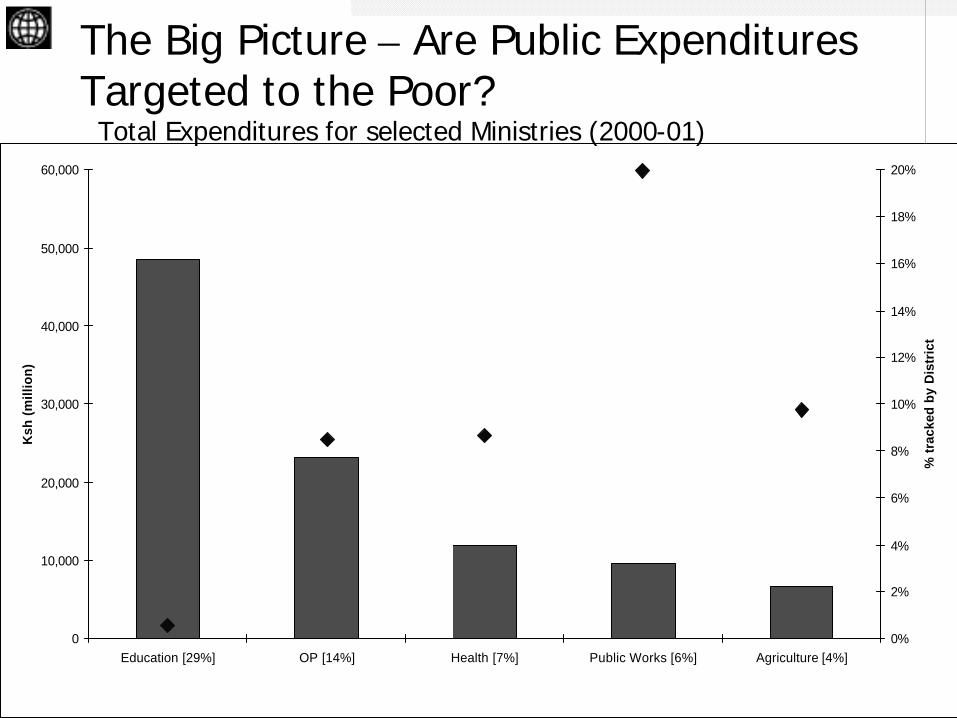
The Big Picture – Are Public Expenditures Targeted to the Poor?
Size of the budget about $US 2.2bn (2000-01)
Recurrent, Developmental and “Core Poverty”Expenditures
Treasury accounting breaks down the budget: Votes (Ministry), Headings, Sub-Headings (District) and Items.
Only 5.5% of the overall Government budget is tracked to the District level in Treasury (Paymaster General) database
The Big Picture – Are Public Expenditures Targeted to the Poor?
0
10,000
20,000
30,000
40,000
50,000
60,000
Education [29%] OP [14%] Health [7%] Public Works [6%] Agriculture [4%]
Ksh
(m
illio
n)
0%
2%
4%
6%
8%
10%
12%
14%
16%
18%
20%
% t
rack
ed b
y D
istr
ict
Total Expenditures for selected Ministries (2000-01)
The Big Picture – Are Public Expenditures Targeted to the Poor?
Key Data Sources:n Treasury - Paymaster General: printed and actual
and detail by sub-Heading (Districts)
n Auditor General: detail on divergence between printed and actual; no sub-Heading info
n Individual ministries – need to make an assessment of routinely collected data available
Currently no central system in place to track public expenditures by Ministries to Districts !!!
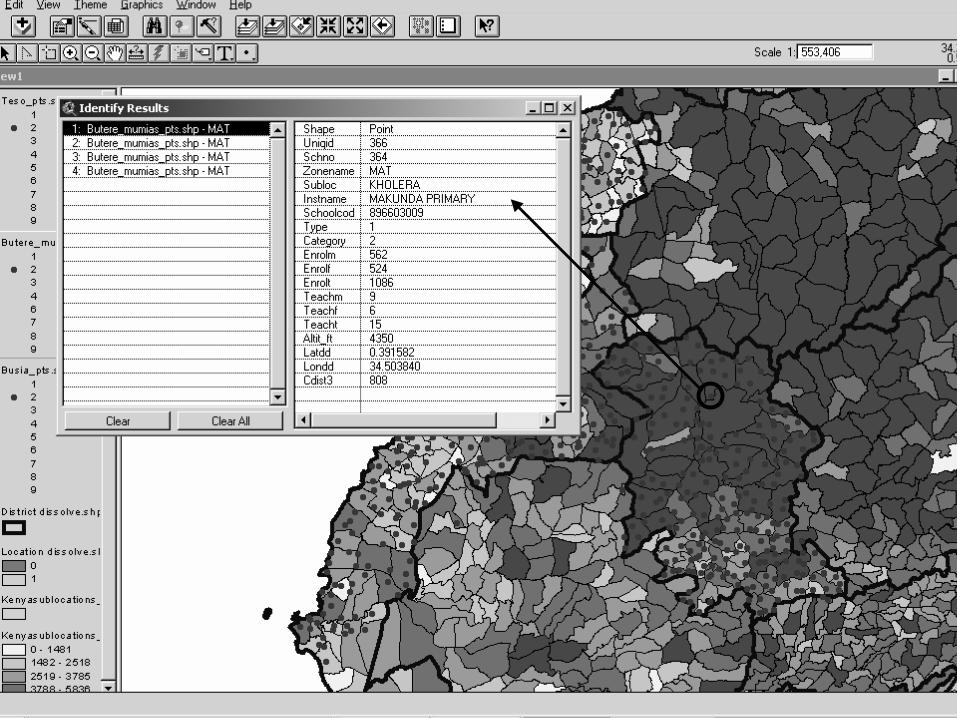
Step 1: Building up the Databasen Geo-reference service delivery locations (point
coordinates) and build the base facility-level layer
n MoEST school mapping project, Health facilities and dispensaries…
n Data verification and validation n Collaboration among actors !!!
Towards Building Integrated GIS Databases
Step 2: Integrate Data Layers - examplesn School Census Data (2003)
w At the facility level w Link MoEST school code to GIS locationw Integrate all the info collected from the school censusw EMIS data can be used for annual updating of database
n National Exam Registration and Results (annual)w At the facility level w Link MoEST to KNEC school codew KCPE and KCSE data from KNEC
n MoEST and TSC staffing and expenditure data (annual)w At the facility & administrative levels w Link MoEST to TSC codes and MoEST budget lines
Towards Building Integrated GIS Databases
Step 2: Integrate Data Layers (cont.)n Population Census Data (1999)
w Population (by age and sex) per sub-locationw Orphans (by sex and type) per sub-locationw Additional population characteristics…w Update every 10 years and annually with demographic
estimates (from CBS – MPND)
n Health facilities and dispensariesn Physical Infrastructure and Community Information
(various years and sources)w Road networkw Electricityw Water w Topographic (1:50000) maps
Building an Integrated MoEST GIS Database (cont.)
Collaboration is critical: fortunately the incentives are present – positive network externalitiesTechnical:n Verification, cleaning and facility layer compilationn Data integration: Coding Correspondence Criticaln e.g., MoEST, KNEC, TSCn e.g., clusters from different surveys
GIS Data Management System – Sustainability!Investments Neededn Physical (computers, software, etc)n Human (training, etc)
Challenges for Completing an Integrated GIS Database