Embed Size (px)
Citation preview
Page 1 of 19
TARIFF DECISION FOR SASOL OIL (PTY) LTD’S SECUNDA
TO NATREF INTEGRATED (SNI) PIPELINE
10 MAY 2018
Page 2 of 19
TABLE OF CONTENTS
Introduction ...................................................................................................................... 6
Applicable Law ................................................................................................................ 6
The Methodology ............................................................................................................. 6
Decision-Making Process ................................................................................................ 7
Assessment of the Tariff Application ............................................................................... 7
Allowable Revenue (AR) .................................................................................................. 7
Regulatory Asset Base (RAB) ......................................................................................... 8
Property, Plant and Equipment (PPE) ............................................................................. 8
Net Working Capital ......................................................................................................... 9
Weighted Average Cost of Capital (WACC) .................................................................. 11
Cost of Equity ................................................................................................................ 11
Cost of Debt ................................................................................................................... 12
Debt-to-Equity Ratio ...................................................................................................... 12
Operation Expenditure (OPEX) ..................................................................................... 13
Land Rehabilitation ........................................................................................................ 15
Depreciation .................................................................................................................. 15
Clawback ....................................................................................................................... 15
Tax Expense .................................................................................................................. 16
Allowable Revenue (AR) ................................................................................................ 17
Volumes ......................................................................................................................... 18
Tariff Design .................................................................................................................. 18
Conclusion ..................................................................................................................... 19
Page 3 of 19
LIST OF TABLES
Table 1: Tariff set for the SNI pipeline ....................................................................................... 5
Table 2: Comparison of the PPE values .................................................................................... 9
Table 3: Comparison of the Net Working Capital ......................................................................10
Table 4: Comparison of the RAB ..............................................................................................10
Table 5: WACC Calculation ......................................................................................................13
Table 6: Operating Expenses ...................................................................................................13
Table 7: Detailed Breakdown of the OPEX costs .....................................................................14
Table 8: Clawback Calculation .................................................................................................16
Table 9: Tax Expense Calculation ............................................................................................17
Table 10: Comparison of the AR values ...................................................................................17
Table 11: Volumes Details ........................................................................................................18
Table 12: Comparison in tariffs .................................................................................................19
Page 4 of 19
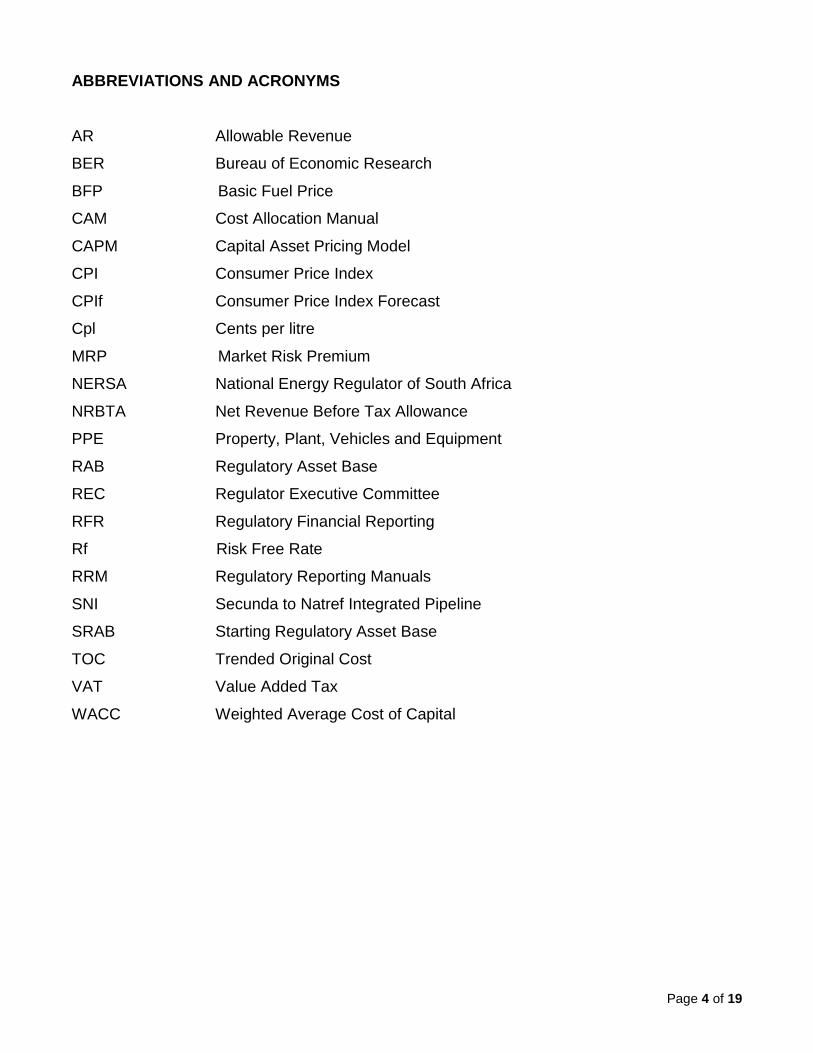
ABBREVIATIONS AND ACRONYMS
AR Allowable Revenue
BER Bureau of Economic Research
BFP Basic Fuel Price
CAM Cost Allocation Manual
CAPM Capital Asset Pricing Model
CPI Consumer Price Index
CPIf Consumer Price Index Forecast
Cpl Cents per litre
MRP Market Risk Premium
NERSA National Energy Regulator of South Africa
NRBTA Net Revenue Before Tax Allowance
PPE Property, Plant, Vehicles and Equipment
RAB Regulatory Asset Base
REC Regulator Executive Committee
RFR Regulatory Financial Reporting
Rf Risk Free Rate
RRM Regulatory Reporting Manuals
SNI Secunda to Natref Integrated Pipeline
SRAB Starting Regulatory Asset Base
TOC Trended Original Cost
VAT Value Added Tax
WACC Weighted Average Cost of Capital
Page 5 of 19
THE NATIONAL ENERGY REGULATOR OF SOUTH AFRICA
In the matter regarding
THE APPLICATION FOR SETTING A TARIFF FOR THE SECUNDA TO NATREF
INTEGRATED (SNI) PIPELINE FOR THE 2018/19 TARIFF YEAR
By
SASOL OIL (PTY) LTD
_______________________________________________________________________
THE DECISION
_______________________________________________________________________
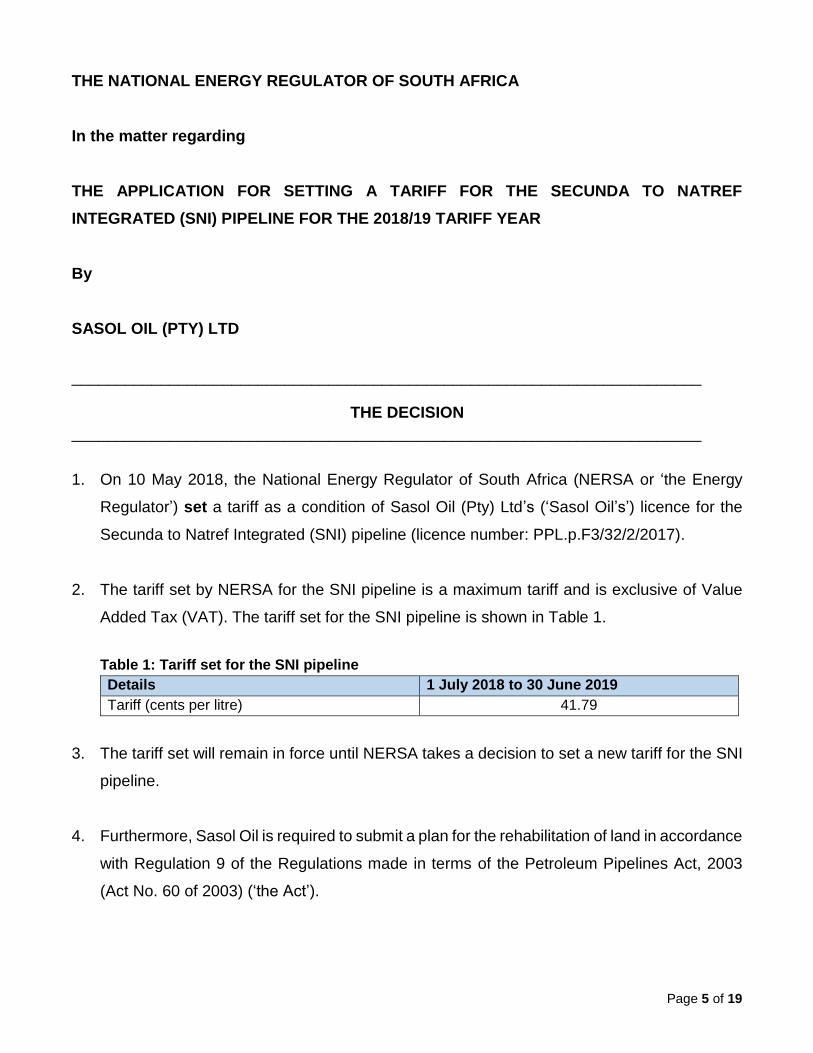
1. On 10 May 2018, the National Energy Regulator of South Africa (NERSA or ‘the Energy
Regulator’) set a tariff as a condition of Sasol Oil (Pty) Ltd’s (‘Sasol Oil’s’) licence for the
Secunda to Natref Integrated (SNI) pipeline (licence number: PPL.p.F3/32/2/2017).
2. The tariff set by NERSA for the SNI pipeline is a maximum tariff and is exclusive of Value
Added Tax (VAT). The tariff set for the SNI pipeline is shown in Table 1.
Table 1: Tariff set for the SNI pipeline
Details 1 July 2018 to 30 June 2019
Tariff (cents per litre) 41.79
3. The tariff set will remain in force until NERSA takes a decision to set a new tariff for the SNI
pipeline.
4. Furthermore, Sasol Oil is required to submit a plan for the rehabilitation of land in accordance
with Regulation 9 of the Regulations made in terms of the Petroleum Pipelines Act, 2003
(Act No. 60 of 2003) (‘the Act’).

Page 6 of 19
___________________________________________________________________________
REASONS FOR DECISION
___________________________________________________________________________
Introduction
1. On 27 January 2011, the National Energy Regulator of South Africa (NERSA or ‘the Energy
Regulator’) issued a licence with conditions to Sasol Oil (Pty) Ltd (‘Sasol Oil’) for the operation
of a pipeline from the Sasol Oil (Pty) Ltd coal-to-liquids refinery at Secunda to the Natref
crude oil refinery at Sasolburg.
2. On 30 November 2017, Sasol Oil submitted a tariff application for the Secunda to Natref
Integrated (SNI) pipeline. The tariff application is for the period 1 July 2018 to 30 June 2019.
3. Sasol Oil applied for a tariff of 40.93 cents per litre (cpl) for the period 1 July 2018 to 30 June
2019. The tariff applied for is a maximum tariff and is exclusive of Value Added Tax (VAT).
4. The tariff applied for by Sasol Oil is based on the total Allowable Revenue (AR) divided by
the total volume in litres.
5. A detailed analysis of the tariff application is provided in the following paragraphs.
Applicable Law
6. The legal basis for NERSA to set tariffs for petroleum pipelines is derived from the National
Energy Regulator Act, 2004 (Act No. 40 of 2004) (‘the NERSA Act’), read with the Petroleum
Pipelines Act, 2003 (Act No. 60 of 2003) (‘the Act’)1.
The Methodology
7. NERSA is required by section 28(2)(a)(i) of the Act to set tariffs based on a systematic
methodology applicable on a consistent and comparable basis. Sasol Oil used the Tariff
1 Available at www.nersa.org.za
Page 7 of 19
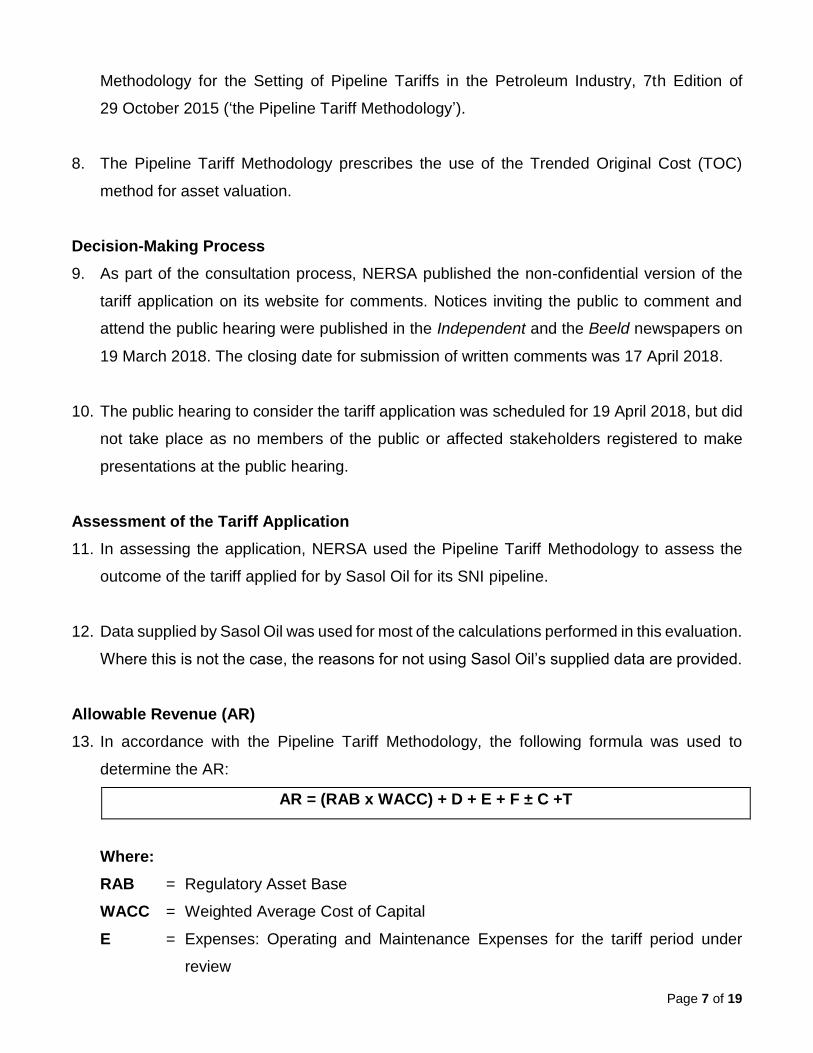
Methodology for the Setting of Pipeline Tariffs in the Petroleum Industry, 7th Edition of
29 October 2015 (‘the Pipeline Tariff Methodology’).
8. The Pipeline Tariff Methodology prescribes the use of the Trended Original Cost (TOC)
method for asset valuation.
Decision-Making Process
9. As part of the consultation process, NERSA published the non-confidential version of the
tariff application on its website for comments. Notices inviting the public to comment and
attend the public hearing were published in the Independent and the Beeld newspapers on
19 March 2018. The closing date for submission of written comments was 17 April 2018.
10. The public hearing to consider the tariff application was scheduled for 19 April 2018, but did
not take place as no members of the public or affected stakeholders registered to make
presentations at the public hearing.
Assessment of the Tariff Application
11. In assessing the application, NERSA used the Pipeline Tariff Methodology to assess the
outcome of the tariff applied for by Sasol Oil for its SNI pipeline.
12. Data supplied by Sasol Oil was used for most of the calculations performed in this evaluation.
Where this is not the case, the reasons for not using Sasol Oil’s supplied data are provided.
Allowable Revenue (AR)
13. In accordance with the Pipeline Tariff Methodology, the following formula was used to
determine the AR:
AR = (RAB x WACC) + D + E + F ± C +T
Where:
RAB = Regulatory Asset Base
WACC = Weighted Average Cost of Capital
E = Expenses: Operating and Maintenance Expenses for the tariff period under
review
Page 8 of 19
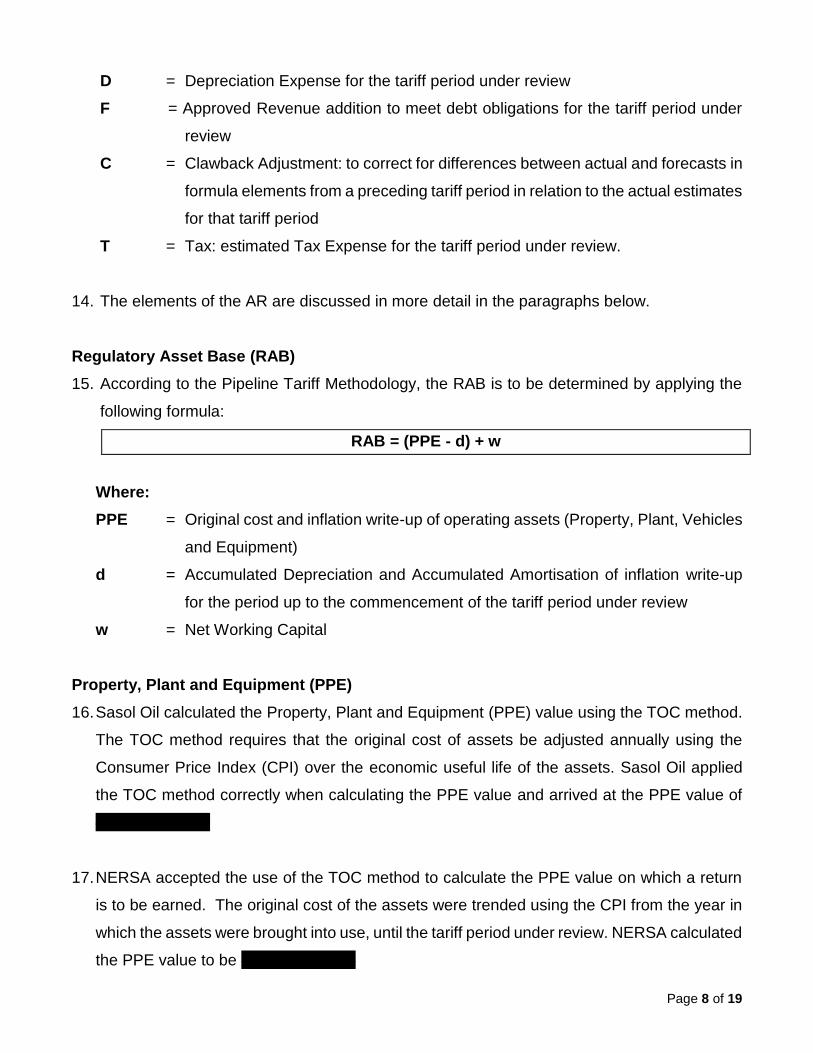
D = Depreciation Expense for the tariff period under review
F = Approved Revenue addition to meet debt obligations for the tariff period under
review
C = Clawback Adjustment: to correct for differences between actual and forecasts in
formula elements from a preceding tariff period in relation to the actual estimates
for that tariff period
T = Tax: estimated Tax Expense for the tariff period under review.
14. The elements of the AR are discussed in more detail in the paragraphs below.
Regulatory Asset Base (RAB)
15. According to the Pipeline Tariff Methodology, the RAB is to be determined by applying the
following formula:
RAB = (PPE - d) + w
Where:
PPE = Original cost and inflation write-up of operating assets (Property, Plant, Vehicles
and Equipment)
d = Accumulated Depreciation and Accumulated Amortisation of inflation write-up
for the period up to the commencement of the tariff period under review
w = Net Working Capital
Property, Plant and Equipment (PPE)
16. Sasol Oil calculated the Property, Plant and Equipment (PPE) value using the TOC method.
The TOC method requires that the original cost of assets be adjusted annually using the
Consumer Price Index (CPI) over the economic useful life of the assets. Sasol Oil applied
the TOC method correctly when calculating the PPE value and arrived at the PPE value of
R880.18 million.
17. NERSA accepted the use of the TOC method to calculate the PPE value on which a return
is to be earned. The original cost of the assets were trended using the CPI from the year in
which the assets were brought into use, until the tariff period under review. NERSA calculated
the PPE value to be R858.88 million.
Page 9 of 19
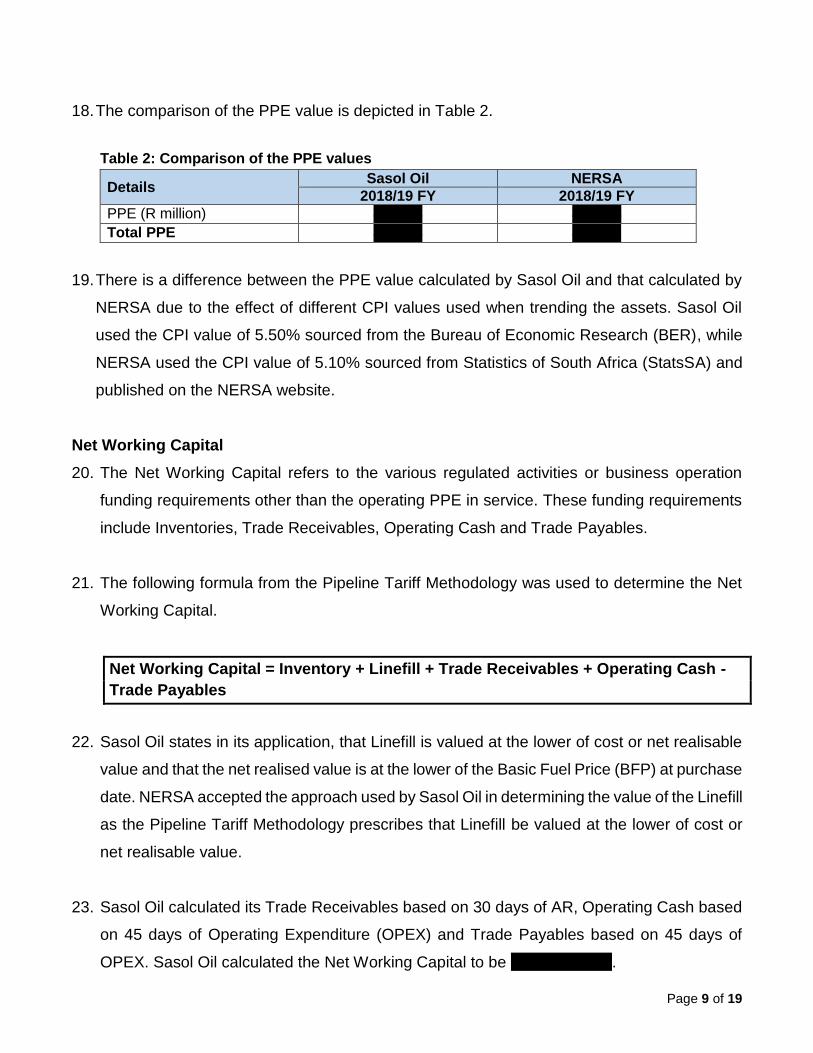
18. The comparison of the PPE value is depicted in Table 2.
Table 2: Comparison of the PPE values
Details Sasol Oil NERSA
2018/19 FY 2018/19 FY
PPE (R million) 880.18 858.88 Total PPE 880.18 858.88
19. There is a difference between the PPE value calculated by Sasol Oil and that calculated by
NERSA due to the effect of different CPI values used when trending the assets. Sasol Oil
used the CPI value of 5.50% sourced from the Bureau of Economic Research (BER), while
NERSA used the CPI value of 5.10% sourced from Statistics of South Africa (StatsSA) and
published on the NERSA website.
Net Working Capital
20. The Net Working Capital refers to the various regulated activities or business operation
funding requirements other than the operating PPE in service. These funding requirements
include Inventories, Trade Receivables, Operating Cash and Trade Payables.
21. The following formula from the Pipeline Tariff Methodology was used to determine the Net
Working Capital.
Net Working Capital = Inventory + Linefill + Trade Receivables + Operating Cash -
Trade Payables
22. Sasol Oil states in its application, that Linefill is valued at the lower of cost or net realisable
value and that the net realised value is at the lower of the Basic Fuel Price (BFP) at purchase
date. NERSA accepted the approach used by Sasol Oil in determining the value of the Linefill
as the Pipeline Tariff Methodology prescribes that Linefill be valued at the lower of cost or
net realisable value.
23. Sasol Oil calculated its Trade Receivables based on 30 days of AR, Operating Cash based
on 45 days of Operating Expenditure (OPEX) and Trade Payables based on 45 days of
OPEX. Sasol Oil calculated the Net Working Capital to be R61.23 million.
Page 10 of 19
24. Similarly, NERSA applied its Pipeline Tariff Methodology, which prescribes that Trade
Receivables be calculated on 30 days of AR, Operating Cash on 45 days of OPEX and
Trade Payables on 45 days of OPEX.
25. NERSA calculated the Net Working Capital to be R61.48 million.
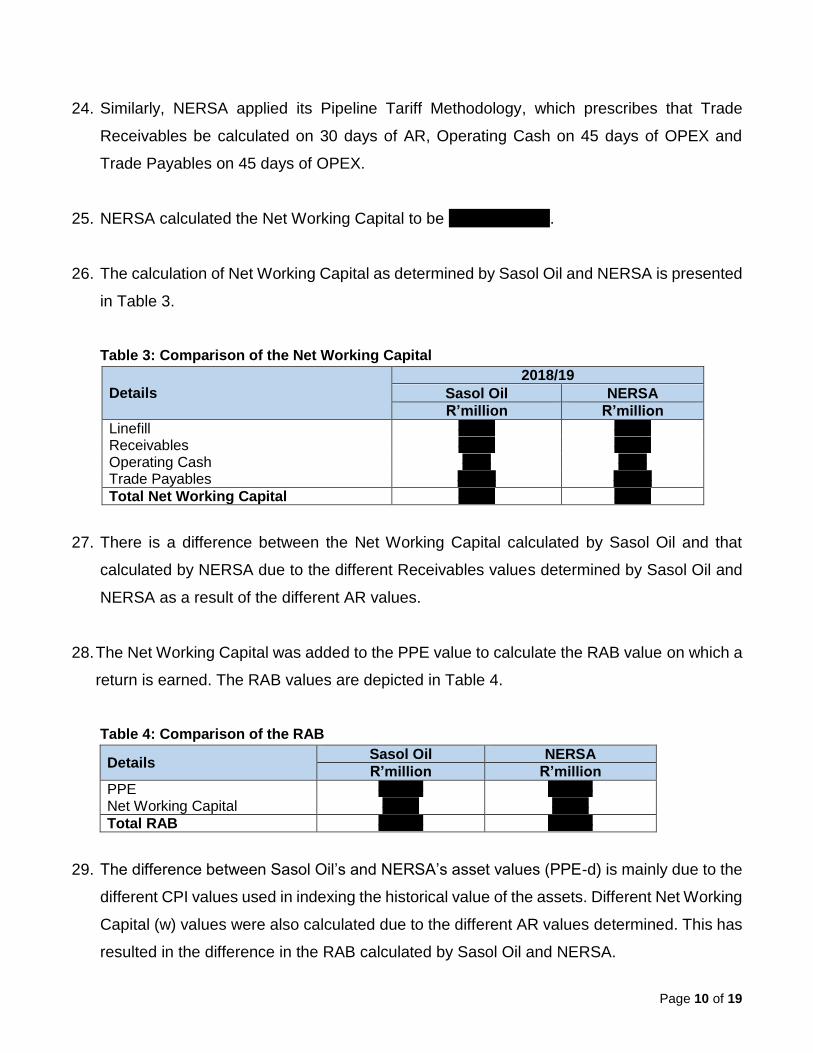
26. The calculation of Net Working Capital as determined by Sasol Oil and NERSA is presented
in Table 3.
Table 3: Comparison of the Net Working Capital
Details 2018/19
Sasol Oil NERSA
R’million R’million
Linefill 49.55 49.55 Receivables 11.68 11.93 Operating Cash 2.24 2.24 Trade Payables (2.24) (2.24)
Total Net Working Capital 61.23 61.48
27. There is a difference between the Net Working Capital calculated by Sasol Oil and that
calculated by NERSA due to the different Receivables values determined by Sasol Oil and
NERSA as a result of the different AR values.
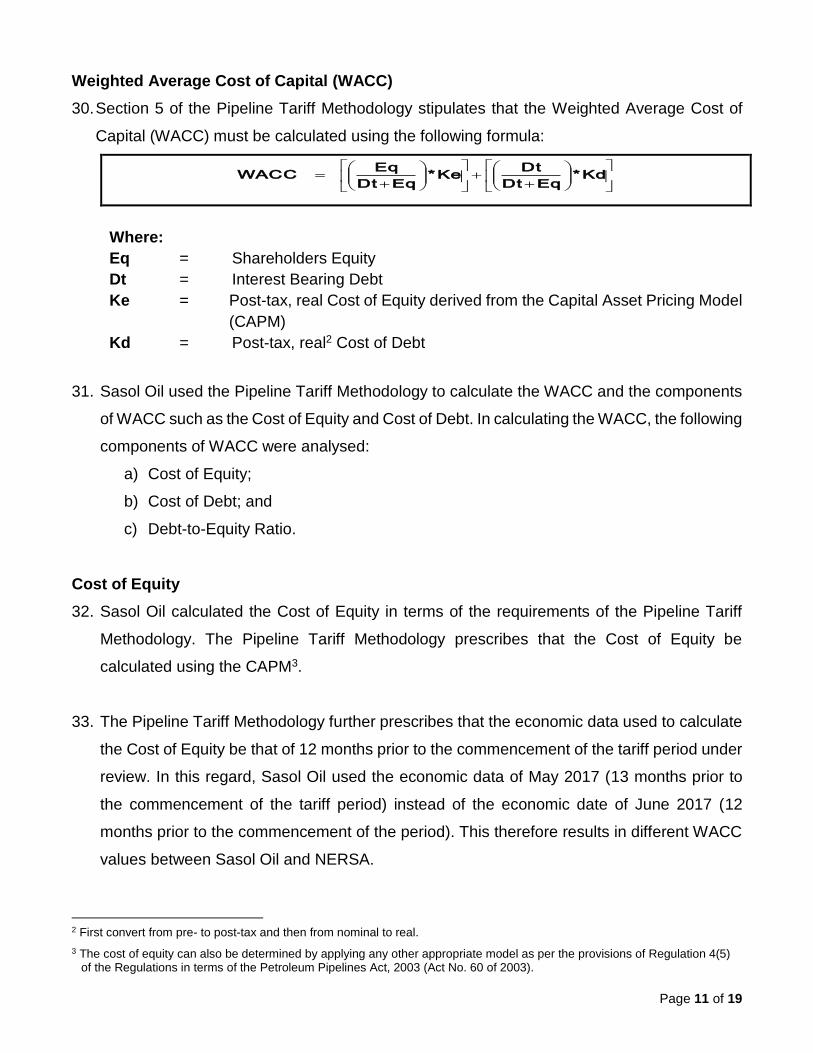
28. The Net Working Capital was added to the PPE value to calculate the RAB value on which a
return is earned. The RAB values are depicted in Table 4.
Table 4: Comparison of the RAB
Details Sasol Oil NERSA
R’million R’million
PPE 880.18 858.88 Net Working Capital 61.23 61.48
Total RAB 941.41 920.36
29. The difference between Sasol Oil’s and NERSA’s asset values (PPE-d) is mainly due to the
different CPI values used in indexing the historical value of the assets. Different Net Working
Capital (w) values were also calculated due to the different AR values determined. This has
resulted in the difference in the RAB calculated by Sasol Oil and NERSA.
Page 11 of 19
Weighted Average Cost of Capital (WACC)
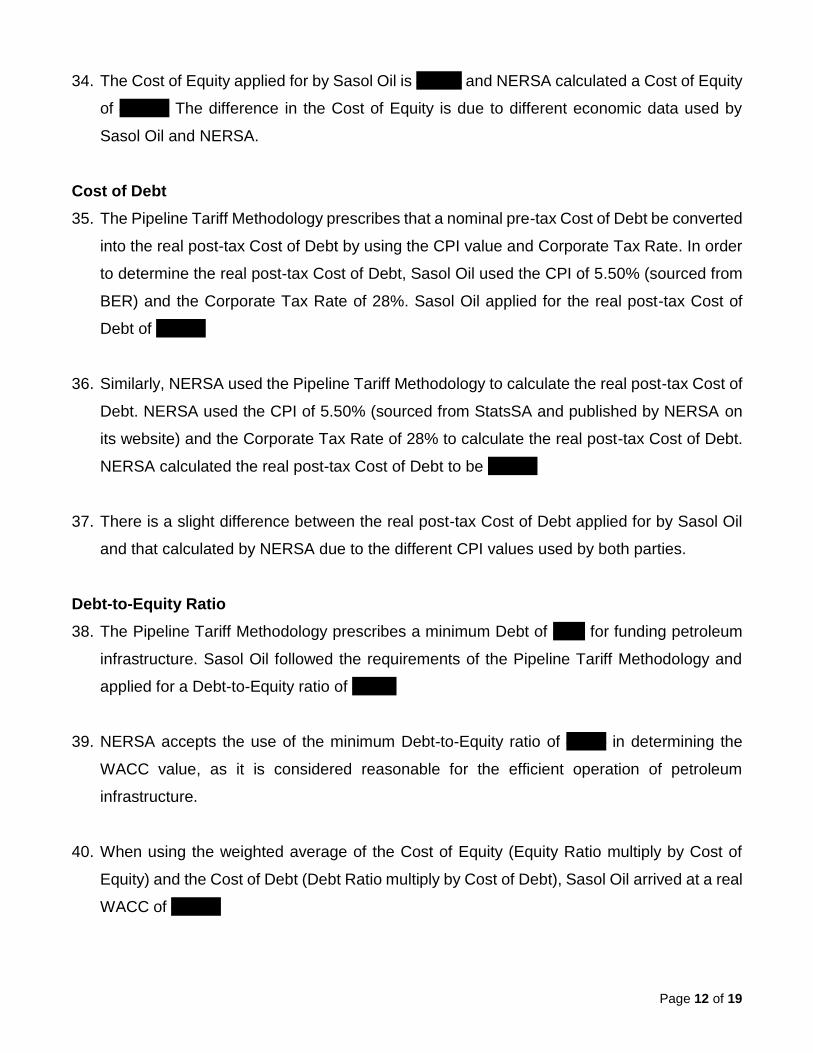
30. Section 5 of the Pipeline Tariff Methodology stipulates that the Weighted Average Cost of
Capital (WACC) must be calculated using the following formula:
Where:
Eq = Shareholders Equity
Dt = Interest Bearing Debt
Ke = Post-tax, real Cost of Equity derived from the Capital Asset Pricing Model
(CAPM)
Kd = Post-tax, real2 Cost of Debt
31. Sasol Oil used the Pipeline Tariff Methodology to calculate the WACC and the components
of WACC such as the Cost of Equity and Cost of Debt. In calculating the WACC, the following
components of WACC were analysed:
a) Cost of Equity;
b) Cost of Debt; and
c) Debt-to-Equity Ratio.
Cost of Equity
32. Sasol Oil calculated the Cost of Equity in terms of the requirements of the Pipeline Tariff
Methodology. The Pipeline Tariff Methodology prescribes that the Cost of Equity be
calculated using the CAPM3.
33. The Pipeline Tariff Methodology further prescribes that the economic data used to calculate
the Cost of Equity be that of 12 months prior to the commencement of the tariff period under
review. In this regard, Sasol Oil used the economic data of May 2017 (13 months prior to
the commencement of the tariff period) instead of the economic date of June 2017 (12
months prior to the commencement of the period). This therefore results in different WACC
values between Sasol Oil and NERSA.
2 First convert from pre- to post-tax and then from nominal to real.
3 The cost of equity can also be determined by applying any other appropriate model as per the provisions of Regulation 4(5) of the Regulations in terms of the Petroleum Pipelines Act, 2003 (Act No. 60 of 2003).
Kd*
EqDt
DtKe*
EqDt
Eq WACC
Page 12 of 19
34. The Cost of Equity applied for by Sasol Oil is 8.27% and NERSA calculated a Cost of Equity
of 8.03%. The difference in the Cost of Equity is due to different economic data used by
Sasol Oil and NERSA.
Cost of Debt
35. The Pipeline Tariff Methodology prescribes that a nominal pre-tax Cost of Debt be converted
into the real post-tax Cost of Debt by using the CPI value and Corporate Tax Rate. In order
to determine the real post-tax Cost of Debt, Sasol Oil used the CPI of 5.50% (sourced from
BER) and the Corporate Tax Rate of 28%. Sasol Oil applied for the real post-tax Cost of
Debt of 1.09%.
36. Similarly, NERSA used the Pipeline Tariff Methodology to calculate the real post-tax Cost of
Debt. NERSA used the CPI of 5.50% (sourced from StatsSA and published by NERSA on
its website) and the Corporate Tax Rate of 28% to calculate the real post-tax Cost of Debt.
NERSA calculated the real post-tax Cost of Debt to be 1.42%.
37. There is a slight difference between the real post-tax Cost of Debt applied for by Sasol Oil
and that calculated by NERSA due to the different CPI values used by both parties.
Debt-to-Equity Ratio
38. The Pipeline Tariff Methodology prescribes a minimum Debt of 30% for funding petroleum
infrastructure. Sasol Oil followed the requirements of the Pipeline Tariff Methodology and
applied for a Debt-to-Equity ratio of 30:70.
39. NERSA accepts the use of the minimum Debt-to-Equity ratio of 30:70 in determining the
WACC value, as it is considered reasonable for the efficient operation of petroleum
infrastructure.
40. When using the weighted average of the Cost of Equity (Equity Ratio multiply by Cost of
Equity) and the Cost of Debt (Debt Ratio multiply by Cost of Debt), Sasol Oil arrived at a real
WACC of 6.12%.

Page 13 of 19
41. NERSA also used the Pipeline Tariff Methodology and calculated a WACC of 6.05%. The
comparison of the WACC values calculated by Sasol Oil and NERSA is shown in Table 5.
Table 5: WACC Calculation
Details Sasol Oil NERSA
Risk Free Rate (before-tax real) 4.68% 4.70% Market Risk Premium (real) 4.55% 4.21% Beta 0.79 0.79 Cost of Equity (post-tax real) 8.27% 8.03%
Cost of Debt (pre-tax) 9.15% 9.15% Corporate Tax Rate 28% 28% Nominal Cost of Debt 6.59% 6.59% CPI forecast 5.50% 5.10% Cost of Debt (post-tax real) 1.09% 1.42%
Capital Structure: Debt Ratio 30% 30% Equity Ratio 70% 70%
WACC 6.12% 6.05%
Operation Expenditure (OPEX)
42. Regulation 5(2) read with regulation 4(2) (a) of the Regulations provides that the tariffs
approved by NERSA must enable an efficient licensee to recover the reasonable operational
and maintenance expenses of the storage facility in the year in which they are incurred.
43. Sasol Oil has an approved Cost Allocation Manual (CAM). Corporate costs and group
services costs are allocated in accordance with the approved CAM.
44. Table 6 provides a comparison between the operating expenses approved for the 2017/18
tariff period and that applied for in the 2018/19 tariff period.
Table 6: Operating Expenses
Details 2017/18 RfD 2018/19 FY % Difference
R’million R’million
Direct Cost Centre 11 657 026 12 712 333 9,05%
Shared services cost 1 130 400 1 074 605 -4,94%
General Managers Cost 1 071 987 1 097 281 2,36%
Corporate division expenses 1 131 811 1 152 758 1,85%
Depot management cost 3 203 523 3 731 172 16,47%
Total OPEX 18 194 747 19 768 149 8,65%
Page 14 of 19
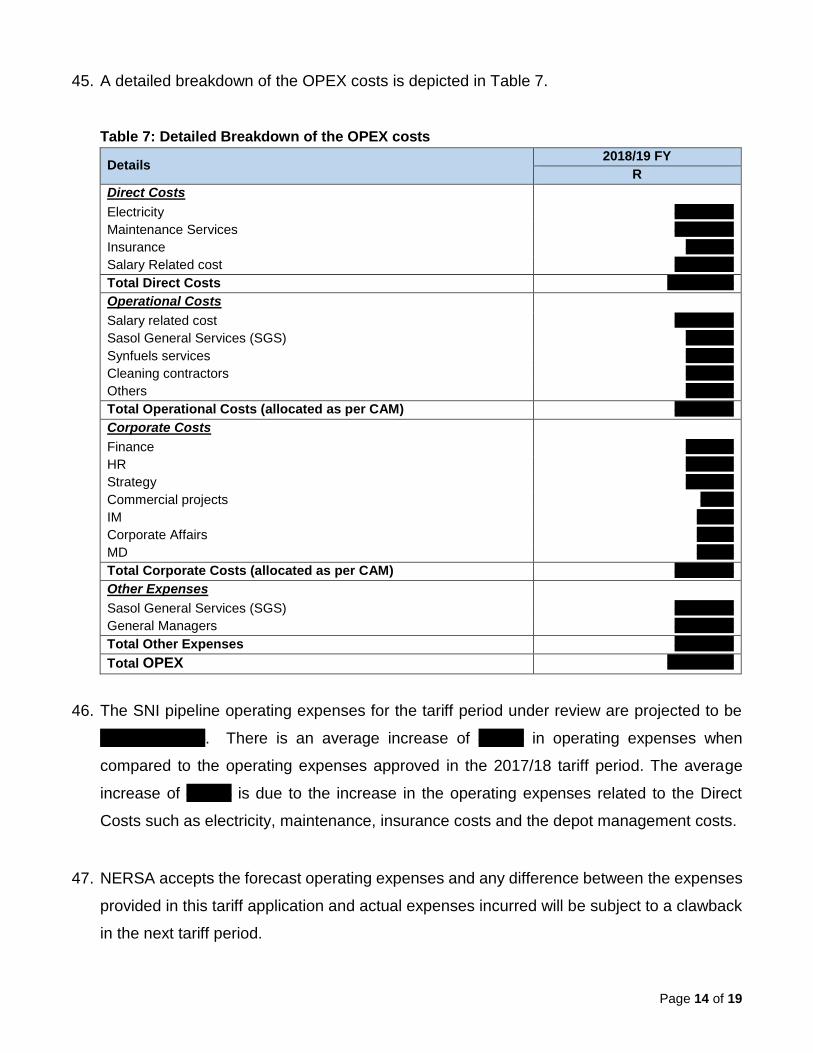
45. A detailed breakdown of the OPEX costs is depicted in Table 7.
Table 7: Detailed Breakdown of the OPEX costs
Details 2018/19 FY
R
Direct Costs
Electricity 6 214 242
Maintenance Services 4 160 331
Insurance 671 145
Salary Related cost 1 666 615
Total Direct Costs 12 712 333
Operational Costs
Salary related cost 2 528 797
Sasol General Services (SGS) 496 148
Synfuels services 216 496
Cleaning contractors 174 551
Others 315 180
Total Operational Costs (allocated as per CAM) 3 731 172
Corporate Costs
Finance 728 261
HR 187 403
Strategy 132 461
Commercial projects 4 261
IM 19076
Corporate Affairs 61582
MD 19714
Total Corporate Costs (allocated as per CAM) 1 152 758
Other Expenses
Sasol General Services (SGS) 1 074 605
General Managers 1 097 281
Total Other Expenses 2 171 886
Total OPEX 19 768 149
46. The SNI pipeline operating expenses for the tariff period under review are projected to be
R19.77 million. There is an average increase of 8.65% in operating expenses when
compared to the operating expenses approved in the 2017/18 tariff period. The average
increase of 8.65% is due to the increase in the operating expenses related to the Direct
Costs such as electricity, maintenance, insurance costs and the depot management costs.
47. NERSA accepts the forecast operating expenses and any difference between the expenses
provided in this tariff application and actual expenses incurred will be subject to a clawback
in the next tariff period.
Page 15 of 19
Land Rehabilitation 48. No provision for Land Rehabilitation costs has been submitted by Sasol Oil in this tariff
application. Additional information was requested from Sasol Oil to ensure compliance with
Regulation 9 of the Regulations, made in terms of the Act. At a meeting held on 20 April
2018, Sasol Oil indicated that it cannot include the Land Rehabilitation cost in the AR, as
Sasol Oil will not be able to recover the cost through tariffs since Sasol Oil does not have
third-party access at its SNI pipeline. Sasol Oil further stated that it makes provision in its
financial statements in case there is a need to rehabilitate its facility.
Depreciation 49. Sasol Oil depreciated its assets (excluding land) on a straight-line basis and the Depreciation
calculated by Sasol Oil is R31.39 million. NERSA in its evaluation also depreciated the
assets (including land) on a straight-line basis and calculated the Depreciation to be R34.32
million. There is a difference between the Depreciation values calculated by Sasol Oil and
that calculated by NERSA due to NERSA accounting for the Depreciation on land in order
to allow Sasol Oil to earn a Return on Investment (ROI).
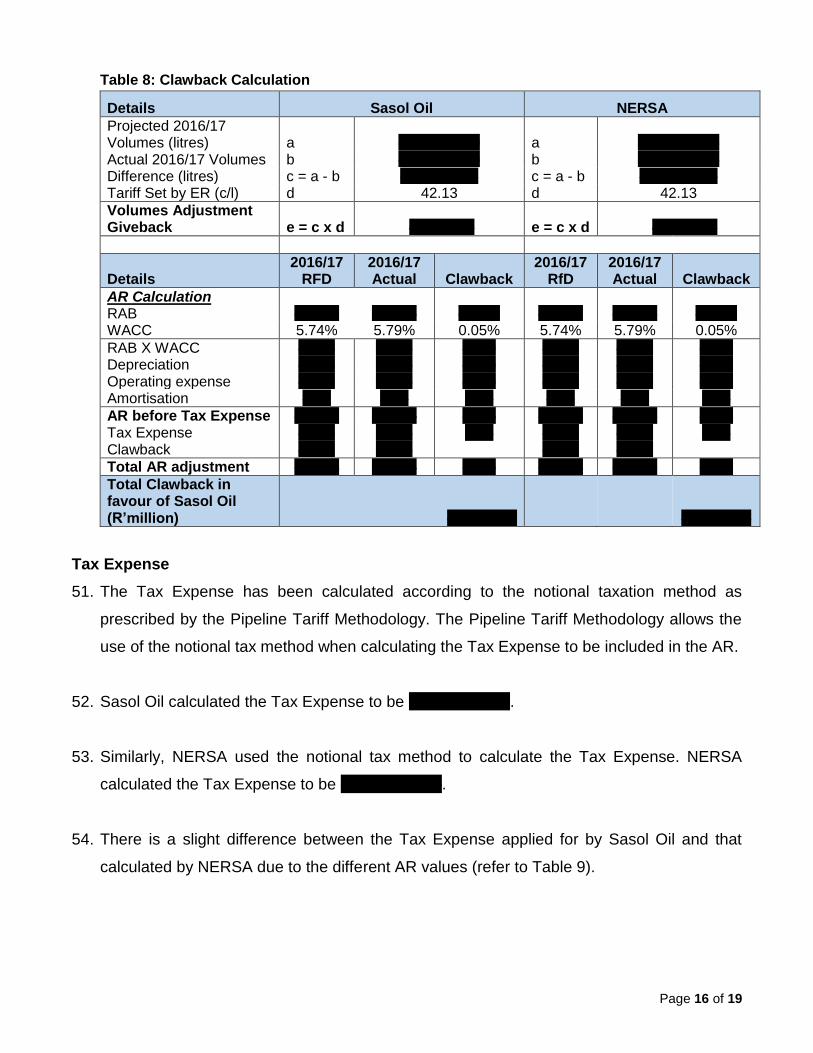
Clawback 50. Sasol Oil calculated a clawback value of R4.73 million. The clawback determined consists
of the volume adjustment, where the difference between the forecast volumes and actual
audited volumes for the 2016/17 tariff period was taken into consideration, as well as an AR
adjustment between the set AR and the actual audited costs in the 2016/17 tariff period
(refer to Table 8).
Page 16 of 19
Table 8: Clawback Calculation
Details Sasol Oil NERSA
Projected 2016/17 Volumes (litres) a 376 582 000 a 376 582 000 Actual 2016/17 Volumes b 386 926 000 b 386 926 000 Difference (litres) c = a - b -10 344 000 c = a - b -10 344 000 Tariff Set by ER (c/l) d 42.13 d 42.13
Volumes Adjustment Giveback e = c x d 4 357 927 e = c x d 4 357 927
Details 2016/17
RFD 2016/17 Actual Clawback
2016/17 RfD
2016/17 Actual Clawback
AR Calculation RAB 927.33 914.35 -12.98 927.33 914.35 -12.98 WACC 5.74% 5.79% 0.05% 5.74% 5.79% 0.05%
RAB X WACC 53.23 52.93 -0.29 53.23 52.93 -0.29 Depreciation 31.58 31.39 -0.19 31.58 31.39 -0.19 Operating expense 17.08 15.89 -1.19 17.08 15.89 -1.19 Amortisation 7.01 8.03 1.02 7.01 8.03 1.02
AR before Tax Expense 108.90 108.25 -0.65 108.90 108.25 -0.65 Tax Expense 23.43 23.71 0.28 23.43 23.71 0.28 Clawback 26.32 26.32 26.32 26.32
Total AR adjustment 158.64 158.28 -0.36 158.64 158.28 -0.36
Total Clawback in favour of Sasol Oil (R’million)
-4 726 483
-4 726 483
Tax Expense
51. The Tax Expense has been calculated according to the notional taxation method as
prescribed by the Pipeline Tariff Methodology. The Pipeline Tariff Methodology allows the
use of the notional tax method when calculating the Tax Expense to be included in the AR.
52. Sasol Oil calculated the Tax Expense to be R25.47 million.
53. Similarly, NERSA used the notional tax method to calculate the Tax Expense. NERSA
calculated the Tax Expense to be R25.49 million.
54. There is a slight difference between the Tax Expense applied for by Sasol Oil and that
calculated by NERSA due to the different AR values (refer to Table 9).
Page 17 of 19
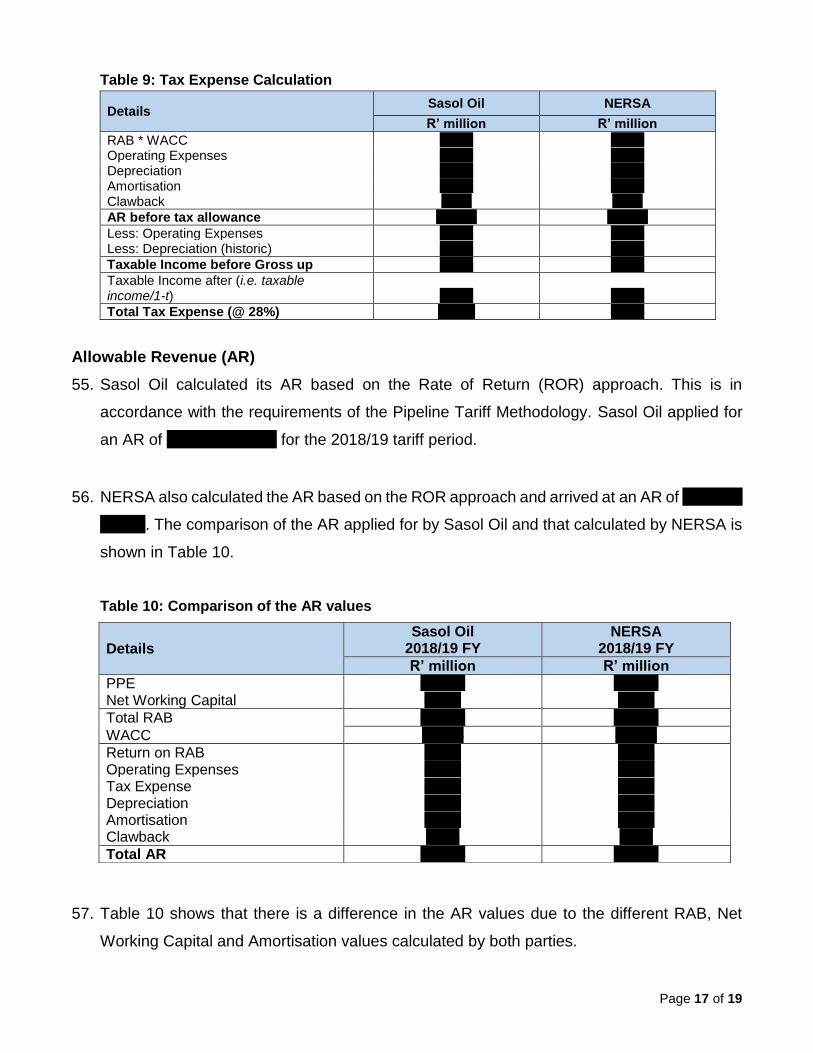
Table 9: Tax Expense Calculation
Details Sasol Oil NERSA
R’ million R’ million
RAB * WACC 57.61 55.66 Operating Expenses 19.77 19.77 Depreciation 31.39 34.32 Amortisation 12.62 14.61 Clawback -4.72 -4.73
AR before tax allowance 116.66 119.63
Less: Operating Expenses 19.77 19.77 Less: Depreciation (historic) 31.39 34.32
Taxable Income before Gross up 65.50 66.54
Taxable Income after (i.e. taxable income/1-t) 90.98 91.03
Total Tax Expense (@ 28%) 25.47 25.49
Allowable Revenue (AR)
55. Sasol Oil calculated its AR based on the Rate of Return (ROR) approach. This is in
accordance with the requirements of the Pipeline Tariff Methodology. Sasol Oil applied for
an AR of R142.14 million for the 2018/19 tariff period.
56. NERSA also calculated the AR based on the ROR approach and arrived at an AR of R145.12
million. The comparison of the AR applied for by Sasol Oil and that calculated by NERSA is
shown in Table 10.
Table 10: Comparison of the AR values
57. Table 10 shows that there is a difference in the AR values due to the different RAB, Net
Working Capital and Amortisation values calculated by both parties.
Details Sasol Oil
2018/19 FY NERSA
2018/19 FY
R’ million R’ million
PPE 880.18 858.88 Net Working Capital 61.23 61.48
Total RAB 941.41 920.36
WACC 6.12% 6.05%
Return on RAB 57.61 55.66 Operating Expenses 19.77 19.77 Tax Expense 25.47 25.49 Depreciation 31.39 34.32 Amortisation 12.62 14.61 Clawback -4.73 -4.73
Total AR 142.14 145.12
Page 18 of 19
Volumes
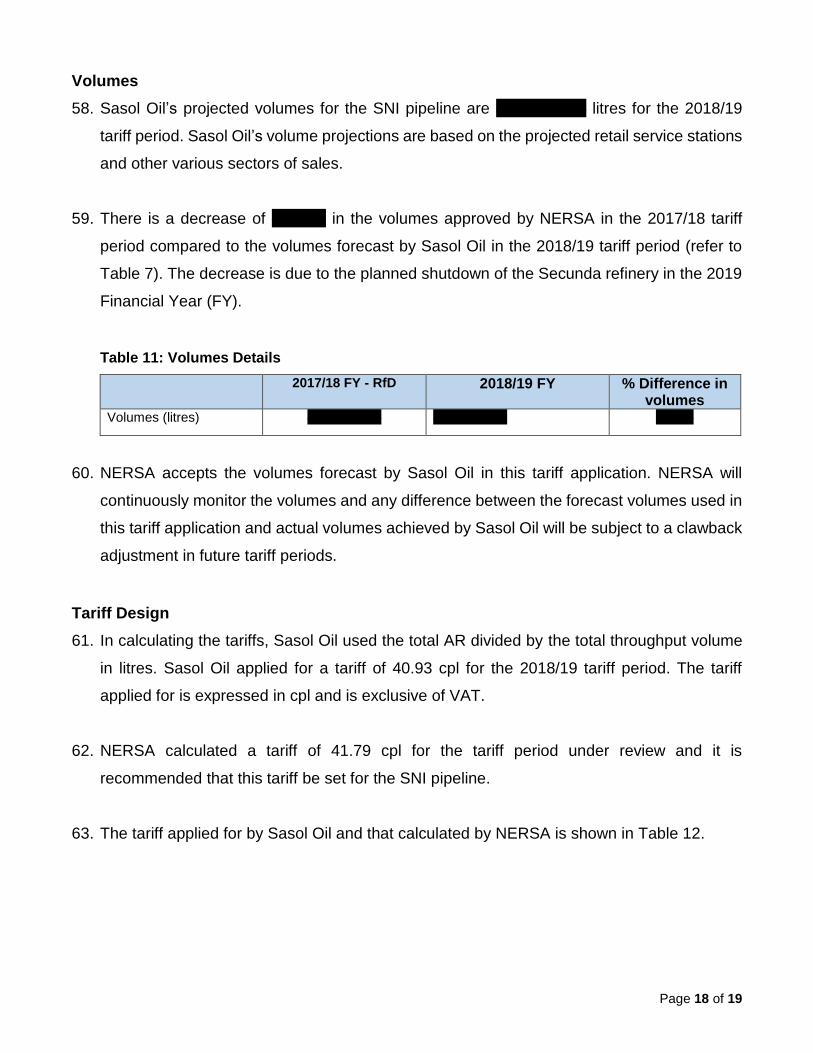
58. Sasol Oil’s projected volumes for the SNI pipeline are 347 281 376 litres for the 2018/19
tariff period. Sasol Oil’s volume projections are based on the projected retail service stations
and other various sectors of sales.
59. There is a decrease of 17.88% in the volumes approved by NERSA in the 2017/18 tariff
period compared to the volumes forecast by Sasol Oil in the 2018/19 tariff period (refer to
Table 7). The decrease is due to the planned shutdown of the Secunda refinery in the 2019
Financial Year (FY).
Table 11: Volumes Details
2017/18 FY - RfD 2018/19 FY % Difference in volumes
Volumes (litres) 422 900 000 347 281 376 -17.88
60. NERSA accepts the volumes forecast by Sasol Oil in this tariff application. NERSA will
continuously monitor the volumes and any difference between the forecast volumes used in
this tariff application and actual volumes achieved by Sasol Oil will be subject to a clawback
adjustment in future tariff periods.
Tariff Design
61. In calculating the tariffs, Sasol Oil used the total AR divided by the total throughput volume
in litres. Sasol Oil applied for a tariff of 40.93 cpl for the 2018/19 tariff period. The tariff
applied for is expressed in cpl and is exclusive of VAT.
62. NERSA calculated a tariff of 41.79 cpl for the tariff period under review and it is
recommended that this tariff be set for the SNI pipeline.
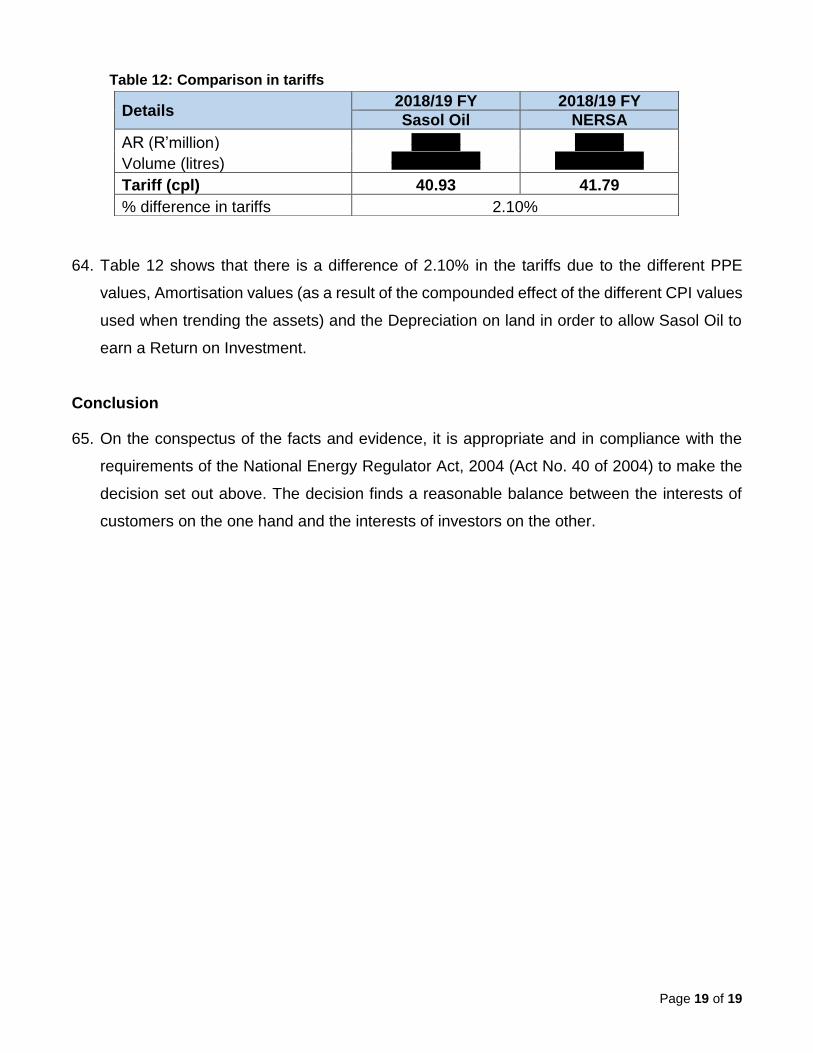
63. The tariff applied for by Sasol Oil and that calculated by NERSA is shown in Table 12.
Page 19 of 19
Table 12: Comparison in tariffs
64. Table 12 shows that there is a difference of 2.10% in the tariffs due to the different PPE
values, Amortisation values (as a result of the compounded effect of the different CPI values
used when trending the assets) and the Depreciation on land in order to allow Sasol Oil to
earn a Return on Investment.
Conclusion
65. On the conspectus of the facts and evidence, it is appropriate and in compliance with the
requirements of the National Energy Regulator Act, 2004 (Act No. 40 of 2004) to make the
decision set out above. The decision finds a reasonable balance between the interests of
customers on the one hand and the interests of investors on the other.
Details 2018/19 FY 2018/19 FY
Sasol Oil NERSA
AR (R’million) 142.14 145.12
Volume (litres) 347 281 376 347 281 376
Tariff (cpl) 40.93 41.79
% difference in tariffs 2.10%