Embed Size (px)
Citation preview
Life Cycle assessment of a grill brushTeam 3
Pol Salat ColoméVilhelm NurmiRim BoulahyaMaxime Muller
1
Table of content
Table of content 2
Introduction 3
Functional unit definition 3
Goal and Scope Definition 3
Inventory Analysis 4
Impact Assessment 5
Interpretation 8
Annex 1: Original product and improvements made 9
Annex 2: Calculation of the amount of plywood in the greener grill brush 10
Annex 3: Further analysis on the inventory 11
References 12
2
IntroductionBy doing a Life Cycle assessment of a grill brush, we want to improve the product in twodifferent directions. Firstly, we want to improve the safety of the product provided that it isnow a little bit dangerous to use. Also, we want to focus on reducing its environmentalimpact by changing materials and giving it a greener end of use life.In order to do the Life Cycle Assessment, two softwares have been used: OpenLCA andGranta Edupack (CES).
Functional unit definitionA grill brush is a tool people use to clean a grill. It is most commonly used in outsidebarbecues but can also be usable in inside grills. Although the time duration of every usecan be quite different and it does not always work the same exact way, its functional unit canbe defined as the number of times used to clean the grill. We can do this approximation bydefining a standardized time of cleaning which is the average time of cleaning a grill.In order to do a numerical approximation we will make the hypothesis that this product isgoing to be sold in Finland. One can assume that barbecues are only used in thesummertime, from May until September, and they are only used three times a month. Grillbrushes should be replaced at least every season (www.weber.com, n.d.). This way, the grillbrush is going to be used approximately 15 times in total.
Functional unit: Cleaning a dirty barbecue 15 times
Goal and Scope DefinitionGoal:An estimated number of 1700 Americans ingested wire bristles in grilled food and went tothe emergency room between 2002-14, according to Consumer Reports (Drown, clevel and.com, 2021). For this reason, we wanted to improve the safety of this brush, as well asmaking it more environmentally friendly.
In order to achieve this goals, the aspects we are going to try to change for a sustainableproduct are:
● Replacing the polypropylene handle of the brush into wood (plywood). The goal ofthis change is to use bio sourced materials instead of polymers.
● Getting rid of the PET wrapping. Indeed, PET has a very bad impact on theenvironment and it is not really essential for this product.
● The handle of the brush will become reusable: the head will become detachable fromthe handle, making it so that at the end of life of the brush, only the head will have tobe replaced.
● Regarding the safety guideline, epoxy resin glue will be added in addition to thestaples, to make sure the wires are attached correctly. The quantity of glue is around0.007g and therefore the environmental impact is negligible.
● By glueing the bristles the use time of the brush is effectively doubled, as quality ofthe product is exceptionally better.
The original product with the suggested changes can be seen in Annex 1.
3
After doing these changes, safety will be improved because of the epoxy resin glue, use timeexpanded due to the bristles not detaching as easily and the global impact will be reducedas shown in the impact assessment.
Scope:In order to do the OpenLCA and Granta Edupack analysis we have included as inputs all thematerials of the grill brush. However, for the greener version, we have considered that thequantity of epoxy resin is neglectable so we haven’t included it in the report
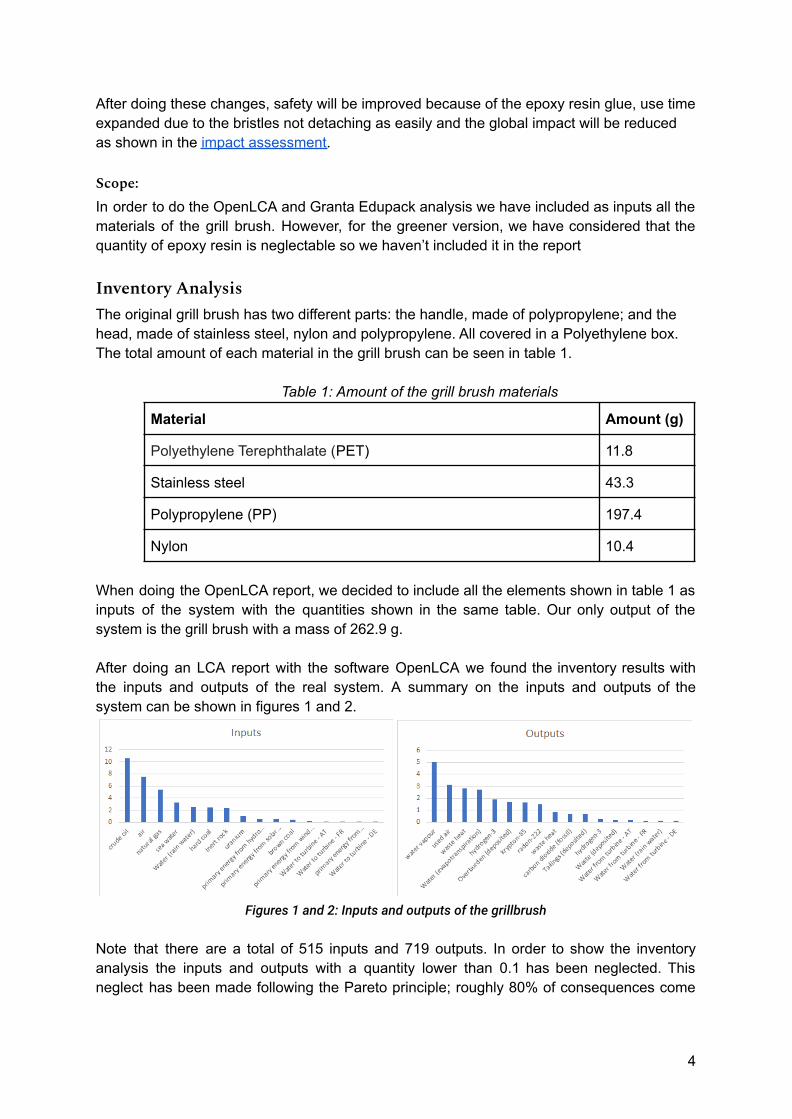
Inventory AnalysisThe original grill brush has two different parts: the handle, made of polypropylene; and thehead, made of stainless steel, nylon and polypropylene. All covered in a Polyethylene box.The total amount of each material in the grill brush can be seen in table 1.
Table 1: Amount of the grill brush materials
Material Amount (g)
Polyethylene Terephthalate (PET) 11.8
Stainless steel 43.3
Polypropylene (PP) 197.4
Nylon 10.4
When doing the OpenLCA report, we decided to include all the elements shown in table 1 asinputs of the system with the quantities shown in the same table. Our only output of thesystem is the grill brush with a mass of 262.9 g.
After doing an LCA report with the software OpenLCA we found the inventory results withthe inputs and outputs of the real system. A summary on the inputs and outputs of thesystem can be shown in figures 1 and 2.
Figures 1 and 2: Inputs and outputs of the grillbrush
Note that there are a total of 515 inputs and 719 outputs. In order to show the inventoryanalysis the inputs and outputs with a quantity lower than 0.1 has been neglected. Thisneglect has been made following the Pareto principle; roughly 80% of consequences come
4
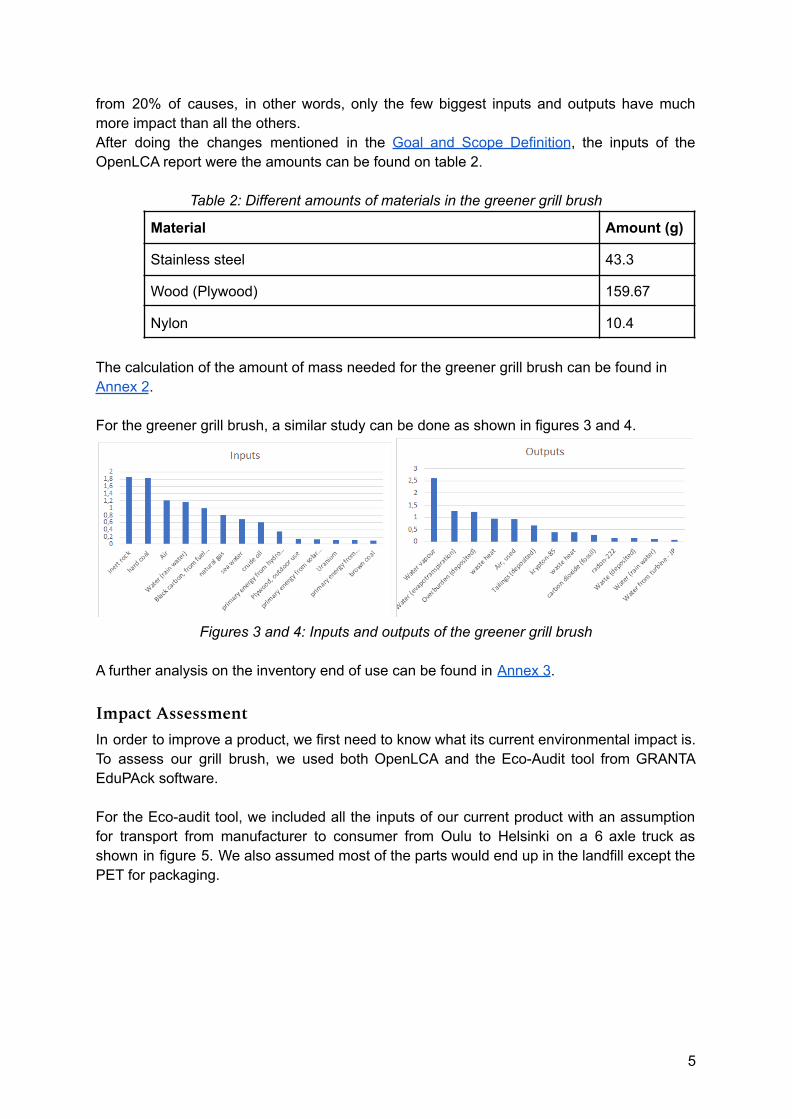
from 20% of causes, in other words, only the few biggest inputs and outputs have muchmore impact than all the others.After doing the changes mentioned in the Goal and Scope Definition, the inputs of theOpenLCA report were the amounts can be found on table 2.
Table 2: Different amounts of materials in the greener grill brush
Material Amount (g)
Stainless steel 43.3
Wood (Plywood) 159.67
Nylon 10.4
The calculation of the amount of mass needed for the greener grill brush can be found inAnnex 2.
For the greener grill brush, a similar study can be done as shown in figures 3 and 4.
Figures 3 and 4: Inputs and outputs of the greener grill brush
A further analysis on the inventory end of use can be found in Annex 3.
Impact AssessmentIn order to improve a product, we first need to know what its current environmental impact is.To assess our grill brush, we used both OpenLCA and the Eco-Audit tool from GRANTAEduPAck software.
For the Eco-audit tool, we included all the inputs of our current product with an assumptionfor transport from manufacturer to consumer from Oulu to Helsinki on a 6 axle truck asshown in figure 5. We also assumed most of the parts would end up in the landfill except thePET for packaging.
5
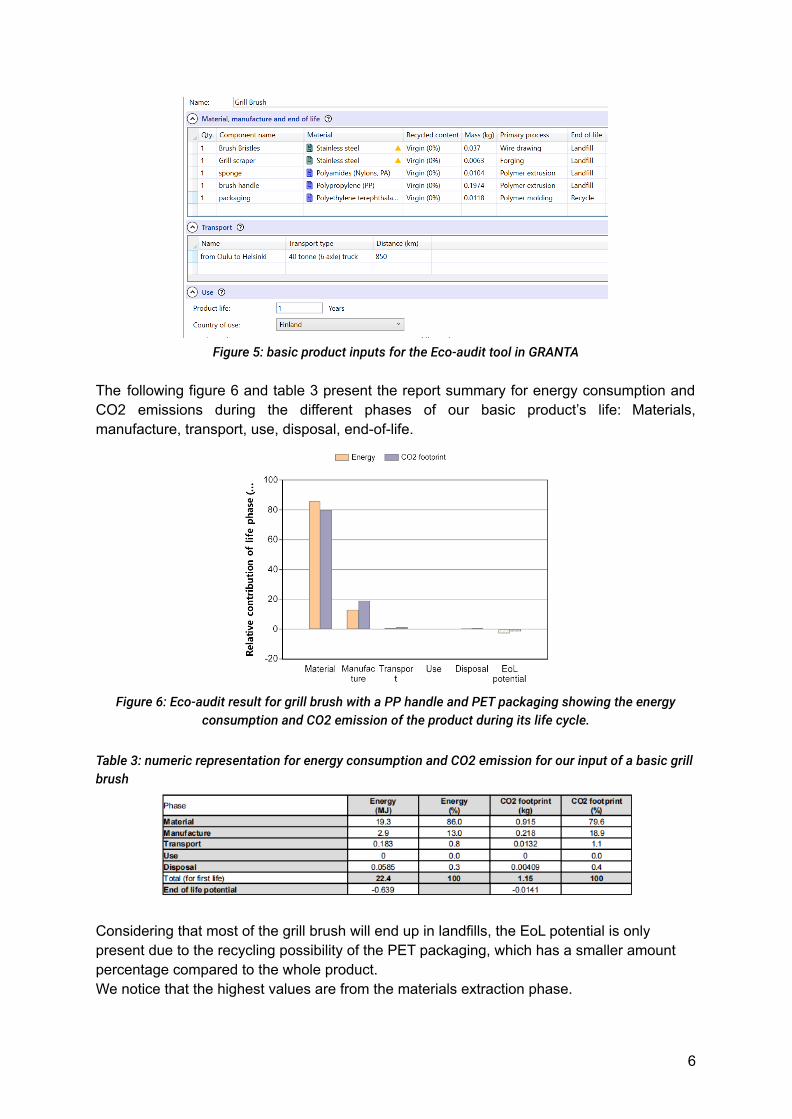
Figure 5: basic product inputs for the Eco-audit tool in GRANTA
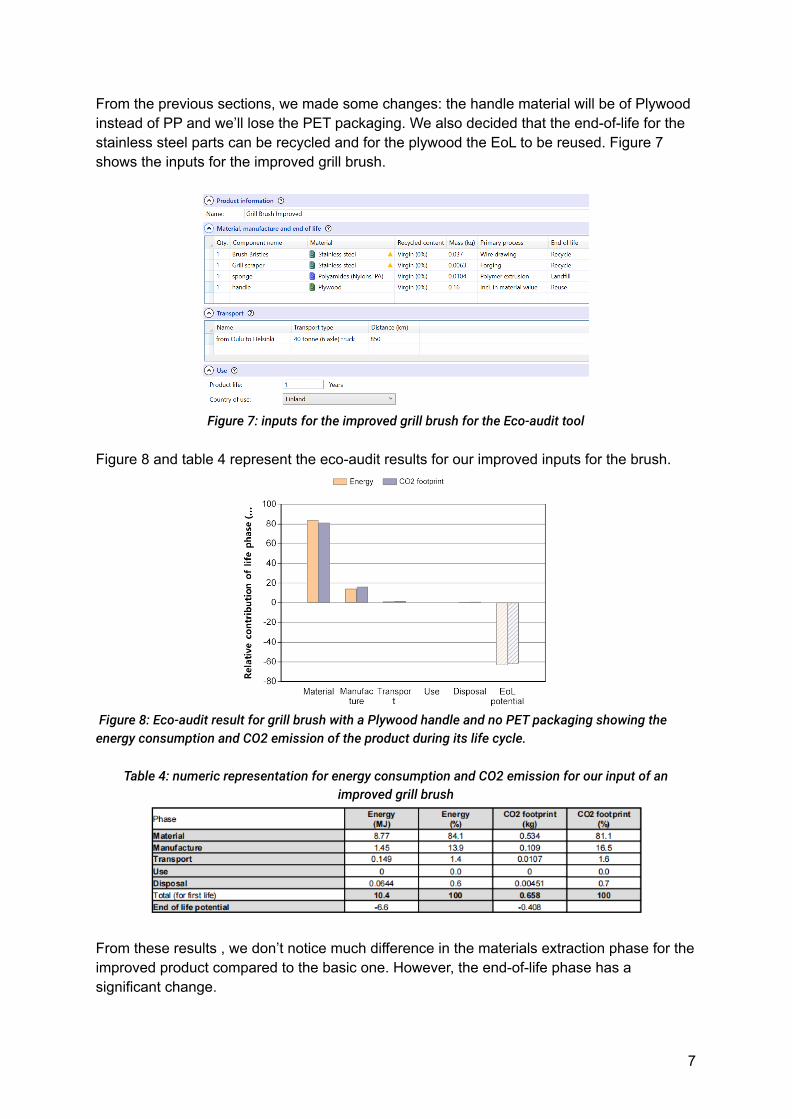
The following figure 6 and table 3 present the report summary for energy consumption andCO2 emissions during the different phases of our basic product’s life: Materials,manufacture, transport, use, disposal, end-of-life.
Figure 6: Eco-audit result for grill brush with a PP handle and PET packaging showing the energyconsumption and CO2 emission of the product during its life cycle.
Table 3: numeric representation for energy consumption and CO2 emission for our input of a basic grillbrush
Considering that most of the grill brush will end up in landfills, the EoL potential is onlypresent due to the recycling possibility of the PET packaging, which has a smaller amountpercentage compared to the whole product.We notice that the highest values are from the materials extraction phase.
6
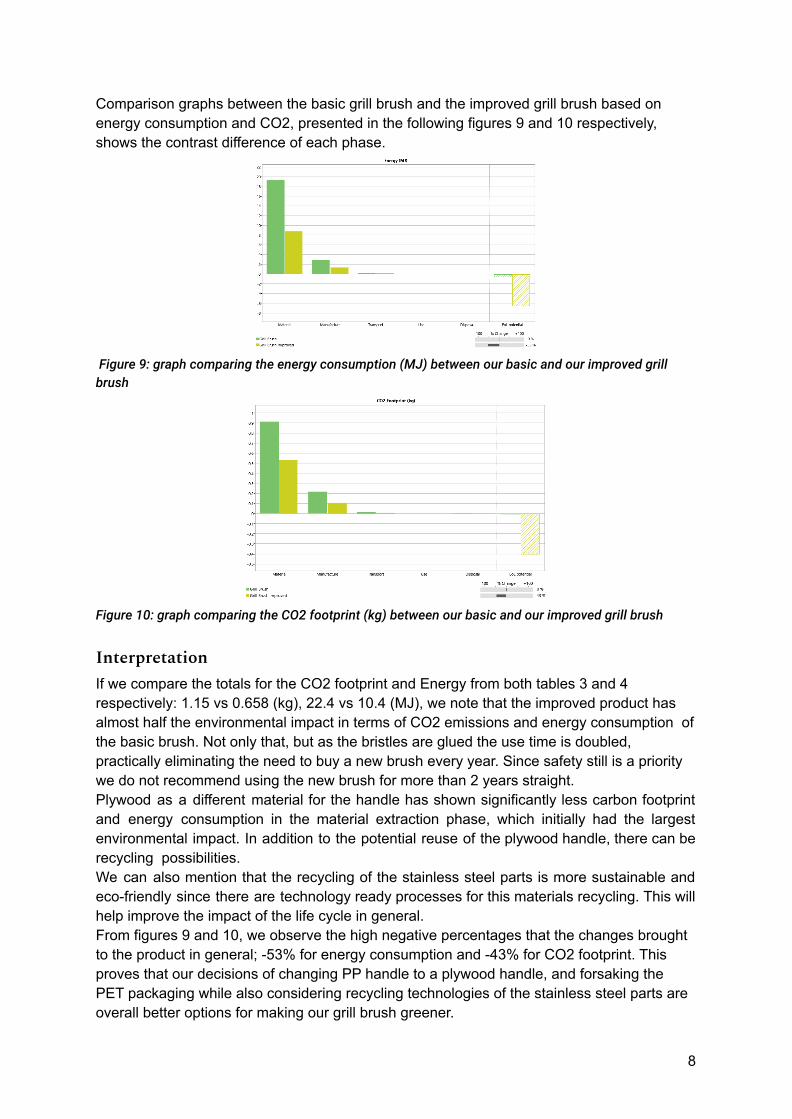
From the previous sections, we made some changes: the handle material will be of Plywoodinstead of PP and we’ll lose the PET packaging. We also decided that the end-of-life for thestainless steel parts can be recycled and for the plywood the EoL to be reused. Figure 7shows the inputs for the improved grill brush.
Figure 7: inputs for the improved grill brush for the Eco-audit tool
Figure 8 and table 4 represent the eco-audit results for our improved inputs for the brush.
Figure 8: Eco-audit result for grill brush with a Plywood handle and no PET packaging showing theenergy consumption and CO2 emission of the product during its life cycle.
Table 4: numeric representation for energy consumption and CO2 emission for our input of animproved grill brush
From these results , we don’t notice much difference in the materials extraction phase for theimproved product compared to the basic one. However, the end-of-life phase has asignificant change.
7
Comparison graphs between the basic grill brush and the improved grill brush based onenergy consumption and CO2, presented in the following figures 9 and 10 respectively,shows the contrast difference of each phase.
Figure 9: graph comparing the energy consumption (MJ) between our basic and our improved grillbrush
Figure 10: graph comparing the CO2 footprint (kg) between our basic and our improved grill brush
InterpretationIf we compare the totals for the CO2 footprint and Energy from both tables 3 and 4respectively: 1.15 vs 0.658 (kg), 22.4 vs 10.4 (MJ), we note that the improved product hasalmost half the environmental impact in terms of CO2 emissions and energy consumption ofthe basic brush. Not only that, but as the bristles are glued the use time is doubled,practically eliminating the need to buy a new brush every year. Since safety still is a prioritywe do not recommend using the new brush for more than 2 years straight.Plywood as a different material for the handle has shown significantly less carbon footprintand energy consumption in the material extraction phase, which initially had the largestenvironmental impact. In addition to the potential reuse of the plywood handle, there can berecycling possibilities.We can also mention that the recycling of the stainless steel parts is more sustainable andeco-friendly since there are technology ready processes for this materials recycling. This willhelp improve the impact of the life cycle in general.From figures 9 and 10, we observe the high negative percentages that the changes broughtto the product in general; -53% for energy consumption and -43% for CO2 footprint. Thisproves that our decisions of changing PP handle to a plywood handle, and forsaking thePET packaging while also considering recycling technologies of the stainless steel parts areoverall better options for making our grill brush greener.
8
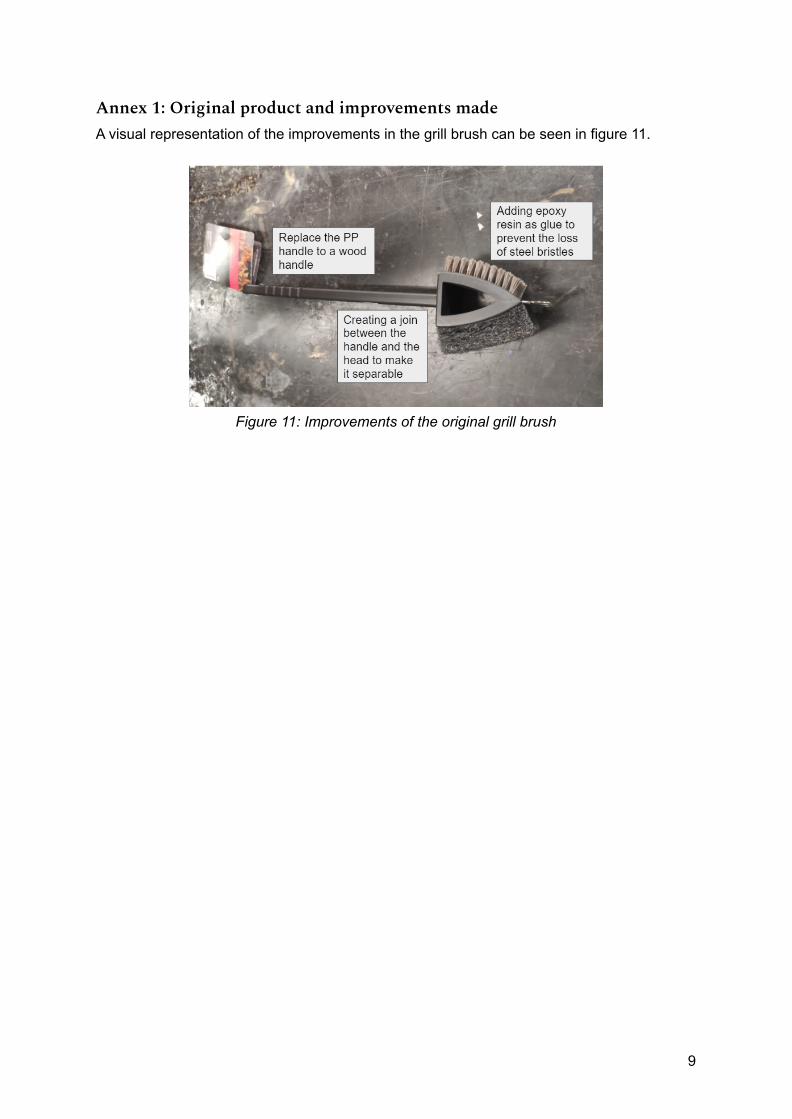
Annex 1: Original product and improvements madeA visual representation of the improvements in the grill brush can be seen in figure 11.
Figure 11: Improvements of the original grill brush
9
Annex 2: Calculation of the amount of plywood in the greener grill brushIn order to make a numerical analysis of the impact of the greener version of the grill brush,an estimation of the amount of wood mass has to be calculated. In order to do theestimation, three different assumptions were made:
1. Polypropylene has a density of 900 kg/m3. (Plastics Europe, n.d.)2. Plywood has a density of 500 kg/m3. (www.australply.com.au, n.d.)3. Given that wood is more difficult to manufacture and complex forms can’t be made,
the hole of the head, seen in figure 1, will not be hollow. Instead, it will be made ofwood. By doing this assumption we have estimated a 50 g addition of wood in thefinal product.
With all the assumptions in mind, the total amount of wood in the greener product will be:
197, 4 * 500900 + 50 = 159. 67 𝑔
10
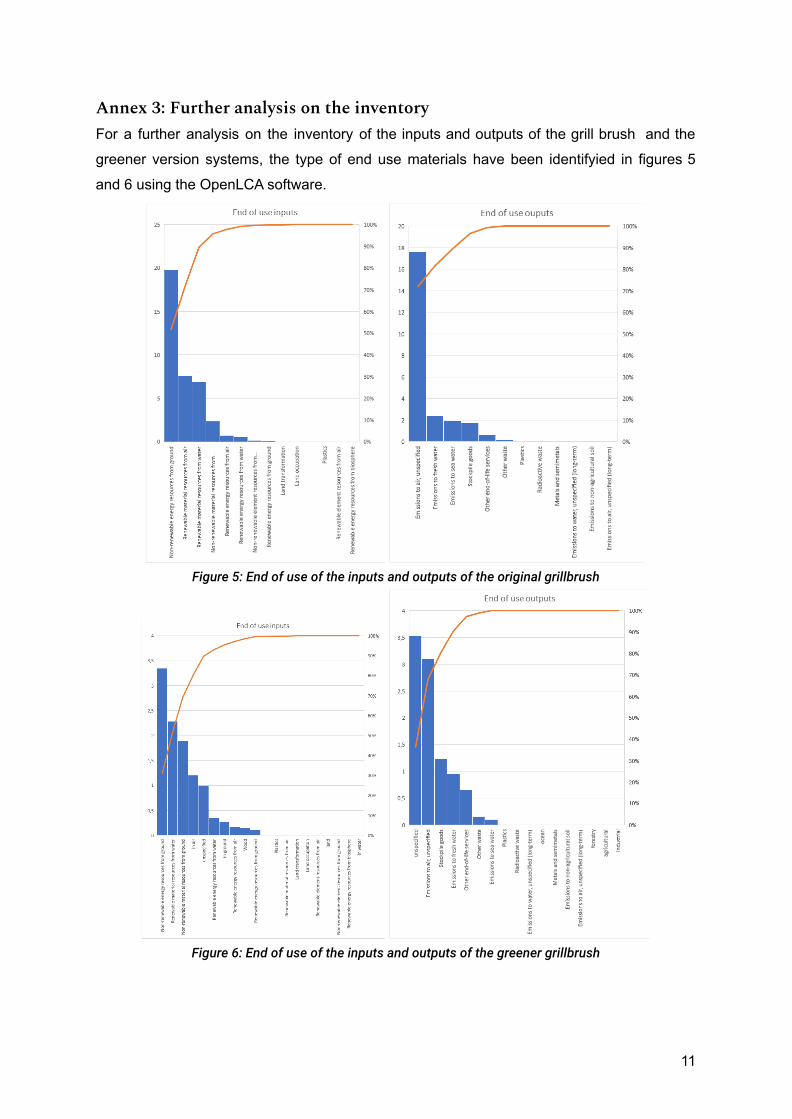
Annex 3: Further analysis on the inventoryFor a further analysis on the inventory of the inputs and outputs of the grill brush and the
greener version systems, the type of end use materials have been identifyied in figures 5
and 6 using the OpenLCA software.
Figure 5: End of use of the inputs and outputs of the original grillbrush
Figure 6: End of use of the inputs and outputs of the greener grillbrush
11
References
1. www.weber.com. (n.d.). Grill Brush Care | Tips & Techniques | Weber Grills.
[online] Available at:
https://www.weber.com/US/en/blog/tips-techniques/grill-brush-care/weber-310
92.html [Accessed 27 Oct. 2021].
2. Drown, H., clevel and .com (2021). Your grill brush could kill you. For real.
Read this before you barbecue this weekend. [online] cleveland. Available at:
https://www.cleveland.com/news/2021/05/ingesting-a-wire-grill-brush-bristle-c
ould-be-deadly-what-to-do-if-you-eat-one.html [Accessed 27 Oct. 2021].
3. Polymeres Technologies, le blog de votre fabricant de résine. (2019). What is
a green epoxy resin ? Are you safer with a green epoxy resin ? [online]
Available at:
https://resineepoxy.ca/en/2019/03/29/a-green-epoxy-system-seriously/
[Accessed 27 Oct. 2021].
4. Plastics Europe. (n.d.). Plastics Europe • Enabling a sustainable future.
[online] Available at: https://plasticseurope.org/ [Accessed 27 Oct. 2021].
5. www.australply.com.au. (n.d.). Characteristics. [online] Available at:
https://www.australply.com.au/technical/characteristics.
12
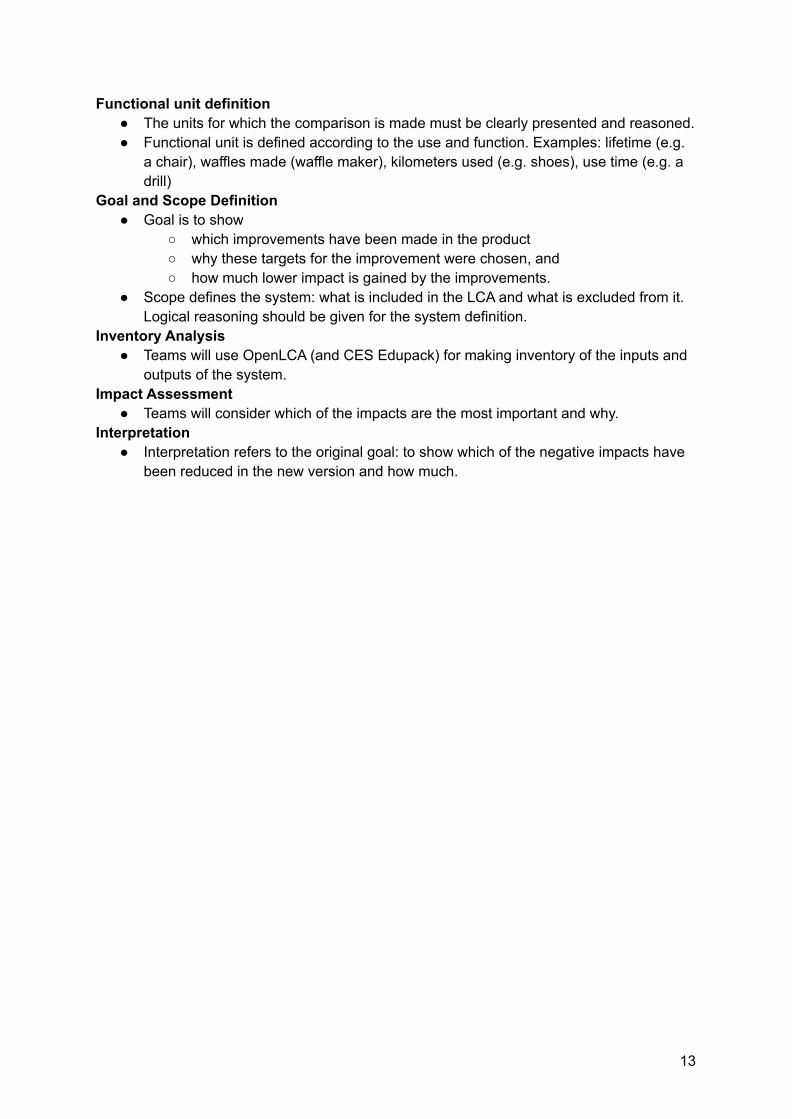
Functional unit definition● The units for which the comparison is made must be clearly presented and reasoned.● Functional unit is defined according to the use and function. Examples: lifetime (e.g.
a chair), waffles made (waffle maker), kilometers used (e.g. shoes), use time (e.g. adrill)
Goal and Scope Definition● Goal is to show
○ which improvements have been made in the product○ why these targets for the improvement were chosen, and○ how much lower impact is gained by the improvements.
● Scope defines the system: what is included in the LCA and what is excluded from it.Logical reasoning should be given for the system definition.
Inventory Analysis● Teams will use OpenLCA (and CES Edupack) for making inventory of the inputs and
outputs of the system.Impact Assessment
● Teams will consider which of the impacts are the most important and why.Interpretation
● Interpretation refers to the original goal: to show which of the negative impacts havebeen reduced in the new version and how much.
13