Embed Size (px)
Citation preview

Jason Withrow ([email protected])
Overview• Introducing Task Analysis• Levels of Data Analysis• Displaying the Task Analysis Data• GOMS Analysis• Storyboarding• Implications for Use Cases

Jason Withrow ([email protected])
Introducing Task Analysis• As the name suggests, this is about
analyzing (exploring/mapping out) a task• ‘Task’ is intentionally generic• From the user’s perspective:
– A task is a desired action/outcome (finding a product, creating an account, making a purchase, joining an e-mail list, searching, etc.)
• From the system’s perspective:– Any functionality could be considered a task
Jason Withrow ([email protected])
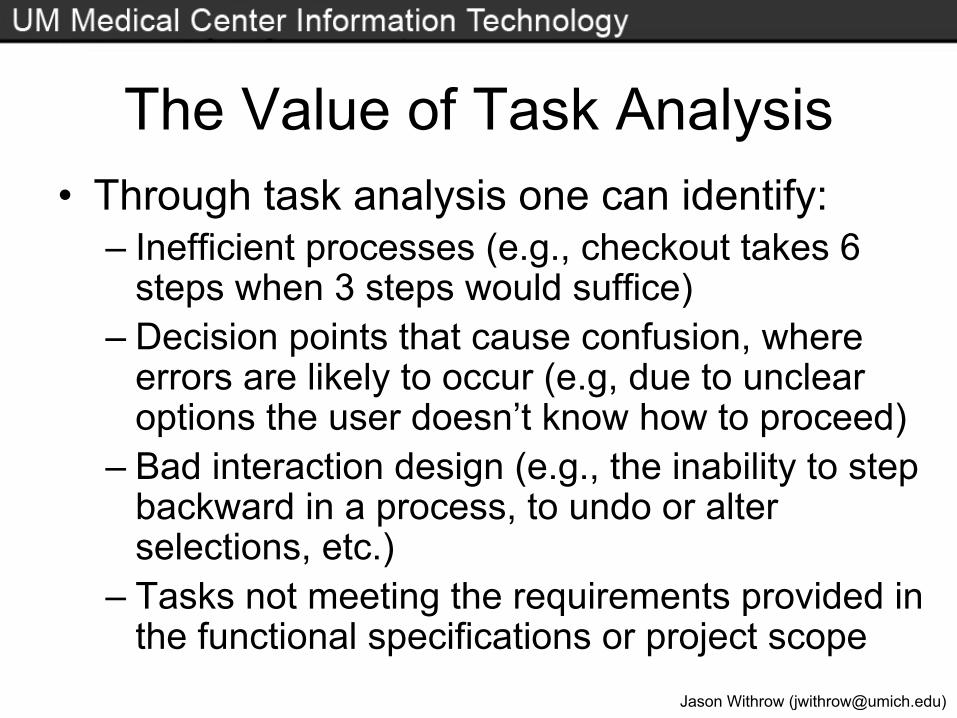
The Value of Task Analysis• Through task analysis one can identify:
– Inefficient processes (e.g., checkout takes 6 steps when 3 steps would suffice)
– Decision points that cause confusion, where errors are likely to occur (e.g, due to unclear options the user doesn’t know how to proceed)
– Bad interaction design (e.g., the inability to step backward in a process, to undo or alter selections, etc.)
– Tasks not meeting the requirements provided in the functional specifications or project scope

Jason Withrow ([email protected])
The Value of Task Analysis• Successful task analysis (and subsequent
success in implementation) results in:– Greater productivity– Reduced errors– Improved satisfaction with the system– Higher rates of task completion (e.g.,
completing a purchase)– Increased conversion rate (casual visitors
creating accounts, etc.)

Jason Withrow ([email protected])
Task Analysis and ROI• Task analysis is frequently used in Return
on Investment (ROI) studies– Registration and checkout are streamlined to
involve fewer steps and more accounts get created, more sales are made
– The cost of making the changes is a fraction of the total return on that investment
• Amazon.com’s one-click checkout was a major triumph in streamlining a task

Jason Withrow ([email protected])
The Drawbacks of Task Analysis• Data gathering can take a fair amount of
time and effort; interviews can be hard to schedule in some cases
• A lot of data is generated (especially if there are a lot of tasks), which takes time to organize and analyze
• Deciding at what level to analyze the task can be difficult; there are various options

Jason Withrow ([email protected])
Approaches to Task Analysis• Hierarchical / Task Decomposition
– The most commonly encountered– Takes a top-down approach, identifying tasks
and breaking them down into component actions• Component Clustering
– Takes a bottom-up approach– Every object (e.g., file, button, image) and every
action (e.g., clicking, deciding) is identified and clustered to ‘build’ the task
• And even more, but their value is minimal

Jason Withrow ([email protected])
Hierarchical / Task Decomposition• Split into five phases:
1. Task Identification2. Task Decomposition3. Task Design4. Task Evaluation5. Task Review

Jason Withrow ([email protected])
Phase 1: Task Identification• Crucial questions:
– What are the user tasks?– Which are the most important?
• Activities in Phase 1:– Interview users – Conduct a contextual inquiry or usability test– From that data make a list of existing tasks– Also list new tasks that need to be designed– Prioritize the list of tasks
Jason Withrow ([email protected])
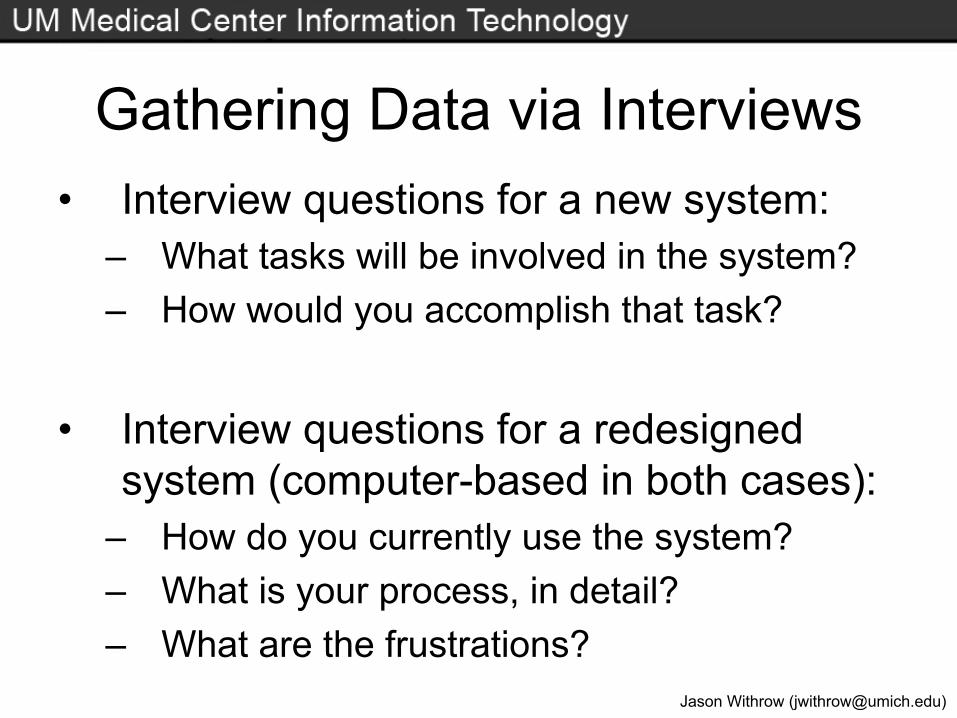
Gathering Data via Interviews• Interview questions for a new system:
– What tasks will be involved in the system?– How would you accomplish that task?
• Interview questions for a redesigned system (computer-based in both cases):
– How do you currently use the system? – What is your process, in detail? – What are the frustrations?
Jason Withrow ([email protected])
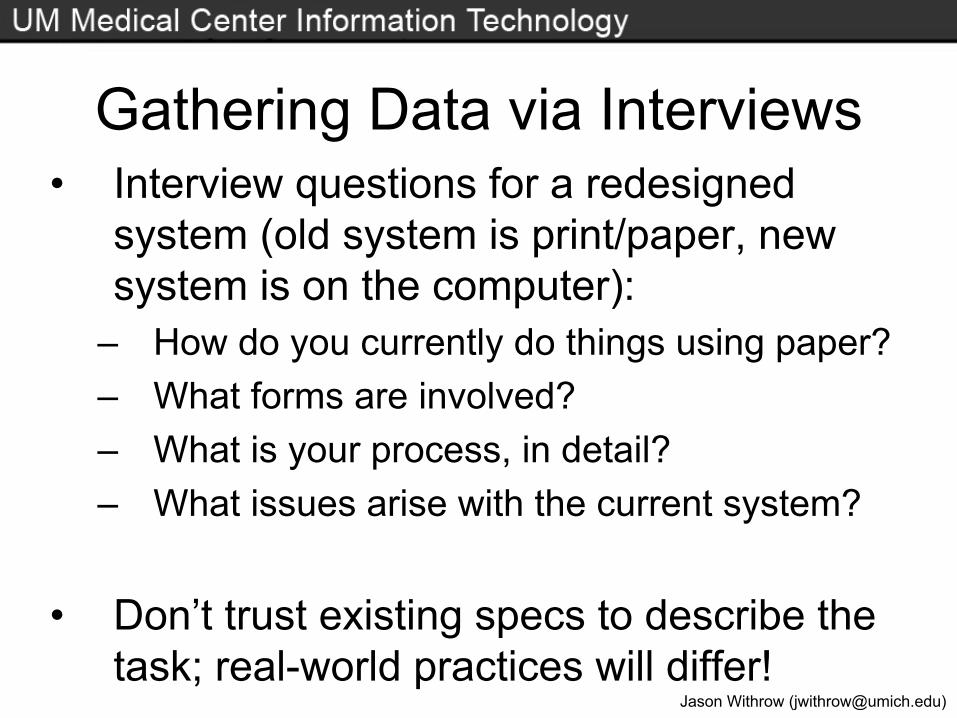
Gathering Data via Interviews• Interview questions for a redesigned
system (old system is print/paper, new system is on the computer):
– How do you currently do things using paper? – What forms are involved?– What is your process, in detail? – What issues arise with the current system?
• Don’t trust existing specs to describe the task; real-world practices will differ!
Jason Withrow ([email protected])
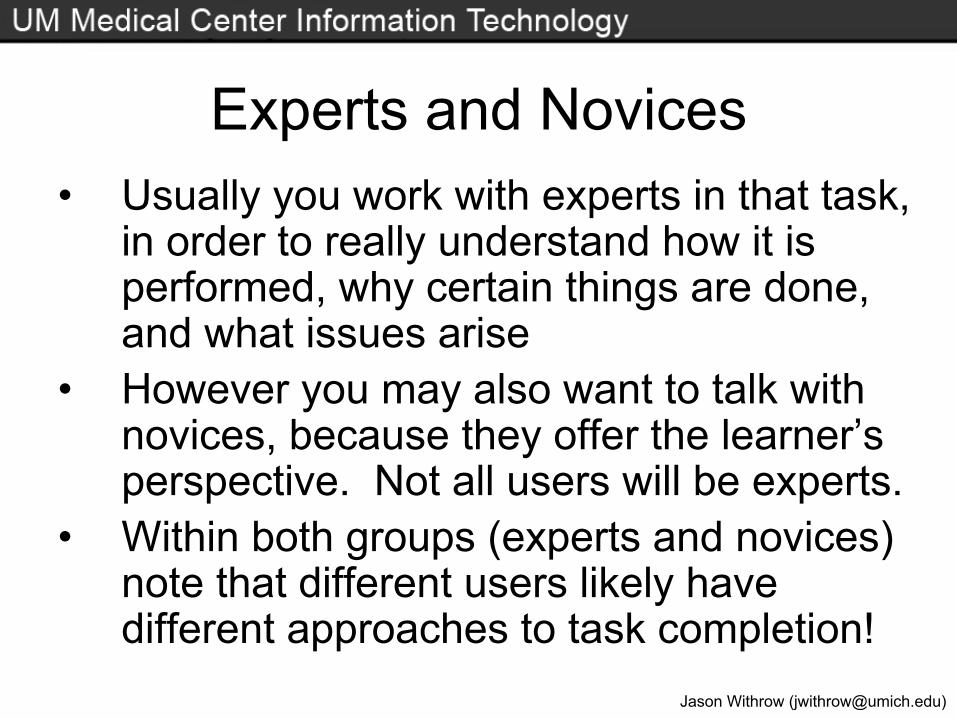
Experts and Novices• Usually you work with experts in that task,
in order to really understand how it is performed, why certain things are done, and what issues arise
• However you may also want to talk with novices, because they offer the learner’s perspective. Not all users will be experts.
• Within both groups (experts and novices) note that different users likely have different approaches to task completion!
Jason Withrow ([email protected])
Contextual Inquiry / Shadowing• A form of ethnographic research• I refer to this as the “fly on the wall”
research approach• You are an observer in the work setting,
taking notes on what you observe, in terms of tasks, user reactions, etc.
• You are likely to see some data that differs from what you were told in the interviews.
Jason Withrow ([email protected])
Usability Testing and Task Analysis• Another way of seeing the user’s task
completion behavior directly, rather than taking their word for it. This time you instruct them to complete the task.
• What users say and what they do are often quite different things
– We still need to do the interviews to really get into their perceptions of the system and as a starting place in creating a totally new system
– Experts often forget to mention some steps, because doing the task is automatic for them
Jason Withrow ([email protected])
Describing Tasks• For each task, identify the following:
– Task name (e.g., Finding an archived article)– Goal of task (e.g., Locate article on a topic)– Actor (e.g., Person browsing the web)– Frequency (e.g., 1-5 times per day)– Importance (e.g., 4 on a scale of 1-5; higher
scores are more important)– Pre-condition(s) (e.g., Start at home page)– Post-condition(s) (e.g., Viewing the article)

Jason Withrow ([email protected])
Sample E-Commerce Tasks• Create an account• Login• Logout• Search for a product and place the
product in the shopping cart• Locate a regional store with the website’s
‘Store Locator’• Join a mailing list for coupons-by-email• Complete a purchase
Jason Withrow ([email protected])
Describing a Task in Phase 1• Task name: Create an account• Goal of task: Establish a customer account• Actor: E-commerce customer• Frequency: Generally once, perhaps multiple
times if login information is forgotten• Importance: 5 (Very Important)• Pre-condition: Web browser showing the
website home page• Post-condition: Screen confirming account
creation

Jason Withrow ([email protected])
Phase 2: Task Decomposition• Crucial Questions:
– Existing System: How are tasks performed?– New System: How will tasks be performed? – What difficulties arise?
• Activities in Phase 2:– Analyze the process used to accomplish each
task, including branching paths– Identify the number of steps– Represent this in whatever way fits best
Jason Withrow ([email protected])
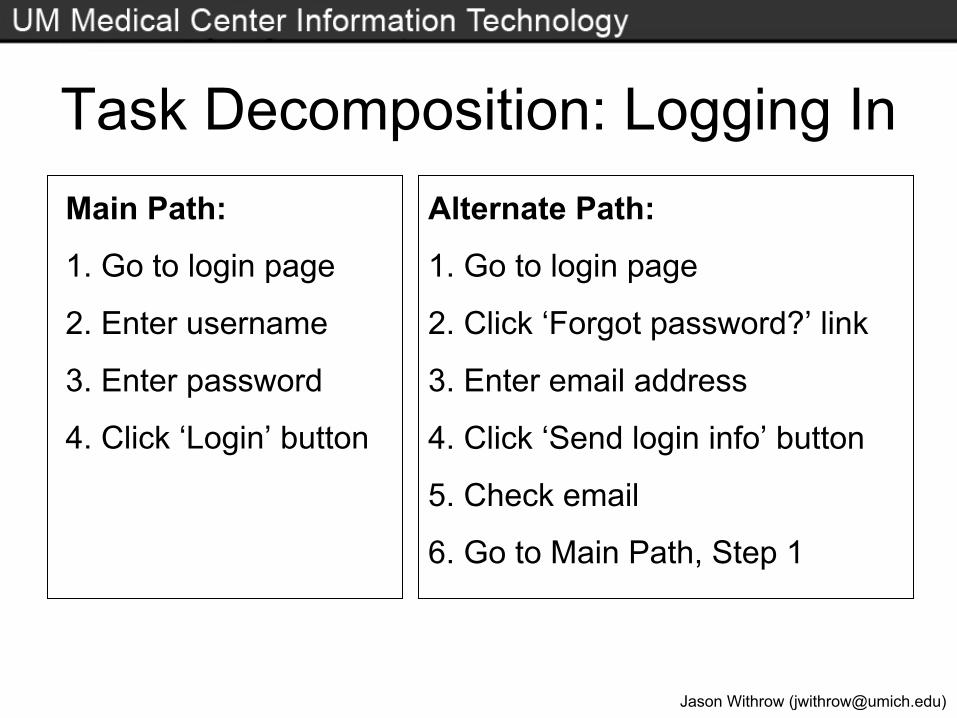
Task Decomposition: Logging InMain Path:
1. Go to login page
2. Enter username
3. Enter password
4. Click ‘Login’ button
Alternate Path:
1. Go to login page
2. Click ‘Forgot password?’ link
3. Enter email address
4. Click ‘Send login info’ button
5. Check email
6. Go to Main Path, Step 1

Jason Withrow ([email protected])
Task Decomposition: SearchingMain Path:
1. Enter query
2. Click ‘Search’ button
3. View results (perhaps multiple pages)
4. Click link in results
5. If no results or no good results found, back to the Search page
Alternate Path:
1. Click ‘Advanced Search’ link
2. Specify Boolean operator
3. Specify scope of search
4. Click ‘Search’ button
5. Go to Main Path, Step 3

Jason Withrow ([email protected])
Task / Logic Flow Diagram
Enter Username
Enter Password
Click ‘Login’
Login Page
Know login info?
Yes
No Click ‘Forgot Password’ Link
Enter Email
Click ‘Send Login Info’ Button
Check Email

Jason Withrow ([email protected])
Jason Withrow ([email protected])
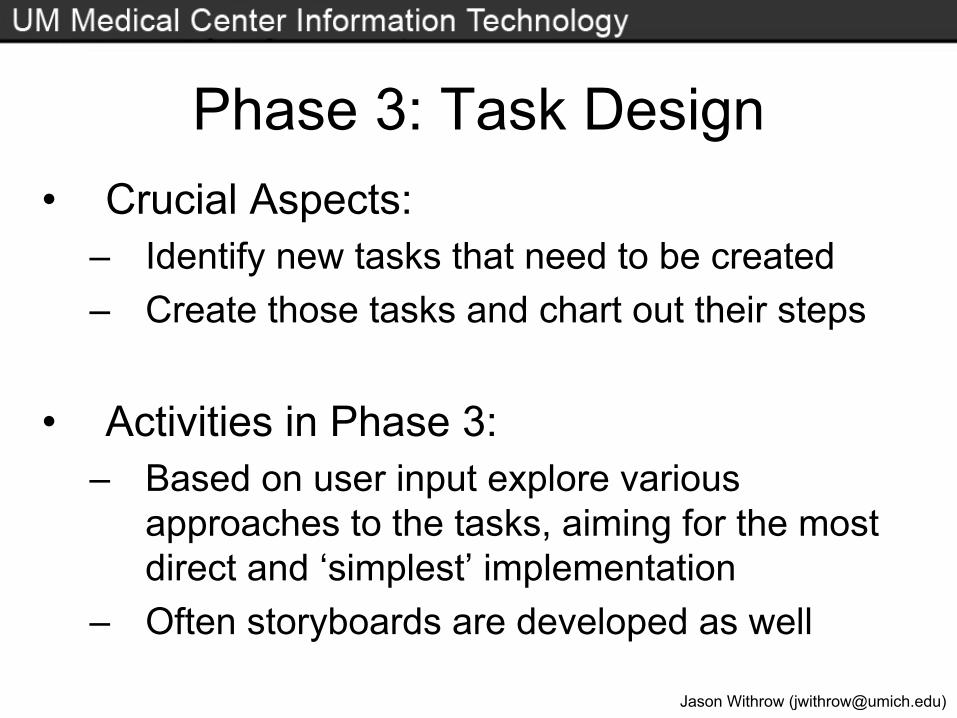
Phase 3: Task Design• Crucial Aspects:
– Identify new tasks that need to be created– Create those tasks and chart out their steps
• Activities in Phase 3:– Based on user input explore various
approaches to the tasks, aiming for the most direct and ‘simplest’ implementation
– Often storyboards are developed as well
Jason Withrow ([email protected])
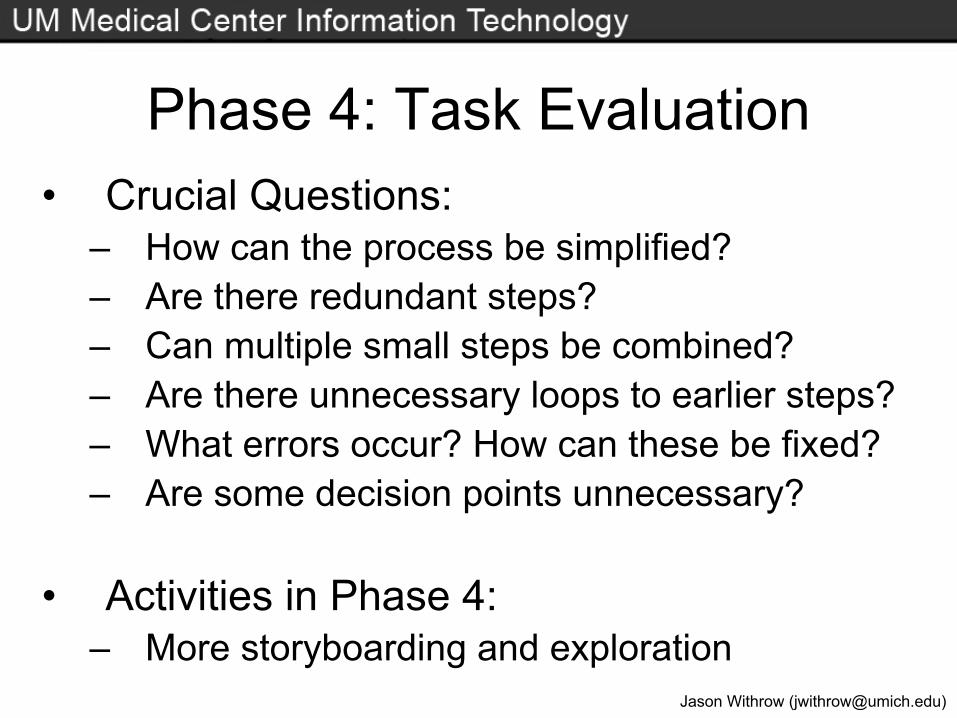
Phase 4: Task Evaluation• Crucial Questions:
– How can the process be simplified? – Are there redundant steps? – Can multiple small steps be combined?– Are there unnecessary loops to earlier steps?– What errors occur? How can these be fixed?– Are some decision points unnecessary?
• Activities in Phase 4:– More storyboarding and exploration

Jason Withrow ([email protected])
The Benefits of Task Evaluation• When redesigning an existing task, you
have an opportunity to make the steps in the task:
– Easier to understand (and thus to complete)– Easier to remember– Less prone to causing user errors– Faster / more efficient

Jason Withrow ([email protected])
Potential Usability Issues• Process is too long; consolidate into a
smaller number of pages• The user gets a few steps into the task and
then is informed:– That they need to be registered, so they are
moved over to registration and cannot get back to their previous place once registration is completed (forcing them to start over)
– That they cannot proceed because the item is out of stock; why not tell them earlier?
Jason Withrow ([email protected])
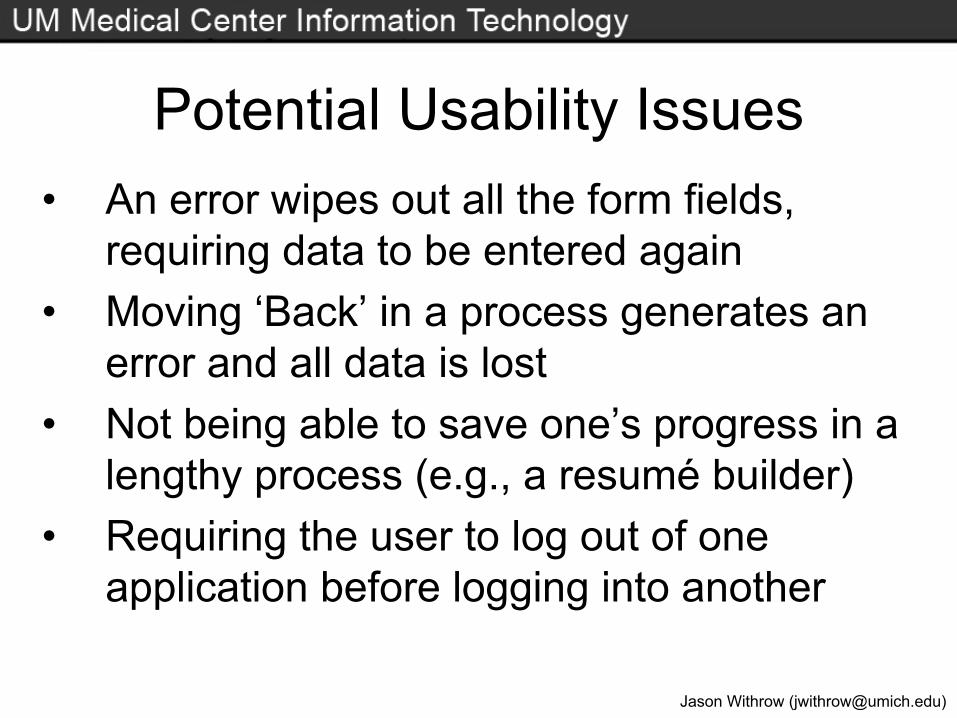
Potential Usability Issues• An error wipes out all the form fields,
requiring data to be entered again• Moving ‘Back’ in a process generates an
error and all data is lost• Not being able to save one’s progress in a
lengthy process (e.g., a resumé builder)• Requiring the user to log out of one
application before logging into another

Jason Withrow ([email protected])
Phase 5: Task Review• Crucial Questions:
– Did we get this right?– Did we miss anything?
• Activities in Phase 5:– Return to the users and show them the revised
task(s). They will be using this system and they won’t hesitate to point out issues they see.

Jason Withrow ([email protected])
Levels of Data Analysis• A task can be analyzed at varying levels of
detail. The most important question to ask is: “Will this extra detail be useful?”
• Some of the more extreme options:– List system responses (e.g., computer outputs)– List necessary resources for each step– Indicate approximate times for each action and
times for the system responses– List substeps at the lowest level (e.g., moving
the hand, gripping the mouse, etc.)

Jason Withrow ([email protected])
Commonly Included Data• Alternate branches in a task
– Often shown in a task/logic flow diagram• User mental operations (e.g., decision
points)• Errors placed at the exact point where they
occur in the existing task, with an explanation of why that error is occurring

Jason Withrow ([email protected])
Displaying the Task Analysis Data• There is not one ‘perfect’ way to display a
task analysis. The choice often depends on the task being analyzed.
• Tasks with decision points and alternate (branching) paths are often displayed with a task flow diagram
– The main drawback is the time required to create these diagrams, although the simple lines and shapes used make it easier/faster
Jason Withrow ([email protected])
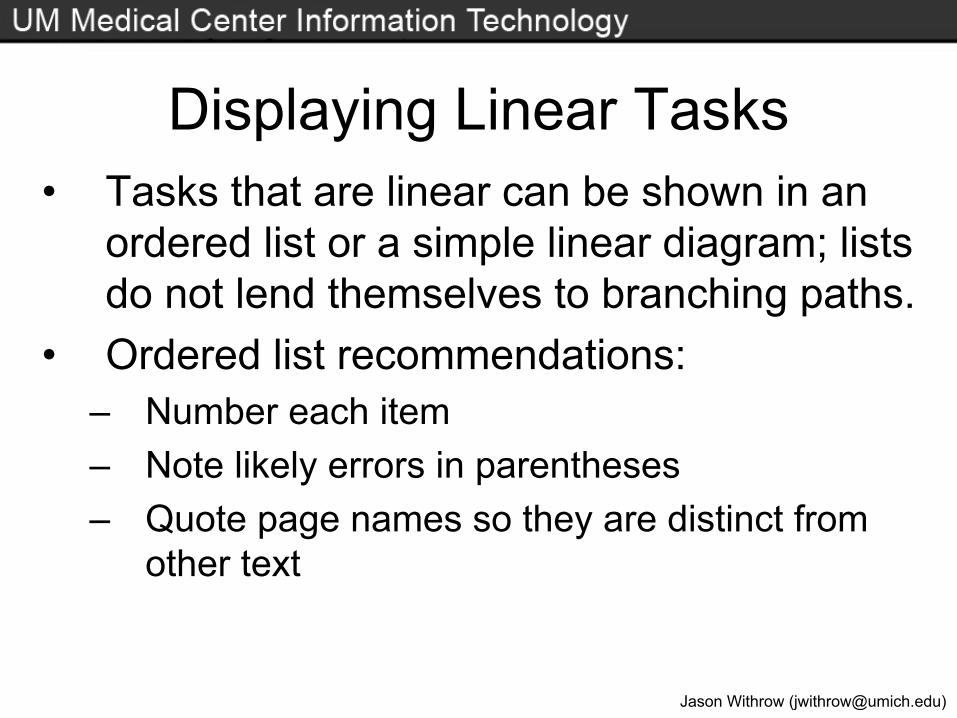
Displaying Linear Tasks• Tasks that are linear can be shown in an
ordered list or a simple linear diagram; listsdo not lend themselves to branching paths.
• Ordered list recommendations:– Number each item– Note likely errors in parentheses– Quote page names so they are distinct from
other text

Jason Withrow ([email protected])
Using Both Lists & Flow Diagrams• It is often useful to create both ‘views’ of
the process, starting with the ordered list and then progressing to the flow diagram
• The ordered list maps out the basic paths and then the diagram shows more details, such as placement of decision points and how the branching works
Jason Withrow ([email protected])
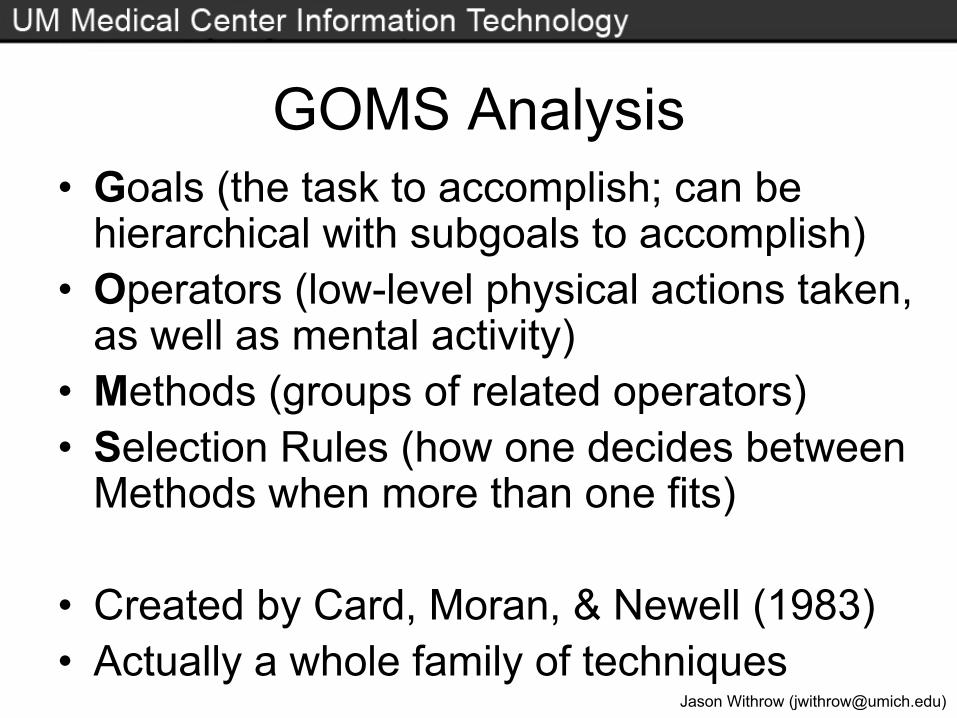
GOMS Analysis• Goals (the task to accomplish; can be
hierarchical with subgoals to accomplish)• Operators (low-level physical actions taken,
as well as mental activity)• Methods (groups of related operators)• Selection Rules (how one decides between
Methods when more than one fits)
• Created by Card, Moran, & Newell (1983)• Actually a whole family of techniques
Jason Withrow ([email protected])
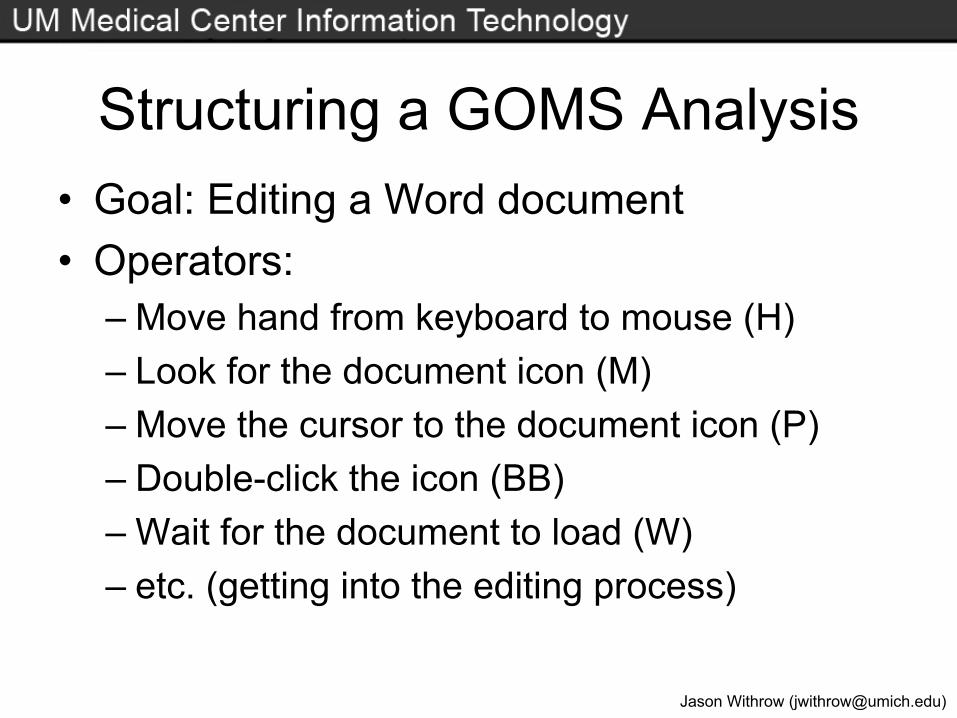
Structuring a GOMS Analysis• Goal: Editing a Word document• Operators:
– Move hand from keyboard to mouse (H)– Look for the document icon (M)– Move the cursor to the document icon (P)– Double-click the icon (BB)– Wait for the document to load (W)– etc. (getting into the editing process)
Jason Withrow ([email protected])
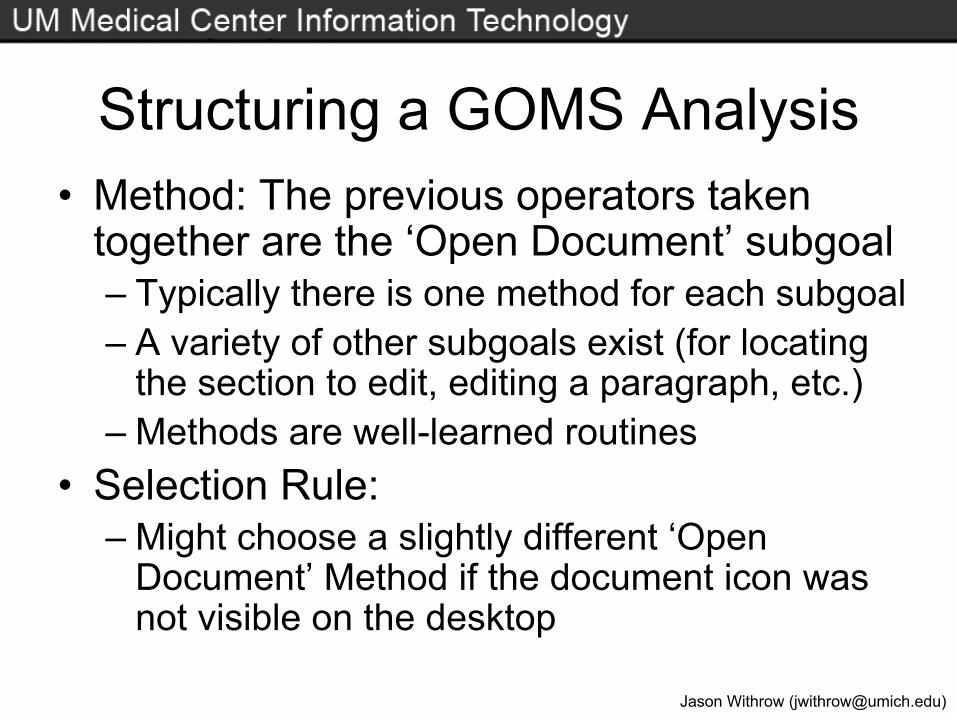
Structuring a GOMS Analysis• Method: The previous operators taken
together are the ‘Open Document’ subgoal– Typically there is one method for each subgoal– A variety of other subgoals exist (for locating
the section to edit, editing a paragraph, etc.)– Methods are well-learned routines
• Selection Rule: – Might choose a slightly different ‘Open
Document’ Method if the document icon was not visible on the desktop
Jason Withrow ([email protected])
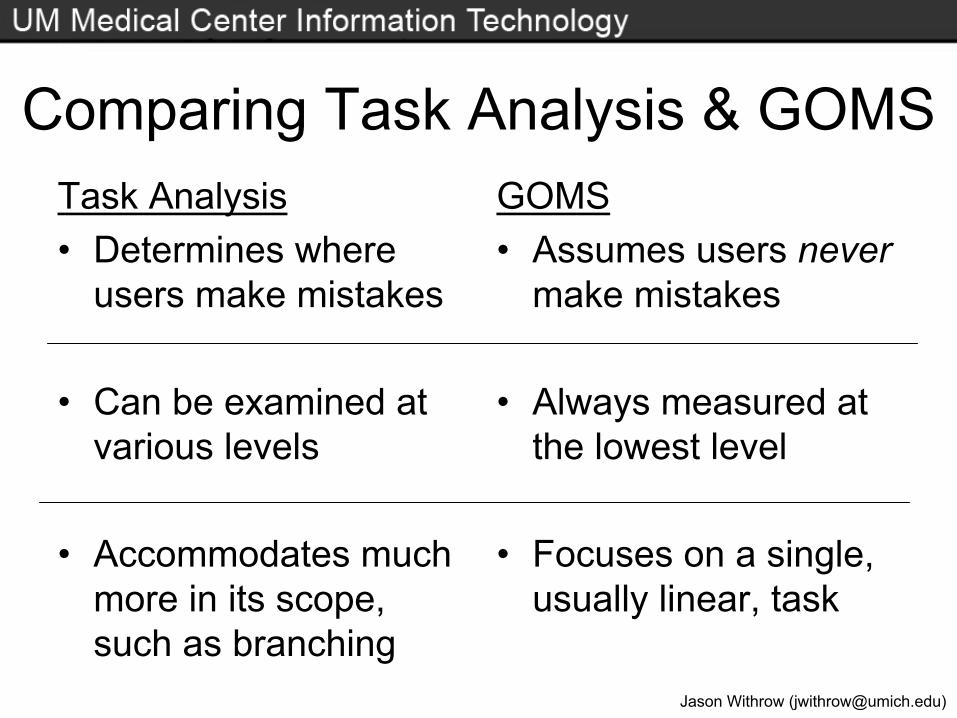
Comparing Task Analysis & GOMSTask Analysis• Determines where
users make mistakes
• Can be examined at various levels
• Accommodates much more in its scope, such as branching
GOMS• Assumes users never
make mistakes
• Always measured at the lowest level
• Focuses on a single, usually linear, task

Jason Withrow ([email protected])
Comparing Task Analysis & GOMSTask Analysis• Interest is in mapping
out a task, to determine the steps involved
• Can factor in individual differences
• Fatigue can factor into the modeling
GOMS• Focused on measuring
task performance, to determine best approach
• Assumes all users are the same
• Never considers effects of fatigue on performance

Jason Withrow ([email protected])
Keystroke-Level Model (KLM)• The simplest of the GOMS approaches• Allows comparison of multiple approaches
to a task to see which is most efficient in terms of time required
• Times are considered to be averages; individual performance would vary to some extent

Jason Withrow ([email protected])
KLM: Opening a Word Document0.4 sec. Move hand from keyboard to mouse (H)1.2 sec. Look for the document icon (M)1.1 sec. Move the cursor to document icon (P)0.2 sec. Double-click the icon (BB)1.0 sec. Wait for the document to load (W)
3.9 seconds to complete goal

Jason Withrow ([email protected])
Storyboarding• A storyboard is a sequence of interface
screens, typically showing progression through a task– This is usually a series of wireframes– Wireframes provide a good balance between
fidelity and time/cost to create– The other options when storyboarding are
Photoshop mockups (too slow/expensive to create) and thumbnails (not enough detail to be useful to developers)
Jason Withrow ([email protected])
From Task Analysis to Storyboards• Storyboards are often paired with a task
analysis, as a way to visually display the progression through the redesigned task
• In this situation the intended audience is the developers, who are responsible for constructing the final interface
• This is why it is crucial to be precise with use of text as well as layout– In cases where text is dynamically generated or
otherwise cannot be determined use ‘xxxxxxx’

Jason Withrow ([email protected])
Supplementing with a Style Guide• A style guide provides specific instructions
concerning how to implement the interface shown in the storyboards– This includes interface details such as fonts,
font sizing, and capitalization style– There are also interaction details such as form
validation, technology used, and providing feedback to the user

Jason Withrow ([email protected])
Annotating Wireframes/Storyboards• To provide more information about a
wireframe or storyboard, you may want to annotate the interface– Annotation means to add notes or comments
• Annotations for wireframes are located onany of the four sides, with lines to thereferenced area– Or footnotes can be used
Jason Withrow ([email protected])
Extended Storyboard Annotations• Since storyboards show a process, there
can be additional information to convey:– Necessary pre-conditions (what needs to
happen before reaching that screen)– Necessary post-conditions (what needs to be
done to progress to the next screen)– Interaction details– Any other pertinent information
• This information is often located below each storyboard screen

Jason Withrow ([email protected])
Implications for Use Cases• A use case would contain:
– Task analysis showing primary and alternate (branching) paths
– Flow diagram– Storyboards/screens (either wireframe or
HTML)