Embed Size (px)
Citation preview

Task XIX: Micro Demand Response andEnergy Savings
Final Management ReportPresented by Linda Hull

Outline of Presentation• Overview of project
– Objectives and work programme• Task Status Report
– Objectives / Progress for last 6 months– Finance
• Final Management Report– Work Performed– Outputs– Achievements
• Matters for the ExCo– Approval of Final Management Report

Overview of Task XIX

OperatingAgent
Finland Greece UKIndia SpainFrance Nether-lands
VTT Ademe
Task XIX Project Participants
PPC BEE NL Agency REE EA Technology
EA Technology

Task XIX – Summary of objectives
• Demand response and energy saving services in the residential and small and medium enterprise sectors– End-use monitoring and feedback– Time of use pricing– Remote / automatic demand control
• Identifying the business case for demand aggregators / energy saving service providers

Work Plan• Subtask 1: Demand response and energy saving products• Subtask 2: End use demand changes• Subtask 3: Demand response & energy saving delivery
mechanisms• Subtask 4: SME customer costs and benefits• Subtask 5: Residential customer costs and benefits• Subtask 6: Business case estimation

Task Status Report

Objectives / Progress over last 6 months
• Finalise the scenarios to be used. • Obtain the necessary data and information from the Task
Experts on the country specific case studies.• Refine Excel models and produce worked examples.• Write the second report - The Business Case for Micro
Demand Response and Energy Saving.
ALL COMPLETED END MAY 2010

FinanceSubtask Description
(Euros) (Euros)1 Demand response and energy saving products 45,875 40,1412 End user demand changes 54,895 48,0333 Delivery mechanisms 39,025 34,1474 SME costs/benefits 41,640 36,4355 Residential costs/benefits 41,640 36,4356 Business case estimation 42,825 37,472
Project management, ExCo liaison & reporting 48,795 42,696Travel and subsisdence 23,150 20,256
337,845 295,614
Original Budget Revised B
Revised Budget (Euros)
Expenditure to end August 2010 £197,753

Final Management Report
• Work performed• Reports
– Report 1– Report 2– Dissemination of results
• Recommendations
OverviewLessons learnt and conclusions

Work Performed – overview
Jan-
09
Feb-
09
Mar
-09
Apr-
09
May
-09
Jun-
09
Jul-0
9
Aug-
09
Sep-
09
Oct
-09
Nov
-09
Dec
-09
Jan-
10
Feb-
10
Mar
-10
Apr-
10
May
-10
Experts Meetings 15th & 16th January 11th & 12th May 8th & 9th October 8th & 9th FebruaryChester, UK Nice, France Barcelona, Spain Chester, UK
Subtask 1Questionnaire
Market information
Subtask 2Questionnaire
End use consumption
Subtask 3
Report 1Draft 1 Draft 2 Final
Subtasks 4 to 6
Report 2Draft 1 Final

Report 1:Micro Demand Response and Energy Saving Products:
Definition of Requirements & Options for Effective Delivery

Micro Demand Response and Energy Saving Products: Definition of Requirements & Options for Effective Delivery
• Impact of market structure– Opportunities (drivers) for demand response and energy savings– The way participants interact with one another (barriers)
• Opportunities for demand response and energy savings– Types of loads – suitability for different products/services– Difficult to assess due to lack of data – particularly for SMEs
• Products and services– Advantages / disadvantages considered
• Review of pilots and case studies– Results wide ranging
• Technical architecture requirements– The minimum requirements

Residential energy end uses
0% 20% 40% 60% 80% 100%
Finland
France
Greece
Netherlands
Spain
UKHeatingHot WaterA/CLightingCold AppliancesWet AppliancesConsumer ElectronicsICTCookingSaunasCar HeatingFansOther
0%
10%
20%
30%
40%
50%
60%
Finland France Greece Netherlands Spain UK
% o
f Res
iden
tial C
onsu
mpt
ion
interruptibleschedulablehybridconvenience
Products
Demand Side Management
Indirect
Load level(amount of energy consumed)
Load Shape (pattern of energy consumption)
Sustained
(long term)
Demand response
TOU tariffs
?
Improved building
standards
Incentive Based
Process / behaviour
change
Improved appliance efficiency
Other Block tariff
Reward scheme
Incentive based
Critical P eak
Pricing
DynamicTOU
pricing
Semidynamic
TOU
Direct load
controlDirect
End Use Monitoring and Feedback
Load limiting
Energy Saving
PRODUCTS
MECHANISMS
TOU tariffs
Static TOU pricing
Processbehaviourchange
Flexible (short term

Technical Architecture
• Controller• Consumer Interface• Response Monitor (Meter)• Internal Communication• Communications Gateway• External Communication
Communications Gateway
Consumer Interface
kWh
£/$/€
CO2
Response Monitor
kWh
kW
Controller 1
Controller 2
Controller 3
End Use Demand 2
Generator / Energy
Storage 1
End Use Demand 1
Response Monitor
kWh
kW
Internal CommunicationExternal Communication

Minimum Functionality ExampleDR – Dynamic Time-of-Use TariffsController Consumer Interface Internal Communications
*Trigger Mode: Manual [Automatic]
*Demand Modification: On/Off [& Modulated]
*Location: General Purpose Outlet (GPO) [Central Home
Energy Management System]
*Information: Tariff Price & Historical consumption
*Notification: Meter Display [VDU+Moblile/Pager] & Bills
*Notification Frequency: Half-houly/Hourly & Billing Cycle (monthly,
quarterly, annually)*Input: None [Consumer Preference
Input]
None[*Signal Flow: Duplex (Two-
way)][*Medium: Wireless]
Response Monitor (Meter) Communications Gateway External Communications
*Type: Interval Meter*Data Transfer: Manual
Read Locally [Read Remotely]
*Tariff: Tariffs can be applied retrospectively with
time stamping
*Signal Flow: Simplex (One-way) [Duplex (Two-way)]
*Situation: Customer Interface (Meter Display/VDU) [Controller (Central
Home Energy Management System)]
*Signal Flow: Simplex (One-way) to Consumer [Duplex (Two-
way)]*Connection: [To/]From
Aggregator, ESCO or Supplier
Report 1: Conclusions
• Impact of market structure is significant– Different drivers / opportunities for new products– Different barriers
• Lack of data on energy end use consumption– Time of day data – Small and medium enterprises
• No ‘one size fits all solutions’– Products– Energy end uses

Report 2:Evaluating The Business Case for
Micro Demand Response and Energy Saving

Evaluating The Business Case forMicro Demand Response and Energy Saving
• Step-by-step methodology• Five country specific case studies
– Finland: Dynamic control of residential storage heater loads– France: Dynamic control of residential storage heater loads– Greece: Subsidy for ‘green a/c’ equipment– India: Replacement of incandescent lamps with CFLs– UK: Direct load control of commercial air-conditioning loads

Step-by-step approach
1. Define the Problem
2. Target Processes
3. Technology
4. Primary Business Case 5. Future Add-ins
“win-win-win”

1. Define the Problem
2. Target Processes
3. Technology
4. Primary Business Case 4. Future Add-ins
The problem?• National Grid (TSO) increasing need for Balancing Services
Reserve 2010/2011 Forecast 2025/26 Volume 3 TWh per annum 8 TWh per annum Cost £311m per annum £690m per annum
1. Define the Problem
2. Target Processes
3. Technology
4. Primary Business Case 4. Future Add-ins
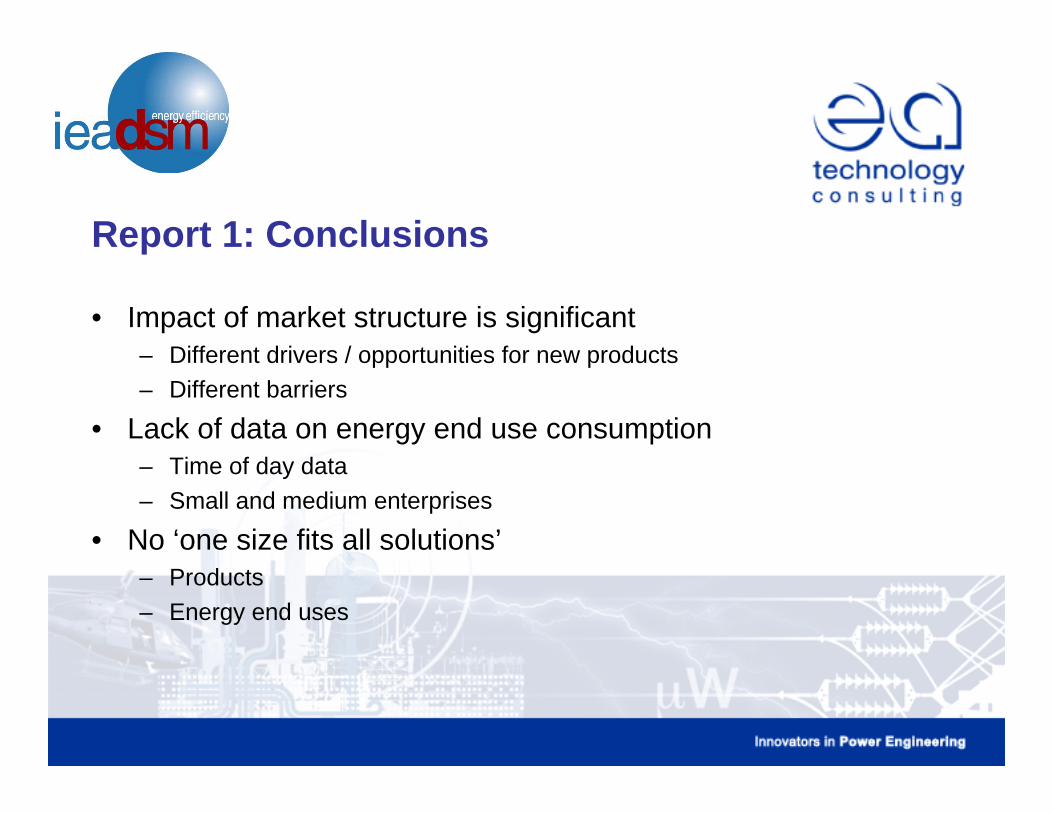
Target Processes?• Cooling and ventilation loads significant
– ~10% to 20% of electricity used in services/commercial sector
• Three scenario’s considered– Single split a/c unit (power consumption 2kW / cooling o/p 6kW)– Scenario 1: daytime / summer operation– Scenario 2: daytime / year round operation– Scenario 3: 24 hours per day / year round operation

1. Define the Problem
2. Target Processes
3. Technology
4. Primary Business Case 4. Future Add-ins
Control, Monitoring, Communication Technology• Control: automatic on/off control of compressor• Meter: existing advanced metering (AMR)• Comms Gateway: dedicated gateway needed• Internal Comms: one way wireless (or wired)• External Comms: one way PSTN, GSM or internet

1. Define the Problem
2. Target Processes
3. Technology
4. Primary Business Case 4. Future Add-ins
Primary Business Case• Aggregator:
– Expenditure: Purchase of controllers– Income: Provision of balances services to TSO
• Consumer:– Energy savings advice (sufficient?)
• TSO:– Avoided shortfall of reserve and equivalent price to conventional sources

UK: Direct Load Control ofCommercial A/C (1 x 2kW)
-800
-600
-400
-200
0
200
400
600
800
0 20 40 60 80 100 120
Annual Benefit (€/customer/year)
NP
V to
agg
rega
tor (
€/cu
stom
er)
€50 Upfront,€5/year ongoing
€100 Upfront,€10/year ongoing
€200 Upfront,€20/year ongoing
€300 Upfront,€30/year ongoing
Control, Monitoring & Communication Technology costs(per customer)
24 hrs x 375 days a/c utilisation 20% £103.20/year
8 hrs x 80 days utilisation 10% £12.50/year

1. Define the Problem
2. Target Processes
3. Technology
4. Primary Business Case 4. Future Add-ins
Future Add-Ins (Secondary Business Case)• Provision of frequency response• Additional technology costs
– Real-time control

Report 2: Conclusions
• Step-by-step approach provides a useful way of assessing business case
• Difficult to obtain robust data– Technology costs– Amount of demand available for specific products/services– Value of demand response
• Roll of smart metering needs to be considered– None of the case studies utilised smart meter functionality (when available)

Dissemination of Results
• Reports 1 & 2 confidential to participants until March 2011– After March 2011: Available from public area of IEA DSM web-site
• In country dissemination led by Experts– National focus meetings– Summary reports – National reports

Overall Recommendations
• Impact of market structure important– Market mapping could help interaction between participants– Role of regulation needs to be understood
• Difficult to assess level of demand response / energy savings– Need for improved energy end use information
• Technology costs– Need for on-going support of innovation in control and monitoring technology
• Smart meter– Third-party access

Questions / comments
Approval of Final Management
Matters for Executive Committee