Embed Size (px)
Citation preview

Tasmanian Climate Change Office
TASMANIAN GREENHOUSE GAS ACCOUNTS STATE GREENHOUSE GAS INVENTORY 2014-15
Tasmanian Climate Change Office Tasmanian Climate Change Office, State Greenhouse Gas Inventory 2014-15
1
Tasmanian Greenhouse Gas Accounts: State Greenhouse Gas Inventory 2014-15 © Government of Tasmania Tasmanian Climate Change Office Excerpts from this publication may be reproduced with appropriate acknowledgement, as permitted under the Copyright Act 1968. Published July 2017 ISBN 978 0 7246 5728 2

Tasmanian Climate Change Office Tasmanian Climate Change Office, State Greenhouse Gas Inventory 2014-15
2
Contents
Minister’s Message ...................................................................................................................................... 4
Introduction .................................................................................................................................................. 5
Measuring Tasmania’s Emissions ............................................................................................................................. 5
International Reporting Rules.................................................................................................................................... 6
Baseline and emissions profile for 2014-15 ........................................................................................... 7
Emissions by sector ................................................................................................................................. 10
Energy ................................................................................................................................................................................. 10
Industrial processes and product use ................................................................................................................ 13
Agriculture ........................................................................................................................................................................ 16
Land use, land use change and forestry ........................................................................................................... 19
Waste ................................................................................................................................................................................. 22
Other performance measures ............................................................................................................... 24
Emissions per capita .................................................................................................................................................... 24
Emissions per dollar of GSP ................................................................................................................................... 25
National context ...................................................................................................................................... 26
The Paris Agreement ................................................................................................................................................. 26
National Electricity Market ...................................................................................................................................... 26
Leveraging National Programs .............................................................................................................................. 27

Tasmanian Climate Change Office Tasmanian Climate Change Office, State Greenhouse Gas Inventory 2014-15
3
Figures Figure 1: Comparison of 1989-90 baseline and 2014-15 greenhouse gas emissions for
Tasmania with the legislated emissions reduction target of 60 per cent below baseline levels ..................................................................................................................................................... 7
Figure 2: Tasmania’s greenhouse gas emissions from 1989-90 to 2014-15, by sector .................. 8
Figure 3: Tasmania's greenhouse gas emissions for 2014-15, by sector ................................................ 9
Figure 4: Tasmania’s energy sector greenhouse gas emissions from the 1989-90 baseline year to 2014-15, by subsector .......................................................................................................................... 12
Figure 5: Tasmania’s industrial processes and product use sector greenhouse gas emissions from the 1989-90 baseline year to 2014-15, by subsector ................................................... 15
Figure 6: Tasmania’s agriculture sector greenhouse gas emissions from the 1989-90 baseline year to 2014-15, by subsector ............................................................................................................... 17
Figure 7: Comparison of agriculture (enteric fermentation) emissions and livestock numbers (‘000s) ................................................................................................................................................................. 18
Figure 8: Tasmania’s LULUCF sector greenhouse gas emissions from the 1989-90 baseline year to 2014-15, by subsector ............................................................................................................... 20
Figure 9: Tasmania’s waste sector greenhouse gas emissions from the 1989-90 baseline year to 2014-15, by subsector .......................................................................................................................... 23
Figure 10: Tasmania’s greenhouse gas emissions per capita (t CO2-e per person) from 1989-90 to 2014-15 ................................................................................................................................................. 24
Figure 11: Comparison of state and territory emissions per capita (t CO2-e per person) in 2014-15 .............................................................................................................................................................. 25
Figure 12: Greenhouse gas emissions per dollar of Gross State Product (kg CO2-e per $) ...... 25
Tables Table 1: Change in Tasmania’s 1989-90 baseline and 2014-15 greenhouse gas emissions, by
sector ...................................................................................................................................................................... 9
Table 2: Change in Tasmania’s greenhouse gas emissions levels in the year to 2014-15, by sector ...................................................................................................................................................................... 9
Table 3: Change in Tasmania’s energy sector greenhouse gas emissions between the 1989-90 baseline year and 2014-15, by subsector ..................................................................... 11
Table 4: Change in Tasmania’s industrial processes and product use sector greenhouse gas emissions between the 1989-90 baseline year and 2014-15, by subsector ................. 14
Table 5: Change in Tasmania’s agriculture sector greenhouse gas emissions between the 1989-90 baseline year and 2014-15, by subsector ..................................................................... 16
Table 6: Change in Tasmania’s LULUCF sector greenhouse gas emissions between the 1989-90 baseline year and 2014-15, by subsector ..................................................................... 19
Table 7: Change in Tasmania’s waste sector greenhouse gas emissions between the 1989-90 baseline year and 2014-15, by subsector ......................................................................................... 22

Tasmanian Climate Change Office Tasmanian Climate Change Office, State Greenhouse Gas Inventory 2014-15
4
Minister’s Message I am pleased to report on the latest greenhouse gas accounts for Tasmania. The State’s emissions have declined by 95 per cent from 1990 levels. This means that, for the third year in a row, Tasmania has exceeded its legislated emissions reduction target of 60 per cent below 1990 levels by 2050.
The Tasmanian Government has recently released Climate Action 21: Tasmania’s Climate Change Action Plan 2017-21. The plan focuses on delivering practical action in areas where the greatest benefits can be achieved and risks managed in a measured way that will enable Tasmania to play its part in meeting the global climate challenge.
Underpinning the plan is a commitment to establish a long-term target to achieve zero net emissions for Tasmania by 2050. This target aligns with the Paris Agreement to limit global warming to well below two degrees above pre-industrial levels. The Government has committed $3 million to support the delivery of the plan, which represents the biggest investment in supporting action on climate change by any Tasmanian Government.
Climate Action 21 has 37 actions based around six priority areas. Key actions include: delivery of the Tasmanian Energy Efficiency Loan Scheme; maximising our renewable energy generation to improve security and reliability for both Tasmania and the National Electricity Market; supporting the rollout of a statewide electric vehicle charging network in partnership with TasNetworks, local government and businesses; and a home energy savings program to support low income households to identify and implement energy efficiency measures.
Tasmania’s path to zero net emissions will support the State’s economy, improve our productivity and provide opportunities for growth. By working together with industry, business and the community, we can leverage our status as a very low greenhouse gas emitter, seize our natural and historic advantages, and make our State climate ready.
This report on the latest greenhouse gas accounts reflects Tasmania’s competitive strengths in renewable energy, natural assets and action on climate change issues.
Matthew Groom MP
Minister for Environment and Parks
Tasmanian Climate Change Office Tasmanian Climate Change Office, State Greenhouse Gas Inventory 2014-15
5
Introduction
The Tasmanian Greenhouse Gas Accounts 2014-15 report demonstrates the State’s progress towards its emissions reduction target and monitors emissions by sector. Under the Climate Change (State Action) Act 2008, Tasmania currently has a legislated greenhouse gas emissions reduction target of at least 60 per cent below 1990 levels by 2050. This report will inform future programs as the State sets a course of action that aspires to zero net emissions by 2050.
Measuring Tasmania’s Emissions Each year, the Minister publishes Tasmania’s baseline and latest emissions figure in the Tasmanian Government Gazette as required under the Climate Change (Greenhouse Gas Emissions) Regulations 2012 (the Regulations). This report, prepared by the Tasmanian Climate Change Office (TCCO) provides further information on the State’s emissions by sector.
Regulation 4 of the Regulations sets out the method for measuring Tasmania’s 1989-90 baseline greenhouse gas emissions, and changes to the State’s emissions over time. The method outlined in the Regulations is consistent with national and international emissions reporting requirements.
The 1989-90 baseline is the total carbon-dioxide equivalent (CO2-e) emissions for Tasmania for the financial year ending on 30 June 1990, as set out in the most recently published state and territory greenhouse gas inventories report.
This Tasmanian Greenhouse Gas Accounts 2014-15 report was compiled using data from the Australian Government’s State and Territory Greenhouse Gas Inventories 20151, produced by the Australian Government Department of the Environment and Energy to meet annual reporting commitments under Article 12 of the United Nations Framework Convention on Climate Change (UNFCCC) and Article 7 of the Kyoto Protocol.
1 http://www.environment.gov.au/climate-change/greenhouse-gas-measurement/publications/state-and-territory-
greenhouse-gas-inventories-2015.
Tasmanian Climate Change Office Tasmanian Climate Change Office, State Greenhouse Gas Inventory 2014-15
6
Emissions for the following sectors are to be included:
• energy;
• industrial processes;
• agriculture;
• waste;
• land use, land use change and forestry (LULUCF); and
• any other sector set out in the State and Territory Greenhouse Gas Inventories report.
Due to the complexity of the data and calculations, there is a two-year lag in reporting, with the latest greenhouse gas emissions accounts relating to 2014-15.
International Reporting Rules The State and Territory Greenhouse Gas Inventories 2015 is the third prepared under the second Kyoto Agreement reporting period (spanning 2013 to 2020), and is based on revised international reporting rules. As agreed by the UNFCCC in 2013, emissions must be estimated using methods described by the Intergovernmental Panel on Climate Change (IPCC) 2006 IPCC Guidelines for National Greenhouse Gas Inventories and 2013 Revised Supplementary Methods and Good Practice Guidance arising from the Kyoto Protocol.
The revised reporting rules and the IPCC guidelines have resulted in changes to the coverage of emission sources, and to some methods and emission factors.2 They have also required changes to the global warming potentials3 used to convert emissions from some gases into CO2-e.
The most consequential change for Tasmania has been the mandatory inclusion of forest management, cropland management and grazing land management activities as subsectors within the LULUCF sector. The inclusion of emissions sources and carbon sinks (or removals), from harvesting and timber growth in the State’s multiple-use public forests, private native forests and plantations, has a significant impact on Tasmania’s emissions accounts.
Each year, the emissions estimates are calculated for all sectors from the baseline year of 1989-90 through to the current year, being 2014-15 in this instance. To incorporate changes to the reporting rules over time, and to maintain usefulness and accuracy in reporting and comparing estimates, all emissions estimates are recalculated yearly across all sectors, from the baseline year of 1989-90 through to the current year. This means the emissions estimates included in this report cannot be directly compared with those released in previous year’s greenhouse gas accounts.
2 The UNFCCC defines an emission factor as the average emission rate of a given greenhouse gas for a given
source, relative to units of activity. 3 Global warming potentials are a relative measure of how much heat a greenhouse gas traps in the atmosphere.
They compare the amount of heat trapped by a certain mass of the gas in question to the amount of heat trapped by a similar mass of carbon dioxide.

Tasmanian Climate Change Office Tasmanian Climate Change Office, State Greenhouse Gas Inventory 2014-15
Tasmanian Climate Change Office 7
Baseline and emissions profile for 2014-15
Tasmania’s total greenhouse gas emissions in 2015 were 0.89 mega-tonnes of carbon dioxide equivalent, which is a 95 per cent reduction from 1989-90 baseline levels.
Tasmania’s 1989-90 baseline greenhouse gas emissions were 19.40 mega-tonnes (Mt) CO2-e. The State’s total emissions for 2014-15 were 0.89 Mt CO2-e, which is a 95 per cent reduction from the baseline. This means that for the third year in a row, Tasmania has exceeded its legislated emissions reduction target of 60 per cent below 1990 levels by 2050 (see Figure 1).
Figure 1: Comparison of 1989-90 baseline and 2014-15 greenhouse gas emissions for Tasmania with the legislated emissions reduction target of 60 per cent below baseline levels
19.4
0.9
0.0
5.0
10.0
15.0
20.0
25.0
1990 2015
Gre
enho
use
gas
emis
sion
s(M
t C
O2-
e)
2050 emissions reduction target (11.6)
Tasmanian Climate Change Office Tasmanian Climate Change Office, State Greenhouse Gas Inventory 2014-15
8
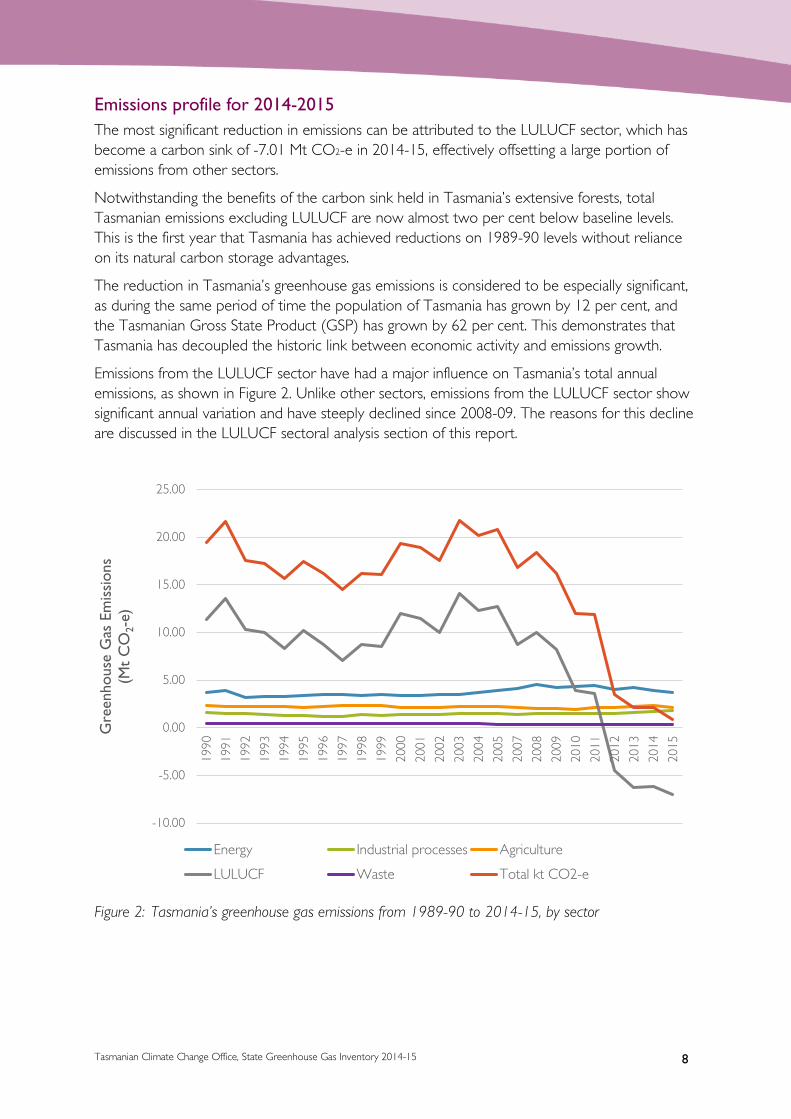
Emissions profile for 2014-2015 The most significant reduction in emissions can be attributed to the LULUCF sector, which has become a carbon sink of -7.01 Mt CO2-e in 2014-15, effectively offsetting a large portion of emissions from other sectors.
Notwithstanding the benefits of the carbon sink held in Tasmania’s extensive forests, total Tasmanian emissions excluding LULUCF are now almost two per cent below baseline levels. This is the first year that Tasmania has achieved reductions on 1989-90 levels without reliance on its natural carbon storage advantages.
The reduction in Tasmania’s greenhouse gas emissions is considered to be especially significant, as during the same period of time the population of Tasmania has grown by 12 per cent, and the Tasmanian Gross State Product (GSP) has grown by 62 per cent. This demonstrates that Tasmania has decoupled the historic link between economic activity and emissions growth.
Emissions from the LULUCF sector have had a major influence on Tasmania’s total annual emissions, as shown in Figure 2. Unlike other sectors, emissions from the LULUCF sector show significant annual variation and have steeply declined since 2008-09. The reasons for this decline are discussed in the LULUCF sectoral analysis section of this report.
Figure 2: Tasmania’s greenhouse gas emissions from 1989-90 to 2014-15, by sector
-10.00
-5.00
0.00
5.00
10.00
15.00
20.00
25.00
1990
1991
1992
1993
1994
1995
1996
1997
1998
1999
2000
2001
2002
2003
2004
2005
2007
2008
2009
2010
2011
2012
2013
2014
2015
Gre
enho
use
Gas
Em
issi
ons
(Mt
CO
2-e)
Energy Industrial processes Agriculture
LULUCF Waste Total kt CO2-e

Tasmanian Climate Change Office Tasmanian Climate Change Office, State Greenhouse Gas Inventory 2014-15
9
Figure 3 shows contributions to total Tasmanian greenhouse gas emissions by sector in 2014-15. Further discussion relating to the impact of subsectors on the greenhouse gas emissions for each sector is contained in the Emissions by sector section of this report.
Figure 3: Tasmania's greenhouse gas emissions for 2014-15, by sector
Table 1 shows the change in both total and sectoral greenhouse gas emissions between the baseline year and 2014-15, while Table 2 shows the differences in Tasmania’s 2014-15 emissions by sector from the preceding year. Note that the percentage changes in this report are calculated on giga-tonnes of emissions, then converted to mega-tonnes and rounded to one decimal place.
Sector Emissions (Mt CO2-e)
Change (%) 1990 2015
Energy 3.72 3.69 -0.7
Industrial processes and product use 1.56 1.80 15.7
Agriculture 2.32 2.12 -8.5
Land use, land use change and forestry 11.35 -7.01 -162.0
Waste 0.47 0.30 -37.0
Table 1: Change in Tasmania’s 1989-90 baseline and 2014-15 greenhouse gas emissions, by sector
Table 2: Change in Tasmania’s greenhouse gas emissions levels in the year to 2014-15, by sector
Sector Emissions (Mt CO2-e)
Change (%) 2014 2015
Energy 3.90 3.69 -5.4
Industrial processes and product use 1.68 1.80 7.0
Agriculture 2.29 2.12 -7.5
Land use, land use change and forestry -6.11 -7.01 -14.8
Waste 0.34 0.30 -13.5
Energy: 3.69Industrial
processes: 1.80 Agriculture: 2.12
LULUCF: -7.01
Waste: 0.30
-8.00
-6.00
-4.00
-2.00
0.00
2.00
4.00
6.00
Gre
enho
use
Gas
Em
issi
ons
(Mt
CO
2-e)
Tasmanian Climate Change Office Tasmanian Climate Change Office, State Greenhouse Gas Inventory 2014-15
10
Emissions by sector
This section provides a sectoral analysis from a Tasmanian perspective, of the greenhouse gas emissions for the five reporting sectors.
Energy The energy sector includes the following subsectors:
• Energy industries: includes emissions that result from the generation of electricity as well as combustion emissions from petroleum refining, oil and gas extraction and processing, coal mining and solid fuel manufacturing.
• Manufacturing industries and construction: includes emissions from on-site combustion of fossil fuels by the manufacturing, non-energy mining and construction sectors.
• Transport: includes emissions from the direct combustion of fuels in transportation by road, rail, domestic aviation and domestic shipping.
• Other sectors: includes emissions from energy used by the commercial, institutional and residential sectors, as well as fuel used by agricultural, fishery and forestry equipment.
• Other: includes all remaining fuel combustion emissions such as those from engine lubricants and greases.
• Fugitive emissions from fuels: includes emissions associated with the extraction and distribution of fossil fuels such as coal, oil and natural gas.
• CO2 transport and storage: includes emissions related to carbon capture and storage (CCS). Tasmania does not currently have any CCS projects operating.
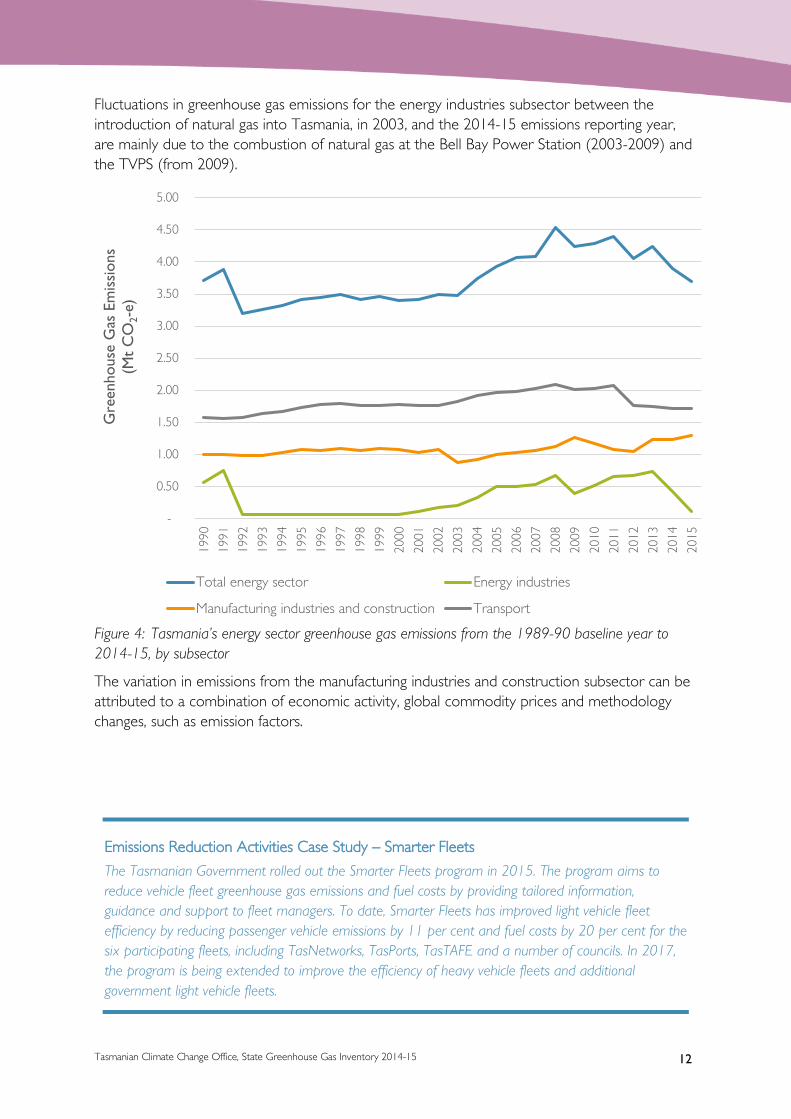
The contribution of these subsectors to Tasmania’s energy sector greenhouse gas emissions is shown in Table 3 and Figure 4.
The emissions associated with electricity generated in Victoria and imported into Tasmania via Basslink are not included in Tasmania’s inventory; rather, they are included in the inventory figures for Victoria.
In 2014-15, the transport subsector continued to be the largest contributor to emissions from the energy sector, followed by manufacturing industries and construction. Emissions from the

Tasmanian Climate Change Office Tasmanian Climate Change Office, State Greenhouse Gas Inventory 2014-15
11
transport subsector increased by 8 per cent between 1989-90 and 2014-15. However, emissions have declined by almost 18 per cent from a peak in 2007-08 despite an increase in vehicle numbers over this period,4 indicating an increase in the fuel efficiency of vehicles.
Table 3: Change in Tasmania’s energy sector greenhouse gas emissions between the 1989-90 baseline year and 2014-15, by subsector
While the greenhouse gas emissions attributed to Tasmania’s energy sector show a slight overall decrease of 0.7 per cent between the baseline year of 1989-90 and 2014-15, the various subsectors have shown significant fluctuations, particularly in recent times.
Stationary energy is a source category of emissions in the energy sector including the energy industries subsector and other direct combustion of fossil fuels in industries, such as manufacturing and construction. Stationary energy emissions account for approximately 52 per cent of emissions nationally. Yet they are a relatively low source of emissions in Tasmania, owing to the State’s renewable energy generation profile. At 1.9 Mt CO2-e, Tasmania has the lowest levels of stationary emissions of all the states and territories, except the Australian Capital Territory as most of its stationary energy is generated in New South Wales, it is a partial inventory with stationary energy emissions included in the New South Wales inventory.
Emissions from the energy industries subsector have decreased over the reporting period, as shown in Figure 4. When considering this decrease, it is important to take into account the Tasmanian Economic Regulator’s observations on Tasmanian electricity imports and generation:
…during 2014-15, the amount of electricity generated in Tasmania declined, with a significant increase in Basslink imports and a decline in exports. The change in Basslink flows was due partly to the removal of the carbon pricing mechanism, from 1 July 2014, but it also reflects reduced inflows and relatively low storage levels for hydro generation. During 2014-15, hydro generation declined by around one-third, compared with 2013-14. There was also less wind generation, due to weather conditions, while there was minimal thermal generation at the Tamar Valley Power Station (TVPS).6
4 From 505,151 vehicles registered in 2008 to 571,550 in June 2015; Historical registration and licensing statistics,
Tasmanian Department of State Growth, http://www.transport.tas.gov.au/registration/information/statistics/ 5 The emissions from the ‘other sectors’ and ‘fugitive emissions from fuels’ subsectors are not available for reporting by subsector. However, emissions from those subsectors are included in the totals set out in Table 3, which are accordingly different from the sum of the figures available for publication. 6 Office of the Tasmanian Economic Regulator, Energy in Tasmania – Performance Report 2014-15 (January 2016),
page v.
Energy Subsector Greenhouse Gas Emissions (Mt CO2-e)
Change (%) 1990 2015
Energy industries 0.57 0.11 -81.2
Manufacturing industries and construction
1.00 1.29 28.6
Transport 1.58 1.71 8.3
Total5 3.72 3.69 -0.7
Tasmanian Climate Change Office Tasmanian Climate Change Office, State Greenhouse Gas Inventory 2014-15
12
Fluctuations in greenhouse gas emissions for the energy industries subsector between the introduction of natural gas into Tasmania, in 2003, and the 2014-15 emissions reporting year, are mainly due to the combustion of natural gas at the Bell Bay Power Station (2003-2009) and the TVPS (from 2009).
Figure 4: Tasmania’s energy sector greenhouse gas emissions from the 1989-90 baseline year to 2014-15, by subsector
The variation in emissions from the manufacturing industries and construction subsector can be attributed to a combination of economic activity, global commodity prices and methodology changes, such as emission factors.
-
0.50
1.00
1.50
2.00
2.50
3.00
3.50
4.00
4.50
5.0019
90
1991
1992
1993
1994
1995
1996
1997
1998
1999
2000
2001
2002
2003
2004
2005
2006
2007
2008
2009
2010
2011
2012
2013
2014
2015
Gre
enho
use
Gas
Em
issi
ons
(Mt
CO
2-e)
Total energy sector Energy industries
Manufacturing industries and construction Transport
Emissions Reduction Activities Case Study – Smarter Fleets
The Tasmanian Government rolled out the Smarter Fleets program in 2015. The program aims to reduce vehicle fleet greenhouse gas emissions and fuel costs by providing tailored information, guidance and support to fleet managers. To date, Smarter Fleets has improved light vehicle fleet efficiency by reducing passenger vehicle emissions by 11 per cent and fuel costs by 20 per cent for the six participating fleets, including TasNetworks, TasPorts, TasTAFE and a number of councils. In 2017, the program is being extended to improve the efficiency of heavy vehicle fleets and additional government light vehicle fleets.
Tasmanian Climate Change Office Tasmanian Climate Change Office, State Greenhouse Gas Inventory 2014-15
13
Industrial processes and product use The industrial processes and product use sector includes the following subsectors:
• Mineral industry: includes emissions that result from mineral processing industries, such as cement, lime, glass and limestone production and road paving with asphalt.
• Chemical industry: includes emissions from chemical production industries, such as soda ash and ammonia.
• Metal industry: includes emissions from the metal processing industries, such as aluminium, steel, iron and zinc production.
• Non-energy products from fuels and solvents use: includes emissions from production of lubricants, greases and solvents.
• Electronics industry: includes emissions from manufacture of integrated circuitry, semiconductors and photovoltaics.
• Product uses as substitutes for ozone depleting substances (ODS): includes emissions from synthetic halocarbons used in refrigeration, air-conditioning, foam blowing, fire protection and aerosols.
• Other product manufacture and use: includes emissions associated with the manufacture of other electrical equipment and compounds such as nitrous oxide, sulphur hexafluoride and perfluorocarbons.
• Other: includes emissions related to food and beverage industries, including the manufacture of beer, wine and alcoholic spirits.
Tasmania’s greenhouse gas emissions from the industrial processes and product use sector have increased by almost 16 per cent since 1989-90, despite a decline through the early 1990s as shown in Figure 5 and Table 4. This increase has resulted, in part, from the product uses as substitutes for ODS subsector and, more recently, emissions from food and beverage industries.
The phase out of ODS under the Montreal Protocol has resulted in consistent growth in emissions from the product uses as substitutes for ODS subsector, from just over 15 tonnes (t) CO2-e in 1993-94 (the first reported year for the subsector) to 0.25 Mt CO2-e in 2014-15. However, this growth is projected to slow by 2019-20, due to the replacement of chlorofluorocarbons and hydrochlorofluorocarbons,7 and the Australian Government phase down of hydrofluorocarbons following the Marrakech Climate Change Conference in November 2016.
7 Commonwealth of Australia, Australia’s Second Biennial Report (December 2015),
https://unfccc.int/files/national_reports/biennial_reports_and_iar/submitted_biennial_reports/application/pdf/australia_second_biennial_report.pdf, page 50.

Tasmanian Climate Change Office Tasmanian Climate Change Office, State Greenhouse Gas Inventory 2014-15
14
Table 4: Change in Tasmania’s industrial processes and product use sector greenhouse gas emissions between the 1989-90 baseline year and 2014-15, by subsector
As Table 4 shows, in 2014-15 almost half the emissions in the industrial processes sector came from food and beverage industries. Annual fluctuations aside, this subsector has shown a general upwards trend in recent years, with a 31 per cent increase in emissions from 2008-09 levels.
AgriGrowth Tasmania notes developments in this industry through its annual Tasmanian Agri-Food ScoreCard8 reporting. Its observations between 2009-10 and 2014-15 include:
• The volume of salmon produced (and therefore processed) increased by 52 per cent, from 30,949 t to 47,184 t;
• The volume of milk processed increased by 32 per cent, from 674 million litres to 891 million litres;
• The volume of beef processed increased by 27 per cent from 52,800 t to approximately 67,000 t; and
• There were several food and beverage processing factory upgrades that increased productivity over the period, including the opening of a large milk powder processing plant in Smithton in 2012.
8 http://dpipwe.tas.gov.au/agriculture/facts-figures/industry-scorecards
Industrial Processes & Product Use Subsector
Greenhouse Gas Emissions (Mt CO2-e) Change (%)
1990 2015
Mineral industry 0.58 0.71 23.2
Non-energy products from fuels and solvents use
0.01 0.00 -58.2
Product uses as substitutes for ozone depleting substances
- 0.25 -
Other product manufacture and use
0.01 0.00 -50.0
Other (food and beverage)
0.97 0.84 -13.7
Total 1.56 1.80 15.7

Tasmanian Climate Change Office Tasmanian Climate Change Office, State Greenhouse Gas Inventory 2014-15
15
Figure 5: Tasmania’s industrial processes and product use sector greenhouse gas emissions from the 1989-90 baseline year to 2014-15, by subsector
Growth in the emissions from Tasmanian food and beverage processing appear consistent with national observations, and is largely being driven by export demand for Australian produce, which is currently expected to increase to 2019-20.9
9 Commonwealth of Australia (2015) Tracking to 2020, page 11, https://www.environment.gov.au/system/files/resources/d46b4104-0a04-4efb-9e83-df97e58eb2ff/files/tracking-to-2020-interim-update-emissions-projections.pdf
-
0.20
0.40
0.60
0.80
1.00
1.20
1.40
1.60
1.80
2.00
1990
1991
1992
1993
1994
1995
1996
1997
1998
1999
2000
2001
2002
2003
2004
2005
2006
2007
2008
2009
2010
2011
2012
2013
2014
2015
Gre
enho
use
Gas
Em
issi
ons
(Mt
CO
2-e)
Total industrial processes Mineral industry
Non-energy products (fuels & solvent use) Product uses as ODS substitutes
Other product manufacture & use Other (food & beverage)
Tasmanian Climate Change Office Tasmanian Climate Change Office, State Greenhouse Gas Inventory 2014-15
16
Agriculture The agriculture sector includes the following subsectors:
• enteric fermentation: includes emissions from the digestive processes of ruminant animals such as cows, sheep, pigs and goats.
• manure management: includes emissions from the decomposition of organic matter in manure under anaerobic conditions.
• rice cultivation: includes emissions during rice growing from the decomposition of plant residues and other organic carbon material in the soil.
• agricultural soils: includes emissions from microbial and chemical transformations that produce and consume nitrous oxide in the soil.
• liming: includes carbon dioxide emissions from the addition of limestone and dolomite to the soil to improve soil quality and plant growth.
• urea application: includes the loss of carbon dioxide from the addition of urea-based fertilisers to the soil.
• other carbon containing fertilisers: includes the loss of carbon dioxide from the addition of other carbon-based fertilisers to the soil.
• other: includes emissions from other sources of agricultural practices.
The agriculture sector comprises the emissions of methane and nitrous oxide only (that is, non-carbon dioxide gases) from livestock, crops, and agricultural and forest soils, and the emissions of carbon dioxide from the application of carbon containing soil additives.
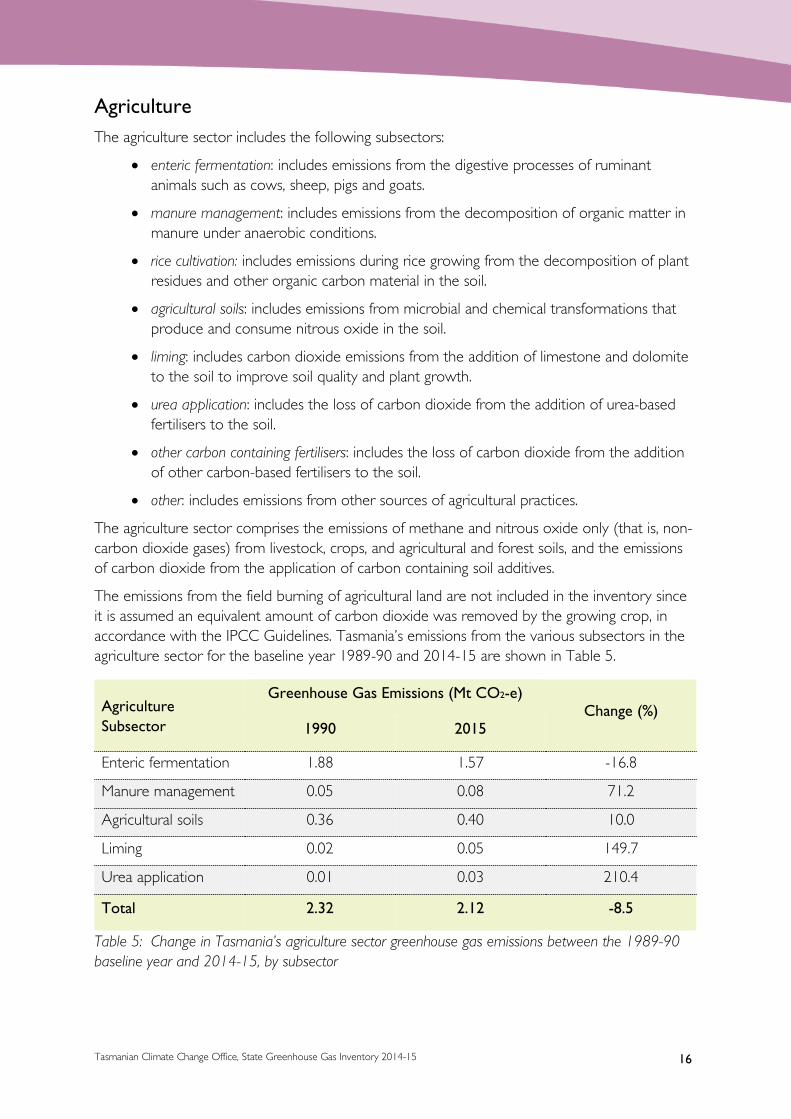
The emissions from the field burning of agricultural land are not included in the inventory since it is assumed an equivalent amount of carbon dioxide was removed by the growing crop, in accordance with the IPCC Guidelines. Tasmania’s emissions from the various subsectors in the agriculture sector for the baseline year 1989-90 and 2014-15 are shown in Table 5.
Table 5: Change in Tasmania’s agriculture sector greenhouse gas emissions between the 1989-90 baseline year and 2014-15, by subsector
Agriculture Subsector
Greenhouse Gas Emissions (Mt CO2-e) Change (%)
1990 2015
Enteric fermentation 1.88 1.57 -16.8
Manure management 0.05 0.08 71.2
Agricultural soils 0.36 0.40 10.0
Liming 0.02 0.05 149.7
Urea application 0.01 0.03 210.4
Total 2.32 2.12 -8.5

Tasmanian Climate Change Office Tasmanian Climate Change Office, State Greenhouse Gas Inventory 2014-15
17
Emissions from Tasmania’s agricultural sector have declined by over 8 per cent between 1989-90 and 2014-15. In 2015, almost 74 per cent of Tasmania’s total agricultural emissions were from enteric fermentation, followed by agricultural soils producing 19 per cent. The impact that the enteric fermentation subsector has on total emissions from the agriculture sector is demonstrated in Figure 6.
Figure 6: Tasmania’s agriculture sector greenhouse gas emissions from the 1989-90 baseline year to 2014-15, by subsector
Fluctuations in the reported emissions from Tasmania’s agricultural sector are due to a combination of factors including: the number of dairy and beef cattle, sheep and pigs; the number of lot fed and pasture fed animals; seasonal variability that impacts pasture growth and soil decomposition; and changes in management practices of manure, fertilisers and other soil additives.
Due to the impact of enteric fermentation on agricultural emissions, and as the subsector includes emissions from the digestive processes of ruminant animals such as cows, sheep, pigs and goats, Figure 7 indicates that the recent decline in sheep and cattle numbers has been the most likely driver of decreasing emissions from the sector.
The agricultural soils subsector produces the second highest emissions in the agricultural sector, in Tasmania. The subsector includes emissions of nitrous oxide from soils, which are added to the soil through processes including the application of nitrogen fertilisers, crop residues or animal wastes and sewage sludge to pastures, and mineralisation due to cultivation of organic soils or loss of soil carbon.
0.00
0.50
1.00
1.50
2.00
2.50
1990
1991
1992
1993
1994
1995
1996
1997
1998
1999
2000
2001
2002
2003
2004
2005
2006
2007
2008
2009
2010
2011
2012
2013
2014
2015
Gre
enho
use
Gas
Em
issi
ons
(Mt
CO
2-e)
Enteric fermentation Manure managementAgricultural soils LimingUrea application Total agriculture

Tasmanian Climate Change Office Tasmanian Climate Change Office, State Greenhouse Gas Inventory 2014-15
18
The increase in emissions from the agricultural soils subsector since 1989-90 was due to a combination of an increase in agricultural fertiliser use and retention of crop residues. As crop production, animal populations and fertiliser use reduced during drought, emissions declined between 2001 and 2009. The return to more favourable weather conditions has seen emissions increase more recently. However, the decline in emissions of 4.9 per cent observed in Tasmania in 2014-15 is likely to be due to a return to drought conditions impacting on farming practices.
Figure 7: Comparison of agriculture (enteric fermentation) emissions and livestock numbers (‘000s)
Emissions Reduction Activities Case Study – Fert$mart
Fert$mart is a program initiated by Dairy Australia in December 2011. The Fert$mart program works with farmers, using the best available science, and enables them to make better decisions on the use of soil amendments, improve and maintain the store carbon in the soil, and reduce greenhouse emissions.
In 2015, the Tasmanian Government supported DairyTas to implement the Fert$mart program in Tasmania, which assists farmers to use nitrogen-based fertilisers more efficiently, reducing nitrous oxide emissions and producing more feed from their pastures at lower cost.
Since the commencement of the program, 144 Tasmanian dairy farms have registered for Fert$mart. In 2017, TCCO is continuing to work with DairyTas to deliver the program, with a focus on providing assistance to farmers to implement the effluent management component of their Fert$mart plans.
Source: http://fertsmart.dairyingfortomorrow.com.au/about-the-programs/
0
500
1,000
1,500
2,000
2,500
3,000
3,500
2006 2007 2008 2009 2010 2011 2012 2013 2014 2015
Livestock - Sheep and lambs - Total ('000s)
Livestock - Cattle - Total cattle ('000s)
Enteric Fermentation emissions -kilotonnes of carbon dioxide equivalent emissions (kt CO2-e)
Tasmanian Climate Change Office Tasmanian Climate Change Office, State Greenhouse Gas Inventory 2014-15
19
Land use, land use change and forestry This is the third year in which greenhouse gas emissions from the Kyoto Protocol reporting subsectors of forest management, cropland management and grazing land management have been included in Tasmania’s LULUCF sector. The LULUCF sector includes the following subsectors:
• afforestation and reforestation: includes emissions and removals (sinks) associated with forests and plantations established after 1990 on land that was previously cleared.
• deforestation: includes emissions and sinks from the human-induced conversion of forest and its replacement with pasture, crops or other uses on land that was forested on 1 January 1990.
• forest management: includes emissions from forests that are managed under a system of practices such as forest harvesting, silvicultural practices and the protection of natural resources in land available for harvest. This includes all multiple-use public forests as well as plantations established prior to 1990, which represents less than half of Tasmania’s native forests. It does not include the sinks from forests in Tasmania’s national parks and from much of the State’s privately owned native forest estate. It also includes prescribed burning and wildfires in native forests.
• cropland management: includes emissions from the cultivation of crops such as orchards and vineyards, and practices such as crop rotation, stubble management, tillage techniques and application of fertilisers, manures and irrigation.
• grazing land management: includes emissions from changes in specified management practices such as pasture management, seed selection, grazing intensity and fire management.
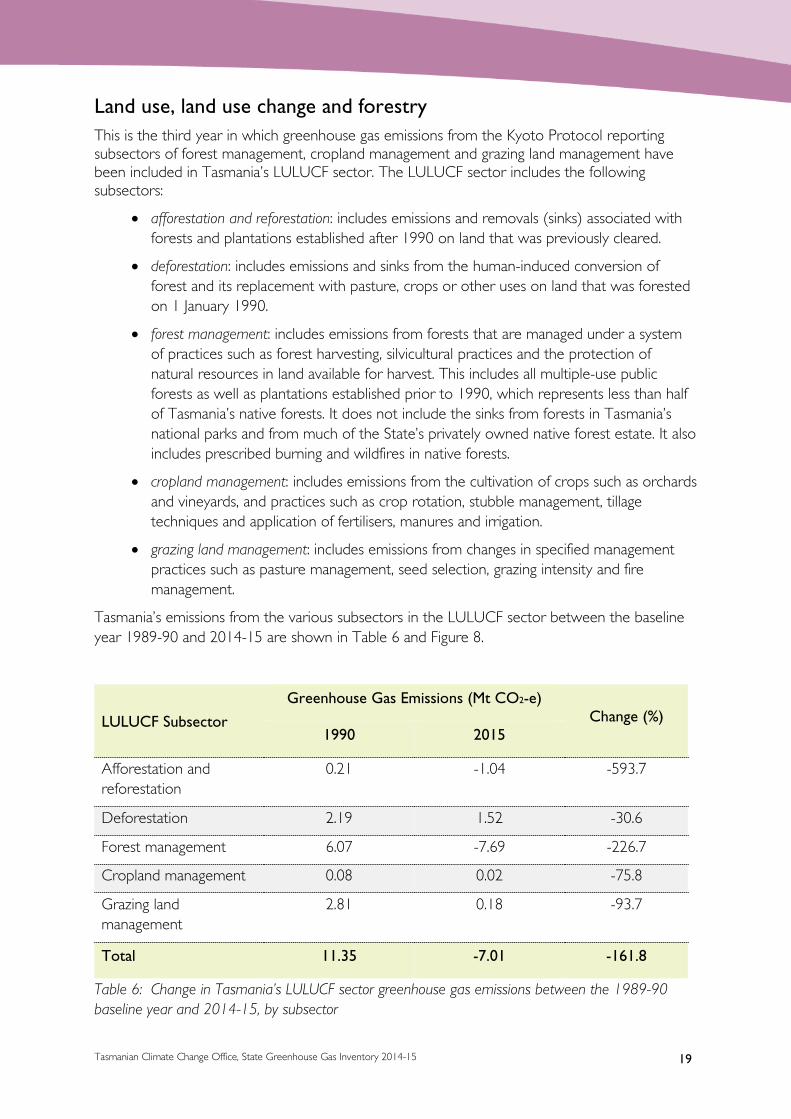
Tasmania’s emissions from the various subsectors in the LULUCF sector between the baseline year 1989-90 and 2014-15 are shown in Table 6 and Figure 8.
Table 6: Change in Tasmania’s LULUCF sector greenhouse gas emissions between the 1989-90 baseline year and 2014-15, by subsector
LULUCF Subsector
Greenhouse Gas Emissions (Mt CO2-e) Change (%)
1990 2015
Afforestation and reforestation
0.21 -1.04 -593.7
Deforestation 2.19 1.52 -30.6
Forest management 6.07 -7.69 -226.7
Cropland management 0.08 0.02 -75.8
Grazing land management
2.81 0.18 -93.7
Total 11.35 -7.01 -161.8
Tasmanian Climate Change Office Tasmanian Climate Change Office, State Greenhouse Gas Inventory 2014-15
20
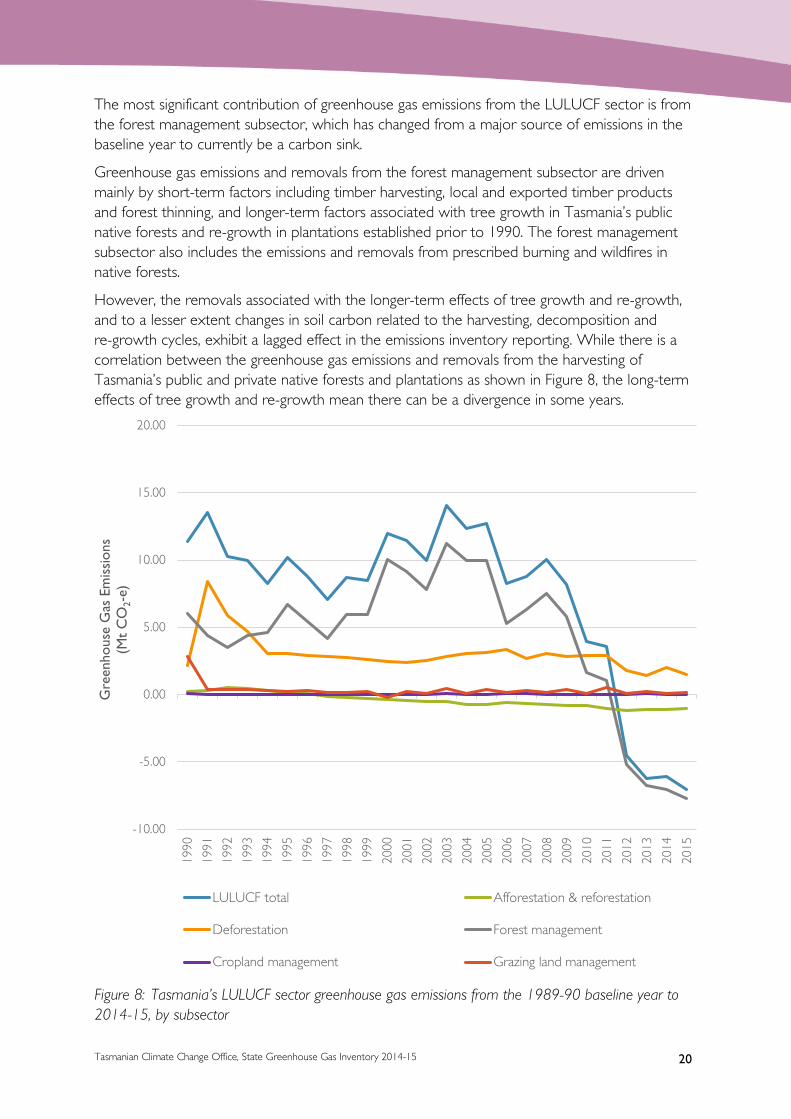
The most significant contribution of greenhouse gas emissions from the LULUCF sector is from the forest management subsector, which has changed from a major source of emissions in the baseline year to currently be a carbon sink.
Greenhouse gas emissions and removals from the forest management subsector are driven mainly by short-term factors including timber harvesting, local and exported timber products and forest thinning, and longer-term factors associated with tree growth in Tasmania’s public native forests and re-growth in plantations established prior to 1990. The forest management subsector also includes the emissions and removals from prescribed burning and wildfires in native forests.
However, the removals associated with the longer-term effects of tree growth and re-growth, and to a lesser extent changes in soil carbon related to the harvesting, decomposition and re-growth cycles, exhibit a lagged effect in the emissions inventory reporting. While there is a correlation between the greenhouse gas emissions and removals from the harvesting of Tasmania’s public and private native forests and plantations as shown in Figure 8, the long-term effects of tree growth and re-growth mean there can be a divergence in some years.
Figure 8: Tasmania’s LULUCF sector greenhouse gas emissions from the 1989-90 baseline year to 2014-15, by subsector
-10.00
-5.00
0.00
5.00
10.00
15.00
20.00
1990
1991
1992
1993
1994
1995
1996
1997
1998
1999
2000
2001
2002
2003
2004
2005
2006
2007
2008
2009
2010
2011
2012
2013
2014
2015
Gre
enho
use
Gas
Em
issi
ons
(Mt
CO
2-e)
LULUCF total Afforestation & reforestation
Deforestation Forest management
Cropland management Grazing land management

Tasmanian Climate Change Office Tasmanian Climate Change Office, State Greenhouse Gas Inventory 2014-15
21
The Tasmanian forestry industry has undergone significant structural change over the last decade which has resulted in annual volumes of softwood and hardwood timber harvested from both native forests and plantations declining from 7.0 million m3 in 2007-08 to approximately 2.4 million m3 in 2012-13.10
The reduction in harvested timber volumes was attributed to a combination of the implementation of the Tasmanian Forest Agreement in 2012,11 the shrinkage of the Japanese pulpwood market as a result of the Global Financial Crisis, and global commodity prices.
In 2014-15, the volume of softwood and hardwood timber harvested from native forests and plantations increased to nearly 3.5 million m3,12 with much of this increase coming from the volumes of hardwood timber harvested from Tasmanian plantations.
However, it is noticeable in Figure 8 that LULUCF emissions declined by nearly 14.8 per cent in the financial year to 2015. Although the total volume of logs harvested has recently risen, the volume of hardwood from Tasmania’s private native forests has remained at very low levels in recent years and the associated LULUCF emissions have not yet demonstrated an upwards trend.
The Forest Practices Authority Annual Report 2014-1513 records fewer hectares of native forests logged (which is counted under the forest management subsector, shown as declining in Figure 8) in the years from 2012 to 2015, than in the years up to and including 2011. While the overall area harvested is still smaller than pre-2011, both the 2013-14 and 2014-15 years are recorded as two of the largest areas of plantation timber harvested in a single year.14 In addition, the Private Forests Tasmania Annual Report 2014-1515 shows the volume of timber harvested from Tasmania’s private native forests has been at very low levels, below 100,000 tonnes annually, between 2012-13 and 2014-15.
Much of the greenhouse gas emissions from timber harvested in Tasmania’s plantations established after 1990 will be accounted for under the afforestation and reforestation subsector, which is shown in Figure 8 to have risen slightly over the period.
A number of factors make it difficult to forecast the potential impact on Tasmania’s emissions profile in relation to timber harvesting volumes. These include: the complexity of the methodologies and models used to estimate levels of carbon sequestration and emissions for Tasmania’s public and private native forests and plantations; changing local and global markets for Tasmanian grown timber products; and impacts associated with a changing climate such as increased bushfire risk, pathogens and reduced growth from heat stress.
10 Australian Forest and Wood Products Statistics, Australian Bureau of Agricultural and Resource Economics and
Sciences, http://www.agriculture.gov.au/abares/publications/display?url=http://143.188.17.20/anrdl/DAFFService/display.php?fid=pb_afwpsd9abfe20160526_11a.xml.
11 Socio-economic impacts of forest industry change: Tasmanian forest industry employment and production, 2012-13 Phase Report (2014) Schirmer, J., Dunn, C. and Loxton, E. University of Canberra http://www.stategrowth.tas.gov.au/__data/assets/pdf_file/0004/98149/Socio-economic_impacts_of_forest_industry_change_-_November_2013.pdf.
12 Australian Forest and Wood Products Statistics, Australian Bureau of Agricultural and Resource Economics and Sciences, http://www.agriculture.gov.au/abares/publications/display?url=http://143.188.17.20/anrdl/DAFFService/display.php?fid=pb_afwpsd9abfe20160526_11a.xml.
13 http://www.fpa.tas.gov.au/__data/assets/pdf_file/0019/127216/FPA_annual_report_2014-15.pdf 14 The data shown is from 2000-01 onwards. 15 http://www.pft.tas.gov.au/__data/assets/pdf_file/0004/131854/PFT_Annual_Report_2014-15.pdf

Tasmanian Climate Change Office Tasmanian Climate Change Office, State Greenhouse Gas Inventory 2014-15
22
Waste The waste sector includes the following subsectors:
• solid waste disposal: includes the emissions from the anaerobic decomposition of organic matter in landfill.
• biological treatment of solid waste: includes the emissions from processes such as windrow composting and enclosed anaerobic digestion.
• incineration and open burning of waste: includes the emissions from the incineration of solvents and municipal and clinical waste.
• wastewater treatment and discharge: includes the emissions from the anaerobic decomposition of organic matter in wastewater and the chemical processes of nitrification and denitrification in wastewater treatment plants.
The waste sector is a minor contributor to Tasmania’s total greenhouse gas emissions. In 2014-15, emissions from this sector totalled 0.30 Mt CO2-e, which is a reduction of 37 per cent since 1989-90 as shown in Table 7.
Table 7: Change in Tasmania’s waste sector greenhouse gas emissions between the 1989-90 baseline year and 2014-15, by subsector
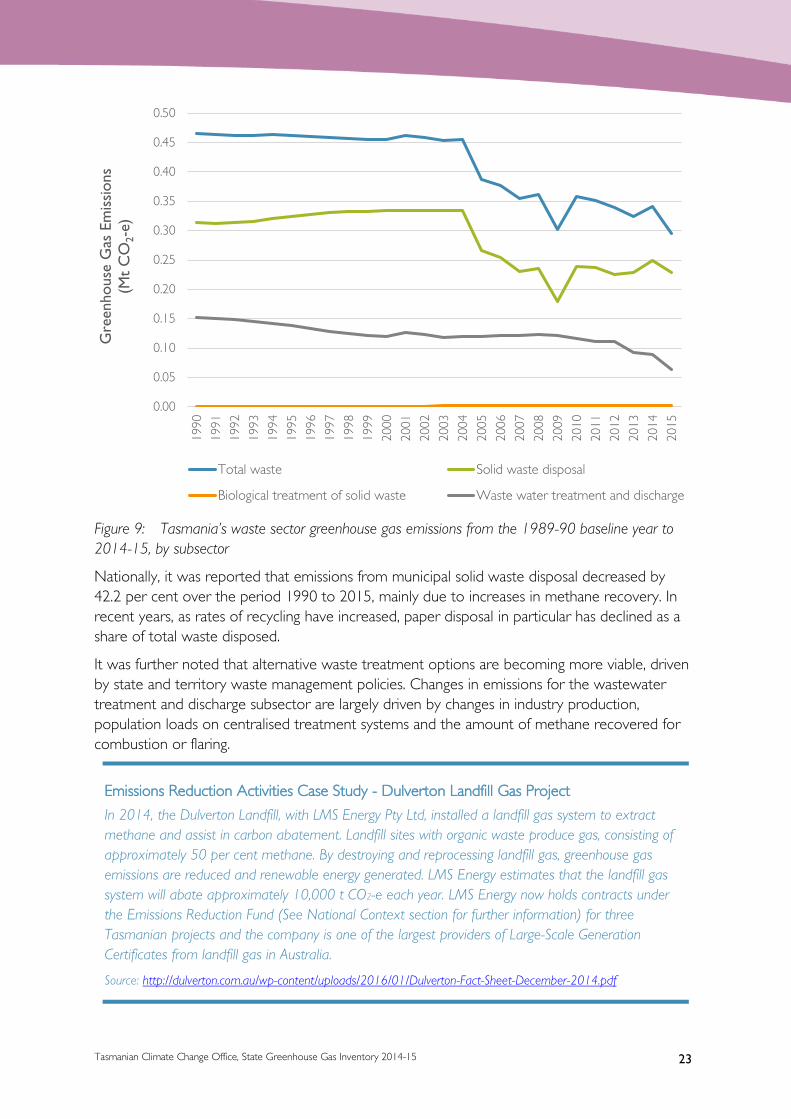
The reduction in emissions from the waste sector has occurred largely since 2003-04, which is shown in Figure 9. This reduction can be largely attributed to the installation of energy generators and/or landfill gas flaring equipment at Hobart, Glenorchy, Launceston and Dulverton landfills, as well as an increase in recycling and the diversion of organic materials from landfill.
Waste Subsector
Greenhouse Gas Emissions (Mt CO2-e) Change (%)
1990 2015
Solid waste disposal 0.31 0.23 -27.0
Biological treatment of solid waste
0.00 0.00 -
Incineration and open burning of waste
- - -
Wastewater treatment and discharge
0.15 0.06 -58.1
Total 0.47 0.30 -36.7
Tasmanian Climate Change Office Tasmanian Climate Change Office, State Greenhouse Gas Inventory 2014-15
23
Figure 9: Tasmania’s waste sector greenhouse gas emissions from the 1989-90 baseline year to 2014-15, by subsector
Nationally, it was reported that emissions from municipal solid waste disposal decreased by 42.2 per cent over the period 1990 to 2015, mainly due to increases in methane recovery. In recent years, as rates of recycling have increased, paper disposal in particular has declined as a share of total waste disposed.
It was further noted that alternative waste treatment options are becoming more viable, driven by state and territory waste management policies. Changes in emissions for the wastewater treatment and discharge subsector are largely driven by changes in industry production, population loads on centralised treatment systems and the amount of methane recovered for combustion or flaring.
0.00
0.05
0.10
0.15
0.20
0.25
0.30
0.35
0.40
0.45
0.50
1990
1991
1992
1993
1994
1995
1996
1997
1998
1999
2000
2001
2002
2003
2004
2005
2006
2007
2008
2009
2010
2011
2012
2013
2014
2015
Gre
enho
use
Gas
Em
issi
ons
(Mt
CO
2-e)
Total waste Solid waste disposal
Biological treatment of solid waste Waste water treatment and discharge
Emissions Reduction Activities Case Study - Dulverton Landfill Gas Project
In 2014, the Dulverton Landfill, with LMS Energy Pty Ltd, installed a landfill gas system to extract methane and assist in carbon abatement. Landfill sites with organic waste produce gas, consisting of approximately 50 per cent methane. By destroying and reprocessing landfill gas, greenhouse gas emissions are reduced and renewable energy generated. LMS Energy estimates that the landfill gas system will abate approximately 10,000 t CO2-e each year. LMS Energy now holds contracts under the Emissions Reduction Fund (See National Context section for further information) for three Tasmanian projects and the company is one of the largest providers of Large-Scale Generation Certificates from landfill gas in Australia.
Source: http://dulverton.com.au/wp-content/uploads/2016/01/Dulverton-Fact-Sheet-December-2014.pdf

Tasmanian Climate Change Office Tasmanian Climate Change Office, State Greenhouse Gas Inventory 2014-15
24
Other performance measures
This section provides an overview of Tasmania’s emissions against other key performance measures, including greenhouse gas emissions per capita and emissions per dollar of Gross State Product (GSP).
Emissions per capita Greenhouse gas emissions per capita provide a measure of the average emissions taking into account changes in population. Tasmania’s per capita greenhouse gas emissions, which have fallen from a peak of 46.3 t of CO2-e person in 1991 to 1.72 t CO2-e person in 2015, are shown in Figure 10.
Figure 10: Tasmania’s greenhouse gas emissions per capita (t CO2-e per person) from 1989-90 to 2014-15
In 2014-15, Tasmania’s greenhouse gas emissions per capita was the lowest of all Australian states and territories, as shown in Figure 11. The jurisdiction with the second lowest emissions
0.0
5.0
10.0
15.0
20.0
25.0
30.0
35.0
40.0
45.0
50.0
19
90
19
91
19
92
19
93
19
94
19
95
19
96
19
97
19
98
19
99
20
00
20
01
20
02
20
03
20
04
20
05
20
06
20
07
20
08
20
09
20
10
20
11
20
12
20
13
20
14
20
15
Per
Cap
ita G
HG
Em
issi
ons
(t C
O2-
e pe
r pe
rson
)

Tasmanian Climate Change Office Tasmanian Climate Change Office, State Greenhouse Gas Inventory 2014-15
25
per capita is the Australian Capital Territory, however, this is only a partial inventory as most of its stationary energy is generated in New South Wales and the associated emissions are included with the New South Wales inventory.
Figure 11: Comparison of state and territory emissions per capita (t CO2-e per person) in 2014-15
Emissions per dollar of GSP The greenhouse gas emissions per dollar of GSP provides an indicator of the emission intensity or productivity of the economy, and is calculated by dividing Tasmania’s net greenhouse gas emissions by the value of its GSP. Since 1989-90, Tasmania’s emissions per dollar of GSP has declined significantly, from 1.2 kg CO2-e per dollar of GSP, down to 0.03 kg CO2-e per dollar in 2014-15, as shown in Figure 12. This is despite a 62 per cent increase in GSP over the same period.
Figure 12: Greenhouse gas emissions per dollar of Gross State Product (kg CO2-e per $)
52.27
33.38 31.82
20.1317.71 17.51
4.031.72
0.00
10.00
20.00
30.00
40.00
50.00
60.00
NorthernTerritory
WesternAustralia
Queensland Victoria SouthAustralia
New SouthWales
AustralianCapital
Territory
Tasmania
Gre
enho
use
Gas
Em
issi
ons
per
Cap
ita(t
CO
2-e
per
pers
on)
-
0.20
0.40
0.60
0.80
1.00
1.20
1.40
1.60
19
90
19
91
19
92
19
93
19
94
19
95
19
96
19
97
19
98
19
99
20
00
20
01
20
02
20
03
20
04
20
05
20
06
20
07
20
08
20
09
20
10
20
11
20
12
20
13
20
14
20
15
Gre
enho
use
Gas
Em
issi
ons
per
GSP
(k
g C
O2-
e pe
r $)

Tasmanian Climate Change Office Tasmanian Climate Change Office, State Greenhouse Gas Inventory 2014-15
26
National context
This section provides a summary of contemporary national and international policy development that may affect Tasmania’s greenhouse gas emissions over the coming years.
The Paris Agreement The Australian Government, as a party to the UNFCCC, joined almost 200 other countries in reaching a global climate agreement at the 21st Conference of the Parties in Paris in December 2015 (Paris Agreement). The Paris Agreement, which was ratified by Australia on 9 November 2016, builds on commitments made under the Kyoto Protocol and sets a goal to hold the average global temperature increase to well below two degrees Celsius.
The Paris Agreement has inbuilt and ongoing review and collaboration mechanisms designed to achieve its long-term goals. Under the Paris Agreement, Australia has committed to an emissions reduction target of between 26 and 28 per cent below 2005 levels by 2030.
The Australian national greenhouse accounts, National Inventory Report 2015, reports Australia’s total greenhouse gas emissions were 525.6 Mt of CO2-e in 2015, or 12 per cent below 2005 levels. The reported preliminary estimate for Australia’s total greenhouse gas emissions in 2016, excluding the LULUCF sector, is 541.6 Mt CO2-e, which is an increase of 1.6 per cent on the corresponding 2015 levels.
In 2018, countries will meet for ‘facilitative dialogue’ discussions, designed to assess progress towards achieving the long-term goals of the Paris Agreement. While some countries are required to set new nationally determined contributions (NDCs) by 2020, countries with 2030 targets, including Australia, are required to set a NDC in 2025; that is, the Australian Government will be required to raise its emissions reduction target.
National Electricity Market Dr Alan Finkel AO, Chief Scientist, presented the Final Report of the Independent Review into the Future Security of the National Electricity Market to the Council of Australian Governments (COAG) Leaders’ meeting on 9 June 2017.
Among the recommendations of the report, is that the Australian Government implement a Clean Energy Target (CET) to provide an orderly transition to a lower emissions electricity

Tasmanian Climate Change Office Tasmanian Climate Change Office, State Greenhouse Gas Inventory 2014-15
27
sector. The report does not stipulate a precise target, but suggests that it should be in line with what is required to meet the Australian Government’s Paris Agreement commitment, stating:
A CET would provide an incentive for all new generators that produce electricity below a specified emissions intensity threshold. All fuel types, including coal with CCS or gas, would be eligible for the scheme provided they meet or are below the emissions intensity threshold. Eligible generators would receive certificates for the electricity they produce in proportion to how far their emissions intensity is below the threshold. New eligible generators would receive certificates for all electricity generated, while existing eligible generators could receive certificates for any electricity that they produce above their historic output. Consideration would also need to be given to the treatment of extensions to long-lived renewable assets like hydro.
The Tasmanian Government is a strong supporter of further renewable energy development in the State. Tasmania’s historic investment in hydro electricity generation will play an increasingly important role in meeting the current energy challenges facing mainland Australia, as it transitions to low emissions generation.
Leveraging National Programs Tasmanians benefit from the implementation of the COAG Energy Council’s energy efficiency and energy productivity programs, through better information for purchasing decisions, savings on power bills, improved thermal comfort of their homes and better health outcomes. Increased levels of energy efficiency can also lead to improved energy security.
On 4 December 2015, the COAG Energy Council released the National Energy Productivity Plan (NEPP), which sets out the framework and initial measures to deliver an economy-wide 40 per cent improvement in Australia’s energy productivity by 2030. NEPP is expected to contribute around a quarter of the additional savings required to meet Australia’s current commitment under the Paris Agreement.
The Energy Efficiency Advisory Team (EEAT) was established to deliver an integrated program on Minimum Energy Performance Standards and manage the energy (star) ratings labelling for equipment and appliances, as well as improve the energy performance of new residential housing. The work streams prioritised under EEAT are expected to deliver emissions reductions of approximately 93 Mt of CO2-e by 2030, which is around 10 per cent of Australia’s 2030 emissions reduction commitment.
These programs can be leveraged to maximise Tasmania’s renewable energy advantages. By reducing local electricity demand, Tasmanian renewable energy generators will be better prepared to contribute to improved energy security of the National Electricity Market and seize opportunities flowing from Australian Government clean energy incentives.
The Emissions Reduction Fund was established by the Australian Government with a budget of up to $2.55 billion to fund emissions reduction activities. Seven Tasmanian projects have been awarded carbon abatement contracts by the Clean Energy Regulator: five reducing landfill gas emissions, one protecting forests on private land, and one heat recovery project. In addition, several national and multi-state projects with activities in Tasmania have been awarded carbon abatement contracts over the five auctions.

Tasmanian Climate Change Office Department of Premier and Cabinet GPO Box 123 HOBART TAS 7001
Phone: 03 6232 7173 Email: [email protected] Visit: www.climatechange.tas.gov.au