Embed Size (px)
Citation preview

Illinois State University Illinois State University
ISU ReD: Research and eData ISU ReD: Research and eData
Theses and Dissertations
12-17-2013
Tattoo Stigma and Job Discrimination Tattoo Stigma and Job Discrimination
Phil Drazewski Illinois State University, [email protected]
Follow this and additional works at: https://ir.library.illinoisstate.edu/etd
Part of the Psychology Commons
Recommended Citation Recommended Citation Drazewski, Phil, "Tattoo Stigma and Job Discrimination" (2013). Theses and Dissertations. 148. https://ir.library.illinoisstate.edu/etd/148
This Thesis is brought to you for free and open access by ISU ReD: Research and eData. It has been accepted for inclusion in Theses and Dissertations by an authorized administrator of ISU ReD: Research and eData. For more information, please contact [email protected].

TATTOO STIGMA AND JOB DISCRIMINATION
Phil Drazewski
71 Pages May 2014
Recent research (Madera & Hebl, 2011) has found that visible stigmas can lead to
discrimination against stigmatized individuals in the form of lower job applicant ratings.
Tattooed individuals may be one group that faces such discrimination. People with
tattoos are perceived less positively than non-tattooed people (Martin & Dula, 2010;
Resenhoeft, Villa, & Wiseman, 2008), which may be the result of a tattoo stigma. Pryor
& Reeder (2011) suggested that one hallmark of stigmas is that they evoke implicit
negative attitudes. In a pilot study, participants implicitly and explicitly evaluated
tattooed and non-tattooed individuals, and a tattoo stigma was supported. In the present
study, tattooed (vs. non-tattooed) applicants were rated lower on overall effectiveness.
However, unlike Madera & Hebl (2011), the present study did not find memory to
mediate the tattoo condition-effectiveness ratings relationship. Implicit tattoo-related
attitudes, explicit tattoo-related attitudes, and participant gender were found to moderate
the relationship between tattoo condition and candidate effectiveness ratings, and a
number of additional participant demographic variables (i.e. age, number of tattoos, level
of education) were found to be additional predictors of candidate effectiveness ratings.
KEYWORDS: job discrimination, stigma, tattoo, implicit attitudes

TATTOO STIGMA AND JOB DISCRIMINATION
PHIL DRAZEWSKI
A Thesis Submitted in Partial
Fulfillment of the Requirements
for the Degree of
MASTER OF SCIENCE
Department of Psychology
ILLINOIS STATE UNIVERSITY
2014

TATTOO STIGMA AND JOB DISCRIMINATION
PHIL DRAZEWSKI
COMMITTEE MEMBERS:
John Pryor, Chair
Eric Wesselmann

i
ACKNOWLEDGEMENTS
I would like to thank my thesis committee members, Dr. John Pryor and Dr. Eric
Wesselmann. Without their continued help, guidance, and patience, this thesis would
never have come to fruition.
This thesis is dedicated to those who have felt stigmatized and/or experienced
discrimination based on their physical appearance.
P.D.

ii
CONTENTS
Page
ACKNOWLEDGEMENTS i
CONTENTS ii
TABLES iv
FIGURES vi
CHAPTER
I. THE PROBLEM AND ITS BACKGROUND 1
II. REVIEW OF LITERATURE AND HYPOTHESES 5
Tattooing Today 5
Attitudes toward Tattooed Individuals 6
Tattoos in the Workplace 8
Gender Differences in Tattoo Evaluation 10
Implicit and Explicit Attitudes toward People with Tattoos 11
III. METHOD 13
Participants 13
Procedure and Design 14
Mini Study 1: Evaluation of a Candidate Interview 15
Mini Study 1: Measures 16
Mini Study 2: Evaluation of Abstract Art 17
Mini Study 2: Measures 17
Additional Survey Questions 18
IV. ANALYSIS OF THE DATA 20
Attention Check, Manipulation Checks, and Outliers 20
Hypotheses 20

iii
Exploratory Analysis of Demographic Moderators 26
Explicit Attitudes 27
Participant Age 28
Number of Tattoos 29
Participant Gender 31
Ethnicity 32
Level of Education 33
V. SUMMARY AND CONCLUSIONS 35
VI. LIMITATIONS AND DIRECTIONS FOR FUTURE RESEARCH 39
Level of Concealability 39
Animated vs. Static Interview Visuals 40
Madera & Hebl Techniques for Other Stigmas 41
Tattoo Research 41
REFERENCES 43
APPENDIX A: Pilot Study 50
APPENDIX B: MTURK Participant Recruitment Page 57
APPENDIX C: Condition Photos Used in First Mini Study 58
APPENDIX D: Simulated Interview and Instructions 59
APPENDIX E: Memory Test and Instructions 62
APPENDIX F: Effectiveness Evaluation Items and Instructions 65
APPENDIX G: Affect Misattribution Procedure (AMP) Example Item 68
APPENDIX H: Explicit Tattoo Attitude Scale 69
APPENDIX I: Final Survey Questions and Instructions 70

iv
TABLES
Table Page
1. Correlations, Means, and Standard Deviations of Mediation Model
Variables 22
2. Correlations, Means, and Standard Deviations of Applicant Gender
Moderation Analysis 23
3. Analysis of Applicant Gender as a Moderator of Tattoo Condition
and Effectiveness Ratings 24
4. Correlations, Means, and Standard Deviations of Implicit Attitude
Moderation Analysis 25
5. Analysis of Implicit Attitudes as a Moderator of Tattoo Condition
and Effectiveness Ratings 26
6. Correlations, Means, and Standard Deviations of Explicit Attitude
Moderation Analysis 27
7. Analysis of Explicit Attitudes as a Moderator of Tattoo Condition
and Effectiveness Ratings 28
8. Correlations, Means, and Standard Deviations of Participant Age
Moderation Analysis 28
9. Analysis of Participant Age as a Moderator of Tattoo Condition
and Effectiveness Ratings 29
10. Correlations, Means, and Standard Deviations of Number of
Tattoos Moderation Analysis 30
11. Analysis of Number of Tattoos as a Moderator of Tattoo
Condition and Effectiveness Ratings 30

v
12. Correlations, Means, and Standard Deviations of Participant
Gender Moderation Analysis 31
13. Analysis of Participant Gender as a Moderator of Tattoo
Condition and Effectiveness Ratings 32
14. Descriptive Statistics of Effectiveness Ratings at Each Ethnicity
Level 33
15. Correlations, Means, and Standard Deviations of Level of
Education Moderation Analysis 33
16. Analysis of Level of Education as a Moderator of Tattoo
Condition and Effectiveness Ratings 34

vi
FIGURES
Figure Page
1. Proposed Mediation of Memory on the Relationship between
Tattoo Condition and Applicant Effectiveness Ratings 10
2. Proposed Moderation of Applicant Gender on the Relationship
between Tattoo Condition and Memory 11
3. Proposed Moderation of Implicit Attitudes on the Relationship
between Tattoo Condition and Memory 12
4. Standardized Regression Coefficients for the Relationship
between Tattoo Condition and Effectiveness Ratings as
Mediated by Participant Recall 22
5. Variables Influencing Candidate Effectiveness Ratings 38

1
CHAPTER I
THE PROBLEM AND ITS BACKGROUND
The job interview has proven to be one of the most widely utilized methods for
employee selection (Campion, Palmer, & Campion, 1997; Dipboye, 2005; Huffcutt &
Arthur, 1994). However, research continues to indicate that the job interview may only be
a modest predictor of actual job performance (Hunter & Hunter, 1984). This lack of
validity may be attributed to interviewer bias associated with job applicant race,
socioeconomic status, religion, dress, physical appearance, or even scent (Baron, 1983;
Dipboye & Colella, 2005; K. K. P. Johnson & Roach-Higins, 1987). In such situations,
applicants displaying undesirable traits face job discrimination regardless of how they
respond to interview questions (Dipboye, 2005). The present study examined whether an
increasingly popular physical trait – tattooing – is subject to a similar form of interviewer
bias.
At its root, tattoo discrimination in interviews may be the result of perceived
stigma. Goffman (1963) identified three types of stigma: (1) abominations of the body,
(2) blemishes of individual character, and (3) tribal stigmas. Tattoos can be classified
within each of these categories in that (1) they involve a deformation the body, (2) their
presence is often regarded as a character blemish, and (3) they can signify a group/tribe
membership.

2
Goffman (1963), Jones & French (1984), and Crocker et al. (1998) argued that
bearers of perceived stigma - including job applicants displaying undesirable physical
traits - can cause perceivers to feel a sense of uncertainty, discomfort, anxiety, or even
danger during social interactions (Blascovich et al., 2001). Thus, though job interviewers
may be motivated to appear non-prejudiced (Dunton & Fazio, 1997), their self-reported
attitudes may differ from their actual attitudes (Vanman et al., 1997).
These views are in line with more recent research indicating that reactions to
stigmatized individuals involve two associated, yet distinct, processes: (1) a reflexive,
unconscious process and (2) a deliberative, conscious process (Pryor, Reeder, & Landau,
1999; Pryor, Reeder, Yeadon, & Hesson-McInnis, 2004; Reeder & Pryor, 2000).
Regarding the reflexive process, a number of negative reactions to abominations
of the body (Bessenoff & Sherman, 2000; Grandfield, Thomson, & Turpin, 2005;
Neumann, Husenbeck, & Seibt, 2004), blemishes of individual character (Bassett &
Dabbs, 2005; Brener, von Hippel, & Kippax, 2007; Jellison, McConnell, & Gabriel,
2004), and tribal stigmas (Greenwald, McGee, & Schwartz, 1998; Kawakami, Phills,
Steele, & Dovidio, 2007) have all been identified.
Such results have led Pryor & Reeder (2011) to suggest that one hallmark of all
stigmas is that they evoke implicit (unconscious) negative attitudes. Moreover, implicit
attitude tests, such as the Implicit Association Test (IAT; Greenwald et al, 1998) and the
Affect Misattribution Procedure (AMP; Payne et al., 2005), have given researchers ways
to quantitatively assess and confirm stigmas at the implicit level. Such a technique

3
(AMP) was used in my Pilot Study to test and confirm the existence of a tattoo stigma
(see Attitudes toward Tattooed Individuals, Appendix).
Regarding the deliberative (as opposed to reflexive) process in Pryor et al.‟s
(2004) dual-process model, research has shown that individuals also consciously use
rules to determine whether it is socially appropriate to react negatively to a stigmatized
person (Crandall & Eshleman, 2003). In such cases, individuals have been shown to react
less negatively to people whose stigmatizing conditions are beyond their control (e.g.
blindness, ethnicity; Weiner, 1995; Pryor et al., 2004). In this vein, tattooed job
applicants may consciously be judged more negatively by job interviewers who fear
stigma spread and/or feel threatened that they may acquire stigma-by-association
(Goldstein & Johnson, 1997; Neuberg, Smith, Hoffman, & Russell, 1994; Ostman &
Kjellin, 2002), which exists across many other stigmatizing conditions (Angermeyer,
Schulze, Dietrich, 2003; Birenbaum, 1992; Corrigan, Watson, & Miller, 2006; Hebl &
Mannix, 2003; Neuberg et al., 1994; Norvilitis, Scime & Lee, 2002; Olson, Dunham,
Dweck, Spelke, & Banaji, 2008; Pryor, Reeder, and Monroe, 2012).
Feelings of threat that result from interactions with stigmatized persons are
increasingly being examined, and visible stigmatizing conditions are being manipulated
and compared in efforts to confirm a stigma-threat hypothesis. In 1994, Houston and Bull
used facial birthmarks (port-wine stains) to manipulate stigma and found fewer people sat
near an individual with a facial stigma than an individual without the stigma. In 2001,
Blascovich and his colleagues found participants interacting with facially stigmatized

4
partners exhibited a physical threat pattern (i.e. increased cardiovascular reactivity) and
also generated fewer words than participants paired with non-stigmatized partners.
Recently, Madera and Hebl (2011) have built upon the research of Houston &
Bull (1994) and Blascovich et al. (2001) by bringing the study of stigma to the arena of
the structured interview. In a study of facially stigmatized job applicants, Madera and
Hebl found job discrimination to exist and be the result of perceived stigma negatively
affecting attentional processes (Rinck & Becker, 2006), which negatively affected
working memory (Baddeley & Hitch, 1974), and thus resulted in lower job applicant
ratings. They also found participants evaluating facially stigmatized applicants depleted
more regulatory resources (Muraven & Baumeister, 2000) than participants evaluating
non-facially stigmatized applicants.
Madera and Hebl‟s study was important in its ability to link perceived stigma to
today‟s hiring practices. It also raised many questions for future research: Can other
perceived stigmas lead to lower applicant ratings? What role may individual differences
play in the evaluation of stigmatized individuals? The purpose of the current study was to
evaluate whether job applicants displaying another potential stigma – tattoos – were
subject to similar discrimination.

5
CHAPTER II
REVIEW OF LITERATURE AND HYPOTHESES
Tattooing Today
In 2006, estimates on the number of tattooed individuals in the United States
ranged from 10 or 20% (Kosut, 2006; Stirn et al., 2006) up to 24% of all adults and 40%
of individuals between 21-31 years old (Laumann, 2006). A number of reasons have been
given for why individuals choose to get a tattoo, including "expressing individuality,
communicating rebellion, defining group membership, conveying spiritual meaning, or
marking milestones such as life or death" (Christensen, 2000, p. 432). Tiggemann &
Hopkins (2011) found tattooing to represent a “bodily expression of uniqueness” and,
interestingly, found one‟s number of tattoos to be significantly positively correlated with
one‟s strength of identification with music (p. 245).
Tattooing in Psychology has been examined largely from a cultural perspective.
In his books Criminal Anthropology (1895) and Savage Origins of Tattooing (1896),
Cesare Lombroso laid out the foundations for literature examining the link between
deviance and tattooing. Since then, researchers have noted the continuing associations
between tattooed individuals and groups associate with deviance (e.g. prisoners, gang
members; Atkinson, 2003). Recently, Burgess and Clark (2010) used such literature as a
basis for examining whether the content of a tattoo makes a difference in how tattooed

6
individuals are perceived. In their research, they found that individuals with traditional
tattoos were rated less suitable for employment than those displaying contemporary
tattoos.
Evolutionary psychologists are also increasingly examining why people get
tattoos. One explanation, the “attractiveness increase hypothesis,” states “people use
body decorations to increase their own physical attractiveness or to hide some
shortcomings in their appearance (e.g. low body symmetry)” (Koziel et al., 2010, p. 187).
Other evolutionary psychologists have hypothesized that, because tattoos and piercings
can present health risks, people who decide to decorate their bodies may be looking to
express an “honest signal of genetic quality” (p. 187).
Attitudes toward Tattooed Individuals
For centuries, tattoos have invoked both positive and negative responses across
varying societies. In some cases, tattoos have been seen as attractive despite being
classified as signs of social deviance (Towler & Schneider, 2005). Most studies, however,
find that tattooed people are perceived less positively than non-tattooed people (Martin &
Dula, 2010; Resenhoeft, Villa, & Wiseman, 2008), and people with tattoos are perceived
as more “sensation seeking” and “having more previous sexual partners” than their non-
tattooed counterparts (Wohlrab et al., 2009, p. 3).
Possessing more visible and/or greater amounts of tattoos has also been shown to
result in higher ratings of perceived negative/deviant behavior. DeMello (2000) noted
that, when linked to behavior, tattoos can be seen as “a sign of a lack of discipline and
self-control, of an inability to consider the future” (p. 140). In another investigation of
7
tattoos and behavioral correlates, Haywood et al. (2012) found tattooing to be associated
with risk-taking behaviors, including “smoking, greater numbers of lifetime sexual
partners, cannabis use (women only) and ever having depression (men only)” (p. 51).
Even when theories linking tattoos with negative behavior are discredited,
research shows that “individuals still tend to make stereotypical assumptions about others
based on appearance” (Adams, 2012, p. 150).
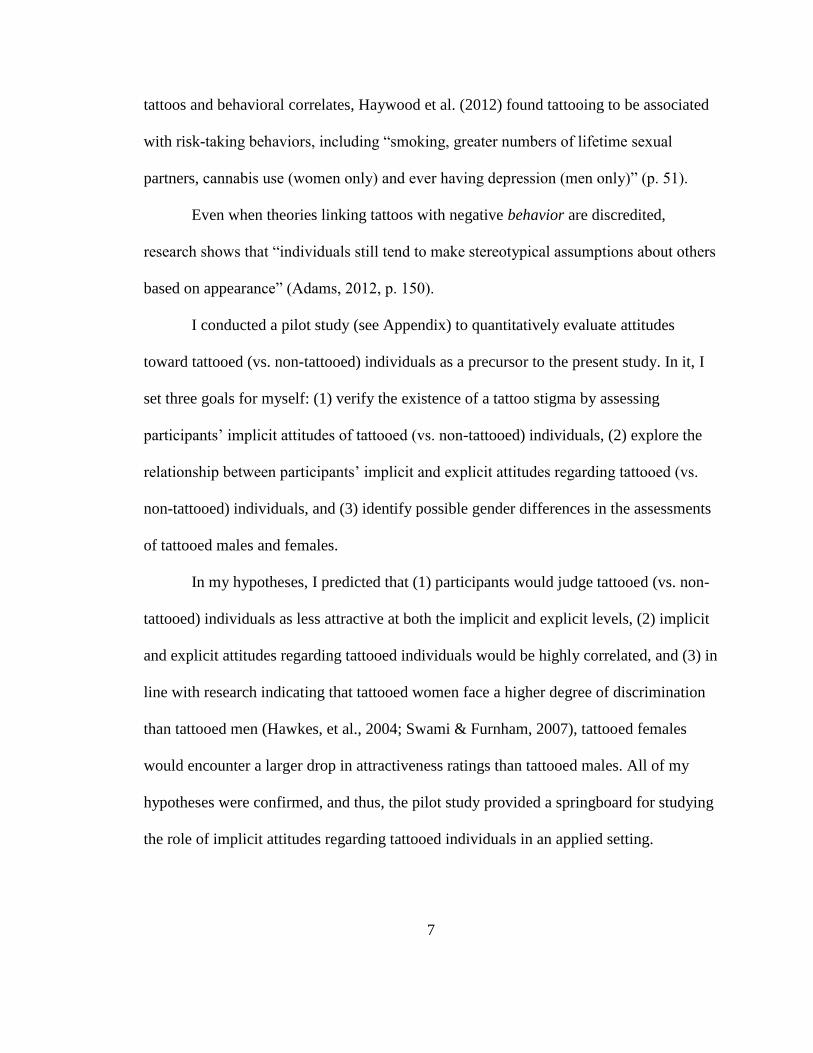
I conducted a pilot study (see Appendix) to quantitatively evaluate attitudes
toward tattooed (vs. non-tattooed) individuals as a precursor to the present study. In it, I
set three goals for myself: (1) verify the existence of a tattoo stigma by assessing
participants‟ implicit attitudes of tattooed (vs. non-tattooed) individuals, (2) explore the
relationship between participants‟ implicit and explicit attitudes regarding tattooed (vs.
non-tattooed) individuals, and (3) identify possible gender differences in the assessments
of tattooed males and females.
In my hypotheses, I predicted that (1) participants would judge tattooed (vs. non-
tattooed) individuals as less attractive at both the implicit and explicit levels, (2) implicit
and explicit attitudes regarding tattooed individuals would be highly correlated, and (3) in
line with research indicating that tattooed women face a higher degree of discrimination
than tattooed men (Hawkes, et al., 2004; Swami & Furnham, 2007), tattooed females
would encounter a larger drop in attractiveness ratings than tattooed males. All of my
hypotheses were confirmed, and thus, the pilot study provided a springboard for studying
the role of implicit attitudes regarding tattooed individuals in an applied setting.

8
Such negative perceptions may have particularly profound impacts in applied
settings (e.g. healthcare, the workplace) where the stakes are particularly high. Stuppy et
al. (1998) found that physicians, registered nurses, and students studying healthcare, all
had negative attitudes towards tattooed persons. Moreover, they found that physicians
(MDs) and registered nurses (RNs) rated tattooed people less positively than student
participants. They also noted that biases against tattooed individuals could lead to
judgment and/or less sensitive care during their assessments.
Tattoos in the Workplace
Increasingly, tattooed individuals are being evaluated in the workplace, largely in
the arenas of hiring practices and treatment. Attitudes towards tattooed individuals
appear mixed, even among those in the field of business; for example, one survey of
university business majors found that 65% of respondents “indicated that tattoos can be
attractive” on both males and females (Totten et al., 2009, p. 88). In line with Houston
and Bull‟s (1992) findings that “adults‟ reactions to stigmatized persons are a complex
mixture of positive and negative responses,” a mix of attitudes seems to also exist in the
evaluation of tattooed individuals (p. 280).
Still, when examining hiring practices as a function of tattooing, attitudes appear
largely negative. In one study, two in five adults reported that simply having a tattoo
could justify being denied employment (Mann, 2005). In another, Dean (2011) found
that, when participants were asked to rate tattooed white-collar workers (i.e. tax service
providers), their tattoos were seen as “very inappropriate” and their service satisfaction
ratings were significantly lower than blue-collared workers (p. 254). For these reasons, I

9
predicted that tattoo stigma may be associated with job discrimination, and by applying
the methods laid out by Madera and Hebl (2011), I set out to confirm such a relationship.
On account of the findings of Mann (2005) and Dean (2011), I first hypothesized that:
Hypothesis 1: Tattooed (vs. non-tattooed) applicants will be rated lower
on overall effectiveness.
Madera and Hebl examined how attentional processes mediated the relationship
between the stigmatizing condition and memory. In doing so, they were able to confirm
their hypotheses that (a) more visual attention would be given to the stigma location on a
stigmatized (vs. non-stigmatized) applicant and (b) there would be less memory (i.e.
recall) of what was said in the interview with a stigmatized (vs. non-stigmatized)
applicant. Due to a lack of necessary equipment (i.e. eye-tracking technology), visual
attention to tattoos was not examined in the current study; however, participant recall was
assessed. In line with Madera and Hebl‟s findings, I hypothesized that:
Hypothesis 2: There will be less recall of what is said in interviews with
tattooed (vs. non-tattooed) applicants.
Madera and Hebl also examined if, by attending more to a stigmatizing condition,
an interviewer “might miss some important information from what the applicant said
during the interview,” which they thought might negatively influence the overall ratings
of the applicant (p. 2). While finding (a) visual attention to mediate the relationship
between stigma condition and memory recall and (b) memory to mediate the relationship
between visual attention and the overall ratings of the applicant, they also found a direct

10
effect of stigma on memory to be significant ( = -.48, p < .05). Thus, though I could not
assess the role visual attention plays in the discrimination process, I hypothesized that:
Hypothesis 3: Memory will mediate the relationship between tattoo
condition and overall effectiveness ratings (Figure 1).
Figure 1. Proposed Mediation of Memory on the Relationship
between Tattoo Condition and Applicant Effectiveness Ratings
Gender Differences in Tattoo Evaluation
Tattoos are not limited to certain types of individuals, yet certain groups face
higher levels of stigmatization and/or discrimination than others. Time and time again,
research has indicated that women, in particular, face a larger degree of
stigmatization/discrimination than men (Hawkes, et al., 2004; Swami & Furnham, 2007),
though tattooing has been found to be equally common in both sexes (Laumann, 2006;
Stieger et al., 2010). The pilot study found that gender did, in fact, moderate attitudes
towards tattooed individuals, with tattooed women being evaluated more negatively than
tattooed men (Appendix). In the present study, I examined if higher levels of
discrimination against women would also be found in a job setting.
Tattooed career-oriented women have indicated that their tattoos make them feel
“good, unique, and special" (Armstrong, 1991, p. 219). Still, studies have shown that
visible tattoos on white-collar workers are deemed inappropriate while similar tattoos on
blue-collar workers were viewed as appropriate (Dean, 2010). Therefore, tattooed women

11
applying for a white-collar job may experience even more discrimination than tattooed
women in a non-work setting. Thus, I hypothesized that:
Hypothesis 4: Applicant gender will moderate the mediation between
tattoo condition and participant recall (i.e. memory), with participants
remembering more information about tattooed females than tattooed males
(Figure 2).
Figure 2. Proposed Moderation of Applicant Gender on the
Relationship between Tattoo Condition and Memory
Implicit and Explicit Attitudes toward People with Tattoos
Though research pertaining to explicit attitudes towards tattooed individuals has
given us insight into the processes involved in explicit evaluation, few (if any) studies
have looked at the implicit processes involved in such assessments. Negative implicit
attitudes are a hallmark of perceived stigmas (Pryor & Reeder, 2011). In the pilot study
(Appendix), a modified Affect Misattribution Procedure (AMP; Payne et al., 2005)
revealed negative implicit attitudes towards tattooed individuals, supporting the existence
of a tattoo stigma. In line with other research indicating that people attend more readily to
negative stimuli than positive stimuli (Rinck & Becker, 2006), attend to stigmas because

12
they are novel (Langer et al., 1976), and discriminate against individuals displaying
stigmatizing conditions (Madera and Hebl, 2011), I hypothesized that:
Hypothesis 5: Implicit tattoo-related attitudes will moderate participant
recall with people who have more negative implicit attitudes about
tattooed individuals recalling less than people who have more positive
implicit attitudes (Figure 3).
Figure 3. Proposed Moderation of Implicit Attitudes on the
Relationship between Tattoo Condition and Memory
Finally, for exploratory reasons, I examined the role other individual differences
play in moderating the relationship between tattoo condition and memory recall. To do
so, I collected information regarding participants‟ explicit attitudes, own number of
tattoos, gender, age, ethnicity, and level of education. No known research has confirmed
that individual differences contribute to such moderation; thus, I explored whether
participants‟ (a) explicit attitudes, (b) number of tattoos, (c) gender, (d) age, (e) ethnicity,
and/or (f) level of education moderated the tattoo condition-participant recall
relationship.
Implicit Att.
Tattoo Cond. Memory Effect. Rating

13
CHAPTER III
METHOD
Participants
The desired sample size for the current study was 400 participants, with at least
100 participants viewing one of four job applicant tattoo-gender conditions: tattooed
male, tattooed female, non-tattooed male, and non-tattooed female. Ns were determined
using a power analysis, the medium effect size (2 = .03) found in Madera & Hebl‟s
(2011) manipulation of stigma, and additional literature, including Murphy & Myors
(2004) and Rossbach & Wilson‟s (1992).
Participants were recruited through Mechanical Turk (MTURK) – an Amazon
company that recruits “Workers” to complete various online tasks for “Requesters.”
Through MTURK, Requesters set up accounts to pay Workers for completing Human
Intellectual Tasks (HITS). Over 100,000 users from over 100 countries complete tens of
thousands of tasks daily on MTURK (Pontin, 2007).
I posted a brief description of the HIT on the MTURK website along with a
description of the compensation. Participants were paid $0.15 for completing a short
study regarding social attitudes. Payment was made automatically by MTURK,
transferring funds from the Requester‟s account to the Worker‟s account. Participation
required individuals to be at least 18 years of age and speak English as their native

14
language. I did not identify participants or access their contact information in any
way.
Of the 884 participants that accessed the two-part study, 654 (74%) fully
completed at least the first interview-related mini study. Of this group, 542 (83%) passed
both the attention check and two manipulation checks (i.e. gender and tattoo condition)
included within the first mini study. Of this group, 231 (43%) identified as male, 306
(57%) as female, and five participants (< 1%) did not identify their gender. Of this same
group, 49 (9%) identified as African American/Black, 429 (79%) as Caucasian/White, 35
(6%) as Asian American/Asian, and 29 (5%) as another ethnicity. The average age of the
participants was 32.1 (SD = 12.3), and of this group, 445 (82%) participants completed
the second, abstract art-related mini study (requiring Flash animation).
Procedure and Design
Through the MTurk HIT, participants were given a link that led them to an ISU
server where they read an informed consent document (see Appendix). Once participants
clicked a box acknowledging their agreement to participate, they were randomly assigned
to one of four experimental conditions, representing the 2×2 study design (Tattoo vs. No
Tattoo and Male Job Applicant vs. Female Job Applicant). The four conditions accessed
Select Survey files on an ISU server.
On the first page of the Select Survey file (located on the ISU server), participants
were informed that their participation in the study would consist of completing two mini
studies. They were told that the first mini study involved their evaluation of an interview
with an MBA graduate student applying for a job in marketing, and the second mini study

15
involved their evaluation of a series of abstract art paintings. Below this paragraph,
participants confirmed that they (1) were at least 18 years of age and (2) spoke English as
their native language by clicking each respective option button. Lastly, they clicked the
“Next” button located at the bottom of the screen and proceeded to the second page of the
Select Survey file.
Mini Study 1: Evaluation of a Candidate Interview
The second page of the Select Survey file informed participants that they were
about to begin the first mini study. They were told that they would see an actual photo
and job transcript from an actual job candidate interview, though the name of the
candidate had been changed. Last, they were told that after the interview, they would be
asked to recall information about the candidate and give their feedback regarding the
candidate's qualifications. Participants were told to click “Next” when they were ready to
begin their observation of the interview.
The third Select Survey page began the first of 17 question-and-answer pages that
comprised the simulated job interview. Each page presented participants with a 342×385
pixel, color photo of one of four job candidate conditions: Tattooed male, Non-tattooed
male, Tattooed female, or Non-tattooed female (Appendix). Below the photo, each page
presented participants with two lines of 18-font, Calibri style text.
The first line represented the interviewer‟s question (Q) and the second line
represented the candidate‟s answer (A). Once participants read through both lines of text,
they clicked “Next” to advance through each subsequent page of the interview. On each
page, the photo of the job candidate remained the same, while the text below the photo

16
differed from page to page. The simulated interview took participants approximately 10
minutes to complete.
Mini Study 1: Measures
After the interview, participants‟ memory was examined by presenting them with
10 questions that quizzed them on the content of the interview. Participants clicked
“Next” to advance through each question, presented individually on separate pages.
Participants clicked one of seven option buttons to submit their required answers for each
question. The coefficient alpha for the 10-item memory scale was originally .57;
however, removing a poor performing item (i.e. applicant‟s major) increased the 9-item
coefficient alpha to .58. The nine-item scale was used in all analyses pertaining to
participant memory. Thoughts regarding the low coefficient alpha value are discussed in
Limitations and Directions for Future Research.
Participants then advanced through 10 questions (one per page), asking them to
evaluate the job candidate‟s overall effectiveness. For these questions, they clicked one
of five option buttons, ranging from “Strongly agree” to “Strongly disagree,” to submit
their (required) answers. An attention check was placed halfway through the ten
effectiveness evaluation questions, telling participants, “This is an attention check. Please
select „Strongly agree.‟” The coefficient alpha for the 10-item effectiveness scale was .90,
and a post-hoc analysis of the items did not reveal any potential improvements to the
scale‟s coefficient alpha per removal of any items. Both sets of questions (i.e. memory
and overall effectiveness) can be found in the Appendix.

17
Mini Study 2: Evaluation of Abstract Art
The next page informed participants that they were about to begin the second,
unrelated mini study. They were further informed that they would be making some rapid
judgments about abstract art, though in reality, this second study was identical to the
AMP used in the pilot study (Appendix) and assessed their implicit attitudes towards
tattoos. To reinforce the belief that the study was about abstract art (rather than tattoos),
this page also gave participants a short description of varying attitudes towards abstract
art.
Finally, this page informed participants that, because each abstract painting would
only appear for one second, each would be preceded by a signal photo alerting them that
the painting to be rated was about to appear. In line with the pilot study, participants
were told that these photos were just signals and not to allow them to influence their
judgments of the abstract paintings (Payne et al., 2005). By clicking “Next”, participants
were taken to the next page, where they were presented with the first signal photo,
abstract painting, and message asking them to “Please Rate the Previous Painting.”
Mini-Study 2: Measures
The first 12 pages involved paintings preceded by signal photos from the
International Affective Picture System (Lang et al., 1995), which helped me compare the
validity and reliability of my AMP data to AMP data used in other studies. The next 20
pages contained signal photos used in my pilot study, with ten photos containing images
of tattooed individuals and the other ten containing images of non-tattooed individuals.

18
Participants made their ratings by selecting one of six option buttons, ranging
from “very unpleasant” to “very pleasant” (Appendix), and clicked “Next” to advance to
the next series of images. The original coefficient alphas for the male, female, and overall
AMP measures were .536, .752, and .759, respectively, and a post hoc analysis indicated
that the removal of any item would not add sufficient reliability to any of the three
implicit scales.
Additional Survey Questions
After participants‟ completed the AMP, two pages containing manipulation
checks were presented to ensure participants‟ recognition of the job applicant‟s (1)
gender and (2) tattoo condition from the first mini study. The gender manipulation check
asked participants, “In the first mini study, was Jessie (the job applicant) male or
female?” Participants selected one of two gender option buttons before clicking “Next”.
The tattoo condition manipulation check asked participants, “In the first mini study, did
Jessie display any of the following features: Piercings, Facial scars, Tattoos, Missing
teeth, or None of the above?” Participants clicked a check box for each feature that they
observed (though the tattoo condition was the only feature manipulated).
Next, participants‟ explicit attitudes towards tattooed men and tattooed women
were assessed using two questions from the pilot study: “Generally, how do you feel
about men with tattoos?” and “Generally, how do you feel about women with tattoos?”
Participants indicated their feelings by picking one of eleven responses, ranging from
“Extremely favorable feelings” to “Extremely unfavorable feelings.”

19
Last, participants answered five demographic questions which asked them about
their: (a) own number of tattoos, (b) gender, (c) age, (d) ethnicity (1 = Caucasian/White,
2 = African American/Black, 3 = Asian American/Asian, 4 = Indian American, 5 =
Other), and (e) level of education (1 = some high school, 2 = high school degree, 3 =
some college, 4 = college degree, 5 = some graduate school, 6 = graduate degree, 7 =
Ph.D). Each demographic question was presented on a separate page. Collecting such
demographic information allowed me to examine any individual differences that served
as moderators of participants‟ implicit attitudes toward male and female tattooed and
non-tattooed individuals.
After all questions were completed, participants were debriefed regarding the true
nature of the survey, gave their consent for the use of their data, and were given a
completion code allowing them to redeem their payment for participation using the
MTurk website.

20
CHAPTER IV
ANALYSIS OF THE DATA
Attention Check, Manipulation Checks, and Outliers
Of the 654 participants that completed the first mini study, 609 passed the
attention check detailed in the Procedure and Design. Of this group, 578 passed the first
manipulation check, correctly identifying the job applicant‟s gender. Of this group, 542
passed the second manipulation check, correctly identifying the job applicant as tattooed
or non-tattooed. Participant data were only used if the participant passed both the
attention check and two manipulation checks.
Using the Generalized Extreme Studentized Deviate (ESD) Test for Outliers
(Rosner, 1983), two outliers were identified in data pertaining to the memory scale and
two more in data pertaining to the implicit attitude scale (AMP). No outliers were found
in data pertaining to the candidate rating scale or explicit attitude scale. Participants
whose data yielded an outlier on either of the aforementioned scales were not used in the
following analyses.
Hypotheses
Hypothesis 1: Tattooed (vs. non-tattooed) applicants will be rated lower on
overall effectiveness.

21
Overall effectiveness ratings were calculated by summing ratings for each of the
ten effectiveness questions. Using these figures (and excluding outliers), an F test was
conducted with job applicant‟s tattoo condition (tattooed = 1, non-tattooed = 0) as the
independent variable and participant ratings of the applicant‟s overall effectiveness as the
dependent variable. Differences in participant effectiveness ratings for the tattooed
applicants (M = 4.11, SD = .60) and non-tattooed applicants (M = 4.21, SD = .55) were
found to be significant, F(1, 536) = 4.49, p < .05, partial 2= .01. Thus, my first
hypothesis was supported.
Hypothesis 2: There will be less recall of what is said in interviews with tattooed
(vs. non-tattooed) applicants.
Participant recall was calculated by summing across nine memory questions (1 =
correct, 0 = incorrect), and an F test was conducted with job applicant‟s tattoo condition
(tattooed vs. non-tattooed) as the independent variable and participant recall (i.e.
memory) as the dependent variable. The analysis did not find memory to be significantly
greater when participants viewed a non-tattooed applicant (M = 7.15, SD = 1.66) over a
tattooed applicant (M = 6.93, SD = 1.77), F(1, 536) = 2.14, p = .15, 2 = .004. Thus, my
second hypothesis could not be confirmed.
Hypothesis 3: Memory will mediate the relationship between tattoo condition and
overall effectiveness ratings.
The results of the previous analysis brought into question whether memory could
function as an appropriate mediator between tattoo condition and effectiveness ratings.
Thus, in fully assessing my third hypothesis, it was first necessary to examine three

22
assumptions: (1) tattoo condition predicts effectiveness ratings, (2) tattoo condition
predicts participant recall, and (3) participant recall predicts effectiveness ratings.
Correlation coefficients were calculated for all three pair-wise relationships, and only the
first (tattoo condition and effectiveness ratings) was found to be significant (Table 1).
Table 1
Correlations, Means, and Standard Deviations of Mediation Model Variables
Variable M SD 1 2
1. Tattoo Condition -.04 1.0
2. Participant Recall 7.05 1.72 -.06
3. Effectiveness Rating 4.17 .58 -.09* -.002
Note: *p < .05
As I did not find significant correlations between each of my variables, I could
not conclude participant recall to be a significant mediator of the relationship between
tattoo condition and effectiveness ratings. A Sobel test also confirmed a lack of mediation
in the model, z = .15, p = .88 (Figure 1).
Figure 4. Standardized Regression Coefficients for the Relationship between
Tattoo Condition and Effectiveness Ratings as Mediated by Participant Recall.
The standardized regression coefficient between tattoo condition and
effectiveness ratings controlling for participant recall is in parentheses.
*p < .05
Participant Recall
Tattoo Condition Effectiveness Ratings
-.06 -.002
- .05 (-.09*)

23
Hypothesis 4: Applicant gender will moderate the mediation between tattoo
condition and participant recall (i.e. memory), with participants remembering
more information about tattooed females than tattooed males.
Having established that participant recall was not a statistically significant
mediator of the tattoo condition-effectiveness ratings relationship, I next analyzed
whether applicant gender was a significant moderator of the tattoo condition-
effectiveness ratings relationship (rather than the tattoo condition-participant recall
relationship). Descriptive statistics and correlations among the predictor variable (tattoo
condition), proposed moderator (participant gender), and criterion variable (effectiveness
ratings) are found in Table 2.
Table 2
Correlations, Means, and Standard Deviations of Applicant Gender Moderation Analysis
Variable M SD 1 2
1. Tattoo Condition -.04 1.0
2. Applicant Gender .06 1.0 -.01
3. Effectiveness Rating 4.17 .58 -.09* .02
Note: *p < .05
A hierarchical multiple regression analysis was conducted with tattoo condition
entered in the first step; tattoo condition and applicant gender entered in the second step;
and tattoo condition, applicant gender, and the interaction of tattoo condition and
applicant gender in the third step.
The second step of my analysis revealed that the addition of applicant gender did
not result in a significant increase in explained variance, ΔR2 < .001, ΔF(2, 535) = .14, p
= .71. In the third step, I observed that the interaction of tattoo condition and applicant

24
gender also did not explain a significant increase in variance in effectiveness ratings, ΔR2
< .001, ΔF(3, 534) = .12, p = .73. Thus, applicant gender did not moderate the
relationship between tattoo condition and effectiveness ratings (Table 3).
Table 3
Analysis of Applicant Gender as a Moderator of Tattoo Condition and Effectiveness
Ratings
Variable B SE B t-value R2 ΔR
2 ΔF
Effectiveness
ratings
Step 1 .008 .008 4.49*
Tattoo
Condition
-.05 .03 -.09 -2.12
Step 2 .009 < .001 .14
Tattoo
Condition
-.05 .03 -.09 -2.12
Applicant
Gender
.009 .03 .016 .37
Step 3 .009 < .001 .12
Tattoo
Condition
-.05 .03 -.09 -2.11
Applicant
Gender
.009 .03 .016 .37
Interaction -.009 .03 -.015 -.35
Note: *p < .05
Hypothesis 5: Implicit tattoo-related attitudes will moderate participant recall with
people who have more negative implicit attitudes about tattooed individuals
recalling less than people who have more positive implicit attitudes.
Next, a hierarchical multiple regression analysis was conducted examining
whether participants‟ implicit attitudes towards tattooed individuals moderated the tattoo
condition-effectiveness ratings relationship. Descriptive statistics and correlations among

25
the predictor variable (tattoo condition), proposed moderator (implicit attitudes), and
criterion variable (effectiveness ratings) are found in Table 4.
Table 4
Correlations, Means, and Standard Deviations of Implicit Attitude Moderation Analysis
Variable M SD 1 2
1. Tattoo Condition -.04 1.0
2. Implicit Attitudes .67 .84 -.001
3. Effectiveness Rating 4.17 .58 -.09* .05
Note: *p < .05
The second step of my analysis revealed that implicit attitudes did not explain
significant new variance in participant effectiveness ratings, ΔR2 = .002, ΔF(2, 437) =
.96, p = .33. However, the interaction between implicit attitudes and tattoo condition did
show a significant increase in explained variance in effectiveness ratings, ΔR2 = .009,
ΔF(3, 436) = 4.12, p < .05, with participants who had more negative implicit attitudes
about tattooed individuals giving lower effectiveness ratings than participants with more
positive implicit attitudes. Thus, implicit attitudes were found to be a significant
moderator of the relationship between tattoo condition and effectiveness ratings (Table
5).

26
Table 5
Analysis of Implicit Attitudes as a Moderator of Tattoo Condition and Effectiveness
Ratings
Variable B SE B t-value R2 ΔR
2 ΔF
Effectiveness
ratings
Step 1 .007 .007 3.21
Tattoo
Condition
-.05 .03 -.09 -1.79
Step 2 .009 .002 .96
Tattoo
Condition
-.05 .03 -.09 -2.07
Implicit
Attitudes
.03 .03 .05 .99
Step 3 .019 .009 4.12*
Tattoo
Condition
-.05 .03 -.09 -1.85
Implicit
Attitudes
.02 .03 .03 .60
Interaction .06 .03 .10 2.03
Note: *p < .05
A post-hoc analysis was conducted to assess whether memory may, in fact, have
served as a mediator of tattoo condition and effectiveness ratings at a high (N = 222, M =
1.23, SD = .40) and/or low (N = 220, M = .10, SD = .77) level of implicit attitudes;
however, Sobel tests did not find evidence of mediation at either the high (z = -.46, p =
.64) or low (z = .53, p = .60) levels.
Exploratory Analysis of Demographic Moderators
Post-hoc analyses also examined a number of additional potential moderators of
the tattoo condition-effectiveness ratings relationship, including participant: (a) explicit
attitudes regarding tattoos, (b) age, (c) number of tattoos, (d) gender, (e) ethnicity, and (f)
level of education.

27
Explicit Attitudes
My first post-hoc hierarchical multiple regression analysis examined whether
explicit attitudes, similar to implicit attitudes, served as a moderator of the tattoo
condition-effectiveness ratings relationship. Descriptive statistics and correlations among
the predictor variable (tattoo condition), proposed moderator (explicit attitudes), and
criterion variable (effectiveness ratings) are found in Table 6.
Table 6
Correlations, Means, and Standard Deviations of Explicit Attitude Moderation Analysis
Variable M SD 1 2
1. Tattoo Condition -.04 1.0
2. Explicit Attitudes 6.63 2.05 .06
3. Effectiveness Rating 4.17 .58 -.09* .17**
Note: *p < .05 **p < .001
The second step of the analysis revealed that explicit attitudes did explain
significant new variance in participant effectiveness ratings, ΔR2 = .030, ΔF(2, 506) =
15.9, p < .001. Likewise, the interaction between explicit attitudes and tattoo condition
showed a significant increase in explained variance in effectiveness ratings, ΔR2 = .014,
ΔF(3, 505) = 7.34, p < .01, with participants who had more negative explicit attitudes
about tattooed individuals giving lower effectiveness ratings than participants with more
positive explicit attitudes. Thus, explicit attitudes were found to be a significant
moderator of the tattoo condition-effectiveness ratings relationship (Table 7).

28
Table 7
Analysis of Explicit Attitudes as a Moderator of Tattoo Condition and Effectiveness
Ratings
Variable B SE B t-value R2 ΔR
2 ΔF
Effectiveness
ratings
Step 1 .006 .006 2.95
Tattoo condition -.04 .03 -.08 -1.72
Step 2 .036 .030** 15.9**
Tattoo condition -.05 .03 -.09 -1.99
Explicit
attitudes
.10 .03 .17 3.98
Step 3 .050 .014* 7.34*
Tattoo condition -.05 .03 -.09 -2.02
Explicit
attitudes
.10 .03 .18 4.13
Interaction .07 .03 .12 2.71
Note: *p < .01 **p < .001
Participant Age
A hierarchical multiple regression analysis was next conducted to assess whether
participant age served as a moderator of the tattoo condition-effectiveness ratings
relationship. Descriptive statistics and correlations among the predictor variable (tattoo
condition), proposed moderator (participant age), and criterion variable (effectiveness
ratings) are found in Table 8.
Table 8
Correlations, Means, and Standard Deviations of Participant Age Moderation Analysis
Variable M SD 1 2
1. Tattoo Condition -.04 1.0
2. Participant Age 32.0 12.2 -.02
3. Effectiveness Rating 4.17 .58 -.09* -.15**
Note: *p < .05 **p < .01

29
The analysis revealed that the addition of participant age explained significant
new variance in participant effectiveness ratings, ΔR2 = .022, ΔF(2, 533) = 12.3, p < .001.
However, the interaction between participant age and tattoo condition did not result in a
significant increase in explained variance in effectiveness ratings, ΔR2 < .001, ΔF(3, 532)
= .12, p = .73. Thus, participant age was found to be an additional predictor of
effectiveness ratings rather than a moderator of the tattoo condition-effectiveness ratings
relationship (Table 9).
Table 9
Analysis of Participant Age as a Moderator of Tattoo Condition and Effectiveness
Ratings
Variable B SE B t-value R2 ΔR
2 ΔF
Effectiveness
ratings
Step 1 .008 .008* 4.42*
Tattoo condition -.05 .03 -.09 -2.10
Step 2 .031 .02** 12.3**
Tattoo condition -.05 .03 -.09 -2.19
Participant age -.09 .03 -.15 -3.50
Step 3 .031 .00 .122
Tattoo condition -.05 .03 -.09 -2.19
Participant age -.09 .03 -.15 -3.50
Interaction .01 .03 .02 .35
Note: *p < .05 *p < .001
Number of Tattoos
My next hierarchical multiple regression analysis assessed whether participants‟
number of tattoos could serve as a moderator of the tattoo condition-effectiveness ratings
relationship. Descriptive statistics and correlations among the predictor variable (tattoo
condition), proposed moderator (number of tattoos), and criterion variable (effectiveness
ratings) are found in Table 10.

30
Table 10
Correlations, Means, and Standard Deviations of Number of Tattoos Moderation
Analysis
Variable M SD 1 2
1. Tattoo Condition -.04 1.0
2. Number of Tattoos .76 1.64 .04
3. Effectiveness Rating 4.17 .58 -.09* .10*
Note: *p < .05
The present analysis revealed that the addition of participants‟ number of tattoos
explained significant new variance in participant effectiveness ratings, ΔR2 = .012, ΔF(2,
533) = 6.26, p < .05. However, the interaction between number of tattoos and tattoo
condition did not show a significant increase in explained variance in effectiveness
ratings, ΔR2 < .001, ΔF(3, 532) = .021, p = .89. Thus, participants‟ number of tattoos
were found to be an additional predictor of effectiveness ratings rather than a significant
moderator (Table 11).
Table 11
Analysis of Number of Tattoos as a Moderator of Tattoo Condition and Effectiveness
Ratings
Variable B SE B t-value R2 ΔR
2 ΔF
Effectiveness
ratings
Step 1 .008 .008* 5.28*
Tattoo condition -.05 .03 -.09 -2.10
Step 2 .020 .012* 6.26*
Tattoo condition -.06 .03 -.10 -2.22
Num. of tattoos .06 .03 .11 2.50
Step 3 .020 .00 .021
Tattoo condition -.06 .03 -.10 -2.21
Num. of tattoos .06 .03 .11 2.46
Interaction .00 .03 .006 .14
Note: *p < .05

31
Participant Gender
My next hierarchical multiple regression analysis assessed whether participant
gender served as a moderator of the tattoo condition-effectiveness ratings relationship.
Descriptive statistics and correlations among the predictor variable (tattoo condition),
proposed moderator (participant gender), and criterion variable (effectiveness ratings) are
found in Table 12.
Table 12
Correlations, Means, and Standard Deviations of Participant Gender Moderation
Analysis
Variable M SD 1 2
1. Tattoo Condition -.04 1.0
2. Participant Gender 1.43 .50 .08
3. Effectiveness Rating 4.17 .58 -.09* -.10*
Note: *p < .05
The analysis revealed that the addition of participant gender explained a
significant amount of new variance in participant effectiveness ratings, ΔR2 = .008, ΔF(2,
530) = 4.47, p < .05. Moreover, the interaction between participant gender and tattoo
condition also showed a significant increase in explained variance in effectiveness
ratings, ΔR2 = .007, ΔF(3, 529) = 3.86, p = .05. Thus, participant gender was found to be
a significant moderator of the tattoo condition-effectiveness ratings with the manipulation
being more effective for male participants (F[1, 229] = 6.68, p = .01) than female
participants (F[1, 304] = .05, p = .83).

32
Table 13
Analysis of Participant Gender as a Moderator of Tattoo Condition and Effectiveness
Ratings
Variable B SE B t-value R2 ΔR
2 ΔF
Effectiveness
ratings
Step 1 .010 .010* 5.10*
Tattoo condition -.06 .03 -.10 -2.26
Step 2 .018 .008* 4.47*
Tattoo condition -.05 .03 -.09 -2.10
Part. gender -.05 .03 -.09 -2.12
Step 3 .025 .007 3.85
Tattoo condition -.05 .03 -.09 -2.10
Part. gender -.05 .03 -.09 -2.07
Interaction -.05 .03 -.08 -1.96
Note: *p < .05
Ethnicity
A two-way ANOVA was performed examining the relationship between tattoo
condition and ethnicity as predictors of candidate effectiveness ratings. The main effect
of tattoo condition, without the eight degrees of freedom afforded to it in the first
hypothesis, this time yielded an F ratio of F(1, 528) = 2.08, p = .15, partial 2
= .004,
indicating that candidate effectiveness ratings were not significantly greater for non-
tattooed applicants (M = 4.22, SD = .55) than for tattooed applicants (M = 4.11, SD = .60)
when examined together with ethnicity. The main effect of ethnicity yielded an F ratio of
F(4, 528) = 1.20, p = .31, partial 2
= .009, indicating that candidate effectiveness ratings
were not significantly higher at any ethnicity level (Table 14). The interaction effect was
also non-significant, F(4, 528) = 1.04, p = .39, partial 2
= .008.

33
Table 14
Descriptive Statistics of Effectiveness Ratings at Each Ethnicity Level
Variable N M SD
Caucasian/White 427 4.18 .56
African American/Black 48 4.13 .67
Asian American/Asian 34 3.97 .70
Indian American 3 4.17 .15
Other 26 4.28 .61
Total 538 4.17 .58
Level of Education
A final hierarchical multiple regression analysis examined whether participant
level of education (1 = some high school, 2 = high school degree, 3 = some college, 4 =
college degree, 5 = some graduate school, 6 = graduate degree, 7 = Ph.D) served as a
moderator of the tattoo condition-effectiveness ratings relationship. Descriptive statistics
and correlations among the predictor variable (tattoo condition), proposed moderator
(level of education), and criterion variable (effectiveness ratings) are found in Table 15.
Table 15
Correlations, Means, and Standard Deviations of Level of Education Moderation
Analysis
Variable M SD 1 2
1. Tattoo Condition -.04 1.00
2. Level of Education 3.77 1.18 .08
3. Effectiveness Rating 4.17 .58 -.09* -.22**
Note: *p < .05 **p < .01
This final analysis revealed that level of education explained significant new
variance in participant effectiveness ratings, ΔR2 = .044, ΔF(2, 533) = 24.7, p < .001.
However, the interaction between level of education and tattoo condition did not show a
significant increase in explained variance in effectiveness ratings, ΔR2 = .003, ΔF(3, 532)

34
= 1.81, p = .18. Thus, level of education was found to be an additional predictor of
effectiveness ratings rather than a significant moderator (Table 16).
Table 16
Analysis of Level of Education as a Moderator of Tattoo Condition and Effectiveness
Ratings
Variable B SE B t-value R2 ΔR
2 ΔF
Effectiveness
ratings
Step 1 .008 .008* 4.42*
Tattoo condition -.05 .03 -.09 -2.10
Step 2 .052 .044** 24.7**
Tattoo condition -.04 .03 -.07 -1.75
Education level -.12 .03 -.21 -5.00
Step 3 .055 .003 1.81
Tattoo condition -.04 .03 -.07 -1.74
Education level -.12 .03 -.21 -4.98
Interaction -.03 .03 -.06 -1.35
Note: *p < .05 **p < .001

35
CHAPTER V
SUMMARY AND CONCLUSIONS
Madera and Hebl (2011) were among the first researchers to examine the specific
processes involved in the discrimination of physically stigmatized individuals in job
interviews. In their research, they found that participants evaluating stigmatized job
applicants remembered less information from the job interview, which directly led to
participants‟ rating stigmatized individuals lower in overall effectiveness than non-
stigmatized individuals. These findings were important in that they connected stigma
research to the study of biases and discrimination in the job interview - one of the most
widely utilized methods for employee selection (Campion, Palmer, & Campion, 1997).
Still, their research encompassed only one type of stigmatizing condition – facial stigmas.
Thus, their findings opened the door for a number of future studies on the discrimination
of other stigmatizing conditions.
Pryor and Reeder (2011) indicated that a hallmark of a stigma is that it evokes
implicit negative attitudes. In a pilot study, a tattoo stigma was found to exist in that
tattooed individuals were evaluated more negatively than non-tattooed individuals at both
the explicit and implicit levels. The present study examined whether this stigma, like
Madera & Hebl‟s study, could also resulted in job applicant discrimination in the
evaluation of tattooed job applicants.

36
Five hypotheses were tested in addition to some exploratory analyses. First, I
hypothesized that tattooed job applicants would be rated lower than non-tattooed
applicants in overall effectiveness ratings, and this hypothesis was confirmed. Second, I
hypothesized that there would be less recall (i.e. memory) of what was said in interviews
with tattooed applicants than non-tattooed applicants. This hypothesis was not confirmed.
Third, I hypothesized that memory would mediate the relationship between tattoo
condition and overall effectiveness ratings. This hypothesis was also not confirmed.
My next two hypotheses were originally set up to examine two potential
moderators of the tattoo condition-participant recall relationship: applicant gender and
participant implicit attitudes. However, as participant recall was not found to be a
significant mediator of the tattoo condition-effectiveness ratings relationship, the analyses
were simplified to examine applicant gender and implicit attitudes as potential
moderators of the tattoo condition-effectiveness ratings relationship instead. Applicant
gender was not found to be a significant moderator the relationship; however implicit
attitudes was, with participants who had more negative implicit attitudes about tattooed
individuals giving significantly lower effectiveness ratings than participants with more
positive implicit attitudes.
Finally, a number of exploratory analyses were performed post-hoc to examine
whether participants‟ (a) explicit attitudes, (b) number of tattoos, (c) gender, (d) age, (e)
ethnicity, and/or (f) level of education served as moderators of the tattoo condition-
effectiveness ratings relationship. Explicit attitudes and participant gender were found to
be predictors and moderators of the relationship, with (a) participants who had more

37
negative explicit attitudes about tattooed individuals giving lower effectiveness ratings
than participants with more positive explicit attitudes and (b) the tattoo manipulation
being more effective for male participants than female participants.
When testing both (AMP-based) implicit attitudes and (feeling thermometer-
based) explicit attitudes in the same equation, the overall equation was highly significant,
R2 = .04, F(2, 416) = 7.99, p < .001. Explicit ratings were superior to implicit ratings
in accounting for unique variance in candidate effectiveness ratings, = .21, t(416) =
4.00, p < .001 and = -.08, t(416) = -1.50, p = .14, respectively. When testing all
significant moderators (i.e. implicit attitudes, explicit attitudes, and participant gender) in
the same equation, the overall equation was again highly significant, R2 = .04, F(3,
415) = 5.59, p = .001. Explicit ratings were again superior to implicit ratings and
participant gender in accounting for unique variance in candidate effectiveness ratings,
= .19, t(416) = 3.66, p < .001, = -.08, t(416) = -1.54, p = .12, and = -.06, t(416) = -
1.12, p = .27, respectively.
Participants‟ age, number of tattoos, and level of education were all found to be
significant predictors of effectiveness ratings rather than moderators of the tattoo
condition-effectiveness ratings relationship. Ethnicity did not prove to be a significant
predictor of effectiveness ratings nor a significant moderator of the tattoo condition-
effectiveness ratings relationship. Figure 2 illustrates each significant relationship
identified in this study.

38
Figure 5. Variables Influencing Candidate Effectiveness
Ratings.
Solid line: p < .05. Dotted line: p = .05.

39
CHAPTER VI
LIMITATIONS AND DIRECTIONS FOR FUTURE RESEARCH
Perhaps the most surprising finding in the present study was that, unlike the
results found in Madera & Hebl (2011), memory did not prove to be a significant
mediator of the stigma condition-effectiveness ratings relationship. I see two possible
explanations for this finding. First, the stigmatizing (i.e. tattoo) condition used for the
present study was more concealable (i.e. applicant‟s arm rather than face) than that used
by Madera & Hebl. Second, rather than watching an actual interview, participants in the
present study read through a script presented below static images, which may have taken
their attention away from the stigmatizing condition.
Level of Concealability
As most observers concentrate on the face of a job applicant (rather than arm)
during an interview, it is likely that the tattoo proved less stigmatizing than a facial
stigma, and thus, had less of an effect on participant recall. However, had the tattoo been
placed on the face or neck, it may have proved just as stigmatizing as a port wine
stain/scar. As was recognized by Bell (1999) and Roberts (2012), the latter who noted
that “not all tattooed bodies are equal in American culture,” differences in tattoo
placement can result in a distinction between “people with tattoos” and “tattooed people.”
Specifically, Roberts found that “people with tattoos” is often used to describe

40
individuals who “have one to a few tattoos strategically placed on areas of their bodies
that are easily hidden;” alternatively, “tattooed people” is used to describe individuals
who “get tattoos that are always visible to others” (p. 153).
Two factors seem to lie at the heart of such a distinction: tattoo number and
placement. Regarding number, Totten et al. (2009) found that 85.3% of respondents
agreed that the number of tattoos a person has makes a difference in how he or she is
perceived by others (p. 92). They also found that tattoos can be attractive “as long as
these are not overdone” (p. 93). Regarding placement, Totten and his colleagues found
that “small, discrete” tattoos were seen as highly attractive (p. 86), while “extensive
tattoos” are usually not seen as attractive (p. 83).
Though Madera and Hebl were able to confirm discrimination of visibly
stigmatized applicants, they limited their study to a very small percentage of individuals
with visible stigmas – individuals with prominent facial marks/scars. While highly
stigmatizing, studies show that port wine stains/prominent facial scars are found in less
than 1% of the population (Barsky et al., 1980). Tattoos, on the other hand, can be seen in
40% of 21-31 year olds today (Martin & Dula, 2010). Therefore, research examining
more popular, though notably more subtle stigmatizing conditions may prove more
beneficial to our understanding of stigma evaluation overall.
Animated vs. Static Interview Visuals
A second possible explanation for why the present study did not find memory to
be a mediator of the tattoo condition-effectiveness ratings relationship may relate to how
the study was conducted. Specifically, participants in the present study were presented

41
with a static image of a job applicant with text of the interview appearing below the static
image. It may have been possible that participants looked at the static image at the
beginning of the interview then saw no reason to pay further attention to the image as
they advanced from one page of the interview to the next. Such occurrences may also
have contributed to the low memory scale coefficient alpha. If this were the case, future
studies may find it advantageous to use a more realistic simulated interview, such as an
animated clip, instead of using static images.
Madera & Hebl Techniques for Other Stigmas
Another limitation of the present study is that it only examined one form of
interview discrimination resulting from stigma – tattoo. Future studies may wish to utilize
the procedures detailed in Madera & Hebl (2011) in an effort to examine other visibly
stigmatizing conditions (e.g. ethnic minority, obesity, piercings). Studies in this vein may
find memory to be a significant mediator of effectiveness ratings or not, creating a more
complete picture of the both the physical and cognitive factors underlying stigma
evaluation and discriminatory consequences. Moreover, such studies are likely to benefit
from advances in 3D imaging technology that are allowing the manipulation of avatar
physical factors (e.g. height, weight, ethnicity) to be increasingly realistic and easy to do.
Tattoo Research
In the current study, participants were only asked to evaluated job applicants who
were recent college graduates. However, future studies may find it useful to vary the age
and/or level of education of the job applicant. Research has shown that tattooed
adolescents are rated less positively than tattooed adults (Stuppy et al., 1998). Totten et
42
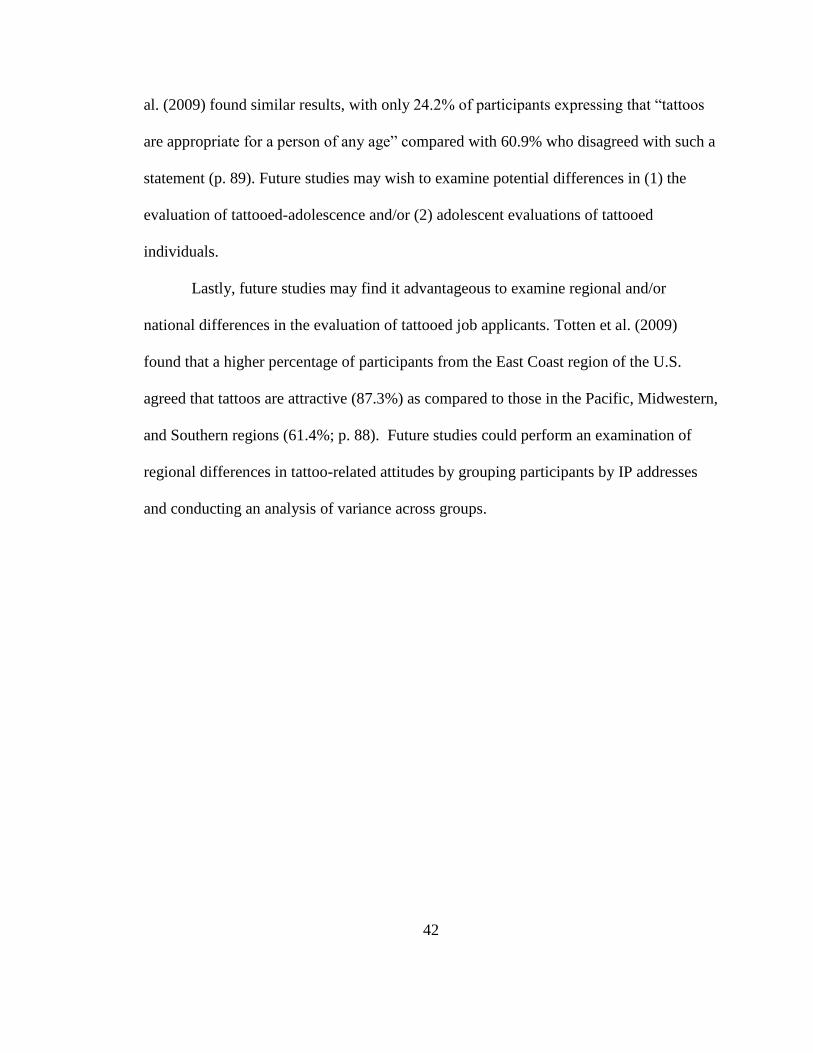
al. (2009) found similar results, with only 24.2% of participants expressing that “tattoos
are appropriate for a person of any age” compared with 60.9% who disagreed with such a
statement (p. 89). Future studies may wish to examine potential differences in (1) the
evaluation of tattooed-adolescence and/or (2) adolescent evaluations of tattooed
individuals.
Lastly, future studies may find it advantageous to examine regional and/or
national differences in the evaluation of tattooed job applicants. Totten et al. (2009)
found that a higher percentage of participants from the East Coast region of the U.S.
agreed that tattoos are attractive (87.3%) as compared to those in the Pacific, Midwestern,
and Southern regions (61.4%; p. 88). Future studies could perform an examination of
regional differences in tattoo-related attitudes by grouping participants by IP addresses
and conducting an analysis of variance across groups.

43
REFERENCES
Adams, J. (2012). Cleaning up the dirty work: Professionalization and the management of
stigma in the cosmetic surgery and tattoo industries. Deviant Behavior, 33, 149-
167.
Angermeyer, M. C., Schulze, B., & Dietrich. S. (2003). Courtesy stigma: A focus group
study of relatives of schizophrenia patients. Social Psychiatry and Psychiatric
Epidemiology, 38, 593-602.
Armstrong, M. L. (1991). Career-oriented women with tattoos. Journal of Nursing
Scholarship, 23, 215–220.
Atkinson, M. (2003). Tattooed: The sociogenesis of a body art. Toronto, Ontario,
Canada: University of Toronto Press.
Baddeley, A. D., & Hitch, G. (1974). Working memory. In G. H. Bower (Ed.), The
psychology of learning and motivation: Advances in research and theory (Vol. 8,
pp. 47-89). New York, NY: Academic Press.
Baron, R. A. (1983). Sweet smell of success? The impact of pleasant artificial scents on
evaluation of job applicants. Journal of Applied Psychology, 68, 709-713.
Barsky, S. H., Rosen, S., Geer, D. E., & Noe, J. M. (1980). The nature and evolution of
port wine stains: A computer-assisted study. Journal of Investigative
Dermatology, 74, 154-157.
Bassett, J. F., & Dabbs, J. M. (2005). A portable version of the go/no-go association task
(GNAT). Behavior Research Methods, Instruments, and Computers, 37, 506-512.
Bell, S. (1999). Tattooed: A participant observer‟s exploration of meaning. Journal of
American Culture, 22(2), 53-58.
Bessenoff, G. R., & Sherman, J. W. (2000). Automatic and controlled components of
prejudice toward fat people: Evaluation versus stereotype activation. Social
Cognition, 18, 329-353.
Birenbaum, A. (1992). Courtesy stigma revisited. Mental Retardation, 30, 265-268.

44
Blascovich, J., Mendes, W. B., Hunter, S. B., Lickel, B., & Kowai-Bell, N. (2001).
Perceiver threat in social interactions with stigmatized others. Journal of
Personality and Social Psychology, 80(2), 253-267.
Brenner, L., von Hippel, W., & Kippax, S. (2007). Prejudice among health care workers
toward injecting drug users with hepatitis C: Does greater contact lead to less
prejudice? The International Journal of Drug Policy, 18, 381-387.
Buhrmester, M., Kwang, T., & Gosling, S. D. (2011). Amazon‟s Mechanical Turk: A
new source of inexpensive, yet high quality, data? Perspectives on Psychological
Science, 6, 3-5.
Burgess, M., & Clark, L. (2010). Do the “savage origins” of tattoos cast a prejudicial
shadow on contemporary tattooed individuals? Journal of Applied Social
Psychology, 40(3), 746-764.
Campion, M. A., Palmer, D. K., & Campion, J. E. (1997). A review of structure in the
selection interview. Personnel Psychology, 50, 655-702.
Chaudoir, S. R., & Quinn, D. M. (2010). Revealing concealable stigmatized identities:
The impact of disclosure motivations and positive first-disclosure experiences on
fear of disclosure and well-being. Journal of Social Issues, 66(3) 570-584.
Christensen, M. H. (2000). Photo essay: Tattoos. Public Health Reports, 115(5), 430-435.
Corrigan, P. W., Watson, A. C., & Miller, F. E. (2006). Blame, shame, and
contamination: The impact of mental illness and drug dependence stigma on
family members. Journal of Family Psychology, 20, 239-246.
Crandall, C. S., & Eshleman, A. (2003). A justification-suppression of the expression and
experience of prejudice. Psychological Bulletin, 129, 414-446.
Crocker, J., Major, B., & Steele, C. (1998). Social stigma. In The handbook of social
psychology, 2, 504-553.
Dean, D. H. (2010). Consumer perceptions of visible tattoos on service personnel.
Managing Service Quality, 20(3), 294-308.
Dean, D. H. (2011). Young adult perception of visible tattoos on white-collar service
provider. Young Consumers: Insight and Ideas for Responsible Marketers, 12(3),
254-264.
DeMello, M. (2000). Bodies of Incription: A Cultural History of the Modern Tattoo
Community. Durham, NC: Duke University Press.

45
Dipboye, R. L. (2005). The selection/recruitment interview: Core processes and contexts.
In A. Evers, N. Anderson, & O. Smit-Voskuijl (Eds.), The Blackwell handbook of
personnel selection (pp. 121-142). Malden, MA: Blackwell.
Dipboye, R. L., & Collela, A. (2005). Discrimination at work: The psychological and
organizational bases. Mahwah, NJ: Erlbaum.
Dunton, B. C., & Fazio, R. H. (1997). An individual difference measure of motivation to
control prejudice reactions. Personality and Social Psychology Bulletin, 23(3),
316-326.
Goffman, E. (1963). Stigma: Notes on the management of spoiled identity. New York,
NY: Prentice Hall.
Grandfield, T. A., Thomson, A., & Turpin, G. (2005). An attitudinal study of responses to
a range of dermatological conditions using the Implicit Association Test. Journal
of Health Psychology, 10, 821-829.
Greenwald, A. G., McGhee, D. E., & Schwartz, J. K. L. (1998). Measuring individual
differences in implicit cognition: The implicit association test. Journal of
Personality and Social Psychology, 74, 1464-1480.
Hawkes, D. Senn, C. Y., & Thorn, C. (2004). Factors that influence attitudes toward
women with tattoos. Sex Roles, 50(9-10), 593-604.
Hebl, M. R., & Mannix, L. M. (2003). The weight of obesity in evaluating others: A mere
proximity effect. Personality and Social Psychology Bulletin, 29, 28-38.
Heywood, W., Patrick, K., Smith, A. M. A, Simpson, J. M., Pitts, M. K., Richters, J., &
Shelley, J. M. (2012). Who gets tattoos? Demographics and behavioral correlates
of ever being tattooed in a representative sample of men and women. Ann
Epidemiol, 22, 51-56.
Houston, V., & Bull, R. (1994). Do people avoid sitting next to someone who is facially
disfigured? European Journal of Social Psychology, 24, 279-284.
Huffcutt, A. I., & Arthur, W., Jr. (1994). Hunter and Hunter (1984) revisited: Interview
validity for entry-level jobs. Journal of Applied Psychology, 79, 184-190.
Hunter, J. E., & Hunter, R. F. (1984). Validity and utility of alternative predictors of job
performance. Psychological Bulletin, 96, 72-98.
Jellison, W. A., McConnell, A. R., & Gabriel, S. (2004). Implicit and explicit measures
of sexual orientation attitudes: Ingroup preferences and related behaviors and

46
beliefs among gay and straight men. Personality and Social Psychology Bulletin,
30, 629-642.
Johnson, K. K. P., & Roach-Higgins, M. E. (1987). Dress and physical attractiveness of
women in job interviews. Clothing and Textiles Research Journal, 5, 1-8.
Jones, E. E., & French, R. S. (1984). Social stigma: The psychology of marked
relationships. New York, NY: W.H. Freeman.
Kawakami, K. Phills. C. E., Steele, J. R., & Dovidio, J. F. (2007). (Close) distance makes
the heart grow fonder: Improving implicit racial attitudes and interracial
interactions through approach behaviors. Journal of Personality and Social
Psychology, 92, 957-971.
Kosut, M. (2006). An ironic fad: The commodification and consumption of tattoos.
Journal of Popular Culture, 39(6), 1035-1048.
Koziel, S., Kretshmer, W., & Pawlowski, B. (2010). Tattoo and piercing as signals of
biological quality. Evolution and Human Behavior, 31, 187-192.
Lang, P. J., Bradley, M. M., & Cuthbert, B. (1995). International Affective Picture
System. Gainesville: University of Florida, Center for Research in
Psychophysiology.
Langer, E. J., Fiske, S., Taylor, S. E., & Chanowitz, B. (1976). Stigma, staring, and
discomfort: A novel-stimulus hypothesis. Journal of Experimental Social
Psychology, 12, 451-463.
Laumann, A. E., & Derick, A. J. (2006). Tattoos and body piercings in the United States:
A national data set. Journal of the American Academy of Dermatology, 55, 413-
421.
Lombroso, C. (1895). Criminal anthropology. Forum, 20, 33-49.
Lombroso, C. (1896). The savage origins of tattooing. Popular Science Monthly, 4, 793-
803.
Madera, J. M., & Hebl, M. R. (2011). Discrimination against facially stigmatized
applicants in interviews: An eye-tracking and face-to-face investigation. Journal
of Applied Psychology, 97(2), 317-330.
Mann, S. (2005). National poll shows public opinion sharply divided on regulating
appearance – from weight to tattoos – in the workplace. Business Wire (30 March
2005). Web (11 March 2008).

47
Martin, B. A., & Dula, C. S. (2010). More than skin deep: Perceptions of, and stigma
against, tattoos. College Student Journal, 44, 200-206.
Muraven, M., & Baumeister, R. F. (2000). Self-regulation and depletion of limited
resources: Does self-control resemble a muscle? Psychological Bulletin, 126, 247-
259.
Murphy, K. R., & Myors, B. (2004). Statistical power analysis: A simple and general
model for traditional and modern hypothesis tests (2nd ed.). Mahwah, NJ:
Erlbaum.
Neuberg, S. L., Smith, D. M., Hoffman, J. C., & Russell, F. J. (1994). When we observe
stigmatized and “normal” individuals interacting: Stigma by association.
Personality and Social Psychology Bulletin, 20, 196-209.
Neumann, R., Hulsenbeck, K., & Seibt, B. (2004). Attitudes towards people with AIDS
and avoidance behavior: Automatic and reflective bases of behavior. Journal of
Experimental Social Psychology, 40, 543-550.
Norvilitis, J. M., Scime, M., & Lee, J. S. (2002). Courtesy stigma in mothers of children
with attention deficit/hyperactivity disorder: A preliminary investigation. Journal
of Attention Disorders, 6, 61-68.
Olson, K. R., Dunham, Y., Dweck, C. S., Spelke, E. S., & Banaji, M. R. (2008).
Judgments of the lucky across development and culture. Journal of Personality
and Social Psychology, 94, 757-776.
Ostman, M., & Kjellin, L. (2002). Stigma by association: Psychological factors in
relatives of people with mental illness. British Journal of Psychiatry, 181, 494-
498.
Payne, B. K., Cheng, C. M., Govorun, O., & Stewart, B. D. (2005). An inkblot for
attitudes: Affect Misattribution as Implicit Measurement. Journal of Personality
and Social Psychology, 89(3), 277-293.
Pontin, J. (2007, March 25). Artificial intelligence: With help from the humans. The New
York Times. Retrieved from
http://www.nytimes.com/2007/03/25/business/yourmoney/25Stream.html
Pryor, J. B., Reeder, G. D., Yeadon, C., & Hesson-McInnis, M. (2004). A dual process
model of reactions to perceived stigma. Journal of Personality and Social
Psychology, 87, 436-452.

48
Pryor, J. B., & Reeder, G. D. (2011). HIV-Related stigma. In J. C. Hall, B. J. Hall, & C.
J. Cockerell (Eds.), HIV/AIDS in the Post-HAART Era: Manifestations,
Treatment, and Epidemiology (pp. 790-806). Shelton, Connecticut: PMPH-USA,
Ltd.
Pryor, J. M., Reeder, G. D., & Monroe, A. E. (2012). The infection of bad company:
Stigma-by-Association. Journal of Personality and Social Psychology, 102(2),
224-241.
Quinn, D. M, Chaudoir, S., R. (2009). Living with a concealable stigmatized identity:
The impact of anticipated stigma, centrality, salience, and cultural stigma on
psychological distress and health. Journal of Personality and Social Psychology,
97(4), 634-651.
Reeder, G. D., & Pryor, J. B. (2000). Attitudes toward persons with HIV/AIDS: Linking
a functional approach with underlying process. In G. Maio and J. Olson (Eds.),
Why we evaluate: Functions of attitudes (pp. 295-323). Hillsdale, NJ: Erlbaum.
Resenhoeft, A., Villa, J., & Wiseman, D. (2008). Tattoos can harm perceptions: A study
and suggestions. Journal of American College Health, 56(5), 593-596.
Rinck, M., & Becker, E. S. (2006). Spider fearful individuals attend to threat, then
quickly avoid it: Evidence from eye movements. Journal of Abnormal
Psychology, 115, 231-238.
Roberts, D. J. (2012). Secret ink: Tattoo‟s place in contemporary American culture. The
Journal of American Culture, 35(2), 153-165.
Rosner, B. (1983). Percentage points for a generalized ESD many-outlier procedure.
Technometrics, 25(2), 165-172.
Rossbach, K. A, Wilson, J. P. (1992). Does a Dog's Presence Make a Person More
Likeable? Anthrozoös, 5(1), pp. 40-51.
Stieger, S., Pietschnig, J., Kastner, C.K., Voracek, M., & Swami, V. (2010). Prevalence
and acceptance of tattoos and piercings: A survey of young adults from the
southern German-speaking area of central Europe. Perceptual and Motor Skills,
110, 3, 1065-1064.
Stirn, A., Andreas, H., & Brahler, E. (2006). Prevalence of tattooing and body piercing in
Germany and perception of health, mental disorders, and sensation seeking among
tattooed and body-pierced individuals. Journal of Psychomatic Research, 60, 531-
534.

49
Stuppy, D. J. Armstrong, M. L., & Casals-Ariet, C. (1998). Attitudes of health care
providers and students towards tattooed people. Journal of Advanced Nursing, 27,
1165-1170.
Stutterheim, S. E., Bos, A. E. R., Pryor, J. B., Brands, R., Liebregts, M., & Schaalma, H.
P. (2011). Psychological and social correlates of HIV status disclosure: The
significance of stigma visibility. AIDS Education and Prevention, 23(4), 382-392.
Swami, V., & Furnham, A. (2007). Unattractive, promiscuous, and heavy drinkers:
Perceptions of women with tattoos. Body Image, 4, 4, 343-352.
Tiggemann, M. & Hopkins, L. A. (2011). Tattoos and piercings: Bodily expressions of
uniqueness? Body Image, 8, 245-250.
Totten, J. W., Lipscomb, T. J. & Jones, M. A. (2009). Attitudes toward and stereotypes of
persons with body art: Implications for marketing management. Academy of
Marketing Studies Journal, 13(2), 77-96.
Towler, A. J., & Schneider, D. J. (2005). Distinctions among stigmatized groups. Journal
of Applied Social Psychology, 35(1), 1-14.
Vanman, E. J., Paul, B. Y., Ito, N. M., & Miller, N. (1997). The modern face of prejudice
and structural features that moderate the effect of cooperation on affect. Journal
of Personality and Social Psychology, 73(5), 941-959.
Weiner, B. (1995). Judgments of responsibility: A foundation for a theory of social
conduct. New York: Guilford Press.
Wohlrab, S., Fink, B., Kappeler, P. M. & Brewer, G. (2009). Differences in personality
attributions toward tattooed and nontattooed virtual human characters. Journal of
Individual Differences, 30(1), 1-5.

50
APPENDIX A
PILOT STUDY
Goffman (1963) identified three types of stigma: (1) abominations of the body,
(2) blemishes of individual character, and (3) tribal stigmas. Tattoos can be classified
within each of these categories: (1) they involve a deformation the body, (2) their
presence is often regarded as a character blemish, and (3) they can signify a group/tribe
membership. Pryor & Reeder (2011) suggested that one hallmark of stigmas is that they
evoke implicit negative attitudes.
In the last few decades, implicit attitude tests, such as the Implicit Association
Test (IAT; Greenwald et al, 1998) and the Affect Misattribution Procedure (AMP; Payne
et al., 2005), have given researchers a way to quantitatively assess implicit attitudes, and
thus, confirm the existence of stigmas. In this pilot study, such a method was used to
confirm the existence of a tattoo stigma.
The goal of this pilot study was threefold. First, I wished to verify the existence of
a tattoo stigma by assessing participants‟ implicit attitudes of tattooed and non-tattooed
individuals. Second, I wished to explore the relationship between participants‟ implicit
and explicit attitudes regarding tattooed individuals. Third, I wished to identify possible
gender differences in the assessments of tattooed males and females.

51
I first predicted that participants would judge tattooed individuals as less
attractive than non-tattooed individuals at both the implicit and explicit levels. Second, I
predicted that implicit and explicit attitudes would be highly correlated. Third, in line
with research indicating that tattooed women face a higher degree of discrimination than
tattooed men (Hawkes, et al., 2004; Swami & Furnham, 2007), I predicted that tattooed
females would encounter a larger drop in attractiveness ratings than tattooed males.
Method
Participants
Seventy-one participants (27 males and 44 females) volunteered to participate in
this study. Participants were given extra credit in an undergraduate Psychology class in
exchange for their involvement. Data was collected in groups ranging from 15 to 20
participants.
Procedure and Design
Participants were told that the purpose of the study was to examine the
psychological processes at work in the evaluation of abstract art. A brief history of
abstract art was given, and participants completed five practice questions indicating their
preference for one abstract painting over another.
Participants‟ implicit attitudes were then assessed using an adaptation of the
Affect Misattribution Procedure. Participants were told that their task was to rate the
visual pleasantness of a series of abstract paintings. They were told that each painting
would be presented for only one second, and therefore, they should make their ratings as
quickly as possible. Ratings were made on an answer sheet using the following scale: -3

52
= very unpleasant, -2 = unpleasant, -1 = slightly unpleasant, +1 = slightly pleasant, +2 =
pleasant, and +3 = very pleasant.
Participants were also told that, because each painting was to be presented for
only a second, a real life signal photo would precede each painting. Fundamentally, the
AMP functions so that each “real life” photo serves as a prime that influences the rating
of the ambiguous painting that follows. However, in line with Payne‟s study, participants
in the pilot were not made aware of the AMP‟s true nature; instead, they were told that all
real-life images served only as warning signals and to not let them influence their
judgments of the abstract paintings. Thus, evaluations of abstract paintings reflected
participants‟ implicit (rather than explicit) attitudes.
Twenty priming photos were presented for one second preceding each abstract
painting. Priming photos consisted of five non-tattooed males, five non-tattooed females,
five tattooed males, and five tattooed females. All photos were found online, and subjects
of priming photos were rated as being of equal relative attractiveness prior to this study.
Priming photos were presented at random. Abstract paintings were created online, and
mirrored copies of each abstract painting following a tattooed prime alternatively
followed a non-tattooed prime as well.
After each (one second) presentation of a prime and (one second) presentation of
an abstract painting, a message was presented asking participants to rate the pleasantness
of the previous painting on a Likert scale. Likert scale values ranged from -3 (very
negative) to +3 (very positive) without the use of a midpoint (0), thus participants‟

53
responses were forced choice in nature while still allowing participants to express the
degree of their feelings.
After a five-minute break, participants explicitly evaluated the attractiveness of
the same 20 subjects used in the priming photos. Here, each photo was presented for two
seconds, and participants were asked to rate the individuals on a scale from 0 (not at all
attractive) to 100 (extremely attractive).
Participants next provided further explicit evaluations by completing a Tattoo
Attitude Scale in which they were asked two questions: “Generally, how do you feel
about men with tattoos?” and “Generally, how do you feel about women with tattoos?”
The Attitude Scale was calibrated from 100 degrees (extremely favorable feelings) to 0
degrees (extremely unfavorable feelings).
Last, participants indicated their age, gender, class, and their own number of
tattoos. All participants were then debriefed regarding the true purpose of the study. A
number of subjects indicated that they suspected the study involved the evaluation of
tattooed individuals; however, no subject picked up on the true nature of the AMP in its
ability to evaluate implicit attitudes.
Results
Implicit Attitudes
I first examined attractiveness ratings generated during the AMP. For each
participant, I computed mean ratings of abstract paintings following tattooed subject and
non-tattooed subject conditions, respectively. Comparing these indices, I found that
abstract paintings preceded by primes of non-tattooed individuals (M = .217, SD = .109)

54
were rated more positively than paintings preceded by primes of tattooed individuals (M
= -.029, SD = .104), F(1, 69) = 11.7, p = .001, η2 = .145. Thus, these ratings showed an
overall tattoo stigma main effect (Figure 1).
Figure 1. Main Effect of Implicit Attitudes of Tattooed
and Non-tattooed Individuals
Explicit Attitudes
Next, I examined the explicit ratings of the 20 subjects of the photos. For each
participant, I computed mean ratings of tattooed individuals and non-tattooed individuals,
respectively. Comparing these indices, I found that non-tattooed individuals (M = 66.6,
SD = 1.65) were rated more attractive than tattooed individuals (M = 53.8, SD = 2.01),
F(1, 69) = 53.0, p < .001, η2 = .435 (Figure 2).
Rat
ing
SD = .109
SD = .104

55
Figure 2. Main Effect of Explicit Attitudes of
Tattooed and Non-tattooed Individuals
Additional Findings
Implicit and explicit attitudes were found to be correlated, r(71) = .55, p < .01 for
males and, r(71) = .37, p < .01 for females. A significant interaction was also found to
exist between gender of prime subject and tattoo condition for explicit ratings, F(1,69)
=5.72 , p = .02, η2 = .076, indicating that having tattoos lowered female ratings more than
male ratings (Figure 3). This finding supported previous research indicating that tattooed
females face a larger degree of discrimination than tattooed males.
SD = 1.65
SD = 2.01
Rat
ing
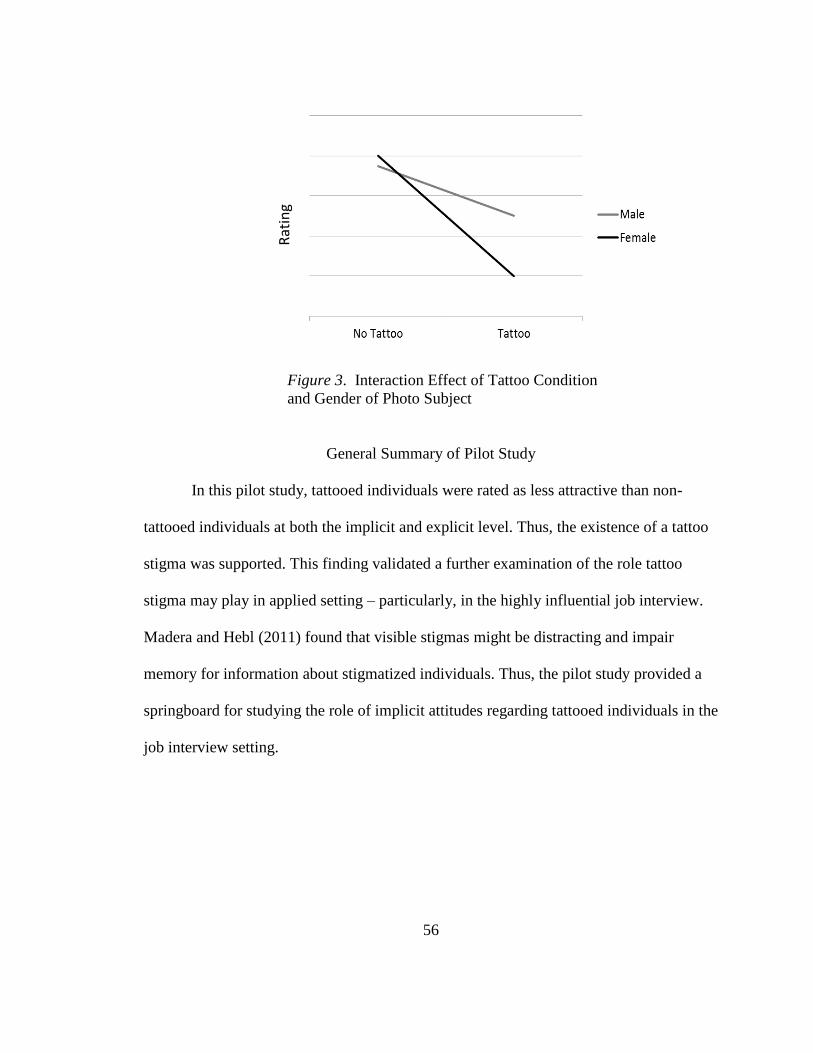
56
Figure 3. Interaction Effect of Tattoo Condition
and Gender of Photo Subject
General Summary of Pilot Study
In this pilot study, tattooed individuals were rated as less attractive than non-
tattooed individuals at both the implicit and explicit level. Thus, the existence of a tattoo
stigma was supported. This finding validated a further examination of the role tattoo
stigma may play in applied setting – particularly, in the highly influential job interview.
Madera and Hebl (2011) found that visible stigmas might be distracting and impair
memory for information about stigmatized individuals. Thus, the pilot study provided a
springboard for studying the role of implicit attitudes regarding tattooed individuals in the
job interview setting.
Rat
ing

57
APPENDIX B
MTURK PARTICIPANT RECRUITMENT PAGE
Social Attitudes Survey
Instructions:
* In this HIT you will be asked to answer some questions about some societal attitudes.
* You are required to be a resident of the United States of America and a fluent
English speaker in order to participate in this HIT. By a "fluent English speaker," we
mean that you studied English in school and that you have a good understanding of basic
conversational English.
* You are also required to be at least 18 years of age.
* This not a survey for people who live outside the continental United States.
* You can only complete this survey once. If you do it more than once, you will not be
paid for either HIT.
* HITS will be approved or disapproved in a week.
I certify that I am a fluent English speaker residing in the USA and that I am at least 18
years old.
Yes
No (please discontinue)
Please go to this link to participate in this study:
https://survey.lilt.ilstu.edu/TakeSurvey.aspx?SurveyID=n62J5o65
If clicking the link does not take you to the study, you can paste it in a browser and then
ENTER.
After you have finished the survey, you will be given a completion code number.
Please enter the completion code for your survey here ...

58
APPENDIX C
CONDITION PHOTOS USED IN FIRST MINI STUDY
Non-tattooed Male Tattooed Male
Non-tattooed Female Tattooed Female

59
APPENDIX D
SIMULATED INTERVIEW AND INSTRUCTIONS
You are about to begin the first mini study. In this study, you will see a photo of an actual
job candidate and a transcript of his or her interview (name of candidate has been
changed). After the interview, you will be asked to recall information about the candidate
and give feedback regarding his or her qualifications.
Advance to the next screen when you are ready to view the interview.
Q: Hi Jessie. Welcome to Factor Plus! Please tell me about yourself.
A: Thank you Mr. Lee. I am currently a graduate student at St. Louis University. I plan
to graduate in May with a Bachelor‟s degree in Business, and as of now, my GPA is a
3.6.
Q: Very nice, and congratulations! Are you from the St. Louis area?
A: No, actually, I was born in Massachusetts, but my family moved to St. Louis when I
was 12 years old and I‟ve lived there since.
Q: What activities are you involved in at St. Louis University?
A: For the last two years, I‟ve worked as a research assistant to a Doctoral student in
Marketing. In this position, I have helped set up a new participant database and have also
helped administer a number of surveys.
Q: Very nice. Are you involved in any other activities?
A: Yes, I am a member of Alpha Phi Omega, a service fraternity. As Service Chair, I am
responsible for organizing transportation for students from campus to organizations off
campus, such as the Humane Society.
Q: Besides your work with the Doctoral student, do you have any other professional
experience in Marketing?

60
A: Yes, I do; for the last three Summers, I have worked as an office assistant at JP Gibb
& Associates Law Firm. Using Python (the programming language), I helped them
design a new website.
Q: Do you know any other programming languages?
A: I am also competent in Java, which has been useful on numerous school projects.
Q: What did these projects entail?
A: In one project, we had to create a game for grade school students that would be both
educational and fun. I created a chess game with cartoon figures that helped kids work
on their strategy skills.
Q: Jessie, what do you consider to be your greatest strength?
A: When I am working on a project, I tend to work well ahead of schedule. This enables
me to work out any problems ahead of time and be confident in my final product.
Q: What is your greatest weakness?
A: To be honest, I had a difficult time with Calculus during college, but with tutoring
assistance and extra effort, I persevered and completed 2 levels with a B minus average.
Q: How do you handle stress and pressure?
A: I enjoy being busy, and I usually end up doing my best work when I‟m under pressure.
Sometimes, if I‟ve been working too long, I will go for a run or do yoga. I‟m a big
believer in exercise. And sleep!
Q: Describe a difficult work situation or project and how you overcame it.
A: At the law firm I worked at, we once had a key employee suddenly quit. My co-
workers and I had to work as a team to pick up the slack. In the end, we managed to share
her responsibilities until a new person was hired, and I actually learned a lot from the
experience.
Q: So, Jessie, why Factor Plus?
A: I did my research, and Factor Plus continues to be rated as one of the top companies in
Marketing today. Also, my cousin‟s friend has been working for Factor Plus for a few
years, and he told that he really likes his job and Factor Plus‟s positive work
environment.
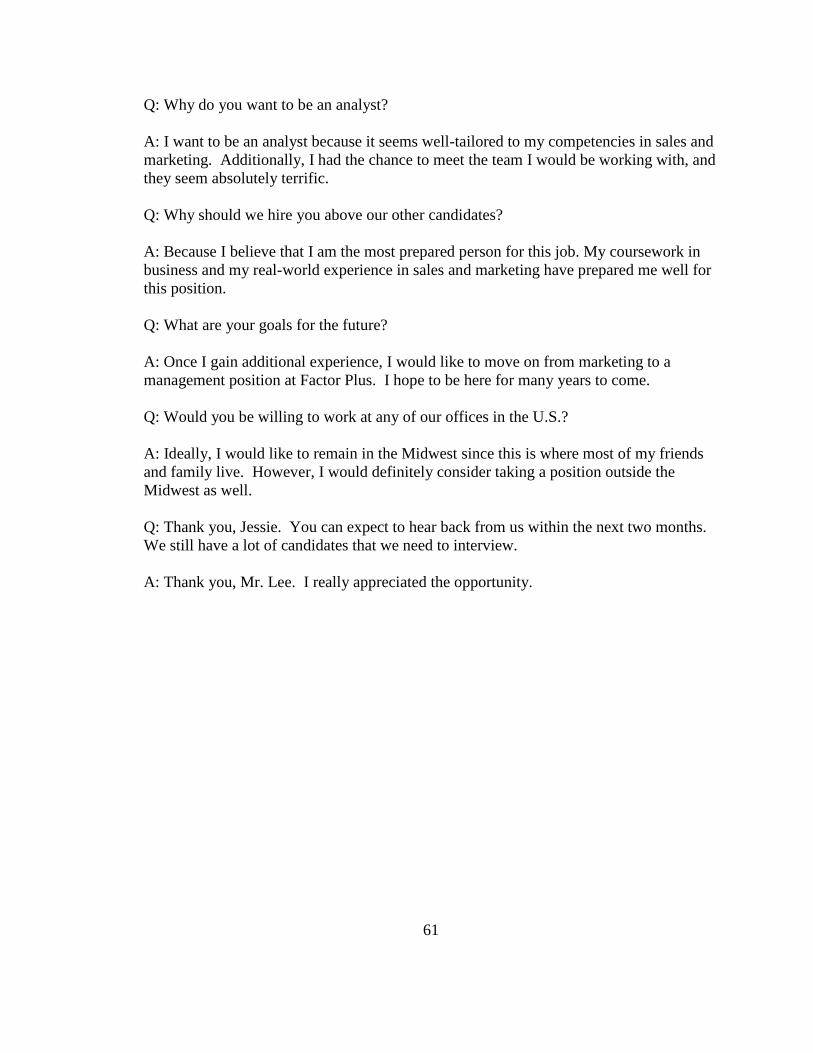
61
Q: Why do you want to be an analyst?
A: I want to be an analyst because it seems well-tailored to my competencies in sales and
marketing. Additionally, I had the chance to meet the team I would be working with, and
they seem absolutely terrific.
Q: Why should we hire you above our other candidates?
A: Because I believe that I am the most prepared person for this job. My coursework in
business and my real-world experience in sales and marketing have prepared me well for
this position.
Q: What are your goals for the future?
A: Once I gain additional experience, I would like to move on from marketing to a
management position at Factor Plus. I hope to be here for many years to come.
Q: Would you be willing to work at any of our offices in the U.S.?
A: Ideally, I would like to remain in the Midwest since this is where most of my friends
and family live. However, I would definitely consider taking a position outside the
Midwest as well.
Q: Thank you, Jessie. You can expect to hear back from us within the next two months.
We still have a lot of candidates that we need to interview.
A: Thank you, Mr. Lee. I really appreciated the opportunity.

62
APPENDIX E
MEMORY TEST AND INSTRUCTIONS
You will now answer some questions regarding the content of the interview. You will
also be asked to give feedback regarding the candidate's qualifications. It is important
that you answer the following questions to the best of your abilities. Please advance to the
next screen when you are ready to begin.
1. Where does Jessie attend university?
a) Indiana University
b) Southern Illinois University
c) St. Louis University
d) University of Illinois
e) University of Massachusetts
f) University of Missouri – St. Louis
g) Washington University in St. Louis
2. What is Jessie‟s major?
Business
Communications
Computer Science
Education
English
Psychology
Marketing
3. What kind of fraternity is Jessie a member of?
A leadership fraternity
A cultural fraternity
A business fraternity
A service fraternity
A pre-law fraternity
An honor‟s fraternity

63
Jessie is not a member of a fraternity
4. What summer job has Jessie held for the last three summers?
Working for a website design company
Working for a grade school organization
Working for the Humane Society
Working as an intern for Factor Plus
Working at a coffee shop
Working for a law firm
Working at a research facility in Massachusetts
5. What programming language(s) does Jessie know?
Python and Java
C++ and Python
C++ and Java
Java only
Python only
C++ only
Python, Java, and C++
6. What is Jessie‟s self-proclaimed greatest strength?
Working ahead of schedule
Calculus
English
Designing websites
Performing research
Maintaining a positive attitude
Communicating effectively
7. Jesse described overcoming a difficult situation. Where did that situation take place?
In a coffee shop
At a law firm
In a research laboratory
At the Humane Society
At a grade school
In a classroom
At home
8. What did Jessie‟s difficult situation involve?

64
Creating a chess game for grade school students
Finding a scholarship to attend college
Transporting students to the Humane Society
Setting up a participant data base
Finding participants for a research study
Covering the work of an employee who suddenly quit
Preparing witnesses for a difficult trial
9. What are Jessie‟s work location preferences?
Jessie would like to travel as much as possible
Jessie would prefer to work in the Midwest
Jessie is only willing to work in the Midwest
Jessie would prefer to work in Massachusetts
Jessie is only willing to work in Massachusetts
Jessie has not thought about work location preference
Jessie would like to work abroad
10. When can Jessie expect to hear back from Factor Plus?
The next day
Within a week
Within the next two weeks
Within a month
Within the next two months
Within the next three months
The interview did not specify

65
APPENDIX F
EFFECTIVENESS EVALUATION ITEMS AND INSTRUCTIONS
Do you agree or disagree?
1. This applicant has strong qualifications.
Strongly disagree
Disagree
Neither agree nor disagree
Agree
Strongly agree
2. This applicant has impressive experiences.
Strongly disagree
Disagree
Neither agree nor disagree
Agree
Strongly agree
3. I am not impressed by this applicant.
Strongly disagree
Disagree
Neither agree nor disagree
Agree
Strongly agree
4. This applicant is not likely to get the job.
Strongly disagree
Disagree
Neither agree nor disagree
Agree
Strongly agree
5. This applicant did a good job in answering the interview questions.
Strongly disagree

66
Disagree
Neither agree nor disagree
Agree
Strongly agree
6. This is an attention check. Please select “Strongly agree.”
Strongly disagree
Disagree
Neither agree nor disagree
Agree
Strongly agree
7. The interviewer was probably impressed with the qualifications of this applicant.
Strongly disagree
Disagree
Neither agree nor disagree
Agree
Strongly agree
8. The applicant seemed like a good match for the job.
Strongly disagree
Disagree
Neither agree nor disagree
Agree
Strongly agree
9. I think the applicant would do well in this job.
Strongly disagree
Disagree
Neither agree nor disagree
Agree
Strongly agree
10. The applicant did not seem to be suited for the job.
Strongly disagree
Disagree
Neither agree nor disagree
Agree
Strongly agree
11. The applicant seemed very professional.
Strongly disagree
Disagree
Neither agree nor disagree

67
Agree
Strongly agree

68
APPENDIX G
AFFECTIVE MISATTRIBUTION PROCEDURE (AMP) EXAMPLE ITEM
Painting (example):
Prompt: “How pleasant or unpleasant was the previous painting?
Answer Options:
very unpleasant
unpleasant
slightly unpleasant
slightly pleasant
pleasant
very pleasant

69
APPENDIX H
EXPLICIT TATTOO ATTITUDE SCALE
Instructions: The following questions concern people's attitudes towards tattooed
individuals. We want to be clear that we are not evaluating you on your responses. We
are simply trying to learn about college students' attitudes towards tattoos. All of your
responses will be kept completely confidential. Please indicate your response using the
scale below.
Directions: The following questions (A-M) require you to use what we
call a FEELING THERMOMETER. The Feeling Thermometer is shown below.
degrees
POSITIVE 100° Extremely favorable feelings
90° Very favorable
80° Quite favorable
70° Fairly favorable
60° Slightly favorable
50° Neither favorable nor unfavorable
40° Slightly unfavorable
30° Fairly unfavorable
20° Quite unfavorable
10° Very unfavorable
NEGATIVE 0° Extremely unfavorable feelings
Using the Feeling Thermometer, please provide a number between 0 and 100 degrees to indicate your feelings about the following groups of people:
your
rating
A. Generally, how do you feel about men with tattoos?
B. Generally, how do you feel about women with tattoos?
C. More specifically, how do you feel about men with neck tattoos?
D. More specifically, how do you feel about women with neck tattoos?
E. More specifically, how do you feel about men with arm tattoos?
F. More specifically, how do you feel about women with arm tattoos?
G. More specifically, how do you feel about men with torso tattoos?
H. More specifically, how do you feel about women with torso tattoos?

70
APPENDIX I
FINAL SURVEY QUESTIONS AND INSTRUCTIONS
1. In the first mini study, was Jessie (the job applicant) male or female?
Male
Female
2. In the first mini study, did Jessie display any of the following features?
Piercings
Facial scar(s)
Tattoos
Missing teeth
None of the above
3. Generally, how do you feel about men with tattoos?
Extremely favorable feelings
Very favorable
Quite favorable
Fairly favorable
Slightly favorable
Neither favorable nor unfavorable
Slightly unfavorable
Fairly unfavorable
Quite unfavorable
Very unfavorable
Extremely unfavorable feelings
4. Generally, how do you feel about women with tattoos?
Extremely favorable feelings
Very favorable
Quite favorable
Fairly favorable
Slightly favorable
Neither favorable nor unfavorable
Slightly unfavorable
Fairly unfavorable
Quite unfavorable

71
Very unfavorable
Extremely unfavorable feelings
5. How many tattoos do you have?
[response options range from 0 to 10+]
6. What is your gender?
Male
Female
No response
7. What is your age?
[response options from 18 to 100+]
8. What is your ethnicity?
African American/Black
Caucasian/White
Asian American/Asian
Indian American
Other, please specify: _____
9. What is your education level?
Some high school
High school degree
Some college
College degree
Some graduate school
Graduate degree
Ph.D