Embed Size (px)
Citation preview

Dis cus si on Paper No. 15-082
Tax Competition in Europe – Europe in Competition
with Other World Regions? Frank Streif

Dis cus si on Paper No. 15-082
Tax Competition in Europe – Europe in Competition
with Other World Regions? Frank Streif
Download this ZEW Discussion Paper from our ftp server:
http://ftp.zew.de/pub/zew-docs/dp/dp15082.pdf
Die Dis cus si on Pape rs die nen einer mög lichst schnel len Ver brei tung von neue ren For schungs arbei ten des ZEW. Die Bei trä ge lie gen in allei ni ger Ver ant wor tung
der Auto ren und stel len nicht not wen di ger wei se die Mei nung des ZEW dar.
Dis cus si on Papers are inten ded to make results of ZEW research prompt ly avai la ble to other eco no mists in order to encou ra ge dis cus si on and sug gesti ons for revi si ons. The aut hors are sole ly
respon si ble for the con tents which do not neces sa ri ly repre sent the opi ni on of the ZEW.
Tax Competition in Europe -
Europe in competition with other world regions?
Frank Streif∗
(ZEW Mannheim and University of Mannheim)
This version: 16 November 2015
Abstract
Corporate tax levels have fallen substantially in Europe during the last decades.
A broad literature has identified tax competition as one reason for this decline in
corporate tax levels. However, none of these studies explicitly asks the question
whether tax competition within regions is different from tax competition across re-
gions, e.g. due to global regionalism of foreign direct investments. This is a crucial
question to answer in order to discuss the desirability of tax harmonization in a
distinct region, for example, within the European Union. Therefore, the study aims
to give hints on the question whether the decline in corporate tax levels in Europe
is mainly driven by tax competition between EU member states or by pressure from
other world regions. The results of this study, which makes use of tax reaction func-
tions, indicate that there is evidence for tax competition within Europe, whereas
there is no robust evidence that European countries compete with countries from
other world regions.
JEL Classification Code: H2, H77, H87
Keywords: corporate taxes, tax competition, tax harmonization, Europe
∗Address of correspondence: Frank Streif, Department for Corporate Taxation and Public Finance,ZEW Mannheim, L7 1, 68161 Mannheim, Germany, +49 621 1235 398, [email protected]
The author would like to thank Zareh Asatryan, Benjamin Bittschi, Sebastian Blesse, Friedrich Heine-mann, Thorsten Martin, Christoph Spengel, Robert Ullmann and Johannes Voget for valuable comments,as well as Julian Lutz and Anja Schulz for excellent research assistance.

1 Introduction
Corporate tax levels have fallen substantially in Europe during the last decades. In
Germany, the effective average tax rate (EATR) has fallen from 45.82% in 1990 to 28.40%
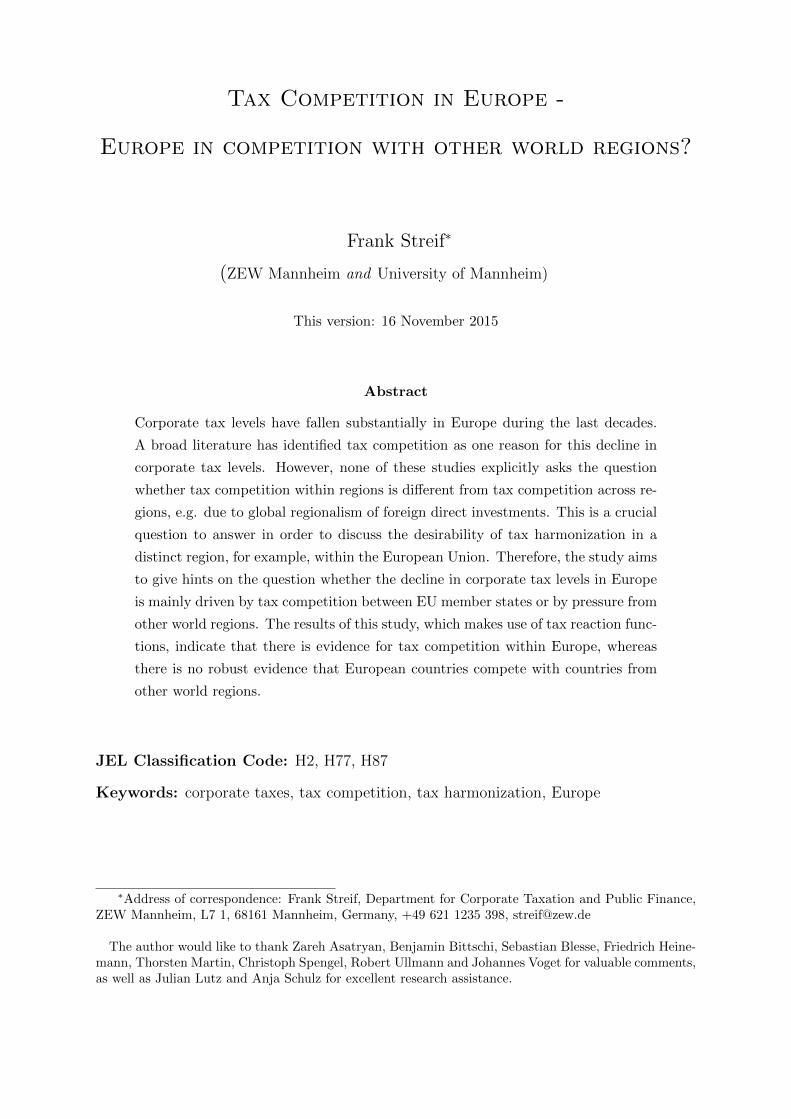
in 2013. Figure 1 shows the development of the average EATRs for four world regions
which are covered in this study (Latin America, Europe, Asia-Pacific and North America).
The development of the corporate effective tax levels in Europe appears most remarkable.
The average European EATR has fallen substantially from approximately 30% in 1996
to approximately 20% in 2012 (see Figure 1). The downward trend in taxation levels
in Europe is steady over time, however, the decline pre 2005 is more distinct than post
2005. Unlike other regions, the average EATR in Latin America has risen slightly over
the period from 1996 to 2012. In North America and in the Asia-Pacific region the
average EATR has fallen, however, less dramatically than in Europe. There is a broad
literature which stipulates that the global decline in corporate tax levels is due to tax
competition. However, none of these studies explicitly asks the question whether tax
competition within regions is different from tax competition across regions. This is a
crucial question to answer in order to discuss the desirability of tax harmonization in
a distinct region, for example, in the European Union. Therefore, this study aims to
answer the following question: Is the decline in corporate tax levels in Europe mainly
driven by tax competition between EU member states or is it (also) due to pressure from
other world regions?
The investigation of this question deserves special attention for at least the following
reason: The desirability of tax harmonization within the EU is linked to the relationship
of the EU with third countries and other world regions. In a globalized world, tax
competition might not stop at the European border. Tax harmonization would possibly
reduce tax pressure within Europe, however, the pressure from outside would not vanish
if it exists. By harmonizing their tax systems, member states might lose their flexibility
to react to tax changes in countries from other world regions. Schon (2003, p. 28)
2

describes this as the member states putting themselves into a “straitjacket”. On the
other hand, Schon (2003) remarks that the existence of other economic areas could make
harmonization within Europe even more necessary in order to reduce transaction and
compliance cost within Europe, and make Europe as a whole, more competitive compared
to other world regions. Due to pressure from outside Europe, the positive effects of tax
competition (e.g. disciplining public budgets) would still apply in a harmonized system.
Complementary to this reasoning, Sørensen (2004) sets up a general equilibrium model in
which he distinguishes between global and regional tax coordination. He makes the point,
that regional tax coordination might not be desirable when considering third countries.
Therefore, the first contribution of this paper is, to analyze the extent of tax competition
within Europe on the one hand, and between Europe and other world regions on the
other hand.
Empirically, the paper follows the classical spatial econometrics approach applied in
the public finance literature. I specify a dynamic panel data model, which is the second
contribution of this paper to the international tax competition literature that has mostly
applied static models thus far. The recent literature on local government interactions
shows that applying the standard instruments in tax reaction functions, might not isolate
possible common shocks or spatially correlated (unobservable) effects from the real effects
of interest and can therefore overestimate the strength of strategic interactions (see, e.g.
Baskaran, 2014, 2015; Isen, 2014; Lyytikainen, 2012). In the analysis, I will carefully take
these new insights into account when interpreting the results.
2 Background and Literature
Foreign Direct Investment in the Context of Regional Economic Blocs
There are reasons why tax competition between countries of the same regional bloc
might be more intense than between countries of different regional blocs.1 If trade costs
1 Regional blocs can be distinct from each other for several reasons: Firstly, distance between coun-tries of the same regional bloc is often smaller than across blocs. Secondly, cultural barriers within
3
Figure 1: Development of Effective Average Tax Rates (EATRs)
2025
3035
40E
AT
R in
%
1995 2000 2005 2010 2015Year
Latin America Asia-PacficEurope North America
within the bloc are low, this may induce countries within the bloc to compete for FDI
more strongly than with countries outside the bloc. This in turn can be reflected in the
tax setting behavior of the governments when corporate taxes are not coordinated or
harmonized. The FDI literature shows that a multinational firm from outside a region
needs to decide to either produce (i) in each country of the region, (ii) produce in one
country within the region and use that location as export-platform, or (iii) export its
products from its home market (third country). Likewise, companies from within the
region need to decide where to locate most efficiently. Decisive factors for this can be
trade costs and barriers to FDI within and across regional blocs.
The effects of global regionalism and economic integration on the choice between ex-
porting and FDI have been analyzed in theoretical papers: Motta and Norman (1996)
emphasize the relevance and impact that regional blocs have on firms. They show that
a regional bloc are likely to be smaller and consumer preferences to be more similar. And thirdly,countries within a region are likely to have both bilateral trade treaties and free trade area agree-ments. Also see Motta and Norman (1996) for the term “regional bloc”.
4

economic integration within a bloc causes outside firms to invest in the regional bloc.
Crucially, firms do not invest equally in each country of the bloc but make use of “intra-
regional export platform FDI, with the investing firm supplying the majority of the
countries in the regional bloc by intra-regional export” (Motta and Norman, 1996, p.
775). In addition to this “third country” perspective, Motta and Norman (1996) point
out that FDI activity of inside firms might actually decrease, since they will choose intra-
regional exports instead of dispersed FDI when intra-regional trade costs are sufficiently
low. Both these effects intensify tax competition between countries within the regional
bloc: Firstly, inside countries have an incentive to compete for the (additional) FDI at-
tracted by the economically integrated area from third countries, and secondly, the less
diversified within-bloc FDI makes inside countries compete more intensively for FDI than
they would in less integrated areas. Analogous implications occur when considering the
theoretical FDI papers from Rowthorn (1992), Motta (1992) and Smith (1987).2 This
competition might be reflected in the tax setting behavior of states.
Closely related to the general term “regional bloc” are free-trade areas. In this context,
Ekholm et al. (2007) analyze the possibility of export-platform foreign direct investment
and show that a free trade area can give incentives to multinationals to invest in that
area. Crucially, multinationals would only invest in one of the countries in the free-trade
area, and serve the whole market within the free-trade area by exports. In line with
the theoretical studies, there is strong empirical evidence that free-trade areas attract
investments from third countries and that multinationals choose one country within the
area as an export-platform; see, e.g. Ekholm et al. (2007) for US multinationals’ invest-
ment in NAFTA and the EU3, Blonigen et al. (2007) for US multinationals’ investment
2 Rowthorn (1992) analyzes intra-industry trade and investment under oligopoly and emphasizes therole of market size and trade barriers between countries. Motta (1992) and Smith (1987) modelfirms’ choice between direct investment and exporting.
3 They show that US affiliates in free-trade areas (EU and NAFTA) mainly export within the free-trade area. The paper finds that it is not so much about countries’ membership in NAFTA andthe EU, respectively, but more about countries belonging to the same geographical area. Theyargue that this is likely due to “North American and European locations [constituting] relativelyintegrated markets independent of the formation of formal free-trade areas through NAFTA andthe EU” (Ekholm et al., 2007, p. 789).
5

in the EU, and Blomstrom and Kokko (1997) for investments in CUSFTA. These studies
confirm empirically Motta and Norman’s theory-based hypothesis of higher FDI inflows
from third countries into regional blocs and less intra-bloc FDI.
With respect to Europe, there is reliable evidence that regional integration has affected
FDI and trade flows within and into Europe. Pain (1997), for example, finds that U.K.
direct investments into other EU countries have been stimulated by the internal market
programme. Crucially, he also identifies some U.K. firms to have diverted their invest-
ments from the United States into the EU. This adds an additional aspect and provides
micro-level evidence that regional economic blocs do not function independently to third
countries.4 Similarly, Baltagi et al. (2008) argue that the European Agreements on trade
liberalization did not only affect trade flows but also FDI. They emphasize the interde-
pendence of allocation decisions and conclude that “a sizable stimulus of investment in
one country or region eventually causes a reduction of investment in other countries or
regions” (Baltagi et al., 2008, p. 195).
Tax Competition
There are two papers which explicitly draw the relationship between regional economic
integration, FDI flows and tax interactions. Raff (2004) shows theoretically that FDI is
likely to increase in an integrated region and that countries within that region might have
an incentive to attract FDI from the rest of the world by a favorable tax environment.
The setting reflects the real world where trade within geographical regional blocs is likely
to be less costly than across regions, however, at the same time, tax policies within regions
are hardly harmonized.
Redoano (2014) connects to this reasoning and is closely related to this paper as it
also focuses on the European context. Her main hypothesis argues that “the lower cost
of cross-border FDI between EU member countries, on the one hand, and the lack of
tax harmonization programs between members, on the other hand, should cause EU
countries to compete more intensively for FDI amongst themselves than with countries
4 Baldwin et al. (1995) also detect investment diversion in the European context.
6

outside the EU” (Redoano, 2014, p. 354). Empirically, the hypothesis of more intense
tax competition within the EU is confirmed on the basis of a Western European data set.
This paper goes one step further and analyzes how far tax competition within Europe
and between Europe and the rest of the world differs. I closely relate to the empirical
literature which attempts to identify strategic interactions among countries by using tax
reaction functions.5 Devereux et al. (2008) analyse for 21 OECD countries if they compete
with respect to their corporate taxes. They find compelling evidence for international
tax competition in statutory tax rates. States also seem to interact with respect to
the effective tax rates. Although evidence for this is weak. The study does not show
whether the results are driven by certain country constellations, or country clusters and
is therefore unable to address the research questions posed by this paper. Furthermore,
Egger and Raff (2014) develop a theoretical model which allows for two dimensions of
interactions, i.e. interaction in tax rates and tax bases. In their empirical contribution,
they show that observed changes in countries’ tax rates and bases are a consequence of
increased regional trade integration.
In the European context, Crabbe (2013) shows by means of tax reaction functions that
EU15 member states which are geographically close to the new Eastern European member
states, react more strongly to the new member states’ tax levels than more remote EU15
countries do. Similarly, Davies and Voget (2008) conclude that the extension of the
EU has intensified tax competition. However, these studies do not answer the question
whether EU states compete with other world regions. A recent study by Altshuler and
Goodspeed (2015) is related to the research question of this paper, as it poses the question
whether the US acts as a Stackelberg leader for the European countries. However, their
5 Besides the empirical studies, the theoretical strand of the existing tax competition literature triesto identify conditions under which different possible consequences of tax competition occur (forexample a race to the bottom); see, e.g. Zodrow and Mieszkowski (1986), Gordon (1986), Razinand Sadka (1991) and Zodrow (2006). Other papers determine theoretically, in which dimension(e.g. statutory tax rates) countries compete with each other; see, e.g. Haufler and Schjelderup(2000), Devereux et al. (2008), Fuest and Hemmelgarn (2005) and Becker and Fuest (2011).
Descriptive studies have shown how various tax parameters have developed over the last centuries.See, e.g. Elschner et al. (2011), Devereux et al. (2002), Gorter and de Mooij (2001) and Devereux(2007).
7

measure for taxation, corporate tax revenues divided by GDP, is vulnerable to cyclical
effects within and/or across regions and only an indirect measure for effective average tax
rates. A further study by Overesch and Rincke (2011) also finds strong (weak) evidence
for competition in statutory tax rates (effective average tax rates) in Europe. Given that
the data only consists of European countries, the paper cannot address the questions
raised in this paper, i.e. how far tax competition within Europe and between Europe and
the rest of the world differs.
3 Empirical Methodology
The tax competition literature referred to in section 2 makes use of tax reaction functions
to detect strategic interaction among countries. Tax reaction functions assume that a
country’s level of corporate taxes is a function of the level of corporate taxes in the
other countries. Theoretically, it is possible that country i reacts differently to all other
countries. However, most of the literature that uses tax reaction functions makes the
assumption that country i reacts to the average level of corporate taxes of all other
countries. This assumption is mainly due to data limitations, since in the case of country
specific response possibilities the number of coefficients to be estimated would equal the
number of countries. That would not be a feasible estimation strategy. The literature
has solved this problem by building an average of the tax levels of all other countries
and making an ex-ante choice about the weighting of the elements in this average. Thus,
the variable of interest is the weighted average tax level of all other countries (excluding
country i) which is called “spatial lag”. In this case, only one coefficient is estimated
which then captures how country i reacts to the average tax rate of all other countries.6
In my paper, I use specifications which allow for more than one average in order to detect
country constellations and regions which drive the results.
6 E.g., Devereux et al. (2008) use one average when testing whether or not there is international taxcompetition.
8

With respect to the weighting scheme, there have been different approaches in the
literature, for example theory-based weights like GDP or trade flows. However, these
weighting variables might be related to the corporate tax levels themselves and there-
fore be endogenous. Recently, Klemm and Parys (2012) have used uniform weights and
Redoano (2014) distance weights which circumvent the additional endogeneity problem
which other weighting schemes cause. I choose to use both uniform and distance weights
in all specifications which constitutes a first robustness test for the results.7
Besides the average taxes of the other countries, the tax level of a country might also
be determined by its own tax level in the previous period, since countries face adjustment
costs when changing their effective average tax rate (EATR). Consequently, the EATR
adjusts only gradually when exogenous factors change and does not jump into a new
equilibrium instantly. Therefore, I specify a dynamic model with the lagged dependent
variable as an explanatory variable. Dynamic models have been applied in similar cir-
cumstances before, for example by Cassette et al. (2012) in a local taxation context or
by Foucault et al. (2008) in the context of public spending interactions in French mu-
nicipalities, but not yet so much by studies testing worldwide tax competition.8 The
results of this paper show that a government’s choice on its country’s EATR is highly
path-dependent.
In the specification, the EATR of country i = 1, ..., N at time t = 1, ..., T is denoted
by τit where N is the number of countries and T represents the number of time periods.
The tax reaction function of state i can be written as (baseline specification):
τit = γτit−1 + δ
N∑j 6=i
wijτjt + Xitβ + ρtr + αi + εit (1)
7 As distance measure I use simple geodesic distances provided by the research institute CEPII. I usethe inverse distance as weight and row normalize the weights to one.
8 Devereux et al. (2008) and Davies and Voget (2008) apply static models.
9
where αi is a country-specific fixed effect, ρtr represents a regional linear time trend and
εit is an error term.9
The EATR of country i is a function of the average EATR of the other countries,
which is represented by the spatial lag term∑N
j 6=iwijτjt where wij is the weight with
which the EATR of country j (τjt) goes into the average EATR of the other countries.
Xit represents a vector of time varying control variables that are expected to influence the
EATR and represent sensible controls in order to make the variable of interest (spatial
lag) uncorrelated with the error term.
The dynamic nature of the specification imposes (internal) validity problems. In an
ordinary OLS regression, the country-fixed effect in the error term causes the lagged
dependent variable to be upward biased. The problem of endogeneity does not vanish
when using fixed- or random-effects OLS estimations (Nickell, 1981). Dynamic panel data
estimators tackle this problem by constructing first differenced regression equations. The
error term and the first differenced lagged dependent variable are still correlated in such
specifications, however, this can be circumvented by instrumenting the difference of the
lagged dependent variable by lags of its levels (or differences).
With tax reaction functions, there is a second major endogeneity concern: the spatial
lag is endogenous by assumption because tax reaction functions explicitly accommodate
that countries interact with each other. Thus, the error term of country i is correlated
with the spatial lag because country i itself has an influence on the tax setting behavior
of the other countries. Previous literature deals with this problem by instrumenting
the spatial lag by the (weighted) average of the covariates of all other countries (i.e. the
countries contained in the spatial lag). These covariates qualify as instruments as they are
9 In the main specifications I do not include time dummies due to their high multicollinearity withthe spatial lag (see, e.g. Elhorst, 2010; Klemm and Parys, 2012; Devereux et al., 2008). However,I use regional linear time trends for four world regions to allow for unobserved factors to vary overtime.
10

uncorrelated with the error term of country i but are correlated with the other countries’
tax levels.10
Both endogeneity problems described above can be tackled efficiently by system GMM
estimation as proposed by Blundell and Bond (1998) and recently applied in the context
of tax reaction functions by Klemm and Parys (2012).11 System GMM uses lagged levels
for instrumenting current differences and lagged differences for instrumenting current
levels. Beside the benefit of using internal instruments, it is also possible to include
additional (exogenous) variables as instruments which are not part of the second stage
regression specification. This is useful for the setting in this paper in order to use the
covariates of the other countries to instrument the spatial lag.12 In the international tax
setting context at hand, system GMM has the additional benefit that it can deal with the
only modest adjustments in effective tax levels in some countries by taking into account
interactions in levels as well as in first differences.
With respect to the assumptions of system GMM, the Hansen J test of overidentifying
restrictions allows to check whether the instruments are correlated with the residuals. The
null hypothesis that there is no correlation between instruments and residuals cannot be
rejected for any of the regressions conducted in the analysis. Furthermore, the Arellano
and Bond (1991) statistics on the first and second order autocorrelation of the first-
differenced residuals is employed. The second order correlation is relevant since the model
is specified in first differences and the autocorrelation in levels needs to be checked.13
10 The covariates of the other countries are averaged by the same weighting scheme which applies tothe spatial lag. This approach is also chosen by, for example, Devereux et al. (2008), Davies andVoget (2008), Klemm and Parys (2012) and Redoano (2014).
11 Furthermore, Madariaga and Poncet (2007) apply this method in the context of FDI spillovers andFoucault et al. (2008) in the context of public spending interactions. Similarly, Cassette et al. (2012)use difference GMM for analyzing local tax competition.
12 I restrict the number of instruments by only using one lag in order to keep the number of instrumentsmanageable as suggested by Roodman (2009, p. 124). This lag specification applies to all regressionsin the paper. The robust option is used in order to produce results robust to heteroskedasticity and“arbitrary patterns of autocorrelation” within countries Roodman (2009, p. 123).
13 The null hypothesis of no autocorrelation cannot be rejected at the 5% significance level for thebaseline results (Table 1) except for one regression.
11

4 Data
Country coverage
The (balanced) panel data set of this paper covers 44 countries over the period 1996
to 2012. The data set consists of four world regions, namely Europe, North America,
Latin America and the Asia-Pacific region. Naturally, the European region makes up
for the majority of the 44 countries.14 For competition in FDI the effective average tax
rate (EATR) is the relevant measure as argued by Devereux and Griffith (1998, p. 337)
and Devereux and Griffith (2003). Besides statutory tax rates, EATRs also take into
account depreciation methods for assets and the valuation method for inventories. This
is important to measure when governments do not only interact with respect to statutory
tax rates, but also use favorable depreciation schemes to become more attractive for
FDI.15
Development of Effective Average Tax Rates
The dynamics related to the EU enlargement in 2004 deserve special attention. The
data shows that the average EATR in Europe has decreased significantly from 1996 to
2012 (Figure 1 in section 1 and Table A8 in the appendix). More precisely, the mean
EATR of the EU28 has fallen from 29.5% in 1996 to 20.4% in 2012. However, there
are substantial differences between the old (EU15) and the new member states (EU13).
Throughout time, the mean EATR of the EU15 was higher than the one of the EU13.
Additionally, the dynamics of the EATRs were different between the two groups. The
new member states lowered their mean EATR drastically until 2004 (year of entry into
the EU for the EU10). Afterwards, they kept decreasing their tax rates, however, the
downward pace became considerably slower. In contrast, the old member states lowered
their mean EATR during the pre-enlargement period less drastically but then slightly
increased their downward movement after the enlargement. Empirical studies show that
14 Table A6 and A7 in the appendix provide information on the countries covered.15 Section 7.2.1 in the appendix explains the data sources and computation assumptions.
12
the EU extension might have played a causal role for the observed dynamics (Davies and
Voget, 2008; Crabbe, 2013). I will take this into account in the analysis
Control Variables
For the empirical analysis, I merge the EATR data with a set of time varying control
variables Xit. Government consumption expenditure (Gov′t Consumptionit) is supposed
to reflect the need of a government (or society) to generate tax revenues in order to serve
its preferences for the provision of public goods and redistributive policies. In addition, I
include demographic variables which might have an effect on the tax setting behavior of
states, i.e. the share of people living in urban areas (Urbanit) and the share of dependents
as percent of the working-age population (Dependencyit).
To capture the openness of an economy, I borrow a measure used by Overesch and
Rincke (2011); it is computed by summing up a country’s imports and exports and
dividing it by its GDP (Opennessit). The effect of this openness measure is ambiguous,
since, first, the (un-)openness of an economy shows if a government tries to attract foreign
FDI altogether and, second, high trade volumes can also indicate that multinationals find
it more attractive to serve the market by imports rather than by direct investments as
argued in section 2. To control for the size of an economy and thus for its possible market
power, the GDP (GDPit) of the respective country is included. Table A5 in the appendix
provides descriptive statistics for these covariates and the EATR.
5 Results
5.1 Main Results
Global Tax Competition
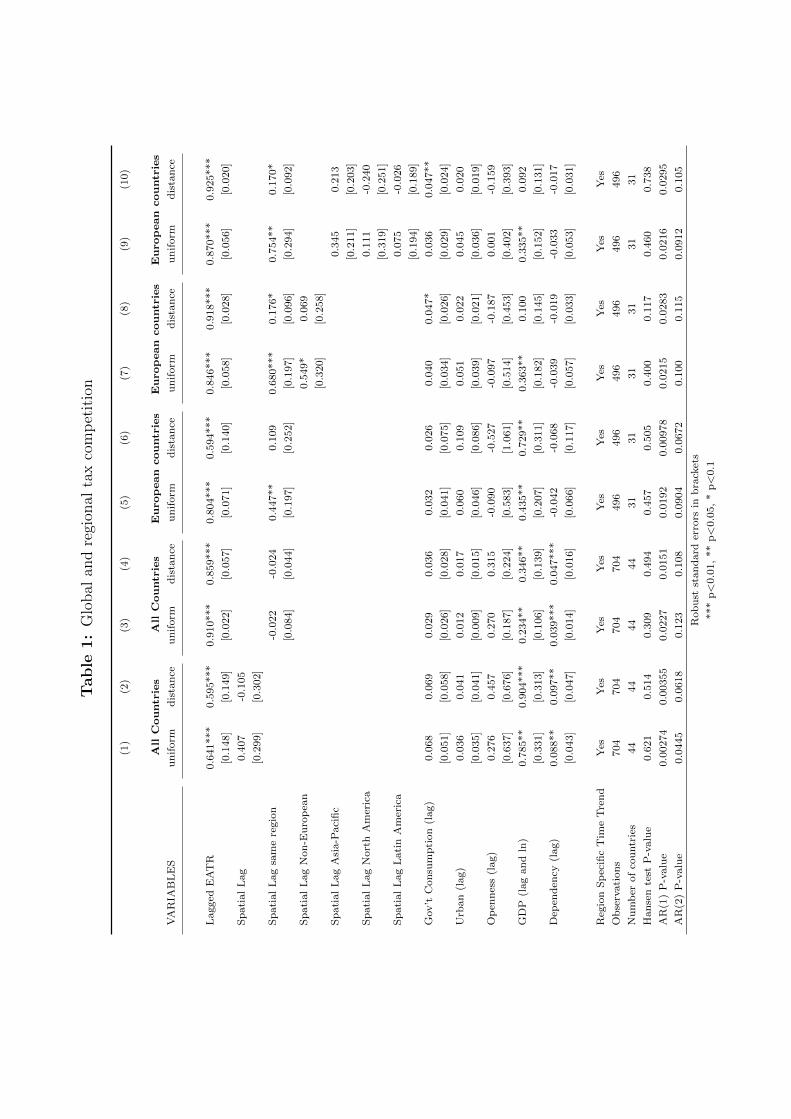
The first specification reflects the presented baseline regression in section 3, i.e. the
EATR of country i is explained by the weighted average EATR of all other countries.
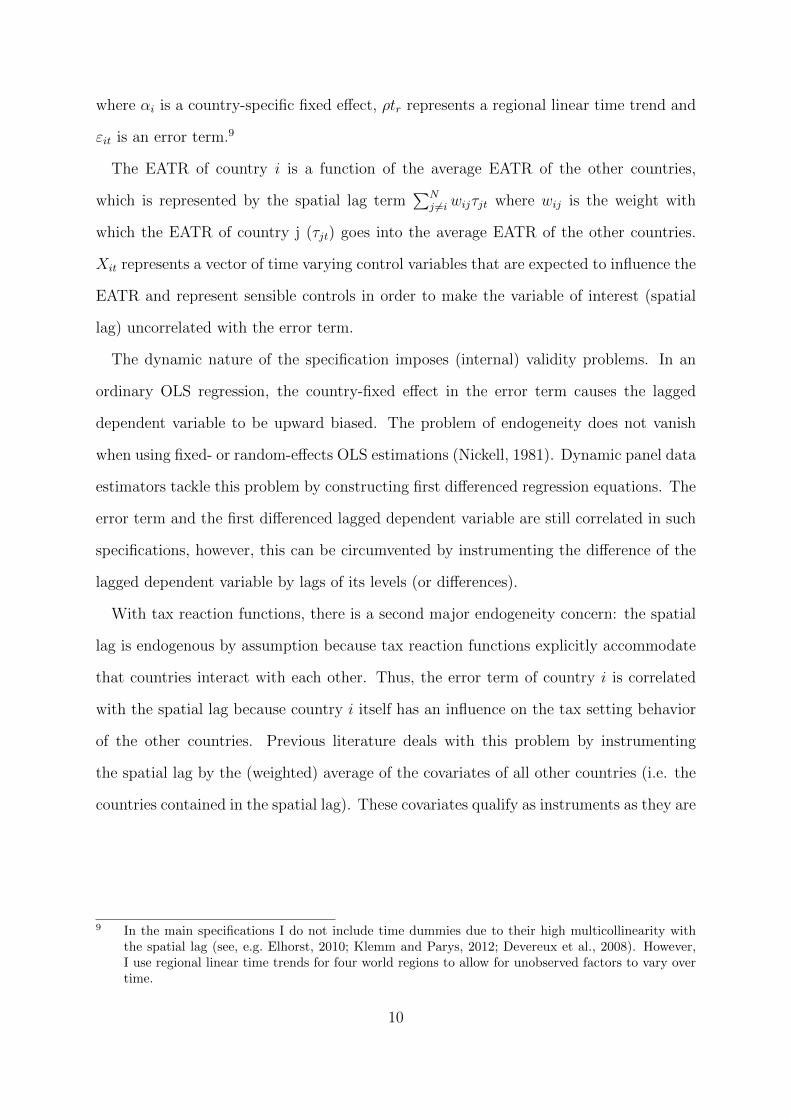
The results in column 1 (uniform weighting) and 2 (distance weighting) of Table 1 show
13

no evidence for international tax competition. The single spatial lag is neither significant
for the uniform weights nor for the distance weights. This contributes to an already am-
biguous literature in which some papers find evidence for international tax competition
in a single spatial lag framework using an international data set (e.g., Devereux et al.,
2008) and some papers do not (Davies and Voget, 2008, p. 26 columns 2 and 3). The
assumption that states adjust their tax parameters only gradually towards a new equilib-
rium is confirmed by the high and significant coefficient of the lagged dependent variable
in Table 1.
The main result, namely that the spatial lag is not positively significant, raises the
questions if this also holds when I refine my approach and look at more regional tax
competition. It is conceivable that the last result is not so much a sign of non-existence
of tax competition between countries but more a sign for tax competition taking place
rather within regional blocs than across regions as argued in the theoretical part of this
paper. This can be due to export-platform strategies which are more likely to play a role
within regions than across regions.
Regional Tax Competition
In the following, I take regional tax competition aspects into consideration by regressing
the EATR of country i on the weighted average EATR of the other countries in the region
of country i. The analysis provides no evidence for the existence of general tax competition
within regions (column 3 and 4 of Table 1). Both the spatial lag of the uniform and the
distance specification are not significant at the 10% significance level. This result is
relatively remarkable given that European countries make up the majority of the sample.
However, when dropping the non-European observations and reducing the sample size,
the spatial lag turns significantly positive in the uniform specification (column 5 and 6 in
Table 1). This indication of tax competition within Europe is confirmed in the subsequent
specifications (column 7-10 in Table 1) and is in line with the literature. However, the
details are different: Overesch and Rincke (2011) find evidence for tax competition within
14
Table
1:
Glo
bal
and
regi
onal
tax
com
pet
itio
n
(1)
(2)
(3)
(4)
(5)
(6)
(7)
(8)
(9)
(10)
All
Countries
All
Countries
European
countries
European
countries
European
countries
VA
RIA
BL
ES
un
iform
dis
tan
ceu
nif
orm
dis
tan
ceu
nif
orm
dis
tan
ceu
nif
orm
dis
tan
ceu
nif
orm
dis
tan
ce
Lagged
EA
TR
0.6
41***
0.5
95***
0.9
10***
0.8
59***
0.8
04***
0.5
94***
0.8
46***
0.9
18***
0.8
70***
0.9
25***
[0.1
48]
[0.1
49]
[0.0
22]
[0.0
57]
[0.0
71]
[0.1
40]
[0.0
58]
[0.0
28]
[0.0
56]
[0.0
20]
Sp
ati
al
Lag
0.4
07
-0.1
05
[0.2
99]
[0.3
02]
Sp
ati
al
Lag
sam
ere
gio
n-0
.022
-0.0
24
0.4
47**
0.1
09
0.6
80***
0.1
76*
0.7
54**
0.1
70*
[0.0
84]
[0.0
44]
[0.1
97]
[0.2
52]
[0.1
97]
[0.0
96]
[0.2
94]
[0.0
92]
Sp
ati
al
Lag
Non
-Eu
rop
ean
0.5
49*
0.0
69
[0.3
20]
[0.2
58]
Sp
ati
al
Lag
Asi
a-P
aci
fic
0.3
45
0.2
13
[0.2
11]
[0.2
03]
Sp
ati
al
Lag
Nort
hA
mer
ica
0.1
11
-0.2
40
[0.3
19]
[0.2
51]
Sp
ati
al
Lag
Lati
nA
mer
ica
0.0
75
-0.0
26
[0.1
94]
[0.1
89]
Gov’t
Con
sum
pti
on
(lag)
0.0
68
0.0
69
0.0
29
0.0
36
0.0
32
0.0
26
0.0
40
0.0
47*
0.0
36
0.0
47**
[0.0
51]
[0.0
58]
[0.0
26]
[0.0
28]
[0.0
41]
[0.0
75]
[0.0
34]
[0.0
26]
[0.0
29]
[0.0
24]
Urb
an
(lag)
0.0
36
0.0
41
0.0
12
0.0
17
0.0
60
0.1
09
0.0
51
0.0
22
0.0
45
0.0
20
[0.0
35]
[0.0
41]
[0.0
09]
[0.0
15]
[0.0
46]
[0.0
86]
[0.0
39]
[0.0
21]
[0.0
36]
[0.0
19]
Op
enn
ess
(lag)
0.2
76
0.4
57
0.2
70
0.3
15
-0.0
90
-0.5
27
-0.0
97
-0.1
87
0.0
01
-0.1
59
[0.6
37]
[0.6
76]
[0.1
87]
[0.2
24]
[0.5
83]
[1.0
61]
[0.5
14]
[0.4
53]
[0.4
02]
[0.3
93]
GD
P(l
ag
an
dln
)0.7
85**
0.9
04***
0.2
34**
0.3
46**
0.4
35**
0.7
29**
0.3
63**
0.1
00
0.3
35**
0.0
92
[0.3
31]
[0.3
13]
[0.1
06]
[0.1
39]
[0.2
07]
[0.3
11]
[0.1
82]
[0.1
45]
[0.1
52]
[0.1
31]
Dep
end
ency
(lag)
0.0
88**
0.0
97**
0.0
39***
0.0
47***
-0.0
42
-0.0
68
-0.0
39
-0.0
19
-0.0
33
-0.0
17
[0.0
43]
[0.0
47]
[0.0
14]
[0.0
16]
[0.0
66]
[0.1
17]
[0.0
57]
[0.0
33]
[0.0
53]
[0.0
31]
Reg
ion
Sp
ecifi
cT
ime
Tre
nd
Yes
Yes
Yes
Yes
Yes
Yes
Yes
Yes
Yes
Yes
Ob
serv
ati
on
s704
704
704
704
496
496
496
496
496
496
Nu
mb
erof
cou
ntr
ies
44
44
44
44
31
31
31
31
31
31
Han
sen
test
P-v
alu
e0.6
21
0.5
14
0.3
09
0.4
94
0.4
57
0.5
05
0.4
00
0.1
17
0.4
60
0.7
38
AR
(1)
P-v
alu
e0.0
0274
0.0
0355
0.0
227
0.0
151
0.0
192
0.0
0978
0.0
215
0.0
283
0.0
216
0.0
295
AR
(2)
P-v
alu
e0.0
445
0.0
618
0.1
23
0.1
08
0.0
904
0.0
672
0.1
00
0.1
15
0.0
912
0.1
05
Rob
ust
stan
dard
erro
rsin
bra
cket
s
***
p<
0.0
1,
**
p<
0.0
5,
*p<
0.1

Europe, however, only with respect to statutory tax rates.16 Davies and Voget (2008)
also find evidence for tax competition within Europe when looking at the EATR. They
use a static model whereas this study confirms the result by means of a dynamic model.
Redoano (2014) also shows that there is European tax competition.
Tax Competition in Europe - Europe in Competition with other World
Regions?
For tax policy in Europe, the question of European tax competition is important. For
the desirability and the design of tax coordination or harmonization, however, it is also
very relevant whether or not there is evidence that European countries react to effective
tax levels of non-European countries. The answer to this question plays a significant role
in the discussion on the advantages and disadvantages of tax harmonization as argued in
the introduction. Full harmonization of corporate taxation in the EU could eventually
put member states into a “straitjacket” which would prevent them from flexibly reacting
to tax pressure from other world regions if such pressure exists (Schon, 2003, p. 28).17
The regressions in column 7 and 8 of Table 1 address this question. The EATR of the
European countries is regressed on the (weighted) average EATR of the other European
countries and the (weighted) average EATR of all non-European countries. Consistent
with the previous result, the European spatial lag (“Spatial lag same region”) is now even
more positive and statistically significant for both types of weighting schemes. However,
evidence for the relevance of the effective tax levels of the non-European countries is
weak. The spatial lag for the non-European countries is only significant at the 10%
significance level for the uniform weights and not significant at all for the distance weights.
When refining this approach and splitting the non-European spatial lag into its regional
components, evidence for tax pressure from other world regions on the European countries
16 They also test for competition in EMTRs and EATRs but find no robust evidence in these cases.Potentially, this could be due to the fact that they address the endogeneity of their dynamic spec-ification by using OLS fixed effects which does not fully solve the endogeneity problem caused bythe lagged dependent variable.
17 For a thorough discussion on this and related arguments please see Schon (2003).
16

vanishes altogether. Neither the spatial lag for North America, Latin America nor the
Asian-Pacific region shows any statistically significant effect. This result can be seen
as a confirmation of the FDI papers on economic integration and export-platform FDI.
They suggest that economic integration leads to tougher competition for FDI within the
integrated area whereas it is theoretically not clear if competition between regional blocs
intensifies. In general, the result is in line with Redoano (2014, p. 354) who stipulates
that “EU countries compete more intensively for FDI amongst themselves than with
countries outside the EU”. Overall, it can be cautionary concluded that there does not
seem to be evidence for tax pressure on European countries from other world regions.
Instead, the fall in effective tax rates in Europe can be attributed to tax competition
within Europe.
5.2 Robustness
Throughout the paper I apply both uniform and distance weights. Both circumvent any
additional endogeneity problem which might occur when using weights like trade or FDI
flows. The uniform weighting scheme is useful in this paper, since I run intra-regional
regressions where distance is likely to play a smaller role than between different regional
blocs (Klemm and Parys, 2012). The results presented do not show much sensitivity to the
respective weighting scheme. All main conclusions hold for both regression specifications.
In the following, I run additional robustness checks with respect to time effects and the
construction of regional blocs. Additionally, the results are extended to European tax
competition considerations.
Construction of Regional Blocs
The FDI literature analyzing export-platform strategies and countries’ competition for
FDI looks at both “free-trade areas” and “regional blocs”, the latter being a more general
concept of an integrated economic area. Free-trade areas often constitute an integrated
economic area before the formalization through a free-trade agreement as argued by
17

Ekholm et al. (2007). Therefore, the empirical analysis of this paper rather focuses on
geographically and economically integrated regions than explicitly considering free-trade
areas.
In the case of Mexico, the question arises if it is more integrated with Latin American
(through Mercosur) or with North America (through NAFTA). Therefore, I conduct a
sensitivity analysis which affiliates Mexico to North America when analyzing whether
there is tax competition within regions. Table A1 in the appendix confirms that general
evidence for tax competition within regions cannot be detected.
With respect to European countries, the paper does not strictly focus on EU member-
ship in the main analysis. Even if a country is not member of the EU or only joined the
EU at a later stage, the European economies show a substantial degree of integration due
to privileged free-trade relationships. Consequently, I also include Switzerland, Norway
and Turkey in the main analysis which have well-established economic relationships with
the EU (e.g. through EFTA in the case of Switzerland and Norway). For robustness I run
regressions that rather focus on the EU instead of Europe by excluding the latter three
countries. The main results remain valid (Column 3-8 in Table A1), however, statistical
significance for tax competition within Europe becomes slightly weaker.
Time Effects
The main specifications do not include time dummies, since they would almost be identical
to the spatial lag. The time dummy would represent the average tax level in a given
year. The spatial lag, in turn, also represents the (weighted) average tax level in a given
year, except the tax level of the country of the dependent variable. Due to the high
multicollinearity between the spatial lag and the time dummy, the spatial lag cannot be
interpreted meaningfully in this case (see, e.g. Elhorst, 2010; Klemm and Parys, 2012;
Devereux et al., 2008). This is especially true with uniform weighting. The problem
might be less severe with distance weights. Therefore, I experiment with time dummies
for the distance regressions and present them in Table A2. Again, there is no evidence
for tax pressure from other world regions on Europe.
18

European Considerations
The main results indicate that there is no general tax competition across or within regions.
Tax competition seems to be a relatively specific European phenomenon. The descriptive
sketch in section 4 and the studies by Davies and Voget (2008) and Crabbe (2013) show
that the EU enlargement process might have contributed to interaction dynamics. Crabbe
(2013) emphasizes the new member states’ impact on the old member states which are
located eastward. Similarly, Davies and Voget (2008) argue that tax competition within
the EU member states is stronger and that the EU enlargement has intensified tax com-
petition in Europe. When I run the regressions only on the EU15 member states (Table
A3, column 3-4), I find no significant effects and, in a way, the findings of Crabbe (2013)
and Davies and Voget (2008) are confirmed. Furthermore, EU28 states seem to react in
particular to the new EU13 member states (Table A3, column 5-6), which confirms the
important role the EU13 played in the dynamics of European corporate taxes.
6 Discussion and Conclusions
Overall, there is a substantial amount of literature which analyses strategic tax interac-
tions between countries. Especially in the context of the European Union, it has been
argued that member states’ sensitivity to each other has led to lower effective corporate
taxes. The integrated economic area in the EU has arguably promoted this development.
The paper supports this, and at the same time, finds no evidence for the existence of
regional tax competition in other world regions, for example in Asia or in Latin America.
Furthermore, there is no evidence for tax competition across regions, and more specif-
ically, for the influence of non-European corporate taxes on tax levels of EU member
states.
In general, the implied causalities of the results in classical spatial econometrics frame-
works have to be interpreted cautiously, since it is questionable that the exogeneity con-
dition for the instruments holds. Recently, Gibbons and Overman (2012), Lyytikainen
19

(2012), Baskaran (2014), and Isen (2014) show that the strength of detected strategic in-
teractions can be severely overestimated, when using the traditional spatial lag approach.
These papers analyze interactions at the local level and make use of policy interventions
and institutional variations within and/or across borders, when instrumenting the spatial
lag. In light of the detected weaknesses of the standard spatial econometrics method, the
result of no inter-regional tax competition gains additional credibility. Although I ap-
ply a method which tends to overestimate strategic interactions, only interactions within
Europe are found. Overall, only moderately robust evidence for international tax inter-
actions has been provided by the literature thus far, which perhaps has to be treated
with caution, given the new methodical insights form the studies on local jurisdictions.
Considering the results of this study and the former literature, the desirability of cor-
porate tax harmonization in the EU remains questionable:
Firstly, the descriptives and empirics do not make a convincing case for an outright har-
monization of corporate taxes. It is unclear how strong strategic interactions among EU
member states really are and whether or not Europe experiences a “race-to-the-bottom”
with respect to effective tax rates. In addition, there is no indication for inefficiently low
levels of public good provision caused by tax competition. The annual report on taxation
trends in the European Union illustrates that tax revenues in percent of GDP exhibit a
rather unclear trend despite the fall in statutory tax rates; in the long term perspective,
corporate tax revenues have even increased (European Commission, 2014, p. 31).18
Secondly, from a normative perspective, it is unresolved if complete tax harmonization
is the first best solution to tax competition. On the one hand, the results indicate that tax
competition with other regions is unlikely to be very strong, which would make regional
tax harmonization a valid option (Sørensen, 2004). On the other hand, the economic
advantages of harmonization need to be traded off against the disadvantages coming
from political economy factors, like governments being Leviathans, or the benefits of
tax harmonization being unevenly distributed due to asymmetries across member states
18 Simmons (2006, p. 24) also observes that corporate tax revenues have increased in the EU15 overthe last decades both with respect to total tax revenues and GDP.
20

(Baskaran and Lopes da Fonseca, 2014; Cardarelli et al., 2002; Itaya et al., 2008; Osterloh
and Heinemann, 2013).
Also, there are alternative solutions to tax competition which are milder than complete
tax harmonization: Firstly, Baskaran and Lopes da Fonseca (2014) argue in favor of
intergovernmental transfers between EU member states, in order to smooth adverse effects
from tax competition. This perspective is currently opened up, given the discussions
on the advancement of the European Union into a federal state with more integrated
budgets and equalization schemes.19 And, secondly, instead of complete corporate tax
harmonization it appears natural to consider more well-dosed harmonization steps, like a
Common Consolidated Corporate Tax Base (CCCTB) or a Common Corporate Tax Base
(CCTB) which has been put forward recently in the Action Plan of the EU Commission.20
Both systems would greatly reduce compliance costs for corporations and make the EU as
a whole more competitive and attractive compared to other world regions. This could be
a feasible path to attract mobile capital and keep corporate tax revenues up (Keuschnigg
et al., 2014, p. 18). At the same time, member states could still set their own tax rates
and preserve some degree of tax autonomy.
19 See for example an interview by the French minister of finance:http://international.sueddeutsche.de/post/128026249890/refondons-leurope
20 The full Draft Council Directive on a Common Consolidated Corporate Tax Base (CCCTB)from 2011 is available for download under: http://ec.europa.eu/taxation_customs/resources/documents/taxation/company_tax/common_tax_base/com_2011_121_en.pdf
Information to the recent CCCTB re-launch can be found under: http://europa.eu/rapid/
press-release_MEMO-15-5174_de.htm
Please also see the Bolkestein Report (European Commission, 2001) and Spengel et al. (2012) foran economic analysis of company taxation in the internal market and the CCTB, respectively, aswell as Fuest (2008) for a critical analysis of the EU Commission’s original Draft Council Directive.
21
References
Altshuler, R. and T. J. Goodspeed (2015). Follow the Leader? Evidence on European
and US Tax Competition. Public Finance Review 43 (4), 485–504.
Arellano, M. and S. Bond (1991). Some Tests of Specification for Panel Data: Monte
Carlo Evidence and an Application to Employment Equations. Review of Economic
Studies 58 (2), 277–97.
Baldwin, R. E., R. Forslid, and J. Haaland (1995). Investment Creation and Investment
Diversion: Simulation Analysis of the Single Market Programme. Working Paper 5364,
National Bureau of Economic Research.
Baltagi, B. H., P. Egger, and M. Pfaffermayr (2008). Estimating Regional Trade Agree-
ment Effects on FDI in an Interdependent World. Journal of Econometrics 145 (1-2),
194–208.
Baskaran, T. (2014). Identifying Local Tax Mimicking with Administrative Borders and
a Policy Reform. Journal of Public Economics 118, 41–51.
Baskaran, T. (2015). Tax Mimicking in the Short- and Long-Run: Evidence from German
Reunification. Discussion Papers 230, University of Goettingen.
Baskaran, T. and M. Lopes da Fonseca (2014). The Economics and Empirics of Tax
Competition: A Survey and Lessons for the EU. Erasmus Law Review 7 (1).
Becker, J. and C. Fuest (2011). Optimal Tax Policy when Firms are Internationally
Mobile. International Tax and Public Finance 18 (5), 580–604.
Blomstrom, M. and A. Kokko (1997). Regional Integration and Foreign Direct Invest-
ment. NBER Working Papers 6019, National Bureau of Economic Research, Inc.
22

Blonigen, B. A., R. B. Davies, G. R. Waddell, and H. T. Naughton (2007). FDI in Space:
Spatial Autoregressive Relationships in Foreign Direct Investment. European Economic
Review 51 (5), 1303 – 1325.
Blundell, R. and S. Bond (1998). Initial Conditions and Moment Restrictions in Dynamic
Panel Data Models. Journal of Econometrics 87 (1), 115–143.
Cardarelli, R., E. Taugourdeau, and J.-P. Vidal (2002). A Repeated Interactions Model
of Tax Competition. Journal of Public Economic Theory 4 (1), 19–38.
Cassette, A., E. D. Porto, and D. Foremny (2012). Strategic Fiscal Interaction Across
Borders: Evidence from French and German Local Governments along the Rhine Val-
ley. Journal of Urban Economics 72 (1), 17 – 30.
Crabbe, K. (2013). Are Your Firm’s Taxes Set in Warsaw? Spatial Tax Competition in
Europe. FinanzArchiv: Public Finance Analysis 69 (3), 317–337.
Crabbe, K. and H. Vandenbussche (2008). Are Your Taxes Set in Warsaw? Spatial Tax
Competition in Europe. Open Access publications from Katholieke Universiteit Leuven
urn:hdl:123456789/386123, Katholieke Universiteit Leuven.
Davies, R. B. and J. Voget (2008). Tax Competition in an Expanding European Union.
Working Papers 0830, Oxford University Centre for Business Taxation.
Devereux, M. P. (2007). Developments in the Taxation of Corporate Profit in the OECD
Since 1965: Rates, Bases and Revenues. Working Papers 0704, Oxford University
Centre for Business Taxation.
Devereux, M. P. and R. Griffith (1998). Taxes and the Location of Production: Evidence
from a Panel of US Multinationals. Journal of Public Economics 68 (3), 335–367.
Devereux, M. P. and R. Griffith (2003). Evaluating Tax Policy for Location Decisions.
International Tax and Public Finance 10 (2), 107–26.
23

Devereux, M. P., R. Griffith, and A. Klemm (2002). Corporate Income Tax Reforms and
International Tax Competition. Economic Policy 17 (35), 449–495.
Devereux, M. P., B. Lockwood, and M. Redoano (2008). Do Countries Compete Over
Corporate Tax Rates? Journal of Public Economics 92 (5-6), 1210–1235.
Devereux, M. P. and M. Pearson (1995). European Tax Harmonisation and Production
Efficiency. European Economic Review 39 (9), 1657 – 1681.
Egger, P. and H. Raff (2014). Tax Rate and Tax Base Competition for Foreign Direct
Investment. International Tax and Public Finance (First Online), 1–34.
Ekholm, K., R. Forslid, and J. R. Markusen (2007). Export-Platform Foreign Direct
Investment. Journal of the European Economic Association 5 (4), 776–795.
Elhorst, J. (2010). Spatial Panel Data Models. In M. M. Fischer and A. Getis (Eds.),
Handbook of Applied Spatial Analysis, pp. 377–407. Springer Berlin Heidelberg.
Elschner, C., J. H. Heckemeyer, and C. Spengel (2011). Besteuerungsprinzipien und
Effektive Unternehmenssteuerbelastungen in der Europaischen Union: Regelt sich die
EU-weite Steuerharmonisierung von Selbst? Perspektiven der Wirtschaftspolitik 12 (1),
47–71.
European Commission (2001). Company Taxation in the Internal Market. Technical
Report COM (2001) 582, Brussels.
European Commission (2014). Taxation Trends in the European Union: 2014 Edition.
Taxation trends 2014, Directorate General Taxation and Customs Union, European
Commission.
Foucault, M., T. Madies, and S. Paty (2008). Public Spending Interactions and Local
Politics. Empirical Evidence from French Municipalities. Public Choice 137 (1), 57–80.
24

Fuest, C. (2008). The European Commission’s Proposal for a Common Consolidated
Corporate Tax Base. Working Papers 0823, Oxford University Centre for Business
Taxation.
Fuest, C. and T. Hemmelgarn (2005). Corporate Tax Policy, Foreign Firm Ownership
and Thin Capitalization. Regional Science and Urban Economics 35 (5), 508–526.
Gibbons, S. and H. G. Overman (2012). Mostly Pointless Spatial Econometrics? Journal
of Regional Science 52 (2), 172–191.
Gordon, R. H. (1986). Taxation of Investment and Savings in a World Economy. The
American Economic Review 76 (5), pp. 1086–1102.
Gorter, J. and R. de Mooij (2001). Capital Income Taxation in Europe; Trends and
Trade-Offs. CPB Special Publication 30, CPB Netherlands Bureau for Economic Policy
Analysis.
Haufler, A. and G. Schjelderup (2000). Corporate Tax Systems and Cross Country Profit
Shifting. Oxford Economic Papers 52 (2), 306–25.
Isen, A. (2014). Do Local Government Fiscal Spillovers Exist? Evidence from Counties,
Municipalities, and School Districts. Journal of Public Economics 110, 57–73.
Itaya, J.-i., M. Okamura, and C. Yamaguchi (2008). Are Regional Asymmetries Detri-
mental to Tax Coordination in a Repeated Game Setting? Journal of Public Eco-
nomics 92 (12), 2403–2411.
Keuschnigg, C., S. Loretz, and H. Winner (2014). Tax Competition and Tax Coordination
in the European Union: A Survey. Economics Working Paper Series 1427, University
of St. Gallen, School of Economics and Political Science.
Klemm, A. and S. Parys (2012). Empirical Evidence on the Effects of Tax Incentives.
International Tax and Public Finance 19 (3), 393–423.
25

Lyytikainen, T. (2012). Tax Competition Among Local Governments: Evidence from a
Property Tax Reform in Finland. Journal of Public Economics 96 (7-8), 584–595.
Madariaga, N. and S. Poncet (2007). FDI in Chinese Cities: Spillovers and Impact on
Growth. The World Economy 30 (5), 837–862.
Motta, M. (1992). Multinational Firms and the Tariff-Jumping Argument: A Game
Theoretic Analysis with some Unconventional Conclusions. European Economic Re-
view 36 (8), 1557–1571.
Motta, M. and G. Norman (1996). Does Economic Integration Cause Foreign Direct
Investment? International Economic Review 37 (4), 757–83.
Nickell, S. J. (1981). Biases in Dynamic Models with Fixed Effects. Econometrica 49 (6),
1417–26.
Osterloh, S. and F. Heinemann (2013). The Political Economy of Corporate Tax Har-
monization - Why Do European Politicians (Dis)Like Minimum Tax Rates? European
Journal of Political Economy 29, 18 – 37.
Overesch, M. and J. Rincke (2011). What Drives Corporate Tax Rates Down? A Re-
assessment of Globalization, Tax Competition, and Dynamic Adjustment to Shocks.
Scandinavian Journal of Economics 113 (3), 579–602.
Pain, N. (1997). Continental Drift: European Integration and the Location of U.K.
Foreign Direct Investment. The Manchester School 65 (S), 94–117.
Raff, H. (2004). Preferential Trade Agreements and Tax Competition for Foreign Direct
Investment. Journal of Public Economics 88 (12), 2745 – 2763.
Razin, A. and E. Sadka (1991). International Tax Competition and Gains from Tax
Harmonization. Economics Letters 37 (1), 69 – 76.
Redoano, M. (2014). Tax Competition Among European Countries. Does the EU Matter?
European Journal of Political Economy 34, 353–371.
26

Roodman, D. (2009). How to Do Xtabond2: An Introduction to Difference and System
GMM in Stata. Stata Journal 9 (1), 86–136.
Rowthorn, R. (1992). Intra-Industry Trade And Investment Under Oligopoly: The Role
of the Market Size. Economic Journal 102 (411), 402 – 414.
Schon, W. (2003). Tax Competition in Europe - General Report. W. Schon (Ed.), Tax
Competition in Europe Amsterdam: IBFD, 1–42.
Simmons, R. S. (2006). Does Recent Empirical Evidence Support the Existence of Inter-
national Corporate Tax Competition? Journal of International Accounting, Auditing
and Taxation 15 (1), 16 – 31.
Smith, A. (1987). Strategic Investment, Multinational Corporations and Trade Policy.
European Economic Review 31 (1-2), 89–96.
Sørensen, P. B. (2004). International Tax Coordination: Regionalism versus Globalism.
Journal of Public Economics 88 (6), 1187–1214.
Spengel, C., M. Ortmann-Babel, B. Zinn, and S. Matenaer (2012). A Common Corporate
Tax Base for Europe: An Impact Assessment of the Draft Council Directive on a
CC(C)TB. World Tax Journal , October, 185–221.
Zodrow, G. (2006). Capital Mobility and Source-Based Taxation of Capital Income in
Small Open Economies. International Tax and Public Finance 13 (2), 269–294.
Zodrow, G. R. and P. Mieszkowski (1986). Pigou, Tiebout, Property Taxation, and the
Underprovision of Local Public Goods. Journal of Urban Economics 19 (3), 356 – 370.
27

7 Appendix
7.1 Robustness Results
Tab
leA
1:
Rob
ust
nes
sof
mai
nre
sult
sw
ith
resp
ect
tore
gion
alblo
csan
dfr
eetr
ade
area
s
(1)
(2)
(3)
(4)
(5)
(6)
(7)
(8)
All
Countries
(NAFTA)
EU28
Countries
EU28
Countries
EU28
Countries
VA
RIA
BL
ES
un
iform
dis
tan
ceu
nif
orm
dis
tan
ceu
nif
orm
dis
tan
ceu
nif
orm
dis
tan
ce
Lagged
EA
TR
0.9
07***
0.8
63***
0.7
64***
0.5
19***
0.8
34***
0.9
22***
0.8
62***
0.9
32***
[0.0
24]
[0.0
53]
[0.0
91]
[0.1
63]
[0.0
69]
[0.0
33]
[0.0
67]
[0.0
23]
Sp
ati
al
Lag
sam
ere
gio
n-0
.037
-0.0
13
0.4
87**
0.1
40
0.6
66***
0.1
58
0.8
09**
0.1
56
[0.0
68]
[0.0
44]
[0.2
22]
[0.3
15]
[0.2
18]
[0.1
12]
[0.3
25]
[0.0
98]
Sp
ati
al
Lag
Non
-Eu
rop
ean
0.5
22
0.0
60
[0.3
39]
[0.2
73]
Sp
ati
al
Lag
Asi
a-P
aci
fic
0.3
07
0.1
62
[0.2
26]
[0.2
19]
Sp
ati
al
Lag
Nort
hA
mer
ica
0.2
02
-0.1
84
[0.3
39]
[0.2
64]
Sp
ati
al
Lag
Lati
nA
mer
ica
0.0
46
-0.0
55
[0.2
08]
[0.2
08]
Gov’t
Con
sum
pti
on
(lag)
0.0
26
0.0
35
-0.0
29
-0.0
75
-0.0
01
0.0
26
0.0
04
0.0
27
[0.0
26]
[0.0
27]
[0.0
65]
[0.1
05]
[0.0
52]
[0.0
39]
[0.0
44]
[0.0
35]
Urb
an
(lag)
0.0
12
0.0
16
0.0
81
0.1
49
0.0
61
0.0
23
0.0
52
0.0
21
[0.0
09]
[0.0
15]
[0.0
59]
[0.1
06]
[0.0
47]
[0.0
25]
[0.0
44]
[0.0
21]
Op
enn
ess
(lag)
0.3
08
0.3
31
-0.2
73
-0.9
26
-0.2
03
-0.1
44
-0.0
75
-0.1
31
[0.1
98]
[0.2
34]
[0.7
03]
[1.3
08]
[0.5
78]
[0.5
08]
[0.4
59]
[0.4
11]
GD
P(l
ag
an
dln
)0.2
46**
0.3
41**
0.5
27**
0.8
89**
0.3
94**
0.1
11
0.3
62**
0.0
92
[0.1
12]
[0.1
36]
[0.2
41]
[0.3
50]
[0.1
92]
[0.1
37]
[0.1
64]
[0.1
25]
Dep
end
ency
(lag)
0.0
44***
0.0
51***
-0.0
53
-0.0
98
-0.0
44
-0.0
19
-0.0
38
-0.0
17
[0.0
13]
[0.0
14]
[0.0
92]
[0.1
67]
[0.0
73]
[0.0
41]
[0.0
68]
[0.0
36]
Reg
ion
Sp
ecifi
cT
ime
Tre
nd
Yes
Yes
Yes
Yes
Yes
Yes
Yes
Yes
Ob
serv
ati
on
s704
704
448
448
448
448
448
448
Nu
mb
erof
cou
ntr
ies
44
44
28
28
28
28
28
28
Han
sen
test
P-v
alu
e0.4
56
0.5
69
0.5
37
0.3
20
0.4
11
0.2
00
0.4
80
0.8
44
AR
(1)
P-v
alu
e0.0
230
0.0
158
0.0
187
0.0
0894
0.0
221
0.0
305
0.0
223
0.0
332
AR
(2)
P-v
alu
e0.1
23
0.1
10
0.0
724
0.0
529
0.0
868
0.1
01
0.0
767
0.0
948
Rob
ust
stan
dard
erro
rsin
bra
cket
s
***
p<
0.0
1,
**
p<
0.0
5,
*p<
0.1
28

Tab
leA
2:
Rob
ust
nes
sof
mai
nre
sult
sw
ith
resp
ect
toti
me
effec
ts
(1)
(2)
(3)
(4)
(5)
(6)
(7)
(8)
(9)
(10)
All
Countries
All
Countries
European
countries
European
countries
European
countries
VA
RIA
BL
ES
un
iform
dis
tan
ceu
nif
orm
dis
tan
ceu
nif
orm
dis
tan
ceu
nif
orm
dis
tan
ceu
nif
orm
dis
tan
ce
Lagged
EA
TR
0.6
41***
0.8
08***
0.9
10***
0.9
07***
0.8
04***
0.6
19***
0.8
46***
0.9
22***
0.8
70***
0.9
23***
[0.1
48]
[0.0
86]
[0.0
22]
[0.0
43]
[0.0
71]
[0.1
26]
[0.0
58]
[0.0
26]
[0.0
56]
[0.0
29]
Sp
ati
al
Lag
0.4
07
0.1
86
[0.2
99]
[0.1
34]
Sp
ati
al
Lag
sam
ere
gio
n-0
.022
0.0
38
0.4
47**
0.0
09
0.6
80***
0.1
17
0.7
54**
0.0
43
[0.0
84]
[0.0
29]
[0.1
97]
[0.2
97]
[0.1
97]
[0.1
11]
[0.2
94]
[0.0
75]
Sp
ati
al
Lag
Non
-Eu
rop
ean
0.5
49*
-0.0
26
[0.3
20]
[2.0
06]
Sp
ati
al
Lag
Asi
a-P
aci
fic
0.3
45
-5.5
76
[0.2
11]
[3.5
01]
Sp
ati
al
Lag
Nort
hA
mer
ica
0.1
11
0.6
24
[0.3
19]
[3.2
51]
Sp
ati
al
Lag
Lati
nA
mer
ica
0.0
75
3.4
28
[0.1
94]
[4.0
54]
Gov’t
Con
sum
pti
on
(lag)
0.0
68
0.0
32
0.0
29
0.0
15
0.0
32
0.0
25
0.0
40
0.0
47*
0.0
36
0.0
48**
[0.0
51]
[0.0
37]
[0.0
26]
[0.0
25]
[0.0
41]
[0.0
72]
[0.0
34]
[0.0
28]
[0.0
29]
[0.0
23]
Urb
an
(lag)
0.0
36
0.0
19
0.0
12
0.0
15
0.0
60
0.1
06
0.0
51
0.0
22
0.0
45
0.0
23
[0.0
35]
[0.0
20]
[0.0
09]
[0.0
10]
[0.0
46]
[0.0
76]
[0.0
39]
[0.0
19]
[0.0
36]
[0.0
16]
Op
enn
ess
(lag)
0.2
76
-0.1
45
0.2
70
0.0
72
-0.0
90
-0.4
18
-0.0
97
-0.1
15
0.0
01
-0.0
02
[0.6
37]
[0.3
38]
[0.1
87]
[0.1
63]
[0.5
83]
[1.0
20]
[0.5
14]
[0.3
67]
[0.4
02]
[0.2
96]
GD
P(l
ag
an
dln
)0.7
85**
0.3
65**
0.2
34**
0.2
05*
0.4
35**
0.7
33*
0.3
63**
0.1
21
0.3
35**
0.1
53
[0.3
31]
[0.1
82]
[0.1
06]
[0.1
09]
[0.2
07]
[0.3
78]
[0.1
82]
[0.1
35]
[0.1
52]
[0.1
22]
Dep
end
ency
(lag)
0.0
88**
0.0
58**
0.0
39***
0.0
45***
-0.0
42
-0.0
75
-0.0
39
-0.0
20
-0.0
33
-0.0
20
[0.0
43]
[0.0
26]
[0.0
14]
[0.0
13]
[0.0
66]
[0.1
09]
[0.0
57]
[0.0
30]
[0.0
53]
[0.0
28]
Reg
ion
Sp
ecifi
cT
ime
Tre
nd
Yes
No
Yes
No
Yes
No
Yes
No
Yes
No
Tim
eF
ixed
Eff
ects
No
Yes
No
Yes
No
Yes
No
Yes
No
Yes
Ob
serv
ati
on
s704
704
704
704
496
496
496
496
496
496
Nu
mb
erof
cou
ntr
ies
44
44
44
44
31
31
31
31
31
31
Han
sen
test
P-v
alu
e0.6
21
0.3
29
0.3
09
0.4
80
0.4
57
0.5
35
0.4
00
0.9
94
0.4
60
1.0
00
AR
(1)
P-v
alu
e0.0
0274
0.0
0903
0.0
227
0.0
140
0.0
192
0.0
129
0.0
215
0.0
230
0.0
216
0.0
246
AR
(2)
P-v
alu
e0.0
445
0.0
752
0.1
23
0.0
966
0.0
904
0.0
648
0.1
00
0.0
979
0.0
912
0.0
972
Rob
ust
stan
dard
erro
rsin
bra
cket
s
***
p<
0.0
1,
**
p<
0.0
5,
*p<
0.1

Table
A3:
Euro
pea
nU
nio
nco
nsi
der
atio
ns
(1)
(2)
(3)
(4)
(5)
(6)
EU28
Countries
EU28
Countries
EU28
Countries
VA
RIA
BL
ES
un
iform
dis
tan
ceu
nif
orm
dis
tan
ceu
nif
orm
dis
tan
ce
Lagged
EA
TR
0.8
67***
0.7
50***
0.8
21***
0.6
44***
0.6
83***
0.4
81***
[0.0
56]
[0.0
88]
[0.0
85]
[0.1
26]
[0.1
23]
[0.1
66]
Sp
ati
al
Lag
EU
15
0.3
03
0.0
93
0.3
17
0.0
40
[0.3
42]
[0.2
27]
[0.5
24]
[0.2
95]
Sp
ati
al
Lag
EU
13
0.1
63*
0.1
43
0.3
09**
0.2
91*
[0.0
84]
[0.1
12]
[0.1
29]
[0.1
75]
Gov’t
Con
sum
pti
on
(lag)
0.0
02
-0.0
16
-0.0
10
-0.0
48
-0.0
47
-0.0
82
[0.0
49]
[0.0
58]
[0.0
60]
[0.0
81]
[0.0
72]
[0.1
04]
Urb
an
(lag)
0.0
48
0.0
81
0.0
60
0.1
11
0.1
06
0.1
68*
[0.0
41]
[0.0
54]
[0.0
52]
[0.0
81]
[0.0
75]
[0.1
00]
Op
enn
ess
(lag)
-0.1
10
-0.3
33
-0.1
44
-0.4
70
-0.4
67
-0.8
86
[0.5
05]
[0.7
47]
[0.5
94]
[0.9
97]
[0.8
86]
[1.2
63]
GD
P(l
ag
an
dln
)0.3
07**
0.4
74*
0.3
99**
0.7
10**
0.6
42*
0.9
79**
[0.1
37]
[0.2
54]
[0.1
91]
[0.2
85]
[0.3
42]
[0.4
60]
Dep
end
ency
(lag)
-0.0
39
-0.0
51
-0.0
36
-0.0
61
-0.0
77
-0.1
11
[0.0
59]
[0.0
90]
[0.0
73]
[0.1
26]
[0.1
20]
[0.1
73]
Ob
serv
ati
on
s448
448
448
448
448
448
Nu
mb
erof
cou
ntr
ies
28
28
28
28
28
28
Han
sen
test
P-v
alu
e0.8
25
0.6
82
0.5
27
0.6
63
0.4
76
0.6
04
AR
(1)
P-v
alu
e0.0
233
0.0
213
0.0
189
0.0
139
0.0
227
0.0
167
AR
(2)
P-v
alu
e0.0
899
0.0
763
0.0
691
0.0
752
0.0
614
0.0
433
Rob
ust
stan
dard
erro
rsin
bra
cket
s
***
p<
0.0
1,
**
p<
0.0
5,
*p<
0.1

7.2 Data
7.2.1 Computation of EATR
The concept of Devereux and Griffith (1998, 2003) models a hypothetical investment
project of a company and allows to compute the tax burden on this investment.21 The
model allows to include the most relevant tax provisions for corporations of a country.22
Nominal corporation tax rates, local taxes on profits and surcharges are included. In
addition, real estate, property and net-wealth taxes are considered. The computations
also consider the depreciation rules for buildings and machinery and the valuation method
for inventories. Overall, the modelled investment is assumed to be financed by a mix of
new equity, retained earnings and debt. In case of debt financing the possibility of interest
deductability is taken into account. Table A4 states the assumptions with respect to the
underlying economic parameters.
Table A4: Assumptions for EATR computation
Category Assumption
Types of assets industrial buildings (0.28%), machinery (0.5%), inven-tories (0.22%)
Source of finance retained earnings (33.33%), new equity (33.33%), debt(33.33%)
True economic depreciation (declin-ing balance)
Buildings: 3.1%Machinery: 17.5%
Lifetime (for tax purposes) Buildings: 25 yearsMachinery: 7 years
Inflation Rate 2%
Real interest rate 5%
Pre-tax rate of return 20%
21 Please also see European Commission (2001) for explanations and applications of the model.22 Taxation at the level of the shareholder is not taken into account because it does not affect decisions
of corporations when assuming that there is significant international portfolio investment, see e.g.Devereux and Pearson (1995, p. 1660).
31

7.2.2 Control Variables
Table A5: Descriptive Statistics
Variable Unit Mean Std.Dev.
Min Max Obs. Source
EATR Percent 25.8 7.7 8.3 47.9 748 ZEW/Oxford
Controls:GDP (ln) USD in Bill. 26.2 1.7 22.3 30.3 748 WorldbankGov’t Con-sumption
% of GDP 18.0 4.5 5.7 29.8 748 Worldbank
Urban Percent 71.8 14.5 26.8 97.5 748 WorldbankDependency Percent 49.2 5.1 36.0 66.9 748 WorldbankOpenness (exports + im-
ports)/GDP0.9 0.5 0.2 3.9 748 Worldbank
The control variables have been used in comparable settings:Government Consumption: Davies and Voget (2008) and Redoano (2014)Urban: E.g., Devereux et al. (2008) and Davies and Voget (2008)Dependency: Davies and Voget (2008), Redoano (2014); implicitly in Overesch and Rincke(2011) and Crabbe and Vandenbussche (2008).GDP : E.g., Egger and Raff (2014).
32

7.2.3 Dataset
Table A6: Dataset European Countries
Country Country
Austria LatviaBelgium LithuaniaBulgaria LuxembourgCroatia UKCyprus MaltaCzech Republic NetherlandsDenmark NorwayEstonia PolandFinland PortugalFrance RomaniaGermany SlovakiaGreece SloveniaHungary SpainItaly SwedenIreland Switzerland
Turkey
Table A7: Dataset Non-European Countries
Country Country
North America:USA Canada
Asia-Pacific:Australia KoreaNew Zealand JapanChina IndiaIndonesia
Latin America:Mexico ArgentinaBrazil Chile
33

Table
A8:
Mea
nE
AT
Rs
inE
uro
pe
over
tim
e
1996
1997
1998
1999
2000
2001
2002
2003
2004
2005
2006
2007
2008
2009
2010
2011
2012
EU
1531
.431
.129
.729
.429
.228
.828
.628
.427
.926
.926
.325
.426
.325.3
24.5
24.3
24.3
EU
1327
.326
.926
.426
.023
.422
.421
.219
.919
.816
.517
.717
.816
.416.6
16.0
16.0
15.9
EU
2829
.529
.128
.127
.826
.525
.925
.224
.524
.122
.022
.321
.821
.721.2
20.5
20.5
20.4
EU
28+
329
.529
.128
.227
.526
.325
.825
.124
.524
.222
.122
.121
.721
.621.2
20.5
20.5
20.4