Embed Size (px)
Citation preview

WWOORRKKIINNGG PPAAPPEERR NNOO.. 225544
Tax Evasion and Community Effects in Italy
Francesco Flaviano Russo
June 2010
University of Naples Federico II
University of Salerno
Bocconi University, Milan
CSEF - Centre for Studies in Economics and Finance DEPARTMENT OF ECONOMICS – UNIVERSITY OF NAPLES
80126 NAPLES - ITALY Tel. and fax +39 081 675372 – e-mail: [email protected]


WWOORRKKIINNGG PPAAPPEERR NNOO.. 225544
Tax Evasion and Community Effects in Italy
Francesco Flaviano Russo*
Abstract I propose an analysis of tax evasion in Italy using the data collected by the website evasori.info. This site collects reports by random internet users of the transactions in which they were involved that, lacking any legal receipt, were hidden from the tax authority. I interpret this experiment as a test of the attitude towards tax evasion by the community in which the tax offender operates: less reported episodes are an indication of a more lenient attitude. Since a more lenient attitude of the community is a lower cost of evading taxes, a smaller number of reports must be associated to less tax evasion. I show that the data confirm this claim. I also show that the presence of younger, less educated individuals and the size of the irregular labor force are associated to a more lenient attitude towards tax evasion. JEL Classification: H2610, K34 Keywords: Tax Morale, Tax Evasion Reports Acknowledgement: I would like to thank the creator and the administrator of the website evasori.info, both of which asked to remain anonymous, for their cooperation and support. The views expressed in the paper and all remaining errors are only mine.
* University of Naples Federico II and CSEF. E-mail: [email protected]


Table of contents
1. Introduction
2. Background
3. The Sample
4. The Community Effect on Tax Evasion
5. Explaining Tax Morale
6. Conclusion
Appendix
References


1 Introduction
Tax evasion involves our everyday life. From the morning coffee to the late night drink,
some of transactions that are part of our daily routine are, either deliberately or acciden-
tally, concealed from the tax authority. In Italy, estimates from the Ministry of Finance
indicate that roughly 20% of the income earned within the national border is not reported,
resulting in a loss of more than 300 millions euros every year in forgone tax revenue. But
who evades taxes more? Is it the owner of the small sandwich shop or the big corporation
that manages a luxury restaurant? Is it the family doctor or the plumber? Furthermore
where is tax evasion located? Is it more concentrated in big cities or small towns?
These are the kinds of questions that an anonymous Italian decided to address exploit-
ing the capabilities of the Internet. His simple idea was to build a website that allows
everybody to report anonymously some detail of the transactions in which they were in-
volved and that, lacking any receipt or proof, were not officially recorded. The details
include the monetary amount, the location and the economic activity of the individual
that did not issue the receipt. By any means, this (ongoing) experiment has been a suc-
cess: more than 70000 reports in 4 years, from the 0.2 euros of a coffee shop in Rome to
the 10000 euros of a manufacturing company in Como, with reports that span almost all
Italian provinces1.
An alternative way to look at this large scale experiment is as a measurement of the
“Tax Morale”, or the attitude towards tax payments and tax evasion. In fact only the
individuals that perceive the failure to issue a receipt, with the consequent lack of tax
payment, negatively, will report the episode. Therefore a high number of reports per
capita, say in a given city, is an indicator of a negative social attitude towards tax evasion.
But the negative social attitude is arguably a cost of evading taxes, which is evaluated
by the potentials offenders as much as law enforcing and expected fines. Thus a bigger
number of reports per capita should be associated to less tax evasion.
1Provinces are the areas in which Italian regions are divided and are typically identified by a geograph-
ical area around a big city called “Capoluogo”.
2

I propose an empirical test of this prediction. I find that a bigger number of reported
transactions is significantly negatively associated to lower evaded sums. This is what I
call a “Community Effect” on tax evasion: a lenient attitude in the community where
the potential evaders operate, by lowering the social and moral costs of evading taxes,
fosters tax evasion. What really identifies the community here is the transaction itself or,
in broader terms, the existence of business relationships. It is, for instance, the attitude of
the customers of a given restaurant or the clients of a lawyer that determines the incentives
to issue bills and parcels.
A closely related question is how to explain the community effect itself. Consistently
with previous studies, I find that the presence of less educated and younger individuals
and a bigger size of the informal labor force are associated to a lower number of reports of
tax evasion, and thus to a “stronger” tax morale. Conversely, the fraction of individuals
aged 30-44 is significantly associated to a bigger number of reports, while the presence of
more educated individuals does not have any predictive power. Interestingly, the fraction
of self employed individuals that, because of their activities, are more prone to tax evasion,
does not predict the number of reports.
The rest of the paper is organized as follows: section 2 provides some theoretical
background. Section 3 describes the dataset. Section 4 and 5 summarizes the empirical
results. Section 6 concludes.
2 Background
The concept of tax morale was introduced in the economic literature to rationalize why
people pay taxes2. The main reason is that, as Feld and Frey (2002) point out, traditional
models of tax evasion a la Allingham and Sandmo (1972)3, based only on auditing prob-
abilities and expected penalties, typically underestimate the tax compliance rate. Thus
2Slemrod (2007) proposes a comprehensive treatment of this point3The two reviews by Andreoni, Erard and Feienstein (1998) and Sandmo (2005) offer a comprehensive
summary of the literature
3
taxes are paid either because of honesty, as in Erard and Feienstein (1994), or because of
civic virtue, which is the intrinsic motivation in Frey (1997). Another possibility is a social
norm against tax evasion, strengthen by the perception of fairness of the tax system, as in
Falkinger (1995).
However, the first idea of a relationship between individual tax compliance and the
tax compliance of the community, dates back at least to the work by Gordon (1989). He
stressed that the “psychic cost” of evading taxes is negatively related to the fraction of peo-
ple that evades taxes, which allows evaders and honest taxpayers to coexist in equilibrium.
My empirical analysis follows exactly this line of research.
In a closely related study, Cannari and D’Alessio (2007) analyze the opinions on tax
evasions and the propensity to evade by looking at the specific questions of the Survey on
Household Income and Wealth (SHIW) administered by the Bank of Italy. They find that
self employed, younger and less educated individuals are more prone to evade taxes and
that this propensity is positively associated to the crime rate and to the unemployment
rate. They also find a generally low aversion to tax evasion, which is part of the reason
why evasion is so high in Italy.
3 The Sample
I use all the information published by the website evasori.info. The idea of the creator
of the webpage was to quantify the amount of tax evasion in Italy by relying on reports
by the individuals that were part of the transactions hidden from the tax authority. In
slightly more than 4 years of operation, the site collected more than 70000 reports in 102
of the 106 Italian provinces4. The reports include the amount of the transaction, the type
of economic activity and the location of the transaction, the latter published in the form of
latitude-longitude couples. The website also automatically assigns a progressive number to
the report that indicates the exact time at which it was made. This information allows the
4There are no reports for Aosta, Olbia, Carbonia and Ogliastra. the Province of Monza, established in
2007, is not covered separately in the website.
4

administrators to produce two outputs: on the one hand a set of spreadsheets, organized
either by economic activity or province, that summarize the total amount of tax evasion;
on the other, a set of maps that give an idea of the geographical areas in which tax evasion
takes place.
I purged the data from all the consecutive reports that, being exactly equal in all
dimensions, clearly concerned the same transaction. This left 5030 usable reports made
prior to March 2010, when I started downloading he data. The bulk of the observations
refer to 2008, 2009 and 2010, while only less than 3% of them to earlier dates. Since it is
difficult to interpret the time variability of the data, I collapsed the time dimension as if
all reports were actually made at the same time.
There is a total of 50 economic activities in which the transactions can be categorized.
Some of them collect as much as 1000 reports (coffee shops), while others only a few.
To make the sample more homogeneous, I aggregated similar activities together, resulting
into 22 activities, 2 of which are residuals. Table (1) lists the groups in descending order
according to the number of observations and and provides summary statistics. The sample
includes both activities with small typical transactions, as coffee shops and food shops
(with median transactions of, respectively, 5 and 8 euros), and activities with big typical
transactions, as lawyers and tax professionals (with median transaction of 1200 euros).
Looking at the kind of activities and the respective frequencies of observations, it is clear
that the reports are mostly about the everyday transactions and about the economic
relationships in which we are more frequently involved. Importantly, since this particular
form of tax evasion involves a big number of socio-economic interactions, it should also be
very sensitive to the community effect and thus an ideal ground to test the theory. All
categories are also characterized by a significantly high standard deviation and by means
much bigger than the median, both of which stress the presence of big outlier observations.
Looking at the whole sample, the smallest reported amount is 0.2 euros while the
biggest is 10000 euros. Just 80 reported transactions are above 5000 euros, while 490
observations, or 10% of the sample, are above 1000. The upper left panel of Figure (1)
5

shows the empirical distribution of the evaded sums, estimated with an Epanechnikov
Kernel. Clearly there is a big concentration around reports of small amounts and a very
small probability mass on big amounts. Another characteristic of the distribution is the
presence of peaks corresponding to round numbers, especially above 100 euros. Both of
these empirical regularities are also evident in the upper right panel of figure (1), which
entails the distribution of the evaded sums conditional on the evasion being less than 1000
euros (4454 observations). This graph excludes both the activities with high transactions
values, observed with less frequency, and some of the outlier observations for activities
with low transaction value. The lower panels of figure (1) are details of the portion of the
distribution with the highest probability density, that also stress the two main properties
of the sample. The left panel is the distribution conditional on evasion being less than 100
euros (3022 observations), while the right on being between 1 and 20 euros (included, 1812
observations).
Aggregating the data geographically, it is evident that the provinces with bigger pop-
ulations are also the ones with the biggest number of reports, with a correlation equal to
0.61. Thus, at least least along this dimension, the sample can be considered as representa-
tive. One problem is that it is difficult to know if the provinces with small populations and
few reports provide information about the transactions that are more frequent in that area.
In other words, it is hard to assess if the sample is truly representative of the population of
transaction in which taxes are evaded. However, since the correlation between the number
of reports per resident in the province and the number of residents is very small, there
is some non trivial variability that can identify the empirical relationship. At a regional
level, the statistics of the distributions of the evaded sums are very similar, highlighting
a substantial homogeneity of the sample. All the regional distributions are also highly
volatile and positively skewed as the national distribution.
6

4 The Community Effect on Tax Evasion
The attitude towards tax evasion of the community in which a business operates is part
of the cost of evading taxes: a more lenient attitude fosters tax evasion by making it less
costly. One way to look at the experiment of the website evasori.info is of a test of this
attitude, or, more generically, of “Tax Morale5”. A bigger number of reports per capita is
indeed an indication of a negative perception of tax evasion, or a “stronger” tax morale,
which should be associated to lower tax evasion.
My empirical test of this proposition entails a regression of the log of the evaded sums
on tax morale, the latter defined as the log of the number of reports per 100 thousand
residents in the province where the transaction was completed. The empirical specification
is the following:
yi k = β0 + β1 ri + γ Xi +k̄∑
k=1
ηk Dk + εi k
where y is the amount of the transaction, r is the number of reports per resident in
province i, X are control variables specific to the province i (from the ISTAT database
freely available online) and Dk are dummies for the k̄ = 22 economic activities in which the
data are aggregated. This specification is indeed equivalent to a pseudo panel with fixed
economic activity effects. Table (2) summarizes the results for different control variables.
In the baseline specification without controls, a 10% higher number of signals per
residents is significantly associated to 0.8% smaller evaded sums. At the median value
of r, this result implies that 12 more reports per 10 thousands residents predict roughly
1.6% lower evaded sums. The coefficient does not change when controlling for the region
GDP, for the province income per capita and for the average monthly family expenditure
per capita, which are included to soak up the variability in the monetary value of the
transactions that depends on the general volume of all transactions. Similarly, it does not
change when controlling for the fraction of self employed individuals, that are in general
5Tax morale is, more general, the attitude towards the payment of taxes more than the attitude towards
not paying them. I use the term to refer to the latter without ambiguity.
7
more prone to tax evasion (Pissarides and Weber (1989) and Slemrod (2007)) and thus
should have a more lenient attitude towards evasion; or when controlling for the regional
fraction of irregular employment, which should also be associated to a more lenient attitude.
Even considering the number of reports per resident aged 65 or less, to account for the
potential use of the internet, delivers very similar coefficients. Purging the sample from the
reports above 1000 euros and above 400 euros provides a similar picture, with coefficients
that are, on average, bigger. Even if it is difficult to interpret the time variability in the
data, I also tried including year dummies (2010, 2009, 2008 and 2007) in the regression,
obtaining almost identical results.
Overall, the data highlight the existence of what I call a “Community Effect” on tax
evasion: the cost of evading taxes is lower if the attitude of the individuals with which the
tax offender typically does business is more lenient, determining more tax evasion. This
effect is indeed specific to the business community, which is geographically identified with
the place where the transactions are completed, or the same place where the tax offender
is located. Importantly, this effect is different from a community effect specific to the
place where the tax offender and the individual that report evasion live. For instance,
what matters for a restaurant is the attitude of its customers, which, can report an evaded
transaction in the place where the restaurant is located.
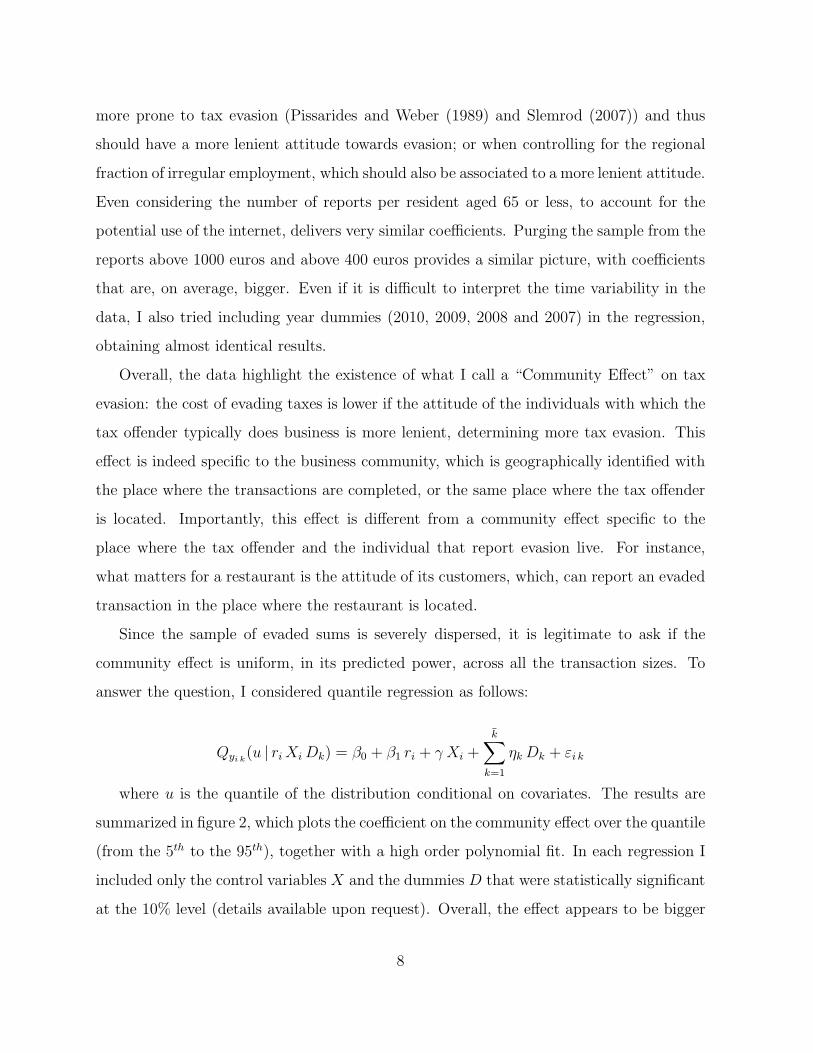
Since the sample of evaded sums is severely dispersed, it is legitimate to ask if the
community effect is uniform, in its predicted power, across all the transaction sizes. To
answer the question, I considered quantile regression as follows:
Qyi k(u | ri Xi Dk) = β0 + β1 ri + γ Xi +
k̄∑
k=1
ηk Dk + εi k
where u is the quantile of the distribution conditional on covariates. The results are
summarized in figure 2, which plots the coefficient on the community effect over the quantile
(from the 5th to the 95th), together with a high order polynomial fit. In each regression I
included only the control variables X and the dummies D that were statistically significant
at the 10% level (details available upon request). Overall, the effect appears to be bigger
8

for very big and very small transactions sizes, but roughly stable in between. In particular,
the coefficient is equal to -1.5 around the 10th percentile, which corresponds to 3 euros,
and between -0.9 and 1 above the 90th percentile, which corresponds to 1000 euros.
5 Explaining Tax Morale
A lenient attitude towards tax evasion is associated to lower evaded sums. But what fosters
this attitude? I address this question by running regressions of the following form:
ri = α0 + α1 z1i + . . . + αn zn
i + εi
where ri is the number of signals per resident in province i, the community effect,
and the z are covariates from the ISTAT database freely available online. The results are
summarized in Table (3).
Since the reports of tax evasion are collected on a website, I check if their number
is correlated with the diffusion of the internet and the proficiency in its use. The first
result is that a bigger percentage of regular internet users in the region where the province
is located is significantly associated to more reports. Also the proficiency in the use of
internet matters, with medium and high proficiency predicting a higher number of reports
over and above the diffusion of internet.
Consistently with the study by Cannari and D’Alessio (2007), I find that a bigger
fraction of young population in the province is associated to a lower tax morale. A 1%
bigger fraction of individual aged 20-24 or 25-29 is associated to 1.2 more reports per capita.
But the coefficients drop significantly once I control for the diffusion of the internet, with
the one on the age group 25-29 becoming not significant. I also find that a bigger fraction
of individuals aged 30-34, 35-39 and 40-44 is robustly associated to more signals per capita,
with or without controlling for the diffusion of the internet. The age groups 35-39 and 40-
44 have also a significantly big predictive power, with the R2 of the univariate regressions
being, respectively, 0.19 and 0.16. Higher age groups (45-49 and 50-54) are not significantly
9
associated to the number of reports once I control for the diffusion of the internet.
Geographically, there is a significantly bigger tax morale in the Center and a signif-
icantly smaller tax morale in the South (including the islands), even if this latter effect
is not significant once I control for the diffusion of the internet. Provinces located in the
Center have, on average, 2.5 more reports per capita than central and northern regions
but, controlling for the diffusion of internet, the effect drops to 1.4.
Self employed individuals are, in general, more prone to tax evasion, if anything because
the income they earn is more easily hidden. Previous studies by Pissarides and Weber
(1989) and Slemrod (2007) also show that, in the US and in the UK, they actually evade
taxes more. However, in my sample, self employment in the province does not predict
significantly the number of reports per capita.
Contrary to the findings of Cannari and D’Alessio (2007), there is no relationship
between the number of reports and the unemployment rate. Individuals with irregular or
“Black Market” jobs, earning income under the table, should also foster a more lenient
attitude towards evasion. In fact a bigger fraction of irregular labor in the region is
significantly associated to a lower number of reports, even if the coefficient in the regression
is very small and its predictive power limited. Looking at a breakdown of the irregularity
rate by economic activity, it looks like irregularity in the service sector and in the industrial
sector matter more than agriculture and construction.
Education also matters. A higher fraction of less educated individuals, whose higher
educational achievement is the Italian equivalent of a middle school (8 years), predicts a
lower number of reports, even when controlling for the use of the internet (which is strongly
negatively correlated with it). However the fraction of highly educated individuals, with
the equivalent of a college degree (17-18 years) does not have any predictive power.
The last set of explanatory variables entails crime rates. In fact avoiding the legally
prescribed obligation to pay taxes is behaviorally similar, to some extent, to breaking other
laws. Thus tax morale should be lower if a greater portion of the population is engaged
in other illegal behaviors. However there is no empirical support for this proposition,
10

since, after controlling for the diffusion of the internet, the number of thefts, robberies
and frauds (in the province) are positively associated to the number of reports and the
number of extorsion, fencing and loansharking episodes are not significant determinants of
the number of reports (details about the regression results available upon request).
6 Conclusion
Allowing the people to report the transactions concealed from the tax authority is a way to
test their attitude towards tax evasion: only the ones that judge negatively the individuals
that fail to issue the receipts will report them. Consequently, the number of reports per
capita, in a given geographical area, is an indicator of the general perception of tax evasion.
Since a negative perception of tax evasion is equivalent to a bigger cost of evading taxes,
a lower number of reports should also be a associated to more tax evasion. I showed that
the data support this claim.
One possible conclusion an, admittedly a strong one, is that we all bear, as economic
agents, some sort of responsibility for the tax evasion that we observe. The behavior of
the tax offenders depends, over and above their cultural values and moral beliefs, from a
consideration of the costs and benefits of evading taxes. Among other costs, the behavior
of all their customers and clients shapes their trade-offs, sometimes in a fundamental way,
and it is natural that a less severe attitude will result in a substantial ease of evasion, and
thus in more tax evasion. This is the sense of the community, or network, effect: it is much
easier to evade taxes is this behavior is not sanctioned by the community, as it is the case
with any other law.
References
Allingham, Maurice and Agnar Sandmo. 1972. “Income Tax Evasion: A TheoreticalAnalysis.” Journal of Public Economics, 1(3): 323-338.
Andreoni, James, Brian Erard and Jonathan Feienstein. 1998. “Tax Compliance.”Journal of Economic Literature, 36(2): 818-860.
11

Cannari, Luigi and Giovanni D’Alessio. 2007. “Le Opiniomi degli Italiani sull’EvasioneFiscale.” Temi di Discussione, Bank of Italy.
Erard, Brian and Jonathan Feienstein. 1994. “Honesty and Evasion in the Tax Com-pliance Game.” Rand Journal of Economics, 25(1): 1-19.
Falkinger, Josef. 1995. “Tax Evasion, Consumption of Public Goods and Fairness.” Journal
of Economic Psychology, 16(1): 63-72.
Frey, Bruno. 1997. “A Constitution for Knaves Crowds Out Civic Virtues.” The Economic
Journal, 107(4): 1043-1053.
Gordon, James P. 1989. “Individual Morality and Reputation Costs as Deterrents to TaxEvasion.” European Economic Review, 33(4): 797-805.
Pissarides, Cristopher A. and Guglielmo Weber. 1989. “An Expenditure-Based Esti-mate of Britain’s Black Economy.” Journal of Public Economics, 39(1): 17-32.
Sandmo, Agnar. 2005. “The Theory of Tax Evasion: A Retrospective View.” National
Tax Journal, 58(4): 643-663.
Slemrod, Joel 2007. “Cheating Ourselves: The Economics of Tax Evasion.” Journal of
Economic Perspectives, 21(1): 25-48.
12

Table 1: Summary Statistics by Economic Activity
Activity Obs Median 1st Qrt 3rd Qrt Mean Std
Coffee Shops 1035 5 2 10 11 26.4Restaurants 808 47 22.2 109 94 132Doctors and Dentists 570 140 80 480 593 1250Food Shops 264 8.2 0.92 100 15.9 23.2Auto Repair 263 300 35 6000 710 1239Personal Services 261 20 13 50 51.8 98.9Lawyers and Tax Professionals 228 1200 500 2725 1865 1887Prepared Meals and Takeout 213 9.5 5 18 16.5 24.3Shops 207 41 15 200 232 668Plumbers, Electricians and Contractors 204 450 150 1400 1227 1902Architects, Engineers and Professionals 127 250 50 1000 1091 1872Real Estate 126 1000 500 3000 2114 2165Household Products and Computers 96 72.5 4 1200 269 650Sport, Leisure and Entertainment 76 62.5 22 150 133 163Housing 71 500 90 2500 740 655Vacation Rentals 64 400 80 3500 795 1195Nursing and Sanitary Services 64 54 30 115 93.1 101Open Markets and Peddlers 63 15 7.5 43 55.1 130Hotels 58 420 49 1500 521 508Construction 40 2650 1000 5800 3788 3142
Residual (low value) 136 70 15 190 158 221Residual (high value) 56 56 1475 375 2600 2264
Notes: Summary statistics for the transactions reported on the website evasori.info by aggregated economic categories. Al values are in euros. The residual categoriesare divided in two groups according to the size of the typical transaction.
13
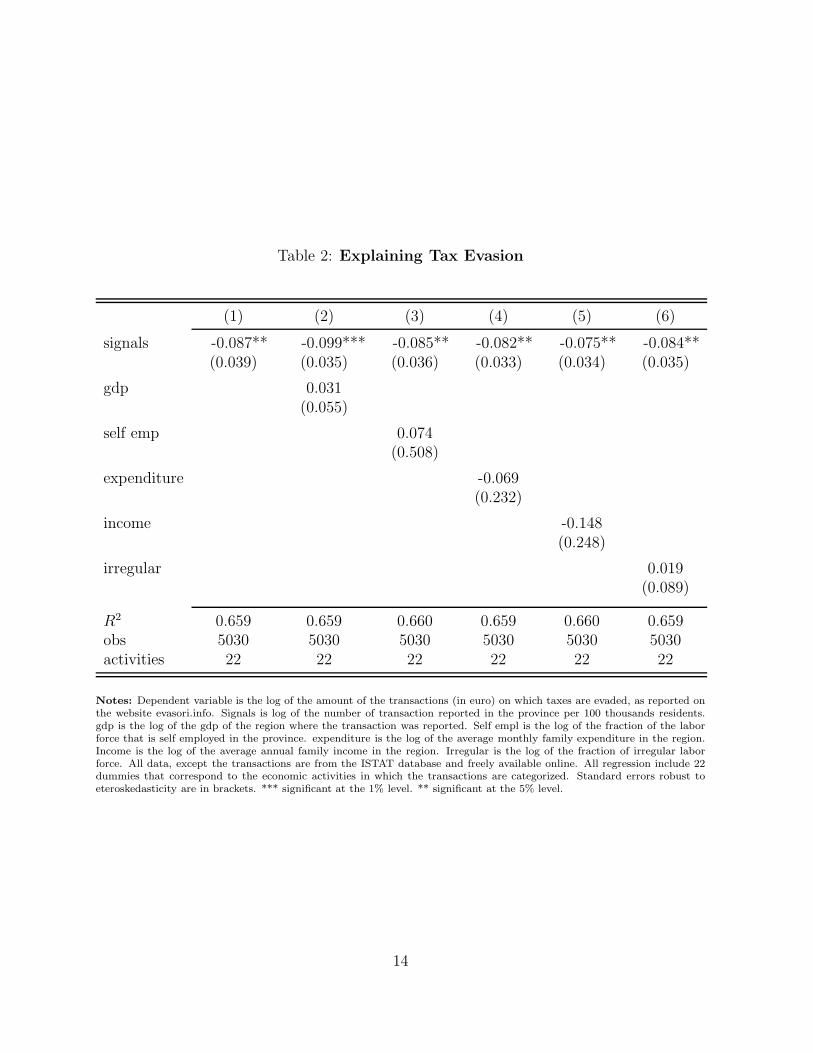
Table 2: Explaining Tax Evasion
(1) (2) (3) (4) (5) (6)
signals -0.087** -0.099*** -0.085** -0.082** -0.075** -0.084**(0.039) (0.035) (0.036) (0.033) (0.034) (0.035)
gdp 0.031(0.055)
self emp 0.074(0.508)
expenditure -0.069(0.232)
income -0.148(0.248)
irregular 0.019(0.089)
R2 0.659 0.659 0.660 0.659 0.660 0.659obs 5030 5030 5030 5030 5030 5030activities 22 22 22 22 22 22
Notes: Dependent variable is the log of the amount of the transactions (in euro) on which taxes are evaded, as reported onthe website evasori.info. Signals is log of the number of transaction reported in the province per 100 thousands residents.gdp is the log of the gdp of the region where the transaction was reported. Self empl is the log of the fraction of the laborforce that is self employed in the province. expenditure is the log of the average monthly family expenditure in the region.Income is the log of the average annual family income in the region. Irregular is the log of the fraction of irregular laborforce. All data, except the transactions are from the ISTAT database and freely available online. All regression include 22dummies that correspond to the economic activities in which the transactions are categorized. Standard errors robust toeteroskedasticity are in brackets. *** significant at the 1% level. ** significant at the 5% level.
14

Table 3: Explaining Tax Morale
INTERNET EDUCATION GEOGRAPHY
low med high laurea lic media nord centro sud
coeff 0.093 0.295** 0.619** 0.048 0.023 -0.292*** -0.235*** -0.148 -0.683 2.506*** 1.379* -2.554*** -0.796(0.112) (0.137) (0.264) (0.108) (0.103) (0.060) (0.083) (0.164) (0.872) (0.930) (0.866) (0.665) (0.801)
internet 1.151*** 1.091*** 0.913*** 0.826*** 1.148*** 0.443 1.189*** 0.935*** 0.983***(0.329) (0.352) (0.286) (0.282) (0.330) (0.415) (0.348) (0.305) (0.402)
R2 0.134 0.138 0.160 0.164 0.001 0.134 0.202 0.214 0.004 0.14 0.083 0.154 0.078 0.138
AGE PROFILE
20-24 25-29 30-34 35-39 40-44 45-49 50-54
coeff -1.286*** -0.671* -1.224** -0.376 2.685*** 2.316** 3.864*** 3.085*** 4.032*** 3.127*** 3.468** 2.350 -0.252 -0.011(0.339) (0.357) (0.510) (0.531) (1.058) (1.008) (0.991) (0.935) (1.011) (0.924) (1.700) (1.590) (1.321) (1.421)
internet 0.935*** 1.082*** 1.067*** 0.737*** 0.795*** 1.073*** 1.151***(0.354) (0.364) (0.281) (0.237) (0.249) (0.289) (0.330)
R2 0.081 0.151 0.035 0.137 0.077 0.191 0.193 0.239 0.164 0.219 0.038 0.151 0.003 0.134
LABOR MKT IRREGULAR LABOR
occup ind total agriculture industry industry (strict) construction services
coeff 0.036 0.012 -0.233*** -0.112* -0.077 -0.021 -0.131*** -0.061 -0.166*** -0.086** -0.104*** -0.045 -0.328*** -0.169*(0.503) (0.122) (0.057) (0.069) (0.096) (0.092) (0.032) (0.039) (0.040) (0.044) (0.028) (0.032) (0.081) (0.095)
internet 1.151*** 0.867** 1.136*** 0.934*** 0.916*** 0.956*** 0.802***(0.327) (0.390) (0.346) (0.376) (0.359) (0.371) (0.386)
R2 0.001 0.134 0.09 0.149 0.008 0.134 0.082 0.147 0.087 0.152 0.076 0.145 0.113 0.152
Notes: Coefficient of a regression of the number of reports per resident in the region and the variable indicated in the column. All data are from the ISTAT database(freely available) except the number of reports which is from evasori.info. Robust standard errors in brackets. 102 observations per regression. *** significant at the1% level. ** significant at the 5% level. * significant at the 10% level.
15

Figure 1: Empirical Distribution of Reported Transactions0
.001
.002
.003
0 2000 4000 6000 8000 10000report
Empirical Distribution (all reports)
0.0
02.0
04.0
06.0
08.0
1
0 200 400 600 800 1000report
Empirical Distribution (reports<1000)
0.0
1.0
2.0
3.0
4
0 20 40 60 80 100report
Empirical Distribution (reports<100)
.02
.04
.06
.08
.1
0 5 10 15 20report
Empirical Distribution (1<reports<20)
Notes: Empirical distributions of reported transactions from the website evasori.info estimated with an EpanechnikovKernel. All data are in euros.
16

Figure 2: Quantile Profile
−.2
−.1
5−
.1−
.05
0co
effic
ient
0 .2 .4 .6 .8 1quantile
Notes: Coefficient of the quantile regression of the evaded sums on the community effect (and controls) plotted over thequantile (0.05-0.95) and polynomial best fit curve.
17