Embed Size (px)
Citation preview
� Introduction
“Captive insurance company owners carefully consider domiciles based on their business plans
and how the captive ultimately will be used,” reported by Mr. Mike Tsikoudakis, an expert of cap-
tive insurance company in Business Insurance. His statement illustrates the recent movement
that captives are carefully and strategically planned and, as a result, the domicile is selected.
The fact appears to contradict Japanese captive owners’ conventional purpose that the estab-
lishment of a captive is to reduce taxes.
This study aims to investigate whether or not, or to what extent, tax regulations on a captive
have impact on the value of setting up a Japanese captive insurer and influence decision making
of a risk manager on captive finance especially for selecting a domicile where the captive is to
be incorporated.
According to Doherty (1985), a captive insurer is defined as a retention fund that is graced
by having its own corporate identity as a subsidiary of a noninsurance parent firm. He also sug-
gested that a captive insurance company is an insurance company that is owned by a non-
1
Tax Impact on the Value
of Japanese Captive Insurers
Abstract
This study identifies whether or not, or to what extent, tax regulations on captives
have impact on the firm value and also on managerial decisions of where captives should
be incorporated. Many Japanese captive owners choose their captive domicile to reduce
tax liabilities with captives in non-tax haven countries such as Hawaii and Micronesia.
This study finds that the tax haven status of domicile does not have material impact on
net value created. Our hypothetical captives in tax haven countries create positive net
value while captives in non-tax haven countries create negative. We conclude that
managerial decision should be not only based on tax regulations but also other factors
surrounding captive.
Yuji Maeda
insurance parent company or companies, and that underwrites the insurance business of its
parents either directly or by means of retention. With captives, most of multi-national corpo-
rations establish their own insurance vehicle to finance their losses rather than transferring
losses with insurance.
The practice of captive finance in risk management has become common among multi-
national companies in U.S., UK and recently European Union Countries. In fact, the number
of captive insurance companies has been growing steadily. As of March 11, 2013, there are
6,052 captives in the world. Contrary, Marsh Broker Japan reported that there are currently
70 to 100 Japanese captives and the number appears to be rather stable over many years.
Special Report of Business Insurance on March 11, 2013 reported that Bermuda is the top in the
number of captives, 856 captives ; Vermont is the third, 586 ; Guernsey is the fourth, 333 ;
Luxembourg is the eighth, 238 ; Hawaii is 11th, 179 ; Dublin is 15th, 141 ; Federated States of
Micronesia is 43rd, 9. Micronesia, however, indicates that most of its captives are owned by
Japanese firms. It promotes that Micronesia provides favorable business environment for
Japanese captives, especially with its 21 percentage corporate tax rate where disadvantageous
tax haven law does not apply to the captive.
Various reasons have been presented by researchers on why companies use their captives
rather than traditional insurance to manage risks. One is to have it a key driver to encourage
risk management and controls within the organization. Other reasons include, but not limited
to, to obtain investment income on the loss fund, to offer an arbitrage opportunity for difference
in insurance premiums, and to have flexibility of the insurance program (Lenrows et al.
(1982)).
Risk management practitioners argue that many Japanese captive owners, however, point
out reducing tax liability to be the primary reason for establishing their captives overseas. This
fact appears to contradict the reasons for captive finance presented by risk managers of other
countries. Therefore, our study attempts to find whether or not Japanese risk managers should
consider the tax regulations for domicile selection from the standpoint of value. The result of
the study will ultimately provide an answer to the important questions for risk management
practice of Japanese corporations.
� Brief Literature Review
Despite the existence of more than 6,052 captives worldwide, 70 to 100 of which are
2

reported to be owned by Japanese firms, there is a paucity of research on Japanese captives
compared to U.S. and European firms. The results from the studies of U.S. and European cap-
tives can be applied partially to Japanese captives. Differences exist in the Japanese business
environment and also there are pronounced differences in the legal liability exposure of
Japanese corporations. Morimiya (1997) and Ikeuchi et al. (2013), for example, have exam-
ined the benefits and challenges of captives worldwide, the global trends that fuel captive
growth, and the captive dynamic with respect to other financing methods. Maeda (2005) dem-
onstrated through qualitative analysis the corporate demand for Japanese captives.
The lack of publically available data with respect to the performance of captives regardless
of their nationalities have resulted in conflicting conclusions from the empirical findings con-
cerning the ability of captives to generate value for parent firms. Diallo and Kim (1989) and
Adams and Hillier (2000) use event study methods to examine whether the establishment of
a captive insurer creates value for its shareholders. The studies demonstrate that although the
share value of the captive parent remains unchanged, the non-significant negative drift of the
cumulative abnormal return on the parent’s stock may indicate that an amount considered neg-
ligible to all stockholders might be significant for certain managers. They thus contend that the
welfare gain derived from the creation of captives is likely to benefit the managers of the parent
firm rather than the shareholders. This conclusion is similar to the conclusion of Scordis and
Porat (1998) who demonstrate that firms with captive insurers are more likely to experience
manager-owner conflicts than firms that do not form captives. Adams and Hillier (2000) par-
tially attribute their results to captive formation by managers for their own benefits. They pro-
vide evidence that the incorporation of captive insurers is somewhat detrimental to value. The
study uses a sample of 120 captives of United Kingdom (U.K.) corporations. They find nega-
tive stock reaction to the news that a captive insurer has been formed, however, the reaction
amounted to less than a percentage point.
The study of Scordis et al. (2007) employed Monte Carlo simulations on general captives in
Bermuda and British Virgin Island to identify sustainable conditions where captives exhibit a
high probability of creating positive shareholder value. The study finds that, on average, cap-
tives have a low probability of generating shareholders value. Well-managed captives, how-
ever, have a high probability of generating shareholder value. The study also finds that the
captives of parents with low systematic risk have the highest probabilities of creating the value.
Maeda et al. (2011) studied shareholder value creation by applying a similar methodology of
Scordis et al. (2007) to a Japanese captive established in Guernsey, Bermuda and Hawaii but
Tax Impact on the Value of Japanese Captive Insurers 3
expanded further into enterprise risk management and finite risk schemes into captives.
Maeda et al (2011) found a high likelihood that a captive generates economic value for its
Japanese parent firm especially when it operated over multiple years. They find that when the
captive reinsurers its entire book of business, thus acting as a vehicle for access the global re-
insurance market, it delivers approximate break-even economic value. The captive can gener-
ate a high level of economic value but only by adopting a higher level of operating risk. They
find that the value-maximizing strategy is for a Japanese corporation to establish its captive in
Bermuda while the risk-minimizing strategy is to establish its captive in Guernsey. They also
demonstrate that Bermuda offers favorable risk-return tradeoffs for Japanese captives com-
pared to Hawaii. Maeda (2013) also demonstrated the research with respect to Japanese cap-
tives established in European domiciles, namely Guernsey, Luxembourg and Dublin, Ireland.
The study demonstrates that Japanese captive domiciles in Europe bring incremental positive
value to the parent.
� Research Methodology
This study uses a scenario approach and the discounted present value method in order to
seek an answer to this important research question for risk managers of Japanese corporations.
Realistic business environment and hypothetical situation using the latest information obtained
from various reliable sources are assumed, and then we forecast income statements and cash
flow statements on MS Excel spreadsheets for each domicile. The latest domicile tax regula-
tions, capital requirement and costs are fully reflected in the scenario.
We assume that the risk manager wishes to set up a captive to finance product liability losses
occurred in Japan. The captive is to be established and maintained over fourteen years and
then liquidated at the end the period. The liability for outstanding losses at the end is to be
transferred by Loss Portfolio Transfer to another insurance company. Using the conventional
discounted cash flow method, we come up the net present value of a captive less the value of
purchasing traditional insurance. Since each domicile has distinct tax regulations, i.e. differ-
ence in corporate tax rates and premium taxes on captives, we compare the value added by the
captives reflecting these local tax regulations and consolidated taxes paid in accordance with
Japanese “Tax Haven Law.”
4
1 Assumption
A hypothetical pure captive is assumed to be established in the following popular domiciles ;
1) Bermuda ; 2) Vermont in U.S.; 3) Hawaii in U.S.; 4) Luxembourg ; 5) Guernsey ; 6) Dublin
and 7) Federated States of Micronesia. A “pure” captive is defined as one which insures only
the parent’s and / or its subsidiaries’ risk. It does not cover the third party risk.
The captive is established by a Japanese company to finance losses occurred in Japan.
Because of Japanese Insurance Law which does not allow the risk existed in Japan to be directly
insured by non-licensed insurers, we have to consider a captive to act as a reinsurance vehicle
offshore ; that is, the risk in Japan is to be first insured by a licensed Japanese insurance com-
pany which then transfers 100 percentage of the risk for fee to the captive overseas. For sim-
plicity, we assume the fronting insurer does not cover risk at all. The licensed insurance
company, therefore, acts as a fronting servicer by issuing insurance policy and providing claim
services. The fixed percentage for such fronting services is deducted from the premium ceded
to the captive.
2 Data
This study uses the information from the database of IRMI (International Risk Management
Institute (2015)). It provides domicile regulations such as corporate tax rate, premium tax
rate, value of equity capital required for establishment, licensing fee and annual renewal fee
among others. The capital and fees also differ among classes of captives. We use the require-
ment for a pure reinsurance captive.
3 Tax Regulation in Japan and at Domiciles
Tax arbitrage is a big problem among country’s tax authorities. Tax arbitrage is the practice
of multi-national corporations to avoid tax liabilities by taking advantage of differences in corpo-
rate tax rates among countries.
Like those of other countries, Japanese tax authority has implemented so-called “Tax Haven
Law” (Tax Treatment No. 66 and Corporate Tax Law No. 11) where corporations whose head
office are located in Japan must consolidate into the parent’s the net income of their subsidiary
companies located in tax haven countries. National Tax Authority defines a tax haven country
where the local corporate tax rate is equal to or below 20 percent. Corporations are therefore
discouraged to set up their subsidiaries in a tax haven country only to reduce tax liabilities. In
other words, if the corporate tax rate is above 20 percent, the country is not recognized as a
Tax Impact on the Value of Japanese Captive Insurers 5
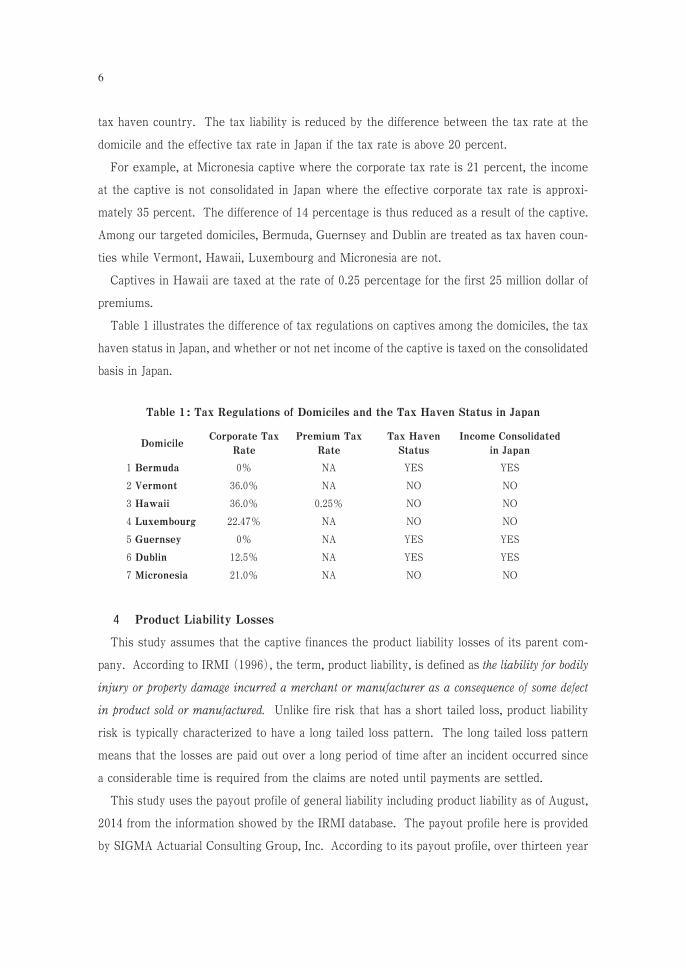
tax haven country. The tax liability is reduced by the difference between the tax rate at the
domicile and the effective tax rate in Japan if the tax rate is above 20 percent.
For example, at Micronesia captive where the corporate tax rate is 21 percent, the income
at the captive is not consolidated in Japan where the effective corporate tax rate is approxi-
mately 35 percent. The difference of 14 percentage is thus reduced as a result of the captive.
Among our targeted domiciles, Bermuda, Guernsey and Dublin are treated as tax haven coun-
ties while Vermont, Hawaii, Luxembourg and Micronesia are not.
Captives in Hawaii are taxed at the rate of 0.25 percentage for the first 25 million dollar of
premiums.
Table 1 illustrates the difference of tax regulations on captives among the domiciles, the tax
haven status in Japan, and whether or not net income of the captive is taxed on the consolidated
basis in Japan.
4 Product Liability Losses
This study assumes that the captive finances the product liability losses of its parent com-
pany. According to IRMI (1996), the term, product liability, is defined as the liability for bodily
injury or property damage incurred a merchant or manufacturer as a consequence of some defect
in product sold or manufactured. Unlike fire risk that has a short tailed loss, product liability
risk is typically characterized to have a long tailed loss pattern. The long tailed loss pattern
means that the losses are paid out over a long period of time after an incident occurred since
a considerable time is required from the claims are noted until payments are settled.
This study uses the payout profile of general liability including product liability as of August,
2014 from the information showed by the IRMI database. The payout profile here is provided
by SIGMA Actuarial Consulting Group, Inc. According to its payout profile, over thirteen year
6
Table 1: Tax Regulations of Domiciles and the Tax Haven Status in Japan
DomicileCorporate Tax
Rate
Premium Tax
Rate
Tax Haven
Status
Income Consolidated
in Japan
1 Bermuda 0% NA YES YES
2 Vermont 36.0% NA NO NO
3 Hawaii 36.0% 0.25% NO NO
4 Luxembourg 22.47% NA NO NO
5 Guernsey 0% NA YES YES
6 Dublin 12.5% NA YES YES
7 Micronesia 21.0% NA NO NO

after an incident occurs, 10 percentage is paid in that incident year, 23 percentage in the sec-
ond, 39 percentage in the third, 54 percentage in the fourth, 65 percentage in the fifth, 74 per-
centage, 79 percentage, 83 percentage, 86 percentage, 88 percentage, 90 percentage, 91
percentage, 93 percentage for the thirteenth year. These values are cumulative percentages.
Therefore, we assume that losses of a year are completely paid off in the fourteenth years.
5 Fees
Various fees are considered for establishing a captive and maintaining the company. For ex-
ample, the captive pays a fee to the fronting insurance company who issues the insurance policy
and provides services of claim payments.
This study considers the fee to be 5 percentage of the premium ceded to the captive. The
5 percentage is indicated typical according to Marsh Broker Japan, a subsidiary of the largest
captive management company. The captive pays also licensing fee for incorporation, licensing,
annual renewal fee to the local regulator, fee for management service, auditing, actuary, legal,
loss control advices, etc. Besides the indicated fees paid to the regulators, we assumed the 15
percentage of the premium income for fees of management, auditing, actuary, legal and loss
control services.
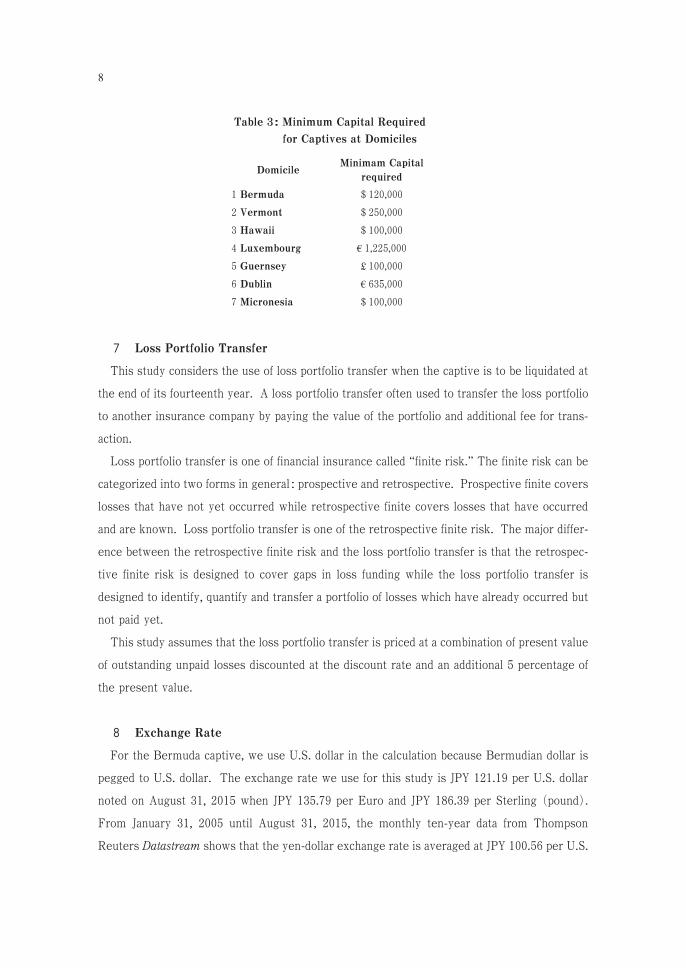
6 Capital Requirement
To maintain the financial stability of captives at the domicile, the local regulator requires the
captive to keep the capital at least as illustrated in Table 3. We use these values for the initial
investment when established.
Tax Impact on the Value of Japanese Captive Insurers 7
Table 2: Fees on Captives at Domiciles
Domicile Licensing Fee Annual Renewal Fee Actuary Review Fee
1 Bermuda $ 971 $ 971 NA
2 Vermont $ 500 $ 500 $ 5,000
3 Hawaii $ 6,000 $ 300 NA
4 Luxembourg $ 1,500 $ 7,500 NA
5 Guernsey �5,140 �5,140 NA
6 Dublin �5,709 �16,189 NA
7 Micronesia $ 500 $ 500 NA
7 Loss Portfolio Transfer
This study considers the use of loss portfolio transfer when the captive is to be liquidated at
the end of its fourteenth year. A loss portfolio transfer often used to transfer the loss portfolio
to another insurance company by paying the value of the portfolio and additional fee for trans-
action.
Loss portfolio transfer is one of financial insurance called “finite risk.” The finite risk can be
categorized into two forms in general : prospective and retrospective. Prospective finite covers
losses that have not yet occurred while retrospective finite covers losses that have occurred
and are known. Loss portfolio transfer is one of the retrospective finite risk. The major differ-
ence between the retrospective finite risk and the loss portfolio transfer is that the retrospec-
tive finite risk is designed to cover gaps in loss funding while the loss portfolio transfer is
designed to identify, quantify and transfer a portfolio of losses which have already occurred but
not paid yet.
This study assumes that the loss portfolio transfer is priced at a combination of present value
of outstanding unpaid losses discounted at the discount rate and an additional 5 percentage of
the present value.
8 Exchange Rate
For the Bermuda captive, we use U.S. dollar in the calculation because Bermudian dollar is
pegged to U.S. dollar. The exchange rate we use for this study is JPY 121.19 per U.S. dollar
noted on August 31, 2015 when JPY 135.79 per Euro and JPY 186.39 per Sterling (pound).
From January 31, 2005 until August 31, 2015, the monthly ten-year data from Thompson
Reuters Datastream shows that the yen-dollar exchange rate is averaged at JPY 100.56 per U.S.
8
Table 3: Minimum Capital Required
for Captives at Domiciles
DomicileMinimam Capital
required
1 Bermuda $ 120,000
2 Vermont $ 250,000
3 Hawaii $ 100,000
4 Luxembourg �1,225,000
5 Guernsey �100,000
6 Dublin �635,000
7 Micronesia $ 100,000
dollar and its standard deviation is JPY 14.53 while the yen-Euro is JPY 132.93 and 18.54, and
the yen-pound is 171.65 and 37.29, respectively.
9 Discount Rate
For this study, we used the rate of return on 10 year maturity Japanese Government Bonds
( JGB) as risk free rates. According to Doherty (1985), the value of discount factor should be
determined by risk factors. The two sources of risk in the cash flows derive from risk invest-
ment returns and from random incident of loss events.
Losses from product liability are assumed uncorrelated with market indices and therefore
free of systematic risk. Investment income, however, exhibits systematic risk which have the
effect of pulling the discount rate above the risk free rate. The 10 year maturity JGBs have had
an average of 1.138 percentage from Thompson Reuters Datastream. We use 2.0 percentage
for the discount rate by adding marginal systematic risk factor to the risk free rate.
10 Reinsurance
Purchase of reinsurance (retro) by the captive is not considered in this scenario for simplic-
ity and also for which the study aims to figure out the tax impact on the value of captive finance.
All the risk is therefore retained and financed by the captive.
11 Premiums
The fronting insurance company charges the premium for the product liability risk according
to the rate in the Japanese insurance market. The insurance rate is tightly regulated by the
Ministry of Finance. The rate is determined basically by pure loss ratios and operating expense
ratios. The most recent Statistics of Japanese Non-Life Insurance Business, 2013 indicates the
32.4 percentage as the percentage for overall operating expense ratio (denoted as OER) in the
non-life insurance business. For the sake of simplicity, the expected losses for the beginning
year is assumed to be JPY 100 million as an annual cumulative value (denoted as EL).
Accordingly, we come up the premium (denoted as P) to be calculated by the following for-
mula :
����
�����
The premium is assumed to grow at the rate of 5 percentage as a year passes while the ac-
cumulated annual loss amount grows at the same rate.
Tax Impact on the Value of Japanese Captive Insurers 9

� Results
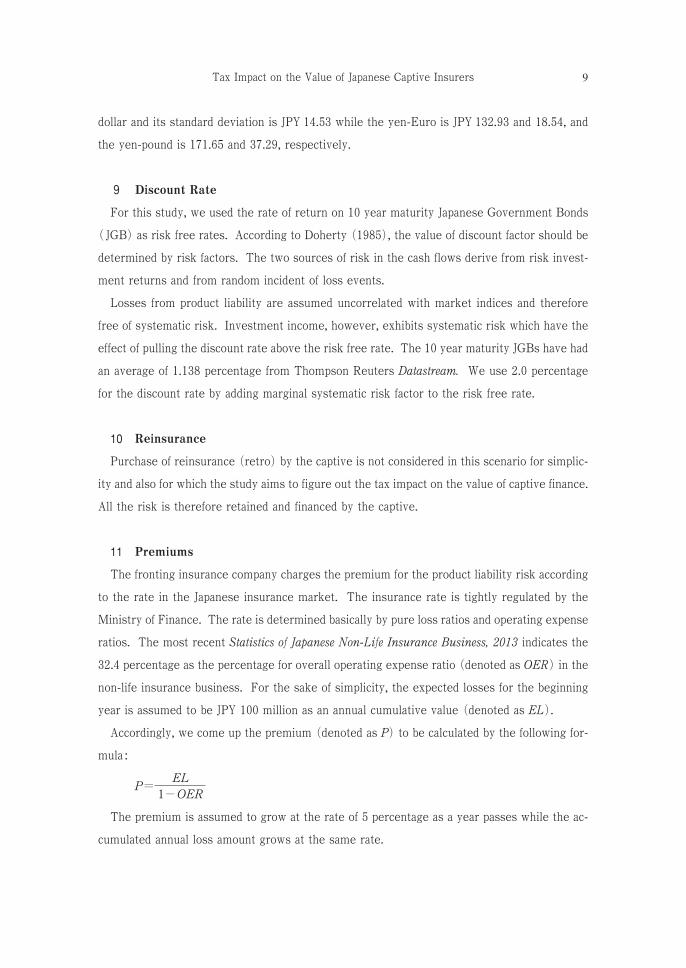
Figure 1 and Figure 2 show a portion of income statement and cash flow statement of the
Bermuda captive. Figure 3 illustrates the cash flows of the parent company using the Bermuda
captive and comes up the present value of establishing the Bermuda captive. Figure 4 illus-
trates the cash flows using traditional insurance and calculates the present value of using tradi-
tional insurance. The value of the captive minus the value of traditional insurance bring us the
net present value of the Bermuda captive.
These figures show the seven year time frame only but in the actual platforms the calculation
has extended to the fourteen years.
The study examines the present value of having the captive from the viewpoint of the parent
company to compare with the present value of purchasing traditional insurance. In the case of
Bermuda captive, the cost in value for the parent is approximately JPY 1,580 million. The cost
in value of traditional insurance is approximately JPY 1,604 million. Therefore, the net present
value of using captive finance is positive and approximately JPY 24 million.
10
Figure 1: Income Statement of Bermuda Captive
Income Statement of Bermuda Captive
Year 1 Year 2 Year 3 Year 4 Year 5 Year 6 Year 7
Underwriting Income
Premium �147,928,994 �155,325,444 �163,091,716 �171,246,302 �179,808,617 �188,799,048 �198,239,000
Tax shield value �51,775,148 �54,363,905 �57,082,101 �59,936,206 �62,933,016 �66,079,667 �69,383,650
Fronting fee �7,396,450 �7,766,272 �8,154,586 �8,562,315 �8,990,431 �9,439,952 �9,911,950
Net ceding premium �140,532,544 �147,559,172 �154,937,130 �162,683,987 �170,818,186 �179,359,095 �188,327,050
in the local currency $ 1,159,652.96 $ 1,217,635.61 $ 1,278,517.39 $ 1,342,443.26 $ 1,409,565.42 $ 1,480,043.70 $ 1,554,045.88
Premium Income $ 1,159,652.96 $ 1,217,635.61 $ 1,278,517.39 $ 1,342,443.26 $ 1,409,565.42 $ 1,480,043.70 $ 1,554,045.88
Underwriting Expense
Ultimate Incurred
Losses$ 825,184.64 $ 866,443.87 $ 909,766.06 $ 955,254.36 $ 1,003,017.08 $ 1,053,167.94 $ 1,105,826.33
Cost of LPT
LPT fee
Initial set-up costs $ 971.00
Operating costs $ 173,947.94 $ 182,645.34 $ 191,777.61 $ 201,366.49 $ 211,434.81 $ 222,006.55 $ 233,106.88
Annual cost $ 971.00 $ 971.00 $ 971.00 $ 971.00 $ 971.00 $ 971.00
Premium tax $ 0.00 $ 0.00 $ 0.00 $ 0.00 $ 0.00 $ 0.00 $ 0.00
Total Expenses $ 1,000,103.58 $ 1,050,060.21 $ 1,102,514.67 $ 1,157,591.85 $ 1,215,422.90 $ 1,276,145.49 $ 1,339,904.21
Underwriting Profit $ 159,549.38 $ 167,575.40 $ 176,002.72 $ 184,851.41 $ 194,142.53 $ 203,898.21 $ 214,141.67
Invest. Income $ 1,560.00 $ 13,288.80 $ 24,210.11 $ 33,961.74 $ 42,592.46 $ 50,475.34 $ 57,787.53
EBIT $ 161,109.38 $ 180,864.21 $ 200,212.84 $ 218,813.15 $ 236,734.99 $ 254,373.55 $ 271,929.20
Income Tax Exp. $ 0.00 $ 0.00 $ 0.00 $ 0.00 $ 0.00 $ 0.00 $ 0.00
Net Income $ 161,109.38 $ 180,864.21 $ 200,212.84 $ 218,813.15 $ 236,734.99 $ 254,373.55 $ 271,929.20
Divident payments 0 0 0 0 0 0 0
Earned Surplus $ 161,109.38 $ 180,864.21 $ 200,212.84 $ 218,813.15 $ 236,734.99 $ 254,373.55 $ 271,929.20
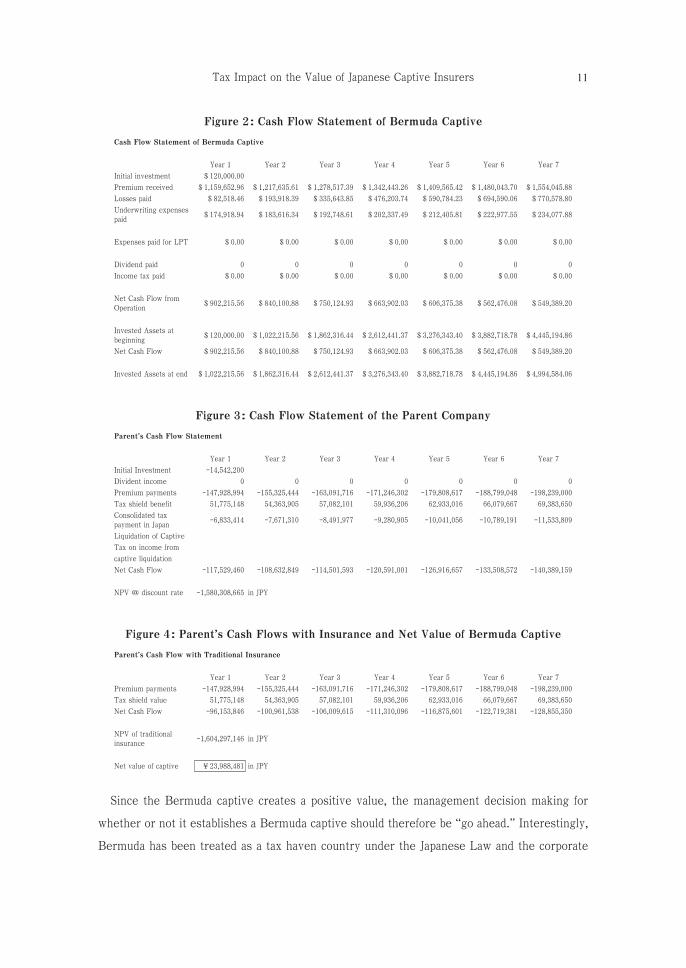
Since the Bermuda captive creates a positive value, the management decision making for
whether or not it establishes a Bermuda captive should therefore be “go ahead.” Interestingly,
Bermuda has been treated as a tax haven country under the Japanese Law and the corporate
Tax Impact on the Value of Japanese Captive Insurers 11
Figure 3: Cash Flow Statement of the Parent Company
Parent’s Cash Flow Statement
Year 1 Year 2 Year 3 Year 4 Year 5 Year 6 Year 7
Initial Investment �14,542,200
Divident income 0 0 0 0 0 0 0
Premium payments �147,928,994 �155,325,444 �163,091,716 �171,246,302 �179,808,617 �188,799,048 �198,239,000
Tax shield benefit 51,775,148 54,363,905 57,082,101 59,936,206 62,933,016 66,079,667 69,383,650
Consolidated tax
payment in Japan�6,833,414 �7,671,310 �8,491,977 �9,280,905 �10,041,056 �10,789,191 �11,533,809
Liquidation of Captive
Tax on income from
captive liquidation
Net Cash Flow �117,529,460 �108,632,849 �114,501,593 �120,591,001 �126,916,657 �133,508,572 �140,389,159
NPV @ discount rate �1,580,308,665 in JPY
Figure 4: Parent’s Cash Flows with Insurance and Net Value of Bermuda Captive
Parent’s Cash Flow with Traditional Insurance
Year 1 Year 2 Year 3 Year 4 Year 5 Year 6 Year 7
Premium payments �147,928,994 �155,325,444 �163,091,716 �171,246,302 �179,808,617 �188,799,048 �198,239,000
Tax shield value 51,775,148 54,363,905 57,082,101 59,936,206 62,933,016 66,079,667 69,383,650
Net Cash Flow �96,153,846 �100,961,538 �106,009,615 �111,310,096 �116,875,601 �122,719,381 �128,855,350
NPV of traditional
insurance�1,604,297,146 in JPY
Net value of captive �23,988,481 in JPY
Figure 2: Cash Flow Statement of Bermuda Captive
Cash Flow Statement of Bermuda Captive
Year 1 Year 2 Year 3 Year 4 Year 5 Year 6 Year 7
Initial investment $ 120,000.00
Premium received $ 1,159,652.96 $ 1,217,635.61 $ 1,278,517.39 $ 1,342,443.26 $ 1,409,565.42 $ 1,480,043.70 $ 1,554,045.88
Losses paid $ 82,518.46 $ 193,918.39 $ 335,643.85 $ 476,203.74 $ 590,784.23 $ 694,590.06 $ 770,578.80
Underwriting expenses
paid$ 174,918.94 $ 183,616.34 $ 192,748.61 $ 202,337.49 $ 212,405.81 $ 222,977.55 $ 234,077.88
Expenses paid for LPT $ 0.00 $ 0.00 $ 0.00 $ 0.00 $ 0.00 $ 0.00 $ 0.00
Dividend paid 0 0 0 0 0 0 0
Income tax paid $ 0.00 $ 0.00 $ 0.00 $ 0.00 $ 0.00 $ 0.00 $ 0.00
Net Cash Flow from
Operation$ 902,215.56 $ 840,100.88 $ 750,124.93 $ 663,902.03 $ 606,375.38 $ 562,476.08 $ 549,389.20
Invested Assets at
beginning$ 120,000.00 $ 1,022,215.56 $ 1,862,316.44 $ 2,612,441.37 $ 3,276,343.40 $ 3,882,718.78 $ 4,445,194.86
Net Cash Flow $ 902,215.56 $ 840,100.88 $ 750,124.93 $ 663,902.03 $ 606,375.38 $ 562,476.08 $ 549,389.20
Invested Assets at end $ 1,022,215.56 $ 1,862,316.44 $ 2,612,441.37 $ 3,276,343.40 $ 3,882,718.78 $ 4,445,194.86 $ 4,994,584.06
tax is taxed in Japan on the net income of the Bermuda captive in the consolidated basis. The
result implies that the income consolidation because of tax haven law is irrelevant to the deci-
sion making of the captive finance for Bermuda captive.
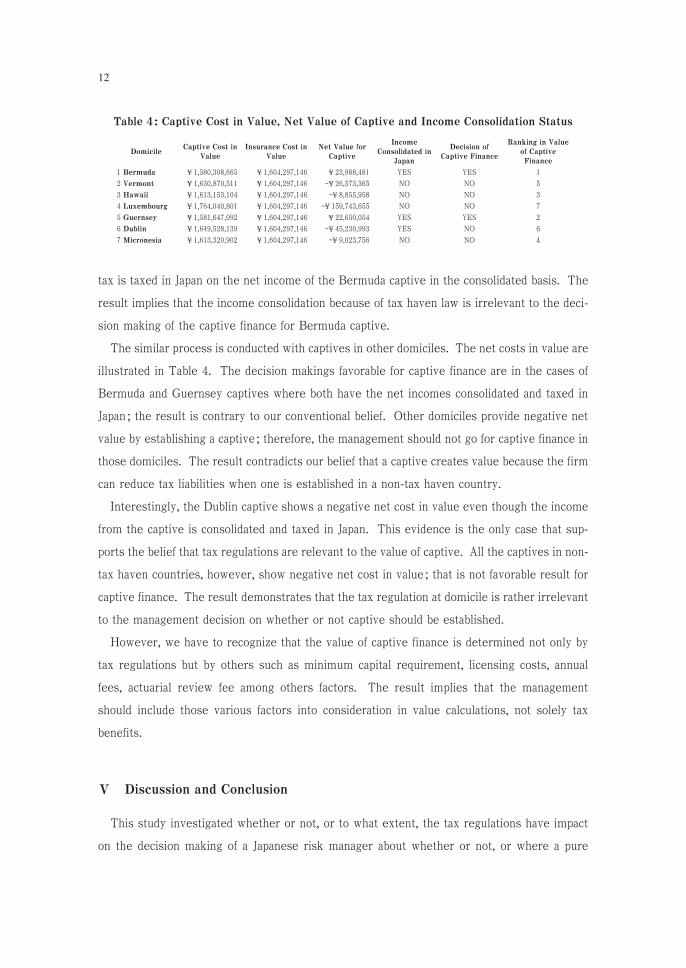
The similar process is conducted with captives in other domiciles. The net costs in value are
illustrated in Table 4. The decision makings favorable for captive finance are in the cases of
Bermuda and Guernsey captives where both have the net incomes consolidated and taxed in
Japan ; the result is contrary to our conventional belief. Other domiciles provide negative net
value by establishing a captive ; therefore, the management should not go for captive finance in
those domiciles. The result contradicts our belief that a captive creates value because the firm
can reduce tax liabilities when one is established in a non-tax haven country.
Interestingly, the Dublin captive shows a negative net cost in value even though the income
from the captive is consolidated and taxed in Japan. This evidence is the only case that sup-
ports the belief that tax regulations are relevant to the value of captive. All the captives in non-
tax haven countries, however, show negative net cost in value ; that is not favorable result for
captive finance. The result demonstrates that the tax regulation at domicile is rather irrelevant
to the management decision on whether or not captive should be established.
However, we have to recognize that the value of captive finance is determined not only by
tax regulations but by others such as minimum capital requirement, licensing costs, annual
fees, actuarial review fee among others factors. The result implies that the management
should include those various factors into consideration in value calculations, not solely tax
benefits.
� Discussion and Conclusion
This study investigated whether or not, or to what extent, the tax regulations have impact
on the decision making of a Japanese risk manager about whether or not, or where a pure
12
Table 4: Captive Cost in Value, Net Value of Captive and Income Consolidation Status
DomicileCaptive Cost in
Value
Insurance Cost in
Value
Net Value for
Captive
Income
Consolidated in
Japan
Decision of
Captive Finance
Ranking in Value
of Captive
Finance
1 Bermuda �1,580,308,665 �1,604,297,146 �23,988,481 YES YES 1
2 Vermont �1,630,870,511 �1,604,297,146 ��26,573,365 NO NO 5
3 Hawaii �1,613,153,104 �1,604,297,146 ��8,855,958 NO NO 3
4 Luxembourg �1,764,040,801 �1,604,297,146 ��159,743,655 NO NO 7
5 Guernsey �1,581,647,092 �1,604,297,146 �22,650,054 YES YES 2
6 Dublin �1,649,528,139 �1,604,297,146 ��45,230,993 YES NO 6
7 Micronesia �1,613,320,902 �1,604,297,146 ��9,023,756 NO NO 4

captive should be established. We have selected seven popular captive domiciles for Japanese
firms, namely Bermuda, Vermont, Hawaii, Luxembourg, Guernsey, Dublin and Federated
States of Micronesia. Their distinct tax regulations and difference in application for tax haven
law in Japan appear to influence the decision making of many Japanese risk managers in choos-
ing the domicile. For this important research question especially for risk management practice,
we used a scenario approach and discounted cash flow method, in which a captive is to be set
up in these domiciles with the identical losses but different tax regulations applied in accor-
dance with the latest domicile information.
As a result of our study, Bermuda and Guernsey captives have created net positive values
even though those countries are treated as “Tax Haven” countries for which the net income at
captives are consolidated in Japan in accordance with the law. Other captives provide negative
net value with captive finance. The implication is that a captive should not be established only
because the domicile reduces the corporate tax liability. The result contradicts our conven-
tional belief that tax haven status of the domicile where corporate tax rate is equal to or below
twenty percentage would have a negative impact on captives. Our study shows that these cap-
tives are followed by Hawaii, Micronesia, Vermont, Dublin and Luxembourg captive in net
value ranking. The selection based on its net value created to the parent is irrelevant to the
tax regulations surrounding the captive.
The result provides us an important conclusion ; that is, the captive does not necessarily pro-
vide the positive net value from the reduction in tax liabilities. Japanese risk managers should
consider all the business situation surrounding the captive finance in selecting the best domi-
cile for their firms, for example, its capital requirement, minimum solvency needed to be main-
tained, regulatory burden such as licensing, annual renewal and actuary review fees among
other factors.
Use of captive is becoming strategically important. An evidence is demonstrated by Mr. Alan
Kubitz, manager of finance and captive operations at the American Automobile Association
Northern California who is currently looking to form a new U.S.-based captive for employee
benefits-related coverage such as group life insurance and long-term disability. We can say that
captive finance could be more widely utilized than before and therefore become critically impor-
tant for the organization. Japanese firms are also expected to follow such trend of captive fi-
nance as they become more globally operated. Risk managers of Japanese firms should
strategically plan a captive and carefully select a domicile by which the business plan can be ef-
fectively achieved.
Tax Impact on the Value of Japanese Captive Insurers 13
Acknowledgements
This study and related activities were financially supported by Japan Society for the Promotion of
Science (KAKENHI Grant Number 25512010). This study could not have been completed without
this financial support, for which we are very grateful.
References
Adams, M. and D. Hillier, “The Effect of Captive Formation on Stock Returns : An Empirical Test from
the UK,” Journal of Banking and Finance, 24(11), 2000, pp. 1787�1807.
Bawcutt Paul updated by Colin Hadley, “European Captive Scene,” International Risk Management
Institute’s Risk Financing Volume I, 2011, IV. J. I�11.
Business Insurance, “Special Report : Captives Grow as Economy Recovers,” March 11, 2013 issue, pp
19�24.
Captive Insurance Companies Association, “CICA : 40 years of captive leadership,” Newton Media
Limited, 2012.
Diallo, A. and S. Kim, “Asymmetric Information Captive Insurers’ Formation, and Managers’ Welfare
Gain,” Journal of Risk and Insurance, 56(2), 1989, pp. 233�251.
Doherty, Neil, “Corporate Risk Management-A Financial Exposition,” McGraw Hill, 1985.
Ikeuchi M., Y. Maeda and F. Sugino, “Japanese Corporations and Captives : Theory and Practice of Risk
Financing (in Japanese),” Hoken Mainichi Shimbun, 2014.
International Risk Management Institute Inc., “IRMI’s Risk Financing, Strategies for Insurance Cash
Flow and Alternative Funding,” 2015. Data in www.IRMI.com is accessed on September 1, 2015.
International Risk Management Institute Inc., “Glossary of Insurance and Risk Management Terms,
Sixth Edition,” 1996.
KPMG Japan, “Foreign Dividend Exclusion,”
http : // www.kpmg.or.jp / knowledge / glossary / tax_fde.html, Web Accessed Sept 3, 2013.
Lenrow G. I., J. H. Brainerd, J. Hall and M. S. Heritz, “Captive Insurers : Pitfalls and Practicabilities,”
Best’s Review, Vol. 82, 12, 1982.
Luxembourg for business, http : // www.luxembourgforbusiness.lu / headquarters, Web Accessed Sept
3, 2013.
Maeda, Yuji. “Risk Financing through Captive Insurer (in Japanese),” Journal of Insurance Science of
Japan, Number 590, 2005, pp 72�89.
Maeda, Yuji and Y. Sakai, “Risk Financing through Captive Insurer : Economic Influences of Captives
on Corporations and the First Domicile in Japan,” Journal of Risk Research, Vol. 10, Issue 6, 2007,
pp 793�803.
Maeda, Y., Y. Suzawa and N. Scordis, “Shareholder Value : The Case of Japanese Captive Insurers,”
Asia-Pacific Journal of Risk and Insurance, Volume 5 Issue 1 Article 3, 2011.
Maeda, Yuji. “Demand for Captives and Domiciles : Why are Countries and States Rushing into
Captives ?” Kwansei Gakuin University Social Sciences Review, Vol. 17, 2012, pp 45�62.
Maeda, Yuji. “Creating Value with a Captive Insurer in Europe,” Kwansei Gakuin University Social
14

Sciences Review, Vol 18, 2013, pp 101�118.
Maeda, Yuji. “Role of Corporate Risk Management and Captives (in Japanese),” Kwansei Gakuin
University Press, 2015.
Morimiya, Yasushi. “Captive Research (in Japanese),” Songai Hoken Jigyou Kenkyusho, 1997.
Scordis, N. and J. Barrese and M. Yokoyama, “Conditions for Captive Insurer Value : A Monte Carlo
Simulation,” Journal of Insurance Issues, 30(2), 2007, pp. 79�101.
Scordis, N. and M. Porat, “Captive Insurance Companies and Manager-Owner Conflicts,” Journal of
Risk and Insurance, 365(2), 1998, pp. 319�330.
Tax Impact on the Value of Japanese Captive Insurers 15