Embed Size (px)
Citation preview
Journal of Public Economics 93 (2009) 855–866
Contents lists available at ScienceDirect
Journal of Public Economics
j ourna l homepage: www.e lsev ie r.com/ locate / jpube
Tax structures in developing countries: Many puzzles and a possible explanation
Roger Gordon a,⁎, Wei Li b,1
a UCSD Department of Economics, 9500 Gilman Dr., Dept. 0508 La Jolla, CA92093-0508, United Statesb Graduate School of Business, University of Virginia, Post Office Box 6550, Charlottesville, VA 22906, United States
⁎ Corresponding author. Tel.: +1 858 534 4828.E-mail addresses: [email protected] (R. Gordon), Li
1 Tel.: +1 434 243 7691.
0047-2727/$ – see front matter © 2009 Elsevier B.V. Adoi:10.1016/j.jpubeco.2009.04.001
a b s t r a c t
a r t i c l e i n f oArticle history:Received 17 November 2006Received in revised form 27 March 2009Accepted 1 April 2009Available online 9 April 2009
JEL classification:H21O23O17F23F13
Keywords:Tax policy in developing countriesInformal economyInflationTariffsRed tapeCapital taxesCorruption
Tax policies seen in developing countries are puzzling on many dimensions, given the sharp contrastbetween these policies and both those seen in developed countries and those forecast in the optimal taxliterature. In this paper, we explore how forecasted policies change if firms can successfully evade taxes byconducting all business in cash, thereby avoiding any use of the financial sector. The forecasted policies arenow much closer to those observed.
© 2009 Elsevier B.V. All rights reserved.
Observed tax structures vary substantially across countries and
over time. Why?To some extent, these differences may simply reflect differences insocial preferences for public vs. private goods. Countries differsubstantially, for example, in the amount spent on the military, oninfrastructure investments, on publicly provided education, or onsocial insurance. Higher spending levels require higher revenue,leading to higher tax rates.
To some extent, these differences may also reflect differences inthe political support for redistribution. More redistribution naturallyrequires higher tax rates on the rich in order to finance lower tax ratesor transfers to the poor. Governments with a stronger preference forredistribution would rely more on progressive personal income taxes,whereas other governments may choose less progressive personaltaxes and make more use of proportional taxes such as a value-addedtax or a payroll tax.
Other differences, though, are more puzzling based on conven-tional models of optimal tax structure. Regardless of a country's tastesfor public vs. private goods or for more or less redistribution, Diamond
[email protected] (W. Li).
ll rights reserved.
and Mirrlees (1971) forecast that the optimal tax structure willpreserve production efficiency under plausible assumptions.2 Thisrules out tariffs in any country that lacks market power ininternational markets. It rules out differential taxes on goodsproduced domestically in one industry vs. another. Atkinson andStiglitz (1976) go further and argue that as long as a country canflexibly choose the rate structure under the personal income tax, thenit has no reason to choose differential tax rates on the consumption ofdifferent goods.3 Not only does this rule out differential excise taxrates by good but it also rules out taxes on income from savings, whichimplicitly impose higher tax rates on goods consumed further into thefuture. Regarding possible revenue from seignorage, Friedman (1969)argues that a country would optimally choose a deflation ratesufficient to generate a nominal interest rate close to zero, so as toavoid any real costs of liquidity.
While these forecasts of no tariffs, no taxes on capital income,uniform taxes on consumption, and deflation, are not consistent withany existing tax structures, they are not sharply inconsistent withobserved tax policies among the most developed countries. With
2 In particular, this conclusion requires access to separate tax rates on expenditureson different goods and on income from the supply of different factors.
3 This conclusion follows if the utility function is weakly separable between leisureand consumption.
8 See Lemieux, Fortin, and Frechette (1994), though, for some empirical evidence onthe how taxes affect the size of the informal sector.
9 Piggott and Whalley (2001) assume, for example, that one good (manufacturedproducts) must be produced in the formal (taxed) sector, whereas a second (services)can be produced in either the formal or the informal sector. Emran and Stiglitz (2005)assume instead that the second good is only produced in the informal sector.10 Keen (2006), however, notes that a VAT includes a tax on imported goods, with a
856 R. Gordon, W. Li / Journal of Public Economics 93 (2009) 855–866
GATT and now the WTO, tariffs are indeed very low among developedcountries. At this point, nominal interest rates are very low amongmost developed countries, even if deflation is rare. While capitalincome is still subject to tax in various ways, Gordon, Kalambokidis,and Slemrod (2004a,b) report evidence that the U.S. collects little orno net revenue from taxes on capital income, and imposes relativelylow distortions on investment and savings.4 While even the richestcountries maintain some important excise taxes, e.g. on gasoline,cigarettes, and liquor, an argument can easily be made that thesespecific taxes help internalize various consumption externalities.
Tax policies in developing countries are much more puzzling,however, in light of these forecasts from the optimal taxmodels. Thesedifferences are laid out in more detail in Section 1. The corporateincome tax is a much more important source of tax revenue amongdeveloping vs. developed countries, as are tariffs and seignorage.5
Poorer countries collect much less revenue from personal incometaxes, yet it seems puzzling that distributional preferences shouldsystematically be so much weaker among poorer countries. On net,poorer countries collect on average only two-thirds or less of theamount of tax revenue that richer countries do, as a fraction of GDP.Yet, given the severe needs for investments in say infrastructure andeducation in these countries, is it plausible that the lack of revenuesimply represents differing tastes for public vs. private goods in poorvs. rich countries?
One natural response to these differences between forecastedpolicies and those observed in developing countries is to concludethat the policies in developing countries should be changed. Newberyand Stern (1987), for example, set out the standard forecasts fromoptimal tax models as an ideal tax structure that developing countriesshould emulate. This is also the basis for recommendations, e.g. fromthe World Bank and IMF, that developing countries should reducetheir tariff and inflation rates, and rely more on value-added taxeswith a uniform rate across industries, rather than on excise taxes orcorporate income taxes.6 Poorer countries have indeed shiftedtowards more use of the value-added tax in recent years with moreuniform rates by industry than had existed under the prior taxstructures. But otherwise the puzzling differences remain.
This leaves unanswered why poorer countries so systematicallychoose the wrong policies, and why these wrong policies haveremained so stable over time. Perhaps political economy problems aremore severe among developing countries, and some importantdomestic constituency gains from the policies that standard modelsfind perverse. Yet these puzzling policies are found under manydifferent types of governments, drawing their support from manydifferent constituencies.7
Perhaps poorer countries lack the best enforcement methods, e.g.based on modern information technology. Certainly computertechnology helps pool information from different sources. Bird(1989) argues, however, that the key problem is acquiring reliableinformation, not processing it.
In this paper, we explore whether the inconsistency between theforecasts from optimal tax models and the data reflects instead aproblem with the models. The starting point for our approach is theobservation of greater tax enforcement problems in poorer countries.
4 Similar results have been found for a number of European countries.5 Similar polices in fact were observed in the past in the U.S. and other currently
richer countries. As documented for example in Hinrichs (1966), until the 1930s theU.S. relied for revenue primarily on tariffs, selective excise taxes, seignorage, andeventually a corporate income tax.
6 See Gillis (1989) for similar advice from tax academics who have adviseddeveloping countries on their tax policies. Here, the key focus is on establishing auniform rate value-added tax, in order to eliminate tax-induced distortions to thecomposition of consumption.
7 Gordon and Li (2007) explores a particular political economy model, based onGrossman and Helpman (1994), and is unable to explain any of the puzzling policiesdescribed above.
According to the estimates reported in Schneider and Enste (2002),for example, the informal economy on average is only about 15% ofGDP among OECD countries, and thus small enough that it should notbe a driving factor in the choice of tax structure. However, amongdeveloping countries, the median size of the informal economy theyreport is 37% of GDP, ranging from 13% in Hong Kong and Singapore to71% in Thailand and 76% in Nigeria.
With such a large informal sector, any effects of the tax structure,or of government policies more generally, on the size of the informalsector can be of first-order importance in the choice of these policies.Yet at this point, we know relatively little about how policies affect thesize of the informal sector, or why the informal sector is so muchlarger in developing than in developed economies.8
One approach to examining the role of the informal sectorexplored in the past is to assume that only certain goods can beproduced in the informal sector.9 Taxes on the formal sector thenlower demand for goods produced in the formal sector and expandproduction in the informal sector. This additional behavioral responselowers optimal tax rates, particularly on those goods where thispotential response is greater. Piggott and Whalley (2001) use thisreasoning to argue for lower taxes on services relative to manufactur-ing, since services can more readily be provided by informal firms.Emran and Stiglitz (2005) argue that the attraction of a VAT isundermined by this possible shift from the formal to the informalsectors, to the point that tariffs may provide a less distorting source oftax revenue.10
These papers, though, do not attempt to explain why the informalsector is larger in developing countries,11 and provide little help inunderstanding why certain goods are more likely to be produced inthe informal sector. In this paper, we explore the implications of aspecific hypothesis about the factors affecting the choice by a firmwhether to be part of the formal or the informal economy. We showthat adding this hypothesis to an otherwise standard optimal taxmodel can easily explainmany of the seemingly perverse policies seenin poorer countries, suggesting that these policies may be sensibleways to deal with the economic pressures the countries face.
The key assumption in the paper is that firms can avoid taxpayments in any country by shifting entirely to cash transactions andnot using the financial sector, thereby avoiding leaving any papertrail.12 When firms make use of the financial sector, in contrast, thegovernment can gain access to their bank records and use thisinformation in enforcing the tax law.13 Firms then have to choosewhether the economic benefits from use of the financial sector aregreater or less than the resulting tax liabilities. Poorer countries differfrom richer countries under our hypothesis simply because the valuefirms receive from using the financial sector is much more modest.14
credit received only for firms that are part of the formal sector. Taking into account thisaspect of a VAT, he shows that tariffs are not appropriate.11 Piggott and Whalley (2001) in fact focus on tax policy in Canada.12 Cash transactions are extremely hard to monitor even in the richest countries.Likely for this reason, illegal activity seems to rely heavily on cash transactions.13 Among the richest countries, governments rely on firms to provide informationabout individual wage and dividend incomes, and rely on accounting reports and taxaudits both to double-check these reports by firms on individual earnings and todocument each firm’s own earnings. Accounting firms and tax audits, in turn, relyheavily on the records of a firm’s transactions through the financial sector, makingthese records a key underlying source of information supporting most forms of taxes.14 The quality of services provided by the financial sector in poor countries may beworse. Alternatively, firms with lower productivity may have less need for the financialsector, perhaps because they rely less on long-distance payments and also perhapsbecause they are less capital intensive and have less need for bank loans.
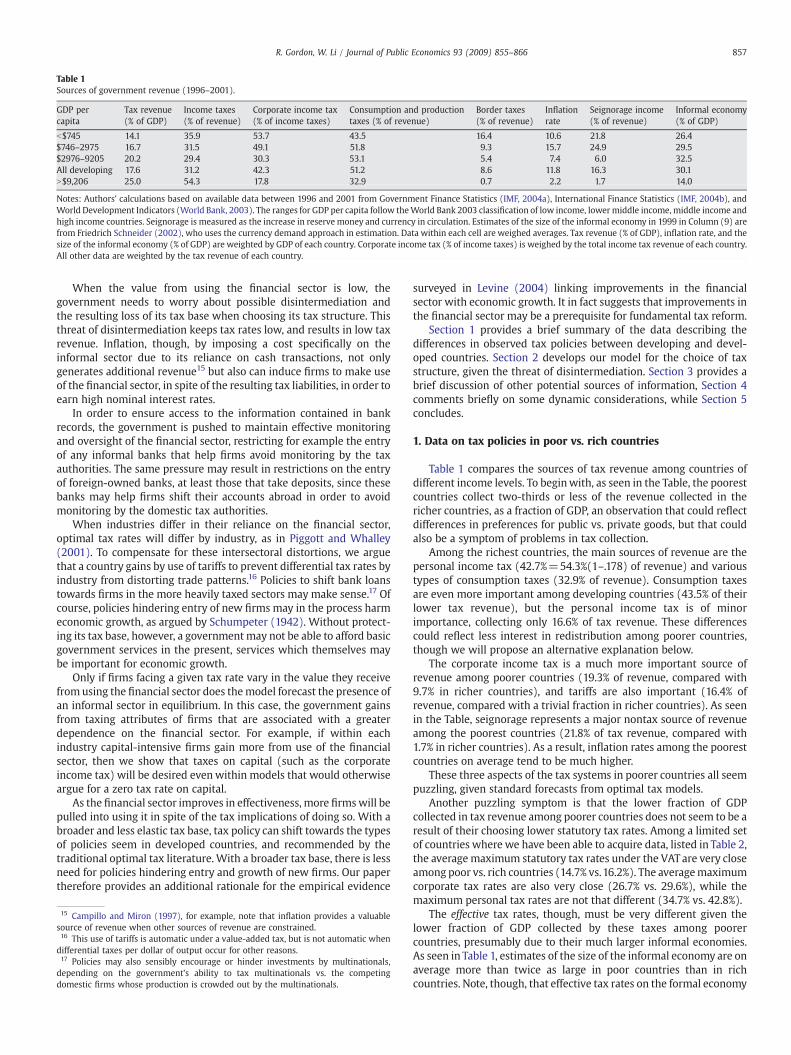
Table 1Sources of government revenue (1996–2001).
GDP percapita
Tax revenue(% of GDP)
Income taxes(% of revenue)
Corporate income tax(% of income taxes)
Consumption and productiontaxes (% of revenue)
Border taxes(% of revenue)
Inflationrate
Seignorage income(% of revenue)
Informal economy(% of GDP)
b$745 14.1 35.9 53.7 43.5 16.4 10.6 21.8 26.4$746–2975 16.7 31.5 49.1 51.8 9.3 15.7 24.9 29.5$2976–9205 20.2 29.4 30.3 53.1 5.4 7.4 6.0 32.5All developing 17.6 31.2 42.3 51.2 8.6 11.8 16.3 30.1N$9,206 25.0 54.3 17.8 32.9 0.7 2.2 1.7 14.0
Notes: Authors' calculations based on available data between 1996 and 2001 from Government Finance Statistics (IMF, 2004a), International Finance Statistics (IMF, 2004b), andWorld Development Indicators (World Bank, 2003). The ranges for GDP per capita follow theWorld Bank 2003 classification of low income, lowermiddle income, middle income andhigh income countries. Seignorage is measured as the increase in reserve money and currency in circulation. Estimates of the size of the informal economy in 1999 in Column (9) arefrom Friedrich Schneider (2002), who uses the currency demand approach in estimation. Data within each cell are weighed averages. Tax revenue (% of GDP), inflation rate, and thesize of the informal economy (% of GDP) are weighted by GDP of each country. Corporate income tax (% of income taxes) is weighed by the total income tax revenue of each country.All other data are weighted by the tax revenue of each country.
857R. Gordon, W. Li / Journal of Public Economics 93 (2009) 855–866
When the value from using the financial sector is low, thegovernment needs to worry about possible disintermediation andthe resulting loss of its tax base when choosing its tax structure. Thisthreat of disintermediation keeps tax rates low, and results in low taxrevenue. Inflation, though, by imposing a cost specifically on theinformal sector due to its reliance on cash transactions, not onlygenerates additional revenue15 but also can induce firms to make useof the financial sector, in spite of the resulting tax liabilities, in order toearn high nominal interest rates.
In order to ensure access to the information contained in bankrecords, the government is pushed to maintain effective monitoringand oversight of the financial sector, restricting for example the entryof any informal banks that help firms avoid monitoring by the taxauthorities. The same pressure may result in restrictions on the entryof foreign-owned banks, at least those that take deposits, since thesebanks may help firms shift their accounts abroad in order to avoidmonitoring by the domestic tax authorities.
When industries differ in their reliance on the financial sector,optimal tax rates will differ by industry, as in Piggott and Whalley(2001). To compensate for these intersectoral distortions, we arguethat a country gains by use of tariffs to prevent differential tax rates byindustry from distorting trade patterns.16 Policies to shift bank loanstowards firms in the more heavily taxed sectors may make sense.17 Ofcourse, policies hindering entry of new firms may in the process harmeconomic growth, as argued by Schumpeter (1942). Without protect-ing its tax base, however, a governmentmay not be able to afford basicgovernment services in the present, services which themselves maybe important for economic growth.
Only if firms facing a given tax rate vary in the value they receivefromusing the financial sector does themodel forecast the presence ofan informal sector in equilibrium. In this case, the government gainsfrom taxing attributes of firms that are associated with a greaterdependence on the financial sector. For example, if within eachindustry capital-intensive firms gain more from use of the financialsector, then we show that taxes on capital (such as the corporateincome tax) will be desired evenwithin models that would otherwiseargue for a zero tax rate on capital.
As the financial sector improves in effectiveness, more firmswill bepulled into using it in spite of the tax implications of doing so. With abroader and less elastic tax base, tax policy can shift towards the typesof policies seem in developed countries, and recommended by thetraditional optimal tax literature.With a broader tax base, there is lessneed for policies hindering entry and growth of new firms. Our papertherefore provides an additional rationale for the empirical evidence
15 Campillo and Miron (1997), for example, note that inflation provides a valuablesource of revenue when other sources of revenue are constrained.16 This use of tariffs is automatic under a value-added tax, but is not automatic whendifferential taxes per dollar of output occur for other reasons.17 Policies may also sensibly encourage or hinder investments by multinationals,depending on the government’s ability to tax multinationals vs. the competingdomestic firms whose production is crowded out by the multinationals.
surveyed in Levine (2004) linking improvements in the financialsector with economic growth. It in fact suggests that improvements inthe financial sector may be a prerequisite for fundamental tax reform.
Section 1 provides a brief summary of the data describing thedifferences in observed tax policies between developing and devel-oped countries. Section 2 develops our model for the choice of taxstructure, given the threat of disintermediation. Section 3 provides abrief discussion of other potential sources of information, Section 4comments briefly on some dynamic considerations, while Section 5concludes.
1. Data on tax policies in poor vs. rich countries
Table 1 compares the sources of tax revenue among countries ofdifferent income levels. To beginwith, as seen in the Table, the poorestcountries collect two-thirds or less of the revenue collected in thericher countries, as a fraction of GDP, an observation that could reflectdifferences in preferences for public vs. private goods, but that couldalso be a symptom of problems in tax collection.
Among the richest countries, the main sources of revenue are thepersonal income tax (42.7%=54.3%(1–.178) of revenue) and varioustypes of consumption taxes (32.9% of revenue). Consumption taxesare even more important among developing countries (43.5% of theirlower tax revenue), but the personal income tax is of minorimportance, collecting only 16.6% of tax revenue. These differencescould reflect less interest in redistribution among poorer countries,though we will propose an alternative explanation below.
The corporate income tax is a much more important source ofrevenue among poorer countries (19.3% of revenue, compared with9.7% in richer countries), and tariffs are also important (16.4% ofrevenue, compared with a trivial fraction in richer countries). As seenin the Table, seignorage represents a major nontax source of revenueamong the poorest countries (21.8% of tax revenue, compared with1.7% in richer countries). As a result, inflation rates among the poorestcountries on average tend to be much higher.
These three aspects of the tax systems in poorer countries all seempuzzling, given standard forecasts from optimal tax models.
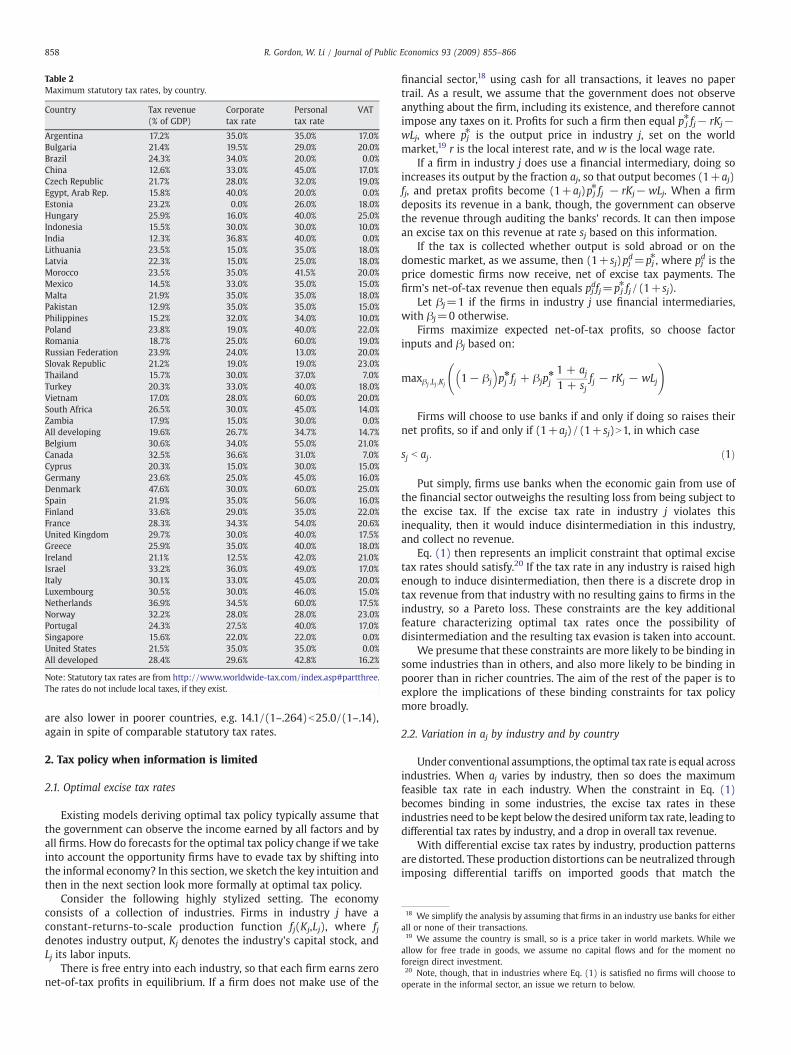
Another puzzling symptom is that the lower fraction of GDPcollected in tax revenue among poorer countries does not seem to be aresult of their choosing lower statutory tax rates. Among a limited setof countries where we have been able to acquire data, listed in Table 2,the averagemaximum statutory tax rates under the VAT are very closeamong poor vs. rich countries (14.7% vs.16.2%). The averagemaximumcorporate tax rates are also very close (26.7% vs. 29.6%), while themaximum personal tax rates are not that different (34.7% vs. 42.8%).
The effective tax rates, though, must be very different given thelower fraction of GDP collected by these taxes among poorercountries, presumably due to their much larger informal economies.As seen in Table 1, estimates of the size of the informal economy are onaverage more than twice as large in poor countries than in richcountries. Note, though, that effective tax rates on the formal economy
18 We simplify the analysis by assuming that firms in an industry use banks for eitherall or none of their transactions.19 We assume the country is small, so is a price taker in world markets. While weallow for free trade in goods, we assume no capital flows and for the moment noforeign direct investment.20 Note, though, that in industries where Eq. (1) is satisfied no firms will choose tooperate in the informal sector, an issue we return to below.
Table 2Maximum statutory tax rates, by country.
Country Tax revenue(% of GDP)
Corporatetax rate
Personaltax rate
VAT
Argentina 17.2% 35.0% 35.0% 17.0%Bulgaria 21.4% 19.5% 29.0% 20.0%Brazil 24.3% 34.0% 20.0% 0.0%China 12.6% 33.0% 45.0% 17.0%Czech Republic 21.7% 28.0% 32.0% 19.0%Egypt, Arab Rep. 15.8% 40.0% 20.0% 0.0%Estonia 23.2% 0.0% 26.0% 18.0%Hungary 25.9% 16.0% 40.0% 25.0%Indonesia 15.5% 30.0% 30.0% 10.0%India 12.3% 36.8% 40.0% 0.0%Lithuania 23.5% 15.0% 35.0% 18.0%Latvia 22.3% 15.0% 25.0% 18.0%Morocco 23.5% 35.0% 41.5% 20.0%Mexico 14.5% 33.0% 35.0% 15.0%Malta 21.9% 35.0% 35.0% 18.0%Pakistan 12.9% 35.0% 35.0% 15.0%Philippines 15.2% 32.0% 34.0% 10.0%Poland 23.8% 19.0% 40.0% 22.0%Romania 18.7% 25.0% 60.0% 19.0%Russian Federation 23.9% 24.0% 13.0% 20.0%Slovak Republic 21.2% 19.0% 19.0% 23.0%Thailand 15.7% 30.0% 37.0% 7.0%Turkey 20.3% 33.0% 40.0% 18.0%Vietnam 17.0% 28.0% 60.0% 20.0%South Africa 26.5% 30.0% 45.0% 14.0%Zambia 17.9% 15.0% 30.0% 0.0%All developing 19.6% 26.7% 34.7% 14.7%Belgium 30.6% 34.0% 55.0% 21.0%Canada 32.5% 36.6% 31.0% 7.0%Cyprus 20.3% 15.0% 30.0% 15.0%Germany 23.6% 25.0% 45.0% 16.0%Denmark 47.6% 30.0% 60.0% 25.0%Spain 21.9% 35.0% 56.0% 16.0%Finland 33.6% 29.0% 35.0% 22.0%France 28.3% 34.3% 54.0% 20.6%United Kingdom 29.7% 30.0% 40.0% 17.5%Greece 25.9% 35.0% 40.0% 18.0%Ireland 21.1% 12.5% 42.0% 21.0%Israel 33.2% 36.0% 49.0% 17.0%Italy 30.1% 33.0% 45.0% 20.0%Luxembourg 30.5% 30.0% 46.0% 15.0%Netherlands 36.9% 34.5% 60.0% 17.5%Norway 32.2% 28.0% 28.0% 23.0%Portugal 24.3% 27.5% 40.0% 17.0%Singapore 15.6% 22.0% 22.0% 0.0%United States 21.5% 35.0% 35.0% 0.0%All developed 28.4% 29.6% 42.8% 16.2%
Note: Statutory tax rates are from http://www.worldwide-tax.com/index.asp#partthree.The rates do not include local taxes, if they exist.
858 R. Gordon, W. Li / Journal of Public Economics 93 (2009) 855–866
are also lower in poorer countries, e.g. 14.1/(1–.264)b25.0/(1–.14),again in spite of comparable statutory tax rates.
2. Tax policy when information is limited
2.1. Optimal excise tax rates
Existing models deriving optimal tax policy typically assume thatthe government can observe the income earned by all factors and byall firms. How do forecasts for the optimal tax policy change if we takeinto account the opportunity firms have to evade tax by shifting intothe informal economy? In this section, we sketch the key intuition andthen in the next section look more formally at optimal tax policy.
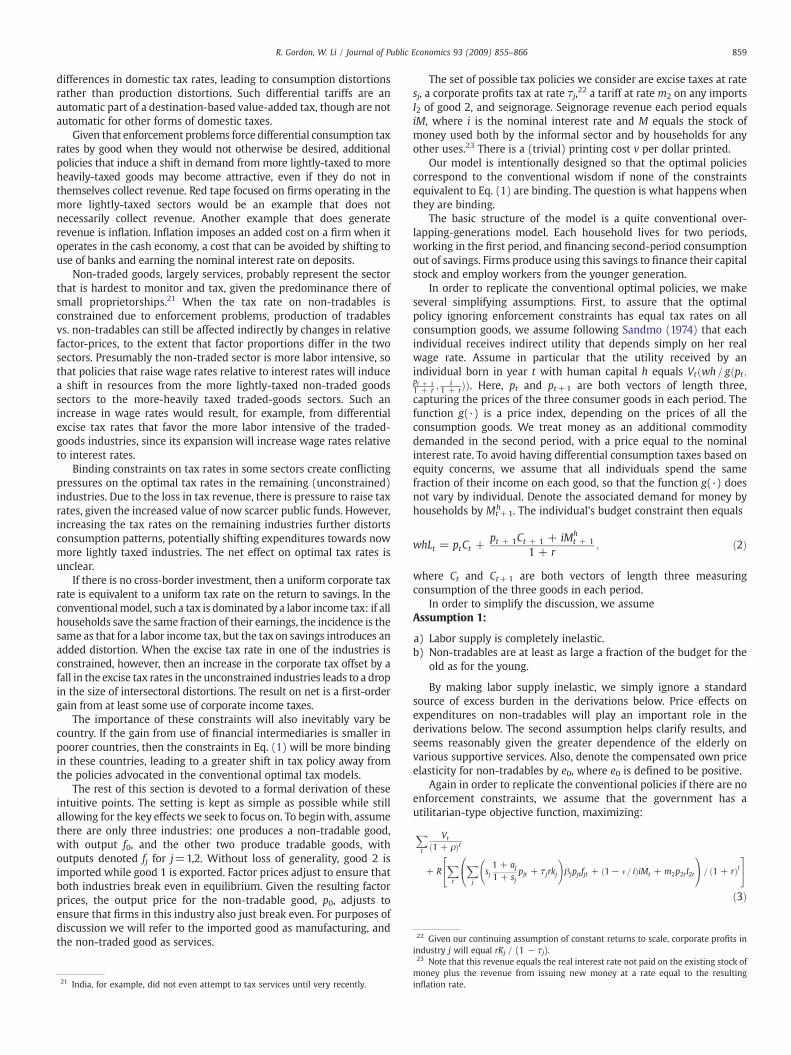
Consider the following highly stylized setting. The economyconsists of a collection of industries. Firms in industry j have aconstant-returns-to-scale production function fj(Kj,Lj), where fjdenotes industry output, Kj denotes the industry's capital stock, andLj its labor inputs.
There is free entry into each industry, so that each firm earns zeronet-of-tax profits in equilibrium. If a firm does not make use of the
financial sector,18 using cash for all transactions, it leaves no papertrail. As a result, we assume that the government does not observeanything about the firm, including its existence, and therefore cannotimpose any taxes on it. Profits for such a firm then equal p j
⁎ fj− rKj−wLj, where pj⁎ is the output price in industry j, set on the worldmarket,19 r is the local interest rate, and w is the local wage rate.
If a firm in industry j does use a financial intermediary, doing soincreases its output by the fraction aj, so that output becomes (1+aj)fj, and pretax profits become (1+aj)pj⁎ fj − rKj−wLj. When a firmdeposits its revenue in a bank, though, the government can observethe revenue through auditing the banks' records. It can then imposean excise tax on this revenue at rate sj based on this information.
If the tax is collected whether output is sold abroad or on thedomestic market, as we assume, then (1+sj)pjd=pj⁎, where pj
d is theprice domestic firms now receive, net of excise tax payments. Thefirm's net-of-tax revenue then equals pjdfj=pj
⁎ fj/(1+sj).Let βj=1 if the firms in industry j use financial intermediaries,
with βj=0 otherwise.Firms maximize expected net-of-tax profits, so choose factor
inputs and βj based on:
maxβj ;Lj ;Kj1− βj
� �pj4fj + βjpj4
1 + aj1 + sj
fj − rKj − wLj
!
Firms will choose to use banks if and only if doing so raises theirnet profits, so if and only if (1+aj)/(1+ sj)N1, in which case
sj b aj: ð1Þ
Put simply, firms use banks when the economic gain from use ofthe financial sector outweighs the resulting loss from being subject tothe excise tax. If the excise tax rate in industry j violates thisinequality, then it would induce disintermediation in this industry,and collect no revenue.
Eq. (1) then represents an implicit constraint that optimal excisetax rates should satisfy.20 If the tax rate in any industry is raised highenough to induce disintermediation, then there is a discrete drop intax revenue from that industry with no resulting gains to firms in theindustry, so a Pareto loss. These constraints are the key additionalfeature characterizing optimal tax rates once the possibility ofdisintermediation and the resulting tax evasion is taken into account.
We presume that these constraints are more likely to be binding insome industries than in others, and also more likely to be binding inpoorer than in richer countries. The aim of the rest of the paper is toexplore the implications of these binding constraints for tax policymore broadly.
2.2. Variation in aj by industry and by country
Under conventional assumptions, the optimal tax rate is equal acrossindustries. When aj varies by industry, then so does the maximumfeasible tax rate in each industry. When the constraint in Eq. (1)becomes binding in some industries, the excise tax rates in theseindustries need to be kept below the desired uniform tax rate, leading todifferential tax rates by industry, and a drop in overall tax revenue.
With differential excise tax rates by industry, production patternsare distorted. These production distortions can be neutralized throughimposing differential tariffs on imported goods that match the
22 Given our continuing assumption of constant returns to scale, corporate profits in
859R. Gordon, W. Li / Journal of Public Economics 93 (2009) 855–866
differences in domestic tax rates, leading to consumption distortionsrather than production distortions. Such differential tariffs are anautomatic part of a destination-based value-added tax, though are notautomatic for other forms of domestic taxes.
Given that enforcement problems force differential consumption taxrates by good when they would not otherwise be desired, additionalpolicies that induce a shift in demand frommore lightly-taxed to moreheavily-taxed goods may become attractive, even if they do not inthemselves collect revenue. Red tape focused on firms operating in themore lightly-taxed sectors would be an example that does notnecessarily collect revenue. Another example that does generaterevenue is inflation. Inflation imposes an added cost on a firm when itoperates in the cash economy, a cost that can be avoided by shifting touse of banks and earning the nominal interest rate on deposits.
Non-traded goods, largely services, probably represent the sectorthat is hardest to monitor and tax, given the predominance there ofsmall proprietorships.21 When the tax rate on non-tradables isconstrained due to enforcement problems, production of tradablesvs. non-tradables can still be affected indirectly by changes in relativefactor-prices, to the extent that factor proportions differ in the twosectors. Presumably the non-traded sector is more labor intensive, sothat policies that raise wage rates relative to interest rates will inducea shift in resources from the more lightly-taxed non-traded goodssectors to the more-heavily taxed traded-goods sectors. Such anincrease in wage rates would result, for example, from differentialexcise tax rates that favor the more labor intensive of the traded-goods industries, since its expansion will increase wage rates relativeto interest rates.
Binding constraints on tax rates in some sectors create conflictingpressures on the optimal tax rates in the remaining (unconstrained)industries. Due to the loss in tax revenue, there is pressure to raise taxrates, given the increased value of now scarcer public funds. However,increasing the tax rates on the remaining industries further distortsconsumption patterns, potentially shifting expenditures towards nowmore lightly taxed industries. The net effect on optimal tax rates isunclear.
If there is no cross-border investment, then a uniform corporate taxrate is equivalent to a uniform tax rate on the return to savings. In theconventionalmodel, such a tax is dominated by a labor income tax: if allhouseholds save the same fraction of their earnings, the incidence is thesame as that for a labor income tax, but the tax on savings introduces anadded distortion. When the excise tax rate in one of the industries isconstrained, however, then an increase in the corporate tax offset by afall in the excise tax rates in the unconstrained industries leads to a dropin the size of intersectoral distortions. The result on net is a first-ordergain from at least some use of corporate income taxes.
The importance of these constraints will also inevitably vary becountry. If the gain from use of financial intermediaries is smaller inpoorer countries, then the constraints in Eq. (1) will be more bindingin these countries, leading to a greater shift in tax policy away fromthe policies advocated in the conventional optimal tax models.
The rest of this section is devoted to a formal derivation of theseintuitive points. The setting is kept as simple as possible while stillallowing for the key effects we seek to focus on. To beginwith, assumethere are only three industries: one produces a non-tradable good,with output f0, and the other two produce tradable goods, withoutputs denoted fj for j=1,2. Without loss of generality, good 2 isimported while good 1 is exported. Factor prices adjust to ensure thatboth industries break even in equilibrium. Given the resulting factorprices, the output price for the non-tradable good, p0, adjusts toensure that firms in this industry also just break even. For purposes ofdiscussion we will refer to the imported good as manufacturing, andthe non-traded good as services.
21 India, for example, did not even attempt to tax services until very recently.
The set of possible tax policies we consider are excise taxes at ratesj, a corporate profits tax at rate τj,22 a tariff at rate m2 on any importsI2 of good 2, and seignorage. Seignorage revenue each period equalsiM, where i is the nominal interest rate and M equals the stock ofmoney used both by the informal sector and by households for anyother uses.23 There is a (trivial) printing cost v per dollar printed.
Our model is intentionally designed so that the optimal policiescorrespond to the conventional wisdom if none of the constraintsequivalent to Eq. (1) are binding. The question is what happens whenthey are binding.
The basic structure of the model is a quite conventional over-lapping-generations model. Each household lives for two periods,working in the first period, and financing second-period consumptionout of savings. Firms produce using this savings to finance their capitalstock and employ workers from the younger generation.
In order to replicate the conventional optimal policies, we makeseveral simplifying assumptions. First, to assure that the optimalpolicy ignoring enforcement constraints has equal tax rates on allconsumption goods, we assume following Sandmo (1974) that eachindividual receives indirect utility that depends simply on her realwage rate. Assume in particular that the utility received by anindividual born in year t with human capital h equals Vt wh= g pt ;ððpt + 11 + r ;
i1 + rÞÞ. Here, pt and pt+1 are both vectors of length three,
capturing the prices of the three consumer goods in each period. Thefunction g(·) is a price index, depending on the prices of all theconsumption goods. We treat money as an additional commoditydemanded in the second period, with a price equal to the nominalinterest rate. To avoid having differential consumption taxes based onequity concerns, we assume that all individuals spend the samefraction of their income on each good, so that the function g(·) doesnot vary by individual. Denote the associated demand for money byhouseholds by Mt+1
h . The individual's budget constraint then equals
whLt = ptCt +pt + 1Ct + 1 + iMh
t + 1
1 + r; ð2Þ
where Ct and Ct+1 are both vectors of length three measuringconsumption of the three goods in each period.
In order to simplify the discussion, we assumeAssumption 1:
a) Labor supply is completely inelastic.b) Non-tradables are at least as large a fraction of the budget for the
old as for the young.
By making labor supply inelastic, we simply ignore a standardsource of excess burden in the derivations below. Price effects onexpenditures on non-tradables will play an important role in thederivations below. The second assumption helps clarify results, andseems reasonably given the greater dependence of the elderly onvarious supportive services. Also, denote the compensated own priceelasticity for non-tradables by e0, where e0 is defined to be positive.
Again in order to replicate the conventional policies if there are noenforcement constraints, we assume that the government has autilitarian-type objective function, maximizing:
Xt
Vt
1 + ρð Þt
+ RXt
Xj
sj1 + aj1 + sj
pjt + τjrkj
!βjpjt fjt + 1− m= ið ÞiMt + m2p2t I2t
0@
1A= 1 + rð Þt
24
35
ð3Þ
industry j will equal rKj / (1 − τj).23 Note that this revenue equals the real interest rate not paid on the existing stock ofmoney plus the revenue from issuing new money at a rate equal to the resultinginflation rate.
860 R. Gordon, W. Li / Journal of Public Economics 93 (2009) 855–866
Here, the function R(·) is a positive concave function that reflectsthe value of government revenue, taking into account the gains toindividuals from the resulting expenditures as well as any additionalgains that officials perceive arising from their control over this budget.
In order to focus on policies that remain unchanged over time, weassume that ρ=r under the resulting equilibrium, no populationgrowth, and no productivity growth. As a result, the capital stockimplicitly satisfies the golden rule, and there is no welfare gainthrough redistribution across cohorts. This allows us to focus on thenature of the optimal policies at a given date, since optimal policieswill be constant across time.
To ensure that the optimal policies, ignoring enforcement con-straints,will not have any tariffs, we assume as before that the country isa price taker in the international market for the two tradable goods.Domestic prices faced by consumers now equal pj≡pj
⁎, j=0,1, andp2≡p2⁎(1+m2), while producers face prices pj/(1+βjsj).
In order to provide an explicit structure for the relative gains fromuse of the financial sector, assume in addition that the gain to firms inindustry j in country c from making use of the financial sector equalsajc=ϕjθc, so that these gains vary both by industry and by country.Assume that θc is a positive function of hc, so that firms in countrieswith higher average human capital value use the financial sectormore.24
Our results below on optimal tax rates will depend heavily on therelative gains from use of the financial sector, and also on relativecapital/labor ratios in the three industries. In order to be able to focuson a concrete case, assume:25
Assumption 2
(a) ϕ0bϕ1bϕ2
(b) K0L0
b K1L1
b K2L2, regardless of relative factor prices, so that firms
producing non-tradables have the lowest capital/labor ratiowhile the imported good has the highest capital/labor ratio.
Here, we assume that more capital-intensive industries gain morefrom use of the financial sector.26 Maintaining accounts with a bankallows the bank to monitor the firm's performance, giving the bankinformation about the firm as well as potential collateral. Bothfacilitate future lending to the firm. Loans are relatively more valuableto a firm the greater the amount of capital it needs to finance. Use ofbanks is also presumably more valuable the greater the physicaldistance at which a firm engages in market transactions, since banksare designed to facilitate financial transactions at a distance. Capital-intensive firms likely trade more at a distance, because the minimumefficient size of a firm tends to be larger the greater its capitalintensity. Also, since capital-intensive firms have greater sales revenueper employee, capital-intensive firms will be more concerned aboutallowing cash transactions, given the threat of internal theft byemployees, leading to a preference to have transactions flow insteadthrough the financial sector.
In addition, we assume that services are the least capital-intensiveindustry while the imported good (manufacturing) is the mostcapital-intensive. The assumption that services are the sector thatcan most easily shift to the informal economy was made as well byPiggott and Whalley (2001), drawing on Canadian evidence. This
24 Firms with more productive entrepreneurs, for example, may sell to a widermarket and use a more capital-intensive technology, in both cases creating more of aneed to make use of the financial sector.25 Results change in obvious ways under alternative assumptions.26 We later make this assumption for firms within each industry as well as for firmsacross industries. A natural alternative approach would be to assume that firm size perse affects ease of monitoring. Note that the optimal size of a firm can easily change inresponse to differential tax rates by size, as found for example in Onji (2006). Theminimum efficient size tends to be larger for more capital-intensive firms, so thatlabor-intensive firms can more easily subdivide into smaller firms in order to escapemonitoring. Optimal tax rates will again be higher on the more capital-intensive firms,since they are less able to respond by subdividing and thereby escaping tax.
assumption is also consistent with the evidence reported in Andreoniet al. (1998) that services have a particularly high evasion rate in theU.S. Our assumption that the imported good is the most capitalintensive is motivated by the presumption that developing countrieshave a comparative advantage in more labor-intensive industries.Results change in straight-forward ways for a country that insteadexports the more capital-intensive traded good.
If firms in industry j choose to make use of the financial sector,then their zero-profit condition implies that
pj1 + aj1 + sj
= cj w; r 1 + τj� �� �
; ð4Þ
where cj represents the unit-cost function. While we also allow for aninflation tax, our assumption is that firms making use of the formalsector avoid any losses from inflation since the nominal interest rateearned on their bank deposits fully adjusts for inflation.
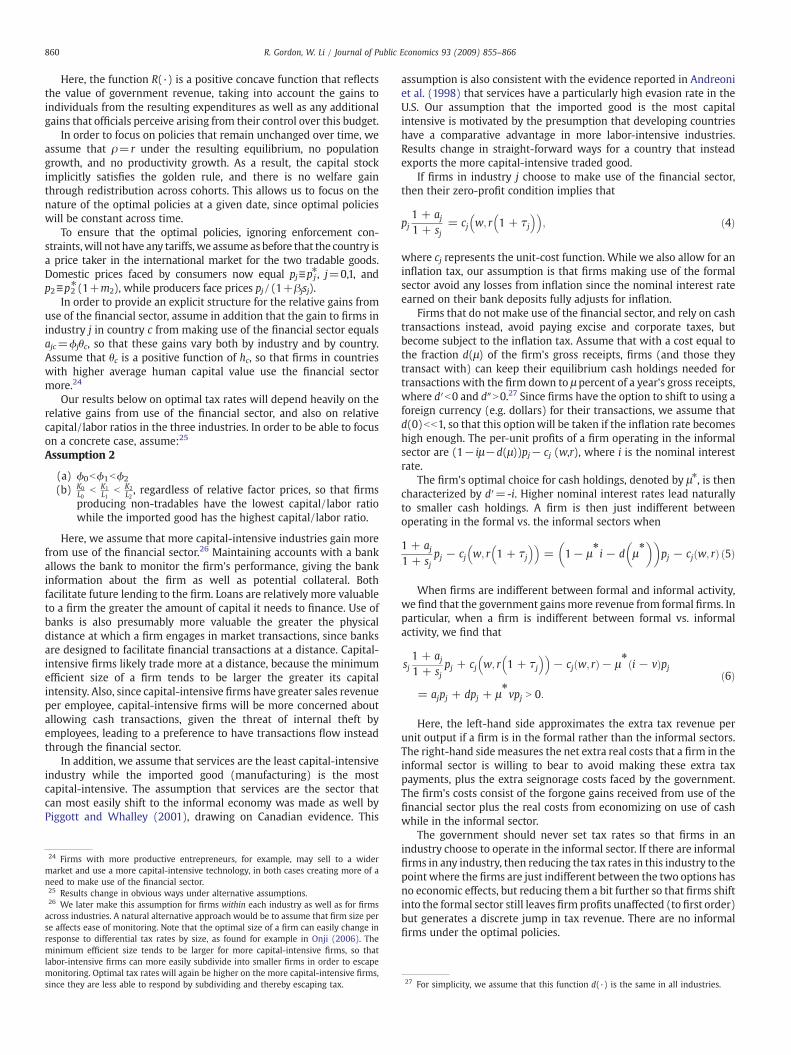
Firms that do not make use of the financial sector, and rely on cashtransactions instead, avoid paying excise and corporate taxes, butbecome subject to the inflation tax. Assume that with a cost equal tothe fraction d(μ) of the firm's gross receipts, firms (and those theytransact with) can keep their equilibrium cash holdings needed fortransactions with the firm down to μ percent of a year's gross receipts,where d′b0 and d″N0.27 Since firms have the option to shift to using aforeign currency (e.g. dollars) for their transactions, we assume thatd(0)bb1, so that this optionwill be taken if the inflation rate becomeshigh enough. The per-unit profits of a firm operating in the informalsector are (1− iμ−d(μ))pj− cj (w,r), where i is the nominal interestrate.
The firm's optimal choice for cash holdings, denoted by μ⁎, is thencharacterized by d′=-i. Higher nominal interest rates lead naturallyto smaller cash holdings. A firm is then just indifferent betweenoperating in the formal vs. the informal sectors when
1 + aj1 + sj
pj − cj w; r 1 + τj� �� �
= 1− μ4i − d μ4� �� �
pj − cj w; rð Þ ð5Þ
When firms are indifferent between formal and informal activity,we find that the government gainsmore revenue from formal firms. Inparticular, when a firm is indifferent between formal vs. informalactivity, we find that
sj1 + aj1 + sj
pj + cj w; r 1 + τj� �� �
− cj w; rð Þ− μ4 i − vð Þpj
= ajpj + dpj + μ4vpj N 0:
ð6Þ
Here, the left-hand side approximates the extra tax revenue perunit output if a firm is in the formal rather than the informal sectors.The right-hand side measures the net extra real costs that a firm in theinformal sector is willing to bear to avoid making these extra taxpayments, plus the extra seignorage costs faced by the government.The firm's costs consist of the forgone gains received from use of thefinancial sector plus the real costs from economizing on use of cashwhile in the informal sector.
The government should never set tax rates so that firms in anindustry choose to operate in the informal sector. If there are informalfirms in any industry, then reducing the tax rates in this industry to thepoint where the firms are just indifferent between the two options hasno economic effects, but reducing them a bit further so that firms shiftinto the formal sector still leaves firm profits unaffected (to first order)but generates a discrete jump in tax revenue. There are no informalfirms under the optimal policies.
27 For simplicity, we assume that this function d(·) is the same in all industries.
861R. Gordon, W. Li / Journal of Public Economics 93 (2009) 855–866
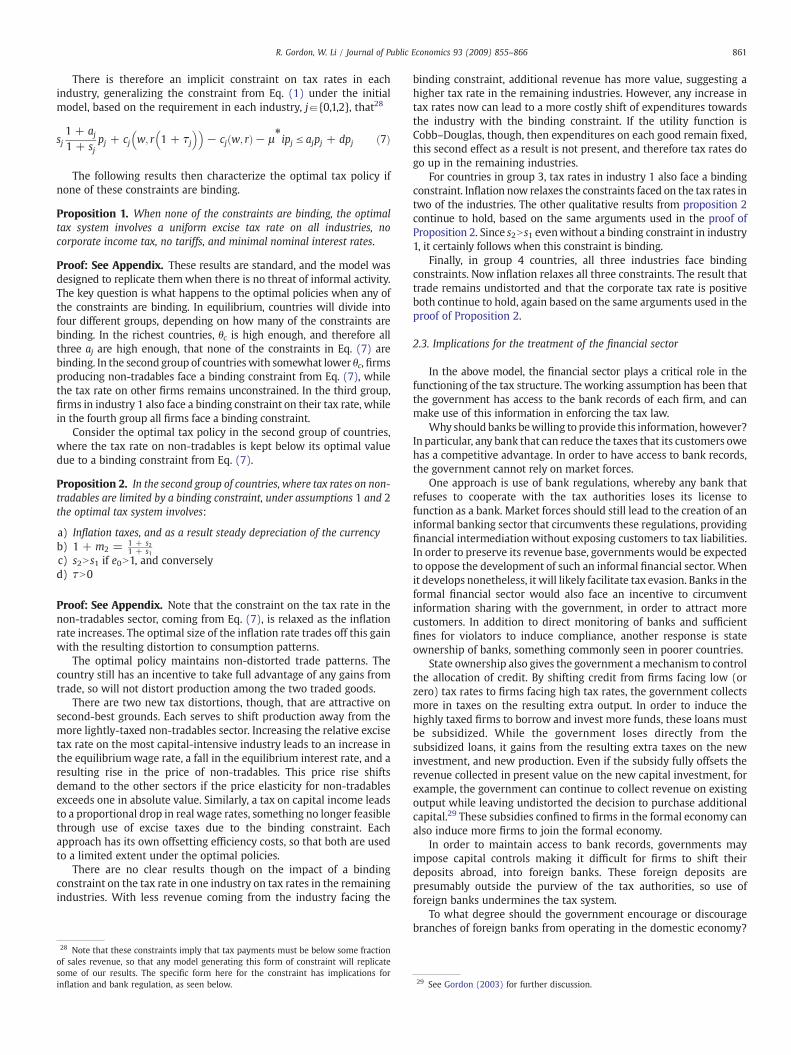
There is therefore an implicit constraint on tax rates in eachindustry, generalizing the constraint from Eq. (1) under the initialmodel, based on the requirement in each industry, ja{0,1,2}, that28
sj1 + aj1 + sj
pj + cj w; r 1 + τj� �� �
− cj w; rð Þ− μ4ipj V ajpj + dpj ð7Þ
The following results then characterize the optimal tax policy ifnone of these constraints are binding.
Proposition 1. When none of the constraints are binding, the optimaltax system involves a uniform excise tax rate on all industries, nocorporate income tax, no tariffs, and minimal nominal interest rates.
Proof: See Appendix. These results are standard, and the model wasdesigned to replicate themwhen there is no threat of informal activity.The key question is what happens to the optimal policies when any ofthe constraints are binding. In equilibrium, countries will divide intofour different groups, depending on how many of the constraints arebinding. In the richest countries, θc is high enough, and therefore allthree aj are high enough, that none of the constraints in Eq. (7) arebinding. In the second group of countrieswith somewhat lower θc, firmsproducing non-tradables face a binding constraint from Eq. (7), whilethe tax rate on other firms remains unconstrained. In the third group,firms in industry 1 also face a binding constraint on their tax rate, whilein the fourth group all firms face a binding constraint.
Consider the optimal tax policy in the second group of countries,where the tax rate on non-tradables is kept below its optimal valuedue to a binding constraint from Eq. (7).
Proposition 2. In the second group of countries, where tax rates on non-tradables are limited by a binding constraint, under assumptions 1 and 2the optimal tax system involves:
a) Inflation taxes, and as a result steady depreciation of the currencyb) 1 + m2 = 1 + s2
1 + s1c) s2Ns1 if e0N1, and converselyd) τN0
Proof: See Appendix. Note that the constraint on the tax rate in thenon-tradables sector, coming from Eq. (7), is relaxed as the inflationrate increases. The optimal size of the inflation rate trades off this gainwith the resulting distortion to consumption patterns.
The optimal policy maintains non-distorted trade patterns. Thecountry still has an incentive to take full advantage of any gains fromtrade, so will not distort production among the two traded goods.
There are two new tax distortions, though, that are attractive onsecond-best grounds. Each serves to shift production away from themore lightly-taxed non-tradables sector. Increasing the relative excisetax rate on the most capital-intensive industry leads to an increase inthe equilibriumwage rate, a fall in the equilibrium interest rate, and aresulting rise in the price of non-tradables. This price rise shiftsdemand to the other sectors if the price elasticity for non-tradablesexceeds one in absolute value. Similarly, a tax on capital income leadsto a proportional drop in real wage rates, something no longer feasiblethrough use of excise taxes due to the binding constraint. Eachapproach has its own offsetting efficiency costs, so that both are usedto a limited extent under the optimal policies.
There are no clear results though on the impact of a bindingconstraint on the tax rate in one industry on tax rates in the remainingindustries. With less revenue coming from the industry facing the
28 Note that these constraints imply that tax payments must be below some fractionof sales revenue, so that any model generating this form of constraint will replicatesome of our results. The specific form here for the constraint has implications forinflation and bank regulation, as seen below.
binding constraint, additional revenue has more value, suggesting ahigher tax rate in the remaining industries. However, any increase intax rates now can lead to a more costly shift of expenditures towardsthe industry with the binding constraint. If the utility function isCobb–Douglas, though, then expenditures on each good remain fixed,this second effect as a result is not present, and therefore tax rates dogo up in the remaining industries.
For countries in group 3, tax rates in industry 1 also face a bindingconstraint. Inflation now relaxes the constraints faced on the tax rates intwo of the industries. The other qualitative results from proposition 2continue to hold, based on the same arguments used in the proof ofProposition 2. Since s2Ns1 evenwithout a binding constraint in industry1, it certainly follows when this constraint is binding.
Finally, in group 4 countries, all three industries face bindingconstraints. Now inflation relaxes all three constraints. The result thattrade remains undistorted and that the corporate tax rate is positiveboth continue to hold, again based on the same arguments used in theproof of Proposition 2.
2.3. Implications for the treatment of the financial sector
In the above model, the financial sector plays a critical role in thefunctioning of the tax structure. The working assumption has been thatthe government has access to the bank records of each firm, and canmake use of this information in enforcing the tax law.
Why should banks bewilling to provide this information, however?In particular, any bank that can reduce the taxes that its customers owehas a competitive advantage. In order to have access to bank records,the government cannot rely on market forces.
One approach is use of bank regulations, whereby any bank thatrefuses to cooperate with the tax authorities loses its license tofunction as a bank. Market forces should still lead to the creation of aninformal banking sector that circumvents these regulations, providingfinancial intermediation without exposing customers to tax liabilities.In order to preserve its revenue base, governments would be expectedto oppose the development of such an informal financial sector. Whenit develops nonetheless, it will likely facilitate tax evasion. Banks in theformal financial sector would also face an incentive to circumventinformation sharing with the government, in order to attract morecustomers. In addition to direct monitoring of banks and sufficientfines for violators to induce compliance, another response is stateownership of banks, something commonly seen in poorer countries.
State ownership also gives the government amechanism to controlthe allocation of credit. By shifting credit from firms facing low (orzero) tax rates to firms facing high tax rates, the government collectsmore in taxes on the resulting extra output. In order to induce thehighly taxed firms to borrow and invest more funds, these loans mustbe subsidized. While the government loses directly from thesubsidized loans, it gains from the resulting extra taxes on the newinvestment, and new production. Even if the subsidy fully offsets therevenue collected in present value on the new capital investment, forexample, the government can continue to collect revenue on existingoutput while leaving undistorted the decision to purchase additionalcapital.29 These subsidies confined to firms in the formal economy canalso induce more firms to join the formal economy.
In order to maintain access to bank records, governments mayimpose capital controls making it difficult for firms to shift theirdeposits abroad, into foreign banks. These foreign deposits arepresumably outside the purview of the tax authorities, so use offoreign banks undermines the tax system.
To what degree should the government encourage or discouragebranches of foreign banks from operating in the domestic economy?
29 See Gordon (2003) for further discussion.
862 R. Gordon, W. Li / Journal of Public Economics 93 (2009) 855–866
For one, the best of the foreign banks could provide much more valueto customers (provide higher aj), so pull more firms into the taxedsector. Such banks can gain a further competitive advantage, however,by enabling firms to shift their financial records abroad, into branchesof the bank based in other countries, where they can no longer bymonitored by the domestic tax authorities.30 It is not surprising, giventhe model here, that governments often express concern about theentry of branches of foreign banks into the country, since these bankscan undermine the entire domestic tax system. Under the abovemodel, preventing foreign banks from taking deposits is sufficient toprevent tax evasion. In fact, domestic-owned banks with foreignbranches create the same risks unless the bank regulation is effectiveenough.
The tax treatment of banks also interacts critically with the taxsystemmore broadly. If the banking sector is competitive, any taxes onbanks in equilibrium must be passed on to customers, reducing thegain, aj, from using banks. In fact,
Proposition 3. Taxes on a competitive banking sector which earns nopure profits will crowd out other taxes on firms at least dollar for dollar.
Proof: See Appendix. Intuitively, banks in a competitive bankingsector must fully pass along any taxes to their customers if they are tocontinue to break even, resulting in an increase in the borrowing vs.lending rates. This increase in the interest rate spread makes use ofbanks less attractive to firms, and in equilibrium by an amount at leastas large in aggregate as the taxes paid by the bank.
This analysis assumes that only firms in the formal sector make useof banks. Households, though, can also make use of banks, raisingadditional complications. For one, when households withdraw cashfrom banks, this suggests that they are purchasing from the informalsector. In addition, households that engage in informal businessactivity may use the banking sector without registering this activity asa business. Since informal firms engage in cash transactions, thiswould be reflected in frequent household deposits and withdrawals ofcash. As a result, taxes on household withdrawals of cash from thebanking sector discourage informal sector activity.31 □
2.4. Implications of variation in the value of aj within each industry
By adding the assumption that only firms that make use of thefinancial sector are subject to tax, and that the value of using thefinancial sector is low in poorer countries, the model is able to explaina variety of observations seen in the data for developing countries thatwould otherwise be puzzling. In particular, the threat of disinterme-diation keeps tax revenue low. It can lead to sharply different tax ratesby sector, as seen through the frequent use of selective excise taxes.Tariffs are expected, offsetting any differences in tax rates by industry.Inflation should also be expected as a tool for discouraging firms fromoperating in the informal (cash) economy. State-owned banks providea mechanism to redirect credit towards the most heavily taxed firms,and to better assure the government access to information about thetax base among firms in the formal sector.
The model, as it stands, has a number of counterfactual forecasts,however. Most importantly, given our focus on the informal economy,it forecasts no informal sector.32
30 Since the bank can charge up to the domestic taxes avoided for this service,helping firms shift their accounts abroad can be particularly profitable.31 This provides some economic rationale for bank transactions taxes, as used in anumber of Latin American countries. While these taxes result in substantialdisintermediation, as documented in Coelho et al. (2001), the optimal tax rate maybe above the rate that maximizes bank transactions tax revenue, given the additionalrevenue gain from inducing a shift in economic activity from the informal to the formalsector.32 More accurately, it forecasts that only industries with aj b 0 operate in the informalsector.
In this section, we now assume that firms within each industryvary in the value, aj, they receive from use of the financial sector. Thegovernment cannot identify a firm's own value of aj, seeing insteadonly the firm's industry. As a result, when the government sets anexcise tax rate for any given industry, some firms will satisfy theconstraint in Eq. (7) and remain in the formal sector whereas others(those with lower values of aj) will instead choose to operate in theinformal sector. In setting this tax rate, the government must thentrade off higher revenue from those firms that remain in the formalsector with the loss in revenue due to some firms shifting in responseinto the informal sector. Except for unusual circumstances, theoptimal tax rate will generate at least some informal activity.
The global optimum could in theory involve very high tax rateswith a very narrow tax base, depending on the shape of thedistribution of the aj. For example, if one set of firms would alwaysuse the banking system, then a very high sj can collect substantialrevenue from these firms at the cost of collecting little or nothing fromother firms. Lowering the tax rate by enough to pull more firms intothe tax base may lower overall tax revenue too much to be attrac-tive. Optimal tax rates can be very high, in spite of the threat ofdisintermediation.
With variation in the aj within each industry, and the presence ofan informal sector, a variety of other policies may now be appropriate.In particular, the government has an incentive to make use of anyobservable indicators that provide information about a firm's value ofaj. By using this information to increase the tax rate on firms within anindustry that have high aj, and lowering the tax rate on firms withinthe industry that have low aj, the government has the potential toboth increase revenue and increase its tax base (by pulling in morefirms from the informal sector). We consider below several suchpolicies.
2.4.1. Corporate income taxesAssume that capital-intensive firms (as well as capital-intensive
industries) value more the use of financial intermediaries. To be moreconcrete, assume that firms in an industry have a production functionA(b)KbLγ−b, with b varying by firm, where a firm's gain from use ofthe financial sector, a, is an increasing function of b: a=α(b). In orderto maintain an equilibrium in spite of heterogeneous firms in eachindustry, we assume decreasing returns to scale for each firm, e.g.γb1.
Corporate taxes can then help collect additional revenue whileleaving unchanged or reducing the degree of disintermediation. Sincethe firms just indifferent to using banks are more labor intensive thanthose already using banks, the marginal firms are relatively moreconcerned about excise tax rates, compared with capital tax rates,than the inframarginal firms. Cutting excise tax rates and raisingcapital tax rates therefore can raise revenue without inducingdisintermediation. This provides another motivation for corporateincome taxes in developing countries, though now with optimal taxrates potentially varying by industry.33
More formally, for any given initial excise tax rate sj in an industry,there should be some value of b, denoted bj⁎, at which a firm is justindifferent to using banks. Any firm k in this industry with bjkNb j
⁎ willuse banks, and conversely.34
Starting from τj=0, consider a marginal increase in τj, with acompensatingmarginal cut in sj just sufficient to leave net profits (andtax payments) unchanged for firms with b=bj⁎. Given the Cobb–Douglas assumption, this implies that ∂s j⁎/∂τ=−bj⁎(1−sj⁎), wheresj⁎≡sj/(1+ sj). With these combined tax changes, firms with b=bj⁎ byconstruction remain indifferent to using banks.
33 The common use of depreciation rather than expensing for capital under the VATin poorer countries is also consistent with this argument.34 Firms with bjk b bj⁎ then evade taxes.
36
863R. Gordon, W. Li / Journal of Public Economics 93 (2009) 855–866
Tax payments by any firm k with bjkNbj⁎ go up, however, due tothese combined tax changes. Starting from τ=0, the marginal changein tax payments equals
rKjk + p4j 1 + aj� �
fjkAs4
j
Aτj+ s4
j
AfjkAτj
24
35
= p4j 1 + aj� �
bjk − b4j� �
1− s4j� �
fjk + s4j
AfjkAτj
" #;
given that rKjk=bjk(1− sj⁎)pj⁎(1+aj) fjk with a Cobb–Douglas pro-duction function. Since by construction bjkNbj⁎, the first term ispositive. This outweighs the second term as long as the effective taxrate on firm k is below the rate at the top of the Laffer curve.Intuitively, since these other firms are more capital intensive, the cutin the excise tax rate is not sufficient to offset the increase in the tax oncapital expenditures. This marginal tax change will not induce anydisintermediation, since these firms discretely gained from use ofbanks. Increasing the corporate tax rate raises more revenue fromfirms already in the tax base in industry jwhile leaving unchanged theextent of disintermediation.
The same argument implies that labor taxes (or personal incometaxes) will be counterproductive, since they shift the tax burden awayfrom firms that are necessarily part of the tax base towards firms thatcan more easily shift into the informal sector. Even if labor incomewere observable to the government, we therefore forecast very limiteduse of personal income taxes in developing countries.
Highly skilled workers, though, may also tend towork in firms thathave a high aj, given the high return to overseeing well the use ofexpensive capital equipment. If so, the government likely gains fromtaxing both indicators (capital and skilled labor). To the extent thatpersonal income taxes exist in developing countries, they do seem tofocus on those with very high incomes.
A related question is why poorer countries provide less socialinsurance, be it Social Security, unemployment insurance, or medicalinsurance. Ignoring social insurance, workers face the same equili-brium net wages in the formal vs. informal sector. With socialinsurance, they have an incentive to shift to the formal sector whenthey are a net beneficiary, and to shift to the informal sector when theyare a net contributor. This adverse selection of workers in the formalsector undermines any social insurance program, an adverse selectionavoided if all firms are part of the formal sector.
2.4.2. Anti-competitive policiesIf the taxed industries consist of a few capital-intensive firms and a
competitive fringe of informal labor-intensive firms, then thegovernment has a financial incentive to adopt policies that give thecapital-intensive firms monopoly power, driving out the competitivefringe. This makes output of the taxed (capital-intensive) firms lesssensitive to tax rates, since the taxed firms can no longer be undercutby the competitive fringe. Any resulting monopoly profits can inprinciple be taxed away, so the key role of such policies is simply tohelp shift output from the untaxed competitive fringe into the taxedshare of each industry.35
2.4.3. Policies towards FDIWhat does the above model imply about government policies
towards FDI?Consider the economic effects of a new subsidiary opened by a
multinational, using its own capital but domestic workers. First whatcan we say about the firm's tax payments? Multinationals can easilyshift the firm's taxable income abroad, e.g. by selling the firm's outputat an artificially low price to a subsidiary in another country. It has an
35 See Auriol and Warlters (2005) for a similar argument.
incentive to do so whenever it has a subsidiary facing a lowerstatutory tax rate.36 Offsetting this, the multinational may have lessscope for tax evasion due to the greater scrutiny it faces from auditorsin the firm's home country. If it produces more output with the sameinputs, due to a superior technology, this in itself adds to excise taxrevenue, though may not add to corporate profits due to the extraroyalties to the parent firm. On net, tax payments should be positive,but at least based on U.S. evidencewill be lower than for an equivalentdomestic firm.37
There are additional general equilibrium considerations, though. Ifthe multinational imports its own capital, the capital stock availablefor the domestically-owned economy remains the same, but the laborforce in the domestically owned economy falls. On net, multinationalsraise tax revenue only if they paymore taxes on the output and profitsgenerated by their labor and capital inputs than were lost from thelower labor inputs to the domestically-owned firms. Given the loweffective tax rates paid by multinationals at least in the U.S., the neteffect is likely to be negative unless the multinational brings insubstantial additional capital.
2.4.4. Red tapeAnother common observation about tax policy in developing
countries is the much higher level of red tape and a high level ofcorruption among tax officials. Is there any way to provide someexplanation for such outcomes given the above model?
When the government does not observe each firm's aj, onealternative response is to hire tax inspectors in order to gain furtherinformation about the value of aj for firms in the formal sector. If thecost of an inspector's time per firm is small enough relative to thevalue of the resulting information in improving tax collection, thenhiring such inspectors makes sense. In particular, the social value ofthe extra tax revenue collected must be enough to cover not only thecost of hiring the inspector but also the loss to residents from the extratax payments.
The problem is inspecting the inspectors. If the monitors cannotthemselves be monitored, e.g. there is no independent source ofinformation from financial records, the government cannot in practicecollect revenue based on what a bureaucrat learns firm by firm.However, it can collect an ex ante amount, based on say the size of thesector over which the bureaucrat has authority. In equilibrium,competition among potential bureaucrats for the job would lead toan ex ante net payment equal to the expected tax revenue collectedminus the opportunity cost of the bureaucrat's time. This is simply aform of tax farming.
A bureaucrat in such a position, however, would want to maximizethe revenue currently collected (net of opportunity costs), rather thanto maximize the government's objective function. In the static settingof our model, this suggests using such tax farming only for sectorswhere the constraint in Eq. (7) would be binding for most all firms ifall the ajwere known, so that the government's desired tax rate equalsthe maximum rate the bureaucrat can effectively charge a firm. To theextent that Eq. (7) is nonbinding for some firms, the bureaucrat willcollect more than the government would prefer, lowering the benefitfrom such tax farming.
Inspectors can also be assigned to monitoring informal firms. Evenif the sales revenue or capital income of these firms remainsunobservable, other aspects of their activity could well be monitored,e.g. their use of foreign exchange, electricity usage, physical invest-ment, number of employees, etc.
One approach for imposing such presumptive taxes linked to theseobservable indicators would be to establish red tape, requiring
Many multinationals have subsidiaries in a tax haven, providing them ampleopportunity for such income shifting.37 Even in the U.S., as documented by Grubert, Goodspeed, and Swenson (1993),foreign subsidiaries pay much less in taxes than seemingly equivalent domestic firms.
864 R. Gordon, W. Li / Journal of Public Economics 93 (2009) 855–866
approval for activities that can be monitored. The result would be anadditional source of revenue, either from explicit fees or from theresulting bribes.38 Even if the payments do not entirely cover thebureaucrat's salary, red tape raises the costs of operating in theinformal sector, causing at least some activity to shift to the formalsector. The gains from this shift in activity could be large enough tojustify the opportunity cost of the bureaucrat's time.
Dharmapala et al. (2008) explore a variant of thismodel inwhich thegovernment hires tax inspectors at a fixed cost per firm inspected. Theyassume that the inspector can document the firm's tax base andmakesthis information available to the tax authorities. They find that theoptimal use of inspectors may be to inspect only firms with a tax baseabove somesize, given thefixed costperfirmof these inspections.Whileinspectors can document whether or not a firm meets this condition atno cost, though, theyassumeno feasible presumptive taxes onfirms thatare not large enough to justify closer inspection.
3. Other sources of information
Many results can easily remain if we consider other stylizeddescriptions of the source of information for the government taxauthorities. Consider for example the alternative assumption that thegovernment observes a business only if it owns land (e.g. a mine or oildeposit) and/or operates out of a factory or office building, giving it avisible fixed location.39 To translate previous notation, let βj=1 if afirm has a visible fixed location, and assume that having such a fixedplace of business raises output by the fraction aj. If a business is“visible,” assume again that the government can observe its entirecapital stock, Kj, and its number of workers, Nj. While the available taxinstruments are now more limited, the qualitative results would stillbe similar to those above.
4. Dynamic considerations
The above model takes as given the size of the extra return, aj, thatfirms receive from making use of the financial sector. If governmentpolicies can potentially affect the aj, however, then this introduces aninteresting dynamic complication to the model.
Besley and Persson (forthcoming), for example, explore a model inwhich the government can invest resources in order to improve itsfuture capacity to tax economic activity in the economy. In contrast, theabove model does not include any direct means for a government toaffect the aj. However, it does presume that use of the financial sector ismore valuable for firms in countries withmore human capital, so higherper capita GDP. The effect of economic growth on the aj provides anadded economic return to policies that facilitate economic growth.
Strikingly, though, the policies found to be second-best optimalabove inevitably hinder economic growth. By restricting entry of newfirms, the government would be hindering entrepreneurial activity,thereby reducing the rate of infusion of new ideas and newtechnologies into the economy. By taxing capital-intensive firmsmore heavily, the government could hinder the use of the mostsophisticated technologies, reducing the rate of learning by doing.40
The result is a tension between current revenue and future growth.Since the growth enables the government to shift to a broader taxbase, this implies a tension between current and future tax revenue.
38 If payments take the form of bribes, the government receives the paymentsimplicitly through a lower salary for the inspector.39 Mining raises special issues. A corporate tax on a mine with full expensing forcapital investments is equivalent to a land tax. With no comparable alternative use forthe land, the tax rate can be very high and still not distort behavior.40 Whether the above policies reduce or increase the scale of the most capital-intensive firms is not certain, though. Production within the traded-goods industriesremains undistorted. The non-traded sector may face a binding constraint lowering itstax rate, but other policies such as inflation, controls over the allocation of credit, andred tape all shift resources back into the more capital-intensive traded-goods sectors.
If the added growth and the resulting increase in future tax revenueare high enough, then it becomes attractive to reduce barriers to entryand to reduce tax penalties on more capital-intensive firms, in spite ofthe resulting fall in current tax revenue. This shift in policy becomesmore attractive the better the government can alleviate the economic(and political) costs borne now due to the loss in current tax revenue.41
Debtfinance of current expenditureswould be one approach, but a riskyone since the growth may not in fact materialize, at least at the rateneeded to finance the repayment of the debt. Reducing currentgovernment expenditures may directly undermine economic growth,to the extent that these expenditures include investments in infra-structure, education, and health. The second-best response may be amore limited deviation from the policies found above, relaxing controlson new entry while still maintaining at least the most important of theprotections described above for the existing tax base.
5. Summary
The key hypothesis of this paper is that governments need to rely onthe information available from bank records in order to identify taxableentities and to measure the amount of their taxable activity. Firms arethen subject to taxonly if they choose tomakeuse of thefinancial sector.When tax rates are high enough, firms insteadmay forego the economicbenefits from use of banks in order to avoid these taxes.
This threat of disintermediationmay be of little import in the richestcountries, where the value provided by financial intermediation isconsiderable. In poorer countries, however, this threat of disintermedia-tionmay be a key factor both limiting the government's ability to collecttax revenue and shaping government policy more generally.
In particular, based on this hypothesis about the role of banks in taxenforcement, we have derived the following forecasts for countrieswhere banks provide only modest value added:
a) Tax revenue as a share of GDP will be low, constrained by thethreat of disintermediation.
b) The tax base will be narrow, confined to firms that particularlyvalue the use of financial intermediaries.
c) The optimal tax structure will include capital income taxes, inorder to focus the tax burden on those firms least willing to foregouse of the financial sector.
d) Tariffs will be used to compensate for tax differences acrosstradable industries.
e) Inflation will be used as an indirect means of taxing the untaxed(cash) economy.
f) Entry of foreign firms may be restricted.g) Entry of foreign banks will be discouraged, given the ease with
which foreign banks can facilitate tax evasion by domestic firms.h) Red tape may provide a mechanism to impose at least some tax on
firms operating in the informal sector.
According to the model, all of these policies are optimal, given astandard government objective function, to the extent that the threatof disintermediation (and the resulting tax evasion) is important,raising questions about recommendations to avoid such policies. Insum, it is important to understand why tax policies are so different indeveloping countries before having confidence in any recommenda-tion for how best to reform them.
Acknowledgements
We would very much like to thank three referees, participants atseminars at Harvard, MIT, the Boston Fed, NBER, the IMF, Berkeley,Michigan Law School, UCSB, UCSD, and particularly Sören Bo Nielsenand Firouz Gahvari for helpful comments on an earlier draft. We
41 See Gordon (2008) for further discussion.
43 This line of reasoning corresponds directly to that in Kaplow (2006) and Laroque(2005).44 With an increase in the inflation rate, offset by a fall in the excise tax rate, we againhave redistribution across cohorts, with the old generation when the policy is firstimplemented losing while later generations gain slightly. With ρ = r, we again haveno net effect on the discounted sum of utilities.45 Illegal activity, e.g. the drug trade, relies heavily on cash transactions to maintainanonymity. Inflation would provide a way to discourage such illegal activity, and onethat may be cheaper at the margin than additional resources invested in druginterdiction. This might be one rationale for a nontrivial nominal interest rate, in spiteof the above results.46
865R. Gordon, W. Li / Journal of Public Economics 93 (2009) 855–866
would also like to thank the World Bank for financial support for thisproject.
Appendix A
Proof of Proposition 1. Consider various marginal changes in taxrates, starting from the proposed optimal tax system. The initial taxsystem will be optimal if none of these marginal changes have animpact on the government's objective.
Consider first a marginal increase in the corporate tax rate in someindustry j, offset by a fall in the excise tax rate in this industry set so asto leave industry profits unchanged at the existing factor prices. Withno change in profits, Eq. (4) imply that factor prices and the outputprice for non-tradables all remain unchanged, as does labor supply.Tax revenue is also left unaffected, ignoring any behavioral responses.However, the capital/labor ratio falls in industry j. In order tomaintain market-clearing factor markets, the more capital-intensiveindustry 2 needs to expand to absorb the freed capital, while industry1 shrinks. To offset these changes in the composition of domesticproduction, with no changes in domestic consumer demand, importsof good 2 fall as do exports of good 1. These changes in factorproportions in industry j , the reallocation of factors betweenindustries 1 and 2, and the change in trade patterns have no effectson tax revenue under the assumed optimal policies, since corporatetax rates and excise tax rates are equal in all industries and there areno tariffs.
Consider next a drop in the excise tax rate in industry 1 and acompensating increase in the excise tax rate in industry 2, chosen soas to leave tax payments unchanged ignoring any behavioralresponses.42 In response to these tax changes, w rises and r falls soas to leave Eq. (4) satisfied for these two industries. Total factorincome from these two industries remains unchanged, satisfyingP2
j=1Lj
!dw +
P2j=1
Kj
!dr = 0. However, when industry 0 has a lower
capital/labor ratio than either of the other two industries, total unitcosts increase for the non-tradables sector. As a result, p0 increases.When we look at the impact from these combined changes on thebudget constraint for all but the initial generation when the policy isannounced, we find that the increase inwmore than compensates forthe fall in r, leaving a net gain of rLdw. However, the old generationwhen the policy change is announced loses from the fall in r by−Kdr=Ldw. Given our assumption that ρ=r, social welfare is leftunaffected by this redistribution from the initial cohort to latercohorts. The one remaining issue is the impact on tax revenue arisingfrom the shift of resources among the three industries. This shift hasno net impact on tax revenue if the corporate tax rate and the excisetax rate are equal in all three industries. By assumption, the changes infactor prices have no effect on labor supply. Any change in savings hasno effect on tax revenue, given the assumed zero tax rate on capitalincome.
What about the overall level of the corporate tax rate? A uniformcorporate tax rate implies no factor price changes, given Eq. (4), so isequivalent to a uniform tax rate on household income from savings.Consider an increase in the corporate tax rate, compensated by asuitable cut in the uniform excise tax rate in the previous period. Theresult will be a fall in the interest rate and a rise in the wage rate facedby all households. Given our assumptions, savings equal the samefraction of household income for all households, so that utility isunaffected for each household. Behavior does change, however. Withthese combined tax changes, the price of consumption in the secondperiod goes up, and savings fall. By assumption, labor supply remainsunaffected. For these combined tax changes to have no effect on
42 The same analysis would arise with offsetting changes in excise tax rates in someother pair of industries.
welfare, government revenue should be unaffected by this fall insavings. This requires that the corporate tax rate equal zero.43
Consider next either an increase in the tariff in industry 2 (raisingthe price of the third consumption good in each period) or an increasein the inflation rate (raising the price of money), in each case with acompensating fall in the uniform excise tax rate so as to leave overallutility unaffected.44 Tax revenue is left unaffected if we ignore anybehavioral responses. Behavioral responses, though, have no effect ontax revenue, implying that the policies are optimal, if the effective taxrate is the same on the expenditures on each of the four goods(including money). Effective tax rates are equal if there is a uniformexcise tax rate on the three commodities, the same tax rate on money,e.g. s/(1+ s)=1− v/i, and no tariff. This implies i=v(1+ s). With aminimum value of v, this result approximates the result in Friedman(1969) that the optimal nominal interest rate is zero.45 □
Proof of Proposition 2. To show that the optimal inflation rate isnow higher, note that the binding constraint on tax rates onnontradables can be relaxed by increasing μ⁎ i+d(μ⁎). The optimalinflation rate trades off the gain from increasing μ⁎ i+d(μ⁎) with thecost from unduly discouraging household expenditures on money.46
With inflation, the country needs to allow for a steady depreciationof the value of its currency in international markets. Any attempts tostabilize the currency, e.g. through a peg to the dollar or the euro, willundermine use of inflation for domestic purposes.47
Would the optimal policies still consist of a uniform excise tax rateon the remaining two industries, no corporate tax, and no tariff?Behavioral responses to a compensated set of tax changes nowincrease tax revenue to the extent that expenditures shift away fromnon-tradables, where the tax rates are kept low due to the bindingconstraint.
Consider first an increase in the excise tax rate in industry 2 and anoffsetting fall in the excise tax rate in industry 1 chosen so as to leaveutility unaffected. As noted in the proof for Proposition 1, these taxchanges lead to a rise in the equilibriumwage rate, a fall in the interestrate, and an increase in the equilibrium value of p0. The resulting shiftin output between industries 1 and 2 has no net effect on tax revenueunder the assumed equal tax rates. However, due to the bindingconstraint on tax rates in industry 0, tax revenue now rises to theextent that expenditures on non-tradables fall. The rise in p0 per secauses a fall in expenditures on non-tradables when the compensatedprice elasticity is greater than one, and conversely. The compensatedfall in the interest rate per se may cause an additional fall inexpenditures on non-tradables, given our assumption that non-tradables are at least as large a fraction of the expenditures for theold as for the young. We therefore find a welfare gain, starting fromequal excise tax rates among the two traded-goods industries fromraising the tax rate in industry 2 and lowering the rate in industry 1.
Consider next a uniform rise in the corporate tax rate, starting froma rate of zero. As before, the market interest rate falls to fully absorbthe effects of this tax change. One effect, as above, may be to reduce
The resulting inflation rate, though, will be kept low enough that firms do not shiftto using a foreign currency instead. Since this currency substitution provides no furthershift in resources towards the taxed sector but leads to a discrete fall in seignoragerevenue, the optimal inflation rate is capped due to this threat of currency substitution.47 We thank Haizhou Huang for pointing out this connection to exchange ratepolicies.
866 R. Gordon, W. Li / Journal of Public Economics 93 (2009) 855–866
expenditures on non-tradables. In addition, note that this marginalincrease in the price of future consumption is equivalent to a fall in thereal wage rate. Given that a uniform increase in excise tax rates is notfeasible, there is no alternative set of instruments available to lowerthe real wage rate without introducing other distortions. A marginalincrease in the corporate tax, starting from a rate of zero, imposes nodistortions directly by the envelope condition, since the amount ofsavings had been efficient. The optimal corporate tax rate is thenpositive.
Finally, consider an increase in the corporate tax rate and a cut in theexcise tax rate in industry j (so as to leave profits unaffected), causing adrop in the capital/labor ratio in industry j, no change in factor prices orp0, but a shift in equilibrium output from industry 1 to industry 2 andoffsetting changes in trade patterns. These changes in the allocation offactors across industries, and the resulting changes in trade patterns,have no effect on tax revenue if there are equal corporate tax rates in allindustries and no trade distortions, so that (1+m2)=(1+s2)/(1+s1).The tariff then adjusts to offset the effects on trade incentives of thehigher excise tax rates in industry 2, as occurs under a VAT. □
Proof of Proposition 3. Consider a representative firm that has bankdeposits of D and bank loans of N, where in equilibrium N=D. Acompetitive banking sector must break even, in spite of any taxes,implying in equilibrium that rNN− rDD− TB=0, where rN (rD) is theinterest rate on loans (deposits) and TB represents the bank's overalltax payments.
The firm then chooses howmuch use tomake of banks, given theseinterest rates. Assume that the percent net gain, a, from use of banks isa concave function a(N/pf, D/pf),48 so that the overall net profits ifthe firm operates in the formal sector equals
1− s4� �
1 + að Þpf − wL − rK − rNN + rDD: ð9Þ
where s⁎=s/(1+ s). The firm then chooses its deposit and borrowingbehavior in order to maximize Eq. (9). Solving this yields some valueN⁎=nf, given interest rates. These interest rates adjust so that inequilibrium N⁎=D⁎.
Given these choices, themaximum feasible excise tax rate at whichthe firm is just willing to operate in the formal sector satisfies
s4 =a − rN − rDð Þn
1 + a: ð10Þ
The maximum feasible tax revenue then equals s⁎(1+a)pf+TB=apf, so is unaffected by the taxes paid by the banking sector.Everything else equal, therefore, the more that revenue is collecteddirectly from banks the lower are the feasible tax rates on firms, sothat adding (non-distorting) bank taxes to the previous model impliesno real changes to the resulting equilibrium. However, to the extentthat bank taxes distort the behavior of banks beyond requiringcompensating changes in borrowing vs. lending rates, then there areadded efficiency costs beyond those we found from taxes on firms,implying a greater cost from use of bank taxes. Bank taxes in somecases may be easier to collect, though, since the government mustmonitor fewer organizations. □
References
Andreoni, James, et al., 1998. Tax compliance. Journal of Economic Literature 36,818–860.
48 The value of a reflects in part the benefits from saving during some time periodsand borrowing during others.
Atkinson, A.B., Stiglitz, J.E., 1976. The design of tax structure: direct vs. indirect taxation.Journal of Public Economics 6, 55–75.
Auriol, Emmanuelle, Warlters, Michael, 2005. Taxation base in developing countries.Journal of Public Economics 89, 625–646.
Besley, Timothy and Persson, Torsten. Forthcoming. “The Origins of State Capacity:Property Rights, Taxation, and Politics,” American Economic Review.
Bird, Richard, 1989. The administrative dimensions of tax reform in developingcountries. In: Gillis, Malcom (Ed.), Tax Reform in Developing Countries. DukeUniversity Press, Durham.
Campillo, Marta, Miron, Jeffrey A., 1997. Why does inflation differ across countries? In:Romer, C., Romer, D. (Eds.), Reducing Inflation: Motivation and Strategy. Universityof Chicago Press, Chicago.
Coelho, Isaias et al., 2001. “Bank Debit Taxes in Latin America — An Analysis of RecentTrends,” IMF Working Paper 01/67.
Dharmapala, Dhammika, Slemrod, Joel, andWilson, John Douglas. 2008. “Tax Policy andthe Missing Middle: Optimal Tax Remittance and Firm-Level Administrative Costs,”mimeo.
Diamond, Peter, Mirrlees, James, 1971. Optimal taxation and public production.American Economic Review 61, 8–27.
Emran, M. Shahe, Stiglitz, Joseph E, 2005. On selective indirect tax reform in developingcountries. Journal of Public Economics 89, 599–623.
Friedman, Milton, 1969. The optimal quantity of money. In: Friedman, Milton (Ed.), TheOptimal Quantity of Money and Other Essays. Aldine Publishing Company, Chicago.
Gillis, Malcolm, 1989. Tax Reform in Developing Countries. Duke University Press,Durham.
Gordon, Roger H., 2003. Taxes and privatization. In: Cnossen, Sijbren, Sinn, Hans-Werner (Eds.), Public Finance and Public Policy in the New Century. MIT Press,Cambridge.
Gordon, Roger H. 2008. “Public Finance and Economic Development: Reflections basedon the Experience in China,” mimeo.
Gordon, Roger, Li, Wei, 2007. “Puzzling Tax Structures in Developing Countries: AComparison of Two Alternative Explanations.” In: Ito, Takatoshi, Andrew, Rose(Eds.), Fiscal Policy and Management in East Asia. University of Chicago Press,Chicago.
Gordon, Roger, Kalambokidis, Laura, Slemrod, Joel, 2004a. A new summary measure ofthe effective tax rate on investment. In: Sorensen, Peter Birch (Ed.), Measuring theTax Burden on Capital and Labor, pp. 99–128.
Gordon, Roger, Kalambokidis, Laura, Slemrod, Joel, 2004b. Do we now collect anyrevenue from taxing capital income. Journal of Public Economics 88, 981–1009.
Grossman, Gene, Helpman, Elhanan, 1994. Protection for sale. American EconomicReview 84, 833–850.
Grubert, Harry, Goodspeed, Tim, Swenson, Deborah, 1993. Explaining the low taxableincome of foreign-controlled companies in the United States. In: Giovannini,Alberto, Hubbard, R. Glenn, Slemrod, Joel (Eds.), Studies in International Taxation.University of Chicago Press, Chicago, pp. 237–270.
Hinrichs, Harley, 1966. A General Theory of tax Structure Change During EconomicDevelopment. Harvard Law School, Cambridge.
IMF, 2004a. Government Finance Statistics Yearbook. IMF, Washington, D.C.IMF, 2004b. International Finance Statistics Yearbook. IMF, Washington, D.C.Kaplow, Louis, 2006. On the undesirability of commodity taxation even when income
taxation is not optimal. Journal of Public Economics 90, 1235–1250.Keen, Michael. 2006. “Tax Design and the Informal Sector,” Mimeo.Laroque, Guy R., 2005. Indirect taxation is superfluous under separability and taste
homogeneity: a simple proof. Economic Letters 87, 141–144.Lemieux, Thomas, Fortin, Bernard, Frechette, Pierre, 1994. The effect of taxes on labor
supply in the underground economy. American Economic Review 84, 231–254.Levine, Ross. 2004. “Finance and Growth: Theory and Evidence,”N.B.E.R. Working Paper
No. 10766.Newbery, David, Stern, Nicholas, 1987. The Theory of Taxation for Developing Countries.
Oxford University Press, New York.Onji, Kazuki. 2006. “Tax Incentives and Legal Boundaries: The Case of Spin-offs under
the Japanese Value-Added Tax,” Mimeo.Piggott, John, Whalley, John, 2001. VAT base broadening, self supply, and the informal
sector. American Economic Review 91, 1084–1094.Sandmo, Agnar, 1974. A note on the structure of optimal taxation. American Economic
Review 64, 701–706.Schneider, Friedrich. 2002. “Size and Measurement of the Informal Economy in 110
Countries Around the World.” Mimeo, Department of Economics, Johannes KeplerUniversity of Linz.
Schneider, Friedrich, Enste, Dominik H., 2002. Shadow economies: size, causes, andconsequences. Journal of Economic Literature 38, 77–114.
Schumpeter, Joseph, 1942. Capitalism, Socialism, and Democracy. Harper, New York.World Bank, 2003. World Development Indicators. World Bank, Washington, D.C.