Embed Size (px)
Citation preview
Taxation and Corporate Risk-Taking∗
Dominika Langenmayr�
University of Munich
Rebecca Lester‡
Massachusetts Institute of Technology
February 17, 2015
Abstract
We study whether the corporate tax system provides incentives for risky firm
investment. We first model the effects of corporate tax rates and tax loss offset
rules on firm risk-taking. Testing the theoretical predictions, we find that firm
risk-taking is positively related to the length of tax loss periods. This result
occurs because the loss rules shift a portion of investment risk to the government,
inducing firms to increase their overall level of risk-taking. Moreover, the corporate
tax rate has a positive effect on risk-taking for firms that can expect to use their
tax losses, and a negative effect for those that cannot. Thus, the effect of taxes on
risky investment decisions varies among firms, and its sign hinges on firm-specific
expectations of future tax loss recovery.
Keywords: Corporate taxation, firm risk-taking, net operating losses
JEL Classification: H25, H32, G32
∗We thank Joshua Anderson, Mihir Desai, Martin Feldstein, Michelle Hanlon, Andreas Haufler, Jeff
Hoopes, Zawadi Lemayian, Patricia Naranjo, Ray Rees, Leslie Robinson (discussant), Masaaki Suzuki
(discussant), Johannes Voget, Brady Williams, Ben Yost, and seminar participants at the University of
Munich, the University of Bayreuth, the London Business School Trans-Atlantic Doctoral Conference,
the Harvard accounting doctoral seminar, the Oxford University Centre for Business Taxation Annual
Symposium, and the 69th Annual Congress of the International Institute for Public Finance for helpful
comments and suggestions. Dominika Langenmayr thanks Harvard University and UC San Diego for
their hospitality and the German Research Foundation for funding (LA 3565/1-1). Rebecca Lester
gratefully acknowledges financial support from the MIT Sloan School of Management and the Deloitte
Foundation.�Department of Economics, Munich, Germany. E-mail: [email protected]‡Sloan School of Management, Cambridge, MA, USA. E-mail: [email protected]

1 Introduction
Firm risk-taking is essential for economic growth. While small, entrepreneurial
firms are commonly viewed as the primary source of risky innovation, large public firms
undertake approximately half of total private sector investment, and the riskiness of
this investment is positively related to per capita growth.1 Therefore, risk-taking by
these large, established firms has considerable macroeconomic effects. We provide the
first evidence on how the government, through the corporate tax system, can encourage
large corporations to make appropriately risky investments.
This study tests the risk-taking effects of both tax rates and tax loss rules, which
permit firms to use losses to reduce prior or future tax payments. We show that studying
both elements is crucial when assessing how tax policies affect firm decisions. Our
analysis makes two contributions. First, our analytical model and empirical results
demonstrate that the tax loss rules directly affect the amount of corporate risk-taking.
Intuitively, the loss rules shift a portion of investment risk to the government, which
induces firms to increase their overall level of risk-taking. This finding shows that
changing statutory loss rules is one channel through which the government could alter
private sector risk-taking.
Second, we show that the sign of the tax rate effect on firm risk-taking depends
on the extent to which a firm can use its tax losses. For firms likely able to use losses,
risk-taking is positively related to the tax rate. In this case, the government shares in
both the profit and the loss related to the investment, decreasing the variance of returns
and thus making risk-taking more attractive. In contrast, for firms that are unlikely
to use losses (due to the statutory limitations or lack of profitability), risk-taking is
negatively related to the tax rate. In this second case, taxes decrease the firm’s income
when the risky investment generates a profit, but the firm is unable to recover much, if
any, of its loss through the tax system. Higher taxes make risk-taking less attractive
for these low loss offset firms. The opposing effects demonstrate the importance of firm-
specific characteristics and of the interaction between tax rate and non-rate aspects
when assessing the investment implications of changing tax policies.
1In 2010, only 0.06% of U.S. firms were public, but these firms comprised 47.2% of total fixed
investment (Asker, Farre-Mensa, and Ljungqvist, 2014). John, Litov, and Yeung (2008) show that a
one-standard deviation increase in firm risk-taking is associated with a 33.2% increase in real GDP
per capita growth.
1

These results reconcile conflicting findings in the previous literature related to the
effectiveness of tax loss incentives. The few papers that study non-tax-rate elements of
the corporate tax system find only small effects of loss rules on the level of investment
(e.g., Devereux, Keen, and Schiantarelli, 1994; Edgerton, 2010). This result is surprising
given the large number of firms that report tax losses and the large aggregate loss
amounts;2 furthermore, firms take actions to preserve and maximize the tax loss benefits
(Maydew, 1997; Erickson and Heitzman, 2010; Albring, Dhaliwal, Khurana, and Pereira,
2011). We address this conflicting evidence by studying how tax loss rules affect the
riskiness, instead of the level, of corporate investment. Thus, earlier studies focusing
only on the volume of investment underestimate the total private sector response to
tax policies because firms also respond with qualitative changes in the type of projects
selected.
We first clarify the tax rate and tax loss effects described above by analytically
modeling how the corporate tax system affects a firm’s risk-taking decision. This model
yields two main predictions: first, that tax loss rules are positively related to firm risk-
taking, and second, that the effect of the tax rate on risk-taking varies with firm-specific
loss offset.3 We then test these hypotheses with an international firm-level panel dataset.
This sample exploits differences in tax loss carrybacks and carryforwards across 17
different jurisdictions. Following John, Litov, and Yeung (2008), we measure firm-specific
operating risk as the variance of returns to firm investment (measured by a firm’s return
on assets), consistent with the risk construct included in our theoretical model. This
measure removes the influence of home country and industry-specific economic cycles,
which firm management cannot alter, and thus directly reflects corporate investment
decisions.
Our first empirical tests show that that loss carryback and carryforward periods are
positively and significantly related to the level of firm risk-taking. A one year longer loss
carryback period is associated with 12.9 percent higher risk-taking for the average firm
in the sample. Similarly, a one year longer loss carryforward period implies 2.3 percent
higher firm risk-taking for the average firm. The higher effect for loss carrybacks reflects
2For the period 1993-2004, 45-52 percent of U.S. corporations reported total net operating losses
valued at over $2.9 trillion (Cooper and Knittel, 2010). In 2002 alone, U.S. firms reported over $418
billion in losses on their tax returns, equivalent to more than 50 percent of the $676 billion of income
reported by profitable firms (Edgerton, 2010).3Domar and Musgrave (1944) first explored the second effect in a model of individual portfolio
choice. We build on their intuition to develop our model of corporate risk-taking.
2

that these rules provide greater risk-taking incentives than loss carryforwards, given
that carrybacks deliver an immediate cash refund and are not conditional on future
profitability. We obtain these results in three different empirical tests, going from a
more general (and less well-identified) setting to more specific (but better-identified)
tests. First, a cross-country panel analysis, which uses variation across countries and
over time; second, a matched sample difference-in-difference test, which allows to control
for unobserved country characteristics; and lastly a regression discontinuity design that
uses a change in Spanish tax loss rule change which limited the amount of available
loss offset for firms with revenues above e20 million. The latter setting offers the best
identification, but is also far less general than the previous two.
To test the effect of the statutory tax rate on firm risk-taking, we partition the
sample based on firm-specific expectations about future loss offset. To measure these
expectations, we use data on prior profitability and the firm’s home country statutory
loss rules to create two groups for high or low loss offset. For example, we identify a
high loss offset firm as a firm that operates in a country that permits loss carrybacks
and was profitable in the carryback years, as this firm can likely offset any future loss
immediately. In each subsample, we regress the risk-taking measure on the corporate tax
rate and control variables and find results consistent with our hypothesis. Specifically,
higher rates are positively and significantly related to risk-taking for high loss offset
firms; a three percentage point increase in the tax rate (equivalent to the change in tax
rate from the mean to the 75th percentile of our sample) is related to an 18.2 percent
increase in the risk-taking measure for the average firm. If loss offset is unlikely, however,
we find that higher tax rates are negatively related to risk-taking. In this case, a three
percentage point increase in the tax rate is associated with a 2.6 percent decrease in
the risk taken by the average firm. We also test this relation using a first differences
specification and find consistent results.
Finally, we perform several robustness analyses, including an instrumental variables
test, construction of alternative risk measures, exclusion of multinational firms, inclusion
of additional control variables, and alternative measurements at the firm- and country-
level. Each of these tests confirm our main results.
Our paper is part of growing literature that studies the determinants of firm risk-
taking. Many papers address the effects of managerial incentives, including May (1995);
Demski and Dye (1999); Rajgopal and Shevlin (2002); and Coles, Daniel, and Naveen
(2006). More recently, the literature has documented that corporate governance (John,
3

Litov, and Yeung, 2008), creditor rights (Acharya, Amihud, and Litov, 2011), shareholder
diversification (Faccio, Marchica, and Mura, 2011), and inside debt (Choy, Lin, and
Officer, 2014) are important determinants of corporate risk-taking. Bargeron, Lehn,
and Zitter (2010) examine how the Sarbanes-Oxley Act of 2002 affected U.S. firm
risk-taking.4
To the best of our knowledge, no prior papers study the effect of the corporate tax
system on the riskiness of corporate investments. Instead, the literature analyzing the
effects of taxation on investment has thus far focused on the level of capital invested
(Hassett and Hubbard (2002) survey the theoretical and empirical literature on this
topic). While most papers only consider the tax rate, a few studies analyze loss offset
provisions. For example, Devereux, Keen, and Schiantarelli (1994) find that tax asymme-
tries do not improve the performance of tax-adjusted Q equations in predicting the level
of investment. Edgerton (2010) studies how the asymmetric tax treatment of profits
and losses affects the size of firm investment. He finds that such asymmetries made
bonus depreciation tax incentives at most four percent less effective than if all firms had
been taxable. Using a sample of multinational subsidiaries of German multinationals,
Dreßler and Overesch (2013) study how host country tax loss rules affect the level of
investment, measured with fixed assets. They find no relation between a country’s loss
carryback rules and the level of investment, a result that they note is surprising.
Another line of literature studies how taxes affect firm hedging. Graham and Smith
(1999) show in a simulation analysis that tax-function convexity (due primarily to tax
loss rules) provides an incentive to hedge for 50 percent of firms. Graham and Rogers
(2002) empirically test this prediction but find no evidence that tax convexity motivates
firms to hedge. They show, however, that firms hedge to increase debt capacity, which
also provides tax benefits. Our more general approach, which examines total firm risk-
taking, takes into account that firms manage risk in several ways, including investment
project selection, diversification, hedging, and insurance.
Other papers consider the effect of taxes on risk-taking for individual portfolio
choice and entrepreneurial risk-taking with contradictory conclusions. While Asea and
Turnovsky (1998) find that higher taxes make it less likely that individuals hold risky
assets, Poterba and Samwick (2002) conclude that households invest more in stock (and
4An emerging line of research studies how tax avoidance strategies affect firm risk (Guenther,
Matsunaga, and Williams, 2013; Hutchens and Rego, 2012; Neuman, Omer, and Schmidt, 2013). Unlike
these papers about tax risk, we examine the tax system itself (and not tax avoidance strategies).
4
less in taxable bonds) when personal income tax rates rise due to the advantageous
lower capital gains tax rates. Studying a sample of start-ups, Cullen and Gordon (2007)
find that increases in personal income taxes have a negative effect on entrepreneurial
risk-taking. Djankov, Ganser, McLiesh, Ramalho, and Shleifer (2010) test the effect of
corporate tax rates (but not tax loss rules) on entrepreneurship, measured by business
registrations, and find that taxes have an adverse effect.
This paper proceeds as follows. In Section 2, we provide an overview of corporate
tax loss rules. Section 3 presents the theoretical model of how tax rates and tax loss
rules affect risk-taking and outlines our empirical hypotheses. Section 4 describes the
research design and data for the cross-country tests, and Section 5 discusses our results.
In Section 6 we present the regression discontinuity analysis and the Spanish data, and
several robustness tests. Section 7 concludes.
2 Overview of Tax Loss Rules
All developed countries impose a tax on corporate income. Many countries allow
firms to recoup a portion of losses incurred by reducing prior or future taxable income.
Specifically, if the tax loss is offset against prior taxable income (a loss carryback), the
government refunds some portion of tax the firm previously paid. In countries that
do not allow loss carrybacks, or in instances where the firm has not been sufficiently
profitable in prior years, the company can instead use the losses to offset future taxable
income (a loss carryforward). Generally, the loss carryback and loss carryforward periods
are limited; Table 1 summarizes these periods for the countries studied in this paper.
[Insert Table 1 here.]
Firms generally prefer loss carrybacks to carryforwards. If a firm was sufficiently
profitable in the past, a loss carryback allows it to immediately receive a refund of prior
year taxes paid when the firm incurs a loss. Otherwise, the firm must wait until a future
year in which it is profitable to carryforward the loss and reduce its corresponding
future tax payment. Therefore, loss carrybacks generate real cash flow for companies
in the loss year, whereas the economic benefit of a loss carryforward is a function of
expected future profits, the expected year of profitability, the expected future tax rate,
and the firm’s discount rate. Carryforwards thus offer an inherently more uncertain tax
benefit.
5

Prior studies demonstrate that tax losses are economically significant for many
firms (Altshuler and Auerbach, 1990; Altshuler, Auerbach, Cooper, and Knittel, 2009).
We expect that this importance is not only limited to the ex-post preservation and
utilization of losses once they have been incurred (Maydew, 1997; Albring, Dhaliwal,
Khurana, and Pereira, 2011; Erickson and Heitzman, 2010). We study whether these
tax loss rules also create ex-ante incentives for corporate risk-taking.
3 Theoretical Model and Hypotheses
Several previous papers model the effects of taxation on firm investment (e.g. Hall
and Jorgenson, 1967; Auerbach, 1983, 1986; Gordon, 1985; Edgerton, 2010). After the
early literature described a the negative effect of capital income taxation on investment,
Gordon (1985) shows that this effect virtually disappears when taking uncertainty into
account. His paper, however, does not model that losses may be taxed differently than
profits. Auerbach (1986) analyzes in a dynamic model how the asymmetric treatment
of losses affects investment, comparing an income and a cash-flow tax system. Edgerton
(2010) uses a tax-adjusted Q model that incorporates financial constraints to model
how firms adjust in response to tax incentives. These papers focus on the amount
of investment. In contrast, this section develops a model to study the effects of the
corporate tax rate and tax loss offset provisions on the riskiness of firm investment. We
then use the insights from this model to formulate our hypotheses for the empirical
tests.
3.1 Model Set-up
Consider a representative firm, which plans to carry out a fixed amount of investment.
It allocates its fund among differently risky investments, such as highly risky research
and development and less risky capital expenditures.
The firm operates in a world with uncertainty. There are two potential states of
the world. In the “good” state, occurring with probability p, the firm generates a
profit of fg (σ) > 0 from its investment. In the “bad” state (probability 1 − p), the
firm incurs a loss of fb (σ) < 0. Both profit and loss are a function of the riskiness
of the firm’s investment, σ. More risk-taking increases the return in the good state
(f ′g(σ) > 0), but decreases the return in the bad state (f ′b(σ) < 0). In other words,
6
increasing the riskiness of investment leads to a higher variance of returns.5 The cost
of the investment, I, is fixed, as we only consider how taxes influence the allocation
of funds among different projects.6 To guarantee interior solutions, we assume that
risk-taking exhibits diminishing returns (f ′′g (σ), f ′′b (σ) < 0).
Firms should select the appropriate level of risk-taking to maximize after-tax re-
turns to shareholders. However, empirical evidence shows that firms exhibit risk-averse
characteristics, which in turn affect a firm’s investment project selection (Hunter and
Smith, 2002). Purnanandam (2008) shows that firms avoid risky investments to lower
the probability of financial distress. Firms with financial constraints hedge currency
risks (Geczy, Minton, and Schrand, 1997). Moreover, a risk-averse manager considers
risk in investment decisions if compensation is linked to firm performance (Tufano, 1996;
Guay, 1999; Hall and Murphy, 2002; Coles, Daniel, and Naveen, 2006; Lewellen, 2006).
Given these empirical results, we allow for firm-level risk aversion in our model.
Following prior literature (Sandmo, 1971; Appelbaum and Katz, 1986; Asplund, 2002;
Janssen and Karamychev, 2007), we model risk aversion by assuming a concave objective
function of the firm (utility function). One interpretation of this objective function is
that it represents the utility the manager derives from the firm’s returns. More generally,
this modeling approach is compatible with any of the aforementioned rationales for
firm-level risk aversion. The main advantage of modeling a utility function is that it
permits us to take into account varying levels of risk aversion, including risk neutrality
as a special case.
The firm maximizes this objective function, which depends on its after-tax profits,
π. The firm pays corporate income tax at rate t on its profit (0 < t < 1). If the
firm incurs a loss, it receives a tax refund on some fraction λ ∈ [0, 1] of the loss.
A loss offset parameter of λ = 1 applies to a firm that i) operates in a country that
permits loss carrybacks and ii) has been profitable and paid taxes during the carryback
period such that the firm could receive an immediate refund if it incurs a future loss.
Otherwise, λ < 1, with the exact value of λ depending on statutory loss carryback and
carryforward rules as well as the firm’s prior and expected future profitability. Assuming
5This construct is thus consistent with the common definition of risk as the variance of returns to
some investment (Domar and Musgrave, 1944; Feldstein, 1969; Stiglitz, 1969; Asea and Turnovsky,
1998). In the same spirit, our empirical analysis in Section 4 uses a risk measure constructed from the
standard deviation of profits to firm assets.6The results are qualitatively the same in models with an endogenous amount of investment, or
with costs of reducing the riskiness of investment.
7

a continuously differentiable and concave utility function, the expected utility of the
firm is given by
EU (π) = pU [(1− t) (fg (σ)− I)] + (1− p)U [(1− λt) (fb (σ)− I)] . (1)
The firm chooses the optimal riskiness of its investment by maximizing its expected
utility. The first order condition for the optimal σ is
∂EU (π)
∂σ= pU ′ [πg] (1− t) f ′g(σ) + (1− p)U ′ [πb] (1− λt) f ′b(σ) = 0, (2)
where πg = (1− t) (fg (σ)− I) > 0 denotes the after-tax profit in the good state of the
world, and πb = (1− λt) (fb (σ)− I) < 0 is the after-tax profit in the bad state. The
first term in eq. (2) demonstrates that a riskier investment increases the firm’s profit
in the good state of the world, while the second term shows that the loss in the bad
state also increases with the riskiness of the investment.
We now derive predictions for the relation between a country’s tax system and firm
risk-taking (σ). We first consider the loss offset parameter λ in the next section and
then the effects of a country’s tax rate t in Section 3.3.
3.2 Effect of Tax Loss Offset Rules (λ) on Firm Risk-taking
3.2.1 Results of the Model
Implicit differentiation of the first order condition in eq. (2) with respect to λ shows
that risk-taking increases when firms are better able to recoup economic losses (i.e.,
when λ is higher):
dσ
dλ=
t (1− p) f ′b(σ)
SOC[U ′ (πb) + U ′′ (πb) πb] > 0, (3)
where the second order condition is given by SOC = pU ′′ (πg) (1− t)2 (f ′g(σ))2
+
pU ′ (πg) (1− t) f ′′g (σ) + (1− p)U ′′ (πb) (1− λt)2 (f ′b(σ))2 + (1− p)U ′ (πb) (1− λt) f ′′b (σ) < 0.
Eq. (3) shows that greater loss offset results in riskier investment. Better loss offset
reduces the downside of risk-taking (the loss) by increasing the firm’s tax refund in the
bad state of the world. Moreover, when there is a larger tax refund available, the loss
occurs at a higher utility level and thus has a lower marginal effect on utility.
Eq. (3) also shows that the size of the risk-taking effect of λ depends on the country’s
tax rate, t. Specifically, t enters eq. (3) in two places. The main effect is evident in the
8

numerator, which shows that the tax refund in the bad state of the world is larger when
the tax rate is higher, thereby increasing the risk-taking incentive provided by λ. The
denominator of eq. (3) shows the indirect effects of t; in particular, the tax rate may
decrease the effect of λ on firm risk-taking because a higher tax rate (and thus larger
tax refund) shifts the firm to a higher utility level in the bad state of the world, where
the marginal utility is lower. In this case, the firm is less responsive to changes in λ.
We summarize the effects of loss offset rules on risk-taking in the following propo-
sition:
Proposition 1 (The effect of loss offset provisions on risk-taking) Better loss
offset (higher λ) increases firm risk-taking. The size of the risk-taking effect of λ depends
on the tax rate (t).Proof. Consider eq. (3). The second order condition SOC is is fulfilled (i.e., negative)
as U ′′ (π) < 0 and f ′′g (σ), f ′′b (σ) < 0. Note also that U ′′ (πb) πb > 0 as πb < 0. As
f ′b(σ) < 0, dσdλ> 0.
3.2.2 Hypothesis 1
Our first hypothesis considers how λ affects firm risk-taking by focusing on the
statutory loss carryback/carryforward periods.7 Longer carryback/carryforward periods
increase the probability that companies can recoup losses incurred. Thus, based on
Proposition 1, we predict the following:
Hypothesis 1a Tax loss carryback and carryforward periods are positively related to
corporate risk-taking.
Proposition 1 also states that the tax rate affects the magnitude of the relation
between firm risk-taking and the available loss offset. The direct effect of the tax rate
on this relation is positive. Intuitively, the amount of the insurance payment from the
government is higher when the tax rate is higher. For example, assuming that two
companies have the same λ, the amount of recoverable loss is greater in a country with
a higher tax rate because the firm originally paid taxes at a relatively higher corporate
rate. Therefore, we predict the following:
7As discussed in Section 2, the amount of firm loss offset (the firm-specific λ) is a function of
statutory rules (the loss carryback/carryforward period), the firm’s prior profitability, and the firm’s
expectation of future income. Here, we focus on the statutory loss periods because the government
can directly influence these rules.
9

Hypothesis 1b The effect of tax loss carryback and carryforward periods on corporate
risk-taking increases with the tax rate.
3.3 Effect of the Tax Rate (t) on Firm Risk-taking
3.3.1 Results of the Model
To see the effect of the tax rate on firm risk-taking, we implicitly differentiate the
first order condition in eq. (2):
dσ
dt=
1
−SOC{−pU ′′ (πg)πgf
′g(σ)− pU ′ (πg) f ′g(σ)− (1− p)U ′′ (πb)λπbf ′b(σ)− (1− p)U ′ (πb)λf ′b(σ)
}.
(4)
For ease of interpretation, we rewrite eq. (4) using the Arrow-Pratt coefficient of relative
risk aversion, RR (π) = −U ′′(π)U ′(π)
|π|.8 Then, after simplifying, dσdt
becomes
dσ
dt=
pU ′ (πg) f ′g(σ) [RR (πg)− 1]− λ (1− p)U ′ (πb) f ′b(σ) [RR (πb) + 1]
−SOC. (5)
The first term in the numerator captures the effect of the tax rate on the profit in the
good state of the world. The tax rate lowers the return to additional risk-taking by
reducing after-tax profits, but it also increases the marginal utility of the additional profit.
The level of the firm’s risk aversion determines which of these two effects dominates.
For low levels of risk aversion, higher taxes reduce firm risk-taking.
The second term shows the tax rate effect if the firm incurs a loss. The loss refund
is a function of both the allowable loss offset (λ) and the tax rate (t). This effect arises
only when some loss offset is available (i.e., λ > 0); if λ = 0, then the second summand
is zero. Consequently, we next analyze the effects of the tax rate on firm risk-taking for
the two extreme cases: full loss offset and no loss offset.
First, for full loss offset (λ→ 1), taxes decrease both the mean and the variance of
returns; that is, the government shares equally in the profit (at tax rate t) and the loss
(at λ · t = t). Because of this risk-sharing, risk-averse firms will increase the amount of
total risk-taking with an increase in the tax rate.9
Second, for no loss offset (λ → 0), the tax effect on risk-taking depends on the
level of firm risk aversion. If the firm’s risk aversion is low (RR < 1), or if firms are
8As πb < 0, we define RR (π) using the absolute value of π so that RR (π) has a positive value also
for firms that incur a loss.9This effect corresponds to the findings of Domar and Musgrave (1944), who evaluate individual
portfolio investment risk-taking for a scenario with full, partial, or no loss offset.
10

risk-neutral (RR = 0), tax rates decrease risk-taking. The negative tax effect on the
additional return in the good state of the world subsumes the positive effect, as the
additional utility occurs at a higher marginal utility. If the firm is very risk-averse
(RR > 1), tax rates always increase risk-taking.
We summarize the effects of tax rates on firm risk-taking in the following proposi-
tion:
Proposition 2 (The effect of tax rates on risk-taking)
1. With full loss offset (λ→ 1), a higher tax rate increases risk-taking by a risk-averse
firm. If the firm is risk-neutral, taxes have no effect.
2. With no loss offset (λ→ 0), a higher tax rate decreases risk-taking if the firm is
moderately risk-averse (RR < 1) or risk-neutral (RR = 0). For very risk-averse
firms (RR > 1), taxes always increase risk-taking.
Proof. The denominator of eq. (5) is positive, as the second order condition is negative
(see proof of proposition 1). Examination of the numerator of eq. (5) is thus sufficient.
On 1): Taxes increase risk-taking for firms with RR > 0 if p U ′ (πg) f′g(σ) ≤ −(1 −
p) U ′ (πb) (1− p)f ′b(σ). From eq. (2) we know that this is fulfilled with equality when
λ = 1. Thus, dσdt
∣∣λ→1
> 0.
On 2). Inspection of eq. (5) shows that the sign of eq. (5) is fully determined by
[RR (πg)− 1] when λ = 0.
The results in proposition 2 for the case of no loss offset vary based on the level
of firm risk aversion. To our knowledge, the empirical literature provides no estimates
of a firm-based coefficient of risk aversion. Using estimates of individual risk aversion,
we expect that the firm’s risk aversion coefficient is less than one.10 In this case, taxes
10Chiappori and Paiella (2011) show that relative risk aversion is constant and relatively low. Using
existing evidence on the effect of wage changes on labor supply, Chetty (2006) finds a mean estimate
of the coefficient of relative risk aversion of 0.71, with all estimates in a range between 0.15 and
1.78 in the baseline case. We expect that the level of firm risk aversion is attenuated relative to
estimates for individuals based on predictions derived from principal-agent contracting. Specifically,
managers generally receive some fixed compensation (a salary) as well as a variable component (bonus
or stock-based compensation) to align managerial incentives with those of the shareholders; because
the manager receives some portion of the salary regardless of the firm’s performance, he likely exhibits
less risk aversion than if all of the compensation were a function of firm profits.
11

decrease firm risk-taking in the case of no expected loss offset.
3.3.2 Hypothesis 2
Proposition 2 indicates that the tax rate effect on firm risk-taking depends on loss
offset possibilities. Accordingly, we derive two separate predictions for firms with very
high or very low values of λ. Taxes and risk-taking are positively related for risk-averse
firms that expect significant loss offset (the “high λ” firms in the model). This relation
occurs because these firms receive an “insurance” payment from the government via
the tax loss rules if investment fails. This insurance effect induces managers to assume
more risk. Therefore, we predict the following:
Hypothesis 2a Tax rates are positively related to risk-taking for firms that expect
significant loss offset (“high λ firms”).
In contrast, proposition 2 also shows that taxes and risk-taking are negatively related
for firms that expect no significant loss offset (the “low λ” firms in the model). For these
firms, taxation affects successful risky investments via a tax on income, but the firm does
not receive much (if any) offset for losses incurred. Accordingly, risk-averse managers
are less likely to engage in risk-taking and instead prefer to invest in safer projects that
generate more predictable returns. For these firms, we predict the following:
Hypothesis 2b Tax rates are negatively related to firm risk-taking for firms that expect
no significant loss offset (“low λ firms”).
4 Research Design & Sample Selection
We first use a cross-country panel setting to test our hypotheses, using both the
variation in tax rates and loss rules across countries and over time. These analyses
confirm our hypotheses in a relatively broad and general setting. In Section 6.1, we
additionally provide a within-country analysis using a recent change of Spanish loss
carryforward rules for a subset of firms. While this setting is very specific, it allows a
detailed identification of the effect of tax loss rules. As this latter test uses a different
sample and research design, we describe it and the associated results later in Section
6.1.
12

4.1 Testing the Effect of Loss Offset Rules (H1)
We first employ two different specifications using cross-country panel data (an
OLS panel estimation and a matched sample difference-in-difference design) to test our
first hypothesis. In Section 6.1, we additionally test this hypothesis with a regression
discontinuity design.
4.1.1 OLS Panel Estimation
We use the following regression specification to test H1a and H1b:
Riskit = β0 +β1LCjt + β2StdCTRjt +β3LC∗StdCTRjt + βnXijt + θk + ρt + εit, (6)
where Riskit is a measure of the riskiness of firm i’s investment in year t (discussed
below); LCjt captures the length of the statutory loss carryback or loss carryforward
period in a firm’s home country j in year t; and StdCTRjt is the statutory corporate
tax rate in country j in year t. We standardize the tax rate to have a mean of zero and
a standard deviation of one such that the coefficient β1 represents the effect of the loss
rules on risk-taking, given the average corporate tax rate in the sample. LC∗StdCTRjt
interacts the loss carryback and loss carryforward variables with the statutory corporate
tax rate. Xijt is a set of firm- and country-specific controls, discussed below; θk captures
industry fixed effects11, and ρt are year fixed effects. We cluster standard errors by firm
and country-year to account for within-firm and within-country-year correlation in our
sample (Petersen, 2009). Based on H1a, we expect the coefficient on LCjt, β1, to be
positive and significant. We also predict a positive coefficient on the interaction term,
β3, as a test of H1b.12
We modeled risk in Section 3 as the variance of profits generated from a risky invest-
ment over different states of the world. Accordingly, we calculate our dependent variable
Riskit as the standard deviation of a firm’s return on assets (ROA). If a firm assumes
more risk, its ROA will be higher in some periods when risky investment succeeds, and
11Industry fixed effects control for shocks that affect a whole industry (e.g. oil price changes). We
also run the regressions with industry-by-country fixed effects, which control for shocks (such as a
regulatory change) that affect only one industry in one country, and obtain very similar results.12We do not predict the sign of β2 because proposition 2 shows that the relation between risk-taking
and the corporate tax rate varies based on firm-specific expectations of loss offset; we outline these
predictions below in discussion of the H2 tests.
13
lower in other periods when the risky investment fails. Thus, we proxy for risk-taking by
i) computing the difference between the country-industry ROA average and the firm’s
ROA, measured as the ratio of EBIT to assets and ii) calculating the standard deviation
of this difference over a three-year period.13 This approach follows John, Litov, and
Yeung (2008), Faccio, Marchica, and Mura (2011), and Acharya, Amihud, and Litov
(2011) and removes the influence of home-country and industry-specific economic cycles,
which firm management cannot alter.14 This measure thus permits a clean analysis of
firm-specific risk that directly reflects corporate operating and investment decisions. In
Section 6.2, we show that our results are robust to using different risk measures, namely
a similar measure defined over five years and a market-based measure.
We measure LC with the number of years of a country’s tax loss carryback (LCB)
and carryforward (LCF ) period. For countries with an indefinite loss carryforward
period (see Table 1, Panel B), we set LCF to 20 years (i.e., the maximum finite period
in the sample) to estimate eq. (6). Therefore, to the extent we find a positive relation in
eq. (6), this assumption should understate the result. The country tax rate StdCTRjt is
the average combined tax rate of central and sub-central governments from the OECD
tax database. If the tax system is progressive, we use the top marginal tax rate.15
We control for a firm’s Size (log of total assets), as larger firms undertake the
bulk of aggregate investment (Djankov, Ganser, McLiesh, Ramalho, and Shleifer, 2010).
However, larger firms also have fewer risky opportunities and lower overall operating
risk (John, Litov, and Yeung, 2008). Furthermore, prior literature documents that a
13Clustering standard errors by firm accounts for correlation introduced by calculating the risk
measure over this three-year period and testing the regression at the firm-year level. We also re-
estimate eq. (7) in two alternative ways: first, at the country-level (see Section 6.2.3) and second,
with data for every third year (2000, 2003, 2006, and 2009) only, so that the regression does not have
overlapping observations (see Section 6.2.4). In both tests we find consistent results.14Specifically, John, Litov, and Yeung (2008) and Acharya, Amihud, and Litov (2011) use EBITDA
in constructing the firm-level risk measure, whereas Faccio, Marchica, and Mura (2011) use EBIT. We
follow Faccio, Marchica, and Mura (2011) and select EBIT when constructing the measure because it
more accurately reflects firm investment decisions by including amortization (related to investment in
intangibles) and depreciation (related to investment in capital expenditures) in the calculation.15We also run the main regressions using the applicable statutory tax rate for each firm and
obtain qualitatively similar results. However, this introduces a potential endogeneity as firms might
manipulate their earnings to be just below the thresholds for higher maringal rates. Moreover, as
lower rates generally apply to very small firms only, the corporations in our sample likely use the top
marginal tax rates for their investment decisions.
14
firm’s tax liability is correlated with firm size (Zimmermann, 1983; Porcano, 1986; Rego,
2003). We include the market-to-book-ratio (MB, market capitalization to shareholders’
equity) and Sales Growth (calculated as the one-year percentage change in revenues) to
control for the firm’s investment opportunity set, as firms with a greater set of possible
investments engage in more risk-taking (Guay, 1999; Rajgopal and Shevlin, 2002), but
are also less profitable and taxable. Given the cross-country sample used, we control for
GDP Growth, constructed with data from the IMF’s World Economic Outlook Database
and calculated as the one-year percentage change in a country’s GDP. As in John, Litov,
and Yeung (2008), we also control for ROA, measured as EBIT/assets, which captures
a firm’s ability to fund investments and risky projects. Finally, we include Leverage
(ratio of total liabilities to total assets) to control for firm risk related to costly financial
distress, interest tax shields that may contribute to a firm’s tax status, and risky asset
substitution concerns (Harris and Raviv, 1991; Leland, 1998). Appendix A provides a
summary of all variables and the data sources.
4.1.2 Matched Sample Difference-in-Difference Estimation
We also employ a matched sample difference-in-difference (DiD) analysis to test our
first hypothesis. This approach exploits changes in the statutory loss offset rules for a
subset of the sample countries. In particular, Germany and the Netherlands decreased
the loss carryback period during our sample years, and Denmark, France, Norway, and
Spain increased the loss carryforward period (see Table 1 for details).
For a valid DiD estimation, treated and control samples must exhibit similar risk
trends prior to the tax law change. Therefore, for each country with a loss carry-
back/carryforward change, we identify countries with similar pre-change risk time trends.
We then employ a firm-specific matching approach to further improve the similarities
between the treated and the control samples. Specifically, we match firms in countries
with a statutory change in the tax loss rules (treated firms) with firms in countries with
no statutory changes and similar aggregate risk time trends (control firms) using the
Mahalanobis distance matching technique. We match observations on fiscal year and on
the control variables previously listed. As relatively few countries changed the loss offset
period, the sample is much smaller for this analysis (970 and 1,395 treatment-control
pairs for the loss carryback and carryforward tests, respectively). However, the DiD
approach offers a precise identification of the treatment effect by controlling for both
observed and unobserved firm characteristics.
15
We calculate the DiD effect using the following regression:
Riskit = β0 + β1Treatedi + β2Postit + β3Treated∗Postit, (7)
where Treatedi is an indicator equal to one if firm i is in a country with a change
in the loss carryback/carryforward period, or zero otherwise; Postit is an indicator
equal to one for all treated and control observations in year t following the loss car-
ryback/carryforward change; and Treated∗Postit is the interaction of the prior two
terms. For firms in countries with a decrease in the loss carryback period, we expect
that risk should decrease for treated firms relative to control firms (β3 < 0). For firms
in countries with an increase in the loss carryforward period, risk should increase for
the treated firms relative to control firms (β3 > 0).16
4.2 Testing the Effect of Tax Rates (H2)
To test the second hypothesis, which considers the tax rate effect on firm risk-taking,
we partition the sample according to the firm-specific expectation of future loss offset
(λ). “High λ” observations include those firm-years in which i) the firm operates in a
country that allows loss carryback, and ii) the firm previously reported positive earnings
(as a proxy for unobservable taxable income) over the commensurate carryback period.
Thus, this designation captures firms most likely to receive an immediate refund of
prior taxes if it sustains a loss in the following year. Conversely, “low λ” firms are those
firm-year observations in which i) the firm operates in a country that does not permit
loss carryback, such that the firm must rely on future profitability to obtain any loss
offset, but ii) profitability in the short term is unlikely based on historical operating
performance.17
For each of the subsamples, we estimate the following regression models:
Riskit = γ0 + γ1CTRjt + γnXijt + θk + ρt + εit. (8)
16The only countries in our sample to increase the loss carryback period are Norway (in 2008 and
2009) and the U.S. (in 2009), but as these increases were introduced retroactively, we do not include
them in our analysis. For the Netherlands, we cannot separate the effects of the decrease in both
loss carryback and carryforward periods and therefore include this change in the “decrease in loss
carryback” group.17Some firms we do not classify as either high or low λ because they do not meet either definition
above. Dropping these firm-years and using only the tails of a hypothetical distribution of λ increases
the precision of the tests of H2.
16
∆Riskit = γ0 + γ1∆CTRjt + γn∆Xijt + ρt + εit. (9)
where CTR is the statutory corporate tax rate, and the other variables are as previously
defined. ∆ denotes first differences. The coefficient of interest is γ1. As outlined in
proposition 2, we predict a positive effect (γ1 > 0) for high λ firms and a negative effect
(γ1 < 0) for low λ firms. Controls and fixed effects are as described for the first set of
regressions in Section 4.1.1.
4.3 Sample Selection and Descriptive Statistics
To construct the cross-country firm-level panel dataset, we select all firms in Thom-
son Reuters’ Worldscope from 1998 through 2009 for the United States and all major
European countries (Austria, Belgium, Denmark, Finland, France, Germany, Greece,
Ireland, Italy, Luxembourg, Netherlands, Norway, Portugal, Spain, Switzerland, United
Kingdom).18 These countries have comparable levels of tax enforcement, and prior cross-
country taxation studies focus on a similar geographic sample (e.g., Devereux, Griffith,
and Klemm, 2002; Devereux and Griffith, 2003).19 Our sample ends in 2009, as we
require data for two subsequent years (2010 and 2011) to calculate the three-year risk
measure. This sample period includes differing levels of macroeconomic and industry-
specific risk, including the dot-com bubble of 1999-2000, the post-9/11 contraction,
global economic expansion in the 2000s, and the financial crisis. While we control for
these macroeconomic shifts with year fixed effects, the opportunities for firm risk-taking
fluctuated during these years, making it a suitable and recent period to examine.
From this sample of 195,163 firm-years, we drop observations for cross-listed firms
(4,743 firm-years) to ensure that we appropriately merge the correct country-specific
tax rules with the firms included in our sample. We also eliminate observations related
to financial and utilities firms (49,851 firm-years) because these firms are subject to
regulatory rules that affect profitability, taxability, and the level of risk-taking. We
drop observations missing total assets or where total assets are less than zero, as well
18Worldscope reports consolidated balance sheet data. As almost all countries in our sample (except
Belgium and Greece) allow for some form of within-country group relief, consolidated data is appropriate
for our research question. We exclude Sweden because of the country’s rules related to specific tax
reserves, which cannot be directly compared to carryback/carryforward rules in the other countries.19Moreover, these countries had comparable and generally low inflation during the sample period,
averaging 2.28%. Therefore, the value of losses within and across these countries should not be signifi-
cantly affected by inflation concerns.
17
as observations missing the requisite time series data to calculate the three-year risk
measure (32,833 firm-years). Finally, we eliminate observations missing data to calculate
the control variables for a final sample of 84,214 firm-year observations.
This sample includes some multinational firms, which may introduce measurement
error into our tests because we are unable to identify each relevant taxing jurisdiction.
While we do not expect a systematic relationship between this measurement error and
the variables of interest, we also present our main results using two smaller samples of
firms with primarily domestic operations. We identify firms as domestic if they report
less than 10 percent of income, sales, and assets as foreign, following Creal, Robinson,
Rogers, and Zechman (2013). After imposing this additional data restriction, the sample
of domestic firms reduces to 43,245 observations by including firm-years where missing
values for the requisite foreign variables are set to zero. We also present results after
dropping firm-year observations with missing foreign values (N=23,756). We convert
all data to US dollars using exchange rates provided by Officer (2011). We merge
the sample with country-level tax loss carryback/carryforward data collected from the
yearly IBFD European Tax Handbook and the U.S. Internal Revenue Code, as well as
OECD statutory corporate tax rate data.
Table 2 provides the descriptive statistics for our sample. We winsorize firm-level
variables at the 1% and 99% level. Firms in the sample report average (median) Risk of
0.294 (0.101). For validation, we compare the country-level average Risk to John, Litov,
and Yeung (2008) and find that the measures are highly correlated (0.84). The average
loss carryback period for our sample is 1.54 years; the average carryforward period is
17.82 years. The mean statutory corporate tax rate is 36.1 percent. The average tax
rate has declined over time, from 38.5 percent in 1998 to 33.5 percent in 2009.
[Insert Table 2 here.]
Our sample includes firms that, on average, exhibit sales growth of 29.0 percent
(median: 8.9) and have a market-to-book ratio of 2.9 (median: 1.7). Thus, the sample
appropriately includes firms that have risky investment opportunities. Furthermore, the
mean ROA (-0.07) indicates that the sample includes loss firms, a necessary condition
for investigating if losses and the corresponding tax rules are associated with risk-taking.
Note, however, that the median firm is profitable (ROA of 0.06). The negative ROA
observations are concentrated in 2001-2003 (following the dot-com bubble) and in 2008
and 2009 (following the financial crisis).
18
We include the United States in the sample because of its economic significance and
note that this data selection step results in an unbalanced panel, in which approximately
half of the total observations (44,088/84,214) are from this country.20 In addition to
the large size of the U.S. economy, such distribution also reflects the larger share of U.S.
incorporated firms, relative to many European countries. France, Germany, and the U.K.
report 7.3 percent (N=6,138), 7.3 percent (N=6,139), and 14.2 percent (N=11,940) of
the sample, respectively. Observations are distributed equally across the sample period,
with an average of 7,018 observations per year.
5 Empirical Results
5.1 Loss Offset Provisions
Table 3 presents the test of H1 using an OLS panel regression (Panel A) and a
difference-in-difference test (Panel B). In Panel A, we first regress Risk on the firm’s
home country statutory loss carryback/carryforward periods (col. 1) and control vari-
ables (col. 2) to test H1a. Considering the average firm in the sample, a one year longer
loss carryback period is associated with 12.9 percent higher risk-taking (coefficient of
0.038); a one year longer loss carryforward period implies 2.3 percent higher risk-taking
(coefficient of 0.007).21 The higher coefficient on LCB reflects that loss carrybacks pro-
vide greater incentives for firm risk-taking than loss carryforwards, given the higher
level of certainty and the more timely refund of prior cash taxes. Note also that loss
carryback periods are short, ranging from zero to three years in our sample. Therefore,
a one-year increase implies a large relative change in the loss offset possibilities.
20In untabulated analyses, we exclude the U.S. firm-years from the sample and find the same
association between risk-taking and the statutory loss offset rules. We discuss the results of these tests
in Section 5.21We calculate this amount by multiplying the period change of one year by the coefficient and
dividing by the mean Risk (0.038/0.294 = 12.9%). For an intuitive interpretation, consider the yearly
change in ROA for a firm that has values of ROA and Risk identical to the average in our sample
(ROA and Risk of -0.072 and 0.294, respectively). Assuming that the average country-industry ROA
is constant, this firm’s ROA ratios over a three-year period are, for example, -0.366, -0.072, and 0.222.
A one year longer carryback period increases the average risk from 0.294 to 0.332, suggesting that
the three-year ratios would instead be, for example, -0.404, -0.072, and 0.260. Therefore, we can also
interpret the 12.9% increase in risk as a 12.9% increase in the span between the best and worst yearly
ROA for the average firm.
19
[Insert Table 3 here.]
Columns (3) and (4) present results for regressions including the interaction terms
LCB*StdCTR and LCF*StdCTR as tests of H1b. The coefficients on LCB and LCF
remain positive and statistically significant, and the economic significance of the co-
efficients increases slightly; a one year longer loss carryback (carryforward) period is
associated with 16.8 (3.2) percent higher risk-taking for the average firm, given the
average tax rate. The coefficient on LCB*StdCTR is positive and significant, consistent
with our hypothesis that loss offset provisions are more economically important to
firms, the higher the country’s tax rate. However, we find an insignificant coefficient on
LCF*StdCTR; a higher tax rate has no effect on the relation between loss carryforwards
and risk-taking. One ex-post explanation is that the tax rate may change prior to a
firm’s use of its loss carryforward, and this uncertainty regarding the future tax rate
makes the current rate less relevant for firm risk-taking decisions. Column (5) presents
results for estimating the full model on the domestic sample of firms, where we set
missing values of foreign variables to zero. Column (6) drops firm-years with missing
foreign values from the sample. We find consistent results for both samples.22
The coefficients on the standardized country tax rate are insignificant in cols. (3)
to (6), consistent with the model’s finding that the tax rate has opposing effects on firm
risk for firms with different loss offset expectations. Throughout the regression results,
the control variables exhibit the expected relation with firm risk-taking.
Next, we present results of the matched sample DiD estimation (Table 3, Panel B).
The validity of the DiD approach depends on the similarity of pre-event time trends in
the treated and control samples. Figure 1 presents evidence that this key identification
assumption is satisfied. The figure shows that the average risk of treated and control
firms in each of the two matched DiD samples is similar in the three years preceding the
carryforward or carryback period change (marked by the vertical line). This suggests
that the matching process produced an appropriate control sample of comparable firms,
thus ensuring that differential changes in risk-taking can be attributed to the changes
in statutory loss offset rules.
[Insert Figure 1 here.]
22In additional analysis, we first estimate eq. (7) separately for loss carrybacks and carryforwards
and find consistent results. Second, we estimate eq. (7), dropping U.S. firm-years from the sample.
The coefficients and their significance are slightly lower but overall consistent with our main results.
20
Figure 1 also presents evidence that changes in the statutory loss offset rules affect
firm risk-taking as predicted. In the upper panel, where the treatment consists of an
increase in the loss carryforward period, risk-taking by the treated firms increases after
the statutory change, while it continues to decline in the control sample. In the lower
panel, where the treatment is a reduction in the loss carryback period, we find that
risk-taking by the treated firms declines compared to the control firms. Both changes
are consistent with the expected effects of changes in the loss offset periods.
Column (1) of Table 3, Panel B presents the β3 coefficient from estimating eq. (7)
for the treated sample of firms with a statutory decrease in the loss carryback period;
col. (2) includes the coefficients for increases in the loss carryforward period. A decrease
in the loss carryback period is associated with a decrease in firm-risk; the coefficient
of -0.018 implies that the average risk of the treated firms is 21 percent lower after the
statutory change compared to the average risk of the matched control firms. We also
find, as predicted, that an increase in the loss carryforward period is related to a 12
percent increase in average risk for the treated firms, relative to the matched control
firms (coefficient of 0.008). These results confirm that more generous tax loss rules
induce greater firm risk-taking.23
As a test of H1b, we partition the difference-in-difference sample based on the tax
rate of the countries with statutory changes in the loss carrryback and carryforward
periods. We first present results for treated firms operating in Germany (col. 1) and
France (col. 2), which have the highest statutory tax rate of countries with changes in
the loss carrryback or loss carryforward period. For both, we observe significant DiD
coefficients of -0.018 and 0.010, respectively. In contrast, the coefficients for the treated
firm-years in the lowest tax rate countries (Netherlands for LCB decrease, Norway
for LCF increase) have DiD coefficients of the correct sign, but neither are significant.
These results confirm that the tax rate increases the relation between statutory loss
offset periods and firm risk-taking.
For robustness, we present two additional sets of results. First, we match on indus-
try affiliation in addition to the listed control variables and find similar coefficients,
confirming that the results are not sensitive to the matching variables selected. Second,
23We calculate these effects by comparing the relative average risk for treated firms to control
firms both before and after the change. These results are estimated using changes in carryback and
carryforward periods of differing lengths and therefore can not be interpreted in the same manner as
in Panel A.
21
we perform the DiD analysis on the smaller sample of domestic firms and again find
similar results.24
In Panel C of Table 3 we further explore the relationship between tax loss offset
periods and corporate risk-taking. First, we test if the effect of loss offset on risk-taking
differs by firm size. Second, we study whether the effect of additional years of the loss
offset period is nonlinear.
Larger firms have a greater number of investments that provide more opportunities
for intra-firm loss offset. For example, when a firm incurs a loss on one investment, it
can directly use this loss to offset other profitable investments (Mirrlees et al., 2011).
Therefore, we predict that the positive effect of statutory loss offset incentives on firm
risk-taking is weaker for larger firms because these firms rely less on the statutory tax
provisions to recoup losses.
We test this prediction by interacting both loss offset variables (LCB/LCF ) with
Size in Table 3, Panel C, cols. (1) and (2). The coefficients on the interaction terms
for both loss carrybacks and loss carryforwards are negative and significant, consistent
with the prediction. Specifically, in the full specification in col. (2), we find that the
marginal effect of a one-year increase in the loss carryback (carryforward) period implies
an increase in Risk of 0.075 (0.012) for a firm at the first quartile of the size distribution,
whereas the same change in the loss offset period implies only an increase in Risk of
0.037 (0.006) for a firm at the third quartile. Thus, the effects of loss carrybacks and
carryforwards are approximately twice as large at the lower end of the interquartile
range.
In a second test, we study the incremental benefit of an additional year of loss offset,
conditional on the total loss offset period. For example, an additional loss carryforward
year could induce a larger increase in risk-taking when the loss carryforward period
prior to a statutory change was five years rather than twenty years.
To test this relationship, we include the square of the loss carryback and loss
carryforward variables in the results presented in Table 3, Panel C, cols. (3) to (4). The
coefficients on LCB and LCF remain positive and significant as in the main results.
However, the coefficients on the squared terms LCB2 and LCF 2 are negative and
significant. Overall, the slope of the loss carryback/carryforward function is positive
24Because the U.S. had only a retroactive change in the loss offset period during our sample (which
we code as no change), the DiD results exclude U.S. effects. This exclusion provides additional evidence
that the U.S. firm-years do not drive our main results.
22
(longer loss offset periods increase firm risk-taking), but the relation becomes “flatter”
as the loss carryback and carryforward periods increase. Thus, additional years in the
loss offset period have diminishing benefits.
In summary, the results from Table 3 support the prediction that a country’s loss
carryback and carryforward periods are positively associated with firm risk-taking, and
this relation is affected by the level of the country’s tax rate. We now turn to the effect
of the corporate tax rate.
5.2 Firm-level Effects of Corporate Tax Rates
Table 4, Panel A includes results from regressing Risk on the firm’s country-level
tax rate and control variables, as a test of H2. The first two columns include the results
for the full sample; cols. (3) to (6) repeat the analysis on the smaller samples of domestic
firms. Columns (1), (3), and (5) present the results for the “high λ” firm-years. As
predicted, higher tax rates are positively and significantly related to risk-taking for
the high loss offset firms. A three percentage point increase in the tax rate (equivalent
to the change in tax rate from the mean to the 75th percentile) is associated with
an 18.2 percent increase in the risk measure for the average high λ firm.25 Excluding
multinational firms (cols. 3 and 5), we find a change in risk of 16.0 percent and 21.2
percent, respectively, for the average firm in these samples. With full loss offset, the
government shares the firm investment risk, making risk-taking more attractive to the
firm.
[Insert Table 4 here.]
In contrast, the observations in cols. (2), (4), and (6) are those firm-years defined as
“low λ”. As predicted in H2b, we observe a negative and significant coefficient on CTR.
In this case, a three percentage increase in the tax rate is associated with a 2.6 percent
decrease in firm risk for the average low λ firm. In the smaller samples that exclude
multinational firms, we find similar, but weaker, results (ranging from a 3.5 percent to
5.4 percent decrease in risk-taking for the average firm in the respective sample).
25We calculate this result by first multiplying the one quartile change in the tax rate by the coefficient
(0.032∗1.194=0.038). We then divide this amount by the average risk for the sample of high λ firms
(0.038/0.210 = 0.182). Note that the magnitude of this effect is similar to results from studies of
entrepreneurial risk-taking: Cullen and Gordon (2007) finds that a five percentage point decrease in
the personal income tax decreases entrepreneurial risk-taking by 40%.
23
Table 4, Panel B presents results from estimating eq. (9), in which we regress
changes in loss offset expectations on changes in the country’s tax rate. Our results for
the high λ firms continue to hold. For the low λ firms, we find mostly an insignificant
effect, although the sign of the coefficient is negative in cols. (4) and (6).26
Importantly, these results show that the effect of taxation on corporate risk-taking
is not uniform across firms. While loss carrybacks and carryforwards provide economic
incentives for firms to engage in risk-taking behavior (from Table 3), firm-specific
expectation of loss utilization must be considered when determining how tax rates
affect risk-taking more broadly.
We now turn back to the effect of loss offset possibilities on risk-taking and consider
a specific rule change in Spain in 2011.
6 Additional Analyses
6.1 Within-Country Analysis
While the international setting provides heterogeneity for testing the effect of loss
offset rules, other unobserved cross-country factors could influence our results. Therefore,
we also test how changes in Spanish tax loss rules imposed from 2011 to 2013 affect
Spanish firms’ risk-taking.
Specifically, Spain limited the amount of loss offset to 75% (50%) of the tax base
in 2011 (2012-2013) for firms with prior year revenues of e20 million to e60 million.
This setting has three advantages: first, the revenue cut-offs are exogenously determined
based on firm performance in the year prior to the passage of the law; second, the law did
not affect tax rates, depreciation allowances, or other significant corporate tax rules; and
third, Spain does not permit loss carrybacks, and therefore, the new loss carryforward
limitations should directly affect firms’ expected loss offset possibilities. Consequently,
this setting permits us to infer that any risk-taking effects can be attributed to changes
in loss offset rules.27
26Because the U.S. federal and state tax rates had little variation during the sample period, these
results provide further evidence that the main results are robust to the exclusion of many U.S. firm-year
observations.27To reduce the impact of these restrictions, loss carryforwards for this period were extended by
three years for a total of 18 years. Given our findings on the nonlinearity of the tax loss effects at the
24
6.1.1 Research Design and Data
The change in the Spanish loss offset limitation lowers λ for the affected firms.
Therefore, we predict that firms with revenue above the e20 million revenue threshold
engage in less risk-taking than firms below the corresponding cutoff following this
statutory change. To test this prediction, we employ a regression discontinuity design
in which we compare Risk across these groups of firms.
For this test we use firm-level data from Bureau van Dijk’s Amadeus data set.28 We
select all incorporated Spanish firms from Amadeus and then follow the same sample
selection steps as the main sample. Given that the statutory change occurred in 2011,
but that data is only available through 2012, we define the risk measure over two years.
For validation, we compare this two-year risk measure for the firms in this dataset to the
last available year from the main Worldscope sample (2009) and find similar values.29
We choose the bandwidth for the regression discontinuity test using the method
suggested by Imbens and Kalyanaraman (2012).30 This yields an optimal bandwidth
of e125,262. Thus, we compare risk-taking in 2011 for firms with revenues between
e20.00 million and about e20.125 million in 2010 to firms with revenues between
e19.875 million and about e20.00 million in 2010.31 To show that our results are
end of Section 5.1, we expect that the loss offset limitations will have a larger immediate effect than
the extension of the overall loss offset period.28The Worldscope-based data set used in the previous sections only has data on listed firms and
includes very few (less than five) Spanish firms with revenues below e20 million. In contrast, the
Amadeus database focuses on small firms and reports information on approximately one thousand
firms within a five million window around the e20 million threshold. Amadeus has been widely used
in other papers examining the effects of taxation on firms’ financial decisions, see, e.g., Huizinga and
Laeven (2008); Egger, Eggert, Keuschnigg, and Winner (2010); or Karkinsky and Riedel (2012).29In the Amadeus sample, Risk in 2011 has a median of 0.021 and a mean of 0.051; Spanish firms
in the Worldscope sample in 2009 have a median Risk of 0.027 and a mean Risk of 0.035.30To implement the regression discontinuity test, we use the Stata program developed by Nichols
(2007).31We note that the Spanish law change also affected firms with revenues greater than e60 million
by limiting loss offset to only 50% (25%) of the tax base in 2011 (2012-2013). However, neither of
the two data sets (Amadeus or Worldscope) provides sufficient observations to test the effects around
this second threshold. Specifically, in Amadeus, we have ten times as many observations for the e20
million test as compared to the e60 million threshold. We therefore focus on the e20 million test.
When running the regression discontinuity test with larger bandwidths for the e60 million threshold,
we find insignificant results, likely as no clear identification is possible due to confounding effects that
arise when using larger bandwidths.
25

robust, we also report results using twice and thrice this bandwidth for robustness.
6.1.2 Results
Figure 2 plots Risk of Spanish firms in 2011 above and below the e20 million
threshold. This figure offers graphical evidence that firms above the threshold have
lower Risk than those firms below the threshold following the statutory change in loss
offset rules.
[Insert Figure 2 here.]
Table 5 reports results from the regression discontinuity analysis. As expected, we
find a negative and significant coefficient for the Average Treatment Effect. This result
means that those firms that can only offset 75% of a potential loss have significantly
lower Risk than similar-sized Spanish firms (i.e., immediately below the threshold)
that can fully offset losses. Overall, this regression discontinuity analysis confirms the
Section 5 results that show that tax loss rules are an important determinant of firm
risk-taking.
[Insert Table 5 here.]
To confirm our results, we also carry out two types of placebo tests in Panel B
of Table 5. First, we test if there are discontinuities at other levels of lagged revenues.
Second, we check if there are discontinuities in other firm-level characteristics around
the 20 million revenue cutoff. In both tests, we find no significant discontinuities, thus
confirming that the loss offset limitation likely caused the change in corporate risk-
taking.
Next, we conduct several additional tests to ensure the robustness of the main
results.
6.2 Robustness Tests
6.2.1 Instrumental Variables Estimation
The tests of Hypothesis 1 in Table 3 show a positive and significant association
between statutory tax loss rules and firm risk. While we attempt to identify a causal
26
relation between tax rules and firm risk using the DiD approach, we acknowledge that
the results could reflect an endogenous relation. Specifically, firm risk-taking may induce
governments to change the tax rules (rather than the government inducing firms to
alter their risk-taking), and the results could potentially suffer from reverse causality.
In this section, we use an instrumental variables specification to mitigate this concern.
We re-estimate eq. (6) using the inverse of the per capita cost to start a new
business (COB) from the World Bank’s Doing Business report (available from 2004) as
an instrument for the loss carryback/carryforward periods. This instrument should be
correlated with the potentially endogenous LCB/LCF variables because both measures
capture a country’s attitude toward private enterprise; that is, we expect that more
business-friendly countries have longer loss carryback/carryforward periods and should
similarly impose low costs on establishing new businesses. Indeed, the instrument is
positively and significantly correlated with both loss carrybacks and carryforwards
(correlations of 0.60 and 0.59, respectively). This instrument should also meet the
exclusion restriction because these costs affect only start-up ventures and should not
influence the risky investment project selection of established corporations, such as
the large, listed firms included in our sample. For these reasons, we believe that our
instrument is valid.
Table 6, Panel A presents the results from estimating the instrumental variable
regressions. Columns (1) to (3) present the results for instrumenting the loss carryback
period; cols. (4) to (6) present results for instrumenting loss carryforwards. Columns (1)
and (4) include the OLS results for separately regressing firm risk-taking on LCB and
LCF, respectively. In the first-stage instrumental variables regressions (cols. (2) and (5)),
the coefficients on COB have the expected sign and are significant at the one percent
level.32 Columns (3) and (6) include the results from the second-stage regression. The
coefficients are positive and significant, confirming that our main results are robust
even when considering potential endogeneity issues.
[Insert Table 6 here.]
32In addition to including the R-squared statistic for both models, we also present the partial R-
square, which measures the explanatory power of the model excluding controls variables. From this
statistic, we note that the models continue to have sufficient explanatory power. The p-values for the
F statistic and the partial F statistic indicate that the regression specification does not suffer from
a weak instrument problem; specifically, the partial F statistic exceeds the critical value of 8.96 as
suggested by Stock, Wright, and Yogo (2002).
27
6.2.2 Alternative Risk Measures
As discussed in Section 5.1, we measure firm risk using the standard deviation of
ROA ratios over three years (year t, t+1, and t+2 ). In Table 6, Panel B, we re-estimate
our main results for both hypotheses using two alternative risk measures. In cols. (1)
to (4), we re-estimate the firm risk over five years (year t to year t+4 ). The results
continue to hold, showing that the results are not sensitive to the period over which
the risk measure is defined. In cols. (5) to (8), we estimate the regressions using a
market-based measure of firm risk – price volatility, following Gonzalez (2005) and
Bargeron, Lehn, and Zitter (2010). This measure captures how volatile firm value is
over a one-year period. We again find consistent results.
6.2.3 Country-level Estimation
Following John, Litov, and Yeung (2008), we also test the relation between loss offset
rules and firm risk-taking at the country-level. We compute the average Risk for each
country-year in the sample and regress this amount on the country’s loss carryforward
and loss carryback periods, as well as the country tax rate and interaction terms. We
find consistent results with positive and significant coefficients (t-statistics) of 0.047
(4.743), 0.004 (3.788), and 0.034 (2.358) on LCB, LCF, and LCB∗StdCTR, respectively.
The coefficient of 0.001 on LCF ∗StdCTR is insignificant (t-statistic of 0.772), also
consistent with the Table 3 results. We conclude that the main results measured at the
firm-level are robust to this alternative country-level measurement.
6.2.4 Overlapping Observations
As discussed in Section 4, the risk measure is defined over a three-year period.
To mitigate concerns of overlapping observations within the sample, we re-estimate
the main regression using only 2000, 2003, 2006, and 2009 (every third year). We
find consistent results; the coefficients (t-statistics) are 0.063 (3.451), 0.009 (3.733),
and -0.014 (-0.449) on LCB, LCF, and StdCTR, respectively. Furthermore, the two
interaction terms have coefficients (t-statistics) of 0.127 (4.122) and -0.003 (-1.192),
also consistent with the main results. We conclude that the main results are not driven
by multiple firm observations within the panel.
28
6.2.5 Stock Option Expense
Stock options could affect both firm risk-taking (by providing incentives to induce
risk-averse managers to make risky firm investments) and the taxability of the firm (if
options are deductible). Unfortunately, data on stock options is only available for a
limited number of firms (N=17,195), and therefore we do not impose this data restriction
when constructing the main sample. For robustness, we re-estimate eqs. (6) and (8)
including this variable as a control, and we find that the size and significance of the
coefficients are very similar to the main results on this smaller sample.
7 Conclusion
This paper studies how a country’s tax system affects corporate risk-taking. The
analytical model shows that the effect of corporate taxation on firm risk is a function
of the statutory tax loss offset rules and tax rates, as well as firm-specific expectation
regarding loss offset possibilities. We empirically confirm the theoretical predictions
using a cross-country sample of firms. We find that the level of corporate risk-taking
is positively related to the available loss offset period. We infer from these results that
firms view these tax rules as important when selecting the riskiness of firm investments.
We then partition firms based on the estimated expectation of available future loss
offset. In both subsamples, we find significant effects of tax rates on risk-taking, but with
opposing signs: higher tax rates increase risk-taking for firms that expect to use their tax
losses and decrease risk-taking for firms with very limited loss offset possibilities. Thus,
our paper provides first evidence that firms have different investment responses to tax
rate changes, and these responses depend on firm-specific characteristics, particularly
prior and expected future profitability.
The direct effects of tax loss rules on investment - as well as the indirect effects via the
tax rate - have important implications for policymakers. To the extent that governments
want to encourage risk-taking, longer tax loss periods, particularly carrybacks, provide
appropriate incentives. Our paper also shows that high tax rates do not necessarily
inhibit risky investments; if governments provide sufficient loss offset (and if the company
can use these losses), then higher rates may encourage risky corporate investments. Of
course, changes in tax rules for risk purposes must be balanced against fiscal needs,
as well as global competitiveness concerns. We look forward to further research that
29

integrates these issues with the demand for risk-taking that is necessary for economic
growth.
30
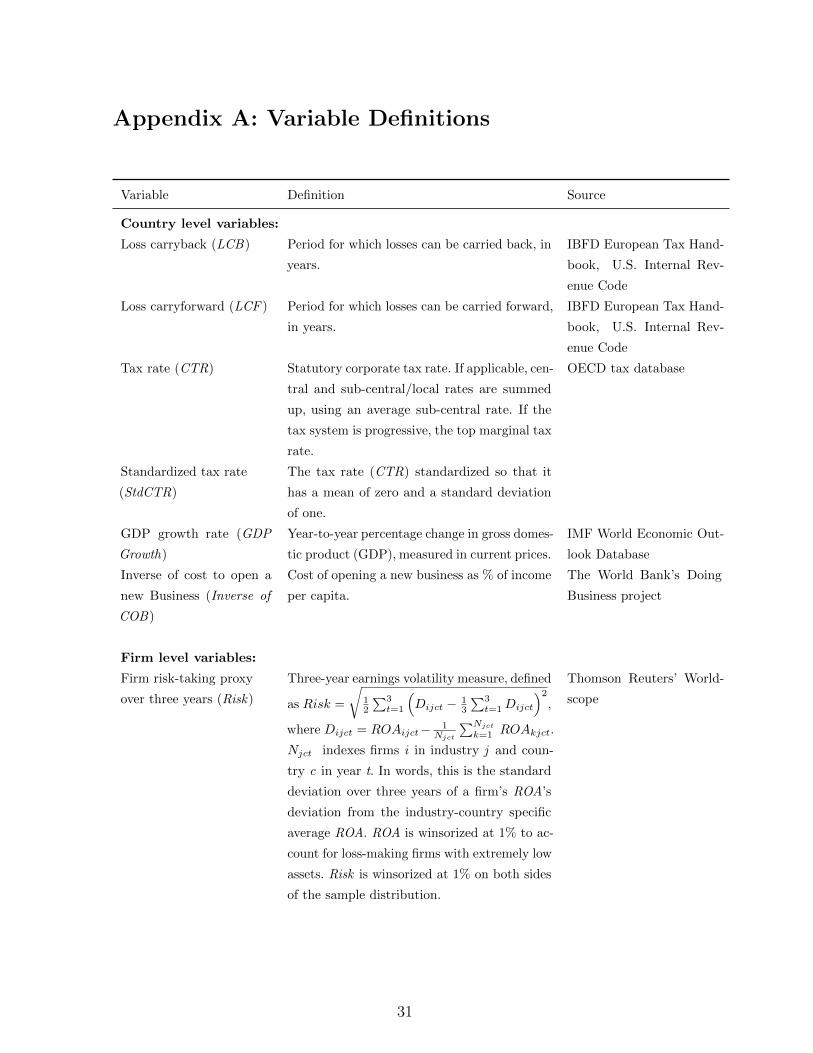
Appendix A: Variable Definitions
Variable Definition Source
Country level variables:
Loss carryback (LCB) Period for which losses can be carried back, in
years.
IBFD European Tax Hand-
book, U.S. Internal Rev-
enue Code
Loss carryforward (LCF ) Period for which losses can be carried forward,
in years.
IBFD European Tax Hand-
book, U.S. Internal Rev-
enue Code
Tax rate (CTR) Statutory corporate tax rate. If applicable, cen-
tral and sub-central/local rates are summed
up, using an average sub-central rate. If the
tax system is progressive, the top marginal tax
rate.
OECD tax database
Standardized tax rate
(StdCTR)
The tax rate (CTR) standardized so that it
has a mean of zero and a standard deviation
of one.
GDP growth rate (GDP
Growth)
Year-to-year percentage change in gross domes-
tic product (GDP), measured in current prices.
IMF World Economic Out-
look Database
Inverse of cost to open a
new Business (Inverse of
COB)
Cost of opening a new business as % of income
per capita.
The World Bank’s Doing
Business project
Firm level variables:
Firm risk-taking proxy
over three years (Risk)
Three-year earnings volatility measure, defined
as Risk =
√12
∑3t=1
(Dijct − 1
3
∑3t=1Dijct
)2,
where Dijct = ROAijct− 1Njct
∑Njct
k=1 ROAkjct.
Njct indexes firms i in industry j and coun-
try c in year t. In words, this is the standard
deviation over three years of a firm’s ROA’s
deviation from the industry-country specific
average ROA. ROA is winsorized at 1% to ac-
count for loss-making firms with extremely low
assets. Risk is winsorized at 1% on both sides
of the sample distribution.
Thomson Reuters’ World-
scope
31

Firm risk-taking proxy
over five years (Risk 5Y )
Five-year earnings volatility, defined as
Risk 5Y =
√14
∑5t=1
(Dijct − 1
5
∑5t=1Dijct
)2,
where Dijct = ROAijct− 1Njct
∑Njct
k=1 ROAkjct.
Njct indexes firms i in industry j and country
c in year t. In words, this is the standard
deviation over five years of a firm’s ROA’s
deviation from the industry-country specific
average ROA. ROA is winsorized at 1% to
account for loss-making firms with extremely
low assets. Risk 5Y is winsorized at 1% on
both sides of the sample distribution.
Thomson Reuters’ World-
scope
Stock price volatility
(Price Volatility)
A measure of a stock’s average annual price
movement to a high and low from a mean
price for each year. For example, a stock’s price
volatility of x% indicates that the stock’s an-
nual high and low price was between +x% and
-x% of its annual average price.
Thomson Reuters’ World-
scope
Firm size (Size) Natural logarithm of total assets in 1000 US-
$ (Worldscope data code: XWC02999), win-
sorized at 1% and 99%.
Thomson Reuters’ World-
scope
Return on asset (ROA) Ratio of EBIT (XWC18191) over assets (XWC
02999), where EBIT are earnings before inter-
est and taxes.
Thomson Reuters’ World-
scope
Sales Growth
(Sales Growth)
Year-to-year percentage change in revenues
(XWC01001), winsorized at 1% and 99%.
Thomson Reuters’ World-
scope
Leverage (Leverage) Ratio of total liabilities (XWC 03351) to to-
tal assets (XWC02999), winsorized at 1% and
99%.
Thomson Reuters’ World-
scope
Market-to-book ratio
(MB)
Ratio of market capitalization (XWC08001)
to common equity (XWC03501), winsorized at
1% and 99%.
Thomson Reuters’ World-
scope
32

References
Acharya, Viral V., Yakov Amihud, and Lubomir Litov, 2011, Creditor rights and cor-
porate risk-taking, Journal of Financial Economics 102, 150–166.
Albring, Susan M., Dan S. Dhaliwal, Inder K. Khurana, and Raynolde Pereira, 2011,
Short-term incentive effects of a reduction in the NOL carryback period, Journal of
the American Taxation Association 33, 67–88.
Altshuler, Rosanne and Alan J. Auerbach, 1990, The significance of tax law asymmetries:
An empirical investigation, The Quarterly Journal of Economics 105, 61–86.
Altshuler, Rosanne, Alan J. Auerbach, Michael Cooper, and Matthew Knittel, 2009,
Understanding U.S. corporate tax losses, Tax Policy and the Economy 76, 73–122.
Appelbaum, Elie and Eliakim Katz, 1986, Measures of risk aversion and comparative
statics of industry equilibrium, The American Economic Review 76, 524–529.
Asea, Patrick K. and Stephen J. Turnovsky, 1998, Capital income taxation and risk-
taking in a small open economy, Journal of Public Economics 68, 55–90.
Asker, John, Joan Farre-Mensa, and Alexander Ljungqvist, 2014, Corporate investment
and stock market listing: A puzzle?, Review of Financial Studies forthcoming.
Asplund, Marcus, 2002, Risk-averse firms in oligopoly, International Journal of Industrial
Organization 20, 995–1012.
Auerbach, Alan J., 1983, Taxation, corporate financial policy and the cost of capital,
Journal of Economic Literature 21, 905–940.
Auerbach, Alan J., 1986, The dynamic effects of tax law asymmetries, Review of Eco-
nomic Studies 53, 205–225.
Bargeron, Leonce, Kenneth Lehn, and Chad J. Zitter, 2010, Sarbanes-Oxley and cor-
porate risk-taking, Journal of Accounting and Economics 49, 34–52.
Chetty, Raj, 2006, A new method of estimating risk aversion, American Economic
Review 96, 1821–1834.
Chiappori, Pierre-Andre and Monica Paiella, 2011, Relative risk aversion is constant:
Evidence from panel data, Journal of the European Economic Association 9, 1021–
1052.
33

Choy, Helen, Juichia Lin, and Micah S. Officer, 2014, Does freezing a defined benefit
pension plan affect firm risk?, Journal of Accounting and Economics 57, 1–21.
Coles, Jeffrey L., Naveen D. Daniel, and Lalitha Naveen, 2006, Managerial incentives
and risk-taking, Journal of Financial Economics 79, 431–468.
Cooper, Michael G. and Matthew Knittel, 2010, The implications of tax asymmetry for
US corporations, National Tax Journal 63, 33–62.
Creal, Drew, Leslie Robinson, Jonathan Rogers, and Sarah Zechman, 2013, The multi-
national advantage, Research Paper 11-37, Chicago Booth.
Cullen, Julie B. and Roger H. Gordon, 2007, Taxes and entrepreneurial risk-taking:
Theory and evidence for the US, Journal of Public Economics 91, 1479–1505.
Demski, Joel S. and Ronald A. Dye, 1999, Risk, return, and moral hazard, Journal of
Accounting Research 37, 27–55.
Devereux, Michael P. and Rachel Griffith, 2003, Evaluating tax policy for location
decisions, International Tax and Public Finance 10, 107–126.
Devereux, Michael P., Rachel Griffith, and Alexander Klemm, 2002, Corporate income
tax reforms and international tax competition, Economic Policy 17, 451–195.
Devereux, Michael P., Michael Keen, and Fabio Schiantarelli, 1994, Corporation tax
asymmetries and investment. Evidence from U.K. panel data, Journal of Public
Economics 53, 395–418.
Djankov, Simeon, Tim Ganser, Caralee McLiesh, Rita Ramalho, and Andrei Shleifer,
2010, The effect of corporate taxes on investment and entrepreneurship, American
Economic Journal: Macroeconomics 2, 31–64.
Domar, Evsey D. and Richard A. Musgrave, 1944, Proportional income taxation and
risk-taking, Quarterly Journal of Economics 58, 388–422.
Dreßler, Daniel and Michael Overesch, 2013, Investment impact of tax loss treatment –
empirical insights from a panel of multinationals, International Tax Public Finance
20, 513–543.
Edgerton, Jesse, 2010, Investment incentives and corporate tax asymmetries, Journal
of Public Economics 94, 936–952.
34

Egger, Peter, Wolfgang Eggert, Christian Keuschnigg, and Hannes Winner, 2010, Cor-
porate taxation, debt financing and foreign plant ownership, European Economic
Review 54, 96–107.
Erickson, Merle and Shane Heitzman, 2010, NOL poison pills: Selectiva v. selectiva,
Tax Notes, June 23.
Faccio, Mara, Maria-Teresa Marchica, and Roberto Mura, 2011, Large shareholder di-
versification and corporate risk-taking, Review of Financial Studies 24, 3601–3641.
Feldstein, Martin S., 1969, The effect of taxation on risk-taking, Journal of Political
Economy 77, 755–764.
Geczy, Christopher, Bernadette A. Minton, and Catherine Schrand, 1997, Why firms
use currency derivatives, Journal of Finance 52, 1323–1354.
Gonzalez, Francisco, 2005, Bank regulation and risk-taking incentives: An international
comparison of bank risk, Journal of Banking & Finance 29, 1153 – 1184.
Gordon, Roger H., 1985, Taxation of corporate capital income: Tax revenues versus tax
distortions, Quarterly Journal of Economics 100, 1–27.
Graham, John R. and Daniel A. Rogers, 2002, Do firms hedge in response to tax
incentives?, Journal of Finance 57, 815–839.
Graham, John R. and Clifford W. Smith, 1999, Tax incentives to hedge, Journal of
Finance 54, 2241–2262.
Guay, Wayne R., 1999, The sensitivity of CEO wealth to equity risk: An analysis of the
magnitude and determinants, Journal of Financial Economics 53, 43–71.
Guenther, David A., Steven R. Matsunaga, and Brian M. Williams, 2013, Tax avoidance,
tax aggressivness, tax risk and firm risk, available at SSRN: http://dx.doi.org/10.
2139/ssrn.2153187.
Hall, Brian J. and Kevin J. Murphy, 2002, Stock options for undiversified executives,
Journal of Accounting and Economics 33, 3–42.
Hall, Robert E. and Dale W. Jorgenson, 1967, Tax policy and investment behavior,
American Economic Review 57, 391–414.
35

Harris, Milton and Artur Raviv, 1991, The theory of capital structure, Journal of Finance
46, 297–356.
Hassett, Kevin A. and R. Glenn Hubbard, 2002, Tax policy and business investment,
in A. Auerbach and M. Feldstein, eds.: Handbook of Public Economics 3, Elsevier,
Chap. 20, 1293–1343.
Huizinga, Harry and Luc Laeven, 2008, International profit shifting within multination-
als: A multi-country perspective, Journal of Public Economics 92, 1164–1182.
Hunter, William C. and Stephen D. Smith, 2002, Risk management in the global econ-
omy: A review essay, Journal of Banking & Finance 26, 205 – 221.
Hutchens, Michelle and Sonja Rego, 2012, Tax risk and the cost of equity capital,
available at SSRN: http://dx.doi.org/10.2139/ssrn.2186564.
Imbens, Guido and Karthik Kalyanaraman, 2012, Optimal Bandwidth Choice for the
Regression Discontinuity Estimator, Review of Economic Studies 79, 933–959.
Janssen, Maarten C.W. and Vladimir A. Karamychev, 2007, Selection effects in auctions
for monopoly rights, Journal of Economic Theory 134, 576 – 582.
John, Kose, Lubomir Litov, and Bernhard Yeung, 2008, Corporate governance and
risk-taking, Journal of Finance 63, 1679–1728.
Karkinsky, Tom and Nadine Riedel, 2012, Corporate taxation and the choice of patent
location within multinational firms, Journal of International Economics 88, 176–185.
Leland, Hayne E., 1998, Agency costs, risk management and capital structure, Journal
of Finance 53, 1212–1243.
Lewellen, Katharina, 2006, Financing decisions when managers are risk averse, Journal
of Finance 82, 551–589.
May, Don O., 1995, Do managerial motives influence firm risk reduction strategies?,
Journal of Finance 50, 1291–1308.
Maydew, Edward L., 1997, Tax induced earnings management by firms with net oper-
ating losses, Journal of Accounting Research 35, 83–96.
36

Mirrlees, James, Stuart Adam, Tim Besley, Richard Blundell, Steve Bond, Robert Chote,
Malcolm Gammie, Paul Johnson, Gareth Myles, and James Poterba, 2011, Small
business taxation, in Tax By Design: The Mirrlees Review, Oxford University Press,
Chap. 19, 451–469.
Neuman, Stevanie S., Thomas C. Omer, and Andrew Schmidt, 2013, Risk and return:
Does tax risk reduce firms’ effective tax rates?, available at SSRN: http://ssrn.com/
abstract=2216878.
Nichols, Austin, 2007, RD: Stata module for regression discontinuity estimation, Sta-
tistical Software Components, Boston College Department of Economics.
Officer, Lawrence H., 2011, Exchange Rates Between the United States Dollar and
Fortyone Currencies, Measuring Worth, available online at www.measuringworth.
com/exchangeglobal.
Petersen, Mitchell A., 2009, Estimating standard errors in finance panel data sets:
Comparing approaches, Review of Financial Studies 22, 435–480.
Porcano, Thomas M., 1986, Corporate tax rates: Progressive, proportional or regressive,
Journal of the American Taxation Association 7, 17–31.
Poterba, James M. and Andrew Samwick, 2002, Taxation and household portfolio
composition: US evidence from the 1980s and 1990s, Journal of Public Economics
87, 5–38.
Purnanandam, Amiyatosh K., 2008, Financial distress and corporate risk management:
Theory and evidence, Journal of Financial Economics 87, 706–739.
Rajgopal, Shivaram and Terry Shevlin, 2002, Empirical evidence on the relation between
stock option compensation and risk taking, Journal of Accounting and Economics
33, 145–171.
Rego, Sonja O., 2003, Tax-avoidance activities of U.S. multinational corporations, Con-
temporary Accounting Research 20, 805–833.
Sandmo, Agnar, 1971, On the theory of the competitive firm under price uncertainty,
The American Economic Review 61, 65–73.
Stiglitz, Joseph E., 1969, The effects of income, wealth and capital gains taxation on
risk-taking, Quarterly Journal of Economics 83, 263–283.
37
Stock, James H., Jonathan H. Wright, and Motohiro Yogo, 2002, A survey of weak
instruments and weak identification in generalized method of moments, Journal of
Business & Economics Statistics 20, 518–529.
Tufano, Peter, 1996, Who manages risk? An empirical examination of risk management
practices in the gold mining industry, Journal of Finance 51, 1097–1137.
Zimmermann, Jerold L., 1983, Taxes and firm size, Journal of Accounting and Economics
5, 119–149.
38
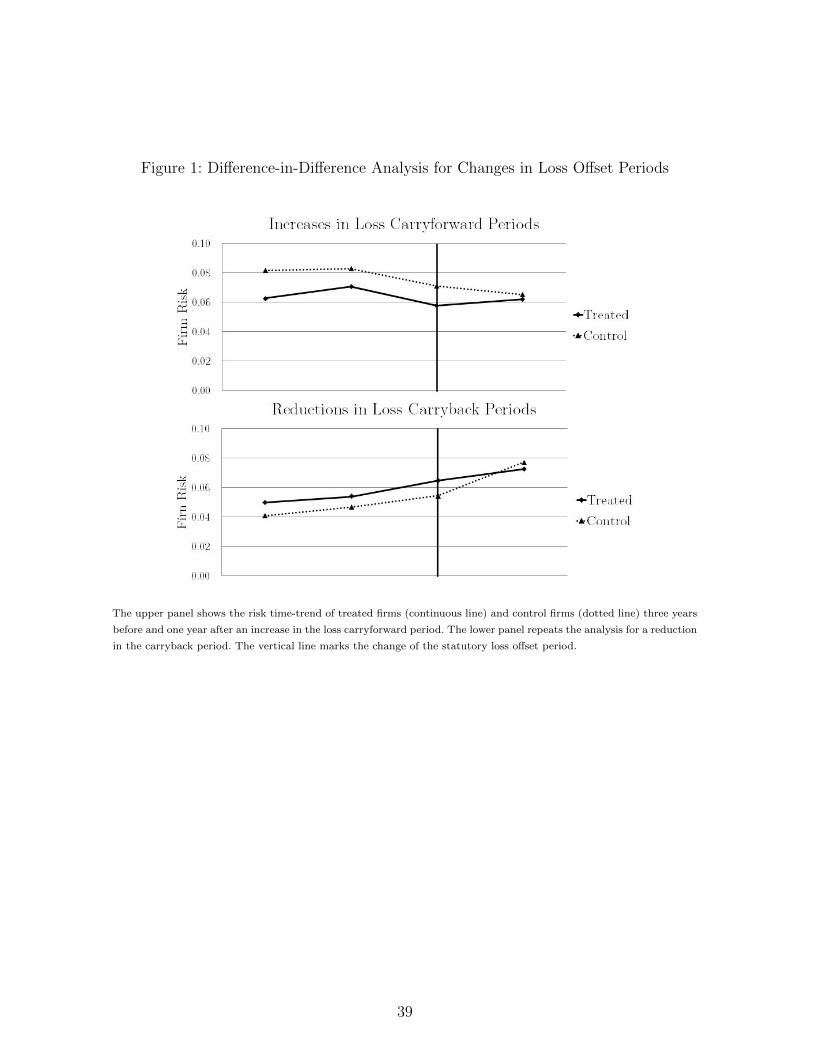
Figure 1: Difference-in-Difference Analysis for Changes in Loss Offset Periods
The upper panel shows the risk time-trend of treated firms (continuous line) and control firms (dotted line) three years
before and one year after an increase in the loss carryforward period. The lower panel repeats the analysis for a reduction
in the carryback period. The vertical line marks the change of the statutory loss offset period.
39
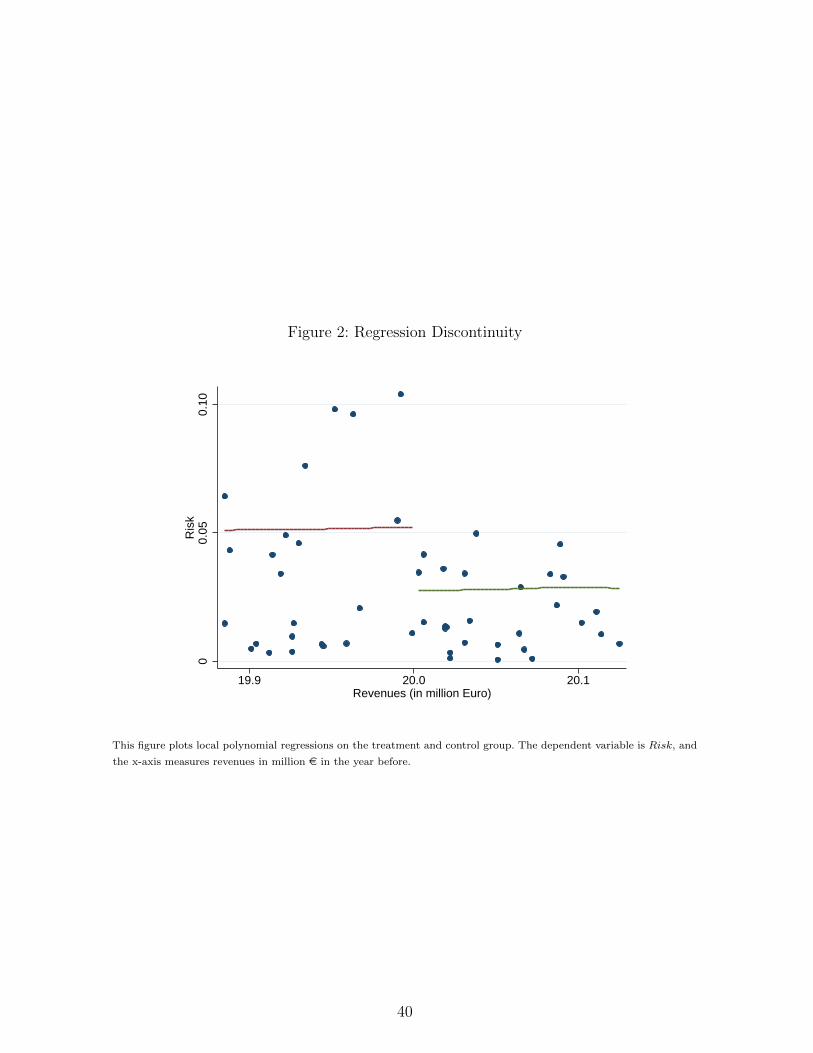
Figure 2: Regression Discontinuity
00.
050.
10R
isk
19.9 20.0 20.1Revenues (in million Euro)
This figure plots local polynomial regressions on the treatment and control group. The dependent variable is Risk, and
the x-axis measures revenues in million e in the year before.
40
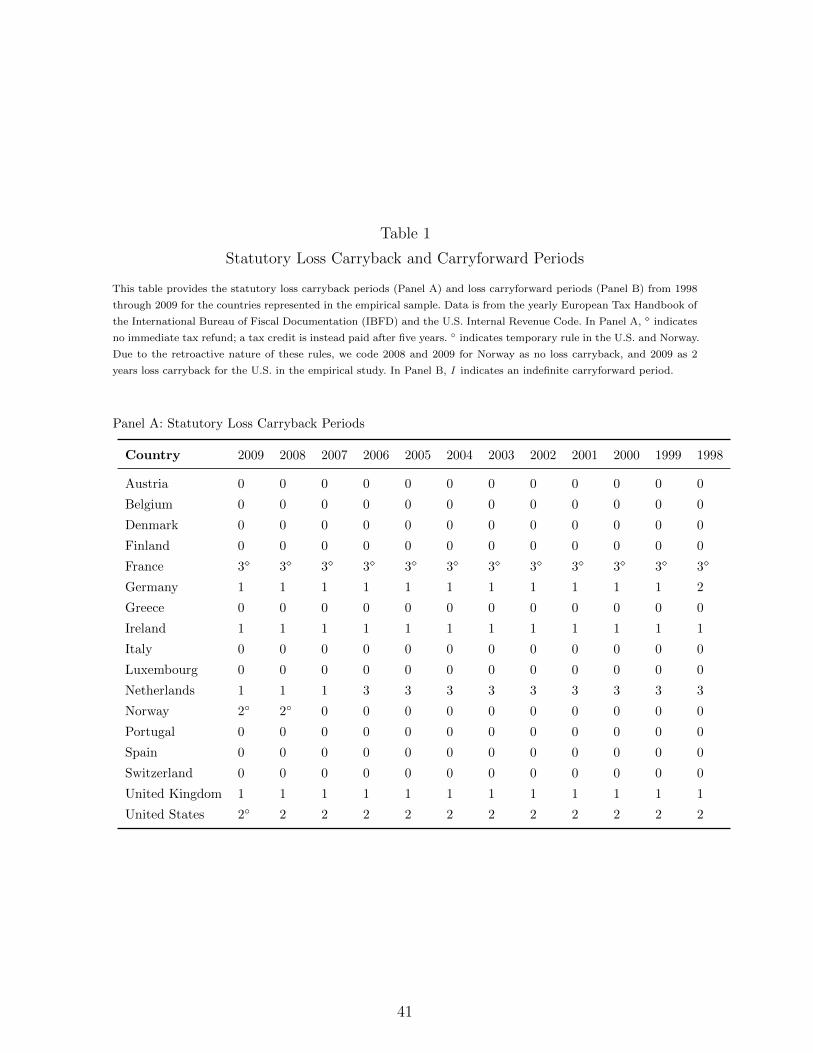
Table 1
Statutory Loss Carryback and Carryforward Periods
This table provides the statutory loss carryback periods (Panel A) and loss carryforward periods (Panel B) from 1998
through 2009 for the countries represented in the empirical sample. Data is from the yearly European Tax Handbook of
the International Bureau of Fiscal Documentation (IBFD) and the U.S. Internal Revenue Code. In Panel A, � indicates
no immediate tax refund; a tax credit is instead paid after five years. ◦ indicates temporary rule in the U.S. and Norway.
Due to the retroactive nature of these rules, we code 2008 and 2009 for Norway as no loss carryback, and 2009 as 2
years loss carryback for the U.S. in the empirical study. In Panel B, I indicates an indefinite carryforward period.
Panel A: Statutory Loss Carryback Periods
Country 2009 2008 2007 2006 2005 2004 2003 2002 2001 2000 1999 1998
Austria 0 0 0 0 0 0 0 0 0 0 0 0
Belgium 0 0 0 0 0 0 0 0 0 0 0 0
Denmark 0 0 0 0 0 0 0 0 0 0 0 0
Finland 0 0 0 0 0 0 0 0 0 0 0 0
France 3� 3� 3� 3� 3� 3� 3� 3� 3� 3� 3� 3�
Germany 1 1 1 1 1 1 1 1 1 1 1 2
Greece 0 0 0 0 0 0 0 0 0 0 0 0
Ireland 1 1 1 1 1 1 1 1 1 1 1 1
Italy 0 0 0 0 0 0 0 0 0 0 0 0
Luxembourg 0 0 0 0 0 0 0 0 0 0 0 0
Netherlands 1 1 1 3 3 3 3 3 3 3 3 3
Norway 2◦ 2◦ 0 0 0 0 0 0 0 0 0 0
Portugal 0 0 0 0 0 0 0 0 0 0 0 0
Spain 0 0 0 0 0 0 0 0 0 0 0 0
Switzerland 0 0 0 0 0 0 0 0 0 0 0 0
United Kingdom 1 1 1 1 1 1 1 1 1 1 1 1
United States 2◦ 2 2 2 2 2 2 2 2 2 2 2
41
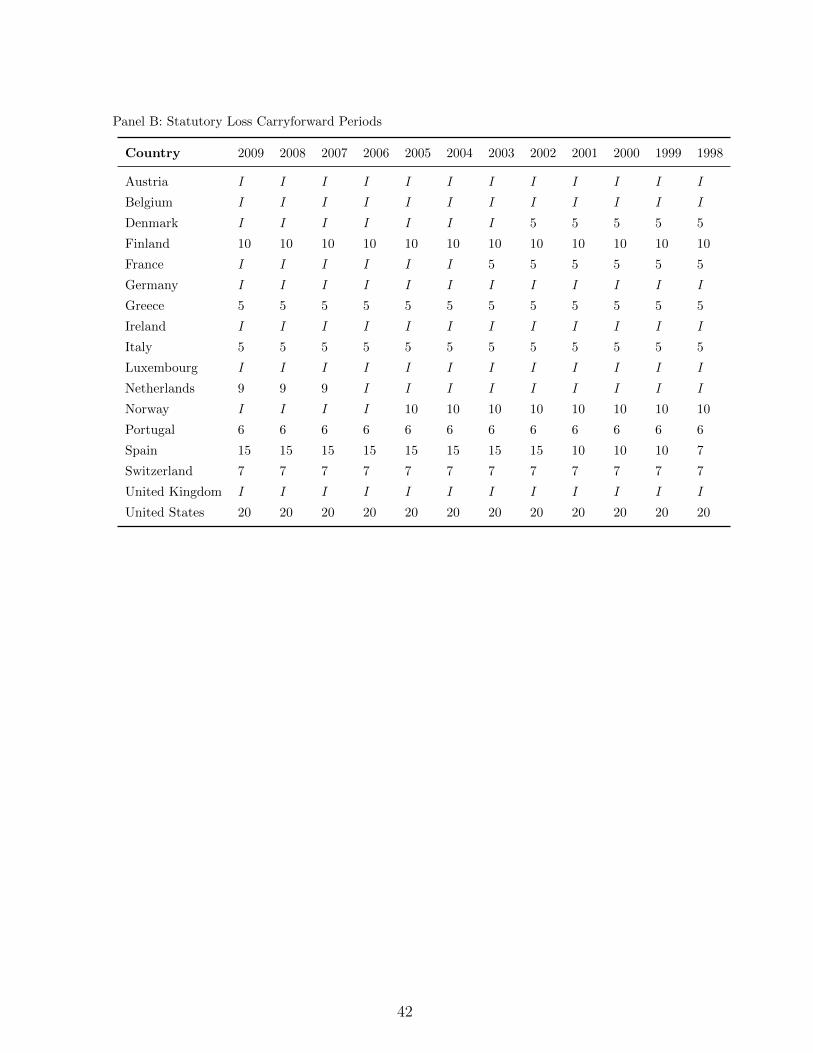
Panel B: Statutory Loss Carryforward Periods
Country 2009 2008 2007 2006 2005 2004 2003 2002 2001 2000 1999 1998
Austria I I I I I I I I I I I I
Belgium I I I I I I I I I I I I
Denmark I I I I I I I 5 5 5 5 5
Finland 10 10 10 10 10 10 10 10 10 10 10 10
France I I I I I I 5 5 5 5 5 5
Germany I I I I I I I I I I I I
Greece 5 5 5 5 5 5 5 5 5 5 5 5
Ireland I I I I I I I I I I I I
Italy 5 5 5 5 5 5 5 5 5 5 5 5
Luxembourg I I I I I I I I I I I I
Netherlands 9 9 9 I I I I I I I I I
Norway I I I I 10 10 10 10 10 10 10 10
Portugal 6 6 6 6 6 6 6 6 6 6 6 6
Spain 15 15 15 15 15 15 15 15 10 10 10 7
Switzerland 7 7 7 7 7 7 7 7 7 7 7 7
United Kingdom I I I I I I I I I I I I
United States 20 20 20 20 20 20 20 20 20 20 20 20
42
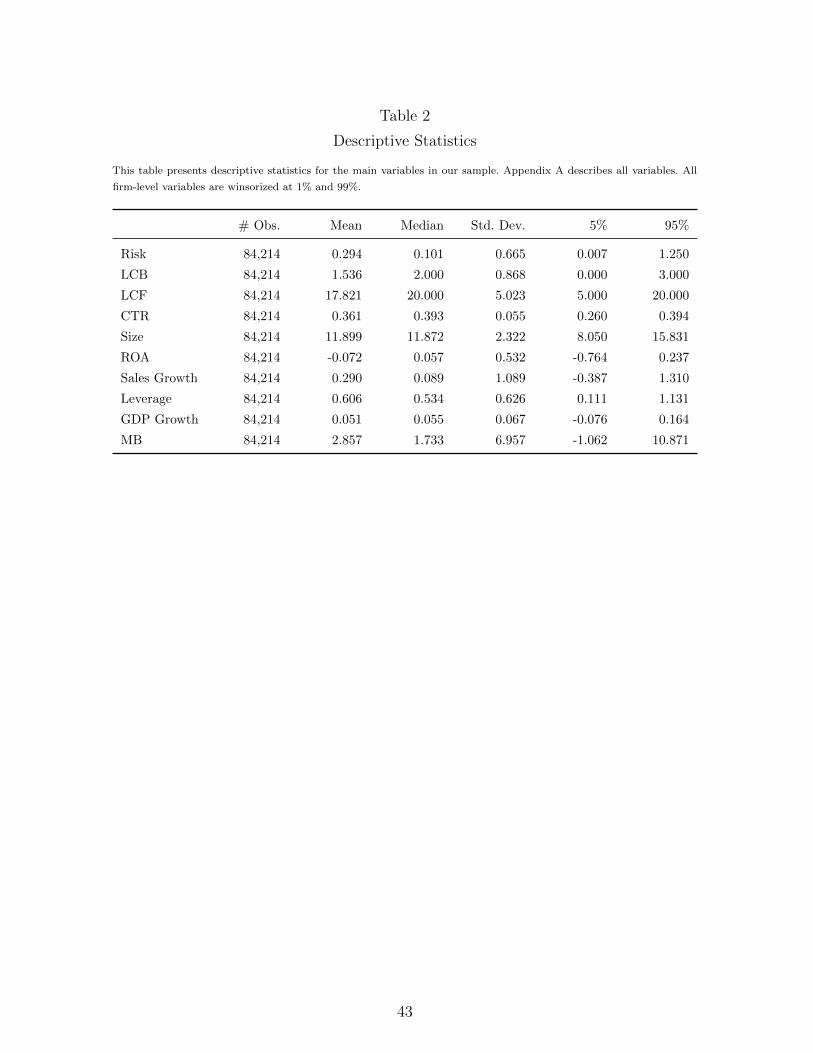
Table 2
Descriptive Statistics
This table presents descriptive statistics for the main variables in our sample. Appendix A describes all variables. All
firm-level variables are winsorized at 1% and 99%.
# Obs. Mean Median Std. Dev. 5% 95%
Risk 84,214 0.294 0.101 0.665 0.007 1.250
LCB 84,214 1.536 2.000 0.868 0.000 3.000
LCF 84,214 17.821 20.000 5.023 5.000 20.000
CTR 84,214 0.361 0.393 0.055 0.260 0.394
Size 84,214 11.899 11.872 2.322 8.050 15.831
ROA 84,214 -0.072 0.057 0.532 -0.764 0.237
Sales Growth 84,214 0.290 0.089 1.089 -0.387 1.310
Leverage 84,214 0.606 0.534 0.626 0.111 1.131
GDP Growth 84,214 0.051 0.055 0.067 -0.076 0.164
MB 84,214 2.857 1.733 6.957 -1.062 10.871
43
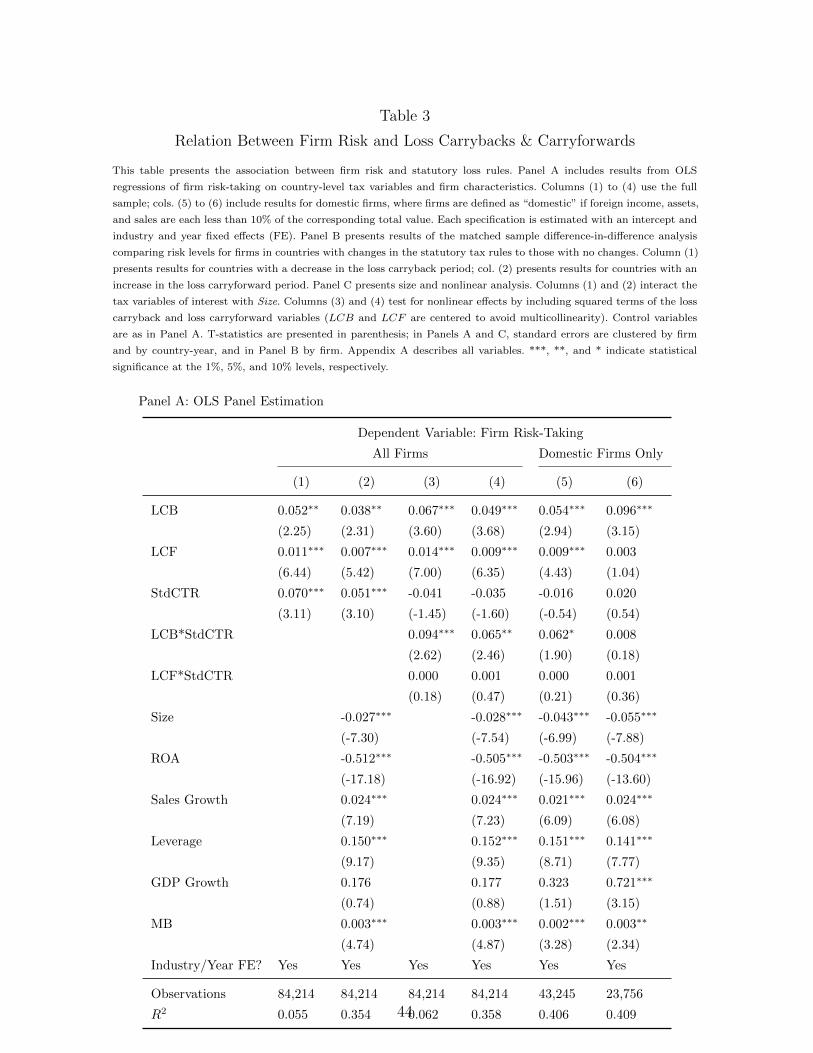
Table 3
Relation Between Firm Risk and Loss Carrybacks & Carryforwards
This table presents the association between firm risk and statutory loss rules. Panel A includes results from OLS
regressions of firm risk-taking on country-level tax variables and firm characteristics. Columns (1) to (4) use the full
sample; cols. (5) to (6) include results for domestic firms, where firms are defined as “domestic” if foreign income, assets,
and sales are each less than 10% of the corresponding total value. Each specification is estimated with an intercept and
industry and year fixed effects (FE). Panel B presents results of the matched sample difference-in-difference analysis
comparing risk levels for firms in countries with changes in the statutory tax rules to those with no changes. Column (1)
presents results for countries with a decrease in the loss carryback period; col. (2) presents results for countries with an
increase in the loss carryforward period. Panel C presents size and nonlinear analysis. Columns (1) and (2) interact the
tax variables of interest with Size. Columns (3) and (4) test for nonlinear effects by including squared terms of the loss
carryback and loss carryforward variables (LCB and LCF are centered to avoid multicollinearity). Control variables
are as in Panel A. T-statistics are presented in parenthesis; in Panels A and C, standard errors are clustered by firm
and by country-year, and in Panel B by firm. Appendix A describes all variables. ***, **, and * indicate statistical
significance at the 1%, 5%, and 10% levels, respectively.
Panel A: OLS Panel Estimation
Dependent Variable: Firm Risk-Taking
All Firms Domestic Firms Only
(1) (2) (3) (4) (5) (6)
LCB 0.052∗∗ 0.038∗∗ 0.067∗∗∗ 0.049∗∗∗ 0.054∗∗∗ 0.096∗∗∗
(2.25) (2.31) (3.60) (3.68) (2.94) (3.15)
LCF 0.011∗∗∗ 0.007∗∗∗ 0.014∗∗∗ 0.009∗∗∗ 0.009∗∗∗ 0.003
(6.44) (5.42) (7.00) (6.35) (4.43) (1.04)
StdCTR 0.070∗∗∗ 0.051∗∗∗ -0.041 -0.035 -0.016 0.020
(3.11) (3.10) (-1.45) (-1.60) (-0.54) (0.54)
LCB*StdCTR 0.094∗∗∗ 0.065∗∗ 0.062∗ 0.008
(2.62) (2.46) (1.90) (0.18)
LCF*StdCTR 0.000 0.001 0.000 0.001
(0.18) (0.47) (0.21) (0.36)
Size -0.027∗∗∗ -0.028∗∗∗ -0.043∗∗∗ -0.055∗∗∗
(-7.30) (-7.54) (-6.99) (-7.88)
ROA -0.512∗∗∗ -0.505∗∗∗ -0.503∗∗∗ -0.504∗∗∗
(-17.18) (-16.92) (-15.96) (-13.60)
Sales Growth 0.024∗∗∗ 0.024∗∗∗ 0.021∗∗∗ 0.024∗∗∗
(7.19) (7.23) (6.09) (6.08)
Leverage 0.150∗∗∗ 0.152∗∗∗ 0.151∗∗∗ 0.141∗∗∗
(9.17) (9.35) (8.71) (7.77)
GDP Growth 0.176 0.177 0.323 0.721∗∗∗
(0.74) (0.88) (1.51) (3.15)
MB 0.003∗∗∗ 0.003∗∗∗ 0.002∗∗∗ 0.003∗∗
(4.74) (4.87) (3.28) (2.34)
Industry/Year FE? Yes Yes Yes Yes Yes Yes
Observations 84,214 84,214 84,214 84,214 43,245 23,756
R2 0.055 0.354 0.062 0.358 0.406 0.40944
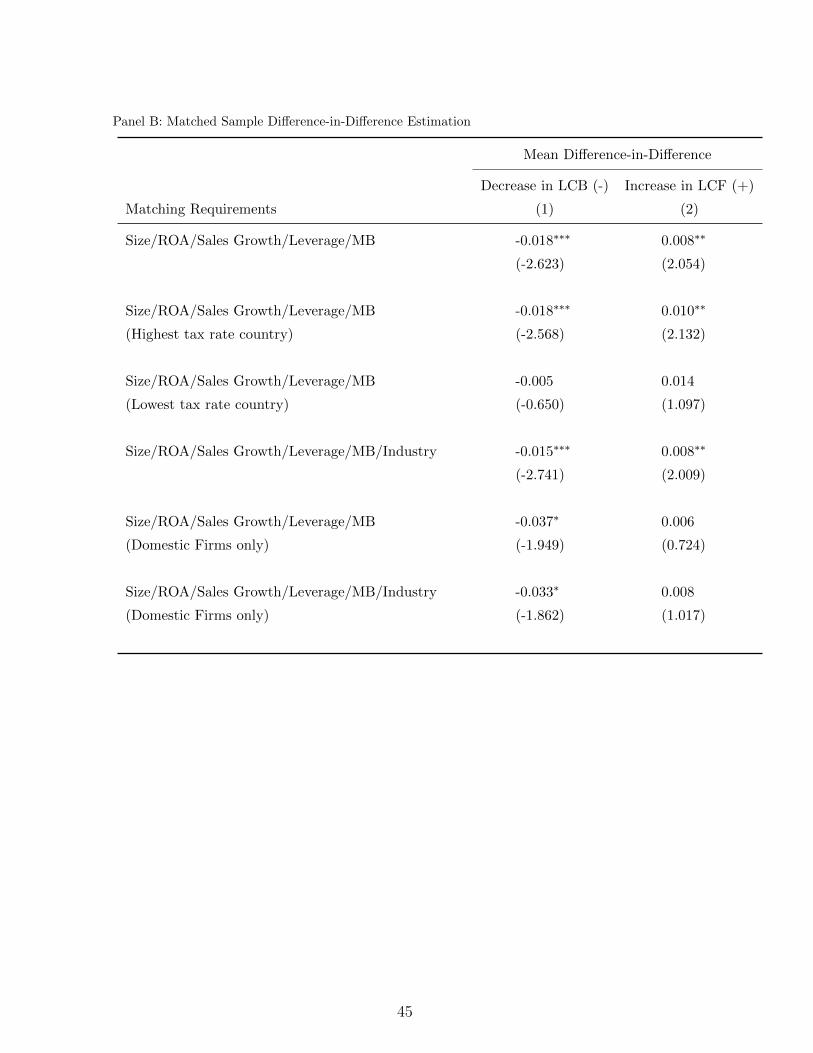
Panel B: Matched Sample Difference-in-Difference Estimation
Mean Difference-in-Difference
Decrease in LCB (-) Increase in LCF (+)
Matching Requirements (1) (2)
Size/ROA/Sales Growth/Leverage/MB -0.018∗∗∗ 0.008∗∗
(-2.623) (2.054)
Size/ROA/Sales Growth/Leverage/MB -0.018∗∗∗ 0.010∗∗
(Highest tax rate country) (-2.568) (2.132)
Size/ROA/Sales Growth/Leverage/MB -0.005 0.014
(Lowest tax rate country) (-0.650) (1.097)
Size/ROA/Sales Growth/Leverage/MB/Industry -0.015∗∗∗ 0.008∗∗
(-2.741) (2.009)
Size/ROA/Sales Growth/Leverage/MB -0.037∗ 0.006
(Domestic Firms only) (-1.949) (0.724)
Size/ROA/Sales Growth/Leverage/MB/Industry -0.033∗ 0.008
(Domestic Firms only) (-1.862) (1.017)
45
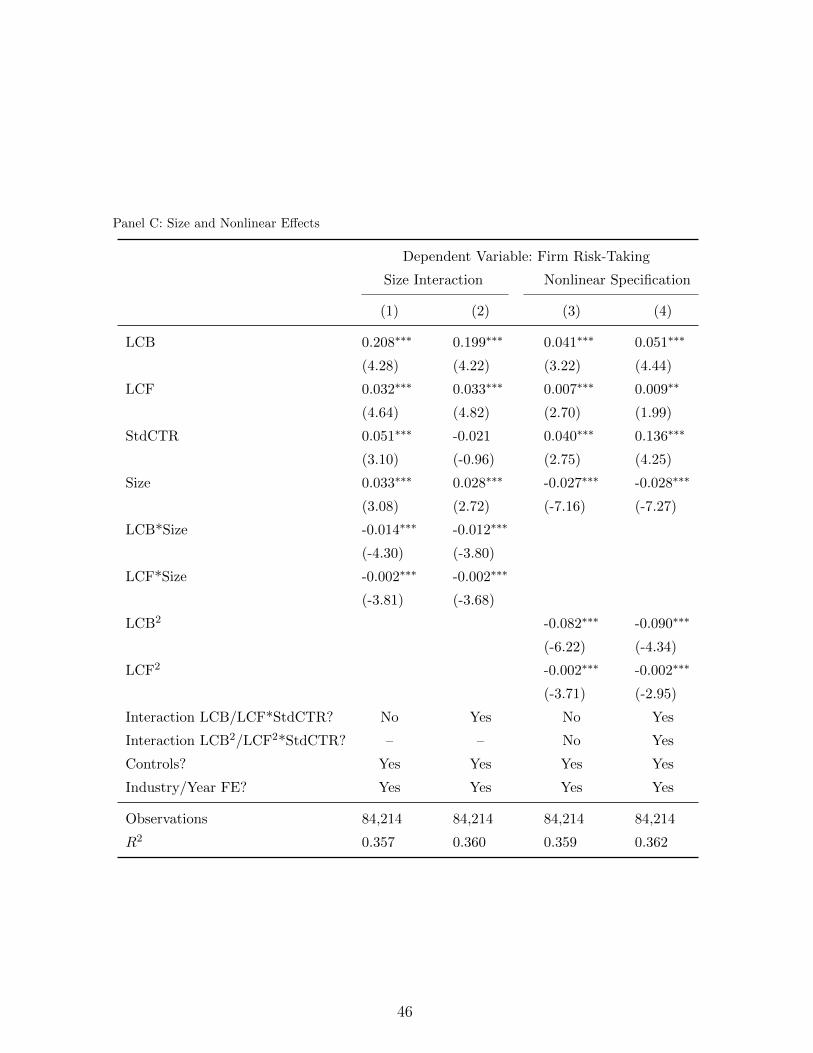
Panel C: Size and Nonlinear Effects
Dependent Variable: Firm Risk-Taking
Size Interaction Nonlinear Specification
(1) (2) (3) (4)
LCB 0.208∗∗∗ 0.199∗∗∗ 0.041∗∗∗ 0.051∗∗∗
(4.28) (4.22) (3.22) (4.44)
LCF 0.032∗∗∗ 0.033∗∗∗ 0.007∗∗∗ 0.009∗∗
(4.64) (4.82) (2.70) (1.99)
StdCTR 0.051∗∗∗ -0.021 0.040∗∗∗ 0.136∗∗∗
(3.10) (-0.96) (2.75) (4.25)
Size 0.033∗∗∗ 0.028∗∗∗ -0.027∗∗∗ -0.028∗∗∗
(3.08) (2.72) (-7.16) (-7.27)
LCB*Size -0.014∗∗∗ -0.012∗∗∗
(-4.30) (-3.80)
LCF*Size -0.002∗∗∗ -0.002∗∗∗
(-3.81) (-3.68)
LCB2 -0.082∗∗∗ -0.090∗∗∗
(-6.22) (-4.34)
LCF2 -0.002∗∗∗ -0.002∗∗∗
(-3.71) (-2.95)
Interaction LCB/LCF*StdCTR? No Yes No Yes
Interaction LCB2/LCF2*StdCTR? – – No Yes
Controls? Yes Yes Yes Yes
Industry/Year FE? Yes Yes Yes Yes
Observations 84,214 84,214 84,214 84,214
R2 0.357 0.360 0.359 0.362
46
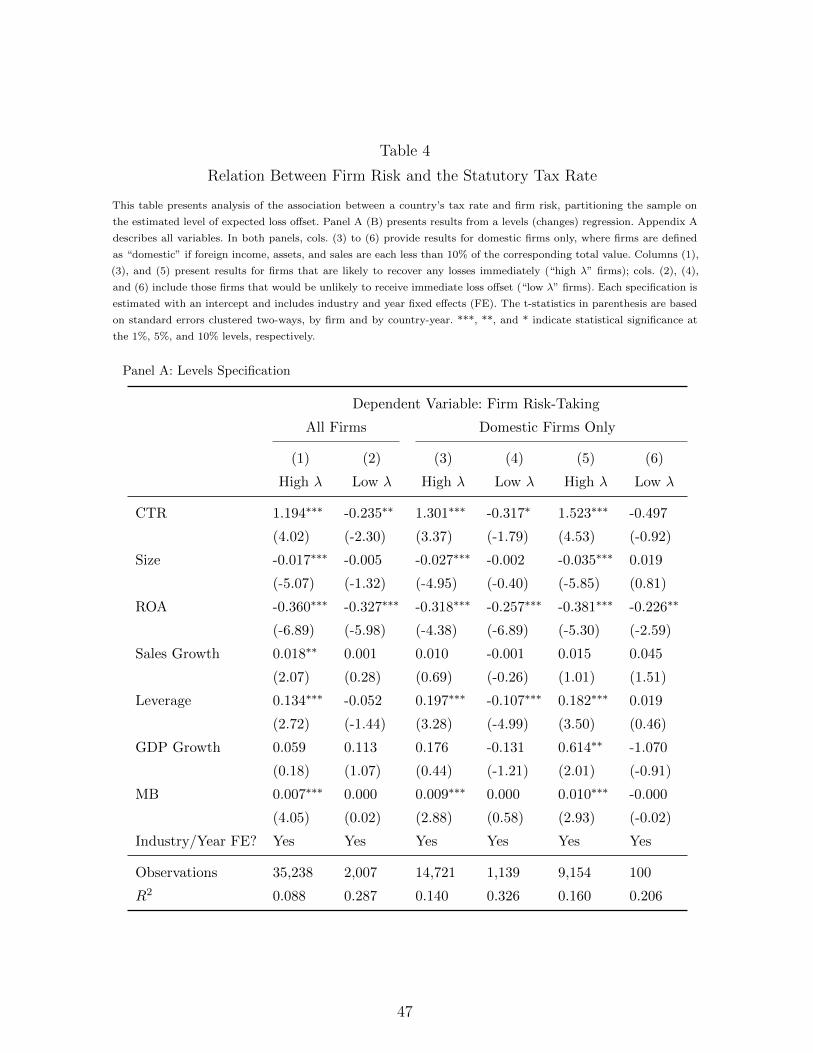
Table 4
Relation Between Firm Risk and the Statutory Tax Rate
This table presents analysis of the association between a country’s tax rate and firm risk, partitioning the sample on
the estimated level of expected loss offset. Panel A (B) presents results from a levels (changes) regression. Appendix A
describes all variables. In both panels, cols. (3) to (6) provide results for domestic firms only, where firms are defined
as “domestic” if foreign income, assets, and sales are each less than 10% of the corresponding total value. Columns (1),
(3), and (5) present results for firms that are likely to recover any losses immediately (“high λ” firms); cols. (2), (4),
and (6) include those firms that would be unlikely to receive immediate loss offset (“low λ” firms). Each specification is
estimated with an intercept and includes industry and year fixed effects (FE). The t-statistics in parenthesis are based
on standard errors clustered two-ways, by firm and by country-year. ***, **, and * indicate statistical significance at
the 1%, 5%, and 10% levels, respectively.
Panel A: Levels Specification
Dependent Variable: Firm Risk-Taking
All Firms Domestic Firms Only
(1) (2) (3) (4) (5) (6)
High λ Low λ High λ Low λ High λ Low λ
CTR 1.194∗∗∗ -0.235∗∗ 1.301∗∗∗ -0.317∗ 1.523∗∗∗ -0.497
(4.02) (-2.30) (3.37) (-1.79) (4.53) (-0.92)
Size -0.017∗∗∗ -0.005 -0.027∗∗∗ -0.002 -0.035∗∗∗ 0.019
(-5.07) (-1.32) (-4.95) (-0.40) (-5.85) (0.81)
ROA -0.360∗∗∗ -0.327∗∗∗ -0.318∗∗∗ -0.257∗∗∗ -0.381∗∗∗ -0.226∗∗
(-6.89) (-5.98) (-4.38) (-6.89) (-5.30) (-2.59)
Sales Growth 0.018∗∗ 0.001 0.010 -0.001 0.015 0.045
(2.07) (0.28) (0.69) (-0.26) (1.01) (1.51)
Leverage 0.134∗∗∗ -0.052 0.197∗∗∗ -0.107∗∗∗ 0.182∗∗∗ 0.019
(2.72) (-1.44) (3.28) (-4.99) (3.50) (0.46)
GDP Growth 0.059 0.113 0.176 -0.131 0.614∗∗ -1.070
(0.18) (1.07) (0.44) (-1.21) (2.01) (-0.91)
MB 0.007∗∗∗ 0.000 0.009∗∗∗ 0.000 0.010∗∗∗ -0.000
(4.05) (0.02) (2.88) (0.58) (2.93) (-0.02)
Industry/Year FE? Yes Yes Yes Yes Yes Yes
Observations 35,238 2,007 14,721 1,139 9,154 100
R2 0.088 0.287 0.140 0.326 0.160 0.206
47
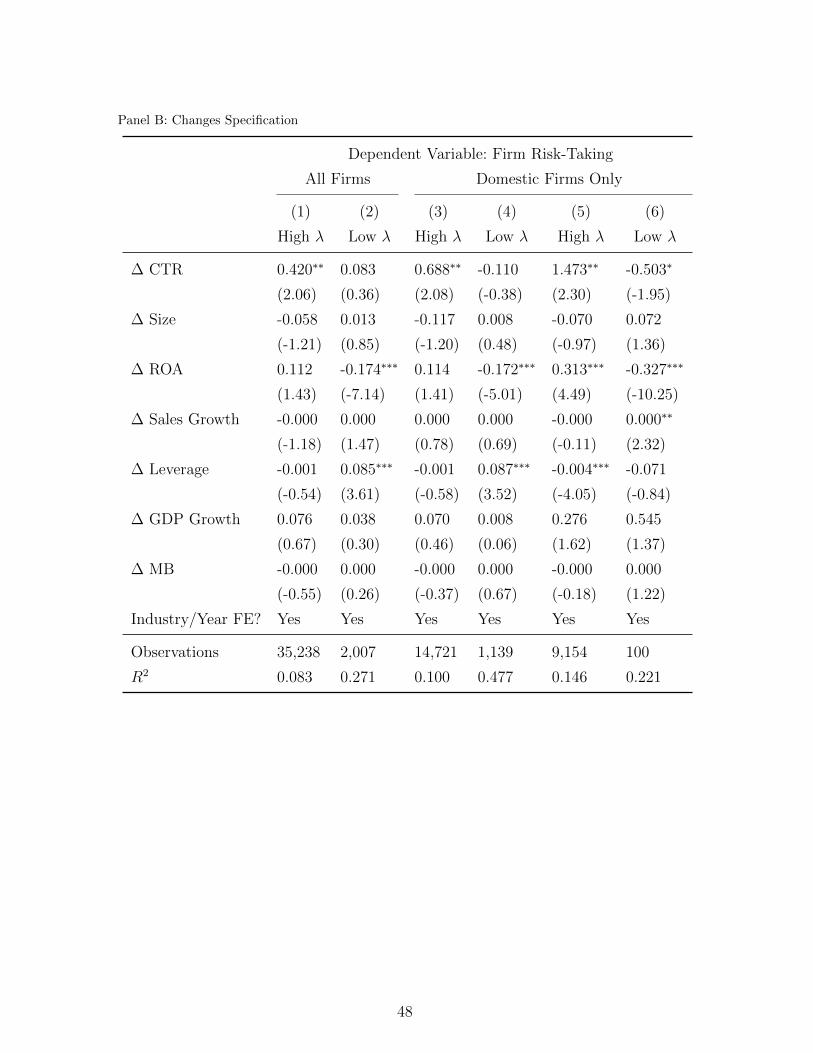
Panel B: Changes Specification
Dependent Variable: Firm Risk-Taking
All Firms Domestic Firms Only
(1) (2) (3) (4) (5) (6)
High λ Low λ High λ Low λ High λ Low λ
∆ CTR 0.420∗∗ 0.083 0.688∗∗ -0.110 1.473∗∗ -0.503∗
(2.06) (0.36) (2.08) (-0.38) (2.30) (-1.95)
∆ Size -0.058 0.013 -0.117 0.008 -0.070 0.072
(-1.21) (0.85) (-1.20) (0.48) (-0.97) (1.36)
∆ ROA 0.112 -0.174∗∗∗ 0.114 -0.172∗∗∗ 0.313∗∗∗ -0.327∗∗∗
(1.43) (-7.14) (1.41) (-5.01) (4.49) (-10.25)
∆ Sales Growth -0.000 0.000 0.000 0.000 -0.000 0.000∗∗
(-1.18) (1.47) (0.78) (0.69) (-0.11) (2.32)
∆ Leverage -0.001 0.085∗∗∗ -0.001 0.087∗∗∗ -0.004∗∗∗ -0.071
(-0.54) (3.61) (-0.58) (3.52) (-4.05) (-0.84)
∆ GDP Growth 0.076 0.038 0.070 0.008 0.276 0.545
(0.67) (0.30) (0.46) (0.06) (1.62) (1.37)
∆ MB -0.000 0.000 -0.000 0.000 -0.000 0.000
(-0.55) (0.26) (-0.37) (0.67) (-0.18) (1.22)
Industry/Year FE? Yes Yes Yes Yes Yes Yes
Observations 35,238 2,007 14,721 1,139 9,154 100
R2 0.083 0.271 0.100 0.477 0.146 0.221
48
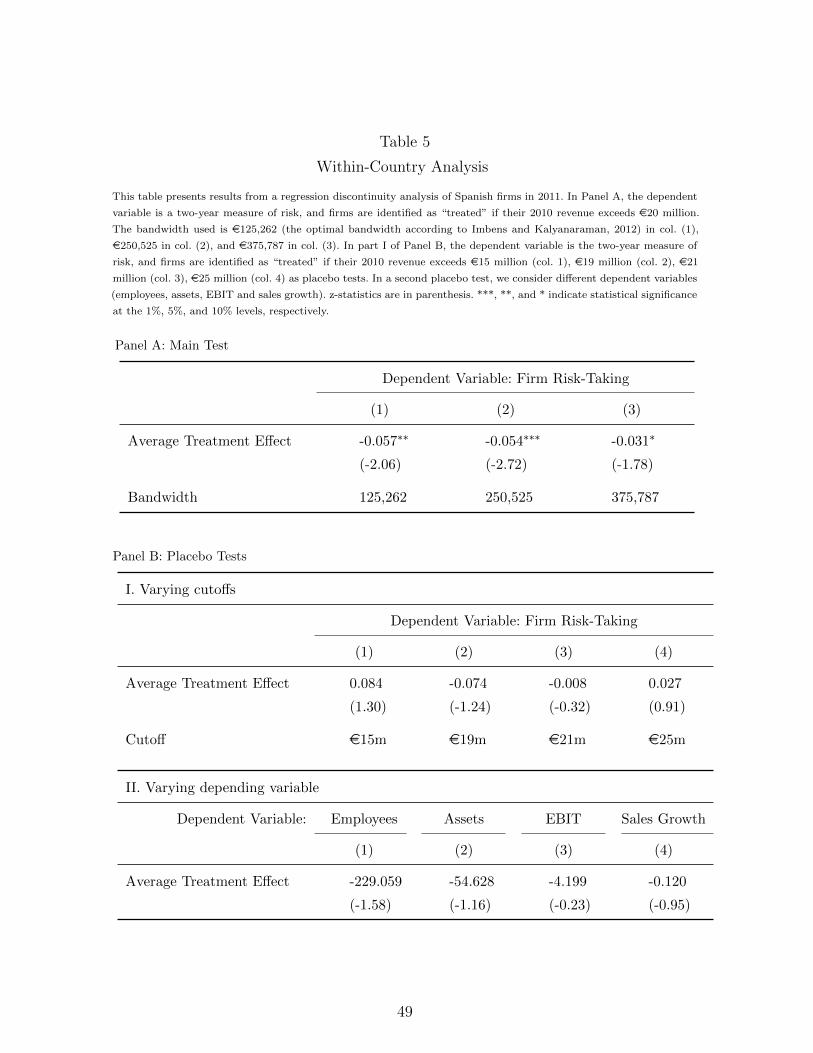
Table 5
Within-Country Analysis
This table presents results from a regression discontinuity analysis of Spanish firms in 2011. In Panel A, the dependent
variable is a two-year measure of risk, and firms are identified as “treated” if their 2010 revenue exceeds e20 million.
The bandwidth used is e125,262 (the optimal bandwidth according to Imbens and Kalyanaraman, 2012) in col. (1),
e250,525 in col. (2), and e375,787 in col. (3). In part I of Panel B, the dependent variable is the two-year measure of
risk, and firms are identified as “treated” if their 2010 revenue exceeds e15 million (col. 1), e19 million (col. 2), e21
million (col. 3), e25 million (col. 4) as placebo tests. In a second placebo test, we consider different dependent variables
(employees, assets, EBIT and sales growth). z-statistics are in parenthesis. ***, **, and * indicate statistical significance
at the 1%, 5%, and 10% levels, respectively.
Panel A: Main Test
Dependent Variable: Firm Risk-Taking
(1) (2) (3)
Average Treatment Effect -0.057∗∗ -0.054∗∗∗ -0.031∗
(-2.06) (-2.72) (-1.78)
Bandwidth 125,262 250,525 375,787
Panel B: Placebo Tests
I. Varying cutoffs
Dependent Variable: Firm Risk-Taking
(1) (2) (3) (4)
Average Treatment Effect 0.084 -0.074 -0.008 0.027
(1.30) (-1.24) (-0.32) (0.91)
Cutoff e15m e19m e21m e25m
II. Varying depending variable
Dependent Variable: Employees Assets EBIT Sales Growth
(1) (2) (3) (4)
Average Treatment Effect -229.059 -54.628 -4.199 -0.120
(-1.58) (-1.16) (-0.23) (-0.95)
49
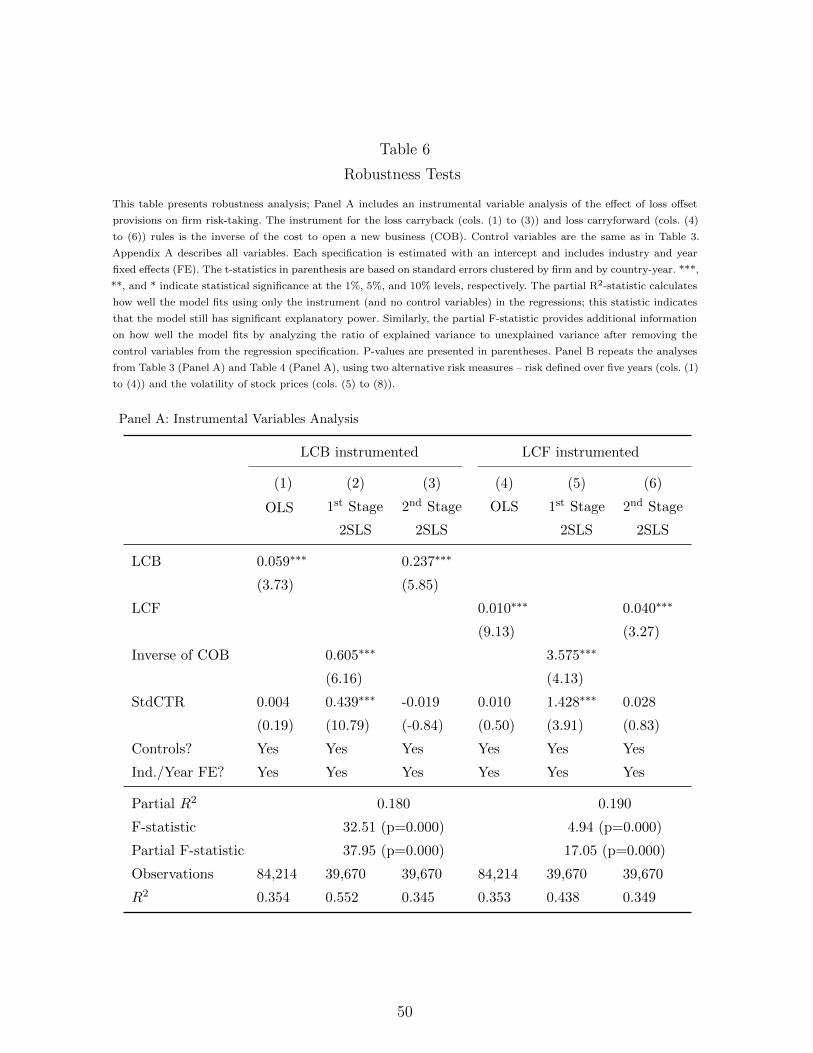
Table 6
Robustness Tests
This table presents robustness analysis; Panel A includes an instrumental variable analysis of the effect of loss offset
provisions on firm risk-taking. The instrument for the loss carryback (cols. (1) to (3)) and loss carryforward (cols. (4)
to (6)) rules is the inverse of the cost to open a new business (COB). Control variables are the same as in Table 3.
Appendix A describes all variables. Each specification is estimated with an intercept and includes industry and year
fixed effects (FE). The t-statistics in parenthesis are based on standard errors clustered by firm and by country-year. ***,
**, and * indicate statistical significance at the 1%, 5%, and 10% levels, respectively. The partial R2-statistic calculates
how well the model fits using only the instrument (and no control variables) in the regressions; this statistic indicates
that the model still has significant explanatory power. Similarly, the partial F-statistic provides additional information
on how well the model fits by analyzing the ratio of explained variance to unexplained variance after removing the
control variables from the regression specification. P-values are presented in parentheses. Panel B repeats the analyses
from Table 3 (Panel A) and Table 4 (Panel A), using two alternative risk measures – risk defined over five years (cols. (1)
to (4)) and the volatility of stock prices (cols. (5) to (8)).
Panel A: Instrumental Variables Analysis
LCB instrumented LCF instrumented
(1) (2) (3) (4) (5) (6)
OLS 1st Stage
2SLS
2nd Stage
2SLS
OLS 1st Stage
2SLS
2nd Stage
2SLS
LCB 0.059∗∗∗ 0.237∗∗∗
(3.73) (5.85)
LCF 0.010∗∗∗ 0.040∗∗∗
(9.13) (3.27)
Inverse of COB 0.605∗∗∗ 3.575∗∗∗
(6.16) (4.13)
StdCTR 0.004 0.439∗∗∗ -0.019 0.010 1.428∗∗∗ 0.028
(0.19) (10.79) (-0.84) (0.50) (3.91) (0.83)
Controls? Yes Yes Yes Yes Yes Yes
Ind./Year FE? Yes Yes Yes Yes Yes Yes
Partial R2 0.180 0.190
F-statistic 32.51 (p=0.000) 4.94 (p=0.000)
Partial F-statistic 37.95 (p=0.000) 17.05 (p=0.000)
Observations 84,214 39,670 39,670 84,214 39,670 39,670
R2 0.354 0.552 0.345 0.353 0.438 0.349
50
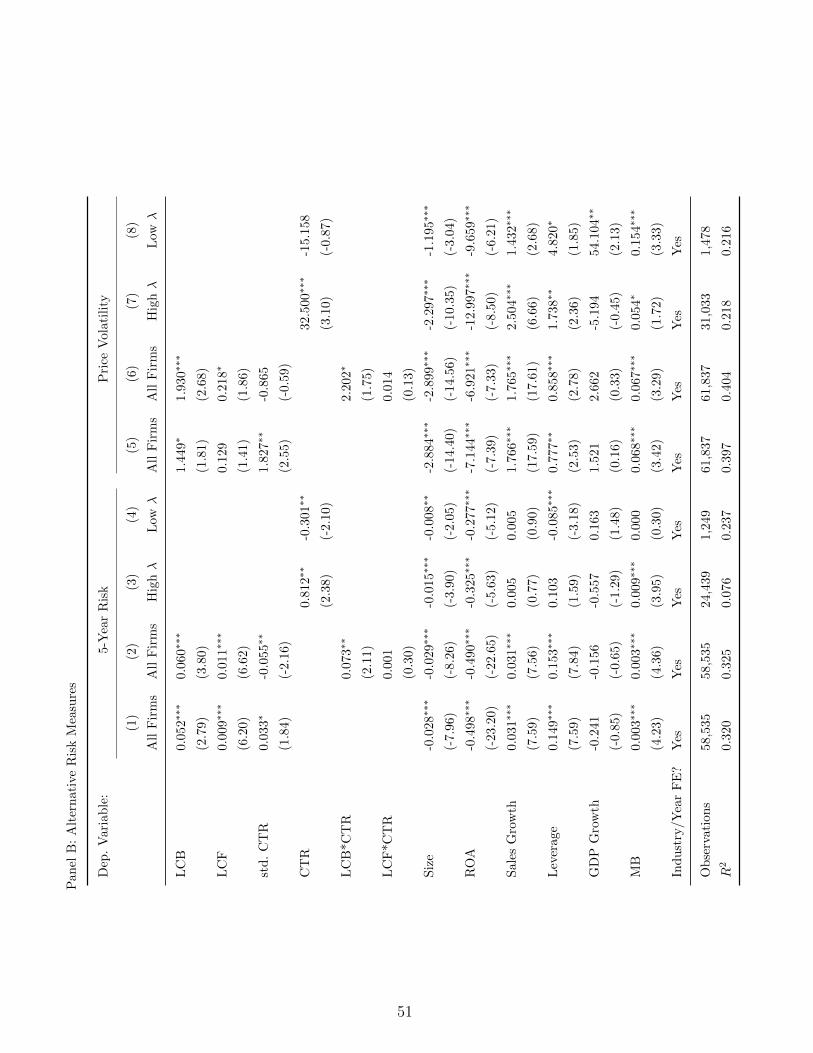
Pan
elB
:A
lter
nat
ive
Ris
kM
easu
res
Dep
.V
aria
ble
:5-Y
ear
Ris
kP
rice
Vola
tili
ty
(1)
(2)
(3)
(4)
(5)
(6)
(7)
(8)
All
Fir
ms
All
Fir
ms
Hig
hλ
Low
λA
llF
irm
sA
llF
irm
sH
ighλ
Low
λ
LC
B0.
052∗∗∗
0.0
60∗∗∗
1.4
49∗
1.9
30∗∗∗
(2.7
9)(3
.80)
(1.8
1)
(2.6
8)
LC
F0.
009∗∗∗
0.0
11∗∗∗
0.1
29
0.2
18∗
(6.2
0)(6
.62)
(1.4
1)
(1.8
6)
std
.C
TR
0.03
3∗
-0.0
55∗∗
1.8
27∗∗
-0.8
65
(1.8
4)(-
2.1
6)
(2.5
5)
(-0.5
9)
CT
R0.8
12∗∗
-0.3
01∗∗
32.5
00∗∗∗
-15.1
58
(2.3
8)
(-2.1
0)
(3.1
0)
(-0.8
7)
LC
B*C
TR
0.0
73∗∗
2.2
02∗
(2.1
1)
(1.7
5)
LC
F*C
TR
0.0
01
0.0
14
(0.3
0)
(0.1
3)
Siz
e-0
.028∗∗∗
-0.0
29∗∗∗
-0.0
15∗∗∗
-0.0
08∗∗
-2.8
84∗∗∗
-2.8
99∗∗∗
-2.2
97∗∗∗
-1.1
95∗∗∗
(-7.
96)
(-8.2
6)
(-3.9
0)
(-2.0
5)
(-14.4
0)
(-14.5
6)
(-10.3
5)
(-3.0
4)
RO
A-0
.498∗∗∗
-0.4
90∗∗∗
-0.3
25∗∗∗
-0.2
77∗∗∗
-7.1
44∗∗∗
-6.9
21∗∗∗
-12.9
97∗∗∗
-9.6
59∗∗∗
(-23
.20)
(-22.6
5)
(-5.6
3)
(-5.1
2)
(-7.3
9)
(-7.3
3)
(-8.5
0)
(-6.2
1)
Sal
esG
row
th0.
031∗∗∗
0.0
31∗∗∗
0.0
05
0.0
05
1.7
66∗∗∗
1.7
65∗∗∗
2.5
04∗∗∗
1.4
32∗∗∗
(7.5
9)(7
.56)
(0.7
7)
(0.9
0)
(17.5
9)
(17.6
1)
(6.6
6)
(2.6
8)
Lev
erag
e0.
149∗∗∗
0.1
53∗∗∗
0.1
03
-0.0
85∗∗∗
0.7
77∗∗
0.8
58∗∗∗
1.7
38∗∗
4.8
20∗
(7.5
9)(7
.84)
(1.5
9)
(-3.1
8)
(2.5
3)
(2.7
8)
(2.3
6)
(1.8
5)
GD
PG
row
th-0
.241
-0.1
56
-0.5
57
0.1
63
1.5
21
2.6
62
-5.1
94
54.1
04∗∗
(-0.
85)
(-0.6
5)
(-1.2
9)
(1.4
8)
(0.1
6)
(0.3
3)
(-0.4
5)
(2.1
3)
MB
0.00
3∗∗∗
0.0
03∗∗∗
0.0
09∗∗∗
0.0
00
0.0
68∗∗∗
0.0
67∗∗∗
0.0
54∗
0.1
54∗∗∗
(4.2
3)(4
.36)
(3.9
5)
(0.3
0)
(3.4
2)
(3.2
9)
(1.7
2)
(3.3
3)
Ind
ust
ry/Y
ear
FE
?Y
esY
esY
esY
esY
esY
esY
esY
es
Ob
serv
atio
ns
58,5
3558,5
35
24,4
39
1,2
49
61,8
37
61,8
37
31,0
33
1,4
78
R2
0.32
00.3
25
0.0
76
0.2
37
0.3
97
0.4
04
0.2
18
0.2
16
51