Embed Size (px)
Citation preview
Working Paper 2012:6 Department of Economics School of Economics and Management
Taxation of Income and Economic Growth: An Empirical Analysis of 25 Rich OECD Countries Margareta Dackehag Åsa Hansson March 2012

1
Taxation of income and economic growth: An empirical
analysis of 25 rich OECD countries
Margareta Dackehag & Åsa Hansson* Department of Economics
Lund University
Abstract
Several empirical papers have studied the effect of government size, typically measured as
government expenditures, on economic growth. There is no consensus on the direction of this
impact, even though more recent studies tend to find a negative relationship between the
general level of government expenditures and economic growth. This negative relationship is
explained by the distortions that raising tax revenues cause on economic activities. There are,
however, several ways to raise tax revenues that likely have different distortionary effects and,
hence, may impact economic growth differently. This paper analyses how taxation of income
influences economic growth. More precisely we study how statutory tax rates on corporate
and personal income affect economic growth by using panel data from 1975 till 2010 for 25
rich OECD countries. We find that both taxation of corporate and personal income negatively
influence economic growth. The correlation between corporate income taxation and economic
growth is more robust, however.
JEL classification: H21 ; H24 ; H25 ; O40
Keywords: Economic growth, taxation of corporate income, taxation of personal income
_________________________________________________________________________ Corresponding author, Department of Economics, Lund University, PO Box 7082, S-22007, Lund, Sweden, e-mail address: [email protected]. Tel.: +46 46 2228674. Fax: +46 46 2224613, http://www.nek.lu.se/NEKAHA/Default.htm.

2
1. Introduction
There is a vast literature on how taxation distorts individuals’ and firms’ decisions concerning
for example how much labor individuals supply, how hard they work, how and where
investments are made, and where firms choose to locate. There is also a sizable literature
documenting the overall effect of government size on economic growth. Though the results
are scattered, recent literature tends to find that government size, typically measured as total
government expenditures as a fraction of GDP, is negatively correlated with economic growth
in rich economies (see e.g., Fölster & Henrekson (2001), Romero-Avila & Strauch (2008),
and Bergh & Karlsson (2010)).
The reason government expenditures are thought to influence economic growth
negatively is due to the distortionary effect of taxation. Studies analyzing the correlation
between overall government expenditures and economic growth are, hence, using an indirect
way to study how taxation affects economic growth. Several studies have analyzed the direct
link between taxation of typically personal income and economic growth (see e.g., Koester &
Kormendi (1989), Plosser (1992), Slemrod (1995), Padovano & Galli (2001) and (2002)). The
results from this literature are equally scattered, however.
It is likely that not only the aggregated total tax burden but also the disaggregated
structure of taxation matters for economic growth. Some taxes are thought to be more
distortionary than others as different taxes have more or less stable tax bases. For instance,
high corporate tax rates are often assumed to be more harmful for economic activities than
taxation of property. Hence, various taxes have different effects on the level of economic
activity. Whether this effect carries over to also impact the growth rate is less clear however.
A study by Easterly (1993) supports this by providing empirical evidence that distortions are
negatively correlated with growth.
With tax competition countries worldwide are reforming their tax systems to become
more competitive. In order to design desirable tax systems information about different taxes’
harmfulness is of great importance. More recently studies have turned to investigate the
structure of taxation and economic growth. For instance, a few papers have examined the link
between tax structure, based on tax measures from tax revenues, and economic growth (e.g.,
Widmalm (2001), Arnold (2008), and OECD (2010)). The results from these studies are
mixed and, hence, hard to draw policy implications from. Moreover, a shortcoming of these
studies is that they all use backward looking average tax measures based on tax revenues. As
distortions from taxation to a large degree are influenced by forward looking marginal tax

3
rates it may be more fruitful to analyze the link between marginal tax rates and economic
growth. An exception to the use of average tax revenue based measures is a study by Lee &
Gordon (2005). They estimate the impact statutory corporate and personal income tax rates
and the value added tax rate have on GDP per capita growth using panel data from in 70
countries. Of these taxes, they find that only corporate tax rates negatively and statistically
significantly influence economic growth.
Given that intensified tax competition and increased demand for public services have
made it more important to raise taxes in efficient ways there is surely more need for
knowledge about how different types of taxes influence economic growth.1 This paper further
examines the correlation between income taxation and economic growth by studying how
taxation of corporate and top personal income impact economic growth in 25 rich OECD
countries during the period 1975 to 2010. We use standard growth estimation techniques with
country and year fixed effects to determine the effect of income tax rates on GDP per capita
growth. Unlike Lee & Gordon we also analyze the impact taxation of dividends and
employers’ social security contributions have on economic growth. Consistent with Lee &
Gordon (2005) we find robust support for corporate tax rates impacting growth negatively.
However, we find support for a non-linear relationship between tax rates and economic
growth. Though we also find a negative correlation between personal income taxes – both on
incomes from labor and from dividends - and economic growth, this relationship is less robust.
The paper is organized as follow. The next section gives a brief motivation of the
paper. Section 3 reviews previous literature while section 4 describes the method and section
5 the data. Section 6 presents the results and finally section 7 concludes the paper.
2. Motivation
Economic researchers have tried to explain and model growth for centuries. More recently,
researchers have typically employed either the neoclassical growth model developed by
Robert Solow in the 1950s or the endogenous growth models developed by Paul Romer and
Robert Lucas in the 1980s to explain and model economic growth. As taxes have no
permanent effects on per capita GDP growth, regardless of the distortionary effects of the tax
system, in the neoclassical model we assume that the endogenous growth model better
explains growth.
1Several papers have analyzed the relationship between tax structure and economic growth indirectly by studying how taxes affect total factor productivity.

4
There are several reasons to expect both corporate and personal income taxation to
impact economic growth. Starting with corporate tax rates, taxation of corporate income
lowers the return on innovations and reduces the amount spent on research and development
which impact growth negatively. In addition, corporate taxation discourages investments both
domestically and internationally by reducing foreign direct investment, and hence hampers
economic growth.
Taxation of personal labor income may influence economic growth by affecting
human capital investments, through supply of labor, and work effort. Flat income taxes do not
influence education decisions as the government shares equally in the forgone earnings and
the future return from education (Trostel, 1993). Progressive income taxes discourage
education, however, as taxes saved while in school are less than taxes paid on future returns to
education (Heckman et al., 1998). An extensive literature has found that incentives and
compensation policies matter for individuals’ effort (see e.g., Ehrenberg, 1990, and
Prendergast, 1996, for reviews). This literature indicates that there is a positive relationship
between wages and work effort. This suggests that higher taxes, that lower net return, increase
production costs and lower efficiency. Similar results have been found in the tax response
literature, with several studies revealing that especially high-income earners respond to lower
net-returns by reducing effort rather than reducing hours worked (see e.g., Gruber & Saez,
2002).
In addition, taxation of both corporate and personal labor income taxation may affect
entrepreneurial activity, which enhances economic growth by creating new ideas and
promoting technological change. The impact of corporate and personal income taxation on
entrepreneurship has recently been receiving attention; the correlation between them is not
clear-cut as there are several ways through which taxes can affect the amount of
entrepreneurial risk-taking. Obviously, the impact of the two income taxes depends on how
entrepreneurial income is taxed in individual countries. In countries where entrepreneurial
income is taxed at lower rates than personal income, high personal income tax rates encourage
individuals to become entrepreneurs (self-employed) in order to avoid highly taxed personal
income.
The treatment of losses may also influence entrepreneurial activity. The classical
Domar and Musgrave (1944) result suggests that higher taxes encourage risk-taking as the
government, by allowing loss offsetting, shares the risk with the entrepreneur. This finding is
also in line with results from Myles (2009), who finds high statutory tax rates on labor income
to encourage risk-taking if losses can be written off against other income. Progressive taxation,

5
however, discourages risk-taking as losses push entrepreneurs into low tax brackets reducing
the value of the loss offset, while profits push entrepreneurs into high marginal tax brackets
reducing the net profit for the entrepreneurs. Gentry & Hubbard (2000) suggest that the larger
the tax wedge is between being successful and unsuccessful the lower is the amount of risk-
taking. In addition, tax avoidance and evasion are much easier for entrepreneurs (self-
employed) to undertake than for employees supporting a positive relationship between
personal income taxes and entrepreneurship.
Taxation of dividend income may also influence growth via its impact on investment
and firm behavior. Indeed, Bush’s aim with his “Jobs and Growth Tax Relief Reconciliation
Act” of 2003, where double taxation of dividends were eliminated, was to boost economic
growth. However, within the academic community there is no consensus about the impact
taxation of dividends has on firm behavior and, hence, on economic performance. Instead
there are two views, the old and new, with conflicting implications. According to the old view,
taxation of dividends is distortionary and reduces available amount of equity capital for firms.
According to the new view, taxation of dividends does not influence the marginal cost of
capital and consequently has no impact on investment decisions. Double taxation of dividends
can, hence, be regarded as a lump-sum tax. The reason for this is that firms can finance their
activities through retained earnings and thus avoid double taxation. In addition, many argue
that in small open economies taxation of dividends is irrelevant for firms’ finances as foreign
investments are perfect substitutes for domestic investments; even though taxation of
dividends lowers domestic savings it does not impact the amount of investment as domestic
capital is replaced by foreign. Recently, this view has been questioned as taxation of
dividends may reduce available new capital and harm firm start-ups for those without access
to international capital markets, and firms with no gain to reinvest. Given the lack of
theoretical consensus several empirical studies have investigated the role of dividend taxation.
Several of these support the old view (e.g., Poterba and Summers (1985), Gentry (1994),
Zodrow (1991), Gerardi et al. (1990), and McKenzie & Thomson (1996)) while others find
support for the new view (Auerbach & Hassett (2002) and Lindhe (2002)). As there clearly is
no consensus on this matter we find it of great interest to analyze the empirical implications of
dividend taxation on economic growth.
Apart from the more direct ways that income taxation influences economic growth
there are several indirect ways through which taxation can influence economic growth both

6
positively and negatively. For example, various tax incentives for research and development
and small firm creation may enhance economic growth.
3. Previous empirical literature
There is an extensive literature examining the relationship between government expenditures
and economic growth. Many of these studies tend to find a negative relationship between size
of government, typically measured as total government or government consumption
expenditures, and economic growth (e.g., Barro (1991), Fölster & Henrekson (2001), (2006),
Romero-Avila & Strauch (2008), Bergh & Karlsson (2010)), while others dispute this
negative relationship (e.g., Ram (1986), Devaranjan et al. (1996), and Agell et al. (2006)) or
are unable to demonstrate a statistically significant correlation (e.g., Kormendi & Meguire
(1985), Levine & Renelt (1992), and Easterly & Rebelo (1993)). The lack of consensus here
may not be surprising as the overall size of the government has two contrasting effects. A
larger size means higher taxes that impose larger distortions in the economy, but higher levels
of public spending may also boost economic growth as part of the spending is growth
enhancing.
While these papers look at government size as a proxy for overall level of taxation,
several papers have tried to determine the direct link between taxation and growth. A majority
of these focuses on how taxation of personal income affects economic growth and uses
various measures to capture the tax burden of income taxation. The results from these studies
are, if possible, even more scattered and found to be sensitive to use of tax measure and
included variables.
For example, Plosser (1992), on the one hand, finds tax burdens measured as the share
of revenues from income and profit taxes to GDP to be negatively correlated with GDP
growth. Koester & Kormendi (1989), on the other hand, detect no statistically significant
relationship between taxes and economic growth. They construct measures of average and
marginal personal income tax rates by regressing tax revenues on GDP, and then use these
measures in a growth regression. Neither tax rates seem to have a negative impact on the
growth rate, though the marginal tax rate has a negative effect on the level of activity.
Padovano & Galli (2001) construct similar tax measures but include a slope dummy in
addition to allow for changes in tax rates over time. Contrary to Koester & Kormendi, they
observe these tax rates to negatively and statistically significantly impact growth. In a later
paper, Padovano & Galli (2002), confirm the negative correlation between marginal tax rates
and economic growth but find average taxes to have an insignificant impact.

7
Easterly & Rebelo (1993) detect, by using a wide set of different marginal income tax
rates little evidence for a robust correlation between these marginal tax rates and economic
growth in developing countries. An unstable or non-existing relationship is also in line with
work from Mendoza, Milesi-Ferretti & Asea (1997), where tax rate variables turn
insignificant in growth regressions when initial income is included, and Slemrod (1995) who
demonstrates that the relationship between tax rates and growth is sensitive to specification
and countries included.
Contrary to these findings are results from e.g., Leibfritz, Thornton & Bibbee’s (1997)
who obtain a negative correlation between both average and marginal tax rates and economic
growth, and Dowrick (1993) who find personal income taxes to have a negative effect on
growth.
Some studies have analyzed the link between growth and the tax structure rather than
the level of taxation. Kneller at al. (1999), for example, study the tax structure by dividing
taxes into distortionary and non-distortionary taxes (measured as tax revenue as a share of
GDP) and expenditures into productive and non-productive. Their results lend support to
distortionary taxes reducing growth and productive spending enhancing growth. This result is
later confirmed in a study by Gemell et al. (2006).
Turning to the literature including corporate tax rates, the literature becomes less
extensive even though there are a growing number of studies showing interest in the overall
structure of taxation and economic growth. While Dowrick (1993) found personal income
taxes to have a negative impact on economic growth his results indicates no such relationship
for corporate tax rates and economic growth. This is consistent with Widmalm’s study (2001)
that investigates the effect of tax structure, defined as the proportion of tax revenues
stemming from taxes on personal income, corporate income, property taxes, taxes on goods
and services, and taxes on wages, and a measure for tax progressivity on GDP growth. Her
results reveal a negative correlation between the proportion of tax revenues from personal
income taxes and economic growth, while no such correlation is found for the proportion of
corporate tax revenues. This may seem surprising as the corporate tax rate is commonly
thought to be more distortionary than taxation of personal income.
Arnold (2008) use annual panel data for 21 OECD countries to study the link between
tax structure and economic growth. His tax measures are also based on tax revenues obtained
from different taxes. Unlike previous studies Arnold use annual data and the estimations are
based on a standard empirical model and a government budget constraint enabling evaluation
of revenue-neutral changes in the tax structure. The results indicate that a stronger reliance on

8
income taxes imply significantly lower levels of GDP per capita than the use of taxes on
consumption and property. Among the income taxes, he finds corporate income taxes to be
associated with lower levels of GDP per capita than personal income taxes.
In addition, Lee & Gordon (2005) analyze whether taxation of household versus
corporate income differ in how they influence economic growth. Unlike above mentioned
studies using tax revenue based tax measures, Lee & Gordon use top statutory tax rates on
corporate and personal income to measure the tax effect. They do this on a sample of 70
countries during the time period 1970 to 1997. Results show a significant negative correlation
between statutory corporate tax rates and growth but no significant correlation between top
statutory personal income tax rates and growth. When they restrict the sample, by including
an OECD-dummy, the corporate tax rate effect on growth for the OECD countries becomes
nearly zero, suggesting that the corporate taxation is less harmful to growth in more
developed countries than in less developed countries.
Above studies are all based on cross-sectional data for a number of different countries.
Engen & Skinner (1996) alert to the problems with cross-country studies and instead propose
the use a bottom-up approach that estimates the effect of taxation on labor supply, investment,
and productivity, respectively, and then sums these individual effects up to obtain the overall
effect. Doing this suggest that both average and marginal tax rates hamper economic growth.
Several other papers have studied the impact of taxes on growth components. Schwellnus &
Arnold (2008) and Vartia (2008), for example, study the impact of corporate income taxes on
the productivity of firms and industries using a large data set of firms and industries across
OECD countries. Both papers find a negative effect of corporate income taxes on productivity,
and hence indirect evidence of corporate taxes harming growth.
Moreover, industry-level evidence from OECD countries (OECD, 2010) suggests a
negative relationship between top marginal tax rates on personal income and long-run levels
of total factor productivity, especially in countries with high entry level rates, suggesting that
high top statutory personal income tax rates hurt firm entry. This is also consistent with
results from Sweden, showing that high marginal tax rates on personal income retard firm
start-ups (see Hansson (2010)). In addition, research by Gentry & Hubbard (2000) points to a
negative relationship between the progressivity in the personal income tax schedule and
entrepreneurial risk-taking.
Similarly, there is a sizable literature documenting a negative relationship between
corporate tax rates and FDI (see e.g., De Mooij & Ederveen, 2006 and Feld & Heckemeyer,
2011). Several papers have established a negative link between labor taxes and FDI as well

9
(Hajkova et al. (2006), Hansson & Olofsdotter (2011)). Hajkova et al. (2006) even find the
impact of labor taxes on FDI to be substantially larger than that of cross-border effective
average and marginal corporate tax rates.
After reviewing the literature, it seems fair to conclude that the empirical evidence of a
relationship between both the level of taxation and the structure, respectively, and economic
growth is weak, and that there is a need for further research to clarify this relationship.
Like Lee & Gordon (1995), our study analyzes how taxation of corporate and personal
income impact economic growth. We also use marginal tax rates on corporate and personal
income as our tax measures rather than measures based on tax revenues. Economic theory
predicts marginal tax rates to matter for the distortions introduced to individuals’ and firms’
choices. This as they influence decisions concerning among others the amount of investments
to undertake, additional income to earn, and entrepreneurial effort, and are, hence, the
relevant tax rates for economic growth. Average tax rates, on the other hand, influence the
discrete decisions whether to invest or work at all. Additionally, average rates are more
correlated with government expenditures than marginal rates, and may hence effect economic
growth positively, while marginal tax rates should, according to theory, be negatively
correlated with growth. The difficulty lies in determining what marginal tax rate to use as
different rates apply to different levels of income (due to various rates but also due to
exemptions, credits, and depreciation allowances). To avoid some of these issues we choose
to use the top marginal tax rate on both personal and corporate income.
Unlike Lee & Gordon (2005) we focus on the rich OECD countries as the effect of
taxation on economic growth likely vary greatly between rich and developing countries. In
addition, we also study the effect of shareholders’ taxation of dividends and employer paid
social security contributions on economic growth. Whether social security contributions
should be considered a tax or a fee for current and future benefits have been debated. If it is a
tax it is likely to have the same impact as taxation of labor income. Either way, we find it to
be of interest to study whether social security contributions impact economic growth and if so
to what extent. Another difference is that we allow for non-linearity in the tax effect. Up to a
certain level tax rates may stimulate growth as the revenues generated are spent in productive
ways enhancing the functioning of the economy. Above a certain level, the negative effects in
terms of larger distortions caused by higher tax rates may outweigh the positive effects from
spending the revenues.

10
4. Empirical method
We estimate the effect of tax rates on economic growth using fixed effects regression, a
standard approach within the literature capable of accounting for many unobservable factors
that may be confounded with the functioning of the tax system. The fixed effects estimator
may remedy the problem of omitted variable bias as long as these are constant over time.
Factors such as national culture, legal-political institutional infrastructure, and government
efficiency are factors that have been found to influence growth and are likely to be correlated
with tax rates. Omitting such factors would lead to biased estimates.
The regression model can be written as:
ittiititit ZXg 0 (1)
To obtain elasticities we estimate (1) in logarithmic form. The dependent variable, git, denotes
the average 4-year per capita GDP growth rate for country i at time period t. Xit0 is a vector of
measures of our tax rates in the initial year. t0 indexes the initial value in the start of each
period. Xit0 hence measures tax rates on corporate and personal income and is our variable of
interest. We also include the tax level squared to allow for non-linear tax effects. Zit is a
vector of explanatory variables including the variables initial income, national investment,
unemployment, dependency ratio, government expenditures, tax revenues, openness (exports
and imports as a fraction of GDP), growth of the labor force, inflation rate, and national
savings.
The i terms are fixed country effects (i.e., unmeasured shocks). These terms account
for time-invariant determinants of economic growth that vary among the countries in our
sample. If i were correlated with Xit0 in equation (1), then estimators that failed to include the
country-specific fixed effects would yield inconsistent estimates of the effect of taxation on
economic growth.
The t terms are sample-wide period effects. These terms account for trends that affect
the economic growth in each of the countries similarly, such as business cycles and the oil
shocks in the 1970s. Tax rates are likely affected by these events and a model failing to
account for such trends would confound those trends with the effects of changing tax rates.
The terms and are parameters to be estimated. The it terms are idiosyncratic
disturbance terms that vary by country and time period, and are assumed to be independently
and identically distributed with mean zero and variance 2.

11
Studies on taxes and growth may suffer from several statistical problems. One of them
is the endogeneity problem. Tax rates may both influence economic growth and be influenced
by economic growth. High taxes may cause lower growth rates, but periods of low growth
rates may require raised tax rates in order to finance increased expenses on, for example,
higher unemployment rates. To mitigate this problem we use 4-year averages for per capita
GDP growth and the other explanatory variables. The tax rate variables take on the initial
values in each 4-year period however. In addition, we use an instrument variable technique.
We follow Lee & Gordon (2005) and use the weighted tax rates in the other countries in the
sample as instruments. The weights are the inverse of the distance between the country in
question and all other countries in the sample.
5. Data
We focus on the rich OECD countries and our dataset is a panel of 25 OECD member
countries. The dataset contains OECD data from 1970 to 2010 on GDP per capita and its
growth rate, the general government tax revenue and expenditure as shares of GDP, national
investment as a share of GDP, national savings as a share of GDP, the unemployment rate, the
dependency ratio, exports and imports as a share of GDP (openness), and the growth of the
labor force.
Data on the various statutory tax rates come from the European Tax Handbook of the
International Bureau of Fiscal Documentation (IBFD), the World Tax Database from the
Office of Tax Policy Research (OTPR) at the University of Michigan, and OECD Tax
Database. Data on the corporate tax rate range from 1970 to 2010, while data on the top
marginal tax rate on personal income cover the period from 1975 to 2010. Employers’ social
security rates range from 1981 to 2010 and refer to the top rate in cases where employers’
social security contributions are differentiated. The top tax rate shareholders face on
distributed profits range from 1981 to 2011. Is should be noted that this rate refers to the top
tax rate on dividends and include taxation at both corporate and shareholder level (when
applicable). Table 1 shows a summary description of the variables. The Appendix contains a
variable description with sources and a list of the OECD member countries included in the
study.
Figures 1 and 2 illustrate the development for corporate income tax rates and the top
marginal tax rates on personal income (figure 1) and shareholders’ top tax rate on distributed
dividends and employers’ social security contribution (figure 2). The average corporate tax

12
rate (blue line in figure 1) increases with nearly 10 percentage points from 1970 to 1980,
where the average corporate tax rate amounts to approximately 45 percent. The subsequent
30-year period is characterized by a general decline, ending with a tax rate of about 26 percent
in 2009. The mean top marginal tax rate on personal labor income (green line in figure 1)
peaks at 70 percent in the late 70s and decreases quite rapidly during the next ten years; in
1990 the rate is below 50 percent. In later years the tax rate has remained above 45 percent
except for the last couple of years in the period.
Turning to figure 2 and the top tax rate on dividends (red line), this rate also shows a
remarkable decline. In the early1980s the average rate for the sample is 76 percent. The rate
then steadily declines to around 44 percent in 2011. Contrary to the development of the other
tax rate employers’ social security contribution rate (green line) has increased fairly steadily
since the early 1980s. The average employer social security contributions starts out just under
14 percent in the early 1980s and then reaches a peak over 18 percent during the first half of
the 2000s, thereafter the average rate declines a little to 17 percent in 2009.
6. Results
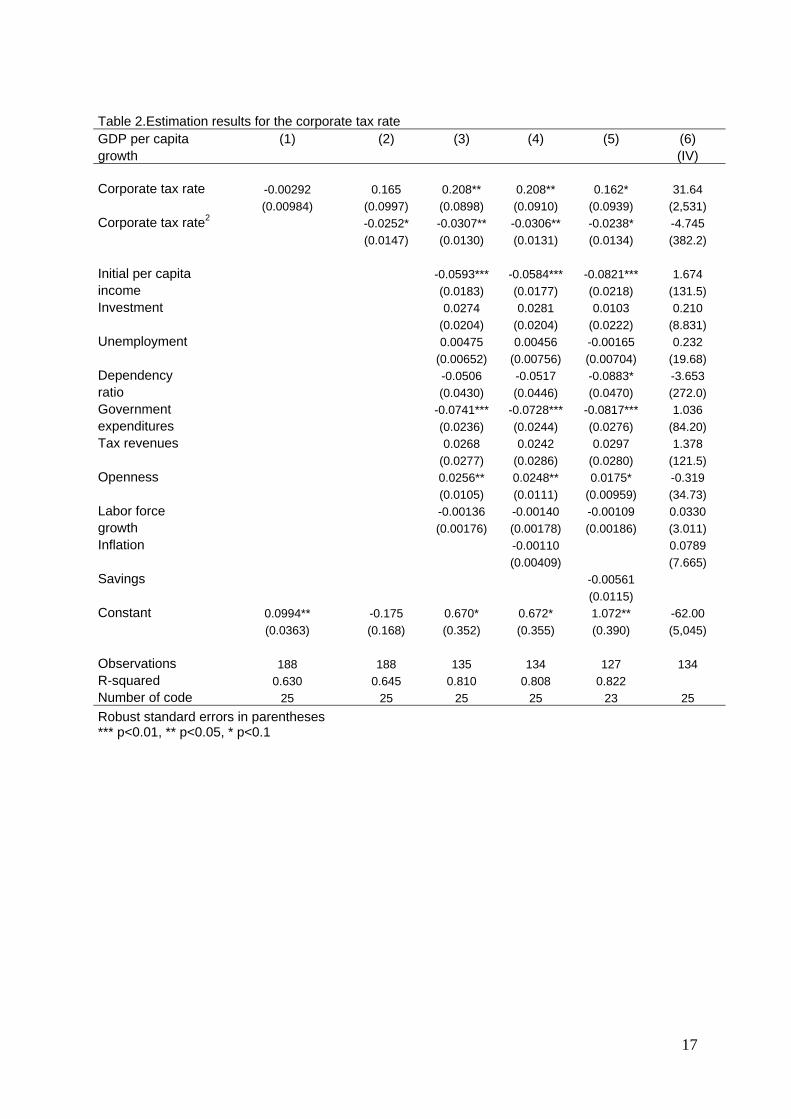
Table 2 reports the results from the regression of the corporate tax rates and GDP per capita
growth. In column (1) only the level of the corporate tax rate, the fixed effects, and a constant
are included as explanatory variables. The corporate tax rate variable has a negative, although
insignificant coefficient. In the next column, (2), we allow for non-linearity by adding the
corporate tax rate variable squared. Interestingly, the level of the corporate tax rate now turns
positive (although still insignificant) while the squared term is negative and statistically
significant at the 10 percent significance level. In columns (3) to (5) additional economic
explanatory variables are included. Including additional explanatory variables strengthens the
results. The level of the corporate tax rate has a positive and in most specifications
statistically significant impact while the squared term has a negative and statistically negative
effect on economic growth. This suggests that low levels of corporate tax rates have a positive
influence while higher rates hamper economic growth. The magnitude of the coefficients is
fairly stable across the different specifications.
Turning to the other explanatory variables, initial per capita income has a negative and
statistically significant impact on GDP per capita growth, supporting the catching-up
hypothesis. Two other explanatory variables are consistently significant across the different
specifications, namely, government expenditures and openness. This result is consistent with
Bergh & Karlsson (2010), who also find government expenditures and openness to
13
statistically significantly influence growth. Government expenditures have a negative and
statistically significant effect on GDP per capita growth; with an elasticity of around -0.07,
implying that a one percent increase in government expenditures lowers GDP per capita
growth by -0.07 percent. Openness has a positive impact on GDP per capital growth; a one
percent increase in openness (measured as the sum of exports and imports as a share of GDP)
raises economic growth by approximately 0.02 percent. The last column (6) in table 2 reports
the results from the IV estimations. The estimation results are weak; nothing is statistically
significant and the instruments poor.
Table 3 presents corresponding results for the top marginal tax rate on personal labor
income. Again, column (1) only includes the top marginal tax rate, a constant, and the fixed
effects. Surprisingly, the top marginal tax rate on personal labor income has a positive and
statistically significant impact on GDP per capita growth. Allowing for non-linearity and
including additional economic explanatory variables result in the same pattern for marginal
tax rates on personal income as for corporate tax rates. Namely, that up to a certain tax level
the relationship between marginal tax rates on personal income and growth is positive, while
above this level the relationship turns negative. The other explanatory variables have the same
impact on per capita GDP growth as in table 2. The results from the IV regression, presented
in the last column (6), are again weak.
Table 4 shows the results for regressions including both statutory marginal tax rates on
corporate and personal labor income. When including both income tax rates only the
corporate tax rate has a statistically significant impact on economic growth. The significance
level and magnitude for the corporate tax rate variables are similar to those in table 2. For the
tax rates on personal income, the coefficients have the same sign as before but are no longer
significant. This is in line with results from Myles (2009), who claims that tax regressions
deliver better results when each form of tax is included separately (Myles, 2009).
Estimation results for shareholders’ top marginal tax rates on dividends and
employers’ social security contributions are presented in table 5. Columns (1) to (3) show the
results for dividend taxation, starting with the specification including only the dividend tax in
level and squared, a constant term, and fixed effects. The dividend tax has a negative and
statistically significant effect on economic growth, but this effect diminishes as the squared
term is positive and significant. Including additional explanatory variables in column (2) does
not alter the result but makes the coefficient more statistically significant. Finally, in column
(3) tax rates on corporate and labor income are added. The dividend tax has the same impact
as before, and consistently with results from table 4 the corporate tax rate has a statistically

14
significant impact on economic growth while taxation of labor income does not. Contrary to
the corporate and labor income tax rate, the dividend tax has an immediate negative impact on
economic growth although at a diminishing rate.
Table 5 also presents regression results from the employers’ social security
contributions. This “tax” has a negative impact when additional explanatory variables are
included (column (5)) but this result vanishes when other income tax rates are incorporated
(column (6)).
Many previous studies on taxation and economic growth have used 5-years averages.
Theory gives no guidance to the choice of period length, however. In order to compare our
results with previous work, and to check whether the period length influences the results we
rerun our estimations based on 5-years rather than 4-years averages. The results from doing
this are presented in table 6. The first column reports the result from the regressions using the
corporate tax rate, the following column reports the results from the marginal tax rate on
personal income, and the third column shows the estimation results when both income taxes
are included. The fourth and fifth columns report the results for the dividend taxation in
isolation and with the other two income taxes.2 The results for the corporate tax rate are robust
and basically unchanged by the choice of period length. The impacts of the labor and dividend
tax rates on economic growth are not upheld though. The coefficients have the same sign as
before but are not significant in any of the specifications. An additional difference is that
openness is no longer significant.
As there is no guidance to the right period length, we, in addition, follow Arnold
(2008) and use annual data to investigate the impact of income taxes on economic growth. To
avoid endogeneity and to account for taxes taking time to affect growth we lag the tax rates
two and four years, respectively. Table 7a reports the resulting estimation results for the tax
variables. The first three columns show the results for the corporate tax, the following three
show results for the personal income tax, and finally the last three columns report the result
for both tax rates. Again, the results for the corporate tax rate are robust and similar to
previous results. The results for the personal income tax are, however, sensitive to the choice
of lag and only statistically significant when no lags are used. Table 7b shows the
corresponding results for the dividend tax and employers’ social security. The results for these
two taxes are also sensitive to length of lag and in most specifications insignificant.
2 Results from the employers’ social security contributions are not reported in the table in order to preserve space. The employers’ social security contributions impacts on growth are insignificant however, both in isolation and with the other taxes.

15
7. Conclusions
Intensified competition between countries and increasing demand for publicly financed
services pressure countries’ tax systems to be designed in efficient ways. In order to design
efficient tax systems it is crucial to know how distortive and harmful different taxes are to
economic growth. This paper aims to provide some insights into the relationship between
taxation of different sources of income and economic growth. We do so by study the
correlation between statutory tax rates on corporate and personal income and economic
growth in 25 rich OECD countries during the period 1975 to 2010.
Unlike many previous studies we allow for taxes having a non-linear effect on
economic growth. The reason for this is that higher rates may be more distortionary and hence
impact growth negatively while lower rates may generate revenues that are spent in
productive ways. We find empirical support for a non-linear relationship. Both low taxation of
corporate and personal labor income enhance growth while higher rates retard growth. While
the result for taxation of personal income is less stable, the results for the corporate tax rate
are robust across specifications and choice of included variables. In addition, we find support
for taxation of dividends having a negative impact on economic growth even though this
result is also less robust than that for the corporate tax rate. The results from this paper hence
suggest that taxation of corporate income has a robust harmful impact on economic growth, a
result that is consistent with more recent research (see e.g., OECD (2010)).

16
Table 1. Variable description, all variables are 4-year averages, unless stated otherwise
Variable Obs Mean Std Dev Min Max Description Growth of GDP per capita
980 6.309 2.889 ‐0.029 14.359 Average annual growth rate of GDP per capita
Initial income per capita
980 16749.5 11530.7 1239.3 78523.3 GDP per capita for the initial year of each subperiod, current prices
Tax revenues 980 34.022 8.146 10.511 51.259 General government tax revenues as a share of GDP, current prices
Government expenditures
640 44.803 7.731 25.95 71.72 General government expenditures as a share of GDP, current prices
Investment 960 0.228 0.039 0.165 0.372 National investment as share of GDP, current prices
Unemployment 816 6.925 3.768 0.787 22.275 Unemployment as share of labor force
Dependency ratio 1000 34.351 2.628 26.292 45.820 Population aged 0‐15 and >65 as share of total population
Openness 980 0.682 0.430 0.103 3.138 Exports and imports of goods and services as share of GDP
Labor force growth 804 0.003 0.007 ‐0.025 0.031 Average annual growth rate of the labor force
Corporate tax rate 860 36.155 9.616 3 56 Top statutory corporate tax rate, for the initial year of each subperiod
Top marginal tax rate on personal income
672 53.129 12.664 11.5 85 Top marginal tax rate on labor income, for the initial year of each subperiod
Top marginal tax rate on distributed dividends
650 54.521 14.555 26.2 93.67 Top marginal tax rate on dividends incl. taxation at both corporate and shareholder level, for the initial year of each subperiod
Employers’ social security contribution
718 16.084 13.890 0 48.26 Employers’ maximal social security contribution rate, for the initial year of each subperiod
17
Table 2.Estimation results for the corporate tax rate GDP per capita (1) (2) (3) (4) (5) (6) growth (IV) Corporate tax rate -0.00292 0.165 0.208** 0.208** 0.162* 31.64 (0.00984) (0.0997) (0.0898) (0.0910) (0.0939) (2,531) Corporate tax rate2 -0.0252* -0.0307** -0.0306** -0.0238* -4.745 (0.0147) (0.0130) (0.0131) (0.0134) (382.2) Initial per capita -0.0593*** -0.0584*** -0.0821*** 1.674 income (0.0183) (0.0177) (0.0218) (131.5) Investment 0.0274 0.0281 0.0103 0.210 (0.0204) (0.0204) (0.0222) (8.831) Unemployment 0.00475 0.00456 -0.00165 0.232 (0.00652) (0.00756) (0.00704) (19.68) Dependency -0.0506 -0.0517 -0.0883* -3.653 ratio (0.0430) (0.0446) (0.0470) (272.0) Government -0.0741*** -0.0728*** -0.0817*** 1.036 expenditures (0.0236) (0.0244) (0.0276) (84.20) Tax revenues 0.0268 0.0242 0.0297 1.378 (0.0277) (0.0286) (0.0280) (121.5) Openness 0.0256** 0.0248** 0.0175* -0.319 (0.0105) (0.0111) (0.00959) (34.73) Labor force -0.00136 -0.00140 -0.00109 0.0330 growth (0.00176) (0.00178) (0.00186) (3.011) Inflation -0.00110 0.0789 (0.00409) (7.665) Savings -0.00561 (0.0115) Constant 0.0994** -0.175 0.670* 0.672* 1.072** -62.00 (0.0363) (0.168) (0.352) (0.355) (0.390) (5,045) Observations 188 188 135 134 127 134 R-squared 0.630 0.645 0.810 0.808 0.822 Number of code 25 25 25 25 23 25
Robust standard errors in parentheses *** p<0.01, ** p<0.05, * p<0.1

18
Table 3. Estimation results for the top marginal personal labor income tax rate GDP per capita (1) (2) (3) (4) (5) (6) growth (IV) Top marginal personal 0.00872* 0.00476 0.244** 0.269** 0.219* -1.926 income tax (0.00440) (0.0376) (0.103) (0.107) (0.117) (4.766) Top marginal personal 0.000537 -0.0315** -0.0347** -0.0275* 0.236 income tax2 (0.00527) (0.0139) (0.0144) (0.0159) (0.590) Initial per capita -0.0604*** -0.0571*** -0.0716*** -0.186 income (0.0165) (0.0154) (0.0240) (0.305) Investment 0.0313 0.0317 0.0185 0.0630 (0.0225) (0.0225) (0.0232) (0.0949) Unemployment 0.00543 0.00442 0.00111 0.00800 (0.00649) (0.00737) (0.00765) (0.0217) Dependency 0.0154 0.0161 -0.0152 -0.156 ratio (0.0321) (0.0340) (0.0437) (0.477) Government -0.0734** -0.0719** -0.0932*** -0.0643 expenditures (0.0308) (0.0318) (0.0282) (0.0910) Tax revenues 0.0157 0.0123 0.0204 0.0864 (0.0329) (0.0341) (0.0357) (0.193) Openness 0.0451*** 0.0470*** 0.0374*** -0.0515 (0.0117) (0.0113) (0.0118) (0.219) Labor force -0.000274 -0.000154 0.000156 -0.000762 growth (0.00177) (0.00179) (0.00188) (0.00550) Inflation -0.00274 0.0156 (0.00369) (0.0419) Savings -0.0144 (0.00946) Constant 0.0520*** 0.0592 0.382 0.321 0.649 6.144 (0.0178) (0.0664) (0.272) (0.273) (0.445) (12.69) Observations 185 185 124 123 117 123 R-squared 0.754 0.754 0.850 0.849 0.870 Number of code 25 25 25 25 23 25 Robust standard errors in parentheses *** p<0.01, ** p<0.05, * p<0.1

19
Table 4. Estimation results for corporate and personal income tax rates GDP per capita (1) (2) (3) (4) (5) (6) growth (IV)
Corporate -0.00546 0.253** 0.233*** 0.234*** 0.184** 69.99 tax rate (0.0149) (0.112) (0.0827) (0.0800) (0.0863) (4,324) Corporate -0.0381** -0.0348*** -0.0346*** -0.0272** -10.02 tax rate2 (0.0159) (0.0119) (0.0115) (0.0121) (618.7) Top marginal personal 0.0118** -0.0571 0.200 0.207 0.209 21.46 income tax rate (0.00524) (0.0580) (0.127) (0.123) (0.141) (1,284) Top marginal personal 0.00846 -0.0263 -0.0271 -0.0269 -3.018 income tax rate2 (0.00764) (0.0175) (0.0170) (0.0195) (180.9) Initial per capita -0.0460*** -0.0405*** -0.0585** 5.312 income (0.0145) (0.0141) (0.0245) (334.5) Investment 0.0293 0.0314 0.0161 -0.969 (0.0227) (0.0226) (0.0252) (60.88) Unemployment 0.00463 0.00329 0.000669 -0.0551 (0.00638) (0.00729) (0.00817) (4.230) Dependency -0.0267 -0.0228 -0.0557 -15.60 ratio (0.0419) (0.0432) (0.0562) (965.3) Government -0.0570** -0.0539** -0.0783*** 3.746 expenditures (0.0253) (0.0259) (0.0246) (235.9) Tax revenues 0.0335 0.0257 0.0423 1.363 (0.0365) (0.0371) (0.0369) (80.30) Openness 0.0401*** 0.0419*** 0.0346*** 1.187 (0.0105) (0.00987) (0.0120) (71.94) Labor force 0.000191 0.000256 0.000428 0.155 growth (0.00168) (0.00170) (0.00185) (9.510) Inflation -0.00347 -0.108 (0.00397) (6.853) Savings -0.0123 (0.0105) Constant 0.0608 -0.233 -0.00747 -0.0565 0.272 -166.5 (0.0502) (0.153) (0.294) (0.302) (0.466) (10,275) Observations 161 161 118 117 111 117 R-squared 0.693 0.718 0.835 0.834 0.852 Number of code 25 25 25 25 23 25
Robust standard errors in parentheses *** p<0.01, ** p<0.05, * p<0.1

20
Table 5. Estimation results for shareholders’ top marginal tax rates on dividends and employers’ social security contributions GDP per capita (1) (2) (3) (4) (5) (6) growth Dividend tax -0.206* -0.229** -0.279** (0.121) (0.100) (0.134) Dividend tax rate2 0.0262* 0.0304** 0.0365** (0.0150) (0.0133) (0.0179) Social security 0.00815 -0.144** -0.073 (0.0466) (0.0544) (0.0743) Social security2 0.00006 0.0265** 0.0170 (0.0081) (0.0107) (0.0148) Corp tax rate 0.250*** 0.2897*** (0.0368) (0.1008) Corp tax rate 2 -0.036*** -0.0422*** (0.0056) (0.0161) Top marginal tax rate 0.123 -0.2109 (0.185) (0.247) Top marginal tax rate -0.016 0.0259 (0.025) (0.0330) Initial per capita -0.113*** -0.0780** -0.0733*** -0.0321* income (0.0287) (0.038) (0.0236) (0.0166) Investment 0.0024 -0.0003 0.0247 0.0298 (0.0232) (0.0332) (0.0317) (0.0338) Unemployment -0.0135 -0.018 0.0036 0.0016 (0.00987) (0.013) (0.0113) (0.0117) Dependency -0.0841 -0.093 -0.0349 -0.0428 ratio (0.0722) (0.088) (0.0634) (0.0588) Government -0.0869** -0.0768** -0.0973* -0.0907 expenditures (0.0353) (0.032) (0.0560) (0.0638) Tax revenues 0.0244 0.0326 0.0730 0.0845 (0.0316) (0.0455) (0.0546) (0.0678)
Openness 0.0118 0.0244 0.0364* 0.0295 (0.0135) (0.015) (0.0210) 0.0263) Labor force -0.00172 -0.0005 -0.0013 0.00165 growth (0.00150) (0.0019) (0.0017) (0.0025) Constant 0.458 2.189*** 1.271 0.0423 1.212 0.603 (0.244) (0.634) (0.7512) (0.0694) (0.487) (0.735) Observations 142 114 97 120 93 82 R-squared 0.562 0.781 0.824 0.517 0.772 0.814 Number of code 25 25 24 22 22 21
Robust standard errors in parentheses *** p<0.01, ** p<0.05, * p<0.1

21
Table 6. Estimation results based on 5-year averages GDP per capita growth (1) (2) (3) (4) (5)
Corporate
0.292*** 0.315*** 0.292** tax rate (0.0774) (0.0903) (0.125) Corporate -0.042*** -0.0453*** -0.0411** tax rate2
(0.0113)
(0.0130)
(0.0183)
Top marginal personal 0.0989 0.136 0.132 income tax rate (0.190) (0.183) (0.254) Top marginal personal -0.0115 -0.0173 -0.0176 income tax rate2
(0.0246)
(0.0238)
(0.0341)
Dividend tax -0.0687 -0.121 (0.171) (0.263) Dividend tax2 0.00933 0.0148
(0.0214)
(0.0326)
Initial per -0.0351** -0.0448* -0.0321 -0.0798*** -0.0401 capita income (0.0171) (0.0232) (0.0250) (0.0253) (0.0516) Investment -0.00474 0.00748 0.00886 -0.0196 0.00582 (0.0162) (0.0213) (0.0209) (0.0217) (0.0259) Unemployment 0.00537 0.00403 0.00451 -0.00270 0.000315 (0.00476) (0.00590) (0.00562) (0.00897) (0.0104) Dependency -0.0624 0.0487 -0.0390 -0.0575 -0.0556 ratio (0.0433) (0.0552) (0.0618) (0.0632) (0.0901) Government -0.0816*** -0.0772*** -0.0572** -0.0999*** -0.0549 expenditures (0.0205) (0.0277) (0.0270) (0.0281) (0.0476) Tax 0.0507** 0.0200 0.0237 0.0612* 0.0175 revenue (0.0235) (0.0304) (0.0315) (0.0350) (0.0513) Openness 0.00816 0.0241 0.0263 0.00230 0.0251 (0.0118) (0.0171) (0.0165) (0.0174) (0.0318) Labor force -0.000387 -0.00115 -0.000447 -0.00190 -0.000548 growth (0.00103) (0.00151) (0.00171) (0.00129) (0.00247) Constant 0.213 0.347 -0.143 1.275** 0.291 (0.289) (0.575) (0.569) (0.600) (1.184) Observations 108 93 89 89 73 R-squared 0.874 0.852 0.878 0.641 0.719 Number of code 25 24 24 25 23
Robust standard errors in parentheses *** p<0.01, ** p<0.05, *p<0.1

22
Table 7a. Estimation results based on annual data GDP per capita growth (1) (2) (3) (4) (5) (6) (7) (8) (9) Corporate 0.150** 0.125* tax rate (0.067) (0.0643) Corporate -0.022** -0.0173* tax rate2 (0.010) (0.010) Corporate 0.254** 0.257*** tax rate lagged(-2) (0.10) (0.086) Corporate -0.037** -0.038*** tax rate2 lagged (–2) (0.015) (0.013) Corporate 0.173** 0.135 tax rate lagged(-4) (0.068) (0.088)Corporate -0.025** -0.0207tax rate2 lagged (–4) (0.010) (0.013) Top marg personal 0.388* 0.261 income tax rate (0.223) (0.190) Top marg personal -0.0503* -0.0339 income tax rate2 (0.0288) (0.0247) Top marg personal income 0.0120 0.0369 tax rate (lagged-2) (0.201) (0.188) Top marg personal income 0.0008 -0.00330 tax rate2 (lagged-2) (0.026) (0.0238) Top marg personal income -0.00111 -0.046 tax rate (lagged-4) (0.072) (0.105)Top marg personal income 0.0020 0.0077 tax rate2 (lagged-4) (0.010) (0.014) Observations 361 359 360 316 311 317 308 304 312 R-squared 0.622 0.618 0.628 0.706 0.668 0.638 0.686 0.662 0.624 Number of code 25 25 25 25 25 24 25 25 24 Robust standard errors in parentheses *** p<0.01, ** p<0.05, *p<0.1

23
Table 7b. Estimation results based on annual data GDP per capita growth (1) (2) (3) (4) (5) (6) (7) (8) (9) Dividend -0.281* -0.412* (0.159) (0.200) Dividend 2 0.0370* 0.0544* (0.0202) (0.0267) Dividend -0.0243 -0.0397 lagged (-2) (0.194) (0.317) Dividend 2 0.00625 0.00515 lagged (-2) (0.0243) (0.0395) Dividend 0.0504 -0.75***lagged (-4) (0.297) (0.212)Dividend 2 -0.00550 0.09*** lagged (-4) (0.0374) (0.027) Social security -0.114* -0.0384 (0.0600) (0.0767) Social security2 0.0208* 0.00447 (0.0119) (0.0145) Social security -0.0449 -0.0853 lagged(-2) (0.056) (0.0704) Social security2 0.0052 0.0158 lagged(-2) (0.010) (0.0119) Social security -0.0406 -0.0598lagged(-4) (0.0495) (0.040)Social security2 0.00681 0.0074 lagged(-4) (0.0080) (0.008) Corporate tax rate 0.0768 0.0409 0.134 (lagged accordingly) (0.0911) (0.0790) (0.146)Corporate tax rate2 -0.00965 -0.00247 -0.0182(lagged accordingly) (0.0143) (0.0123) (0.023) Top marg tax rate 0.0998 -0.378* -0.320 (lagged accordingly) (0.177) (0.213) (0.187)Top marg tax rate2 -0.0144 0.0466 0.0409 (lagged accordingly) (0.0234) (0.0290) (0.025) Observations 307 294 286 254 241 231 220 205 202 R-squared 0.589 0.582 0.579 0.608 0.600 0.588 0.726 0.693 0.618 Number of code 25 25 25 22 22 22 21 21 19 Robust standard errors in parentheses *** p<0.01, ** p<0.05, *p<0.1

24
Figure 1. Mean corporate tax rates and top marginal tax rates on personal income

25
Figure 2. Mean employers’ social security contributions and shareholders’ top tax rate on distributed dividends

26
Appendix Variable Description Source
Growthgdppc Average annual growth rate of per capita GDP
OECD1
Incomepc GDP per capita for the initial year of each subperiod, current
OECD1
Taxrev General government tax revenue as share of GDP, current prices
OECD2
Govexp General government expenditure as share of GDP, current prices
OECD1
Natinv National investment as share of GDP, current prices
OECD1
Unempl Unemployment as share of labor force
OECD1
Dep Population aged 0‐15 and >65 as share of total population
OECD3
Open Exports and imports of goods and services as share of GDP
OECD1
Labgrowth Average annual growth rate of labor force
OECD3
Infl Average inflation rate OECD1 natsav National savings as share of GDP, current prices OECD1 corptax Top statutory corporate tax rate, for initial year
of each subperiod
IBFD, OTPR
topmtrlabor Top marginal tax rate on labor income, for initial year of each subperiod
IBFD, OTPR
dividend tax Top marginal tax rate on dividends (both corp and shareholder level), for initial year of each subperiod
OECD4
employer social sec Employers’ maximal social security contribution rates, for initial year of each subperiod
OECD4
Publications
IBDF, European Tax Handbook
Online Databases
OECD1: OECD, National Accounts Main Aggregates
OECD2: OECD, Revenue Statistics
OECD3: OECD, General Statistics OECD4: OECD, Tax database

27
Country listAustralia Finland Ireland New Zealand SwedenAustria France Italy Norway SwitzerlandBelgium Germany Japan Poland TurkeyCanada Greece Luxembourg Portugal United KingdomDenmark Iceland Netherlands Spain United States

28
References
Agell, J., Ohlsson, H. & P. Thoursie, 2006, Growth effects of government expenditure and
taxation in rich countries,: A comment, European Economic Review, 50(1), 211-218.
Arnold, J., 2008, do tax structure affect aggregate economic growth? Empirical evidence from
a panel of OECD countries, OECD Economics Department Working Papers, No 643,
OECD.
Auerbach, A.J., & K.A. Hassett, 2002, On the marginal source of investment funds, Journal
of Public Economics, 87(1), 205-232.
Barro, R., 1991, Economic growth in a cross-section of countries, Quarterly Journal of
Economics, 106(2), 407-443.
Bergh, A. & M. Karlsson, 2010, Government size and growth: accounting for economic
freedom
and globalization, Public Choice, 142, 195-213.
Devaranjan, S., Swaroop, V. & H. Zou, 1996, The composition of public expenditures and
economic growth, Journal of Monetary Economics, 37, 313-344.
Domar, E.D., & R.A. Musgrave,1944, Proportional Income Taxation and Risk-Taking,
Quarterly Journal Economics, 58, 388-422.
Dowrick, S., 1993, Government consumption: its effects on productivity growth and
investment,
in Gemmel, N.,(ed) The growth of the public sector. Theories and evidence, Aldershot,
Edward Elgar.
Ehrenberg, R., 1990, Introduction: Do compensation policies matter?, Industrial and Labor
Relations Review, 43(3), 3S-12S.
Easterly, W., 1993, How much do distortions affect growth?, Journal of Monetary Economics,
32, 187-212.
Easterly, W. & S. Rebelo, 1993, Marginal income tax rates and economic growth in
developing countries, European Economic Review, 37, 409-417.
Engen, E.M. & J. Skinner, 1996, Taxation and economic growth, National Tax Journal, 49,
617- 642.
Feld, L. & J. Heckemeyer, 2011, FDI and taxation: A meta study, Journal of Economic
Surveys,
25(2), 233-272.
Fölster, S. & M. Henrekson, 2001, Growth effects of government expenditure and taxation in
rich countries, European Economic Review, 45, 1501- 1520.
29
-, 2006, Growth effects of government expenditure and taxation in rich countries, A reply,
European Economic Review, 50, 219-221.
Gemell, N., Kneller, R. & I. Sanz, 2006, Fiscal policy impacts on growth in the OECD: Are
they long- or short-term?, Mimeo, University of Nottingham.
Gentry, W.M., 1994, Taxes, financial decisions and organizational form: Evidence from
publicly traded partnerships, Journal of Public Economics, 53(2), 223-244.
Gentry, W.M., & R.G. Hubbard, 2000, Tax policy and entrepreneurial entry, American
Economic Review, 90(2), 283-287.
Gerardi, R., Graetz, M.J., & H.S. Rosen, 1990, Corporate integration puzzles, National Tax
Journal, 43(2), 307-314.
Gruber, J. & E. Saez, 2002, The elasticity of taxable income: Evidence and implications,
Journal of Public Economics, 84, 1-32.
Hajkova, D., Nicoletti, G., Vartia, L. & K.Y. Yoo, 2006, Taxation and Business Environment
as drivers of foreign direct investment in OECD countries, OECD Economic Studies,
No 43/2.
Hansson, Å., 2010, Tax policy and entrepreneurship: Empirical evidence from Sweden, Small
Business Economics, DOI 10.1007/s11187-010-9282-7.
Hansson, Å. & K. Olofsdotter, 2011, Labor Taxation and FDI decisions in the European
Union, Department of Economics Lund University Working paper No
2011:11.
Heckman, J. et al, 1998, Tax policy and human capital formation, American Economic Review,
88, 293-297.
International Bureau of Fiscal Documentation, (IBDF), European Tax Handbook, various
editions, IBDF, Amsterdam.
Kneller, R., Bleaney, M.F. & N. Gemmell, 1999, Fiscal policy and growth: Evidence from
OECD countries, Journal of Public Economics, 74, 171-190.
Koester, R. & R. Kormendi, 1989, Taxation aggregate activity and economic growth: Cross-
country evidence, Journal of Monetary Economics, 16, 141-163.
Kormendi, R. & P. Meguire, 1985, Macro economic determinants of growth: Cross-country
evidence, Journal of Monetary Economics, 16, 141-163.
Lee, Y. & R. Gordon, 2005, Tax structure and economic growth, Journal of Public
Economics,
89, 1027-1043.

30
Levine, R. & D. Renelt, 1992, A sensitivity analysis of cross-country growth models,
American Economic Review, 83, 942-963.
Leibfritz, W., Thornton, J. & A. Bibbee, 1997, Taxationa and economic performance, OECD
working Papers no 176.
Lindhe, T., 2002, The marginal source of finance, Working Paper no 2002:9, Department of
Economics, Uppsala University.
McKenzie K.J. & A.J. Thompson, 1996, The economic effects of dividend taxation, Technical
Committee on Business Taxation Working Paper 96-7, Department of Finance,
Government of Canada, Ottowa.
Mendoza, E., Miles-Ferretti, G.M. & P. Asea, 1997, On the ineffectiveness of tax policy in
altering long-run growth: Harbeger’s superneutrality conjecture, Journal of Public
Economics, 66, 99-126.
Mooij, R. de, and S. Ederveen, 2006, What a difference does it make? Understanding the
empirical literature on taxation and international capital flows, Brussels, September
2006.
Myles, G., 2009, Economic growth and the role of taxation, OECD Economics Department
Working Papers, No 713, No 714, No 715.
OECD, 2010, Tax policy reform and economic growth, OECD Tax Policy Studies, No 20,
OECD Publishing.
OECD, 2011, Tax database, www.oecd.org/ctp/taxdatabase.
Office of Tax Policy Research, OTPR, World Tax Database, University of Michigan.
Padovano, F. & E. Galli, 2001, Tax rates and economic growth on the OECD countries (1950-
1990), Economic Inquiry, 39, 44-57.
_, 2002, Comparing the growth effects of marginal vs average tax rates and progressivity,
European Journal of Political Economy, 18, 529-544.
Plosser, C.I. , 1992, The search for growth, in Policies for long-run growth, Kansas City:
Federal Reserve Bank of Kansas City.
Porterba, J.M. & L.H. Summers, 1985, The economic effect of dividend taxation, in Altman
E.I. & M.G. Subrahmanyam (eds) Recent Advances in Corporate Finance, Homewood,
Ill., Richard D. Irwin.
Prendergast, C., 1996, What happens within firms? Survey of empirical evidence on
compensation policies, NBER Working paper 5802.

31
Ram, R., 1986, Government spending and economic growth: A new framework and some
evidence from cross-sectional and time-series data, American Economic Review, 87(2),
184-188.
Romero-Avila, D. & R. Strauch, 2008, Public finance and long-term growth in Europe:
Evidence from a panel data analysis, European Journal of Political Economy, 24, 172-
191.
Slemrod, J., 1995, What do cross-country studies teach about government involvement,
prosperity, and economic growth?, Brookings Paper on Economic Activity, pp 373-
431.
Schwellnus, C. & J. Arnold, 2008, Do corporate taxes reduce productivity and investment at
the firm-level? Cross-country evidence from the Amadeus dataset, OECD Economics
Department Working Papers.
Trostel, P., 1993, The effect of taxation on human capital, Journal of Political Economy, 101,
327-350.
Vartia, L., 2008, How do taxes affect investment and productivity? – Industry level analysis
of OECD countries, OECD Economics Department Working Papers,
Widmalm, F., 2001, Tax structure and growth: Are some taxes better than others?, Pubic
Choice, 107, 199-219.
Zodrow, G. 1991, On the traditional and new views of taxation, National Tax Journal, 44(1),
497-509.