Embed Size (px)
Citation preview

TAXATION PAPERS
VAT indicators
Working paper No /2004
EUROPEAN COMMISSIONDirectorate-GeneralTaxation & Customs Union
ISSN 1725-7557
2

Taxation Papers are written by the Staff of the Direction Taxation of the Directorate-General for Taxation and CustomsUnion, or by experts working in association with them. Taxation papers are intended to increase awareness of the workbeing done by the staff and to seek comments and suggestions for further analyses.
Views expressed in the Taxation Papers represent exclusively the positions of the authors and do not necessarily cor-respond to those of the European Commission.
Comments and inquiries should be addressed to:
A first draft of this document was submitted to Delegates to the Working Group “Structures of the Taxation Systems inthe EU” for information at the meeting held on 25 October 2002.
DOC TAXUD/2004/2004 - EN
This paper exists only in English
A great deal of additional information on the European Union is available on the Internet.It can be accessed through the Europa server (http://europa.eu.int).
Cataloguing data can be found at the end of this publication.
Luxembourg: Office for Official Publications of the European Communities, 2004
ISBN 92-894-5174-2
© European Communities, 2004Reproduction is authorised provided the source is acknowledged.
Printed in Belgium
PRINTED ON WHITE CHLORINE-FREE PAPER
Europe Direct is a service to help you find answers to your questions about the European Union
Freephone number:00 800 6 7 8 9 10 11

TAXATION PAPERS
VAT indicators
by
Alexandre Mathis*
Working paper No 2 — April 2004
The electronic version of the paper is available at
http://europa.eu.int/comm/taxation_customs/taxation/taxation.htm
*
The author is economist in the unit Economic Analysis of Taxation

4
Summary
Under the current VAT system defined in the Sixth VAT Directive, Member States are
required to have a single VAT rate of at least 15% and may have a maximum of two
reduced VAT rates set no lower than 5%. Annex H of the 6th
Directive outlines the list of
the goods and services to which reduced rates could apply.
However, this basic structure which applies to all Member States is complicated by the
numerous individual temporary derogations granted to particular Member States. Most of
these specific rates (zero rate, super reduced rates, parking rate and so on) are to be found
under the title XVI Transitional provisions Article 28 of the 6th
Directive and most have
been granted until the entry into force of the "definitive system" of VAT based on
taxation in the Member State of origin.
The aim of this paper is to shed some light on the application of the current VAT system
to both VAT bases and rates among Member States. For the VAT bases, our indicators
demonstrate the share of the base to which a specific VAT rate applies relative to the
whole taxable base. For the VAT rates, focusing on the statutory standard VAT rate is
not satisfactory. To take into account the existence of different VAT rates, we compute
implicit VAT rates. These implicit VAT rates give an indication on the VAT burden.
Our analysis shows that the standard VAT rate is far from applicable to the whole taxable
base. In the year 2000, on average for the EU-15, 69% of the VAT taxable transactions
value was taxed at the standard VAT rate. Moreover for some Member States, only
around half of the taxable transactions were actually taxed at the standard VAT rate.
Therefore, non-standard VAT rates are not the exception as they should be.
Taking into account all VAT rates in force gives us an implicit VAT rate that is up to
30% lower than the standard rate in force in the Member States. In the year 2000, the
EU-15 average for the statutory standard VAT rate was 19.4% with a minimum
(compulsory) of 15% and a maximum of 25%. In contrast, the implicit VAT rate for the
EU-15 was 15.9% with a larger volatility.
Keywords: VAT, Sixth VAT Directive, Implicit VAT rate.
JEL Classification: E62, H21
5
1. INTRODUCTION
Value added tax (VAT) is a general consumption tax. Article 2 of the First VAT
Directive(1
) states that “the principle of the common system of value added tax involves
the application to goods and services of a general tax on consumption exactly
proportional to the price of the goods and services, whatever the number of transactions
which take place in the production or distribution process before the stage at which tax is
charged”.
In the same Article 2 of the 1st
VAT Directive, VAT is defined as follows: “on each
transaction, value added tax, calculated on the price of the goods or services at the rate
applicable to such goods or services, shall be chargeable after deduction of the amount of
value added tax borne directly by the various cost components. The common system of
value added tax shall be applied up to and including the retail trade stage”.
Therefore, with this tax/credit method only the value added at each stage of the
production and distribution chain is taxed. As a result the length of the production or
distribution chain is irrelevant and competition is fair(2
). Producers in the production
chain are actually unpaid tax collectors but not really taxpayers. The VAT is only paid by
the final consumers who are, broadly speaking, households and certain public bodies or
businesses without the right to deduct.
In principle, this tax is not designed to modify the consumer's habit. In other words, this
tax is not intended to alter the type or the quantities of goods and services purchase by
the consumer.
Under the current VAT system (6th
VAT Directive(3
)), Member States are required to
have a single standard VAT rate of at least 15% and may have a maximum of two
reduced VAT rates set no lower than 5%. Annex H of the 6th
Directive lists the goods
and services to which reduced rates could apply.
However, this basic structure which applies to all Member States is complicated by the
numerous individual temporary derogations granted to particular Member States. Most of
these specific rates (zero rate, super reduced rates, parking rate and so on) are to be found
under the title XVI Transitional provisions Article 28 of the 6th
Directive and most been
granted until the entry into force of the "definitive system" based on taxation in the
Member State of origin.
These derogations or options to the standard rules alter both the VAT base and the
implicit VAT rate(4
).
The base is altered to the extent that the Member States choose goods and services from
the list of goods and services in Annex H which can be subject to reduced rate of
(1
) First Council Directive 67/227/EEC of 11 April 1967
(2
) In the 1st
Directive this neutrality (view as no distortion of competition between firms or Member
States) is one of the justifications of putting into practice the VAT system. “Whereas a system of value
added tax achieves the highest degree of simplicity and of neutrality when the tax is levied in as
general a manner as possible and when its scope covers all stages of production and distribution and
the provision of services”.
(3
) Sixth Council Directive 77/388/EEC of 17 May 1977
(4
) Broadly speaking, the implicit VAT rate gives an indication of the VAT burden. It corresponds to a
weighted average VAT rate. It will be defined more precisely in section 4.

6
VAT(5
). Other alterations of the base are due to the fact that as a result of specific
derogations, some Member States are allowed to tax or exempt goods and services
outside the list.
Under some specific conditions Member States may apply more VAT rates: super-
reduced rate, parking rate and VAT exemption with refund of the input tax paid at the
preceding stage (the so-called zero rate). The goods and services to which these
additional VAT rates apply vary amongst Member States.
We should note that the VAT own resources for the EU budget is computed on a
harmonised VAT base (i.e., on a VAT base corrected of all specific derogations or
options used by Member States). In other words the Member States contribution to the
EU budget through the VAT own resources is not affected by the different VAT rates or
derogations in force.
Currently, only Denmark applies only the standard VAT rate (merely newspapers are
taxed at zero rate). The majority of Member States apply three or even four different
VAT rates; one of them uses five different VAT rates. A set of two VAT rates is only in
force in three Member States.
The Communication “A Strategy to improve the operation of the VAT system within the
context of the internal market”(6
) provides an overall framework for future VAT
initiatives. This Communication outlines a VAT strategy based on four objectives:
“simplification and modernisation of current rules, more uniform application of
current rules and a new approach to administrative cooperation”.
The Communication “Tax policy in the European Union - Priorities for the years
ahead”(7
) provides an overall framework for future policy initiatives. For the current
VAT system this Communication stressed that “As for VAT rates, a review and
rationalization of the rules and derogations applying to the definition of reduced VAT
rates should be considered in the medium term, but not before the end of 2002”. This
VAT strategy is in line with the Article 93 of the Treaty which states that harmonisation
of turnover taxes is essential “to the extent that such harmonisation is necessary to
ensure the establishment and the functioning of the internal market”.
In its proposal for a Council Directive amending Directive 77/388/EEC as regards
reduced rates of value added tax(8
), the Commission advocates for a simplification and a
modernisation of the current rules and to apply current legislation more uniformly. This
proposal is still under discussion at the Council.
The intention in this document is to develop quantitative tools or indicators in order to
measure the application of the present arrangements in the VAT field. These issues are
addressed at a macroeconomic level. This set of indicators will shed some light on the
application of the current VAT system on both the VAT bases and the implicit rates in
Member States.
(5
) Annex H of the 6th
Directive
(6
) COM(2000) 348final – June 2000
(7
) COM(2001) 260 final – May 2001
(8
) COM(2003) 397 final – July 2003

7
For the VAT bases, indicators will answered the following questions: what are the
weights of the non-standard VAT rates in the whole VAT taxable base? In other words,
what is the share of the base to which a specific VAT rate applies relative to the whole
taxable VAT base?
For the VAT rates, indicators will give explanations to what extent non-standard VAT
rates alter the total VAT tax burden.
Because of data availability, year 2000 is the latest year available(9
). Therefore all VAT
rates are those in force in 2000(10
).
Table 1: VAT rates (in %) in 2000
Member States Zero
rate(11
)
Super
reduced
rate
Reduced
rates
Standard
rate
Parking
rate
Number
of rates in
force
Belgium (BE) Yes - 6 21 12 4
Denmark (DK) Yes - - 25 - 2
Germany (DE) - - 7 16 - 2
Greece (EL) - 4 8 18 - 3
Spain (ES) - 4 7 16 - 3
France (FR) - 2.1 5.5 19.6(12
) - 3
Ireland (IE) Yes 4.2(13
) 12.5 21 12.5 5
Italy (IT) Yes(14
) 4 10 20 - 4
Luxembourg (LU) - 3 6 15 12 4
Netherlands (NL) - - 6 17.5 - 2
Austria (AT) - - 10 20 12 3
Portugal (PT) - - 5/12 17 - 3
Finland (FI) Yes - 8/17 22 - 4
Sweden (SE) Yes - 6/12 25 - 4
United-Kingdom
(UK)
Yes - 5 17.5 - 3
Source: Commission services
2. VAT BASE: THE SHARES OF THE DIFFERENT VAT RATES
We define the taxable VAT base as the value of all transactions that are subject to VAT
excluding exempted transactions. The standard rate base is the value of all transactions
that are taxable at the standard rate.
(9
) Most of the data used in this paper are computed using information from VAT own resources reports.
The 2002 reports are sent to the Commission in 2003. These reports used National account data of
2000. In other words VAT own resource computation of year t are done with National account data of
year t-2 (Regulation n°1553/89).
(10
) The current VAT rates could be found at this web site address:
http://europa.eu.int/comm/taxation_customs/publications/info_doc/info_doc.htm#vat_rates
(11
) Zero rate means VAT exemption with refund of the input tax paid at the preceding stages.
(12
) From 01/04/2000 it was 20.6%.
(13
) VAT “flat rate addition” payable by unregistered farmers. It was 4.% before March 2000.
(14
) Only for: Supplies of unwrought gold (in ingots, etc.); Supplies of land not capable of being used as
building land; Supplies of ferrous and non-ferrous metal scrap. This will not be study in the next
sections.

8
To follow the spirit of the 6th
Directive, reduced rates (and in general all non-standard
rates) should remain exceptions to the standard rate(15
). Therefore, we conclude that the
standard VAT rate should cover a broad range of the taxable VAT base. In other words,
we expect that most of the transactions subject to VAT are taxed at the standard rate. But
what actually happens in practice?
We compute below, for each VAT rate in force, the ratio between the value of the
transactions to which the standard rate applies and the aggregate value of all transactions
subject to VAT.
The data has come from ESA95 National Accounts. Computations of the VAT bases
were done by Member States in their VAT own resources annual framework(16
) based on
the year 2000, the most recent available(17
). Denmark will not be included in all
indicators because there is effectively only a standard rate.
2.1. Standard rate base:
Only one Member State (DK) shows a share of the standard rated transactions in all
transaction equal to 100%. Then, eight Member States (DE, FI, UK, SE, NL, BE, AT and
FR) are between 85% and the EU average of 69%.
The remaining Member States are under the EU average (PT, EL, IT, IE, LU and ES).
We should also note that three Member States (IE, LU and ES) show a share of the
standard VAT rate below 50%. This grouping of Member States is consistent with the
years 1996 and 1998 (see annex 1).
CHART 1: Standard VAT rate base, as a % of the taxable base (year 2000)
0%
20%
40%
60%
80%
100%
Denm
ark
Germ
any
Finland
UK
Sweden
Netherlands
Belgium
Austria
France
Portugal
Greece
Italy
Ireland
Luxem
bourg
Spain
UE-15
(15
) “It follows from Article 12(3)(a) of the Sixth Directive that the application of one or two reduced rates
is an option accorded to Member States as an exception to the principle that the standard rate
applies. … It is settled case-law that provisions which are in the nature of exceptions to a principle
must be interpreted strictly”, in judgement of 18 January 2001, European Court of Justice,
Commission v. Kingdom of Spain, C-83/99,ECR 2001,I-00445.
(16
) Regulation n°1553/89
(17
) Except for Portugal 1999 (2000 data not available).
9
In short, the standard VAT rate is far from being applicable to the whole taxable base.
For some Member States, only around half of the taxable base is subject to the standard
rate. Therefore, non-standard rates are not the exception as they should be.
2.2. Reduced rate base:
According to the 6th
Directive (Art. 12), Member States may apply either one or two
reduced rates. These rates must not be less that 5% and are only applicable to supplies of
the categories of goods and services specified in Annex H of the 6th
Directive. Member
States may also apply a reduced rate for the supply of natural gas or electricity and also
to imports of works of art, collector’s items and antiques (as referred to in Article 26)(18
).
The following chart shows the share of the reduced rate base as a percentage of the whole
taxable base. For the sake of clarity, the chart displays the sum of the two bases for the
four Members States (AT, PT, FI and SE) where two reduced rates are in force.
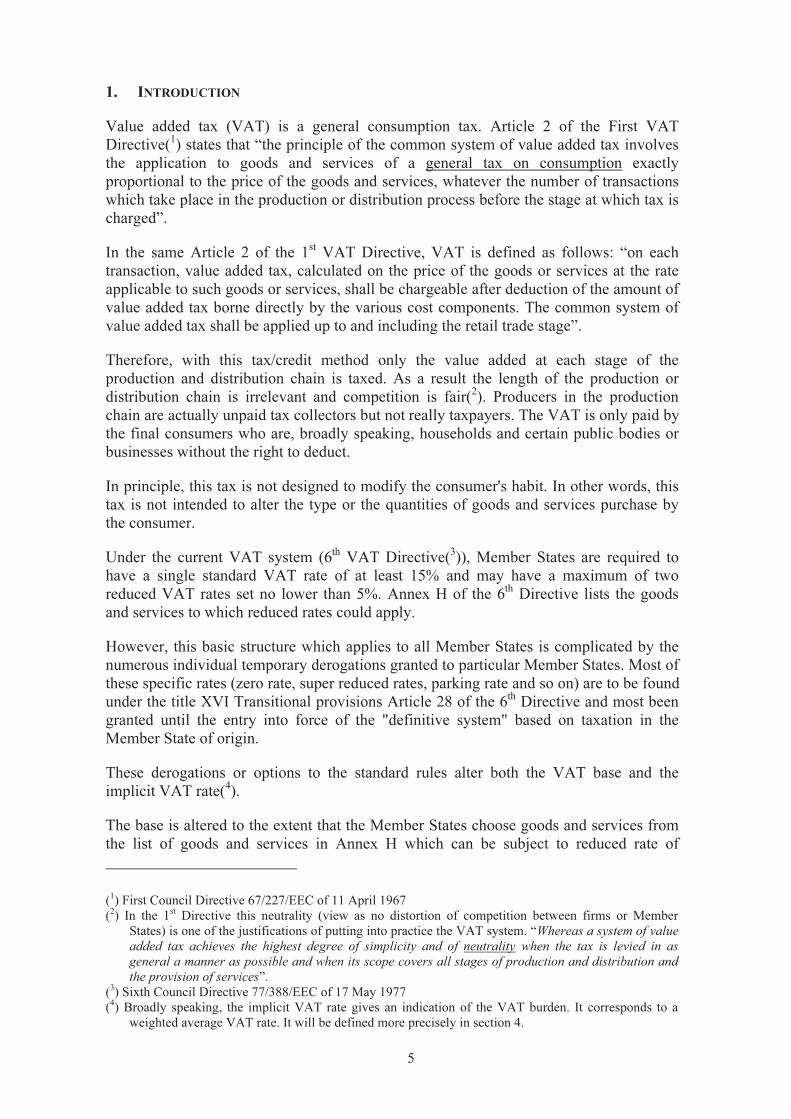
Chart 2: Reduced VAT rates base, as a % of the taxable base (year 2000)
0%
10%
20%
30%
40%
50%
Spain
Ireland
Portugal
Greece
Italy
Austria
Belgium
Netherlands
France
Finland
Sweden
Germ
any
UK
Luxem
bourg
Denm
ark
UE-15
There is a huge disparity amongst the Member States on the size of the share of the
reduced rate base. Spain ranks first with 44% of the taxable base. The United-Kingdom
and Luxembourg have the lowest share with only 3%. Denmark does not apply any
reduced VAT rates. The EU average is at 23%.
To highlight the effect of the transitional measures stated in Article 28 of the 6th
Directive, we compute the sum of the share of both standard and reduced rate bases. The
(18
) There are also some additional reduced rates provisions in the transitional measures stated in article 28.
10
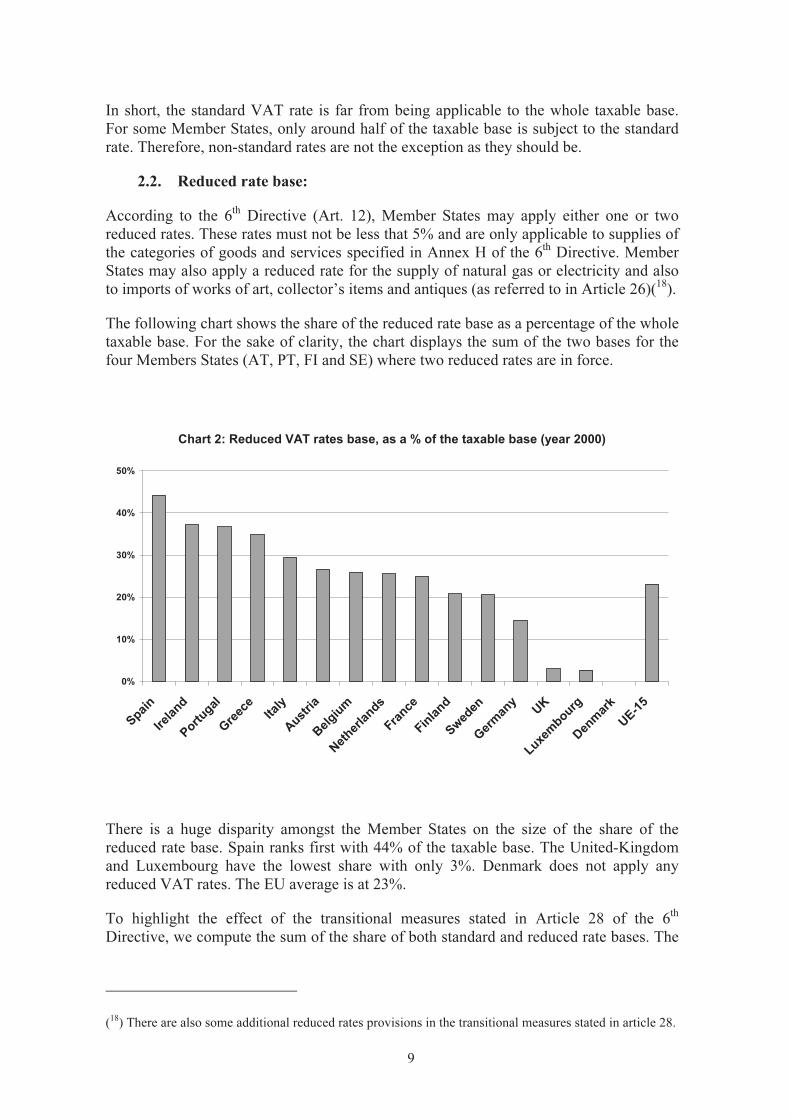
closer to 100% this sum is, the lower the effects of transitional measures(19
). This sum is
shown in the next chart.
CHART 3: Sum of the Standard and Reduced rates Bases, as a % of the
taxable base (year 2000)
0%
20%
40%
60%
80%
100%
Denm
ark
Netherlands
Germ
any
Portugal
Austria
Belgium
Finland
Sweden
Greece
France
Spain
Italy
Ireland
UK
Luxem
bourg
UE-15
It is clear from the previous chart that for a small set of Member States the share of the
sum of the standard and reduced rate bases is far from 100%.
Seven Member States (DK, NL, DE, PT, AT, BE and FI) are close to 100%, actually
above 99%. Then 3 Member States (SE, EL and FR) follow closely with respectively
98%, 97% and 96%. Spain shows a share of 90% followed by Italy and Ireland both with
87%. The United-Kingdom presents a share of 81%. Luxemburg is far below the other
Member States with a share of only 50%.
The EU average is at 92% but with a large difference with a maximum of 100% and a
minimum of 50%.
Therefore, the possibility of derogation given in the 6th
Directive to apply other rates than
standard and reduced rates clearly has a non-negligible impact. We will explore the
implications of the super-reduced rate, zero rate and parking rate, in the next sections.
2.3. Super-reduced rate base
Member States may apply reduced rates lower than 5% (so-called super-reduced rate)
which were in force on 1st
January 1991 (Title XVI Transitional provisions Article 28 of
the 6th
Directive).
(19
) This approach can only give information about the effects of the zero rate, the super reduced rate and
the parking rate but not on the specific reduced rate provisions stated in article 28.
11
Six Member States apply the super-reduced rate: Greece, Spain, France, Ireland, Italy
and Luxembourg.
For Luxembourg the base of the super-reduced rate is an important part of the taxable
base, around a quarter. For Italy and Spain, the super-reduced rate base accounts for
respectively 12% and 9.5% of the taxable base. For France, it is less than 5%, for Greece
less than 2%. For Ireland percentage is negligible (0.1%).
For Greece, France, Spain and Italy the base of standard, reduced and super-reduced rates
cover now the entire taxable base.
However, for LU, UK, IE and to some extent SE, a substantial part of the taxable base is
subject to the special provisions of the zero rate and the parking rate.
2.4. Zero rate base
As for super-reduced rates, the Member States may apply exemptions with refund of the
tax paid at the preceding stage, the so-called zero rate (Title XVI Transitional provisions
Article 28 of the 6th
Directive).
Only a small number of Member States have the possibility to apply the zero VAT rate.
It should be noted that the goods and services subject to the zero rate are quite different
among Member States. On the one hand, Denmark applies the zero rate only to
newspapers and is out of this sample. On the other hand, the descriptive list of zero-rated
goods and services contains 20 category lines for the United Kingdom and 12 for Ireland.
The lists of zero-rated goods and services for these two Member States are given in the
annex.
For the United Kingdom, the zero rate base is around 20% of the whole taxable base. In
other words, a fifth of the whole taxable base is actually not taxed and is not subject to
VAT payments and therefore no VAT receipts for the government budget. The share of
the zero rate base for Ireland is also large with 12% of the taxable base. The next three
Member States are far from these figures. Sweden follows with less than 2% and Finland
is at 1.5%. For Belgium, the share of the zero rate base is negligible, less than 0.6%.
The three years available (1996, 1998 and 2000, see annex 1) were used to check the
stability of the share of the zero rated VAT base. It appears that for the United-Kingdom,
Finland, Sweden and Belgium this share is stable. Ireland seems to have a slightly
decreasing trend for the zero rated VAT base with a share of 16%, 14% and 12%
respectively for years 1996, 1998 and 2000. However, these observations are not enough
to draw strong conclusions about a possible trend.
In 1967 the introduction of the 2nd
Directive stated that, “…the introduction of zero rates
gives rise to difficulties, so that it is highly desirable to limit strictly the number of
exemptions and to make the reductions considered necessary by applying reduced rates
which are high enough to permit in normal circumstances the deduction of the tax paid
at the preceding stage”. With the accession of new Member States, sticking to this
recommendation has become more and more difficult.
2.5. Parking rate base
Parking rates may be applied by the Member States to goods and services, not included
in the list, to which a reduced rate was applied on 1st
January 1991 (Title XVI
12
Transitional provisions Article 28 (2)(e) of the 6th
directive). The minimum rate for this
parking rate is fixed at 12%.
The share of the parking rate base for Luxembourg is 26% of the whole taxable base.
Luxembourg applies parking rate to a list of 12 categories of goods and services(20
),
including unleaded gasoline and tobacco.
For Belgium, the second Member State applying a parking rate, the share is 0.6%, which
could be considered negligible. Ireland also applies a parking rate. Unfortunately parking
and reduced rates are set at the same level 12.5%. Therefore, we are not able to
discriminate between reduced and parking bases and in a first approximation all
transactions subject to a 12.5% rate were allocated to the base of reduced rate. Austria
applies a parking rate of 12% for wine from farm production carried out by the producing
farmer. However, this base is considered as negligible.
The parking rate should have been only transitory and was expected to be withdrawn. In
1996, the share of the parking rate was 17% of the taxable base (22.3% in 1998) in
Luxembourg. On the other side, Belgium remains stable with the same very small share
of 0.7% for both years (1996 and 1998).
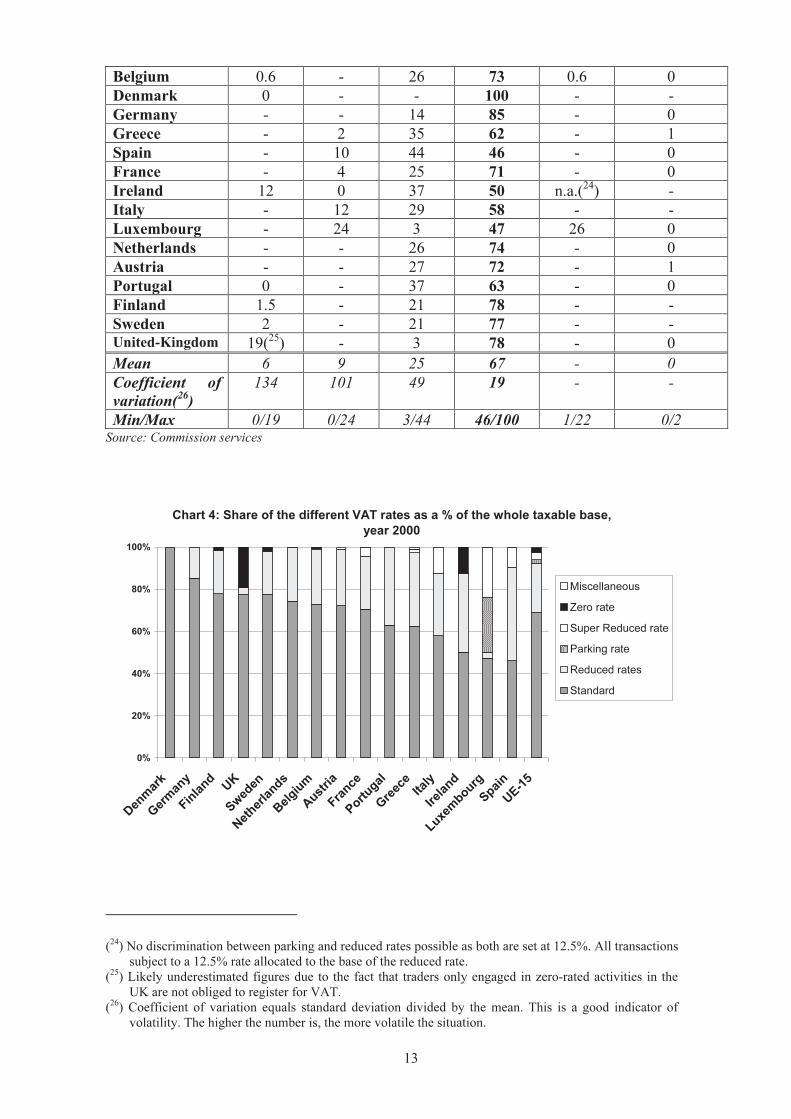
To sum up, three Member States (UK, IE, LU) show evidence of a large part of the bases
relate to either zero rate or parking rate. Two Member States (UK and IE) present a large
zero rate base. Luxembourg exhibits a gap greater than 20%, explained by the large size
of the parking rate base. The following table and chart summarise the bases of all
different VAT rates as a percentage of the whole taxable VAT base for the year 2000.
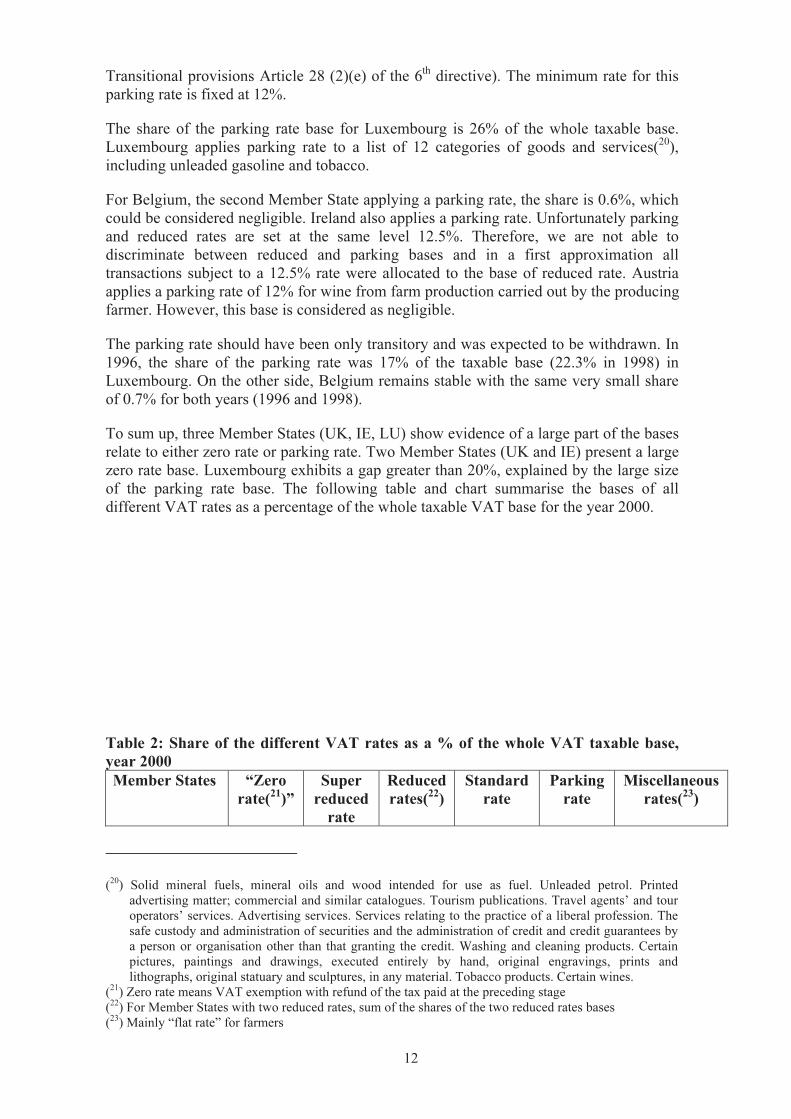
Table 2: Share of the different VAT rates as a % of the whole VAT taxable base,
year 2000
Member States “Zero
rate(21
)”
Super
reduced
rate
Reduced
rates(22
)
Standard
rate
Parking
rate
Miscellaneous
rates(23
)
(20
) Solid mineral fuels, mineral oils and wood intended for use as fuel. Unleaded petrol. Printed
advertising matter; commercial and similar catalogues. Tourism publications. Travel agents’ and tour
operators’ services. Advertising services. Services relating to the practice of a liberal profession. The
safe custody and administration of securities and the administration of credit and credit guarantees by
a person or organisation other than that granting the credit. Washing and cleaning products. Certain
pictures, paintings and drawings, executed entirely by hand, original engravings, prints and
lithographs, original statuary and sculptures, in any material. Tobacco products. Certain wines.
(21
) Zero rate means VAT exemption with refund of the tax paid at the preceding stage
(22
) For Member States with two reduced rates, sum of the shares of the two reduced rates bases
(23
) Mainly “flat rate” for farmers
13
Belgium 0.6 - 26 73 0.6 0
Denmark 0 - - 100 - -
Germany - - 14 85 - 0
Greece - 2 35 62 - 1
Spain - 10 44 46 - 0
France - 4 25 71 - 0
Ireland 12 0 37 50 n.a.(24
) -
Italy - 12 29 58 - -
Luxembourg - 24 3 47 26 0
Netherlands - - 26 74 - 0
Austria - - 27 72 - 1
Portugal 0 - 37 63 - 0
Finland 1.5 - 21 78 - -
Sweden 2 - 21 77 - -
United-Kingdom 19(25
) - 3 78 - 0
Mean 6 9 25 67 - 0
Coefficient of
variation(26
)
134 101 49 19 - -
Min/Max 0/19 0/24 3/44 46/100 1/22 0/2
Source: Commission services
Chart 4: Share of the different VAT rates as a % of the whole taxable base,
year 2000
0%
20%
40%
60%
80%
100%
Denm
ark
Germ
any
Finland
UK
Sweden
Netherlands
Belgium
Austria
France
Portugal
Greece
Italy
Ireland
Luxem
bourg
Spain
UE-15
Miscellaneous
Zero rate
Super Reduced rate
Parking rate
Reduced rates
Standard
(24
) No discrimination between parking and reduced rates possible as both are set at 12.5%. All transactions
subject to a 12.5% rate allocated to the base of the reduced rate.
(25
) Likely underestimated figures due to the fact that traders only engaged in zero-rated activities in the
UK are not obliged to register for VAT.
(26
) Coefficient of variation equals standard deviation divided by the mean. This is a good indicator of
volatility. The higher the number is, the more volatile the situation.

14
3. VAT BASES: WHO IS CONCERNED
As shown above, the shares of the different VAT-rate bases in the taxable VAT base are
quite dissimilar amongst Member States. We now examine the incidence of VAT on
various economic agents.
Each VAT base (standard rate base, reduced rate base, etc.) is split into six main
categories(27
):
i) Final consumption of households,
ii) Intermediate consumption of private non-profit institutions and general government,
iii) Intermediate consumption of other sectors,
iv) Gross fixed capital formation of private non-profit institutions and general
government,
v) Gross fixed capital formation of other sectors, and
vi) Others.
The following table shows the shares of all the above defining categories in percentage of
the whole VAT base for the year 2000.
The share of final consumption of households in the total taxable base ranges from 60%
for Ireland and Sweden to 74% for Italy. The EU average is 66%.
Table 3: Share of the different categories as a % of the total taxable base (year
2000)
Member
States
Final
consumption
of households
Intermediate
consumption
of private
non-profit
institutions
and general
government
Intermediate
consumption
of other
sectors
Gross fixed
capital
formation
of private
non-profit
institutions
and general
government
Gross
fixed
capital
formation
of other
sectors
Others
Belgium 71 5 9 3 10 2
Denmark(28
) 61 11 12 3 12 0
Germany 61 9 11 3 16 0
Greece 67 7 0 6 19 0
Spain 73 5 6 4 9 2
France 64 8 11 5 12 1
Ireland 60 5 9 6 17 3
Italy 74 5 12 2 7 0
Luxembourg 64 4 19 6 7 0
Netherlands 63 6 12 17(29
) 2
(27
) This split is compulsory for the VAT own resource report according to the Regulation n°1553/89
(28
) Year 1998

15
Austria 72 8 6 12(29
) 2
Portugal 68 9 12 7 4 0
Finland 64 14 11 5 4 2
Sweden 60 19 12 4 5 0
United-
Kingdom
68 9 15 2 6 1
Mean 66 8 11 4 10 1
Coefficient of
variation
7 47 41 58 48 104
Min/Max 60/74 4/19 0/19 0/7 4/19 0/3
Source: Commission services
At this stage we focus next on the share of the final consumption of households in each
VAT rate bases. This gives indications as to whether special provisions are primarily
targeted to households or to other sectors.
3.1. Final household consumption and standard VAT rate
As we can see in the next chart, final household consumption is on average around two-
thirds of all the transactions to which the standard VAT rate applies. However, this needs
to be qualified. The highest share is for Ireland with 75% and the lowest share is for
Greece with only 51%(30
).
(29
) No split between GFCF of government and GFCF of other sectors is available in our database.
Therefore, descriptive statistics are computed without Netherlands and Austria.
(30
) Data for Denmark was not available.

16
Chart 5: Share of final consumption of households in transactions with
standard VAT rate (year 2000)
0%
20%
40%
60%
80%
100%
Ireland
Italy
Spain
Belgium
UK
Austria
Portugal
Luxem
bourg
Finland
France
Germ
any
Netherlands
Sweden
Greece
UE-15
3.2. Final household consumption and the other VAT rates
For a majority of the Member States, reduced rates as defined in the 6th
directive mainly
apply to households' consumption.
Ireland is one exception where only 30% of the transactions rated at the reduced rate(31
)
are final consumption of households. However, the super-reduced rate is 100% targeted
at the final consumption of Irish households(32
). Similarly, 93% of the zero-rated
transactions are also targeted at the final consumption of Irish households. As previously
seen, the share of the zero-rated VAT transactions is 12% of the all transactions subject
to VAT.
The zero rate is generally targeted to the final consumption of households. This is true in
Portugal, Ireland and to a lesser extent in Belgium and Finland. However, the share of the
final consumption of households in the zero-rated transactions is lower in the United-
Kingdom at 72% and only 42% in Sweden.
For parking rated transactions in Belgium and Luxembourg, the share of the final
consumption of households is respectively 43% and 53%. However, It must be kept in
mind that the weight of the parking base in the whole taxable base is negligible (less than
0.7%) for Belgium but culminates at 26% for Luxembourg. For Ireland, as previously
explained, we are not able to discriminate between reduced and parking rates.
To summarise, the common assumption that reduced rates point to the households’ final
consumption generally holds but with significant exceptions.
(31
) Transactions rated at the parking are also included.
(32
) We should note that the weight of the base of the super-reduce rate in the whole taxable base is quite
small (less than 1% as previously seen)

17
Table 4: Share of the final consumption of households in each VAT rated
transactions, as a % of the corresponding VAT base, year 2000.
% Zero rate Super
reduced
rate
Reduced
rate 1
Reduced
rate 2
Parking
rate
Standard
rate
Belgium 88 - 83 - 43 67
Denmark n.a. - - - - n.a.
Germany - - 92 - - 56
Greece - 93 94 - - 51
Spain - 89 74 - - 70
France - 85 82 - - 56
Ireland 93 100 30 - -(33
) 75
Italy - 78 75 - - 72
Luxembourg - 81 85 - 53 61
Netherlands - - 88 - - 54
Austria - - 93 100 - 64
Portugal 100 - 77 83 - 62
Finland 83 - 82 96 - 57
Sweden 42 - 78 94 - 53
United-
Kingdom
72 - 92 - - 66
Mean 80 87 80 93 48 62
Coefficient of
variation
26 9 20 8 - 12
Min/Max 42/100 76/100 30/94 83/100 43/53 51/75
Source: Commission services
4. VAT RATES: STATUTORY VERSUS IMPLICIT RATES
To measure the level of the VAT burden, focusing on the statutory standard rate is not
satisfactory. As demonstrated above, the weight of the taxable base at the standard rate is
only two thirds, on average, of the whole taxable VAT base (see section 2.1 above). To
take into account the existence of all the VAT rates in force, we weigh each VAT rate
with the share of the value of the transaction to which that rate applies as a percentage of
the total taxable transactions.
This implicit rate (or weighted average VAT rate, WAR(34
)) gives an indication of the
VAT burden. It also gives an indication of the tax differentials induced by the non-
(33
) No discrimination between parking and reduced rates is possible as both are at 12.5%. All transactions
subject to a 12.5% rate allocated to the base of the reduce rate.
(34
) WAR = sum of Wi*VATi,
where Wi = value of the transactions to which VAT rate i applies divided by the aggregate value of all
taxable transactions and VATi is the VAT rate i.
VAT rates are those in force in 2000. Weights are computed with 2000 National Account.

18
standard VAT rates. The closer the standard rate and the weighted average VAT rate are,
the smaller the impact of the non standard rates (e.g.: reduced rates, zero rate). In the
extreme case of Denmark, where there is only the standard rate, both standard and
weighted rates are identical. To define this weighted average VAT rate in a different
way, it is the VAT rate which if applied to all goods and services subject to VAT give,
ceteris paribus, the same VAT receipt. In other words, if all VAT rates, such as the zero
rate, reduced rates, super reduced rate, parking rate and standard rate, were replaced with
this unique weighted average VAT rate, the VAT receipt would be, ceteris paribus(35
),
the same.
In the following chart, standard and weighted rates are shown; Member States are ranked
according to their standard rates. Ireland exhibits the greatest gap between standard and
weighted with 5.8 percentage points. Italy and Spain are above 5 percentage points.
Greece, France, Luxembourg, Belgium, Portugal, United-Kingdom and Sweden are
between 4.5 and 3.5 percentage points. Then the gap between standard and weighted
rates narrows to less than 3 percentage points for the remaining Member States (NL, AT,
FIN, DE). Germany shows the lowest gap with only 1.3 percentage points. This reflects
the fact that Germany has only two VAT rates and (apart from Denmark) has the highest
share of the standard rate base in the whole taxable base, around 85%. Netherlands,
which has two VAT rates as well, is also in the group with the lowest gap between
standard rate and weighted rate with a 3 percentage point gap. The Netherlands’ share of
the standard rate base in the whole taxable base is 75%.
The EU average for standard rates is at 19.4% with a statutory minimum of 15%. For the
implicit VAT rate, which takes into account all the VAT rates in force, the EU average is
lower with 15.9%, which corresponds to about a 20% discount of the previous EU
average standard rate. But the dispersion is to a certain extent higher with a minimum
and maximum of 10.9% and 25%.
Chart 6: Statutory Standard VAT rate and implicit VAT rate (year 2000)
0%
5%
10%
15%
20%
25%
Denm
ark
Sweden
Finland
Belgium
Ireland
Italy
Austria
France
Greece
Netherlands
UK
Portugal
Germ
any
Spain
Luxem
bourg
UE-15
Implicit VAT rate
Statutory standard VAT rate
(35
) This assumes that the consumption will not change.

19
It is clear from the chart that the distortion induced by the non-standard rates on the VAT
burden is not related to the level of the standard rate. Italy and Austria share the same
20% standard rate but their implicit VAT rates are respectively 15% and 17.3%.
Furthermore, Germany and Spain have a common 16% standard VAT rate but
respectively 14.7% and 10.9% for their weighted rates.
We have computed the same implicit VAT rate for final household consumption only
(HH WAR). As a result, the implicit VAT rate for final household consumption is lower
than the whole implicit VAT rate. This confirms that the households’ final consumption
is relatively less VAT taxed. This could be interpreted due to the fact that deviations
from standard rate are mostly related to households. The EU average for this HH WAR is
14.7% with a minimum and a maximum of 10.5% and 20.2%.
For the year 2000, the following table recapitulates the statutory standard rate and the
implicit VAT rate with the difference between the two, both in absolute and relative
values. The implicit VAT rate for the final consumption of the households is also given.
It also computes the average and the coefficient of variation. The latter, which is greater
for the implicit than for the statutory standard rate, would indicate that special
derogations and special provisions increase the dispersion among Member States.
Table 5: Implicit VAT rates and statutory standard VAT rate for 2000
Implicit
VAT rate
for final
household
consumption
Implicit
VAT rate
Statutory
standard
rate
Gap standard
vs. implicit
rate,
in % points
Gap standard
vs. implicit
rates,
as a % of the
Standard rate
Belgium 16.3% 16.9% 21% 4.1 19%
Denmark Na 25% 25% 0 0%
Germany 14.1% 14.7% 16% 1.3 8%
Greece 12.6% 14.2% 18% 3.8 21%
Spain 10.8% 10.9% 16% 5.1 32%
France 14.7% 15.5% 19.9%(36
) 4.4 22%
Ireland 16.0% 15.2% 21 5.8 28%
Italy 14.8% 15% 20% 5.0 25%
Luxembourg 10.5% 11.1% 15% 3.9 26%
Netherlands 13.3% 14.6% 17.5% 2.9 17%
(36
) 19.6% and 20.6%.

20
Austria 16.5% 17.3% 20% 2.7 14%
Portugal 12.8% 13.2% 17% 3.8 22%
Finland 19.4% 19.9% 22% 2.1 10%
Sweden 20.2% 21.4% 25% 3.6 14%
United-
Kingdom
13.9% 13.7% 17.5% 3.8% 22%
Mean 14.7% 15.9% 19.4% 3.5 19%
Coefficient of
variation
19% 24% 16% 43% 45%
Min/Max 10.5%/20.2% 10.9%/25% 15%/25% 0%/5.8% 0%/32%
Source: Commission services

21
5. CONCLUSION
This paper develops aggregate indicators to shed light on the present VAT system. They
show that the objective of the 6th
VAT Directive, which advocate a standard VAT rate
with the possibility of one or two reduced rates, is far to be reached.
Actually, for several Member States the number of authorized deviations from the
standard rules distorts their VAT base. Our indicators on the standard VAT base
demonstrate that the standard VAT rate is far from covering the whole taxable base. In
the year 2000, on average for the EU-15, 69% of the VAT taxable transactions value was
taxed at the standard VAT rate. For some Member States, only around half of the whole
taxable base is subject to the standard rate. Therefore, non-standard VAT rates are not the
exception as they should be.
To take into account the existence of different VAT rates, we compute implicit VAT
rates. These implicit VAT rates give an indication on the VAT burden. The implicit VAT
rate indicator can be 30% lower than the standard rate in force in the Member State. In
the year 2000, the EU-15 average for the statutory standard VAT rate was 19.4% with a
minimum (compulsory) of 15% and a maximum of 25%. In contrast, the implicit VAT
rate for the EU-15 was 15.9% with a larger volatility, from 10.9% to 25%.

22
ANNEX 1
Table A1: Standard VAT rate base, as a % of the taxable base37
Member States 1996 1998 2000
Belgium (BE) 72 71 73
Denmark (DK) 100 100 100
Germany (DE) 83 85 85
Greece (EL) 54 55 62
Spain (ES) 52 48 46
France (FR) 72 68 71
Ireland (IE) 53 51 50
Italy (IT) 60 56 58
Luxembourg (LU) 52 46 47
Netherlands (NL) 75 74 74
Austria (AT) 69 71 72
Portugal (PT) 60 62 63
Finland (FI) 77 78 78
Sweden (SE) 77 77 77
United-Kingdom (UK) 78 77 78
EU-15 69 68 69
Source: Commission services
37
We define the taxable VAT base as the value of all transactions that are subject to VAT excluding
exempted transactions

23
Table A2: Reduced VAT rates base, as a % of the taxable base38
Member States 1996 1998 2000
Belgium (BE) 26 27 26
Denmark (DK) 0 0 0
Germany (DE) 16 14 14
Greece (EL) 42 42 35
Spain (ES) 39 42 44
France (FR) 23 27 25
Ireland (IE) 30 35 37
Italy (IT) 28 31 29
Luxembourg (LU) 4 2 3
Netherlands (NL) 25 26 26
Austria (AT) 30 27 27
Portugal (PT) 40 37 37
Finland (FI) 20 20 21
Sweden (SE) 21 19 21
United-Kingdom (UK) 3 3 3
EU-15 23 24 23
Source: Commission services
Table A3: Super reduced VAT rate base, as a % of the taxable base39
Member States 1996 1998 2000
Greece (EL) 2.1 1.8 1.7
Spain (ES) 9 10 10
France (FR) 4.4 4.4 4.3
Ireland (IE) 0.3 0.2 0.1
Italy (IT) 12 13 12
Luxembourg (LU) 27 29 24
Source: Commission services
38
We define the taxable VAT base as the value of all transactions that are subject to VAT excluding
exempted transactions
39
We define the taxable VAT base as the value of all transactions that are subject to VAT excluding
exempted transactions

24
Table A4: Parking VAT rate base, as a % of the taxable base40
Member States 1996 1998 2000
Belgium (BE) 0.8 0.7 0.6
Ireland (IE) na(
41
) na na
Luxembourg (LU) 17.0 22.3 26.0
Source: Commission services
Table A5: Zero VAT rate base, as a % of the taxable base42
Member States 1996 1998 2000
Belgium (BE) 1.0 0.4 0.6
Ireland (IE) 16.3 14.1 12.4
Italy (IT) na na na
Portugal (PT) 0.0 0.0 0.0
Finland (FI) 1.6 1.5 1.5
Sweden (SE) 2.7 3.9 2.0
United-Kingdom (UK) 19.1 19.6 19.4
Source: Commission services
40
We define the taxable VAT base as the value of all transactions that are subject to VAT excluding
exempted transactions
(41
) No discrimination between parking and reduced rates possible as both are set at 12.5%. All transactions
subject to a 12.5% rate allocated to the base of the reduced rate.
42
We define the taxable VAT base as the value of all transactions that are subject to VAT excluding
exempted transactions

25
ANNEX 2
List of goods and services subject to VAT exemption with refund of the input tax paid at
the preceding stage (the so-called zero rate)
BELGIUM:
− Supplies of daily and weekly newspapers of general information
− Supplies of certain recovered materials and by-products
DENMARK:
− Sales of newspapers normally published at a rate of more than one issue per month.
IRELAND:
− Supplies of books and pamphlets (excluding newspapers, periodicals, catalogues,
diaries, etc.)
− Supplies of food and drink intended for human consumption (excluding certain
products such as alcoholic beverages, manufactured beverages, ice-cream and
confectionery)
− Supplies of seeds, plants, trees, etc. used for food production
− Supplies of fertiliser in units of not less than 10 kg
− Supplies of animal feeding stuffs (excluding pet food)
− Supplies of orally administered medicines for human consumption
− Supplies of orally administered medicines for animal consumption (excluding those for
pets)
− Supplies of certain articles of feminine hygiene
− Supplies of medical equipment such as wheelchairs, crutches, orthopaedic appliances
and other artificial parts of the body (excluding false teeth)
− Supplies of articles of clothing and footwear for children of average size under the age
of ten (excluding clothes made of fur or skin and articles of clothing and footwear not
marked with the size or age)
− Supplies of wax candles (plain, white and undecorated)
− Certain services provided by the Commissioners of Irish Lights
ITALY:
− Supplies of unwrought gold (in ingots, etc.)
− Supplies of land not capable of being used as building land
− Supplies of ferrous and non-ferrous metal scrap
FINLAND:
− Newspapers and periodicals provided that they are sold on subscription for a period of
at least one month
− Printing services for membership publications of non-profit making organisations
SWEDEN
− Services with regard to production (basically printing services) of membership
periodicals, staff periodicals and periodicals issued by non-profit organisations, including
services related to such production, such as distribution services
26
− Medicine supplied on prescription or sold to hospitals or imported into the country to
be supplied on prescription or sold to hospitals
United-Kingdom:
− Supplies of books, newspapers, periodicals, sheet music, maps, etc.
− Supplies of food products for human or animal consumption, except for supplies of pre-
cooked dishes and certain highly processed products such as ice-cream, chocolates,
manufactured beverages or beverages subject to excise duty and pet foods
− Supplies of seeds or other means of propagation of plants classified under the above
paragraph
− Supplies of live animals of a type generally used as, or yielding or producing, food for
human consumption
− Supplies of water other than water for enterprises, distilled or mineral water
− Supplies of pharmaceuticals, medicines only where prescribed
− Supplies of medical and surgical instruments, aids only to handicapped persons
(excluding hearing aids, dental prostheses, spectacles, etc.)
− Supplies of children’s clothing and footwear
− Construction of buildings for residential purposes; approved alterations to listed
buildings
− Supplies of certain materials by a person supplying the above-mentioned services,
excluding maintenance and repair work
− Supplies for and by charity organisations of goods donated with a view to being sold
− Supplies of magnetic tape and tape recorders, etc. to the Royal National Institute for the
Blind
− Supplies to a charity organisation of radio receivers for free loan to blind persons
− Sewage services
− The transport of passengers in any vehicle, vessel or aircraft carrying at least 12
passengers; or by the Post Office; or by any scheduled service
− The transport of passengers or freight from or to a place outside the United Kingdom
− Supplies of certain caravans and houseboats
− Supplies of boots and helmets for industrial use
− Supplies of motor-cycle and cycle helmets
− The issue of bank notes

European Commission
Taxation papers — VAT indicatorsWorking paper No 2/2004
by Alexandre Mathis
Luxembourg: Office for Official Publications of the European Communities
2004 — 26 pp. — 21 x 29.7 cm
ISBN 92-894-5174-2

ISBN 92-894-5174-2
,!7IJ2I9-efbheb!›
KP
-58-04-708-EN
-C


![ECE 2000 Gate Question Papers[1]](https://img.pdfslide.net/doc/110x75/577cd7b71a28ab9e789f9758/ece-2000-gate-question-papers1.jpg)