Embed Size (px)
Citation preview

Taxpayers’ tax compliance Behavior: Business Profit taxpayers’ in Addis Ababa (2015)
ADDIS ABABA UNIVERSITYSCHOOL OF BUSINESS AND ECONOMICS
DEPARTMENT OF ACCOUNTING AND FINANCE(GRADUATE PROGRAM)
Taxpayers’ tax compliance Behavior- Businessprofit taxpayers’ of Addis Ababa city
Administration
A Thesis Submitted to the School of Graduate Studies of Addis AbabaUniversity in Partial Fulfillment of the Requirements for the Degree of
Master of Science in Accounting and Finance.
By:
Geletaw Tsegaw Tessema
JUNE 2015ADDIS ABABA
ABC Research Alert
ABC Research Alert, Vol 5, No 1 (2017) ISSN 2413-5224

Taxpayers’ tax compliance Behavior: Business Profit taxpayers’ in Addis Ababa (2015)
ii
ADDIS ABABA UNIVERSITYSCHOOL OF GRADUATE STUDIES
Statement of Declaration
This is to certify that the thesis prepared by Geletaw Tsegaw Tessema entitled: “Taxpayers’ tax
compliance behavior - Business Profit taxpayers’ of Addis Ababa city” and submitted to in partial
fulfillment of the requirements for the degree of master of science in Accounting and Finance;
complies with the regulations of the university and meets the accepted standards in respect of
originality and quality.
Signed by the examining committee:
Advisor:
Dr. Abebe Yitayew Signature: ________________ Date: ___________
Examiners:
Dr. Alem Hagos Signature: ________________ Date: ___________
Dr. Laxmikantha Padakanti Signature: ________________ Date: __________
______________________________________________________________________________
(Chairman of the Department ofGraduate Program) Signature: __________________ Date___________

Taxpayers’ tax compliance Behavior: Business Profit taxpayers’ in Addis Ababa (2015)
ii
Acknowledgement
I am heartily thankful to my advisor, Dr. Abebe Yitayew, whose encouragement, guidance
and support from the initial to the final level enabled me to develop an understanding of the
subject. His insightful guidance and meticulous accuracy were instrumental in shaping this
work into its final form.
This thesis would not have been possible without constant participations of Addis Ababa
City business profit taxpayers’. Their enthusiasm to take part in both the surveys and
interviews contributed significantly to the success of this study.
My gratitude is also extended to the following that have helped me in finalizing this study
and data search: Ethiopian Revenue and Custom Authority (ERCA) and Addis Ababa City
Tax Administration office. Particularly My thanks go to my friends who continually
supported me for searching of data and provision of valuable advises at the time of
undertaking this research paper.
Finally, yet importantly, without the unconditional love and support of my family, I could
have never accomplished this research paper. In this respect, I am deeply grateful to my
parents who have been motivating and praying for my success especially my father Ato
Tsegaw Tessema and my mother Achamyelesh Yimam. To the above-mentioned people
and to those who have not been mentioned, your sacrifice and encouragement are greatly
appreciated and will always be in my memory.

Taxpayers’ tax compliance Behavior: Business Profit taxpayers’ in Addis Ababa (2015)
iii
Abstract
This paper attempted to reveal determinants of taxpayers’ tax compliance behavior. Six tax
compliance determinants were examined; the examined tax compliance determinants were: tax
knowledge; feeling of fairness; the influence of peer groups; income level of taxpayers;
detection & punishments and perception on government spending. The study adopted a mixed
method research approach to test the proposed hypotheses and to answer research questions.
The data has been collected from 225 business profit taxpayers of those 200 were through
distributing of self-administered questionnaires and the remaining 25 through in-depth-
interviews. The latest statistical package (SPSS) software, correlation and regression analysis,
were used to analyze the survey and thematic analysis was applied to the in-depth interviews.
The results of this combined research methodology suggest that Addis Ababa City business
profit taxpayers tax compliance behavior have been highly and significantly affected by tax
knowledge; feeling of fairness; the influence of peer groups; income level of taxpayers and
detection & punishments variables while confidence in government spending doesn’t have as
such significant impact on tax compliance behavior of businesses. The analysis focuses on tax
compliance and its determinants and is therefore subject to an underlying assumption of tax
payers' understanding of tax and other potentially relevant information. The results of this study
also provide specific insights and allow policy makers to gain a better understanding of the key
variables that are significantly associated with tax compliance and enable them to implement
suitable strategies to minimize potentially damaging factors, and should also allow them to
improve their government’s tax revenue collections. Such a study becomes imperative given
limited research so far undertaken in the area. The present study may also be utilized to provide
further information to assist tax authorities in designing full-fledged tax policies and in
improving their respective tax collection mechanisms.
Keywords: Tax Compliance Behavior, Tax non-compliance, Tax evasion, Business ProfitTaxpayers’, Tax avoidance, Tax compliance Opportunity, Attitudes and perceptions.
Taxpayers’ tax compliance Behavior: Business Profit taxpayers’ in Addis Ababa (2015)
iv
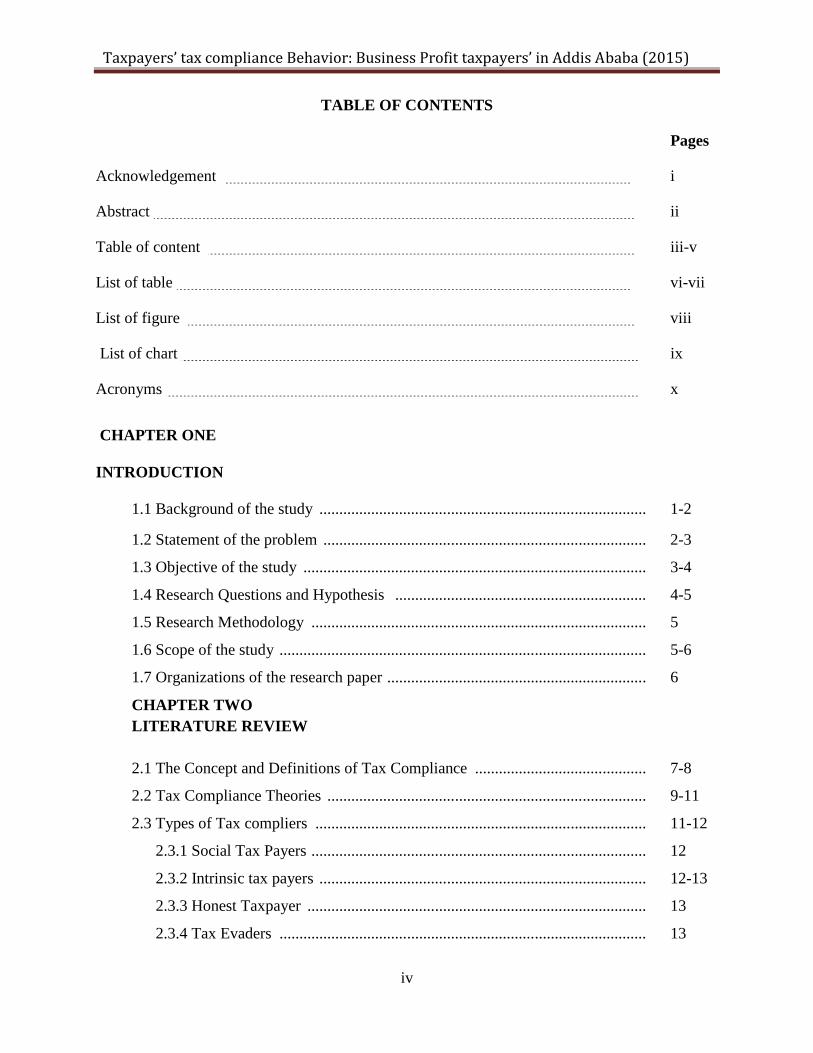
TABLE OF CONTENTS
Pages
Acknowledgement i
Abstract ii
Table of content iii-v
List of table vi-vii
List of figure viii
List of chart ix
Acronyms x
CHAPTER ONE
INTRODUCTION
1.1 Background of the study .................................................................................. 1-2
1.2 Statement of the problem ................................................................................. 2-3
1.3 Objective of the study ...................................................................................... 3-4
1.4 Research Questions and Hypothesis ............................................................... 4-5
1.5 Research Methodology .................................................................................... 5
1.6 Scope of the study ............................................................................................ 5-6
1.7 Organizations of the research paper ................................................................. 6
CHAPTER TWOLITERATURE REVIEW
2.1 The Concept and Definitions of Tax Compliance ........................................... 7-8
2.2 Tax Compliance Theories ................................................................................ 9-11
2.3 Types of Tax compliers ................................................................................... 11-12
2.3.1 Social Tax Payers .................................................................................... 12
2.3.2 Intrinsic tax payers .................................................................................. 12-13
2.3.3 Honest Taxpayer ..................................................................................... 13
2.3.4 Tax Evaders ............................................................................................ 13

Taxpayers’ tax compliance Behavior: Business Profit taxpayers’ in Addis Ababa (2015)
v
2.4 Tax Compliance Cost ...................................................................................... 13-14
2.5 Tax Compliance Benefits ................................................................................ 14-15
2.6 Improving Tax Compliance ............................................................................ 15
2.6.1 Accountable and Transparent Administration ........................................ 15
2.6.2 Tax Amnesties ......................................................................................... 15-16
2.6.3 Incentives and Tax Concessions ............................................................. 16-19
2.7 Factors Determining Tax Compliance Behaviour ............................................. 19
2.7.1 Demographic factors ............................................................................... 19-20
2.7.2 Non-compliance opportunity .................................................................... 20
2.7.3 Attitudes and perceptions ......................................................................... 20
2.7.4 Tax System/structure ................................................................................ 20-21
2.7.5 Socio-economic and psychological factors .............................................. 21
2.8 Relationships between Tax Compliance, Tax Morale and Tax Attitudes ........ 21
2.8.1 Tax Payers Attitudes and Compliance ..................................................... 21-23
2.8.2 Tax Morale and Attitudes ......................................................................... 23
2.9 A review of Ethiopian tax system ..................................................................... 23-25
2.10 A review of empirical studies .......................................................................... 25-28
2.11 Conclusions and knowledge’s gap .................................................................. 28
2.12 Conceptual framework of the study…………………………………………. 29
CHAPTER THREERESEARCH DESIGN3.1 Hypotheses and research questions ................................................................... 30-37
3.2 Research Approaches ........................................................................................ 37-38
3.2.1 Quantitative Research Approach .............................................................. 38-39
3.2.2 Qualitative Research Approach ................................................................ 39
3.2.3 Mixed Research Approach ....................................................................... 39-40
3.3 Research Method Adopted ................................................................................ 40
3.3.1 Quantitative aspect-Survey design (self-administered questionnaires) .... 41-46
3.3.2 Qualitative Approach- in depth interviews .............................................. 47
3.3.3 Data Analysis ........................................................................................... 48
3.3.3.1 Non-response bias and response representativeness
For quantitative aspect ........................................................................... 48-49

Taxpayers’ tax compliance Behavior: Business Profit taxpayers’ in Addis Ababa (2015)
vi
3.3.3.2 Descriptive Analysis and multiple regression models .......................... 49-50
3.3.3.3 Definition and Variable Measurement ................................................. 50-53
3.4 Conclusions and the relationship between research question/ hypotheses
and sources of data ........................................................................................... 54-55
CHAPTER FOURRESULTS AND ANALYSIS4.1 Results 56
4.1.1 Survey result 564.1.1.1 Respondents’ profile 56-594.1.1.2 The tax system and its impacts on tax compliance behaviour
Of businesses 604.1.1.3 Specific factors affecting taxpayers tax compliance
Behaviour 61-744.1.2 Correlation among variables 74-754.1.3 Multiple regressions Analysis 75-774.1.4 Stepwise Multiple regressions Analysis 77-794.1.5 In-depth interview results 79-81
4.2 Analysis 81-884.3 Conclusions 88
CHAPTER FIVECONCLUSIONS AND RECOMMENDATIONS5.1 Major findings/Conclusions 89-905.2 Recommendations 91-925.3 Contribution and implications of the study 92-935.4 Limitations of the research 93
References 94-99APPENDICES:Appendix 1- Taxpayers survey instrument (English Version) 101-106Appendix 2- Taxpayers survey instrument (Amharic Version) 107-113Appendix 3- In-depth Interviews 114Appendix 4- SPSS Data Outputs 115-116

Taxpayers’ tax compliance Behavior: Business Profit taxpayers’ in Addis Ababa (2015)
vii
List of tables
Pages
Table 1: Total Number of Tax payers as per their Respective Categories………….......... 44
Table 2: Number of tax payers as per their categories and their
Respective sub-cities……………………………………………………………. 44
Table 3: selected sub-cities to distribute Questionnaires…………………………............ 46
Table 4: Variables description and expected associations with
The level of tax compliance…………………………………………….............. 53
Table 5: Relation between the research question/ hypotheses and source of data……….. 55
Table 6: Sectors distribution survey of respondents…………………………………….. 57
Table 7: Forms of business ownership…………………………………………………… 57
Table 8: Respondents’ turnover for the 2014/15 fiscal year……………………………... 58
Table 9: Respondents’ positions………………………………………………….............. 58
Table 10: Respondents educational background…………………………………………. 59
Table 11: Sources of knowledge…………………………………………………………. 59
Table 12: Tax payers tax compliance behaviour………………………………................. 60
Table 13: Reasons for tax non-compliance……………………………………… ……… 60
Table 14: The impact of tax knowledge on the tax compliance
Behaviour taxpayers’……………………………………………..................... 62
Table 15: The impact of feeling of fairness on the tax compliance
Behaviour of taxpayers’………………………………………….................... 63
Table 16: Factors explaining feeling of fairness in the tax compliance
Behaviour……………………………………………………………………… 64
Table 17: The impact of peer groups on the tax compliance
Behaviour of businesses….…………..….………………………...................... 65
Table 18: Factors explaining the influence of peer groups in
Tax compliance behaviour……………………..…..…………....………..….... 66

Taxpayers’ tax compliance Behavior: Business Profit taxpayers’ in Addis Ababa (2015)
viii
Table 19: The impact of Income Level of taxpayers on the
Tax compliance behaviour…………………................................................. 68
Table 20: Factors explaining Income Level of tax payers in the
Tax compliance behaviour……………………………………………………..69
Table 21: The impact of detections and punishments on the
Tax compliance behaviour………………………….……….......................... 70
Table 22: Factors explaining Detection and Punishments in
Tax compliance behaviour…………………………………………….……....71
Table 23: The impact of government spending on the
Tax compliance behaviour……………………………….............................. 73
Table 24: Factors explaining Government spending in the
Tax compliance behaviour………………………………………….................74
Table 25: Pearson correlation Matrix…………………………………………................75
Table 26: Summary of the Standard Regression Model……………………....................76
Table 27: Summary of the Stepwise Regression Model…………………………………78
Table 28: Summary of responses on tax compliance behaviour…………………………79
Table 29: Response on tax knowledge and understanding of the tax system....................80

Taxpayers’ tax compliance Behavior: Business Profit taxpayers’ in Addis Ababa (2015)
ix
List of figure
Figure 1- Economic and non‐economic factors for tax compliance……………………29

Taxpayers’ tax compliance Behavior: Business Profit taxpayers’ in Addis Ababa (2015)
x
List of chart
Chart 1- Categories of Taxpayers and their distribution in their
Respective sub-cities (i.e. based on their rank from 1up to 4)……………….45

Taxpayers’ tax compliance Behavior: Business Profit taxpayers’ in Addis Ababa (2015)
xi
Acronyms
BF Belief of Fairness
CA Category A
CB Category B
CC Category C
DP Feeling of Detection and Punishments
DP Feeling of Detection and Punishments
ERCA Ethiopian Revenue and Custom Authority
ETB Ethiopian Birr
GDP Gross Domestic Product
GERD Great Ethiopian Renaissance Dam
GS Confidence in government spending
GTP Growth and Transformation Plan
IL Income Level
IR Tax Compliance
PAYE Pay as You Earn
PG Peer Group influences
SS Sample Size
TC Inland Revenue
TK Tax Knowledge
VAT Value Added Tax

Taxpayers’ tax compliance Behavior: Business Profit taxpayers’ in Addis Ababa (2015)
1
Chapter One: Introduction
1.1Background of the study
The issue of taxpayers’ tax compliance behavior has evoked great attention among many
revenue authorities in the world. Questions about tax compliance are as old as taxes
themselves and will remain an area of discovery as long as taxes exist. To understand the
impact of a tax system, it is important to know who complies with the tax law as well as who
does not. Tax non-compliance is a large and growing problem in almost all countries.
Unfortunately, we know very little about tax morale. Economists see the problem as one of
rational decision made under uncertainty. This means that cheating on taxes is a gamble
paying off in lower taxes or, with the probability of detection, ending in sanctions. This view
of taxpayer behavior was first presented in a formal model by Allingham and Sandmo (1972),
influenced by the economics-of-crime approach. Nevertheless, such a portfolio analysis can’t
explain why many households comply more fully than predicted by this approach. A lot of
economic approaches to tax compliance continue on this framework. Tax compliance is a
finally observable action.
Complying or not is not only a function of opportunity, tax rates, and probability of detection,
but also the function of an individual’s willingness to comply or evade. When the tax morale
is high, tax compliance will be relatively high too. Compliance decisions must be affected by
other factors. How can moral rules and sentiments directly guide tax morale? In the literature
we find psychological theories which are discussed in the context of tax morale. It may seem
astonishing, but a lot of people do comply with the rules and laws. Kelman’s (1958) work,
adapted to tax compliance by Vogel (1974), illustrates how people comply for different
reasons. “Compliers” pay their taxes, because people are required to do so and fear the
consequences if they do not. “Identifiers” are influenced by social norms and the beliefs and
behaviors of people close or of importance to them. “Internalizers” have a consistency
between their beliefs and their behavior.
In additions to this, tax non-compliance has, for a long time, been a challenge to tax officials
in executing their role as revenue collectors for the state. Failure to comply with tax

Taxpayers’ tax compliance Behavior: Business Profit taxpayers’ in Addis Ababa (2015)
2
regulations in the country is not only a denial of the state of its needed revenue for
developmental projects, but also a discouragement to others to comply. According to Terkper
(2003), legitimate taxpayers in the formal sector perceive the state as being unfair in pursuing
them for taxes while the informal sector continues to operate untaxed. Ignoring informal
sector activities will lower compliance morale and increase the risk of generalized non-
compliance.
Therefore, this paper assesses the motives behind complying with the tax legislations i.e. what
shapes business profit taxpayers’ attitudes to comply with the tax laws? What benefit they
receive if they comply with the tax legislations? and what are the risks of non-compliance by
focusing on Addis Ababa city administration business profit tax payers.
1.2 Statement of the Problem
The Ethiopian government under the auspices of the Growth and Transformation plan (GTP)
has been undertaking initiatives to stimulate and sustain the long run growth and development
of the country’s economy. It’s believed that, this medium term economic endeavor will bring
a tremendous change in the country’s economy. As part of the GTP initiatives, the
government has undertaking mega budget projects by selecting priority sectors. Due to this
fact, revenue mobilization has becoming a great concern of government in recent years.
However, the issue of non-compliance, tax avoidance and tax evasion has posing a serious
challenge for the tax and revenue authorities.
The domestic tax bases in most African countries are undermined by widespread tax
avoidance and evasion. Although taxpayers’ non-compliance is a continual and growing
global problem and studies suggest that developing countries, many of them in Sub-Saharan
Africa, are the hardest hit. For instance, in Ethiopia non-compliance in the tax administration
system can be exhibited in different economic indicators. These include persistent low tax to
GDP ratio. In spite the fact that the Ethiopian economy is growing fast where in double digit,
it has continued generating low tax revenues by far low even as compared with sub-Saharan
Africa countries (World Bank 2010). Therefore, dealing with the problem of non-compliance
requires an understanding of the factors underlying taxpayers’ decision about whether to pay

Taxpayers’ tax compliance Behavior: Business Profit taxpayers’ in Addis Ababa (2015)
3
or evade taxes. Better understanding of taxpayer behavior can be expected to place revenue
bodies in a stronger position to design and implement effective compliance strategies, which
contributes to the sustainability of taxation systems.
In Ethiopia, the issues of tax compliance behavior have not been significantly investigated.
However, the study conducted by Tilahun Aemiro et.al (2014) revealed that perception on
government spending; equity and fairness of the tax system; penalties; personal financial
constraints; changes on current government policies; and referral group (friends, relatives etc.)
as factors that significantly affects the tax compliance behavior. Notwithstanding, this study
has also ignored tax knowledge as a determining factor in affecting the tax compliance
behavior of business profit tax payers. In additions to this, Suresh Vadde (2014) investigated
only a certain factors as determinants of taxpayers’ voluntary compliance. This study
neglected some of the factors (i.e. detection and punishments) which contribute its part in
affecting the tax compliance behavior of business profit tax payers.
Therefore, this paper assesses factors that affects taxpayers’ tax compliance behavior and
what shapes their attitude to comply with the tax legislations while the benefits of non-
compliance is outweighing in the case of business profit tax payers operating in Addis Ababa
city Administration . As per Fishers et.al (1992) tax compliance behavior have been affected
by different factors and some of them are intrinsic to individuals own motives and others are
external to different situations. As a result, assessing those factors in the context of Ethiopia
helps policy makers and tax authorities to better understand the behaviors of the taxpayers and
develop and design full-fledged tax policies and procedures.
1.3 Objectives of the study
1.3.1 General objective
In the context of the problems and research questions highlighted above, the broad objective
of the study is to assess factors affecting tax compliance behaviour of businesses profit tax
payers operating in Addis Ababa City Administrations. Thus, this paper tries to answer the
motives behind complying or not with the tax legislations.

Taxpayers’ tax compliance Behavior: Business Profit taxpayers’ in Addis Ababa (2015)
4
1.3.2 Specific objectives
The specific objectives are;
To investigate factors affecting the taxpaying attitudes of business profit tax payers.
To determine the factors motivating business profit taxpayers to comply with the tax
legislations.
To assess efforts made by tax authorities in inspiring people to comply with the tax
legislations.
To identify the risks encountered by business profit tax payers because of non-
compliance with the tax legislations.
1.4 Research Question and Hypothesis of the study
In order to achieve the above broad objectives, the researcher had developed one research
questions and six hypotheses.
Why business profit tax payers comply with the tax legislations while the benefits of non-
compliance is outweighing?
Hypothesis 1:
Tax knowledge (demographic factor) affects the taxpaying attitudes of business profit tax
payers operating in Addis Ababa city administrations.
Hypothesis 2:
Belief in fairness (attitude & perception factor) affects the tax compliance behavior of
business profit tax payers.
Hypothesis 3:
Influences of the peer groups (attitudes & perception) positively and significantly affects the
tax compliance behavior of business profit tax payers.
Hypothesis 4:
Income level of tax payers does have positive and significant impact on the tax compliance
behaviors of business profit tax payers.

Taxpayers’ tax compliance Behavior: Business Profit taxpayers’ in Addis Ababa (2015)
5
Hypothesis 5:
Feeling of detection and punishments by the tax authorities does have significant impact on
the tax compliance behaviors of business profit taxpayers.
Hypothesis 6:
Taxpayer’s confidence in government spending significantly affects the tax compliance
behavior of business profit tax payers.
1.5 Research Method
The researcher adopted mixed research approaches in order to assess factors that affect tax
compliance behavior of businesses operating in Addis Ababa city administration. This mixed
research approach helps to gather data that could not be obtained by adopting a single method.
While acknowledging an important contribution of a mixed method approach in taxation
studies, McKerchar (2010) also highlights several reasons behind the use of such an approach.
The first is the need to address different objectives of the study, which cannot be achieved by
a single method. The second reason is to enable one approach to inform another approach,
either in design or in interpretation. The third reason is to triangulate the findings of different
approaches (either performed concurrently or sequentially) in an effort to provide greater
confidence to the study.
Based on the above researcher recommendations, it appears that the main reason for the
researcher to adopt a mixed method approach is to enable one approach to inform another
approach in the interpretation of the overall results. To be consistent with this approach, the
researcher has been employed survey and interviews as a major research tools. Those methods
were carried out sequentially with the intention that the interviews were enriching the findings
in the survey. The researcher used both primary and secondary data’s in order to analyze the
research. The primary data were collected through questionnaire and interview while the
secondary data has been collected from tax authorities, websites and different books.
1.6 Delimitation/Scope of the study
The primary aim of this study is to examine factors affecting taxpayers’ tax compliance
behavior. In doing so, the researcher encountered non-response rate of 23.5%. This non-

Taxpayers’ tax compliance Behavior: Business Profit taxpayers’ in Addis Ababa (2015)
6
response rate has been registered because some of the respondents are not aware of the issue
of tax compliance behavior and; most of the questions are related with individuals own
intrinsic and extrinsic motives. Moreover, many business owners’ lacks proper educational
background and expertise in order to easily understand and respond to the questionnaire and
interviews.
1.7 Organization of the Research
The thesis focuses on the examination of taxpayers’ tax compliance behavior by focusing on
Addis Ababa City Administration business profit taxpayers. Therefore, the paper has been
structured as follows. Chapter 2 contains a review of the literature including tax compliance
theory; factors determining tax compliance behavior and its relationships with tax morale and
attitudes; a review of Ethiopian tax system and past studies and research gaps. The research
design and methodology are presented in chapter 3. Chapter 4 presents the results of survey
and in-depth interviews subsequently this is followed by an analysis of the results of the
different methods concurrently. That is, the findings of all the different methods adopted in
this study are pooled together, the research question is answered, and hypotheses tested.
Finally, chapter 5 presents an overview of the thesis and its major findings, recommendation,
contribution to the literature, and tax authorities and limitation of the research.

Taxpayers’ tax compliance Behavior: Business Profit taxpayers’ in Addis Ababa (2015)
7
Chapter Two: Review of Related Literature
In light of the above, the purpose of this chapter is to review the literature in the area of “tax
payers’ tax compliance behaviour”. This review of the literature establishes the framework for
the study and highlights the apparent strengths and weaknesses of the previous studies, which
in turn helps to clearly identify the gap in the literature and formulating the research question
for the study.
2.1 The Concept and Definitions of Tax Compliance
Tax compliance is a major problem for many tax authorities and it is not an easy task to
persuade taxpayers to comply with tax requirements even though tax laws are not always
precise. The exact meaning of tax compliance has been defined in various ways. For example,
Andreoni et.al (1998) claimed that tax compliance should be defined as taxpayers’ willingness
to obey tax laws in order to obtain the economy equilibrium of a country.
A wider definition of tax compliance, defined in 1978 by Song and Yarbrough suggested that
due to the remarkable aspect of the operation of the tax system in the United States and that it
is largely based on self assessment and voluntary compliance, tax compliance should be
defined as taxpayers’ ability and willingness to comply with tax laws which are determined by
ethics, legal environment and other situational factors at a particular time and place.
Furthermore, tax compliance has also been segregated into two perspectives, namely
compliance in terms of administration and compliance in terms of completing (accuracy) the
tax returns. Compliance in pure administrational terms therefore includes registering or
informing tax authorities of status as a taxpayer, submitting a tax return every year (if
required) and following the required payment time frames.
In contrast, the wider perspective of tax compliance requires a degree of honesty, adequate tax
knowledge and capability to use this knowledge, timeliness, accuracy, and adequate records in
order to complete the tax returns and associated tax documentation.
This perspective further reveals, although it is inevitable that tax authorities will seek to
‘influence’ the areas taxpayers have influence over determining to reduce the risks of non-

Taxpayers’ tax compliance Behavior: Business Profit taxpayers’ in Addis Ababa (2015)
8
compliant behavior they face otherwise e.g. through continuously conducting tax audits of
different sorts and other means such as various compliance influencing activities including tax
education. Some authors have viewed tax compliance from a different perspective. For
example, Allingham and Sandmo (1972) described tax compliance as an issue of ‘reporting an
actual income’ and also claimed that tax compliance behavior was influenced by a situation
whereby taxpayers have to make a decision under uncertainty Clotfelter (1983) i.e. either
taxpayers would enjoy tax savings due to under-reporting income or have to pay tax on the
undeclared amount at a penalty rate which is higher than they would have paid had the income
been fully declared at the correct time. McBarnet (2001) suggested tax compliance should be
perceived in three ways, namely;
a) Committed compliance - taxpayers’ willingness to pay taxes without complaint;
b) Capitulative compliance - reluctantly giving in and paying taxes and
c) Creative compliance – engagement to reduce taxes by taking advantage of possibilities to
redefine income and deduct expenditures within the bracket of tax laws.
Some literatures characterize and explain tax compliance as the output of interrelation among
variables including perception of equity, efficiency and incidence (public finance views). Tax
enforcement aspects like penalties and the probability of detection also relate to tax
compliance while other labor market behavior factors including an individual’s wages and tax
bracket also contribute to tax compliance (Kirchler 2007).
In contrast with tax compliance, tax non-compliance is defined as taxpayer’s failure to remit a
proper amount of tax, perhaps on account of the complexity or even contradictions in the tax
legislation or tax administration procedure. Non-compliance is also perceived as the failure of
a taxpayer to report (correctly) the actual income, claim deductions and rebates and remit the
actual amount of tax payable to the tax authority on time Kirchler (2007). Furthermore, it has
been defined as failure to comply with tax laws and/or report incorrect income, the act of
claiming incorrect deductions, relief and rebates and/or paying the incorrect amount of tax
beyond the stipulated time frame.

Taxpayers’ tax compliance Behavior: Business Profit taxpayers’ in Addis Ababa (2015)
9
2.2 Tax Compliance Theories
Models of taxpayer behavior, including the decision whether or not to pay taxes, tend to
reflect one of five theories that can be referred to as: (1) economic deterrence; (2) fiscal
exchange; (3) social influences; (4) comparative treatment; and (5) political accountability.
These are to some extent interconnected, and some represent an evolution of others.
Economic deterrence
The economic deterrence theory states that taxpayer’s behavior is influenced by factors such
as the tax rate determining the benefits of evasion, and the probability of detection and
penalties for fraud which determine the costs (Allingham and Sandmo 1972; Becker 1968).
This implies that if detection is likely and penalties are severe, few people will evade taxes. In
contrast, under low audit probabilities and low penalties, the expected return to evasion is
high. The theoretical principles of economic deterrence have also been widely adopted by tax
administrations when developing enforcement strategies that rely principally on penalties and
the fear of getting caught.
Fiscal exchange
The fiscal exchange theory suggests that the presence of government expenditures may
motivate compliance and that governments can increase compliance by providing goods that
citizens prefer in a more efficient and accessible manner. Alm et al. (1992) note that
compliance increases with (perceptions of) the availability of public goods and services.
Accordingly, the main concern of taxpayers is what they get directly in return for their tax
payments in the form of public services (quid pro quo). In this perspective, taxation and the
provision of public goods and services are interpreted as a contractual relationship between
taxpayers and the government (Moore 2004). Individuals may pay taxes because they value
the goods provided by the government, recognizing that their payments are necessary both to
help finance the goods and services and to get others to contribute (Fjeldstad and Semboja
2001).
Taxpayers’ tax compliance Behavior: Business Profit taxpayers’ in Addis Ababa (2015)
10
The existence of positive benefits may increase the probability that taxpayers will comply
voluntarily, without direct coercion. Although most taxpayers cannot assess the exact value of
what they receive from the government in return for taxes paid, it can be argued that they have
general impressions and attitudes concerning their own and others’ terms of trade with the
government (Richupan 1987). It is then reasonable to assume that a taxpayer’s behavior is
affected by his/her satisfaction or lack of satisfaction with his/her terms of trade with the
government.
Social influences
In the social influence model, compliance behavior and attitudes towards the tax system is
thought to be affected by the behavior and social norms of an individual’s reference group
(Snavely 1990). It is reasonable to assume that human behavior in the area of taxation is
influenced by social interactions much in the same way as other forms of behavior (ibid).
Compliance behavior and attitudes towards the tax system may therefore be affected by the
behavior of an individual’s reference group such as relatives, neighbors and friends.
Therefore, if a taxpayer knows many people in groups important to him who evade taxes,
his/her commitment to comply will be weaker.
On the other hand, social relationships may also help deter individuals from engaging in
evasion in fear of the social sanctions imposed once discovered and revealed publicly.
Theoretical research on herd behavior in economic situations (Banerjee 1992) also indicates
that social influences may affect compliance, in particular by affecting the perceived
probability of detection. One of the most consistent findings about taxpayer attitudes and
behavior in Western countries is that those who report compliance believe that their peers and
friends (and taxpayers in general) comply, whereas those who report cheating believe that
others cheat (Yankelovich et al. 1984). Evidence suggests that perceptions about the honesty
of others may affect compliance behavior.
Comparative treatment
The comparative treatment model is based on equity theory and posits that addressing
inequities in the exchange relationship between government and taxpayers would result in

Taxpayers’ tax compliance Behavior: Business Profit taxpayers’ in Addis Ababa (2015)
11
improved compliance (McKerchar and Evans 2009). Citizens may not consider their
relationship with the state in a vacuum where both parties are the only actors. Likewise, they
may not think about their fellow citizens without considering their own relationship with the
state. They may also consider how the state treats them relative to their fellow citizens. This
judgment is likely to affect not only their judgment of the state, but also how they view their
fellow citizens. If the state treats certain groups preferentially, this may color the citizen’s
relationship with the state and the group receiving favors. A crucial variable is then not just
what a person gets from the state, but what the person gets from the state (and how the state
treats the person) relative to those who are in the person’s wider national community. This
social psychology model highlights the importance of equity theory in the study of
compliance and taxpayer behavior.
Political legitimacy
Finally, according to the political legitimacy theory, tax compliance is influenced by the
extent that citizens trust their government (Tayler 2006; Kirchler et al. 2008; Fauvelle‐Aymar
1999). Legitimacy could be described as belief or trust in the authorities, institutions, and
social arrangements to be appropriate, proper, just and work for the common good. Political
scientists have addressed how political legitimacy and civic identification are fostered.
(Persson 2008) argues that African countries that upon independence emphasized building
national over ethnic identity have been more successful than those who allowed ethnicity to
become the main animus of politics.
2.3 Types of Tax compliers
Kelman’s (1965) work, which was adapted to tax compliance by Vogel (1974), illustrates how
people can comply for different reasons. Compliance, identification and internalization are
Kelman’s tripartite typology. “Compliers” pay their taxes because people are required to do so
and fear the consequences if they do not. “Identifiers” are influenced by social norms and the
beliefs and behaviors of people close or of importance to them. “Internalisers” have a
consistency between their beliefs and their behavior. Benno Torgler (2003) in his dissertation

Taxpayers’ tax compliance Behavior: Business Profit taxpayers’ in Addis Ababa (2015)
12
(Tax morale) developed different kinds of taxpayers. For the purpose of this paper some of
them are depicted below:-
2.3.1. Social Tax Payers
“Social Taxpayers” are influenced by social norms, feel guilty when they under-report and
escape detection and feel ashamed when they under-report and get caught. Furthermore, they
are very sensitive to people’s belief, especially of those close to them. They react emotionally
and very strongly to perceived changes next to them. They can be seen as conditional
cooperators. If they perceive that others pay taxes they tend to pay them too. On the other
hand, a reduction of others’ contribution reduces their willingness to contribute. Satisfaction
and behavior are linked not only to the objective outcome levels, but also to outcomes
received in relation to those which were judged to be fair.
Furthermore, a perceived inequity between one’s own exchange and the exchanges others get
creates a sense of distress. Disadvantage in such situation causes anger, advantage; feelings of
guilt. Anger reduces the moral costs of evasion.
2.3.2 Intrinsic tax payers
Another type of taxpayer is the “Intrinsic Taxpayer”. The motivation of the “Intrinsic
Taxpayers” includes among others, the feeling of obligation, which motivates a person
without being forced. “Intrinsic Taxpayers” are sensitive to institutional factors, as e.g., the
behavior of governments or tax administrations. Positive actions by the state are intended to
increase taxpayers’ positive attitudes and commitment to the tax system, tax-payment, and
thus compliant behavior.
The way people are treated by the authorities affects their evaluations of authorities and their
willingness to co-operate. They have a certain intrinsic motivation to pay taxes. However, if
the intrinsic motivation is not recognized, intrinsic taxpayers get the feeling that they can as
well be opportunistic. When monitoring and penalties for noncompliance increase, individuals
notice that extrinsic motivation has increased, which on the other hand crowds out intrinsic
motivation to comply with taxes (see, e.g., Frey 1997). Their willingness to co-operate does

Taxpayers’ tax compliance Behavior: Business Profit taxpayers’ in Addis Ababa (2015)
13
not depend on the amount others contribute to the public good. Thus, they are not conditional
regarding the others’ contribution, but they depend on the institutional conditions under which
they must pay their taxes.
2.3.3 Honest Taxpayer
A third type of taxpayers is called “Honest Taxpayer”. These taxpayers do not even search for
ways to cheat at taxes. Their behavior does not respond to changes in the tax policy
parameters, as taxes, fine rates, or audit frequency. Thus, their behavior is not subject to a
marginal but rather an absolute evaluation (Frey 1997).
2.3.4. Tax Evaders
At the other extreme, there are the “Tax Evaders”. Relative price changes due to higher
punishment or higher audit probability are considered. In general they have low tax morale. It
can be argued that for these taxpayers the standard economic rational choice theory comes
into play. They compare the expected value of evading taxes with the value of being honest.
2.4 Tax Compliance Cost
Abdul-Jabbar and Pope (2008) define “tax compliance cost” as the cost incurred by taxpayers
to fulfill their statutory tax obligations, over and above their actual tax liability. “Tax
compliance costs”, according to Smulders et al (2012), include monetary costs, time costs,
psychological costs, and opportunity costs to taxpayers. In the literature the following types of
costs have been identified:
Efficiency costs (also called social costs) which refer to the cost of behaviour that is not
optimal and result from the tax system (Evans, 2008:452). An example is taxpayers’ altering
their investment decisions as a result of tax concessions that give preferential treatment to
certain activities.
Opportunity costs which refer to the opportunities that a taxpayer might have lost for other
benefits, with the money and time spent on complying with tax matters.

Taxpayers’ tax compliance Behavior: Business Profit taxpayers’ in Addis Ababa (2015)
14
Monetary costs refer to expenses incurred by taxpayers in respect of professional advisers
and in order to equip them, or their employees, with sufficient knowledge to understand and
comply with the tax laws.
Time costs refers to the time taxpayers and their employees spend on tax compliance
matters, such as filing returns, keeping records, etc.
Psychological costs include the stress, anxiety, frustration and dissatisfaction suffered by
taxpayers as a result of trying to comply with their tax obligations (Evans, 2008:451).
According to Smulders, et al. (2012) and with reference to businesses (rather than individuals
as taxpayers) “tax compliance costs include internal costs,… that is, the cost of collecting,
paying and accounting for tax on products or profits of the business, and on the wages and
salaries of employees together with the costs of acquiring the knowledge to enable this work
to be done; and external costs, mainly in the form of advisors costs – using professional tax
service providers is one of the main costs contributing to the cost of complying with taxation
legislation.”
2.5 Tax Compliance Benefits
Tax compliance does not entail only costs for the taxpayer. There are also tax compliance
benefits which need to be considered. Literature on “tax compliance benefits” categorized
these benefits into three broad categories, namely cash-flow benefits, managerial benefits, as
well as tax deductibility benefits (Smulders et al., 2012).
oCash-flow benefits are the benefits derived from the use of tax revenues for a period before
they must be paid over to the revenue authority, such as property tax collected by banks or
supermarkets, the deduction of “pay-as-you-earn tax” (PAYE) by employers and VAT by
vendors, before these are paid over to the relevant revenue authority (Smulders et al., 2012).
A further example is the benefit from the lawful delay that arises when the income received by
a taxpayer is not immediately or fully taxed on accrual or receipt.
oManagerial benefits are the benefits that may arise due to a requirement in terms of tax
legislation to maintain records, such as better recordkeeping, the use of technology, improved
knowledge of the financial affairs of the business in particular in the form of increased

Taxpayers’ tax compliance Behavior: Business Profit taxpayers’ in Addis Ababa (2015)
15
knowledge of their complex accounting information systems and improved business or
managerial decisions (Smulders et al., 2012).
oTax deductibility benefits are the benefits that arise when the income tax system permits
some tax compliance costs to be treated as a legitimate deduction for tax calculation purposes,
for example where the tax system permits a business a deduction for the services of their tax
practitioners and tax-related incidental expenses from their taxable income (Smulders, et al.,
2012).
2.6 Improving Tax Compliance
As Bird (2003) correctly points out, “assessing the relation between administrative effort and
revenue outcome is by no means a simple task”. Maximizing revenue is only one dimension
of the task of tax administration. How that revenue is raised, in other words the effect and
impact of the revenue-raising task in equity, the level of economic welfare as well as the
political fortunes of governments, may be as important. Rather than simply looking at the
amount of revenue raised, that is the level of collection, to measure the effectiveness or
success of a tax administration, a more accurate measure would be to measure the so-called
“compliance gap” which constitutes the gap between actual and potential revenues (Casanegra
de Jantscher and Bird, 1992). There are a lot of efforts that has been made by different
jurisdictions in order to improve the tax compliance behavior of tax payers and some of them
are depicted below:-
2.6.1 Accountable and Transparent Administration
A transparent and accountable tax administration that is service-oriented is likely to have a
positive impact on public trust. If the revenue is furthermore properly spent in terms of a
budget which the taxpayers find agreeable, compliance should increase.
2.6.2 Tax Amnesties
Governments periodically offer those who have not fully complied with their tax obligations a
period in which they can voluntarily correct past violations and not suffer the full penalties
that such violations would normally entail. Although revenue is a key attraction of amnesties,

Taxpayers’ tax compliance Behavior: Business Profit taxpayers’ in Addis Ababa (2015)
16
they are also sometimes used to address political goals, for example, as a measure to “put the
past behind us in order to move forward” (Bird, 2003). On the whole, the evidence is clear
that tax amnesties are seldom successful and should rather be avoided (Bird, 2003).
Tax amnesties are popular and therefore commonly encountered. They are especially
attractive to politicians who regularly (and somewhat short-sightedly) view an “amnesty as a
way to obtain revenue that was owed the government but would never have been collected
without the amnesty” (Mikesell and Birskyte, 2007:1058).
Apart from the importance of careful design, a tax amnesty will only be effective if the
taxpayer can be certain that the amount declared during the amnesty will not result in a future
investigation of possible tax evasion in years not covered by the amnesty (Bird, 2003).
Mikesell and Birskyte (2007) state that one-time amnesties may enhance voluntary taxpayer
compliance during the amnesty period, but that typical tax amnesties are unlikely to generate
significant amounts of new revenue in the long run. To be successful, an amnesty program
must do more than simply offer relief for past violations. These authors conclude: “It must
also change future behavior, both of the taxpayer and the government. If the likelihood of
getting caught, and thus penalized, rises after the program, then taxpayers are more likely to
take advantage of the temporary amnesty as a last chance opportunity. The design of a
successful amnesty might combine mild treatment of the evaders upon the disclosure with a
tougher expected enforcement regime.”
2.6.3 Incentives and Tax Concessions
Tax incentives and concessions are often used as measures to enhance revenues and overall
tax compliance. As Bird and Zolt (2003) point out – “many countries have sought to improve
their economy by introducing a variety of tax incentives for investment, for savings, for
exports, for employment, for regional development, and so on… Often, such incentives are
redundant and ineffective, giving up revenue and complicating the fiscal system without
achieving their stated objectives. Even to the extent that incentives may be effective in
inducing investors to behave differently than they would have done in response to market

Taxpayers’ tax compliance Behavior: Business Profit taxpayers’ in Addis Ababa (2015)
17
signals, the result is often distorting and inefficient, diverting scarce resources into less than
optimal uses.”
Tax incentives result in inequity as they purposely cause very uneven tax burdens, with
domestic companies often subject to full taxation, while foreign investors benefit from tax
incentives that reduce their effective tax rates (Bird and Zolt, 2003). These authors further
indicate that non-tax factors, such as a sound macroeconomic policy, good infrastructure and a
stable governance system are more important factors than tax concessions. Although there
may indeed be cases for some tax concessions, for example, to assist the small business
sector, “these tax incentives should be well-designed, properly implemented, and periodically
evaluated if they are to do more good than harm” (Bird and Zolt, 2003).
In an attempt to assist micro, small and medium-sized businesses to lower or minimize their
tax compliance costs and reduce their tax burden, governments often provide these enterprises
with a simplified tax regime and/or a variety of tax concessions (Smulders, et al., 2012).
These concessions can generally be classified into two main categories, namely –
positive concessions that provide a lower rate of taxation, an exemption from paying tax
or an accelerated tax deduction; and
relieving concessions that excuse the taxpayer from requirements otherwise imposed, for
example special registration thresholds for certain taxes (relieving taxpayers from
complying with a tax), simplified accounting rules and longer accounting periods (e.g.,
for VAT purposes).
Positive concessions have a direct impact on the tax burden, resulting in a reduction in, or
exemption from, tax liability. These concessions do not have a direct impact on tax
compliance costs. These concessions are generally elective and subject to complex qualifying
criteria and strict rules, which means they can be rather costly to understand and adopt
(Smulders et al., 2012). As complexity generally increases tax compliance costs (Bird and
Zolt, 2003; Mikesell and Birskyte, 2007), complex tax concessions may ultimately and rather
perversely, increase tax compliance costs.

Taxpayers’ tax compliance Behavior: Business Profit taxpayers’ in Addis Ababa (2015)
18
Relieving concessions can indeed have a direct impact on the tax burden, particularly in the
form of tax compliance costs. For instance, a specific tax registration threshold can preclude a
business from registering for a particular tax. In some cases, registration thresholds can also
arguably be regarded as positive concessions. This would occur when an exemption threshold
results in an exemption both from having to pay the tax (a positive concession) and from
having to comply with the obligations imposed by that tax (a relieving concession). If an
exemption threshold merely relieves the taxpayer from having to comply with administrative
compliance requirements, but does not provide tax exemption, it would be regarded as a
relieving provision only. A reduction in the number of tax payments that need to be made,
constitute a real concession. It could result in less time – whether internal and/or external –
being spent on a particular tax compliance obligation, which ultimately leads to a reduction of
tax compliance cost (Smulders et al., 2012).
Some jurisdictions have hoped to enhance revenues and voluntary compliance by granting
taxpayers a discount for early payment (McCluskey and Franzsen, forthcoming). If it is not
backed up with proper enforcement, it is not likely to be successful. The honest taxpayers who
have been paying in the past will benefit from the discount, and the tax evaders will still evade
the tax. The simple lesson is that incentives and concessions, as is the case with amnesties,
must be properly designed to ensure that only those who are meant to benefit, actually benefit
from the preferential treatment.
Too much political and/or administrative discretion to grant exemptions or other forms of tax
relief should also be avoided. These quickly erode the tax base and if tax rates are not
increased to recoup the revenue loss from the remaining taxpayers, which is seldom an
acceptable (political) option, the inevitable result is a decrease in tax revenues.
Discouraging non-compliance is only one aspect of improving compliance (Bird, 2003).
Treating taxpayers in a professional manner, in other words, more like customers rather than
like suspects or thieves, may do much more to promote and improve compliance (Bird, 2003;
Mikesell and Birskyte, 2007; Wang, 2010). Providing taxpayers with various payment options
(e.g. banks, supermarkets, internet, ward offices), easy filing, and assistance (e.g. on-line or at
shopping malls and sports stadiums) not only reduces actual compliance costs, but can reduce

Taxpayers’ tax compliance Behavior: Business Profit taxpayers’ in Addis Ababa (2015)
19
unintentional non-compliance. A professional and effective service-oriented tax
administration is crucial for improving tax compliance.
2.7 Factors Determining Tax Compliance Behavior
Fischer et al. (1992) stated there are four basic factors that determine tax compliance behavior
in his expanded model (Fischer Model). i.e., (i) demographic (e.g. - age, gender and
education) (ii) noncompliance opportunity (e.g. income level, income source and occupation),
(iii) attitudes and perceptions (e.g. fairness of the tax system and peer influence) and (iv) tax
System/structure (e.g. complexity of the tax system, probability of detection and penalties and
tax rates).
2.7.1 Demographic factors
The relationship between demographic variables and tax compliance has long been of interest
(Tittle, 1980). Three major personal characteristics for which there is evidence of a
relationship are age, gender, and education (Jackson and Milliron, 1986). The Fischer model
suggests that demographic variables indirectly affect taxpayer compliance by their impacts on
noncompliance opportunities and attitudes and perceptions. There is a positive link between
age and taxpayer compliance is reported (Jackson and Milliron, 1986). Generally they pointed
out young taxpayers are more willing to take risks and are less sensitive to sanctions as well as
age is a factor for intentional evaders, with younger taxpayers less complaint. In addition
noncompliance is significantly less common and of lower magnitude among householders in
which either the head or the heads spouse is over age of 65.
Early research (Tittle, 1980) testing the tax compliance level of males versus females reports
that females are more likely to tax compliance. Traditionally “females identified with
conforming roles, moral restraints, and more conservative life patterns” (Jackson and
Milliron, 1986). All these attributes may promote higher tax compliance. Education, as a
demographic variable relates to the taxpayers ability to comprehend and comply or not
comply with the tax laws (Groenland and Veldhoven, 1983). Two aspects of education
distinguished: “the general degree of fiscal knowledge and the degree of knowledge involving

Taxpayers’ tax compliance Behavior: Business Profit taxpayers’ in Addis Ababa (2015)
20
evasion opportunities” (Jackson and Milliron, 1986). They find that those with more fiscal
knowledge had more positive tax ethics scores than those with lower fiscal knowledge.
2.7.2 Non-compliance opportunity
In the Fischer model, noncompliance opportunity can affect taxpayer compliance directly
through income level, income source, and occupation. Almost all the theoretical model
indicates that as income rises, tax evasions should increase over most ranges (Andreoni et al.,
1998). In other way, the lower income group tends to have a lower proportion of tax
compliance by under-reporting income and by over-claiming expenses than their counterparts
in the higher income group. Taxpayers vary in terms of the opportunities available to them to
overstating expenses and understating incomes. Greater tax noncompliance opportunity is
generally resulted from self-employment and income sources not subject to withholding taxes.
Sutherland (1949) point out that tax evasion considered as a white-collar crime, committed by
an individual of respectability and high social status in the course of performing his
employment. In addition, almost all sole proprietors those who engaged in sales from fixed
locations (car dealerships, stores, restaurants etc) understated taxes by the greatest percentage.
2.7.3 Attitudes and perceptions
The Fischer model suggests two major considerations for altering taxpayer’s attitudes and
perceptions to tax compliance are the fairness of the tax system and peer influence.
Richardson (2006) it is widely believed by tax administrators and the taxpayers that growing
dissatisfaction with the fairness of tax system is the major causes for increasing tax
noncompliance. As well as Grasmick and Scott (1982) indicate that respondents with peers
who practice tax noncompliance are more likely to commit as well.
2.7.4 Tax System/structure
It is widely acknowledged that the extent of tax compliance in many developing countries has
been decreasing. The underdeveloped tax system/structure is one of the major causes for this
phenomenon. In the Fischer Model the effectiveness of tax system affected by complexity of
tax system, probability of detection, and penalties and tax rates. As the tax law has become

Taxpayers’ tax compliance Behavior: Business Profit taxpayers’ in Addis Ababa (2015)
21
increasingly complex, complexity has come to recognize as a possible reason for tax
noncompliance (Jackson and Milliron, 1986). In the context of tax compliance decisions,
complexity should include two dimensions, excessive detail in the tax rules and numerous
computations required. In addition, if there is a higher audit probabilities and severe penalties
encourage tax compliance. The third major construct of tax system/structure in the Fischer
model is tax rates; which reveal that the probability of underreporting and the level of
underreporting are positively related to the marginal tax rates.
2.7.5 Socio-economic and psychological factors
Culture considered as one of a powerful environmental factor that affects the taxpayer’s
compliance. Different social norms and ethical values will create different incentives for tax
compliance. These cultural differences may have a direct impact on ethical values and moral
development and ultimately affecting tax compliance decisions (Chan et al, 2000). In general,
the author has adopted the following charts after critically assessing the factors which is going
to affect the tax compliance behaviors of business profit tax payers.
2.8 Relationships between Tax Compliance, Tax Morale and Tax Attitudes
2.8.1 Tax Payers Attitudes and Compliance
According to Ajzen’s (1991) Theory of Planned Behavior, attitude relates to one’s own
personal views about a behavior. Attitude may also be defined as positive or negative views of
an “attitude object”; i.e. a person, behavior or event. Mowen (1987) in his book entitled
Consumer Behavior, defined attitudes as consisting of the following:-
o Attitudes are likes and dislikes.
o The "major characteristics that distinguish attitude from other concepts are its evaluative
or affective nature".
o Attitudes are the core of our likes and dislikes for a certain people, groups, situation,
object and intangible ideas.

Taxpayers’ tax compliance Behavior: Business Profit taxpayers’ in Addis Ababa (2015)
22
In relation to taxation, taxpayers’ attitudes may be defined as positive or negative views of tax
compliance behavior. The outcome of positive views is tax compliance and negative views are
tax non compliance. These views may be explained by Psychology-based theories which
reveal that taxpayers’ attitude may be influenced by the following factors which eventually
influence taxpayers’ behavior.
Individual attitudes toward compliance have been shown to be a function of social and
cultural norms. If such attitudes would carry over to actual compliance, enhancing these
norms, as through increasing overall trust in government, is a desirable policy instrument to
complement the usual enforcement options. The attitude of taxpayers varies considerably.
Some comply with the fullest extent required, irrespective of whether the IR is actively
auditing them or their industry. Other taxpayers essentially play the audit lottery and either do
not prepare contemporaneous documentation or prepare the absolute minimum with the hope
of avoiding the imposition of penalties.
An individual’s attitude towards tax system may predict (his tax compliance behavior).
Theoretically, attitude is a partial indication of behavior. Attitude towards an event, object,
function or person may be favorable or unfavorable. According to Ajzen (1991) and Fishbein
and Ajzen (1975), individual evaluates an event or object positively or negatively and positive
and negative evaluation is the main dominant characteristic of an individual’s attitude.
The payment of tax is obligatory duty of every citizen whether natural or corporate citizen. As
a civic duty, it is expected that citizens will voluntarily comply with such obligation but that is
not the case with some citizens. Studies have established relationship between attitudes of
taxpayers and compliance. The study of Eriksen and Fallan (1996) revealed that taxpayer’s
attitude towards tax system has influence on reinforced desire toward tax evasion and
compliance.
The study of Oriviska and Hudson (2002) examined the attitudes to tax evasion and reported
that evasion is condoned by large number of people who are particularly benefiting from it.
Eriksen and Fallan (1996) said that dimensions of attitude towards tax evasion include:

Taxpayers’ tax compliance Behavior: Business Profit taxpayers’ in Addis Ababa (2015)
23
attitude to one’s own tax evasion which is referred to as tax ethic, fairness of tax system,
attitude to other people’s tax evasion and attitude to general crime (Alabede et al., 2011).
2.8.2 Tax Morale and Attitudes
Tax morale, unlike tax evasion, measures not individual behavior but individual attitude. Tax
morale which is not a new notion but has received surprisingly little attention in the tax
compliance literature—can be defined as a moral obligation to pay taxes, a belief in
contributing to society by paying taxes. (Schmölders, 1970; Strümpel, 1969) tried to bridge
economics and social psychology by emphasizing that economic phenomenon should be
analyzed from a perspective larger than the traditional neoclassical point of view (e.g., Lewis,
1979, 1982). Tax morale is also closely linked to what have been termed taxpayer ethics, “the
norms of behavior governing citizens as taxpayers in their relationship with the government”
(Song and Yarbrough, 1978: 443).
A later empirical analysis found that, compared to other variables, tax morale had the
strongest significant impact on the size of the shadow economy (Weck, 1983). Torgler
(2003a) also found that tax morale significantly reduced tax evasion. However, these two
studies also treated tax morale as an exogenous residual. Thus, much extant research treats tax
morale as a black box or residuum rather than analyzing the factors that shape or maintain it
(Feld and Frey, 2002a).
2.9 A review of Ethiopian tax system
At the present time payment of taxes is obligatory in all civilized nations; where the rate or
imposition is at all dependent upon the taxpayer, the tax takes the form of a fee or payment for
contractual services. The working law on income taxation in Ethiopia, the Income Tax
Proclamation No. 286/2002, has classified sources of income into four schedules. Therefore,
income taxation in the country is undertaken based on these schedules, which have been
systematically classified as Schedule A (employment), Schedule B (rental of building),
Schedule C (income earned from business) and Schedule D (not categorized in any of the
three). However, our major concern under this topic is on Schedule C type of the tax system.

Taxpayers’ tax compliance Behavior: Business Profit taxpayers’ in Addis Ababa (2015)
24
Schedule C type of tax system further divided in to three sub category such as category A, B
and C.
Category “A” taxpayers
Category “A” taxpayers are composed of two groups. The first group comprises of those
taxpayers whose annual turnover for a single tax year is 500,000 or more. In addition, any
company incorporated under the laws of Ethiopia is a category “A” taxpayer irrespective of
their annual turnover. The rational for incorporating companies under category “A”
irrespective of their annual turnover seems to dwell upon the idea that given the present local
and international business environment by the time companies are established they must have
at least 500,000 as a starting capital. Category “A” taxpayers are required to keep books and
accounts.
Category “B” Taxpayers
Category “B” taxpayers are those taxpayers with annual turnover greater than 100,000 but less
than 500,000 Ethiopian Birr. Like category “A” taxpayers’, category “B” taxpayers are also
required to keep proper books and accounts. Nevertheless, the books and accounts to be kept
by category B taxpayers are less complicated compared to category ‘A’ taxpayers. Thus, they
are required to keep an account incorporating mainly profit and loss statements for the
particular year. Their income tax liability will be assessed based on the books and accounts
kept by the taxpayers. The same administrative penalties apply if Category “B” taxpayers fail
to keep books and accounts.
Category C taxpayers
Category “C” is the third and the last category. Small businesses are the main types of
businesses incorporated in this category .All taxpayers with annual turnover income less than
100,000 Ethiopian Birr are grouped as category C taxpayers. These categories of taxpayers
are not required to keep books and accounts. Their income tax liability will be determined
through a special procedure known as presumptive taxation. They are required to pay an

Taxpayers’ tax compliance Behavior: Business Profit taxpayers’ in Addis Ababa (2015)
25
income tax from their incomes they generate based on the schedules attached at the back of
the income tax regulation.
2.10 A review of empirical studies
The tax compliance literature has provided evidence suggesting that compliance is influenced
by numerous factors. Scholars identified these factors as economic, social and psychological
Kirchler (2007). To mitigate the challenge of tax non-compliance, it is necessary to
understand factors influencing an individual’s decision to comply with tax laws.
According to Kirchler (2007), tax compliance determinants are classified in to four categories.
The four categories are 1) economic factors (tax rates, tax audits and perceptions of
government spending); 2) institutional factors (the role of the tax authority, simplicity of the
tax returns and administration and probability of detection); 3) social factors (ethics and
attitude, perceptions of equity and fairness, political affiliation and changes on current
government policy, referent groups); and 4) individual factors (personal financial constraints,
awareness of offences and of penalties).
Tadesse Getachew et.al (2014) attempted to reveal determinants of taxpayers’ compliance
with the tax system. This study examined nine tax compliance determinants; the examined tax
compliance determinants were: probability of being audited; perception of government
spending; perception of equity and fairness; penalty, financial constraint; changes to current
government policies; referral group; the role of the tax authority; and tax knowledge. This
study used a cross-sectional survey method of research design. Given the scaled ranking
information of the dependent variable (tax compliance), an ordered probit was applied to
examine determinants of tax compliance in Mekelle city, Ethiopia. The study indicates that
tax compliance was influenced by the probability of being audited, financial constraints, and
changes in government policy.
In additions to this, Mohd Rizal Palil(2010) study also focuses on the level of individual
Malaysian taxpayers’ knowledge and explores how tax knowledge levels influence tax
compliance behavior in a new SAS. The results suggested that tax knowledge has a significant
impact on tax compliance even though the level of tax knowledge varies significantly among

Taxpayers’ tax compliance Behavior: Business Profit taxpayers’ in Addis Ababa (2015)
26
respondents. The results also indicate that tax compliance is influenced specifically by
probability of being audited, perceptions of government spending, penalties, personal
financial constraints, and the influence of referent groups. To test the hypotheses, the data
was analyzed using multiple regressions (Ordinary Least Squares (OLS)). Two measurements
of tax compliance behavior were tested (direct and hypothetical questions).
Furthermore, Merima Ali et.al (2013) examined the extent to which the different theories of
taxpayer compliance such as economic deterrence, Fiscal Exchange, Non-state Actors as
Service Providers, Social Influence, Comparative Treatment and Political Legitimacy and
Knowledge about Taxes has to contribute to explaining people’s attitude towards taxation. In
order to capture factors that correlate with tax compliance attitude.
Benno Torgler (2003) found a model validating the influence of detection, number of tax
auditors per taxpayer, penalty tax rate, individual tax rate, income class of a taxpayer and trust
in the government and confidence in the courts and the legal system on the tax moral . To
investigate the impacts of those variables on the tax moral; the author has been controlled the
influences of age, gender, education, marital status, employment status.
Frey and Feld (2002) also argue that tax morale is supported or even raised when tax officials
treat taxpayers with respect and on the other hand is reduced when the administration
considers taxpayers as individuals who have to be forced to pay the taxes: “The feeling of
being controlled in a negative way, and being suspected of tax cheating, tends to crowd out
the intrinsic motivation to act as an honorable taxpayer and, as a consequence, tax morale will
fall. In contrast, if the tax official makes an effort to find out the reason for the error by
contacting the taxpayer in an informal way (e.g. by phoning him or her), the taxpayer will
appreciate this respectful treatment and tax morale will be upheld”. They divide respectful
treatment into two components: (i) transparent and clear procedure by the tax administration,
(ii) as a direct personal component, how the taxpayers’ character is respected by tax
administrators. Their empirical analysis shows that a respectful treatment of taxpayers by the
tax administration reduces tax evasion.

Taxpayers’ tax compliance Behavior: Business Profit taxpayers’ in Addis Ababa (2015)
27
Other than this, Mohd Rizal Palil et.al (2013) also attempted to reveal the determinants of tax
compliance in Malaysia in a self-assessment system (SAS) with special emphasis on
individual taxpayers. Four tax compliance determinants are examined: the probability of being
audited; the perception of government spending; tax rates; and the role of the tax authority.
Allingham and Sandmo (1972) were the first researchers to conduct empirical analysis into
compliance behaviour of taxpayers and they came up with a model which became known as
A- S model. In the model, the compliance decision of taxpayers is considered to be affected
by income of the taxpayer, tax rate, probability of audit, and fine rate. However, factors
influencing compliance behaviour of taxpayers are far more numerous than suggested in the
A-S model (Alm, 1991; Jackson & Millron, 1986). Therefore, the authors underplayed the
influence of psychological and social factors including the demographic characteristics on
taxpayers’ behaviour.
Subsequently, in a comprehensive review study, Jackson and Millron (1986) came up with
fourteen key determinants for tax compliance and these determinants were later categorized
into four group determinants in the study of Fischer, Wartick and Mark (1992) and became
known as Fischer’s model of tax compliance. Demographic variables are within one of these
groups of determinants. The demographic factors in Fischer’s model include gender, age,
education, and income level and employment status.
As per a recent study on tax compliance in the business sector in South Africa, Wang (2010)
concluded that, generally, taxpayers’ decisions to comply (or not comply) are determined by
the following direct factors:
The complexity of the tax system (Mikesell and Birskyte, 2007);
Taxpayers’ confidence in government generally, but more specifically government
service provision and the cost-effectiveness of the provision of public goods and services,
as well as the level of fraud and corruption within government;
Taxpayers’ perception regarding the fairness of the entire tax system;
The social setting and societal norms; and
The effectiveness of tax authorities in detection and punishment of non-compliance.
Taxpayers’ tax compliance Behavior: Business Profit taxpayers’ in Addis Ababa (2015)
28
In general, by adopting a deductive approach on the review of the literature the following
section presents conclusions and knowledge gaps.
2.11 Conclusions and knowledge gaps
This chapter describes the relevant theories and factors that form the background of this study.
Based on the discussion, tax payers’ tax compliance behaviour have been affected by different
factors and all of them are categorized in to four broad groups such as demographic factors,
non-compliance opportunities, attitudes and perceptions and tax system or structure. A review
of past studies on tax compliance behaviour indicates mixed but interesting findings. Tax
compliance has been an important subject of research in a large number of developed and a
number of developing countries. Since each country has its own approach to managing tax
compliance levels and each has different tax laws and regulations, the factors impacting tax
compliance behaviour appear to vary among countries.
The Ethiopian government had developed a five year Growth and Transformation Plan and
has been working hard to achieve the planned economic growth of the country. In the GTP,
the government clearly stated that efforts will be geared towards promoting compliance and
equipping tax collection institutions with adequate enforcement power which will further
boost revenue mobilization at federal and regional levels. As a result, assessing factors which
determines tax compliance behaviour of businesses such as tax knowledge, fairness in the tax
system, confidence in government spending, detections and punishments, the influence of
peer groups and income level of taxpayers has to be investigated in order to increase the
income earning capability of the government and to improve the business environment by
encouraging voluntary compliance. In additions to this, many research’s have not been made
on the tax compliance behaviour of business operating in Addis Ababa city administration.
This gap leads to the main research question of the thesis. Why business profit tax payers
comply with the tax legislations while the benefits of non-compliance is outweighing? The
following chapter provides details of the research method in respect of the identified research
problems.

Taxpayers’ tax compliance Behavior: Business Profit taxpayers’ in Addis Ababa (2015)
29
2.12 Conceptual framework of the study
From the aforementioned literature review part of the paper, the author had adopted (i.e.
Fisher et.al 1992) the following conceptual frameworks for the study.
Figure 1- Economic and non‐economic factors for tax compliance

Taxpayers’ tax compliance Behavior: Business Profit taxpayers’ in Addis Ababa (2015)
30
Chapter 3: Research Design
The purpose of this chapter is to present the research question and hypotheses, the underlying
principles of research methodology and the choice of the appropriate research method for the
thesis. This chapter has been arranged as follows: Section 3.1 presents the hypotheses and
research question for the thesis. Section 3.2 presents the research approaches. This is followed
by the philosophy of quantitative (section 3.2.1), qualitative (section 3.2.2), and mixed
methods (along with discussion of the choice of the appropriate method for the current
research) (section 3.2.3) approaches. Then, the research methods adopted in this study has
been presented in section 3.3. Finally, conclusion and the relationship between research
question and hypotheses, and sources of data are presented in section 3.4.
3.1 Hypotheses and research question
As presented in chapter 1, the broad objective of these theses is to assess factors affecting tax
compliance behavior of businesses operating in Addis Ababa City administration. As per the
literature, taxpayers tax compliance behaviors have been affected by both intrinsic and
extrinsic factors. Therefore, the very purpose of this paper is to test those factors by applying
in Addis Ababa city administrations business profit tax payers. In regard with these
assumptions, the author had developed one research question and six hypotheses.
1) Why business profit taxpayers comply with the tax legislations while the benefits of non-
compliance is outweighing?
Citizens are obliged to make financial contribution in the form of tax payment to the
government. Apart from representing important sources of revenue to the government of most
countries, taxation is a useful fiscal tool for stabilizing national economy as well as
redistributing the national wealth. However, taxation can only perform these important
functions efficiently where taxpayers are willing to comply with tax laws of a country. But it
is widely acknowledged that some people do not like paying taxes and because of this reason,
some portion of the taxpayers may fail to comply with a country’s tax laws. Tax
noncompliance is the failure of taxpayer to meet tax obligations whether the act is done

Taxpayers’ tax compliance Behavior: Business Profit taxpayers’ in Addis Ababa (2015)
31
intentionally or unintentionally and this may occur through failure to file tax returns,
misreporting taxable income or misreporting of allowable subtractions from taxable income or
tax due such as exemptions, deductions, tax credit etc (Kirchler, 2007).
The most obvious consequence of tax noncompliance is the loss of tax revenue to government
and this limits funds for execution of projects (Frazoni, 2000; Wenzel, 2005). In addition, tax
noncompliance creates inequality among the people because both horizontal and vertical
equity are affected (Fjeldstad & Semboja, 2001). Tax noncompliance is a universal
phenomena hindering efficient tax revenue productivity in both developing and developed
countries. These non-compliance behaviors have been emanated from individual intrinsic and
extrinsic motives. Therefore, the research questions has been drawn in order to assess the
behavioral aspect of the taxpayers’ with the intentions of identifying the factors why business
profit tax payers comply with the tax legislations while the benefits of non-compliance is
outweighing? Based on the research questions highlighted, the author has developed the
following hypothesis in order to test tax payers’ tax compliance behavior:-
Hypothesis 1: Tax knowledge (demographic factor) affects the taxpaying attitudes of
business profit taxpayers.
The influence of knowledge on compliance behavior has been proven in various researches
Mohamad Ali et al (2007). Harris (1989) divided tax knowledge into two aspects, namely,
knowledge through common or formal education received as a matter of course and
knowledge specifically directed at possible opportunities to evade tax. In the first case, the
level of education received by taxpayers is an important factor that contributes to the general
understanding about taxation especially regarding the laws and regulations of taxation Eriksen
and Fallan (1996). Given evidence that tax knowledge affects understanding of taxpayers, an
obvious explanation that has been raised by previous researchers e.g. Singh, (2003), Eriksen
and Fallan, (1996) Harris (1989) is whether enhancement of tax knowledge will increase tax
compliance. Eriksen and Fallan (1996 p387) claimed that ‘knowledge about tax law is
assumed to be important for preferences and attitudes towards taxation.

Taxpayers’ tax compliance Behavior: Business Profit taxpayers’ in Addis Ababa (2015)
32
There is little research that explicitly considers how attitude towards taxation is influenced by
specific knowledge of tax regulations’. The research done by Eriksen and Fallan has
illustrated the importance of tax education in a tax system. They suggested that fiscal
knowledge correlates with attitudes towards taxation and tax behavior can be improved by a
better understanding of tax laws.
Eriksen and Fallan’s study is divided into three main parts. Firstly, the investigation is focused
on taxpayers’ knowledge. Secondly, the research tries to reveal the overall impact of tax
knowledge on tax compliance behavior among individual taxpayers and thirdly, the research
involves tax agents in order to determine their influence in determining taxpayers’ behavior,
tax agents are assumed to be involved more in preparing, declaring and calculating tax
liability on behalf of individual taxpayers than in the directly assessed system.
Eriksen and Fallan (1996) attempted to determine the relationship between the level of tax
knowledge and attitudes toward taxation; whether specific tax knowledge influences attitudes
in general (not only tax attitudes) and investigate people’s behavior toward traditional crime.
The results of the study suggested that tax knowledge has a positive correlation with
perceptions of fairness, tax ethics and attitudes to others’ tax evasion. Therefore, this study
aims at understanding the overall impact of tax knowledge’s on tax compliance behaviors of
business profit tax payers operating in Addis Ababa city administrations.
Hypothesis 2: Belief in fairness (attitude & perception factor) affects the tax compliance
behavior of business profit tax payers.
As mentioned by Smith (1776), one of the main principles of the taxation system design is
equity or fairness, which can be perceived via two-dimensional views –horizontal equity
(people with the same income or wealth brackets should pay the same amount of taxes) and
vertical equity (taxes paid increase with the amount of the tax base). The driving principle
behind vertical equity is the notion that those who are more able to pay taxes should
contribute more than those who are not. Wenzel (2003) suggested three areas of fairness from
the taxpayers’ point of view (social psychology): 1) distributive justice (viewed as the
exchange of resources i.e. benefit and cost); 2) procedural justice (viewed as the process of
Taxpayers’ tax compliance Behavior: Business Profit taxpayers’ in Addis Ababa (2015)
33
resource distribution) and 3) retributive justice (viewed as the appropriateness of sanctions
when norm-breaking occurs).
1. In distributive justice, an individual is concerned about the fairness of their actions,
and wants to be treated in relation to his merits, efforts and needs Kirchler et. al,
(2008). If he feels that his tax burden is higher than other people within the same
income group, his tax compliance probably decreases more widely at group levels;
taxpayers want a fair treatment of their group relative to other income groups. If a
specific group perceives that their tax liability is higher than other groups, then tax
evasion might occur among the group members Spicer and Becker (1980). At a
society-wide level, tax compliance is less likely if the perception is held that the tax
system is unfair; wide scale tax evasion is likely to occur. Allingham and Sandmo
(1972); in contrast, if the society perceives that the tax system is equitable and fair,
voluntary compliance is expected to increase.
2. With regard to procedural justice, the main elements for perceived fairness are
neutrality of procedures used, trustworthiness of the tax authorities, and the polite,
dignified, and respectful treatment of taxpayers as individuals or groups. Taxpayers
expect that tax authorities will provide sufficient information about the tax law and
regulations so that they can complete their tax return as accurately as possible. It is
argued therefore that increased information about tax law and regulations can
increase fairness perception and compliance.
3. Retributive justice, unreasonable and intrusive audits and unfair penalties lead to
stressful and dissatisfied taxpayers Spicer and Lundsted (1976). Unfavourable
retributive justice perceptions could lead to non-compliant behaviour and
consequently increase tax evasion and inflate the tax gap.
As can be seen from the above literatures compliance behavior of Addis Ababa city
administration business profit tax payers have been affected by the belief of distributive
justice, procedural justice and Retributive justice.

Taxpayers’ tax compliance Behavior: Business Profit taxpayers’ in Addis Ababa (2015)
34
Hypothesis 3: Influences of the peer groups (attitudes & perception) affects the tax
compliance behavior of business profit tax payers.
Both psychologists and economists believe that individuals conform to social norms
established by peers. First, individuals can incur a high psychological cost (e.g. feelings of
guilt, loss of self-respect) in undertaking an undesirable action when other individuals are
inclined to follow the norm of truthful reporting. People tend to feel worse as the proportion
of others in one’s reference group who respect the norm increases. Fischer and Huddart
(2008) show how ‘established norms’ or ‘peer pressure’ can influence an individual’s
desirable actions, because agents occur at a personal cost in not following their peers. A
second reason is that agents gain information from peers’ behavior and form an accurate
interpretation of reality and behave accordingly. According to these views, much of one’s
behavior is influenced by one’s perceptions of what is ‘typical’ or considered to be ‘normal’.
This suggests that when other people behave honestly, such behavior will be followed. Yet, if
the number of transgressors grows, the incentive to comply can dwindle. Jackson and Milliron
(1989) find that highly non-compliant peers reduce the compliance of other taxpayers. As
mentioned, people respond to norms to gain an accurate understanding of how to respond
effectively to social situations, especially during times of uncertainty. This shows that
individuals take norms as a source of information to shape reality and as a guide to correct
behavior.
According to Lindbeck 1995, conformity to a social norm is conditional on whether there is
need to form expectations about other people’s behavior and beliefs. We argue that
individuals are affected in their compliance behavior by the behavior of their “neighbors”, or
those about whom they may have information, whom they may know, or with whom they may
interact on a regular basis. Individuals seem more likely to file and to report their taxes when
they believe that other individuals are also filing and reporting their taxes; conversely, when
individuals believe that others are cheating on their taxes, they may well become cheaters
themselves.
As can be tested by different authors in different countries, tax compliance behavior of
business profit tax payers’ have been affected by the influence of peer groups but researches

Taxpayers’ tax compliance Behavior: Business Profit taxpayers’ in Addis Ababa (2015)
35
have not been made so far in the case of Ethiopia. Therefore, the paper validates those issues
in the case of Addis Ababa city administration business profit tax payers.
Hypothesis 4: Income level of tax payers (non-compliance opportunity) does have positive
and significant impact on the tax compliance behaviors of business profit tax payers.
In Fischer’s model, source of income, level of income and occupation are considered as
factors providing opportunity for tax noncompliance. Empirically, studies have proof the
relationship between noncompliance opportunity factors and tax compliance behavior.
Similarly, Manaf, Hasseldine, & Hodges (2005) found that middle-income taxpayers are more
compliant. Concerning source of income, Fjeldstad and Semboja (2001) also observed that
employees paying their taxes through a withholding system have fewer opportunities to be
noncompliant. In another study, Richardson (2006) found that income source is significantly
related to tax evasion. In respect of occupation, Andreoni et al. (1998) noted that there was an
understatement of taxes by a greater percentage by sole proprietors. In contrast, Manaf et al.
(2005) showed sole proprietors are likely to be more compliant. Therefore, the very purpose
of this paper is to test the impact of the income level of tax payers’ in affecting the tax
compliance behavior of business profit tax payers operating in Addis Ababa city
administration.
Hypothesis 5: Feeling of Detection and punishments (tax system/structure) does have an
impact on the tax compliance behaviors of business profit tax payers.
The basic theoretical model used in nearly all research on tax compliance begins with the
economics-of-crime model of Becker (1968), first applied to tax compliance by Allingham
and Sandmo (1972). Here a rational individual is viewed as maximizing the expected utility of
the tax evasion gamble, weighing the benefits of successful cheating against the risky prospect
of detection and punishment, and the individual pays taxes because he or she is afraid of
getting caught and penalized if he or she does not report all income.
This approach gives the plausible and productive result that compliance depends upon audit
rates and fine rates. Indeed, the central point of this approach is that an individual pays taxes
because of this fear of detection and punishment. The obvious implication for designing

Taxpayers’ tax compliance Behavior: Business Profit taxpayers’ in Addis Ababa (2015)
36
strategies to reduce tax evasion is to increase enforcement. This economics-of-crime approach
therefore gives the sensible result that compliance depends upon the enforcement policies of a
tax administration. However, it is essential to recognize that this approach also concludes that
an individual pays taxes because – and only because – of the economic consequences of
detection and punishment. Again, this is a plausible and productive insight, with the obvious
implication that the government can encourage greater tax compliance by increasing the audit
and the penalty rates of its regulatory regime.
The many extensions of this economics-of-crime approach considerably complicate the
theoretical analyses, and generally render clear-cut analytical results impossible. Nevertheless,
these extensions retain the basic approach and the basic result: individuals focus exclusively
on the financial incentives of the evasion gamble, and individuals pay taxes solely because
they fear detection and punishment. However, it is clear to many observers that compliance
cannot be explained entirely by such purely financial considerations, especially those
generated by the level of regulatory enforcement. The percentage of individual income tax
returns that are subject to a thorough tax audit is generally quite small in most countries,
almost always well less than 1 percent of all returns. Similarly, the penalty on even fraudulent
evasion seldom exceeds more than the amount of unpaid taxes, and these penalties are
infrequently imposed; civil penalties on non-fraudulent evasion are even smaller. However,
even in the least compliant countries evasion never rises to levels predicted by a purely
economic analysis, and in fact there are often substantial numbers of individuals who
apparently pay all (or most) of their taxes all (or most) of the time, regardless of the financial
incentives they face from the enforcement regime. However, researches have not been made
so far in the case of Ethiopia validating why businesses pay their taxes i.e. is it because of fear
of detection or punishment? Is it because of moral values? Or the benefits to be received from
the government spending and etc. Therefore this paper assesses those issues one by one by
distributing an appropriate questionnaire.

Taxpayers’ tax compliance Behavior: Business Profit taxpayers’ in Addis Ababa (2015)
37
Hypothesis 6: Tax payers’ confidence in government spending (tax system/structure)
significantly affects tax compliance behavior of business profit taxpayers.
Studies on the relationship between the specifics of actual government spending and tax
compliance, particularly on tax evasion, are very limited. Logically, taxpayers, and especially
those who pay high amounts of tax, will be sensitive to what the government spends their
money on. Although there is limited empirical evidence, it is reasonable to assume that
taxpayers will tend to evade tax if they perceive that the government spends tax money
unwisely.
Lewis (1982) suggests that attitudes should be examined for the degree to which they are a
product of myth and misperception. He argued that when myths and misperceptions are
replaced by knowledge, a change in attitudes towards taxation would occur even if the
taxpayers' basic ideology and values remain unchanged and the tax law is unchanged. He also
claimed that misperception probably plays a major role shaping fairness evaluations.
Meanwhile, Roberts, Hite and Bradley (1994) also suggest that attitude to one's own tax
evasion (tax ethics), and attitude to other people's tax evasion are important. If the government
is wisely spending the national revenue, for example for basic facilities like education, health
and safety and public transportation, it is likely that voluntary compliance will increase. In
contrast, if taxpayers perceive that the government is spending too much on something
considered unnecessary or unbeneficial to them then taxpayers will feel betrayed and attempt
to evade. Therefore, this paper tested the relationship between the government spending and
tax compliance behavior in the case of Addis Ababa city administration.
3.2 Research Approaches
Identifying the research approaches and discussing the rationale for choosing a specific
research approach is a priority for conducting a research topic. In additions to this, identifying
the researcher’s beliefs and world views is also a pre-requisite in undertaking a research.
Therefore, based on these assumptions the two extremely contradicting paradigms are
positivism and constructivism. Thus, positivist researchers normally adopt quantitative
methods and constructivist researchers adopt qualitative methods. The other paradigm is

Taxpayers’ tax compliance Behavior: Business Profit taxpayers’ in Addis Ababa (2015)
38
combination of positivism and constructivism (that is mixed method). Thus, this section
incorporates the philosophy of quantitative, qualitative and mixed methods approaches.
3.2.1 Quantitative Research Approach
Creswell (2003) noted that quantitative research is one in which the investigator primarily
uses positivist claims for developing knowledge. The positivism approach views that the
world as objective realism and therefore suggested that knowledge created by deductive
reasoning where by a precise and systematic process is adopted (McKerchar, 2010). Besides
quantitative research is to develop and employ mathematical models, theories, and hypotheses
pertaining to natural phenomena. The process of measurement is central to quantitative
research because it provides the fundamental connection between empirical observation and
mathematical expression of an attribute. i.e., in this approach, the research problem translated
to specific variables and hypotheses. In this approach a researcher uses a theory which is an
interrelated set of constructs (or variables) formed into propositions, or hypotheses, that
specify the relationship among variables (typically in terms of magnitude or direction).
The systematic view might be an argument, a discussion, or a rationale, and it helps to explain
(or predict) phenomena that occur in the world. Labovitz and Hagedorn (1971) add to this
definition the idea of a theoretical rational, which they define as “specifying how and why the
variables and relational statements are interrelated” (p.17). Why would an independent
variable, X, influence or affect a dependent variable, Y? The theory would provide the
explanation for this expectation or prediction. Quantitative research favor methods such as
experiments and surveys, and will attempt to test hypotheses or statements with a view to
infer from the particular to the general.
This approach typically concentrates on measuring or counting and involves collecting and
analyzing numerical data and applying statistical tests. Well-formulated quantitative research
has a significant contribution of generalizing of the broader population. This leads to
consistent procedures in sample selection, instrument design, implementation, and analysis.
However, this approach does have its own setbacks and appears that there is a flexibility
problem in design, which may be vital when additional information revealed through data

Taxpayers’ tax compliance Behavior: Business Profit taxpayers’ in Addis Ababa (2015)
39
collection needs further exploration for knowledge. Therefore quantitative research approach
alone may not bring effective result in interpretive and exploration of research problems.
3.2.2 Qualitative Research Approach
Qualitative research is a means for exploring and understanding the meaning individuals or
group ascribe to a social or human problem (Cresswell 2008). A qualitative approach is one in
which the inquirer often makes knowledge claims based primarily on constructivist
perspectives (i.e., the multiple meanings of individual experiences meanings socially and
historically constructed, with an intent of developing a theory or pattern) or
advocacy/participatory perspectives (i.e., political, issue-oriented, collaborative, or change
oriented) or both.
It also sues strategies of inquiry such as narratives, phenomenology’s, ethnographies,
grounded theory studies, or case studies. The researcher collects open-ended, emerging data
with the primary intent of developing themes from the data. Qualitative research is
exploratory in its nature because of this in qualitative research approach there are description
and inductive discovery of evolving theory that may arise after data is collected. Qualitative
research design has also its own setbacks because it doesn’t produce data that allow
comparison; the methodological approach does not ensure objectivity, and hence the quality
of the findings is questionable and the research structure and procedure do not ensure the
validity and reliability of methods.
3.2.3 Mixed Research Approach
These procedures developed in response to a need to clarify the intent of mixing quantitative
and qualitative data in a single study (or a program of study). With the inclusion of multiple
methods of data and multiple forms of analysis, the complexity of these design calls for more
explicit procedures. These procedures also developed in part to meet the need to help
researchers create understandable designs out of complex data and analyses. This inquiry
paradigm lies between positivism and constructivism known as critical realism and
pragmatism.

Taxpayers’ tax compliance Behavior: Business Profit taxpayers’ in Addis Ababa (2015)
40
Researchers adopting these paradigms view the world as complex and therefore difficult to
understand simply through empirical realism (McKerchar, 2010). McKerchar (2010 p,20)
argues that “each strategy has its strength and weaknesses and the drive for mixed method
research is to use one strategy to either inform, validate, or compensate for the weaknesses of
another.” McKerchar (2010) also highlights several reasons behind the use of such an
approach. The first is the need to address different objectives of the study, which cannot
achieve by a single method. The second reason is to enable one approach to inform another
approach, either in design or in interpretation. The third reason is to triangulate the findings of
different approaches (either performed concurrently or sequentially) in an effort to provide
greater confidence to the study. Based on the above researcher recommendations, it appears
that the main reason for the researcher to adopt a mixed method approach is to enable one
approach to inform another approach in the interpretation of the overall results. To be
consistent with this strategy, a similar sampling frame used to draw the potential respondents
for both approaches.
In this study as stated in the previous chapters, the overall research question is “Why business
profits taxpayers comply with the tax legislations while the benefits of non-compliance is
outweighing?” In order to address this research problem and to answer the research objective
comprehensively six hypotheses and one research question were developed at the beginning
of this chapter. In light of the research question and hypotheses, the studies were employed
both qualitative and quantitative research approach, i.e., self administrated questionnaires and
in-depth interview. Therefore, using both approaches is helpful for generating the benefits of a
mixed methods approach presented earlier and mitigating the bias in adopting only either
quantitative or qualitative approach. Thus, the following sections present the specific
quantitative and qualitative aspects of the research method used for this study.
3.3 Research Method Adopted
This section presents the specific data collection methods from both approaches. As a result of
this, Section 3.3.1 presents quantitative data collection method used while section 3.3.2 and
3.3.3 present the qualitative data collection method and data analysis methods (both
qualitative and quantitative components) respectively.

Taxpayers’ tax compliance Behavior: Business Profit taxpayers’ in Addis Ababa (2015)
41
3.3.1 Quantitative aspect-Survey design (self-administered questionnaires)
To collect relevant data for the examination of taxpayers tax compliance behavior in the case
of Addis Ababa City administration business profit tax payers; survey is one method of
descriptive research method that help us to gather data at a particular point in time with the
intention of describing the nature of existing conditions, or identifying standards against
which existing conditions can be compared, or determining the relationships that exist
between specific events.
Therefore, the adoption of survey design in this study is helpful in order to represent a wider
population; provides descriptive, inferential and explanatory information; gather data on a
one-shot basis or gathering of information that will not be available from archive records. In
this regard, Fowler (1984, p. 12) noted that the strengths of survey methods that result in their
wider use included the value of statistical sampling, consistent measurement, and the ability to
obtain information not systematically available elsewhere.
For the purpose of this study the author adopted self administered questionnaires. A self-
administered questionnaire has the advantage of scanning a wide field of issues, population,
programs etc. with low cost. However, this method is likely to result in a low response rate.
On the demerits of self-administered the response rates were typically not as high as might be
desired. With very low response rates, it is difficult to establish the representativeness of the
sample because those who responded to the survey may be different from the population they
will intend to represent. The drawbacks of the self-administered questionnaires will be
believed to be mitigated largely by informing respondent through different necessary personal
techniques and using other methods. In addition to the mode of collecting data, a sample
survey is concerned with issues including sampling and instrument designs, and pre-survey
evaluation. The subsequent sections, hence, review these issues in a sample survey in respect
of the current study.
Sample and Sampling Techniques
Selecting samples in a research is a common practice to generalize the targeted populations.
Tabachnick and Fidell (2001) noted that ideally, samples are selected on randomly bases this

Taxpayers’ tax compliance Behavior: Business Profit taxpayers’ in Addis Ababa (2015)
42
indicates the representativeness of the population. The intention of this study was to
generalize the findings to all taxpayers and potential taxpayers in Addis Ababa City
administration. Therefore, the sample designs and mode of collecting data would be
statistically representative of tax compliance behaviors of businesses operating in Addis
Ababa City Administrations. In the case of sample design, as the literature on survey method
reveals, how well a sample represents a population depends on the sample frame, the sample
size, and the specific procedures of selecting potential respondents.
In respect of sample frame, in a study with the intention of statistically generalizing about
Addis Ababa City business profit tax payers, the sample frame from which potential
respondents are to be chosen have to be representative of the population. In sample design, a
sample selection about broader potential respondents giving equal chance of selection is vital
to increasing the representativeness of the sample. Therefore, the target for the sample
includes population consists of all businesses operating in Addis Ababa City Administration
and pays business profit taxes.
Another point in sample design is the sample size. The choice of a sample size has a bearing
on the reliability of a study. However, this does not mean that large sample size always leads
to high level of accuracy rather it is to indicate that sample size is one of the factors that
contribute to the credibility of a survey estimate. For the choice of sample size, different
researchers give different ideas. For example , Alreck and Settle (995 p,63) noted that the
choice of sample size is normally made after considering statistical precision, practical issues
and available resources (e.g. cost and time). Fowler (1984 p, 43) noted that there is no single
precise way for the determinations of sample size hence there are a number of inadequacy for
deciding on sample size. For instance, in deciding of a sample size by specifying the fraction
of the population to be included in the sample, there is no any right way. This is because the
population from which a sample of a particular size is drawn has virtually no impact on how
well that sample is likely to describe the population.
In addition, for using that a particular sample is the typical approach to studying a population
may also practically lead to the wrong answer. Therefore, it is better if to see the sample size
used by other researchers, because it is better if the sample size to be decided by considering

Taxpayers’ tax compliance Behavior: Business Profit taxpayers’ in Addis Ababa (2015)
43
the different goals to be achieved by a particular study. Finally, also for deciding on the
sample size by calculating a desired confidence interval for one variable for an entire
population is uncommon. However, Fowler contends that nothing is wrong with this approach
in terms of some theoretical sense. Apart from the problem of basing sample size decision on
the need for precision of a single estimate and the difficulty of determining the level of
specific precisions in advance, the estimation of the level of accuracy fails to take into account
errors arising from sources other than sampling. The aforementioned points help us consider
different conditions in deciding on the desired sample size like the availability of time and
resources, and the aim of the research. However, if the final condition is employed, Fowler
(1984, p. 43) indicated that for a population, the level of precision increases steadily up to
sample sizes of 150 to 200. If the desire is to increase the sample size beyond this limit, there
is much more gain that is modest.
In this regard, taking the available resources, time, budget, data, and geographic distances into
account, a sample size of 200 were feasible from the total population of 319,319. In order to
supplement the information obtained from 200 business profit taxpayers, 25 business profit
taxpayers were interviewed. The researcher used stratified random sampling methods in
administering the questionnaires. Due to the fact that, there are many business profit tax
payers residing in Addis Ababa city administrations. The researcher therefore deemed it fit to
employ the stratified random sampling method to classify all profit tax payers by their tax
categories and used his personal judgment to select Domestic trade and services,
Manufacturing, building and construction, hotel and tourism, import and export and etc for
data collection.
Having stratified the business profit tax payers and arrived at which business sector to select
from, the researcher had randomly selected from each of the categories on a randomly bases.
These methods were used, because of that each of the strata or category of target population
had an equal chance or probability of being included or excluded in the final sample. The use
of these sampling methods is justified by the fact that they were quicker and less costly to
employ and had the ability to represent a high degree of spread in the data collection.

Taxpayers’ tax compliance Behavior: Business Profit taxpayers’ in Addis Ababa (2015)
44
As per the data obtained from ERCA, as of November 9, 2014 there were 319,319 business
profit taxpayers operating in Addis Ababa city administrations. These are stratified in to three
categories, namely category A, B and C” based on their annual turnovers. To draw a
representative sample size of 200, the tax payers further stratified in to sub-cities (i.e. based
on sub-cities in which their business operation has been found). Details are shown below in
the table:-
Table 1: Total Number of Tax payers as per their Respective Categories
No. Categories of Tax Payers Total Number of Taxpayers asper their Categories
Percentages
1 A 51,257 16%2 B 47,000 15%3 C 221,062 69%Total 319,319
Source: Ethiopian Revenue and Customs Authority (2014)
Table 2: Number of tax payers as per their categories and their respective sub-cities
No Name Tax Payers-CategoryA B C Total
No. % No. % No. % No. %1 Arada 2,131 4% 4,882 10% 10,652 5% 17,665 6%2 Gullele 2,943 6% 2,238 5% 18,357 8% 23,538 7%3 Addis Ketema 1,723 3% 4,925 10% 12,045 5% 18,693 6%4 Lideta 1,213 2% 2,366 5% 8,349 4% 11,928 4%5 Bole 6,446 13% 5,211 12% 33,717 15% 45,374 14%6 Kirkos 3,000 6% 2,500 5% 19,192 9% 24,692 8%7 Akaki Kality 1,630 3% 5,067 11% 15,215 8% 21,912 7%8 Yeka 4,302 9% 3,753 8% 31,177 14% 39,232 12%9 Nifas Silk Lafto 3,954 8% 7,216 15% 33,150 15% 44,320 14%10 Kolfe Keranyo 3,721 7% 4,019 9% 32,013 14% 39,753 12%11 A.A. No. 1** 4,598 9% - - - - 4,598 1%12 A. A.No.2** 5,187 10% - - - - 5,187 2%13 Markato No.1** 3,582 7% 3,183 7% 4,955 2% 11,720 4%14 Merkato No.2** 6,827 13% 1,640 3% 2,240 1% 10,707 3%
Total 51,257 100% 47,000 100% 221,062 100% 319,319 100%
Source: Ethiopian Revenue and Customs Authority (2014)

Taxpayers’ tax compliance Behavior: Business Profit taxpayers’ in Addis Ababa (2015)
45
Note: ** those taxpayers’ are specially designated taxpayers and centrally treated by ERCA
at the head office level.
As we have seen from the above tables, Category–C tax payers (69%) received the highest
percentage and most of them are distributed in Bole, Nifas silk, Kolfe and Yeka sub-cities
respectively. Next to Category–C taxpayers, Category-A taxpayers incorporates 16% of the
total populations and distributed in Merkato No.2, Bole, Addis Ababa No.2 and Addis Ababa
No.1 respectively. In additions to these, the smallest percentages of all taxpayers’ are fall
under Category-B (i.e.15%) and most of them are found in Nifas Silk,Bole,Akaki Kality and
Addis Ketema sub-cities respectively.
Chart 1- Categories of Taxpayers and their distribution in their respective sub-cities (i.e.
based on their rank from 1up to 4)
Chart 1 depicts that most of the tax payers’ are distributed in six sub-cities such as Bole, Nifas
Silk Lafto, Kolfe Keranyo, Yeka, Merkato, Akaki Kality and Addis Ketema and in two
specially designated branches such as Addis Ababa No.1 & No.2. Considering those facts, the
author distributed his questionnaires as per the following table:-

Taxpayers’ tax compliance Behavior: Business Profit taxpayers’ in Addis Ababa (2015)
46
Table 3: selected sub-cities to distribute Questionnaires
No. Sub-cities and Specially designated Branches’ Total number of questionnaires1. Bole 522. Nifas Silk 463. Kolfe Keranyo 364. Yeka Sub-city 365. Merkato-2 86. Addis Ababa No.2 67. Akaki Kality 68. Addis Ketema 59. Addis Ababa No.1 5
Total 200
Source: Taxpayers’ tax compliance Survey (2015)
The survey instruments
The survey instruments have been prepared in the form of structured self-administered
questionnaire and served as the measuring instrument for the study. This instrument does have
three sections. The first section intended to gather background information about respondents.
While the second section is concerned with business profit taxpayers’ tax compliance
behavior specifically it was designed to assess factors determining tax payers’ tax compliance
behavior such as tax knowledge, the influence of peer groups, income level of tax payers,
belief in fairness, feeling of detection and punishment and confidence in government
spending.
In the last section respondents are provided with an opportunity to suggest possible solutions
and to give further comments about how to improve tax compliance behaviors of business
profit tax payers’. In order to measure, the items the researcher used Likert type-scale (i.e.,
“Strongly agree “to “Strongly Disagree”). In additions to this, multiple choice and multiple-
response scales (which provides multiple options but the respondent can select anything from
one to several alternatives) has also been used to assess information’s from the respondents.

Taxpayers’ tax compliance Behavior: Business Profit taxpayers’ in Addis Ababa (2015)
47
3.3.2 Qualitative Approach- in depth interviews
In addition to self-administered questionnaires, this study involved in-depth interviews to
provide more information to the data obtained through the survey questionnaires. The use of
interviews is appropriate in obtaining either multifaceted or sensitive information, as well as
understanding concepts that require detailed elaboration (Hair et al. 2007). In relation to the
interview method, research in the social sciences has seen a range of interview approaches,
including structured interviews, semi-structured interviews and unstructured interviews. In
Nardi, P. M. (2003) book provides the underlying criteria of each type of interview described
as structured, semi-structured, and unstructured interviews. Structured interview: the
interviewer follows scripted questions in a particular sequence, the interviewee chooses
responses from a range of options that are fixed coded quantitatively (responses provided by
the interviewer), and asymmetrical structure. In addition, data analyzed via deductive analysis
for hypothesis testing in multivariate studies. Whereas Semi-structured Interviews: Interview
protocol is used as a guide and questions may not always be asked in the same order (the
interviewer initiates questions and poses follow up “probes” in response to the interviewee’s
descriptions and accounts), asymmetrical structure and data analyzed via inductive analytic
methods for descriptions and interpretations in interpretive studies. Unstructured Interviews:
Both interviewer and interviewee initiate questions and discuss topics, possibly less
asymmetrical structure, and data analyzed via inductive analytic methods for descriptions and
interpretations in interpretive studies.
With reference to the guidelines, this study adopts semi-structured interviews to collect
qualitative data. It anticipated that this approach would provide richer and more accurate data
to enhance the findings for this study. Twelve questions were developed as a guide for the
semi-structured interview sessions. These questions were formulated with reference to the
topics under study, that is: tax payers’ tax knowledge, belief in fairness, influence of the peer
groups, income level, feeling of detection and punishments and confidence in government
spending.
Taxpayers’ tax compliance Behavior: Business Profit taxpayers’ in Addis Ababa (2015)
48
3.3.3 Data Analysis
This section sets out the proposed analysis to evaluate the survey data beginning with the non-
response bias test and response representativeness. Next is a brief discussion of the descriptive
analysis and multiple regression models.
3.3.3.1 Non-response bias and response representativeness for quantitative aspect
A non-response bias test was performed to ensure that there is no bias on the samples. Leong,
C. Y. (1980), highlight that the popular approach to prove non-response bias is by comparing
first responses to responses generated after follow-ups. If there are no significant differences
between the two groups of responses, it assumed that there is no problem of non-response
bias. One method of proving response representativeness is by comparing the demographic
background of the responses with the entire population (Leong, C. Y. 1980).
In this study, the responses considered representative of an entire population if they reflected a
similar distribution in terms of category and annual turnover. Therefore result of the study
indicated about the response rate, response bias and response representativeness as follows:
Response rate
The survey was conducted between April and May 2015 and questioners’ were distributed to
200 randomly chosen business profit taxpayers. All the taxpayers’ survey respondents were
located in Addis Ababa City. A two week return date was requested. To increase the response
rate, follow-up reminders (together with questionnaires), and alternatively, telephone call
reminders were made to the representatives requesting them to remind them to return the
questionnaires. Out of this sample, 15 questionnaires were returned as non-answered. One
possible reason for not completing the questionnaires is the subject of research itself (taxation)
considered as difficult subject. Overall, 153 responses were received, giving a response rate of
76.5 percent. This shows that the response rate considered as fair. (Dillman, 2007) suggests
that the response rate for a personal delivery approach varies considerably from the lower of
28 percent to the highest of 50 percent.

Taxpayers’ tax compliance Behavior: Business Profit taxpayers’ in Addis Ababa (2015)
49
Non-response bias
To test if there is any non-response bias on the samples, a t-test analysis performed comparing
the early responses to responses generated after follow-ups (Dillman, 1992). Therefore, in
order to decide whether the groups were significantly different from each other, the p-value
was examined. The result shows that the majority of the items have a p-value of more than
0.05, indicating that the groups are not significantly different. While the results provide an
indication that there is no problem of response bias among the early and late responses in the
Addis Ababa City business profit taxpayers’ sample, it is important to note that they do not
guarantee that the sample is free of non-response bias considering the low response rate
achieved.
Response representativeness
One method of establishing response representativeness is by comparing the respondent
profile with the entire population (McInnis, 2006). In this study, the responses were compared
based on turnover and taxpayers category. The majority of the respondents in the survey
responses are more than annual turnover of ETB 500,000. In terms of working sector,
however, the percentage of the survey responses is comparable to the total population. The
majority of them are domestic trade and service sector was represented. In sum, comparing
the survey responses with the total population on two criteria signifies no major differences.
Thus, it can conclude that the responses are representative of the total population (Addis
Ababa business profit taxpayers’).
3.3.3.2 Descriptive Analysis and multiple regression models
To analyze the data both descriptive and inferential statistics were used. Descriptive statistics
adopted by the researcher includes measure of central tendency (i.e. mean, mode and median),
measure of variability or dispersion (i.e. standard deviation and variance). In additions to this,
the author adopted inferential statistics such as multiple regression models in order to test the
correlation and variability between dependent (tax compliance) and independent variables (i.e.
knowledge, fairness, peer group influence, income level, detection & punishment and tax
payers’ confidence in government spending). Moreover, structure coefficients, F-tests and

Taxpayers’ tax compliance Behavior: Business Profit taxpayers’ in Addis Ababa (2015)
50
analysis of variance (ANOVA) has also been used in order to examine the significant
difference between two or more means. In order to undertake the above data analysis the
researcher used Statistical Package for Social Science (SPSS) software.
3.3.3.3 Definition and Variable Measurement
In this study tax compliance behaviors have been measured by six hypothetical questions; and
the use of those hypothetical questions can increase reliability of results and minimizes
respondents’ dishonesty when answering the questionnaire (Troutman, 1993). The dependent
variable of the study is tax compliance behavior and which is affected by tax knowledge,
fairness in the tax system, peer group influence, income level, detection and punishments and
Confidence in government spending. Only those variables are selected by the author because
businesses are not affected by demographic factors such as age and gender. Therefore, based
on the selected factors the author had developed the following regression models:
The Model
Tax compliance behaviors of businesses have been measured by six factors: tax knowledge,
fairness in the tax system, peer group influence, income level, detection and punishments and
Confidence in government spending. For instance, peer group influence can be measured by
five statements: e.g. “Positive peer attitude i.e. a belief that my neighbors are reporting and
paying tax honestly encourages me to report and pay the correct amount of taxes.” (5 =
strongly agree, 1 = strongly disagree). The average score over the five items in each factor
will be taken as an index for tax compliance. Based on this score, taxpayers were categorized
into three levels of compliance: low, medium and high (adopted from Tadesse Getachew
Engida et.al 2014). Given the scaled ranking information of the dependent variable, regression
model have been applied. The regression result has the following form:
Yi*= β0 + X1iB1 + X2iB2 + ……….XKiBK +
Yi* = XiB +

Taxpayers’ tax compliance Behavior: Business Profit taxpayers’ in Addis Ababa (2015)
51
Where Yi* is the dependant variable (levels of compliance); β is the vector of estimated
parameters and Xi is the vector of explanatory variables; ei is the error term, which is assumed
to be normally distributed (zero mean and unit variance).
Yi, the observed ordinal variable, takes on values 0 through m according to the following
scheme:
Yi = jµ j-1 < Yi* ≤ µj where, j=0….m
Like the models for binary data, the study is concerned with how changes in the explanatory
variables transform into the probability of observing a particular level of compliance.
Accordingly, the probability of each tax compliance level (low-y1, medium-y2, and high-y3)
will be computed as follows:
yi=1 if yi* ≤ u1
yi=2 if u1< yi* ≤ u2
yi=3 if yi* > u2
Likewise, our regression model has been drawn from the above assumptions considering tax
compliance behaviors of businesses have been affected by tax knowledge, fairness in the tax
system, peer group influence, income level, detection and punishments and Confidence in
government spending by controlling other factors such as gender and age. For both behavioral
estimations we include some control variables (Age and Gender), and in the estimation of tax
compliance behavior we include a dummy variable to reflect whether business profit tax
payers affected by those variables (effects on tax compliance behavior Dummy) in order to
control for the effect of age and gender on tax compliance behavior.
As per these study tax compliance behavior of business profit tax payers doesn’t been
affected by age and sex because most of the time those variables are used for assessing
individual level of tax compliance behavior rather than using for assessing tax compliance
behavior of business profit tax payers (such as share companies and private limited
companies). Considering those factors the model has been stated as follow:

Taxpayers’ tax compliance Behavior: Business Profit taxpayers’ in Addis Ababa (2015)
52
TC = α + β1TK +β2BF + β3PG+ β4IL + β5DP +β6GS + e....................................................(3)
Where;
Tax compliance (TC) – this study adopted the definition of McBarnet (2001) and stated that
tax compliance should be perceived in three ways, namely; committed compliance (i.e.
taxpayers’ willingness to pay taxes without complaint); Capitulative compliance (i.e.
reluctantly giving in and paying taxes) and Creative compliance (i.e. engagement to reduce
taxes by taking advantage of possibilities to redefine income and deduct expenditures within
the bracket of tax laws). Therefore, tax compliance in this study is a dependent variable and
affected by tax knowledge, fairness in the tax system, peer group influences, income level of
the taxpayers, detection and punishments and confidence in government spending.
Tax Knowledge (TK) – is the vector of explanatory variables and includes knowledge about
tax policies, procedures, rules and regulations; and which have both positive and negative
impact in the tax morale or taxpaying attitude of business profit tax payers. This tax
knowledge’s shall be obtained through continuous training, opportunities, expertise, and
nearness to tax related information’s.
Belief of Fairness in the tax system (BF) - is also the vector of explanatory variables and
explained by tax fairness relative to other tax payers, equitable determinations of tax liability,
and provisions of equitable information to all tax payers, setting fair penalties and availability
of loopholes(such as arbitrary estimation of tax liability by the tax assessors).
Income Level of the tax payers (IL) – has been considered as an independent variable and
tested whether source of income, level of income and types of businesses are providing
opportunity for tax non-compliance opportunity and the author incorporates questions related
with the prevailing inflation level, applicable tax rates, business growth, type of business and
voluntary compliance behavior in the tax administrations affects tax compliance behavior.
Influences of Peer Groups (PG) - has been considered as an independent variable and
measured by questions related with positive peer attitudes, rewarding best tax payers, cross

Taxpayers’ tax compliance Behavior: Business Profit taxpayers’ in Addis Ababa (2015)
53
checking reference groups and the feeling of guilt and loss of self respect. The authorr has
been expected positive and significant impact on the tax compliance behaviors of businesses.
Detection and Punishment (DP) – this factor is considered as an independent variable and
includes questions related with paying taxes because of fear of being caught and penalized,
continuous audits , morality, incentives and complexity of the tax administrations. This factor
is also affects tax compliance behavior of businesses as high detection and punishments by the
tax authority perpetrates involuntary tax compliance behavior of taxpayers.
Taxpayers’ Confidence in Government Spending (GS) – confidence in government
spending has been regarded as a determining factor of tax compliance behaviour. In order to
test those variables the author incorporates questions related with proper utilizations of taxes
by the government, perceptions on benefits to be received from the government spending,
voluntary tax compliance and corruption and fraud.
E = Error terms which is assumed to be normally distributed (zero mean and unit variance).
Table 4: Variables description and expected associations with the level of tax compliance
Variables Symbols Unit of measurement Expected signs/hypothesesDependant VariablesTax compliance TC (1,2,3) ordinalIndependentVariablesTax knowledge TK (1,2,3) Ordinal +(high tax knowledge, high
compliance)Feeling of fairness FF (1-5 Likert Scale)
Ordinal+(good perception, highcompliance)
Income level of taxpayer
IL (1-5 Likert Scale)Ordinal
+(High income, HigherCompliance)
The influence of peergroups
PG (1-5 Likert Scale)Ordinal
+(high influence, highcompliance)
Detection andpunishments
DP (1-5 Likert Scale)Ordinal
+(high probability, highcompliance)
Confidence ingovernment spending
GS (1-5 Likert Scale)Ordinal
+(good perception, highcompliance)

Taxpayers’ tax compliance Behavior: Business Profit taxpayers’ in Addis Ababa (2015)
54
3.4 Conclusions and the relationship between research question/ hypotheses and
sources of data
This chapter has presented the research question and various hypotheses as well as the
methods appropriate to address them. Table-5 sets out how research question/hypotheses
addressed by the appropriate item in the survey and in depth interviews with business profit
taxpayers. To sum up, based on the overarching research problem stated in the earlier chapter,
one research question and six hypotheses have been developed. With respect to methodology,
the principles of qualitative, quantitative, and mixed methods research approaches shown.
Based on the underlying principles of research methods; the mixed method approach were
chosen as appropriate to this research. More specifically, to address the research questions,
survey (self-administered questionnaires) and in-depth interviews were shown to be the
appropriate methods of inquiry for this research. The next chapter presents the results and
analysis of each of these methods of inquiry.

Taxpayers’ tax compliance Behavior: Business Profit taxpayers’ in Addis Ababa (2015)
55
Table 5: Relation between the research question/ hypotheses and source of data
Research question/hypotheses Name of variablesinvestigated
Items in the self-administeredquestionnaires and in-depthinterviews
Q1) Why business profits taxpayerscomply with the tax legislations whilethe benefits of non-compliance isoutweighing?
Self administered questionnaires 7,8, 9, 10, 11, 12, 13, 14 & 15 andtaxpayers interviews2,3,4,5,6,7,8,9,10 & 11.
H1) Tax knowledge (demographicfactor) affects the taxpaying attitudes ofbusiness profit tax payers.
Tax knowledge andtax compliancebehavior
Self administered questionnaires 4,5, 6 &7 and taxpayers interviews 1,2, 3 & 4.
H2) Belief of Fairness (attitude &perception factor) increasescompliance behavior of business profittax payers.
Belief in fairnessand tax compliancebehavior
Self administered questionnaires 6,8 & 13 and taxpayers interviews 1,3 & 5.
H3) Influences of the peer groups(attitudes & perception) do havepositive and significant impact on thetax compliance behavior of businessprofit tax payers.
Peer group influenceand tax compliancebehavior
Self administered questionnaires 8,13 & 14 and taxpayers interviews 1,2, 3 & 5.
H4) Income level of tax payers (non-compliance opportunity) does havepositive and significant impact on thetax compliance behaviors of businessprofit tax payers.
Income level oftaxpayers and taxcompliance behavior
Self administered questionnaires 3,10, 13 & 14 and taxpayersinterviews 1, 2 &7.
H5) Feeling of Detection andpunishments by the tax authorities (taxsystem/structure) does have an impacton the tax compliance behaviors ofbusiness profit tax payers.
Feeling of detectionand punishmentsand tax compliancebehavior
Self administered questionnaires 11,13 & 14 and taxpayers interviews 1,2, 3 & 8.
H6) Tax payer’s confidence ingovernment spending (taxsystem/structure) affects the taxcompliance behavior of business profittax payers.
Tax payersconfidence ingovernmentspending and taxcompliance behavior
Self administered questionnaires 12and taxpayer’s interviews 1, 2, 3, 9,10, 11 & 12.

Taxpayers’ tax compliance Behavior: Business Profit taxpayers’ in Addis Ababa (2015)
56
Chapter 4: Results and Analysis
This chapter presents the results of the various data collection methods and analysis in the
context of the existing knowledge reviewed in chapter two.
4.1 Results
One of the purposes of this study is to investigate Addis Ababa City business profit taxpayers’
tax compliance behaviour. The principal data sources to this end are the survey and in-depth
interview. The following discussion presents the results of the survey and in-depth interview
therefore in section 4.1.1 presents survey results while in section 4.1.2 presents in-depth
interview result.
4.1.1 Survey result
The purpose of this section is to show the results from surveys that are conducted to Addis
Ababa City business profit taxpayers. Therefore, it covers the respondent’s profiles in section
4.1.1.1. Investigation of general factors affecting taxpayers’ tax compliance behavior in
section 4.1.1.2., and in section 4.1.1.3 it covers specific factors affecting taxpayers’ tax
compliance behavior of businesses operating in Addis Ababa city administrations.
4.1.1.1 Respondents’ profile
According to Income Tax Regulation No. 78/2002, there are different categories of business
sectors. For this study, the sectors distribution of respondents was summarized in Table 6. As
per the outcomes of the survey, about 56% of the respondents were engaged in domestic trade
and services, while 15% and 12% were engaged in building & construction and
manufacturing sectors respectively (Table 6).

Taxpayers’ tax compliance Behavior: Business Profit taxpayers’ in Addis Ababa (2015)
57
Table 6: Sectors distribution survey of respondents
Business sector Frequency Percentages
Domestic trade and services 85 56%
Building and Construction 23 15%
Manufacturing 18 12%
Import and Export 17 11%
Others 10 6%
Total 153 100%
Source: Business profit taxpayers survey and own computations (2015)
In terms of forms of business ownership, 37 percent and 35 percent of the survey of taxpayer
respondents were sole proprietors and private limited company respectively (Table 7).
Table 7: Forms of business ownership
Type of ownerships Frequency Percentages
Sole proprietorship 57 37%
Private Limited company 53 35%
Share company 23 15%
partnership 20 13%
Total 153 100%
Source: Business profit taxpayers survey and own computations (2015)
Assessing of business profit taxpayers survey respondents in terms of their annual turnover in
the fiscal year 2014/15 showed that (49 percent) had a total turnover of more than Ethiopian
birr (ETB) 500,000; while 35 percent had a turnover of between ETB 100,001 to ETB
500,000 (Table 8).

Taxpayers’ tax compliance Behavior: Business Profit taxpayers’ in Addis Ababa (2015)
58
Table 8: Respondents’ turnover for the 2014/15 fiscal year
Total annual Turnover(ETB) Frequency Percentages
Up to 100,000 25 16%
100,001- 500,000 53 35%
More than 500,000 75 49%
Total 153 100%
Source: Business profit taxpayers survey and own computations (2015)
In respect of knowing the position of the respondents in the sector, the result showed that
about 42 percent and 25 percent of the respondents respectively were owners and others
(owner & manager) while 18 percent were Managers (Table 9).
Table 9: Respondents’ positions
Position Frequency Percentages
Owner 64 42%
Other(owner & Manager) 38 25%
Manager 28 18%
Employee 23 15%
Total 153 100%
Source: Business profit taxpayers survey and own computations (2015)
In case of the educational qualification of respondents, the survey revealed that about 53
percent had BA holders while 18 percent had a Diploma. Nearly 13 percent of respondents
indicated that they had a masters Degree, while 12 percent and 4 percent were 12 grades
complete and no formal schooling respectively (Table 10).

Taxpayers’ tax compliance Behavior: Business Profit taxpayers’ in Addis Ababa (2015)
59
Table 10: Respondents educational background
Level of education Frequency Percentage
Bachelor Degree 82 53%
Diploma 28 18%
Master Degree 20 13%
12 Grade complete 18 12%
Below 12 Grade 5 4%
Total 153 100
Source: Business profit taxpayers survey and own computations (2015)
The most important source (see Table 11) of tax knowledge to the taxpayers’ is proclamations
and directives issued by the concerned government organs (29%) and the ERCA website,
newsletters or advertisement (28%), though other direct forms of interaction with ERCA are
of relatively low importance as sources of knowledge. For example, there is a low level of
training courses offered by ERCA (8%) and of participation both in representative meetings
with ERCA at national or regional levels (10%).
Table 11: Sources of tax knowledge
Modes of communications Frequency Percentage
ERCA website, Newsletters or advertisement 44 28
Meetings with ERCA at national or regional level 17 12
Proclamations and directives issued by the concerned
government organs.
45 29
Training courses offered by accounting firms or
consultants.
19 13
Training courses offered by ERCA 13 8
Participation in business meetings, forums and boards 15 10
Total 153 100
Source: Business profit taxpayers survey and own computations (2015)

Taxpayers’ tax compliance Behavior: Business Profit taxpayers’ in Addis Ababa (2015)
60
4.1.1.2 The tax system and its impact on the tax compliance behavior of businesses
The survey outcomes revealed that about 54 percent of business profit taxpayers’ believes that
the prevailing tax system doesn’t encourage them to comply with the tax legislations. In
additions to this, 30 percent of the respondents are indifferent about the impact of the current
tax system on the tax compliance behavior of businesses. While 16 percent of the respondents
are agreed with the proposed statements depicting that the prevailing tax system encourages
them to pay their tax obligations. Details are shown on the table below:
Table 12: Taxpayers’ tax compliance behavior
Descriptions Frequency PercentageYes 24 16%No 83 54%Indifferent 46 30%Total 153 100%
Source: Business profit taxpayers survey and own computations (2015)
Moreover, in order to know the reasons behind complying with the tax legislations;
respondents are asked some of the questions prescribing the factors which contributes its part
to tax non-compliance behavior and the result revealed that about 44 percent showed that lack
of knowledge as the major reason while 31 percent, 16 percent, and 9 percent responded that
intentional behavior, lack of ability to pay, and unintentional behavior respectively as factors
contributing to tax non-compliance behavior (table 13).
Table 13: Reasons for tax non-compliance
Description Frequency Percentage
Lack of knowledge 67 44%
Intentionally 48 31%
Lack of ability to pay their tax obligations 25 16%
Unintentionally 13 9%
Total 153 100%
Source: Business profit taxpayers survey and own computations (2015)

Taxpayers’ tax compliance Behavior: Business Profit taxpayers’ in Addis Ababa (2015)
61
4.1.1.3 Specific factors affecting taxpayers’ tax compliance behavior
Tax knowledge
As per this study, taxpayers’ tax compliance behaviour has been affected by one’s own
knowledge about tax policies, procedures, rules and regulations. Tax knowledge does have
both positive and negative impact on the tax morale or taxpaying attitude of business profit
tax payers. This tax knowledge’s shall be obtained through continuous training, opportunities,
expertise, and nearness to tax related information’s.
Sometimes many business owners utilize the acquired tax knowledge to evade or avoid taxes.
And doing so does have a devastating impact in reducing the income earning capability of the
government. Therefore, the absolute levels of the mean response in Table 14 are all below 4
except one question prescribing sharing knowledge with ERCA increases the chance to
determine the correct tax liability, the level indicating agreement. It thus appears that
companies see ERCA as an important source of information but do not have a strong
motivation to share information in a two-way process, despite the low risk identified. The
main conclusions from this part of the survey are as follows.
o Business profit tax payers’ should consider the benefits of both of higher levels of tax
awareness among operational decision makers and of improved relations with ERCA.
Obviously costs are an important consideration in determining the optimum structure for
tax knowledge.
o ERCA should make greater use of firms’ tax-related experiences by improving its
methods of capturing feedback. This would enable difficulties to be identified at an
earlier stage.

Taxpayers’ tax compliance Behavior: Business Profit taxpayers’ in Addis Ababa (2015)
62
Table 14: The impact of tax knowledge on the tax compliance behavior of taxpayers’Statement Strongly
disagreeDisagree Neutral Agree Strongly
agreeMeanscore
Standarddeviation
My business has the requiredexpertise to share taxknowledge’s with ERCA.
20(13%) 31(20%) 24(16%) 52(34%) 26(17%) 3.23 1.31
My business has sufficientopportunities to share taxknowledge’s with ERCA.
28(18%) 31(20%) 41(27%) 50(33%) 3(2%) 2.79 1.14
My business has sufficientexperience to share taxknowledge’s with ERCA.
17(11%) 33(22%) 37(24%) 46(30%) 20(13%) 3.11 1.22
My business has the necessarychannel of communications toshare tax knowledge withERCA.
17(11%) 42(28%) 17(11%) 61(40%) 16(10%) 3.10 1.24
Sharing knowledge with ERCAincreases the chance todetermine the correct amount oftax liability.
2(1%) 9(6%) 11(7%) 48(32%) 83(54%) 4.31 0.94
Source: Business profit taxpayers survey and own computations (2015)
Table 14 shows that majority of companies (86%) agree that sharing knowledge with ERCA
enables the latter to determine the company’s correct tax liability; while a minority (7%)
believes that sharing knowledge enables ERCA to increase tax liability. Knowledge sharing
with ERCA may therefore be seen as a low-risk activity by the majority of companies. The
responses to the remaining questions in Table 14 are mixed, although differences do exist
between the different tax knowledge structures.
Belief in Fairness
This study incorporates various statements explaining the feeling of fairness perceptions on
tax compliance behaviour of businesses. For instance, it includes statements prescribing
equitability of the tax system, provisions of sufficient information and treating all taxpayers
respectfully, politely and dignifying them for their actions and other similar statements to test
whether the feeling of fairness perceptions affects tax compliance behaviour of businesses.
Considering those facts, the mean responses obtained from table 15 are all near to 4.0 except
one question prescribing “my tax obligation is fair relative to others”. That means respondents
are neutral with this statements. However, the last two questions revealed that unreasonable,
intrusive audits and unfair penalties, leads taxpayers towards stress and dissatisfaction (mean

Taxpayers’ tax compliance Behavior: Business Profit taxpayers’ in Addis Ababa (2015)
63
response of 4.41 and standard deviation of 0.73) and the current tax system does have many
loopholes(i.e. arbitrary estimation of taxes) which leads taxpayers towards corruption and tax
evasion (mean response of 4.27 & standard deviation of 0.99).
Table 15: The impact of the feeling of fairness perceptions on the tax compliancebehaviour of businesses
StatementStronglydisagree
Disagree Neutral Agree Stronglyagree
Meanscore
Standarddeviation
I believe that my taxobligation is fair relative toothers.
13(8%) 35(23%) 59(39%) 35(23%) 11(7%) 2.97 1.05
I believe that the overall taxsystem is not equitable. 11(7%) 13(9%) 15(10%) 68(44%) 46(30%) 3.81 1.17I believe that tax authoritiesprovide sufficient andequitable information to alltaxpayers.
9(6%) 17(11%) 9(6%) 66(43%) 52(34%) 3.89 1.17
I believe that unreasonable,intrusive audits and unfairpenalties of tax assessors willlead towards stress anddissatisfaction.
2(1%) 0 9(6%) 63(41%) 79(52%) 4.41 0.73
I believe that the current taxsystem have many loopholesto lead taxpayers towardscorruption and tax evasion.
4(3%) 9(6%) 7(5%) 55(36%) 78(50%) 4.27 0.99
Source: Business profit taxpayers survey and own computations (2015)
In additions to this, the impacts of fairness perceptions on the tax compliance behaviour have
been divided in to three levels such as low, medium and high. Based on these categorizations
the following results have been obtained:-
o As per table 16 most of the taxpayers are agreed with the statements proposed by the
author with mean response of near to 4. Except the first questions prescribing my tax
obligation is fair relative to others (i.e. respondents choose neutral positions).
o Regarding about the feeling of fairness perceptions, the effects of the proposed statements
on the tax compliance behaviour is very high (i.e. incorporates 83% of the total
populations). Details are shown below:-

Taxpayers’ tax compliance Behavior: Business Profit taxpayers’ in Addis Ababa (2015)
64
Source: Business profit taxpayers survey and own computations (2015)
Moreover, table 16 above shows that the feeling of fairness perception highly affects tax
compliance behavior of businesses operating in Addis Ababa city administrations. Generally,
from the survey result the author understood that fairness issues such as distributive justice,
procedural justice and retributive justice have been highly affected by taxpayer’s tax
compliance behavior. For instance respondents believe that:
The overall tax system in Addis Ababa city administration is not equitable
Tax authorities don’t provide sufficient and equitable information to all taxpayers.
Unreasonable, intrusive audits and unfair penalties of tax assessors will lead tax payers
towards stress and dissatisfaction.
The current tax system does have many loopholes (such as arbitrary estimation of taxes)
to lead taxpayers towards corruption and tax evasion.
Table 16: Factors explaining feeling of fairness in the tax compliance behavior
BF
Fairnessrelativeto others
Overalltax systemis unequal
Provision ofsufficientandequitableinformation
Intrusiveaudits andunfairpenalties
Loopholeswill lead toinvasionandcorruption
LowMean 1.63 1.50 1.50 4.00 3.75Std. Dev. 1.061 .535 .535 1.414 1.753N 17 17 17 17 17
MediumMean 3.75 3.75 3.00 3.75 3.25Std. Dev. .500 .957 1.414 .500 .957N 9 9 9 9 9
HighMean 3.10 4.14 4.28 4.52 4.41Std. Dev. .931 .847 .720 .569 .795N 127 127 127 127 127
Total
Mean 2.97 3.81 3.89 4.41 4.27
Std. Dev. 1.049 1.171 1.174 .732 .992
N 153 153 153 153 153

Taxpayers’ tax compliance Behavior: Business Profit taxpayers’ in Addis Ababa (2015)
65
Influences of the peer groups
This variable assesses whether the influence of peer groups affects the tax compliance
behaviour of businesses operating in Addis Ababa city administrations. In order to understand
those issues the author incorporates questions related with the influence of reference groups,
rewards and moral values in affecting the tax compliance behaviour of businesses. Details of
the assessment results are shown below:
Table 17: The impact of peer groups on the tax compliance behaviour of businesses
Statement Stronglydisagree
Disagree Neutral Agree Stronglyagree
Meanscore
Standarddeviation
1
Positive peer attitude i.e. abelief that my neighbors arereporting and paying taxhonestly encourages me toreport and pay the correctamount of taxes.
11(7%) 13(8%) 11(7%) 61(40%) 57(37%) 3.91 1.20
2
Rewarding tax payers i.e.giving a trophy for being besttax payers does have its ownimpact in affecting the taxcompliance behavior ofcitizens.
2(1%) 26(17%) 7(5%) 66(43%) 52(34%) 3.91 1.10
3
Paying taxes are my obligationand I didn’t see any referencegroups from my neighbors. 9(6%) 26(17%) 20(13%) 52(34%) 46(30%) 3.66 1.24
4
I believe that my neighbors areevading taxes and don’t reportthe true and fair picture oftheir tax liability.
2(1%) 15(10%) 55(36%) 52(34%) 28(19%) 3.59 0.95
5
I will not evade taxes becauseof the feeling of guilt and lossof self respect.
2(1%) 11(6%) 22(14%) 72(47%) 39(26%) 3.84 0.99
Source: Business profit taxpayers survey and own computations (2015)
As per table 17 above respondents are agreed with the proposed statements with the
mean values of near to four. However, there agreement is not as such convincing (i.e.
it ranges from 3.59 to 3.91). In general, based on the assessment results it is possible to
conclude that:-
Positive peer attitudes (i.e. a belief that my neighbours are reporting and paying tax
honestly encourages me to report and pay the correct amount of taxes) affects the tax

Taxpayers’ tax compliance Behavior: Business Profit taxpayers’ in Addis Ababa (2015)
66
compliance behaviour of businesses operating in Addis Ababa city administrations.
This statement has been confirmed by the mean response of 3.91 and standard
deviations of 1.2. From the total 153 respondents about 118(77%) are agreed with the
statements.
Rewarding taxpayers (i.e. giving a trophy for being best tax payers) does have its own
impact in affecting the tax compliance behaviour of businesses. This statement has
been confirmed by the mean values of 3.91 and standard deviations of 1.10. From the
total populations about 77% agreed with the proposed statements.
In additions to this, about 72% of the total populations agreed with the statements
prescribing “I will not evade taxes because of the feeling of guilt and loss of self
respect”. Therefore, it’s possible to conclude that those taxpayers who don’t evade
taxes and pay their tax obligations without any failure because of the feeling of guilt
and loss of self respect rather than other factors.
The lowest response rate i.e. a mean value of 3.59 & 3.66 and standard deviations of
0.95 & 1.24 has been obtained for questions number 4 & 3 respectively.
Table 18: Factors explaining the influence of peer groups in tax compliance behavior
PG
Positivepeerattitude
Rewardingtaxpayers
Not seeingreferencegroups in aneighbors
Neighborsdon’t reporttrue & fairtaxes
Not to evadetaxes due thefeeling ofguiltiness
LowMean 2.67 2.67 2.83 3.17 2.17N 13 13 13 13 13Std. Dev. 1.633 1.211 .983 .983 .753
MediumMean 2.86 3.14 3.86 2.57 4.07N 31 31 31 31 31Std. Dev. 1.231 .949 .949 .756 .730
HighMean 4.36 4.28 3.92 3.70 3.98N 109 109 109 109 109Std. Dev. .802 .904 1.313 .778 .892
Total
Mean 3.91 3.91 3.66 3.59 3.84
N 153 153 153 153 153
Std. Dev. 1.201 1.100 1.238 .955 .987
Source: Business profit taxpayers survey and own computations (2015)
Taxpayers’ tax compliance Behavior: Business Profit taxpayers’ in Addis Ababa (2015)
67
Moreover, in order to test the level of their agreements with the proposed statements there
responses have been divided in to three levels such as High, Medium and Small. Based on
table 18 above, about 71% of the total populations have been highly agreed with the proposed
statements with a mean value ranging from 3.7 to 4.36 and standard deviations of between
0.802 & 1.313. In general, considering the above facts it’s possible to conclude that, the
influence of peer groups have been highly affects tax compliance behaviour of businesses
operating in Addis Ababa city administrations.
Income Level of taxpayers
Income level of taxpayers’ have been considered as an independent variable and expected to
test whether source of income, level of income and types of businesses are providing
opportunity for tax non-compliance opportunity. Therefore, the absolute levels of the mean
response under table 19 are below 4. However, the highest score have been obtained from
questions prescribing:-
The current tax system doesn’t take in to account the prevailing inflation level in the
country (i.e. the author has found the mean response of 3.84 and standard deviations of
0.96) and depicting that the prevailing tax system doesn’t consider the income earning
capability of businesses; and the highest and lowest tax brackets lags behind the prevailing
inflation level in the country. From the total respondents about 50% agreed with the
statements proposed by the author.
In additions to this, the author has found positive results on question number 3 & 2(see
table 19) with the mean response of 3.70 & 3.67 and standard deviations of 1.05 & 1.08
respectively. Considering those results, it’s possible to conclude that “Paying taxes hinders
sustainable growth of businesses and the applicable tax rate is very high and deteriorates
the income earning capability of businesses”.

Taxpayers’ tax compliance Behavior: Business Profit taxpayers’ in Addis Ababa (2015)
68
Table 19: The impact of Income Level of taxpayers on the tax compliance behavior
StatementStronglydisagree
Disagree Neutral Agree Stronglyagree
Meanscore
Standarddeviation
1.The current tax systemdoesn’t take in to accountthe prevailing inflationlevel in the country.
0(0%) 11(7%) 50(33%) 44(29%) 48(31%) 3.84 0.96
2.The applicable tax rate isvery high and deterioratesthe income earningcapability of businesses.
4(3%) 24(16%) 24(16%) 66(43%) 35(22%) 3.70 1.08
3.Paying taxes hinderssustainable growth of mybusinesses.
4(3%) 26(17%) 9(6%) 85(55%) 28(19%) 3.67 1.05
4.The type of business that Iengaged encourages me topay the correct amount oftaxes.
4(3%) 26(17%) 57(37%) 55(36%) 11(7%) 3.27 0.93
5.I believe that the currenttax system encouragesvoluntary tax compliancebehavior.
20(13%) 41(27%) 28(19%) 50(32%) 14(9%) 2.97 1.22
Source: Business profit taxpayers survey and own computations (2015)
However, the respondents’ response for two of the questions in the above table (i.e. table 19)
is near to 3 depicting that they choose a neutral positions. Therefore, it’s possible to conclude
that respondents are not aware of or don’t want to give their opinion about the impact of the
current tax system on voluntary tax compliance (mean response of 2.97 and standard
deviations of 1.22) and the type of businesses that individuals are engaged for determinations
of the correct tax liability (mean response of 3.27 and standard deviations of 0.93).

Taxpayers’ tax compliance Behavior: Business Profit taxpayers’ in Addis Ababa (2015)
69
Table 20: Factors explaining Income Level of tax payers in the tax compliance behavior
IL
Tax systemdoesn’t takeinflation
Tax rate isvery high
Paying taxeshinder growthof business
Business typeencouragespaying taxes
Tax systemencouragesvoluntarycompliance
Low
Mean 3.25 2.13 3.13 3.00 2.13N 17 17 17 17 17Std.Dev.
1.035 .835 .991 .926 .641
Medium
Mean 3.74 3.63 3.04 3.15 2.63N 59 59 59 59 59Std.Dev.
1.059 1.043 1.091 .949 1.079
High
Mean 4.06 4.11 4.29 3.43 3.43N 77 77 77 77 77Std.Dev.
.802 .718 .710 .917 1.243
Total
Mean 3.84 3.70 3.67 3.27 2.97N 153 153 153 153 153Std.Dev.
.958 1.054 1.086 .931 1.215
Source: Business profit taxpayers survey and own computations (2015)
In additions to these, table 20 above depicts that whether income level of taxpayers’ affects
tax compliance behavior of businesses or not. In order to test those issues perceptions of
taxpayers on the proposed statements have been divided in to three levels such as Low,
Medium and High. Therefore, the result of the study shows that:
More than 50% of the respondents are agreed with the proposed statements i.e. income
level of taxpayers highly affects tax compliance behaviour of businesses. The mean
response in this category ranges from 3.43 to 4.29 and standard deviations ranges from
0.949 to 1.091.
The lowest mean value have been obtained from questions depicting that “I believe that
the current tax system encourages voluntary tax compliance behaviour (mean value of
2.97)” and “the type of business that taxpayers’ are engaged encourages them to pay the
correct amount of taxes (mean value 3.27)”.
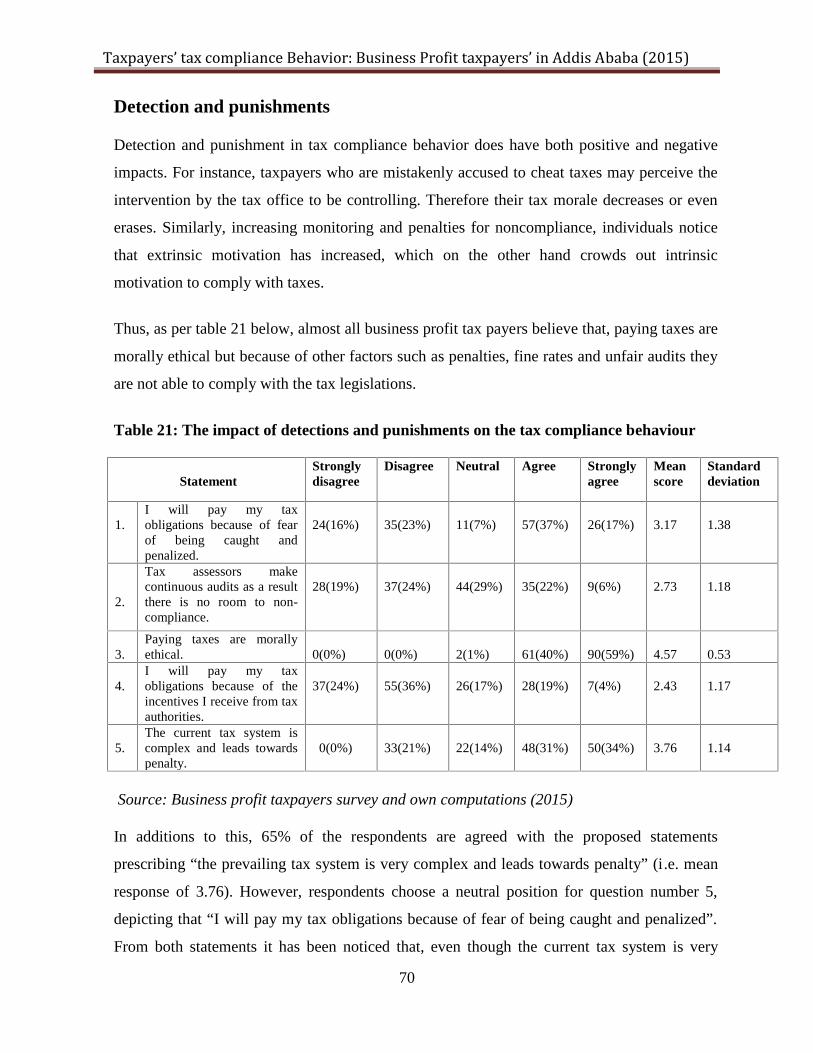
Taxpayers’ tax compliance Behavior: Business Profit taxpayers’ in Addis Ababa (2015)
70
Detection and punishments
Detection and punishment in tax compliance behavior does have both positive and negative
impacts. For instance, taxpayers who are mistakenly accused to cheat taxes may perceive the
intervention by the tax office to be controlling. Therefore their tax morale decreases or even
erases. Similarly, increasing monitoring and penalties for noncompliance, individuals notice
that extrinsic motivation has increased, which on the other hand crowds out intrinsic
motivation to comply with taxes.
Thus, as per table 21 below, almost all business profit tax payers believe that, paying taxes are
morally ethical but because of other factors such as penalties, fine rates and unfair audits they
are not able to comply with the tax legislations.
Table 21: The impact of detections and punishments on the tax compliance behaviour
StatementStronglydisagree
Disagree Neutral Agree Stronglyagree
Meanscore
Standarddeviation
1.I will pay my taxobligations because of fearof being caught andpenalized.
24(16%) 35(23%) 11(7%) 57(37%) 26(17%) 3.17 1.38
2.
Tax assessors makecontinuous audits as a resultthere is no room to non-compliance.
28(19%) 37(24%) 44(29%) 35(22%) 9(6%) 2.73 1.18
3.Paying taxes are morallyethical. 0(0%) 0(0%) 2(1%) 61(40%) 90(59%) 4.57 0.53
4.I will pay my taxobligations because of theincentives I receive from taxauthorities.
37(24%) 55(36%) 26(17%) 28(19%) 7(4%) 2.43 1.17
5.The current tax system iscomplex and leads towardspenalty.
0(0%) 33(21%) 22(14%) 48(31%) 50(34%) 3.76 1.14
Source: Business profit taxpayers survey and own computations (2015)
In additions to this, 65% of the respondents are agreed with the proposed statements
prescribing “the prevailing tax system is very complex and leads towards penalty” (i.e. mean
response of 3.76). However, respondents choose a neutral position for question number 5,
depicting that “I will pay my tax obligations because of fear of being caught and penalized”.
From both statements it has been noticed that, even though the current tax system is very

Taxpayers’ tax compliance Behavior: Business Profit taxpayers’ in Addis Ababa (2015)
71
complex and leads towards penalty, respondents are not aware of its impact on tax compliance
behavior.
As per table 22 below, perceptions of taxpayers’ have been divided in to three levels such as
Low, Medium and High. And, the assessment result shows that, the impact of detection and
punishment on tax compliance behavior is not as such significant since 54% of respondents
are fall in between high and low. However, the contributions of tax morality on the tax
compliance behavior of businesses have not been neglected. Because the highest mean value
i.e.4.57 has been obtained from questions prescribing “paying taxes are morally ethical”.
Nevertheless, Paying taxes due to the motives of receiving incentives from the government
and fear of continuous audits by the tax assessors doesn’t have as such significant impact in
affecting detection and punishments variable in a tax compliance behavior. The simple lesson
that we have taken from this part of the paper is that incentives and concessions, as is the case
with amnesties, must be properly designed to ensure that only those who are meant to benefit,
actually benefit from the preferential treatment.
Table 22: Factors explaining Detection and Punishments in tax compliance behavior
DP
fear of beingcaught andpenalized
continuous audits
Paying taxesare morallyethical
Paying taxesdue toincentives
The taxsystem iscomplex
LowMean 1.92 2.31 4.54 2.08 2.54N 28 28 28 28 28Std. Deviation .641 1.109 .519 .954 .877
Medium
Mean 3.29 2.26 4.63 2.34 3.76N 83 83 83 83 83Std. Deviation 1.450 .950 .541 1.122 1.051
HighMean 3.79 3.95 4.47 2.84 4.58N 42 42 42 42 42Std. Deviation 1.084 .705 .513 1.344 .607
TotalMean 3.17 2.73 4.57 2.43 3.76N 153 153 153 153 153Std. Deviation 1.383 1.179 .527 1.174 1.135
Source: Business profit taxpayers survey and own computations (2015)

Taxpayers’ tax compliance Behavior: Business Profit taxpayers’ in Addis Ababa (2015)
72
Perceptions on Government Spending
The central point discussed under this topic is that, if the government is wisely spending the
national revenue, for example for basic facilities like education, health and safety and public
transportation, it is likely that voluntary compliance will increase. In contrast, if taxpayers
perceive that the government is spending too much on something considered unnecessary or
unbeneficial to them then taxpayers will feel betrayed and attempt to evade. Therefore, the
mean response obtained from table 23 is less than 3 for two of the statements depicting that:
“I believe that the government spends the collected taxes wisely” (i.e. mean response of
2.60 and standard deviation of 1.15). Thus, based on this statements, it’s possible to say
that taxpayers’ in Addis Ababa city administrations perceives that the government doesn’t
spend the collected taxes wisely as a result they are always searching for any loopholes to
evade and avoid taxes.
“I believe that my business has benefiting from basic government spending like education,
health; safety and etc” (i.e. mean response of 2.91 and standard deviation of 1.13).
However, most of the respondents are agreed with the statements depicting that:-
“I believe that paying taxes are my obligation whether the government spends wisely or
not” (i.e. mean response of 4.14 and standard deviations of 0.98). Therefore, about 78% of
the taxpayers’ comply with the tax legislations without expectations of any financial as
well as non-financial benefit from the government. However, their compliance behaviour
has been emanated from escaping of penalty or cancellations of trade licenses by the
government authority.
“I believe that negative acts (i.e. corruption and fraud) of tax assessors encourage non-
compliance behaviour” (i.e. mean response of 4.11 and standard deviation of 1.16). The
survey result depicts that, non-compliance behaviour have been perpetrated by negative
acts of tax assessors and or immoral behaviour of the tax authority (i.e. 81% of the
respondents are agreed with the proposed statements).
Generally, based on the survey result, it’s possible to conclude that, many business owners in
Addis Ababa city administrations perceives that their businesses are not benefiting from the

Taxpayers’ tax compliance Behavior: Business Profit taxpayers’ in Addis Ababa (2015)
73
government spending on basic infrastructure in one way or another. This is mainly because of
income variability, bureaucracy and corruptions prevailing in the country.
Table 23: The impact of government spending on the tax compliance behavior
Statement Stronglydisagree
Disagree Neutral Agree Stronglyagree
Meanscore
Standarddeviation
1.I believe that thegovernment spends thecollected taxes wisely.
33(21%) 39(26%) 42(27%) 35(23%) 4(3%) 2.60 1.15
2.I believe that my businesshas benefiting from basicgovernment spending likeeducation, health, safetyand etc.
17(11%) 39(26%) 46(30%) 39(26%) 12(7%) 2.91 1.13
3.I believe that spending onbasic infrastructuresencourages voluntary taxcompliance.
12(7%) 17(11%) 28(19%) 46(30%) 50(33%) 3.70 1.24
4.I believe that negative acts(i.e. corruption and fraud)of tax assessors encouragenon-compliance behavior.
9(6%) 12(7%) 9(6%) 50(32%) 73(49%) 4.11 1.16
5.I believe that paying taxesare my obligation whetherthe government spendswisely or not.
4(3%) 4(3%) 25(16%) 53(34%) 67(44%) 4.14 0.98
Source: Business profit taxpayers survey and own computations (2015)
In additions to these, table 24 below depicts that whether perceptions on government spending
affects tax compliance behavior of businesses or not? In order to test those issues perceptions
of taxpayers on the proposed statements have been divided in to three levels such as Low,
Medium and High. Therefore, it’s possible to conclude that:
Up to 50% of the total population fall in the medium category. Therefore, perceptions on
government spending moderately affect tax compliance behaviour of businesses operating
in Addis Ababa city administrations. Moreover, most of the respondents perceive that the
government doesn’t spend the collected taxes wisely and their businesses are not
benefiting from the government spending.

Taxpayers’ tax compliance Behavior: Business Profit taxpayers’ in Addis Ababa (2015)
74
Table 24: Factors explaining Government spending in the tax compliance behavior
GS
Spendingwisely bythe gov’t
Benefitingfrominfrastructures
voluntarycompliance
negativeacts ofgov’t
payingtaxes aremyobligation
LowMean 1.54 2.00 1.92 3.00 3.54N 28 28 28 28 28Std. Deviation .519 1.000 .760 1.732 1.391
MediumMean 2.00 2.36 3.68 4.41 3.91N 48 48 48 48 48Std. Deviation .976 .902 1.129 .908 .921
HighMean 3.37 3.60 4.37 4.34 4.51N 77 77 77 77 77Std. Deviation .843 .847 .690 .765 .658
TotalMean 2.60 2.91 3.70 4.11 4.14N 153 153 153 153 153Std. Deviation 1.147 1.126 1.244 1.161 .982
Source: Business profit taxpayers survey and own computations (2015)
4.1.2 Correlation among variables
Table 25 below illustrates the Pearson correlation matrix for dependent and independent
variables. Based on Table 25, all independent variables were significantly correlated with tax
Compliance behavior and the highest correlation occurred between tax compliance and BF
(belief in fairness) (rs = .528) followed by IL (Income Level), DP (Detection and
Punishment), PG (Peer group influence), Tax Knowledge (TK) and GS (Perception on
government spending). According to univariate results in Table 25, it was suggested that BF,
IL, DP, PG, TK and GS were the most significant determinants. The significant correlations
here suggest that all independent variables are significant determinants of tax compliance.

Taxpayers’ tax compliance Behavior: Business Profit taxpayers’ in Addis Ababa (2015)
75
Table 25: Pearson correlation Matrix
**.Correlation is significant at the 0.01 level (2-tailed).*. Correlation is significant at the 0.05 level (2-tailed).Source: Business profit taxpayers survey and own computations (2015)
4.1.3 Multiple regressions Analysis
Multiple regression analysis is conducted to identify the relationship between tax compliance
behavior as dependent variable and the independent variables. The outputs of multiple
regressions are shown in (Table 26).
1 2 3 4 5 6 7
Tax Compliance 1.000
TK .327** 1.000
BF .531** .343 1.00
IL .474** -.277 .122 1.000
DP .451** -.113 .086 .429 1.000
GS .314** .083 .120 -.026 .302 1.000
PG .392** -.052 .235 .503 .315 -.025 1.000

Taxpayers’ tax compliance Behavior: Business Profit taxpayers’ in Addis Ababa (2015)
76
Table 26: Summary of the Standard Regression Model
Notes: Dependent variable – Tax compliance* Significant at p < 0.05** Significant at p < 0.01TC = α + β1TK +β2BF + β3PG+ β4IL + β5PD +β6GS + ei
TC = -0.372 + 0.248(TK) + 0.242(BF) + 0.345(PG) + 0.157(IL) + 0.156(DP) + 0.048(GS)Source: Business profit taxpayers survey and own computations (2015)
As can be seen in table 26 above, all correlations, except perception on government spending
were statistically significant. The result from multiple regressions indicated that tax
compliance behavior have been significantly influenced by five variables namely tax
knowledge, belief in fairness, Peer group influences, Income Level, Detection & Punishments.
Our multiple regression result also suggested that peer groups becomes the main factor with a
beta coefficient of .345, followed by Tax knowledge (β= .248), belief in fairness (β= .242),
income level (β =.157) and detection and punishments (β =.156). The estimated correlation
coefficient (R) and estimated coefficient of determination (R2) are estimated within the range
of .809 and .654, respectively.
Therefore, the R2 result shows that 65 percent of the independent variables explain the
dependent variable i.e. tax compliance behavior. Moreover, the results imply that peer groups
are highly and positively affect tax compliance behavior of businesses. Subsequently,
Variables R2 AdjustedR2
Pearsonr
Beta Std.Error
Structurecoefficients
sig
Effects on taxcompliance behavior
0.65 0.62
Constant 0.372 0.273 0.177
Tax knowledge 0.327 0.248 0.060 0.404 0.000**
Belief in fairness 0.531 0.242 0.066 0.656 0.001**
Peer group influences 0.474 0.345 0.079 0.586 0.000**
Income level 0.451 0.157 0.068 0.557 0.024*
Detection andpunishments
0.314 0.156 0.063 0.388 0.015*
Government spending 0.392 0.048 0.061 0.485 0.430
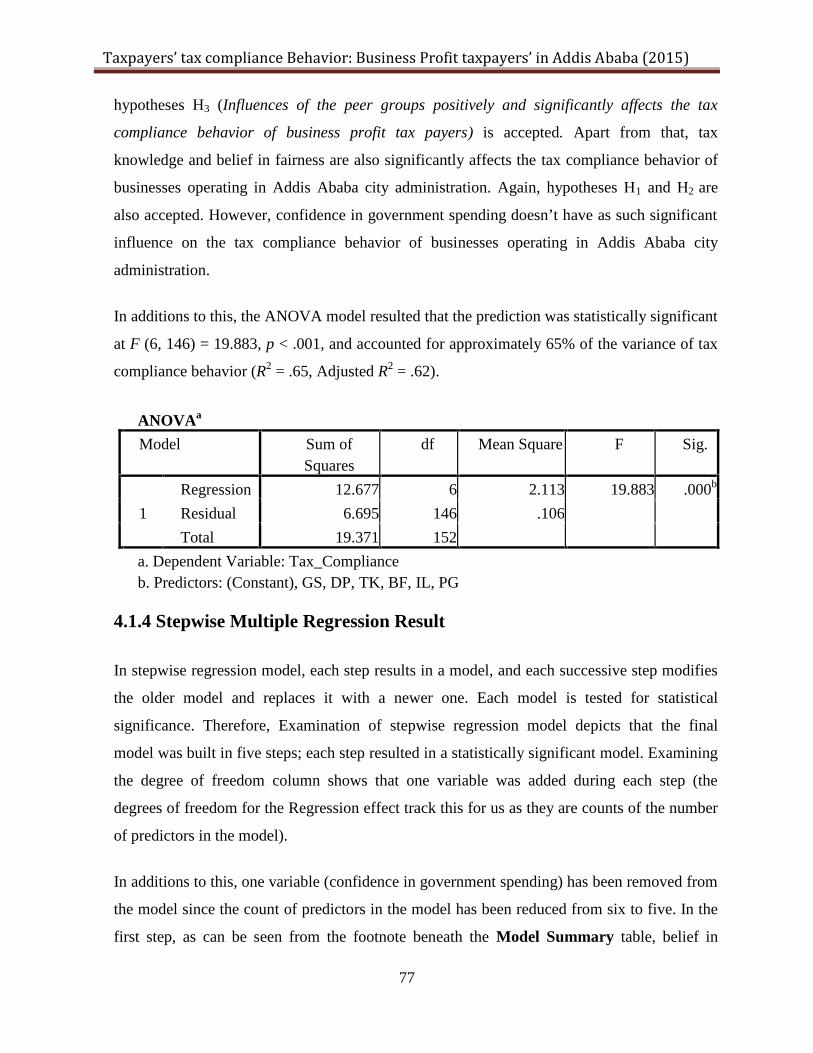
Taxpayers’ tax compliance Behavior: Business Profit taxpayers’ in Addis Ababa (2015)
77
hypotheses H3 (Influences of the peer groups positively and significantly affects the tax
compliance behavior of business profit tax payers) is accepted. Apart from that, tax
knowledge and belief in fairness are also significantly affects the tax compliance behavior of
businesses operating in Addis Ababa city administration. Again, hypotheses H1 and H2 are
also accepted. However, confidence in government spending doesn’t have as such significant
influence on the tax compliance behavior of businesses operating in Addis Ababa city
administration.
In additions to this, the ANOVA model resulted that the prediction was statistically significant
at F (6, 146) = 19.883, p < .001, and accounted for approximately 65% of the variance of tax
compliance behavior (R2 = .65, Adjusted R2 = .62).
ANOVAa
Model Sum ofSquares
df Mean Square F Sig.
1
Regression 12.677 6 2.113 19.883 .000b
Residual 6.695 146 .106
Total 19.371 152
a. Dependent Variable: Tax_Complianceb. Predictors: (Constant), GS, DP, TK, BF, IL, PG
4.1.4 Stepwise Multiple Regression Result
In stepwise regression model, each step results in a model, and each successive step modifies
the older model and replaces it with a newer one. Each model is tested for statistical
significance. Therefore, Examination of stepwise regression model depicts that the final
model was built in five steps; each step resulted in a statistically significant model. Examining
the degree of freedom column shows that one variable was added during each step (the
degrees of freedom for the Regression effect track this for us as they are counts of the number
of predictors in the model).
In additions to this, one variable (confidence in government spending) has been removed from
the model since the count of predictors in the model has been reduced from six to five. In the
first step, as can be seen from the footnote beneath the Model Summary table, belief in

Taxpayers’ tax compliance Behavior: Business Profit taxpayers’ in Addis Ababa (2015)
78
fairness was entered into the model. The R Square with that predictor in the model was .282.
Not coincidentally, that is the square of the correlation between tax compliance behavior and
belief in fairness (.5312 = .282), and is the value of R Square Change. On the second step,
positive affect was added to the model. The R Square with both predictors in the model was
.452; thus, the author gained .17 in the value of R Square (.452 – .282 = .17), and this is
reflected in the R Square Change for that step. By the time it’s possible to arrive at the end
of the fifth step, and the R Square value has reached .807. Note that this value is very close to
but not identical to the R2 value obtained under the standard method. Details of the fifth step
result have been shown on the following table:
Table 27: Summary of the Stepwise Regression Model
Notes: Dependent variable – Tax compliance* Significant at p < 0.05** Significant at p < 0.01Source: Business profit taxpayers survey and own computations (2015)
As can be seen in the above table of stepwise regression results that the differences are not
significant is due to the fact that these five variables did almost the same amount of predictive
work in much the same configuration as did the six predictors accomplished using the
standard method. And, it’s possible to conclude that belief in fairness, Peer group influences,
Income level, Tax knowledge and Detection and punishments were used in a stepwise
multiple regression analysis to predict tax compliance behavior and found similar results with
Variables R2 AdjustedR2
Pearson r
Beta Std.Error
Structurecoefficients
sig
Effects on taxcompliance behavior
0.65 0.62
Constant -0.365 0.272 0.184
Tax knowledge 0.327 0.249 0.059 0.405 0.000**
Belief in fairness 0.531 0.251 0.065 0.658 0.000**
Peer group influences 0.474 0.369 0.072 0.587 0.000**
Income level 0.451 0.165 0.067 0.559 0.017*
Detection andpunishments
0.314 0.152 0.062 0.389 0.018*
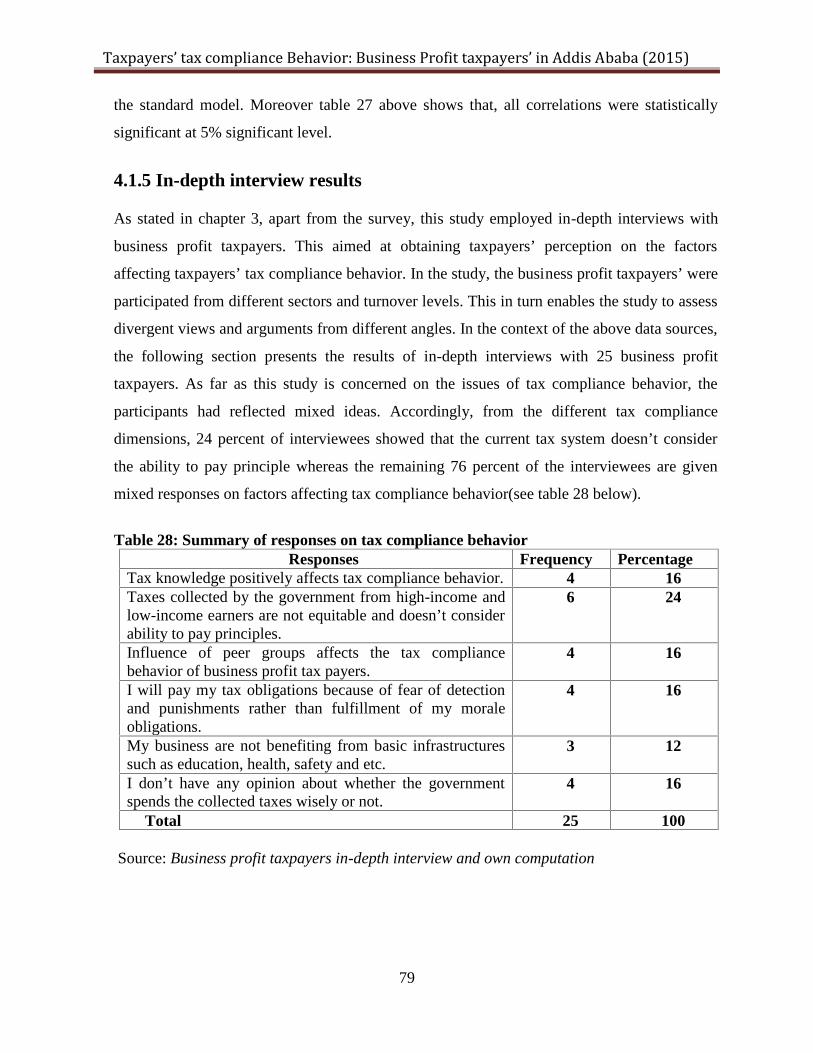
Taxpayers’ tax compliance Behavior: Business Profit taxpayers’ in Addis Ababa (2015)
79
the standard model. Moreover table 27 above shows that, all correlations were statistically
significant at 5% significant level.
4.1.5 In-depth interview results
As stated in chapter 3, apart from the survey, this study employed in-depth interviews with
business profit taxpayers. This aimed at obtaining taxpayers’ perception on the factors
affecting taxpayers’ tax compliance behavior. In the study, the business profit taxpayers’ were
participated from different sectors and turnover levels. This in turn enables the study to assess
divergent views and arguments from different angles. In the context of the above data sources,
the following section presents the results of in-depth interviews with 25 business profit
taxpayers. As far as this study is concerned on the issues of tax compliance behavior, the
participants had reflected mixed ideas. Accordingly, from the different tax compliance
dimensions, 24 percent of interviewees showed that the current tax system doesn’t consider
the ability to pay principle whereas the remaining 76 percent of the interviewees are given
mixed responses on factors affecting tax compliance behavior(see table 28 below).
Table 28: Summary of responses on tax compliance behaviorResponses Frequency Percentage
Tax knowledge positively affects tax compliance behavior. 4 16Taxes collected by the government from high-income andlow-income earners are not equitable and doesn’t considerability to pay principles.
6 24
Influence of peer groups affects the tax compliancebehavior of business profit tax payers.
4 16
I will pay my tax obligations because of fear of detectionand punishments rather than fulfillment of my moraleobligations.
4 16
My business are not benefiting from basic infrastructuressuch as education, health, safety and etc.
3 12
I don’t have any opinion about whether the governmentspends the collected taxes wisely or not.
4 16
Total 25 100
Source: Business profit taxpayers in-depth interview and own computation

Taxpayers’ tax compliance Behavior: Business Profit taxpayers’ in Addis Ababa (2015)
80
With respect to tax knowledge, researcher has sought that 60 percent of the participant had
replayed that there were many problems in understanding, completing and filing the tax return
form(s) and in understanding the tax system in general; whereas the remaining 40 percent
replayed that they don’t have detail knowledge on the prevailing tax system.
Besides this, 40 percent of participant of the interview reflected that the prevailing tax system
is complex and affects the tax compliance behavior of businesses. Whereas 24 percent of the
participant reflected that, the Ethiopian business profit tax rules are bulky and hard for
taxpayers to navigate. Furthermore, 20 percent of the participant agreed that the absence of the
tax structure and treatment procedure by itself is very complex (see table 29).
Table 29: Response on tax knowledge and understanding of the tax system
Response Frequency PercentageTax payers have only general knowledge and ideas of thetax system.
10 40
There are many problems in understanding, completing andfiling the tax return form(s) and in understanding the taxsystem in general.
15 60
Tax knowledge 25 100The prevailing tax system is complex and affects the taxcompliance behavior of businesses.
10 40
The Ethiopian business profit tax rules are bulky and hardfor taxpayers to navigate.
6 24
The tax structure and treatment procedure by itself is verycomplex.
5 20
Low level of readability and the tax return form andprocedure is unclear.
4 16
Understanding of the tax system 25 100
Source: Business profit taxpayers in-depth interview and own computation
To sum up the above mentioned results, quantitative and qualitative methods of inquiry,
namely survey and in-depth interview with business profit taxpayers were presented. Data
obtained through these methods were employed to investigate factors affecting tax compliance
behavior. The results of the different data collection methods revealed consistent findings.
However, in order to address the research problems of this study, as detailed in chapter 3, it is
crucial to examine the results of the different methods concurrently. It is therefore to pool the

Taxpayers’ tax compliance Behavior: Business Profit taxpayers’ in Addis Ababa (2015)
81
results presented in this section together and comprehensively address the research question
(specific research question) and hypotheses. The subsequent section, hence, endeavors to
analyze the results and address the research questions holistically.
4.2 Analysis
As stated in chapter 2 the general research question of this thesis is “Why business profit tax
payers’ comply with the tax legislations while the benefits of non-compliance is
outweighing?” In this context, the specific objective of the research is to explore factors
affecting taxpayers’ tax compliance behaviour in the case of the City of Addis Ababa.
Therefore, the purpose of this chapter is to address the specific research question and
hypotheses through considering broader objective of the study at large, using data presented in
the preceding sections. Accordingly, the following analysis presents; how the research
question and all the hypotheses were addressed. This is followed by a discussion of the
application of the findings to the research objectives.
Hypothesis 1, states that tax knowledge (demographic factor) affects the taxpaying attitudes
of business profit tax payers operating in Addis Ababa city administrations. Data obtained
from business profit taxpayers’ survey and in-depth interviews were employed to address this
specific research question and hypotheses. Based on table 11, 14 and 26 tax knowledge does
have both positive and negative impact on the tax morale or taxpaying attitude of business
profit tax payers. This tax knowledge’s shall be obtained through continuous training,
opportunities, expertise, and nearness to tax related information’s. The absolute levels of the
mean response in Table 14 are all below 4 except the one prescribing sharing knowledge with
ERCA increases the chance to determine the correct tax liability, the level indicating
agreement. It thus appears that companies see ERCA as an important source of information
but do not have a strong motivation to share information in a two-way process, despite the low
risk identified.
In additions to this, tax knowledge does have both positive and significant impact in affecting
the tax compliance behavior of businesses at 5 percent significant level indicating that
knowledge about the tax rules, regulations and procedures encourages business profit tax
payers to report and pay the correct tax liability. Moreover, majority of companies (86%)

Taxpayers’ tax compliance Behavior: Business Profit taxpayers’ in Addis Ababa (2015)
82
agree that sharing knowledge with ERCA enables the latter to determine the company’s
correct tax liability; while a minority (7%) believes that sharing knowledge enables ERCA to
increase tax liability. Moreover, structural coefficient obtained from table 26 depicts that a
unit interventional change of tax knowledge by holding other factors constant affects tax
compliance behavior by 0.404 indicating that tax knowledge significantly affects tax
compliance behavior of business profit tax payers’. Whereas the finding from interviews
shows that, lack of knowledge among business profit taxpayers caused difficulty for dealing
with tax matters; the main reason for this as the suggestion of taxpayers is the tax authority
does not provide any general, technical, and legal knowledge.
Therefore, considering the above findings it can be concluded that tax knowledge
(demographic factor) affects the taxpaying attitudes of business profit taxpayers operating in
Addis Ababa city administrations; as high tax knowledge encourages high tax compliance
behavior. This result is similar with the research done by Eriksen and Fallan which illustrated
the importance of tax education in a tax system. They suggested that fiscal knowledge
correlates with attitudes towards taxation and tax behavior and can be improved by a better
understanding of tax laws. Notwithstanding, not only tax knowledge affects tax payers tax
compliance behavior but there are also other factors which perpetrates taxpayers tax
compliance behavior.
Hypothesis 2, belief in fairness (attitude & perception factor) affects the tax compliance
behavior of business profit taxpayers. In order to test this variable the author incorporates
table 15, 16, 25 & 26. The mean responses obtained from table 15 are all near to 4.0 except
one question prescribing “my tax obligation is fair relative to others”. That means respondents
are neutral with this statements. However, the last two questions revealed that unreasonable,
intrusive audits and unfair penalties leads taxpayers towards stress and dissatisfaction (mean
response of 4.41 and standard deviation of 0.73); and the current tax system does have many
loopholes which leads taxpayers towards corruption and tax evasion (mean response of 4.27
& standard deviation of 0.99).
Rather than this, from the survey result the author understood that fairness issues such as
distributive justice, procedural justice and retributive justice have been highly affected by
taxpayers’ tax compliance behavior. For instance respondents believe that, the overall tax

Taxpayers’ tax compliance Behavior: Business Profit taxpayers’ in Addis Ababa (2015)
83
system in Addis Ababa city administration is not equitable; tax authorities don’t provide
sufficient and equitable information to all taxpayers; unreasonable, intrusive audits and unfair
penalties of tax assessors leads tax payers’ towards stress and dissatisfaction and the current
tax system does have many loopholes which leads taxpayers towards corruption and tax
evasion. Moreover, Pearson correlation matrix depicts that, the highest correlation i.e.0.531
has been occurred between the feeling of fairness perception and tax compliance behavior.
In additions to this, multiple regression result also shows that the feeling of fairness
perceptions significantly affects tax compliance behavior of businesses operating in Addis
Ababa city administration at 5% significant level; and structural coefficient obtained from
table 26 supports that a single interventional change in the feeling of fairness perceptions by
holding other factors constant affects tax compliance behavior by 0.656 indicating that the
feeling of fairness perceptions significantly affects tax compliance behavior of business.
Interview result also showed that most of the taxpayers’ believes that their tax obligation is
not fair relative to others; and tax related information’s are not disseminated equally; and
unfair penalties are set by tax assessors and the tax system by itself does have many loopholes
which leads taxpayers towards stress and dissatisfaction. Considering the above points it can
be concluded that, belief in fairness significantly and highly affects the tax compliance
behavior of business profit tax payers’.
Hypothesis 3, Influences of the peer groups (attitudes & perception) positively and
significantly affects the tax compliance behavior of business profit tax payers. This variable
has been analyzed using table 17, 18, 25 and 26. Thus, information about peer effects has
complicated and subtle impacts. These results clearly indicate that peer effects matter; that is,
knowing about how one’s neighbors are – or are not – complying with the tax laws changes
one’s own behavior, even if in perhaps unintended ways. The mean response(i.e.3.91)
obtained from table 17 depicts that positive peer attitudes (i.e. a belief that my neighbors are
reporting and paying tax honestly encourages me to report and pay the correct amount of
taxes) affects the tax compliance behavior of businesses operating in Addis Ababa city
administrations.

Taxpayers’ tax compliance Behavior: Business Profit taxpayers’ in Addis Ababa (2015)
84
Moreover, rewarding taxpayers (i.e. giving a trophy for being best tax payers) does have its
own impact in affecting the tax compliance behavior of businesses. Rather than this, about
72% of the total populations agreed with the statements prescribing “I will not evade taxes
because of the feeling of guilt and loss of self respect”. Therefore, it’s possible to conclude
that those taxpayers who don’t evade taxes and pay their tax obligations without any failure
because of the feeling of guilt and loss of self respect.
Moreover, Pearson correlation matrix of 0.392 depicts that the correlation between tax
compliance behavior and peer group influence is significant at 5% significant level and our
multiple regression result also shows that the influence of peer groups highly affects tax
compliance behavior of businesses at 1% significant level and our structure coefficient
obtained from table 26 depicts that an interventional change in one’s own behavior by
referring a reference group in a neighbor and by holding other factors constant affects tax
compliance behavior by 0.586 indicating that reference group in a neighbor significantly
affects tax compliance behavior of business profit tax payers. Therefore, it can be concluded
that, influences of the peer groups are positively and significantly affects the tax compliance
behavior of business profit tax payers in Addis Ababa city administrations.
Hypothesis 4, Income level of tax payers does have positive and significant impact on the tax
compliance behaviors of business profit tax payers. In order to analyze this variable table 19,
20, 25 and 26 have been used. The author had tested income level of taxpayers’ and its impact
on tax compliance behavior by incorporating an indirect question to maintain its reliability.
Therefore, the mean value obtained from table 19 reveals that, the current tax system doesn’t
take in to account inflation levels in the country (i.e. mean response of 3.84 and standard
deviations of 0.96); and depicting that the current tax system doesn’t consider the income
earning capability of businesses; and the highest and lowest tax brackets lags behind the
prevailing inflation level in the country.
In additions to this, the author has found positive results on question number 3 & 2(see table
19) with the mean response of 3.70 & 3.67 and standard deviations of 1.05 & 1.08
respectively. Considering those results, it’s possible to conclude that “Paying taxes hinders
sustainable growth of businesses and the applicable tax rate is very high and deteriorates the

Taxpayers’ tax compliance Behavior: Business Profit taxpayers’ in Addis Ababa (2015)
85
income earning capability of businesses”. Pearson correlation matrix also reveals that the
correlation between tax compliance behavior and income level of taxpayers pegged at 0.474
and shows that tax compliance behavior have been highly affected by income level business
profit taxpayers. In additions to this, structure coefficient shown in the multiple regression
models prescribes that an interventional change in the income level of business profit
taxpayers by holding other factors constant affects tax compliance behavior by 0.557. Other
than this; significance level shown on table 26 depicts that income level of taxpayers
significantly affects tax compliance behavior at 5% significance level. Therefore, it’s possible
to conclude that, income level of tax payers does have positive and significant impact on the
tax compliance behaviors of business profit tax payers. This result goes with Fischer’s model,
as source of income, level of income and occupation are considered as factors providing
opportunity for tax noncompliance.
Our interview result also supports the findings obtained from survey instruments. For
instance, as stated by many business owners inflation level prevailing in the country does have
significant impact in affecting the tax compliance behavior of businesses as the tax rates,
exemptions and penalties are not exposed to modifications in line with the inflation level
prevailing in the country. In additions to this, many business owners believes that paying
taxes hinder sustainable growth of business as some portion of their incomes goes to the
government. Therefore, in order to improve tax compliance behavior the government must
implement various policy mechanisms such as encouraging tax payers to pay their tax
obligations voluntarily without the interference of third parties; and revising the applicable tax
rates in line with the inflation levels. However, Income level of taxpayers is not the only
factor threatening tax compliance behavior but there are also other factors which affects tax
compliance behavior.
Hypothesis 5, Feeling of detection and punishments by the tax authorities does have
significant impact on the tax compliance behaviors of business profit tax payers. In order to
analyze this variable we have used table 21, 22, 25 and 26. The mean response of 4.57
obtained from table 21 depicts that almost all of business profit tax payers believe that, paying
taxes are morally ethical but because of other factors such as penalties, fine rates and unfair
audits they are not able to comply with the tax legislations.

Taxpayers’ tax compliance Behavior: Business Profit taxpayers’ in Addis Ababa (2015)
86
In additions to this, 65% of the respondents are agreed with the proposed statements
prescribing “the prevailing tax system is very complex and leads towards penalty” (i.e. mean
response of 3.76). Moreover, respondents choose a neutral position for question number 5,
depicting that “I will pay my tax obligations because of fear of being caught and penalized”.
From both statements we can conclude that, even though the current tax system is very
complex and leads towards penalty, respondents are not aware of its impacts on tax
compliance behavior as a result it requires further investigations. Moreover table 22 depicts
that, the impact of detection and punishment on tax compliance behavior is not as such
significant since 54% of respondents are fall in between. However, we don’t neglect the
impact of tax morality on the tax compliance behavior of businesses since the highest mean
value i.e.4.57 has been obtained from questions prescribing “paying taxes are morally ethical”
rather than fear of detections and punishments. Furthermore, Pearson correlation matrix of
0.451 reveals that the correlation between detection and punishments’ and tax compliance
behavior is significant at 1% significance level (see table 25). Our multiple regression models
on table 26 shows that, structure coefficient of 0.388 prescribes that an interventional change
in the detection and punishment variables by holding other factors constant affects tax
compliance behavior significantly at 5% significance level.
Considering the aforementioned results it’s possible to conclude that feeling of detection and
punishments variable does have significant impact in affecting the tax compliance behavior of
businesses. However, the feeling of being audited, detected and punished doesn’t lead
taxpayers’ towards paying their taxes rather this kind of feelings erodes the already
maintained tax morality of businesses. This result opposes with the economics-of-crime
approach which concludes that an individual pays taxes because – and only because – of the
economic consequences of detection and punishments and the government can encourage
greater tax compliance by increasing the audit and the penalty rates of its regulatory regime.
In additions to this, 39% of our interview result reveals that taxpayers’ in Addis Ababa city
administration pay their tax obligation not because of fear of being caught and penalized but
they believes that paying taxes are morally ethical. In additions to this, Paying taxes because
of receiving incentives from the government and fear of continuous audits by the tax assessors
doesn’t have significant impact in affecting detection and punishments variable. Detection and
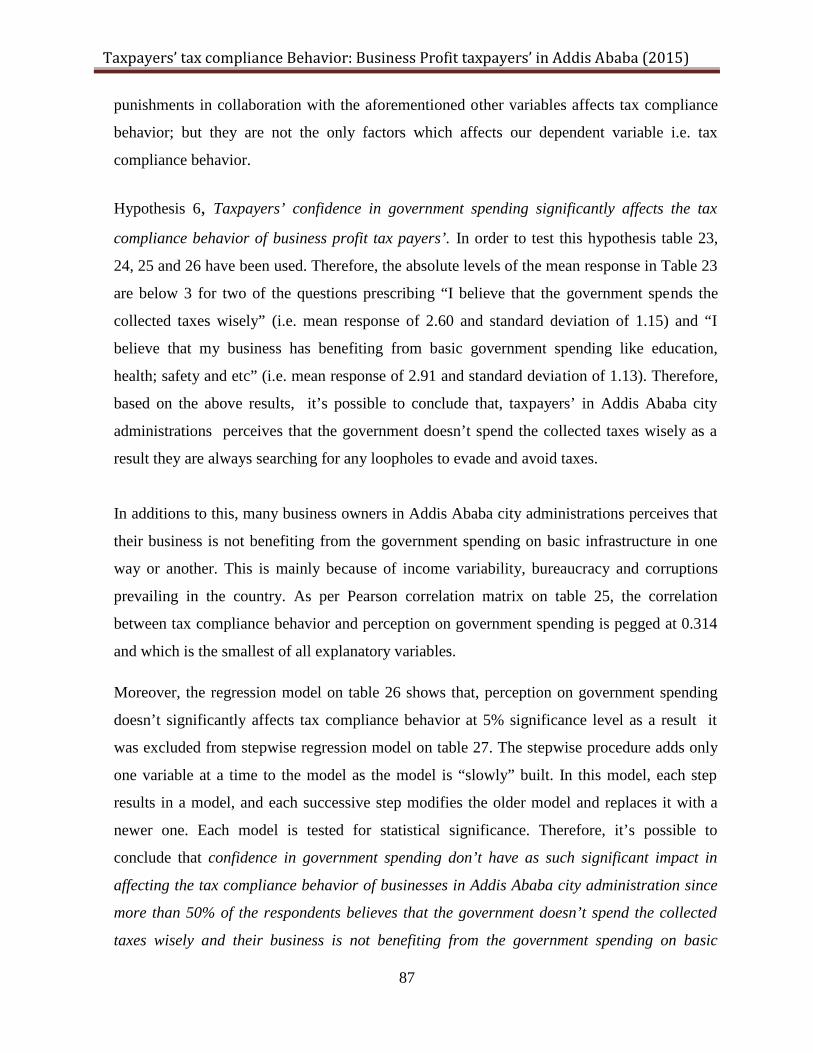
Taxpayers’ tax compliance Behavior: Business Profit taxpayers’ in Addis Ababa (2015)
87
punishments in collaboration with the aforementioned other variables affects tax compliance
behavior; but they are not the only factors which affects our dependent variable i.e. tax
compliance behavior.
Hypothesis 6, Taxpayers’ confidence in government spending significantly affects the tax
compliance behavior of business profit tax payers’. In order to test this hypothesis table 23,
24, 25 and 26 have been used. Therefore, the absolute levels of the mean response in Table 23
are below 3 for two of the questions prescribing “I believe that the government spends the
collected taxes wisely” (i.e. mean response of 2.60 and standard deviation of 1.15) and “I
believe that my business has benefiting from basic government spending like education,
health; safety and etc” (i.e. mean response of 2.91 and standard deviation of 1.13). Therefore,
based on the above results, it’s possible to conclude that, taxpayers’ in Addis Ababa city
administrations perceives that the government doesn’t spend the collected taxes wisely as a
result they are always searching for any loopholes to evade and avoid taxes.
In additions to this, many business owners in Addis Ababa city administrations perceives that
their business is not benefiting from the government spending on basic infrastructure in one
way or another. This is mainly because of income variability, bureaucracy and corruptions
prevailing in the country. As per Pearson correlation matrix on table 25, the correlation
between tax compliance behavior and perception on government spending is pegged at 0.314
and which is the smallest of all explanatory variables.
Moreover, the regression model on table 26 shows that, perception on government spending
doesn’t significantly affects tax compliance behavior at 5% significance level as a result it
was excluded from stepwise regression model on table 27. The stepwise procedure adds only
one variable at a time to the model as the model is “slowly” built. In this model, each step
results in a model, and each successive step modifies the older model and replaces it with a
newer one. Each model is tested for statistical significance. Therefore, it’s possible to
conclude that confidence in government spending don’t have as such significant impact in
affecting the tax compliance behavior of businesses in Addis Ababa city administration since
more than 50% of the respondents believes that the government doesn’t spend the collected
taxes wisely and their business is not benefiting from the government spending on basic

Taxpayers’ tax compliance Behavior: Business Profit taxpayers’ in Addis Ababa (2015)
88
infrastructure in one way or another. As per this paper, perception on government spending
negatively affects tax compliance behavior of businesses. This result have also been confirmed
by our interview with the taxpayers operating in Addis Ababa city administrations because
most of the respondents believes that the government doesn’t wisely spend the national
revenue, for basic facilities like education, health and safety and public transportation. In
additions to this, respondents perceive that the government is spending too much on
something considered unnecessary or unbeneficial to them and they will feel betrayed and
attempt to evade.
4.3 Conclusions
To sum up, the discussions in this chapter endeavoured to integrate the results of the
quantitative and qualitative methods so as to address the specific research question and
hypotheses and achieve the objectives of the research holistically. However, the findings in
this study are not without weaknesses. The subsequent chapter, thus, presents the strengths
and weaknesses of the study coupled with implications to the tax authorities and the literature
with future research directions.

Taxpayers’ tax compliance Behavior: Business Profit taxpayers’ in Addis Ababa (2015)
89
Chapter 5: Conclusions and Recommendations
This chapter presents the conclusions and recommendations. The purpose of the chapter is to
review the whole thesis and highlight future research directions. Accordingly, section one
presents overview of the thesis and its major findings while the second section presents the
recommendations with future research directions. The third section covers the contribution of
the thesis to the literature and tax authority. The limitations of the thesis presented in the last
section.
5.1 Major findings/Conclusions
Based on the preceding analysis the paper has drawn the following conclusions/findings:
o Firstly, tax compliance behaviour have been affected by Belief in Fairness, Income Level,
Detection and Punishment, Peer group influence and Tax knowledge while confidence in
government spending doesn’t have as such significant impact in affecting the tax
compliance behaviour of businesses. Perceptions on government spending appear to be
not significantly correlated with tax compliance decisions.
o Secondly, the current tax system does have many loopholes (i.e. arbitrary estimation of
taxes) which erode the tax compliance behaviour of businesses. For instance, Mini and
micro business owners do not keep their books properly as a result they are exposed to
violation of the record keeping requirement of the government so their tax obligation
should be imposed based on subjective estimation. This subjective estimation of tax leads
the tax assessors towards corruption and illegal implementation of the tax policy.
Therefore, unreasonable, intrusive audits and unfair penalties of tax assessors in Addis
Ababa city administration lead taxpayers towards stress and dissatisfaction.
o Thirdly, positive peer attitudes and rewarding taxpayers (i.e. giving a trophy for being best
tax payers) does have its own impact in affecting the tax compliance behaviour of
businesses. However, paying taxes due to the motives of receiving incentives from the
government and fear of continuous audits by the tax assessors doesn’t have as such
significant impact in affecting detection and punishment variable in our tax compliance
behaviour model. The simple lesson that we have taken from this part of the paper is that
incentives and concessions, as is the case with amnesties, must be properly designed to

Taxpayers’ tax compliance Behavior: Business Profit taxpayers’ in Addis Ababa (2015)
90
ensure that only those who are meant to benefit, actually benefit from the preferential
treatment.
o Fourthly, the current tax system doesn’t take in to account the prevailing inflation level
and the income earning capability of businesses; and the highest and lowest tax brackets
lags behind the prevailing inflation level in the country. For example, the tax-exempt
income threshold is considered to be very low and as a result micro and small businesses,
which normally generate meagre income from their activities, are obliged to pay taxes,
which they could not afford.
o Fifthly, detection and punishment in tax compliance behaviour does have both positive
and negative impacts. For instance, taxpayers’ who are mistakenly accused to cheat on
their taxes may perceive the intervention by the tax office to be controlling. Therefore
their tax morale decreases or even erases. Similarly, increasing monitoring and penalties
for noncompliance, individuals notice that extrinsic motivation has increased, which on
the other hand crowds out intrinsic motivation to comply with taxes.
o Sixths, the R2 result shows that 65 percent of the independent variables explain the
dependent variable i.e. tax compliance behaviour. Moreover, the results imply that most of
the variables except confidence in government spending are highly affects tax compliance
behaviour of businesses.
o Finally, stepwise regression result shows that the differences with the standard method are
not significant is due to the fact that these five variables did almost the same amount of
predictive work in much the same configuration as did the six predictors accomplished
using the standard method.
From the above findings, what the paper generally conclude that, though there have been
considerable attempts and progresses to improve taxation system in the City, there are
significant drawbacks. Unless these strains are resolved there might not be changed the
perceptions and attitudes of the taxpayers as well as the social and economic development of
the city.

Taxpayers’ tax compliance Behavior: Business Profit taxpayers’ in Addis Ababa (2015)
91
5.2 Recommendations
Based on the study conducted using survey method and in depth interviews; factors affecting
taxpayers’ tax compliance behavior have been identified and possible recommendations
would be forwarded so that it may help the tax authority and other policy makers to approach
the issue accordingly.
o According to the result, the taxpayers’ need various social services (such as school, road,
electricity, transportation, telecommunications and etc) from the government in return of
what they have paid as a tax. If there is no provision of sufficient services, the willingness
and motivation of the taxpayers’ to pay their tax obligation in full and on timely basis may
be affected, i.e. the taxpayers’ perceive that their money is being misappropriated or used
for meaningless purposes. Therefore, the government should be transparent for the
taxpayers’ money and the service provided to the society.
o The tax authority educating the public must be considered crucial. It is possible through
tax education, concepts of taxation and tax knowledge shall be imparted. Furthermore,
taxpayers’ need more information about their tax obligations and their role in promoting
the growth of the economy of the country and the well-being of its citizens.
o In order to improve taxpayers’ tax compliance behaviour the government must build
transparent, non-bureaucratic, questionable and responsible institutions which in one way
or another supports the tax collection tasks and encourages business profit taxpayers’ to
pay their tax obligations without any setbacks.
o A transparent and accountable tax administration that is service-oriented is likely to have a
positive impact on public trust. If the revenue is furthermore properly spent in terms of a
budget which the taxpayers’ find agreeable, compliance should increase.
o Incentives and concessions, as is the case with amnesties, must be properly designed to
ensure that only those who are meant to benefit, actually benefit from the preferential
treatment. Too much political and/or administrative discretion to grant exemptions or
other forms of tax relief should also be avoided.
o Providing taxpayers’ with various payment options (e.g. banks, supermarkets, internet,
ward offices), easy filing, and assistance (e.g. on-line or at shopping malls and sports

Taxpayers’ tax compliance Behavior: Business Profit taxpayers’ in Addis Ababa (2015)
92
stadiums) not only reduces actual compliance costs, but can reduce unintentional non-
compliance.
o The tax imposed by the government body has an impact on the firm’s profitability and its
existence as a firm. So, it is imperative from the government side to critically evaluate and
understand the income level of the firm before imposing a tax rate.
o Many business owners do not keep their books properly, which invited to general
estimations, which are often arbitrary. So training is necessary on the one hand and on the
other hand, national standards for bookkeeping, which would be respected in all taxation
office nationwide, need to be defined and introduced.
5.3 Contribution and implications of the study
The findings of this study expected to provide updated information and advanced practices on
taxpayers’ tax compliance behavior which is happening in the city. In the researchers’ view,
the results of this study have contributed to the tax literature as well as to the tax authorities.
The contributions are discussed below:-
To the literature
This study contributes to the existing literature in several ways. First, no prior work has been
performed in this area (i.e. taxpayers’ tax compliance behavior) in our country especially in
Addis Ababa city administration. Thus, the findings documented in this study will be a
“stepping stone” for more studies in the future. Second, the mixed-method approach
undertaken in this study provides complementary views from different perspectives. While the
survey results emphasize the predictive power and significance level of the analysis, the in-
depth interviews enhance the findings by providing explanations that are more detailed.
Finally, this study helps as instrument for future researchers intending to study taxpayers’ tax
compliance behavior by incorporating other variables not mentioned in this paper.
To the tax authorities
In addition to advancing academic knowledge in the taxation area, this study has also its own
practical implications. First, the results of this study provides implications for the government

Taxpayers’ tax compliance Behavior: Business Profit taxpayers’ in Addis Ababa (2015)
93
that specific insights should allow policy makers to gain better understanding of the key
variables that are significantly associated with tax compliance and enable them to implement
suitable strategies to minimize potentially damaging factors, and should also allow them to
improve a government’s tax revenue collections. Secondly, the role of the tax authority in
minimizing the tax gap and in increasing voluntary compliance was found to be very
important as the government has been placed as the main influencing factor in relation to tax
compliance behavior. Finally, the government plays a central role through designing and
enforcing the tax systems, and collecting taxes.
5.4 Limitations of the research
In spite of the significant contributions of this study, it has also a number of limitations. The
first is the inherent weaknesses with the survey approach itself, like the respondents’ differing
interpretation of the questions. However, it was acknowledged that these weaknesses may
remain to some extent. For example, in terms of the different interpretation of the questions by
respondents, the researcher has made reasonable efforts to ensure the wording and sentences
were straightforward and precise. In terms of the interview approach, the main weakness is
probably the use of similar samples for the survey.
On the other hand, the study only used business profit taxpayers’ (i.e. schedule C type of the
taxpayers’) who are largely sole proprietors and Private Limited Companies. Thus, this is very
difficult to generalize this research paper to other group of the taxpayers. Besides, the
respondents’ attitudes in the course of giving responses perceived to be encountered with the
government as a result some of them are not willing to give feedbacks to all of the questions
incorporated under this study. Moreover, the absence of adequate source of materials made
the work more complex. Unless the undying effort of the researcher exerted for each of the
protracted problems the paper would not been reaching to this status.

Taxpayers’ tax compliance Behavior: Business Profit taxpayers’ in Addis Ababa (2015)
94
References
Abdul-Jabbar, H and Pope, J, (2008). “Exploring the relationship between tax compliance
costs and compliance issues in Malaysia”. Journal of Applied Law and Policy. pp 1–20.
Ajzen, I. (1991). Theory of planned behavior. Organizational Behavior and Human Decision
Processes, 50, 179-211.
Allingham, M. G., & Sandmo, A.(1972). Income Tax Evasion: A Theoretical Analysis.
Journal of Public Economics, 1, 323-338.
Alm, J. (1999). Tax compliance and tax administration. In H. W. Bartley, Handbook on
taxation. New York: Marcel Deker.
Alm, J., McClelland, G. H., & Schulze, W. D. (1992). Why do people pay taxes? Journal of
Public Economic, 48(1), 21-38.
Alm, J., Jackson B.R & McKee, M. (1992), “Estimating the Determinants of Taxpayer and
prospects”, Journal of Accounting Research, Vol 5, pp. 125-165.
Andreoni, J., Erard, B., & Feinstein, J. (1998). Tax compliance. Journal of Economic
Literature, 36, 818 860.
Banerjee, A.V.(1992).A simple Model of herd behavior. The Quarterly Journal of Economics,
107,797-817.
Becker, Gary S. (1968). “Crime and Punishment – An Economic Approach”. The Journal of
Political Economy 76 (2): 169-217.
Benno Torgler. (2003). Tax morale and institutions. Center for research in economics,
management and the arts. Working paper No. 2003-09.
Bird, R.M. and Zolt, E. (2003). “Introduction to Tax Policy Design and Development”.
Notes for a course on Practical Issues of Tax Policy in Developing Countries, World
Bank.
Bosco, L., Mittone, L., (1997). Tax evasion and moral constraints: some experimental
evidence. KYKLOS 50, 297–324.
Chan, C. W., Troutman, C. S., & O'Bryan, D. (2000). An expanded model of taxpayer
compliance: Empirical evidence from USA and Hong kong. Journal of International
Accounting, Auditing and Taxation, 9(2), 83-103.

Taxpayers’ tax compliance Behavior: Business Profit taxpayers’ in Addis Ababa (2015)
95
Beron, K.J., Tuachen, H.V., and Witte, A.D. (1992). The effect of audits and socioeconomic
variables on tax compliance. In Slemrod, J. (ed.), Why People Pay Taxes?: Tax
Compliance and Enforcement. Ann Arbor. University of Michigan Press.
Council of Ministers Income Tax Regulations No. 78/2002
Clotfelter CT(1983). Tax evasion and tax rates: An analysis of individual returns.
Rev.Econ.stat., 65(3):36373.
Creswell, J W (2003), Research design: qualitative, quantitative and mixed methods
approaches, 2nd ed., Sage Publications, California.
Dubin, J. A., Graetz, M. A., & Wilde, L. L. (1987). Are we a nation of tax cheater?: New
econometric evidence on tax compliance. American Economic Review, 77(2), 240-245.
Suresh Vadde.(2014). Compliance and non-compliance behavior of business profit tax
payers’ towards the tax system. A case study of Mekelle City, Ethiopia. Scholars
journal of Economics, Business and Management 2014,1(10):525-531.
Extracts from the 1995 Ethiopian Constitution, the fiscal provisions.
Evans, C. (2008). Taxation compliance and administrative costs: An overview. In: Lang, M.,
Obermair, J., Schuch, J., Staringer, C. & Weninger, P. (eds.) Tax compliance for
companies in an enlarged European Community. The Netherlands: Kluwer Law
International & London: Linde Verlag.
Erard, B., & Feinstein, J. S. (1994). The role of moral sentiments and audit perceptions in tax
compliance. Public Finance, 49(2),70-89.
Eriksen, K., and Fallan, L. (1996). Tax knowledge and attitudes towards taxation: A report
on a quasi experiment. Journal of Economic Psychology, 17, 387–402.
Fischer, C.M., Wartick, M, & Mark, M.M. (1992). Detection probability and taxpayer
compliance: a review of the literature. Journal of Accounting Literature, 11, 1-46.
Fischer, P., and S. Huddart. (2008). Optimal contracting with endogenous social norms. The
American Economic Review 98: 1459-1475.
Fishbein, M., and Ajzen, I. (1975). Belief, Attitude, Intention and Behavior: An Introduction
to Theory and Research. Massachusetts: Addison-Wesley.
Fjeldstad, et.al.(2001).Why people pay taxes: The case of the development levy in Tanzania.
World development, 29, 2059-2074.
Fowler, F J (1984), Survey research methods, SAGA publications, California
Taxpayers’ tax compliance Behavior: Business Profit taxpayers’ in Addis Ababa (2015)
96
Franzoni, L. (2000). Tax evasion and tax compliance. Encyclopedia of Law and Economic,
Volume VI. In Boukaertm B., De Geest, G. (Eds.), The Economic and Public Tax Law.
Cheltenham: Edward Elgar.
Frey, B. S. (1997). Not Just for the Money. An Economic Theory of Personal Motivation.
Cheltenham, UK, Edward Elgar Publishing.
Frey, B., & Feld, L. (2002). Deterrence and morale in taxation: An empirical analysis.
Working paper No760.
Graetz, Michael J., and Louis L. Wilde. (1985). “The Economics of Tax Compliance: Facts
and Fantasy.” National Tax Journal 38:355–363.
Groenland, E. A., & van Veldhoven, G. M. (1983). Tax evasion behavioral psychological
framework. Journal of Economic Psychology , 3(2), 129-144.
Grasmick, H.G., & Scott, W.J. (1982). Tax evasion and mechanisms of social control: a
comparison with grand and petty theft. Journal of Economic Psychology, 2, 213-230.
Harris, T.D. (1989). The effect of type of tax knowledge on individuals’ perceptions of
fairness and compliance with the federal income tax system: An empirical study. PhD
Thesis, University of South Carolina.
Hasseldine, J., and Hite, P. (2003). Framing, gender and tax compliance. Journal of
Economic Psychology, 24 (4), 517-533.
Income Tax Proclamation No. 286/2002.
Jackson, B. R., & Millron, V. C. (1986). Tax compliance research: Finding, problem and
prospects. Journal of Accounting Literature, 5, 125-165.
Jackson, B. R., and V. C. Milliron. (1989). Tax preparers: Government agents or client
advocates? Journal of Accountancy 167 (5): 76-82.
John.C.Mowen.(1987). Consumer Behavior.
Jean Hindriks,et.al (1999). Corruption, extortion and evasion. Journal of public Economics
74(1999), 395-430.
Kelman (1958). Compliance, identification, and internalization: Three processes of attitude
change. Journal of Conflict Resolution 2 (1), 51-60.
Kelman, H. (1965). Manipulation of Human Behavior: An Ethical Dilemma for the Social
Scientist, Journal of Social Issues. 21: 31-46.

Taxpayers’ tax compliance Behavior: Business Profit taxpayers’ in Addis Ababa (2015)
97
Kirchler E.(2007). The economic psychology of tax behavior. Cambridge: Cambridge
University Press..
Kirchler et.al. (2008). Enforced verses Voluntary tax compliance: the “slippery slope”
framework. Journal of economic Pychology, 29,210-225.
Lewis, A. (1982). The psychology of taxation. Oxford: Martin Robert.
Lindbeck, A. (1995). Welfare state disincentives with endogenous habits and norms. The
Scandinavian Journal of Economics 97 (4): 477-494.
Manaf, N.A., Hasseldine, J., and Hodges, R. (2005). The determinants of Malaysian land
taxpayers’ compliance attitudes. eJournal of Tax Research, 3(2), 206-21.
McKerchar, M. (2010). Design and conduct of research in tax, law, and accounting. Sydney:
Thomson Reuters.
McBarnet D (2001). When compliance is not the solution but the problem: From changes in
law to changes in attitude. Canberra: Australian National University, centre for tax
system integrity.
McCluskey, W.J. and Franzsen, R.C.D. Forthcoming. “Property Taxes in Metropolitan
Cities”. In Bahl, R., Linn, J. and Wetzel, D. (eds) Metropolitan Government Finance in
Developing Countries, Lincoln Institute of Land Policy: Cambridge Massachusetts.
Mikesell, J.L. and Birskyte, L. (2007). “The Tax Compliance Puzzle: Evidence from Theory
and Practice” International Journal of Public Finance.
Mohamad Ali, A., Mustafa, H., and Asri, M. (2007). The effects of knowledge on tax
compliance behaviors among Malaysian taxpayers. International Conference on
Business and Information July 11-13, Tokyo, Japan.
Orviska, M., and Hudson, J. (2002). Tax evasion, civic duty and the law abiding citizen.
European Journal of Political Economy, 19(1), 83-102.
Persoon,A.(2008). The institutional sources of statehood- Assimilation, multiculturalism and
taxation in sub-Saharan Africa. Doctoral thesis, Gothengurg University.
Porcano, T.M. (1988). Correlates of tax evasion. Journal of Economic Psychology 9(1), 47-
67.
Palil, M.(2010). Tax knowledge and tax compliance Determinants in self assessment system
in Malaysia. Unpublished doctoral thesis, University of Birmingham.

Taxpayers’ tax compliance Behavior: Business Profit taxpayers’ in Addis Ababa (2015)
98
Richupan, S.(1987).Determinants of income tax evasion: Role of tax rate, shape of tax
schedules and other factors. In: Gandhi, V.P. (ed). International Monetary Fund.
Richardson, G. (2006). Determinants of tax evasion: A cross country investigation. Journal of
International of Accounting, Auditing and Taxation, 15(2), 150-169.
Richardson, G. (2008). The relationship between cultural and tax evasion across country:
Additional evidences and extension. Journal of International Accounting, Auditing and
Taxation, 17(2), 67-78.
Roberts, L.H., Hite, P.A., and Bradley, C.F. (1994). Understanding attitudes toward
progressive taxation. Public Opinion Quarterly, 58, 165-190.
Schmölders, G. (1970). Survey Research in Public Finance: A Behavioral Approach to
Fiscal Theory, Public Finance. 25: 300-306.
Singh, V. (2003). Malaysian Tax Administration. 6th ed. Kuala Lumpur: Longman.
Smith, A. (1776). The Wealth of Nation. London: Penguin Books.
Smulders S, Stiglingh M, Franzsen R and Fletcher L. (2012). “Tax compliance costs for the
small business sector in South Africa – establishing a baseline” eJournal of Tax
Research (Australia).
Snavely, K.(1990). Governmental policies to reduce tax evasion: Coerced behavior versus
services and values development. Policy sciences, 23, 57-72.
Song, Y., & Yarbrough, T. (1978).Tax ethics and taxpayer attitudes: A survey. Public
Administration Review, 38(5), 442-452.
Spicer MN, Lundstedt SB (1976). Understanding Tax Evasion. Public Finance. 31:295-305.
Spicer, M.W., and Becker, L.M. (1980). Fiscal inequity and tax evasion: an experimental
approach. National Tax Journal, 33(2), 171-175.
Strümpel, B. (1969). The Contribution of Survey Research to Public Finance: A. T. Peacock
(ed.), Quantitative Analysis in Public Finance. New York: Praeger Press: 14-32.
Sutherland E (1949). White Collar Crime New York: Dryden
Tabachnick, B. G., & Fidell, L. S. (2001). Using multivariate statistics (4th ed.) Boston:
Allyn and Bacon.
Terkper, S. (2003). Managing small and medium size taxpayers in developing economies.
Tax Note International, 211-234.
Taxpayers’ tax compliance Behavior: Business Profit taxpayers’ in Addis Ababa (2015)
99
Tilahun Aemiro et.al (2014). Determinants of tax compliance behavior in Ethiopia: The case
of Bahirdar City Taxpayers. Journal of Economics and Sustainable Development,
Vol.5, No.15, 2014.
Tittle, C. R. (1980). Sanctions and social deviance: The question of deterrence. New York:
Praeger .
Torgler, B. (2003). Tax morale: Theory and analysis of tax compliance. Unpublished
doctoral dissertion, University of Zurich, Switzerland.
Torgler, B. (2007). Tax compliance and tax morale. Cheltenham: Edward Elgar Publishing
Ltd.
Torgler, B., & Schneider, F. (2001). Attitudes towards paying taxes in Austria: An empirical
analysis. Empirica, 32, 231-250.
Troutman, C.S. (1993). Moral commitment to tax compliance as measured by the
development of moral reasoning and attitudes towards the fairness of the tax laws,
Ph.D. thesis. Oklahoma State University.
Vogel, J. (1974). Taxation and public opinion in Sweden: An interpretation of recent survey
data. National Tax Journal, 27(1), 499-513.
Wang, L. (2010). A Review of the Determinants of Voluntary Compliance with Tax Laws by
South African Taxpayers with Particular Reference to Businesses in South Africa.
Unpublished MPhil: Taxation mini-dissertation, University of Pretoria.
Wahlund, R. (1992). Tax changes and economic behavior: The case of tax evasion. Journal
of Economic Psychology, 13, 657-677.
Webley, P., and Halstead, S. (1986). Tax evasion on the micro: Significant simulation or
expedient experiments? Journal of Interdisciplinary Economics, 1, 87-100.
Weck, H. (1983). Schattenwirtschaft: Eine Möglichkeit zur Einschränkung der öffentlichen
Verwaltung? Eine ökonomische Analyse. Finanzwissenschaftliche Schriften 22. Bern:
Lang.
Wenzel, M. (2003). Tax compliance and the psychology of justice: Mapping the field.
Wenzel, M. (2005a). Motivation or rationalization? Causal relations between ethics, norms,
and tax compliance. Journal of Economic Psychology, 26, 491–508.

Taxpayers’ tax compliance Behavior: Business Profit taxpayers’ in Addis Ababa (2015)
100
Appendices!

Taxpayers’ tax compliance Behavior: Business Profit taxpayers’ in Addis Ababa (2015)
101
Appendices 1- Taxpayers survey instrument (English version)
Addis Ababa UniversitySchool of Business and Economics
Department of Accounting and FinanceDear Participant
The paper has been entitled “Tax payer’s tax compliance behavior” The case of Addis Ababa
City Administration Business Profit tax payers and prepared by Ato Geletaw Tsegaw
Tessema who is currently following his MSc (in accounting and finance) at Addis Ababa
University.
The aim of this paper is to know more about the tax compliance behavior of businesses
operating in Addis Ababa city administration. And the research questions focused on why
businesses pay their taxes while the benefits of non-compliance is outweighing? What are the
motivating factors that lead tax payers towards paying taxes and other similar issues have
been investigated by focusing on Addis Ababa City administrations business profit tax payers.
Therefore, to supplement the data obtained from in depth interviews, the investigator seeks to
gather relevant information from randomly selected taxpayers by means of self-administered
questionnaire.
All responses will be treated in strict confidence and the identity of respondents and their
organization will not be disclosed.
For further information, please contact Ato Geletaw Tsegaw by the following address:
Tel: 0911-72-51-66 E-mail: [email protected]

Taxpayers’ tax compliance Behavior: Business Profit taxpayers’ in Addis Ababa (2015)
102
Section I-Background InformationPlease tick (√) on your choice
1) In which type of business sector did you engaged?
1 Manufacturing 2 Import and Export
2 Building and Construction 4 Domestic Trade and services
5 Other, please specify……………………………………………….
2) What is your legal form of business operations?
1 A sole proprietorship 2 A partnership
3 A private limited Co. 4 A share company
5 Others please specify……………
3) In which category does your business annual turnover is included?
1 Under Birr 100,000 2 Birr 100,001 – Birr 500,000
3 More than Birr 500,000
4) What is your level of education?
1 Below 12 grade 2 12 grade completed 3 Diploma
4 Bachelor degree 5 Masters or above
6 Please specify ………………………………………………
5) What is your position in the company?
1 Owners 2 Employees
3 Manager 4 Other responsibilities, please specify
………………………………………………………………………………………………
6) Which modes of communications serve as the most important sources of information to your
business?
1 ERCA website or Newsletters.
2 Meetings with ERCA at national or regional level
3 Proclamations and directives issued by the concerned government organs
4 Training courses offered by accounting firms or consultants
5 Training courses offered by ERCA
6 Participation in business meetings, forums and boards
7) Do you believe the prevailing tax system encourages business profit taxpayers’ to properly pay
their tax obligations?

Taxpayers’ tax compliance Behavior: Business Profit taxpayers’ in Addis Ababa (2015)
103
1 yes 2 No 3 Indifferent
8) If your answer is ‘No’ for question number 7 what are the possible reasons?
1 Lack of knowledge
2 Intentionally
3 Lack of ability to pay their tax obligations
4 Unintentionally
Section II- Factors Influencing taxpayers tax Compliance Behavior
Please tick (√) on your choice
9) Taxpayers Tax Knowledge – tax knowledge affects the taxpaying attitudes of businessprofit tax payers. Please indicate to what extent you agree with each of the followingstatements:
No StatementsStronglyDisagree Disagree Neutral Agree
StronglyAgree
9.1 My business has the requiredexpertise to share taxknowledge’s with ERCA.
9.2. My business has sufficientopportunities to share taxknowledge’s with ERCA.
9.3 My business has sufficientexperience to share taxknowledge’s with ERCA.
9.4 My business has the necessarychannel of communications toshare tax knowledge withERCA.
9.5 Sharing knowledge withERCA increases the chance todetermine the correct amountof tax liability.

Taxpayers’ tax compliance Behavior: Business Profit taxpayers’ in Addis Ababa (2015)
104
10) Taxpayer’s belief in fairness- belief in fairness affects the tax compliance behavior ofbusiness profit tax payers. Please indicate, for each of those statements, to what extent youagree:
No StatementsStronglyDisagree Disagree Neutral Agree
StronglyAgree
10.1 I believe that my tax obligation isfair relative to others.
10.2 I believe that the overall tax systemis not equitable.
10.3 I believe that tax authorities providesufficient and equitable informationto all taxpayers.
10.4 I believe that unreasonable,intrusive audits and unfair penaltiesof tax assessors will lead towardsstress and dissatisfaction.
10.5 I believe that the current tax systemhave many loopholes to leadtaxpayers towards corruption andtax evasion.
11) The Influence of Peer Groups – The influence of peer groups has been expected toaffect the tax compliance behavior of businesses. Therefore, please indicate, for each of thosestatements to what extent you agree:
No StatementsStronglyDisagree Disagree Neutral Agree
StronglyAgree
11.1 Positive peer attitude i.e. a beliefthat my neighbors are reportingand paying tax honestlyencourages me to report and paythe correct amount of taxes.
11.2 Rewarding tax payers i.e. givinga trophy for being best taxpayers does have its own impactin affecting the tax compliancebehavior of citizens.
11.3 Paying taxes are my obligationand I didn’t see any referencegroups from my neighbors.
11.4 I believe that my neighbors areevading taxes and don’t reportthe true fair picture of their taxliability.
11.5 I will not evade taxes because ofthe feeling of guilt and loss ofself respect.

Taxpayers’ tax compliance Behavior: Business Profit taxpayers’ in Addis Ababa (2015)
105
12) Income Level of Tax payers- This is to test whether source of income, level of incomeand type of businesses are considered as factors providing opportunity for tax non-compliance. Therefore, please indicate, for each of those statements to what extent you agree:
No StatementsStronglyDisagree Disagree Neutral Agree
StronglyAgree
12.1 The current tax system doesn’ttake in to account the prevailinginflation level in the country.
12.2 The applicable tax rate is veryhigh and deteriorates the incomeearning capability of businesses.
12.3 Paying taxes hinders sustainablegrowth of my businesses.
12.4 The type of business that Iengaged encourages me to paythe correct amount of taxes.
12.5 I believe that the current taxsystem encourages voluntary taxcompliance behavior.
13) Feeling of Detection and Punishments –this variable has been expected to test whetherdetection and punishments affects the tax compliance behavior of business profit tax payers.Therefore, please indicate, for each of those statements to what extent you agree:
No StatementsStronglyDisagree Disagree Neutral Agree
StronglyAgree
13.1 I will pay my tax obligationsbecause of fear of being caughtand penalized.
13.2 Tax assessors make continuousaudits as a result there is noroom to non-compliance.
13.3 Paying taxes are morally ethical.
13.4 I will pay my tax obligationsbecause of the incentives Ireceive from tax authorities.
13.5 The current tax system iscomplex and leads towardspenalty.

Taxpayers’ tax compliance Behavior: Business Profit taxpayers’ in Addis Ababa (2015)
106
14) Tax payer’s confidence in government spending (tax system/structure) – it has beenexpected that taxpayers’ confidence in government spending affects the tax compliancebehaviors of business profit tax payers. Therefore, please indicate, for each of thosestatements to what extent you agree:
No StatementsStronglyDisagree Disagree Neutral Agree
StronglyAgree
14.1 I believe that the governmentspends the collected taxes wisely.
14.2 I believe that my business hasbenefiting from basic governmentspending like education, health,safety and etc.
14.3 I believe that spending on basicinfrastructures encouragesvoluntary tax compliance.
14.4 I believe that negative acts (i.e.corruption and fraud) of taxassessors encourage non-compliance behavior.
14.5 I believe that paying taxes are myobligation whether thegovernment spends wisely or not.
Section III- Comments and Recommendations
13) Please specify your comment (if you have any) about factors that affects tax payer’s taxcompliance behaviors.______________________________________________________________________________
______________________________________________________________________________
14) Please state your possible solutions about how to improve tax payer’s tax compliance behaviors.______________________________________________________________________________
______________________________________________________________________________
15) please state any other comments (if you have).
______________________________________________________________________________
______________________________________________________________________________

Taxpayers’ tax compliance Behavior: Business Profit taxpayers’ in Addis Ababa (2015)
107
Appendix 2 -Taxpayers’ tax compliance behavior survey instrument
(Amharic Version)›Ç=e ›uv ¿’>y`e+
u=´’e~ ኢኮኖሚክስ
›"¨<”+”Ó“ óÓ”e ƒ/¡õM
¾Ñu= Ów` (Business profit tax system) Ø“ƒ SÖ¾p:-
¾}Ÿu\ ¾Ø“~ }d�ò
¾²=I Ø“ƒ `°e “Tax payers’ tax compliance behavior in the case of Addis Ababa
Business Profit taxpayers” c=J” ›Ø“¨< ›„ ÑK�¨< ìÒ¨< }cT u›Ç=e ›uv
¿’>y`e+ u›"¨<”+”Ó“ óÓ”e ƒUI`ƒ ¡õM }T] ’¨<::
¾Ø“~ ª“ ›LT u›Ç=e ›uv Ÿ}T ¨<eØ ¾T>Ñ–< ¾ƒ`õ Ów` ŸóÄ‹ KU”
Ów^†¨<” u¨p~“ u›Óvu< �”ÅT>ŸõK<& �”Ç=G<U Ów^†¨<” uS¡ðL†¨<
¾T>ÁÑ’ƒ ØpU U” �”ÅJ’“ Ów` ÁKS¡ðM ¾^c< ¾J’ ¾ÑAL }î°• �ÁK¨< ¾ƒ`õ
Ów` ŸóÄ‹ KU”É” ’¨< Ów^†¨<” ¾T>ŸõK<ƒ ¾T>K<ƒ Ñ<ÇÄ‹ uØMkƒ Ãn—K<::
ÃI”” Ø“ƒ KTÉ[Ó ŸnK SÖÃp u}ÚT] ¾Ø“~ ›p^u= ÃI”” SÖ¾p Á²ÒË
c=J” SÖÃl” ¾T>VK<ƒ ÓKcx‹“ É`Ï�†¨< uØ”no ¾T>Á²<“ KT”U Ãó
�”ÅTÃÅ[Ñ< uSÓKî ’¨<::
KuKÖ S[Í:- ›„ ÑK�¨< ìÒ¨<” uT>Ÿ}K¨< ›É^h TÓ–ƒ ËLK<
0911 725166 E-mail: [email protected]

Taxpayers’ tax compliance Behavior: Business Profit taxpayers’ in Addis Ababa (2015)
108
¡õM I. S”Å`Å]Á Gdw
uT>ðMÑ<ƒ Là UM¡ƒ ÁÉ`Ñ<
1. u¾ƒ—¨< ¾e^ ²`õ ’¨< ¾}cT\ƒ;
1. TU[ƒ
2. uI”í“ ¢”eƒ^¡i”
3. ›eSÜ“ LŸ=
4. ¾GÑ` ¨<eØ ”ÓÉ
5. K?L "K ÃÓKì< _________________________________________________________
2. ¾�`e É`σ;
1. ¾›”É ÓKcw ’¨<
2. ¾i`¡“ TIu` ’¨<
3. GLò’~ ¾}¨c’ ¾ÓM TIu` ’¨<
4. g?` "Uþ’> ’¨<
5. Ÿ²=I ¨<ß ŸJ’ ÃÓKì< ________________________________________________
2. ›S�© iÁß u¾ƒ—¨< ¡õM ¨<eØ ÃSÅvM;
1. Ÿw` 1®®, ®®® u�‹
2. Ÿw` 1®®, ®®® - w` 500,000
3. Ÿw` 500, 000 uLÃ
4. ¾ƒUI`ƒ Å[Í
1. Ÿ12— ¡õM u�‹
2. 12— ¡õM ÁÖ“kk
3. Ç=–KAT
4. ÉÓ]
5. Te}`e“ Ÿ²=Á uLÃ
6. K?L "K ÃÓKì< ______________________________________________________
5. uÉ`Ï~ ¨<eØ ÁKƒ ¾Y^ ²`õ
1. vKu?ƒ 2. c^}— 3. T’@Ë`
4. K?L "K ÃÓKì< ___________________________________________________

Taxpayers’ tax compliance Behavior: Business Profit taxpayers’ in Addis Ababa (2015)
109
6. ¾ƒ—¨< ¾S[Í ›ÑMÓKAƒ ’¨< KÉ`σ u×U ¾T>ÁeðMѨ<;
1. ¾Ñu=‹“ Ñ<U\¡ vKeM×” ÉI[ Ñî ¨ÃU ¾}KÁÄ îG<ö‹
2. ŸÑu=‹ vKeM×” Ò` ¾T>Å[Ñ< GÑ` ›kõ ¨ÃU ¡ML© ewcv‹
3. –a¡LT@i•‹“ ÇÃ_¡+|‹
4. ƒ_Ã’>”Ó /eMÖ“‹/
5. ¾›"¨”+”Ó ›ÑMÓKAƒ ¾T>cÖ< É`Ï„‹ eMÖ“
6. u}KÁÄ ewcv‹ Là uSd}õ ¾T>ј °¨<kƒ
7. ›G<” ue^ Là ÁK¨< ¾�¡e c=e}U É`Ï„‹ ÁKv†¨<” Ów` ¨ÃU
¾T>Öupv†¨<” Ów` u›Óvu< �”Ç=ŸõK< Áu[��M wK¨< ÁU“K<
1. ›
2. ›LU”U
3. ›e}Á¾ƒ ›McØU
8. KØÁo 7 SMe “›LU”U” ¾T>M ŸJ’ U¡”Á„‡ U”É” “†¨<
1. ¾°¨<kƒ T’e
2. uT¨p
3. ¾›pU ¨<e”’ƒ
4. vKT¨p

Taxpayers’ tax compliance Behavior: Business Profit taxpayers’ in Addis Ababa (2015)
110
¡õM G<Kƒ
9. Ów`” u¨p~ KS¡ðM ¨ÃU LKS¡ðM ›e}ªî ¾T>ÁÅ`Ñ< U¡”Á„‹ ¾Ów` ŸóÄ‹ ¾�¡e°¨<kƒ:- Ÿ²=I u�‹ K}²[²\ƒ ¯[õ} ’Ña‹ SeTTƒ ›KSeTTƒƒ” UM¡ƒ uTÉ[ÓÃÓKì<&
}^.l
¯[õ} ’Ña‹ u×U›MeTTU
›MeTTU ›e}Á¾ƒ›McØU
�eTTKG< u×U�eTTKG<
9.1. É`Ï‚ ŸHÑ` ¨<eØ Ñu= Ò`¾T>ÁÓvv °¨<kƒ ›K¨<::
9.2. É`Ï‚ ŸHÑ` ¨<eØ Ñu= Ò`¾T>ÁÓvu< °ÉKA‹ ›K<ƒ::
9.3. É`Ï‚ um MUÉ ›K¨<::9.4. É`Ï‚ ŸHÑ` ¨eØ Ñu= Ò`
¾T>ÁÓvv ¾S[Í SKª¨Ý²È‹ ›K<ƒ::
9.5. ŸHÑ` ¨<eØ Ñu= Ò` S[ÍSKª¨Ø ƒ¡¡K—¨< ¾Ów`SÖ” �”Ç=¨e” Ã[ÇM::
10. ¾Ów` ŸõÄ‹ u�¡e e`¯~ Là ÁL†¨< ¾õƒH©’ƒ ØÁo:-Ÿ²=I u�‹ K}²[²\ƒ ¯/’Ña‹SeTTƒ ›KSeTTƒƒ” UM¡ƒ uTÉ[Ó ÃÓKì<&
}^.l ¯[õ} ’Ña‹ u×U›MeTTU
›MeTTU ›e}Á¾ƒ›McØU
�eTTKG< u×U�eTTKG<
10.1. ŸK?KA‹ Ów` ŸóÄ‹ ›”í`¾�’@ Ów` ¡õÁ ¾}hK ’¨<::
10.2. �”Å’@ �U’ƒ ¾Ów` e`¯~õƒH© ›ÃÅKU::
10.3. ŸÑu=‹ vKeM×” ¾T>cÖ¨<£Ów` S[Í KG<K<U Ów`ŸóÄ‹ um“ �Ÿ<M ’¨<::
10.4. �”Å’@ �U’ƒ É”Ñ}—“ ›eðLÑ>*Ç=ƒ �”Ç=G<U }S×טÁMJ’ p׃ Ów` ŸõÄ”Kß”kƒ“ ue`¯~ Là °U’ƒT׃” ÁeŸƒLM::
10.5. �”Å’@ �U’ƒ uS}Óu` LÃÁK¨< ¾�¡e e`¯ƒ w²<kÇÇ‹ ÁK<ƒuƒ“ ¨ÇM}ðKÑS<e““ �¡e Tßu`u`¾T>Ç`Ó ’¨<::

Taxpayers’ tax compliance Behavior: Business Profit taxpayers’ in Addis Ababa (2015)
111
11. u²<]Á‹” ÁK< ÓKcx‹ ›e}ªî*:- Ÿ²=I u�‹ K}²[²\ƒ ¯/’Ña‹ SeTTƒ ›KSeTTƒ”UM¡ƒ uTÉ[Ó ÃÓKì<&
}^.l
¯[õ} ’Ña‹ u×U›MeTTU
›MeTTU ›e}Á¾ƒ›McØU
�eTTKG< u×U�eTTK
G<11.1. u›Ÿvu=Á‹” ÁK< ÓKcx‹ SM"U
›SK"Ÿƒ Ów^‹”” vÓvu<�”É”ŸõM Ã[Ç“M::
11.2. SM"U Ów` ŸóÄ‹” SgKU¨ÃU °¨<p“ SeÖƒ uÓw`›ŸóðM e`¯~ Là ¾^c< ¾J’›e}ªî* ›K¨<::
11.3. Ów` S¡ðM ÓÈ� c=J”u²<]Á ÁK< c‹” ›MSKŸƒU::
11.4. u›Ÿvu= ÁK< Ów` ŸóÄ‹ Ów`”ÁÚu[w^K< ¨ÃU ÁKv†¨<”ƒ¡¡K— Ów` KS”Óeƒ›Ád¨<lU::
11.5. �’@ Ów`” ›Lßu[w`UU¡”Á~U T”’‚ ›ÃðpÉU�”Ç=G<U Ów` Tßu`u` ¨<eש�`"� ›ÃcÖ˜U::
12. ¾Ów` ŸóÄ‹ ¾Ñu= SÖ”:-�v¡” Ÿ²=I u�‹ K}²[²\ƒ ¯/’Ña‹ SeTTƒ ›KSeTTƒƒ”UM¡ƒ uTÉ[Ó ÃÓKì<&
}^.l
¯[õ} ’Ña‹ u×U›MeTTU
›MeTTU ›e}Á¾ƒ›McØU
�eTTKG< u×U�eTTKG<
12.1. ›G<” Là ÁK¨< ¾Ów`e`¯ƒ ¾Ñ”²w ªÒ T׃”ÁÑ“²u ›ÃÅKU::
12.2. }Óv^© uSJ” Là ÁK¨<¾�¡e SÖ” Ÿõ ÁK“¾ÓKcx‹” ¾Ñu= U”ßÁÑ“²u ›ÃÅKU::
12.3. ¾}cT^G<uƒ ¾e^ ²`õƒ¡¡K—¨<” ¾Ów` SÖ”�”ÉŸõM Ã[Ç—M::
12.4. Ów`” u›Ñvu< S¡ðM¾É`Ƀ” IM¨<“Ãð�}“M::
12.5. uS}Óu` Là ÁK¨< ¾�¡ee`¯ƒ É`Ï„‹ ÁKv†¨<”°Ç uðnŘ’ƒ �”Ç=ŸõK<Áu[��M::

Taxpayers’ tax compliance Behavior: Business Profit taxpayers’ in Addis Ababa (2015)
112
13. É`Ï‚ u�¡e vKS<Á‹ ÃS[S^M �“ �k×KG< wKA Tcw:- �v¡” Ÿ²=I u�‹ K}²[²\ƒ¯/’Ña‹ SeTTƒ ›KSeTTƒ” UM¡ƒ uTÉ[Ó ÃÓKì<&
}^.l
¯[õ} ’Ña‹ u×U›MeTTU
›MeTTU ›e}Á¾ƒ›McØU
�eTTKG< u×U�eTTKG<
13.1. Ów_” ¾UŸõK¨< u¨”ËM�Ö¾nKG<“ �k×KG< wÂuTew ’¨<::
13.2. ¾HÑ` ¨<eØ Ñu= c^}™‹u¾Ñ>²?¨< lØØ` ÁÅ`ÒK<eK²=I Ów` �”ÇßðM¾T>ÁÅ`Ó U”U ¡õ}ƒ ¾KU::
13.3. Ów`” S¡ðM ¾Gk— c‹SÑKÝ ’¨<::
13.4. Ów_” ¾UŸõK¨ ŸHÑ` ¨<eØÑu= ¾TÑ–¨<” Tu[�‰ uTcw’¨<::
13.5. ›G<” Là ÁK¨< ¾Ów` e`¯ƒ&KS[ǃ ¾T>Áe†Ó`“ Ów`ŸóÄ‹” Kp׃ ¾T>Ç`Ó ’¨<::
14. ¾Ów` ŸóÄ‹ uS”Óeƒ ¨<Ü e`¯ƒ Là ¦Ft“ �`ÓÖ˜’ƒ:- �v¡” Ÿ²=I u�‹ K}²[²\ƒ¯/’Ña‹ SeTTƒ ›KSeTTƒ” UM¡ƒ uTÉ[Ó ÃÓKì<&
}^.l
¯[õ} ’Ña‹ u×U›MeTTU
›MeTTU ›e}Á¾ƒ›McØU
�eTTKG< u×U�eTTKG<
14.1. �”Å’@ �U’ƒ S”Óeƒ¾cucu¨<” Ów` vÓvu<ue^ Là Á¨<LM::
14.2. �”Å’@ �U’ƒ É`Ï‚S”Óeƒ Kª“ ª“›ÑMÓKA„‹ TKƒUKƒUI`ƒ& KÖ?“ ¨²}ŸT>Á¨×¨< ¨Ü }ÖnT>’¨<::
14.3. uª“ ª“ ¾I´w›ÑMÓKA„‹ Là Ów`”TªM Ów` ŸõÄ‹”Ów^†¨<” u^d†¨<}’di’ƒ �”Ç=ŸõK<ÁÅ`Ò†ªM::
14.4. ¾Ów` cwdu=‹ ÁM}ÑvvI] Ów` ŸóÄ‹”Ów^†¨<” vÓvu<�”ÇßõK< ÁÅ`ÒM::
14.5. U”U �”è” S”Óeƒ¾cucu¨<” Ów` vÓvu<›ªK ›LªK Ów` S¡ðMÓÈ� ’¨<::

Taxpayers’ tax compliance Behavior: Business Profit taxpayers’ in Addis Ababa (2015)
113
¡õM III ÁKƒ” ›e}Á¾ƒ ÃeÖ<
15. �v¡ uÓw` ŸóÄ‹ Ów` ¾S¡ðM vIM Là } uT>ÁÅ`Ñ<ƒ ó¡}a‹(Factors) ²<]Á ÁKƒ”›e}Á¾ƒ ÃeÖ<:-
_________________________________________________________________________________
16. ¾ƒ`õ Ów` ŸóÄ‹” Ów` ¾S¡ðM vIM ÁhhLM ¨ÃU ›eƒªî* ÁÅ`ÒM ¾T>K<ƒ Gdw "Kƒu=ÑMì<::
_________________________________________________________________________________
17. K?L SÓKî ¾T>ðMÑ<ƒ Ñ<ÇÃ "K::
_____________________________________________________________________________
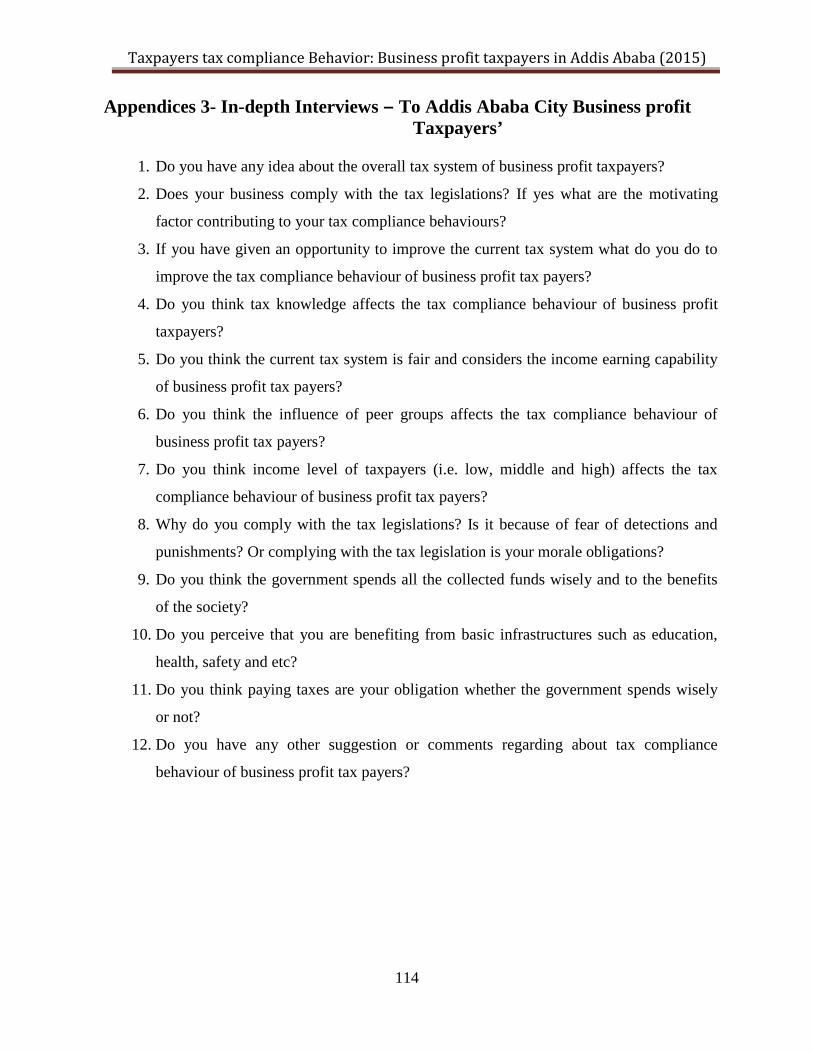
Taxpayers tax compliance Behavior: Business profit taxpayers in Addis Ababa (2015)
114
Appendices 3- In-depth Interviews – To Addis Ababa City Business profitTaxpayers’
1. Do you have any idea about the overall tax system of business profit taxpayers?
2. Does your business comply with the tax legislations? If yes what are the motivating
factor contributing to your tax compliance behaviours?
3. If you have given an opportunity to improve the current tax system what do you do to
improve the tax compliance behaviour of business profit tax payers?
4. Do you think tax knowledge affects the tax compliance behaviour of business profit
taxpayers?
5. Do you think the current tax system is fair and considers the income earning capability
of business profit tax payers?
6. Do you think the influence of peer groups affects the tax compliance behaviour of
business profit tax payers?
7. Do you think income level of taxpayers (i.e. low, middle and high) affects the tax
compliance behaviour of business profit tax payers?
8. Why do you comply with the tax legislations? Is it because of fear of detections and
punishments? Or complying with the tax legislation is your morale obligations?
9. Do you think the government spends all the collected funds wisely and to the benefits
of the society?
10. Do you perceive that you are benefiting from basic infrastructures such as education,
health, safety and etc?
11. Do you think paying taxes are your obligation whether the government spends wisely
or not?
12. Do you have any other suggestion or comments regarding about tax compliance
behaviour of business profit tax payers?

Taxpayers tax compliance Behavior: Business profit taxpayers in Addis Ababa (2015)
115
Appendices 4: SPSS Data Outputs
1. Correlation among variables
CorrelationsTax Compliance TK BF PG IL DP GS
Pearson Correlation
Tax Compliance 1.000 .327 .531 .474 .451 .314 .392TK .327 1.000 .343 -.277 -.113 .083 -.052BF .531 .343 1.000 .122 .086 .120 .235PG .474 -.277 .122 1.000 .429 -.026 .503IL .451 -.113 .086 .429 1.000 .302 .315DP .314 .083 .120 -.026 .302 1.000 -.025GS .392 -.052 .235 .503 .315 -.025 1.000
Sig. (1-tailed)
Tax Compliance . .003 .000 .000 .000 .004 .000TK .003 . .002 .010 .175 .248 .333BF .000 .002 . .157 .238 .161 .025PG .000 .010 .157 . .000 .416 .000IL .000 .175 .238 .000 . .005 .004DP .004 .248 .161 .416 .005 . .420GS .000 .333 .025 .000 .004 .420 .
**. Correlation is significant at the 0.01 level (2-tailed).*. Correlation is significant at the 0.05 level (2-tailed).
2. Model Summary- Regression results
Model Summary
Mode
l
R R
Square
Adjusted R
Square
Std. Error of
the Estimate
Change Statistics Durbin-
WatsonR Square
Change
F
Change
df1 df2 Sig. F
Change
1 .809a .654 .621 .326 .654 19.883 6 142 .000 1.851
a. Predictors: (Constant), GS, DP, TK, BF, IL, PG
b. Dependent Variable: Tax_Compliance
Model Summary
Model Sum of Squares df Mean Square F Sig.
1
Regression 12.677 6 2.113 19.883 .000b
Residual 6.695 146 .106
Total 19.371 152
a. Dependent Variable: Tax_Compliance
b. Predictors: (Constant), GS, DP, TK, BF, IL, PG

Taxpayers tax compliance Behavior: Business profit taxpayers in Addis Ababa (2015)
116
Stepwise Regression resultsModel Summary
Model R RSquare
Adjusted RSquare
Std.Error of
theEstimate
Change StatisticsR SquareChange
F Change df1 df2 Sig. FChange
1 .531a .282 .271 .452 .282 26.677 1 68 .0002 .672b .452 .436 .398 .170 20.827 1 67 .0003 .742c .551 .531 .363 .099 14.574 1 66 .0004 .786d .619 .595 .337 .067 11.485 1 65 .0015 .807e .651 .624 .325 .032 5.936 1 64 .018
a. Predictors: (Constant), BFb. Predictors: (Constant), BF, PGc. Predictors: (Constant), BF, PG, TKd. Predictors: (Constant), BF, PG, TK, ILe. Predictors: (Constant), BF, PG, TK, IL, DP
ANOVAa
Model Sum of Squares df Mean Square F Sig.
1Regression 5.458 1 5.458 26.677 .000b
Residual 13.913 152 .205Total 19.371 153
2Regression 8.758 2 4.379 27.641 .000c
Residual 10.614 151 .158Total 19.371 153
3Regression 10.677 3 3.559 27.018 .000d
Residual 8.694 150 .132Total 19.371 153
4Regression 11.983 4 2.996 26.354 .000e
Residual 7.389 149 .114Total 19.371 153
5Regression 12.610 5 2.522 23.871 .000f
Residual 6.762 148 .106Total 19.371 153
ABC Research Alert, Vol 5, No 1 (2017) ISSN 2413-5224