Embed Size (px)
Citation preview
1
TBCC TSTO Design for the NASA-AFRL Joint System Study
Christopher Snyder NASA Glenn Research Center, Cleveland, Ohio
and Jeff Robinson and Shelly Ferlemann
NASA Langley Research Center, Hampton, Virginia
ABSTRACT
NASA and the Air Force Research Laboratory are involved in a Joint System Study (JSS) on Two-Stage-to-Orbit (TSTO) vehicles. The JSS will examine the performance, operability and uncertainty of unmanned, fully reusable, airbreathing-based TSTO launch vehicle concepts. NASA is providing a concept using turbine-based combined cycle (TBCC) propulsion on the booster stage and an all-rocket orbiter. The Air Force supplied two vehicle concepts, both utilizing an all-rocket booster; one with an all-rocket orbiter, the other using a rocket-based combined cycle orbiter. For NASA, this study is being used for tool assessment and development, and to identify generic technology gaps, not to choose vehicle types or concepts. This presentation starts with an overview of the major JSS ground rules and assumptions. Second, the NASA TSTO concept, Reusable Airbreathing Launch Vehicle – iteration B (RALV-B) is introduced, including its mission profile and, the vehicle (booster and orbiter) layout and packaging. The high speed propulsion concept is then briefly discussed, including the work performed and lessons learned. The low speed TBCC propulsion system is covered next in some detail. An overview for the low speed system is given; then its development is discussed (starting with initial layout and leading to more detailed analyses performed and results). The low speed system portion is wrapped up with lessons learned and summary. Finally, an overall summary and lessons learned so far for the JSS are given as well as work planned to complete the study.
NASA/USAF Joint System Study
Page 1
NASA/Air Force
Joint System
Study
National Aeronautics and Space Administration
www.nasa.gov
United States
Air Force
National Aeronautics and
Space Administration
TBCC TSTO Design for the
NASA-AFRL Joint System
Study
Turbine Engine Technology Symposium
Dayton Convention Center, Dayton, OH
September 16, 2010
Presented by Christopher Snyder
Christopher Snyder, NASA Glenn
Jeff Robinson, NASA Langley
Shelly Ferlemann, NASA Langley
Distribution Statement A: Approved for Public Release
NASA/USAF Joint System Study
Page 2
Joint Systems Study (JSS) Description & Planned Efforts / Present Status
Ground Rules and Assumptions
NASA TBCC TSTO Concept (RALV-B)RALV-B design evolution was covered at the FAP Annual 2009
Upper stage is reusable lifting body, all rocket (X-34 heritage)
Vehicles changed as requirements changed (payload, orbit, etc.)
Will not be repeated here (time constraints)
Mission Profile & vehicle layout / packaging
High Speed Propulsion (work performed & lessons learned)
Low Speed PropulsionSystem Overview
Level 1 Information
Level 2 Efforts
Lessons Learned / Summary
Overall Summary
Overview
NASA/USAF Joint System Study
Page 3
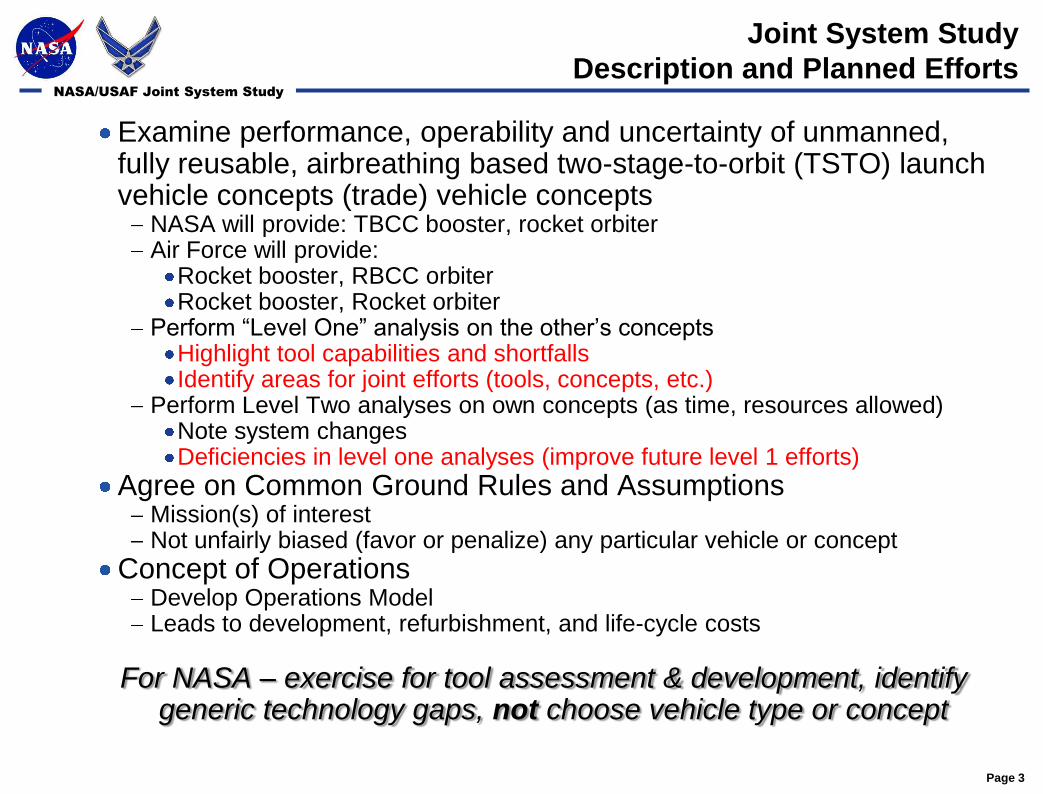
Examine performance, operability and uncertainty of unmanned, fully reusable, airbreathing based two-stage-to-orbit (TSTO) launch vehicle concepts (trade) vehicle concepts
NASA will provide: TBCC booster, rocket orbiterAir Force will provide:
Rocket booster, RBCC orbiterRocket booster, Rocket orbiter
Perform “Level One” analysis on the other’s conceptsHighlight tool capabilities and shortfallsIdentify areas for joint efforts (tools, concepts, etc.)
Perform Level Two analyses on own concepts (as time, resources allowed)Note system changesDeficiencies in level one analyses (improve future level 1 efforts)
Agree on Common Ground Rules and AssumptionsMission(s) of interestNot unfairly biased (favor or penalize) any particular vehicle or concept
Concept of OperationsDevelop Operations ModelLeads to development, refurbishment, and life-cycle costs
For NASA – exercise for tool assessment & development, identify generic technology gaps, not choose vehicle type or concept
Joint System Study
Description and Planned Efforts
NASA/USAF Joint System Study
Page 4
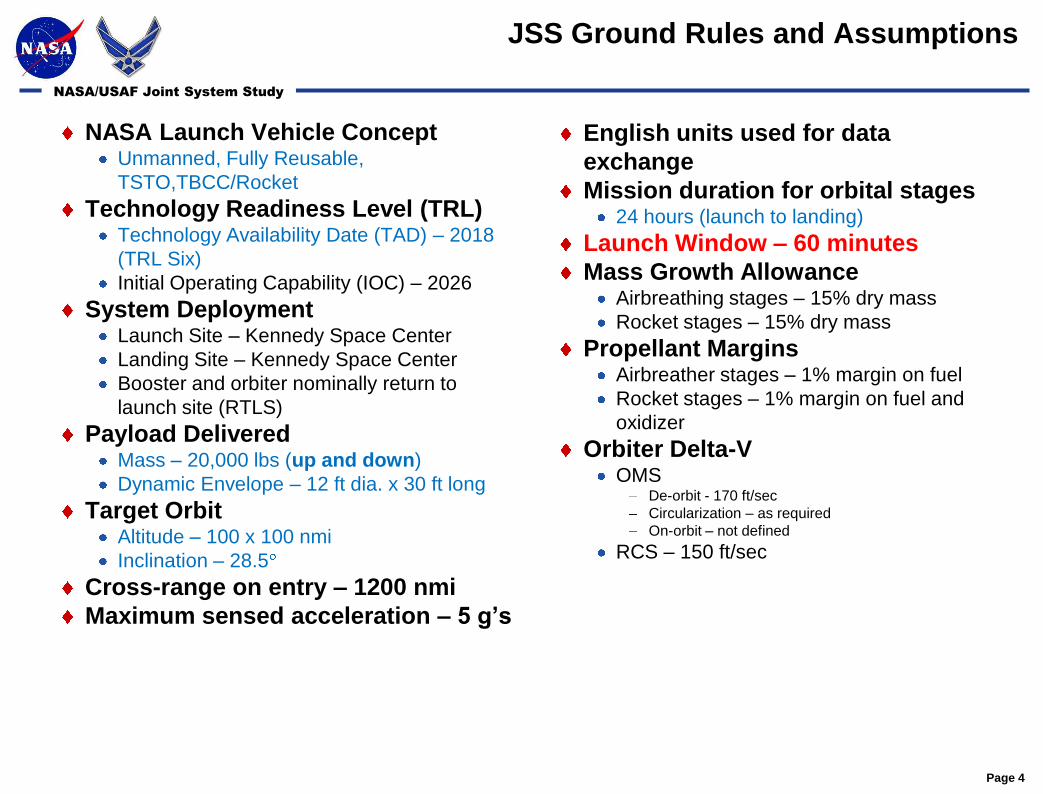
NASA Launch Vehicle ConceptUnmanned, Fully Reusable,
TSTO,TBCC/Rocket
Technology Readiness Level (TRL)Technology Availability Date (TAD) – 2018
(TRL Six)
Initial Operating Capability (IOC) – 2026
System Deployment Launch Site – Kennedy Space Center
Landing Site – Kennedy Space Center
Booster and orbiter nominally return to
launch site (RTLS)
Payload DeliveredMass – 20,000 lbs (up and down)
Dynamic Envelope – 12 ft dia. x 30 ft long
Target OrbitAltitude – 100 x 100 nmi
Inclination – 28.5
Cross-range on entry – 1200 nmi
Maximum sensed acceleration – 5 g’s
JSS Ground Rules and Assumptions
English units used for data
exchange
Mission duration for orbital stages24 hours (launch to landing)
Launch Window – 60 minutes
Mass Growth AllowanceAirbreathing stages – 15% dry mass
Rocket stages – 15% dry mass
Propellant MarginsAirbreather stages – 1% margin on fuel
Rocket stages – 1% margin on fuel and
oxidizer
Orbiter Delta-VOMS
De-orbit - 170 ft/sec
Circularization – as required
On-orbit – not defined
RCS – 150 ft/sec
NASA/USAF Joint System Study
Page 5
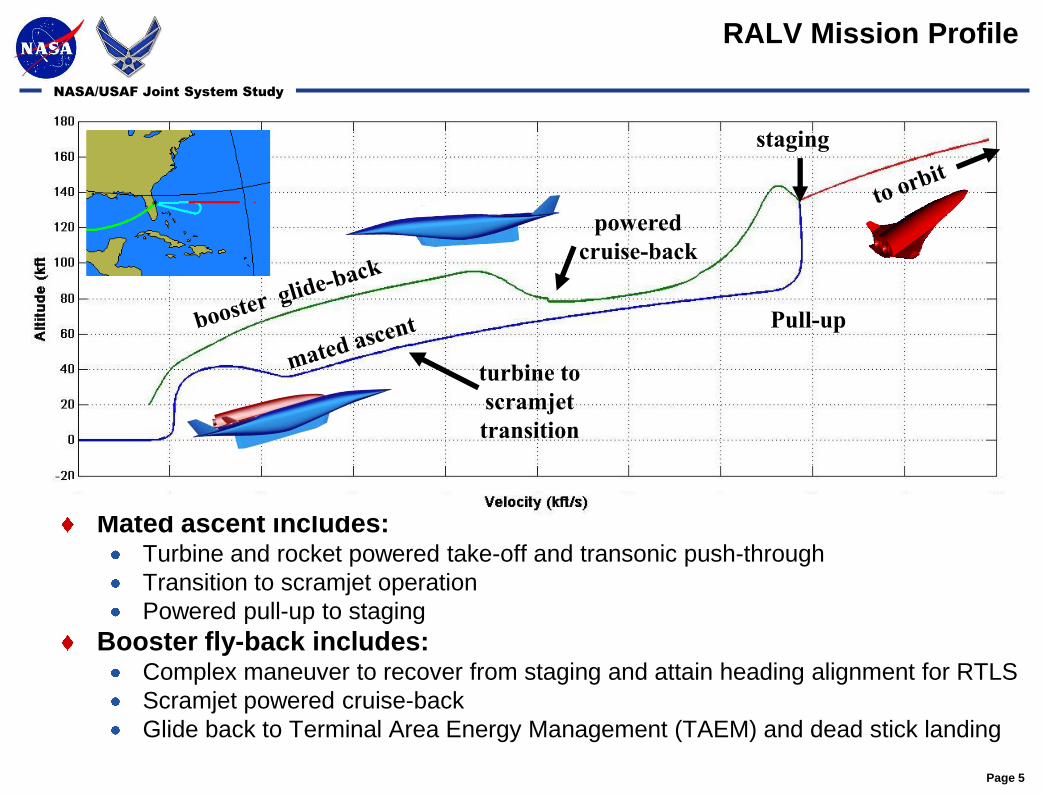
RALV Mission Profile
Mated ascent includes:Turbine and rocket powered take-off and transonic push-through
Transition to scramjet operation
Powered pull-up to staging
Booster fly-back includes:Complex maneuver to recover from staging and attain heading alignment for RTLS
Scramjet powered cruise-back
Glide back to Terminal Area Energy Management (TAEM) and dead stick landing
staging
turbine to
scramjet
transition
powered
cruise-back
Pull-up
NASA/USAF Joint System Study
Page 6
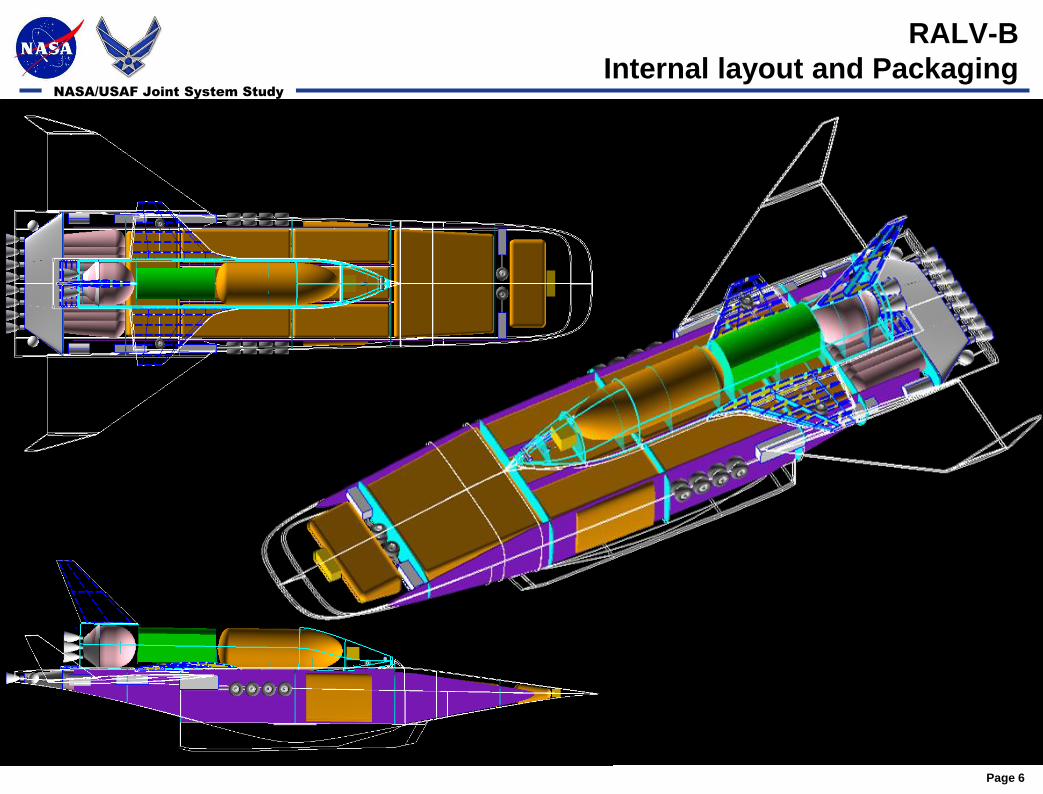
RALV-B
Internal layout and Packaging
NASA/USAF Joint System Study
Page 7
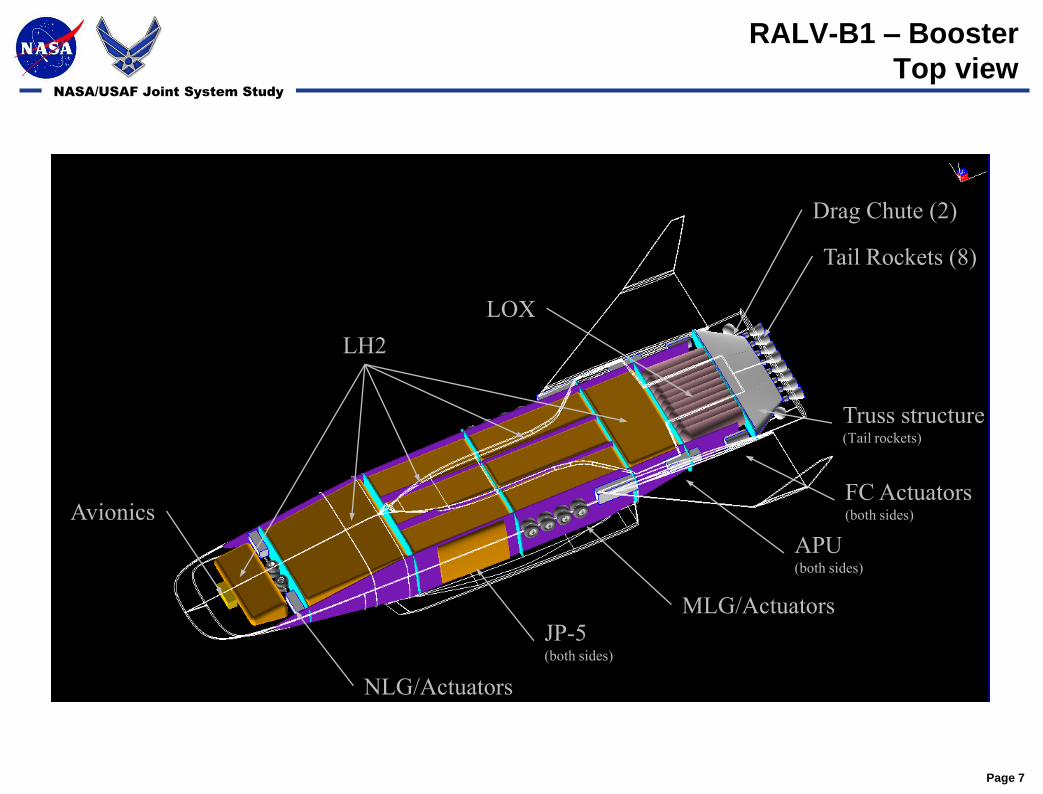
RALV-B1 – Booster
Top view
LH2
JP-5(both sides)
LOX
Tail Rockets (8)
Drag Chute (2)
APU(both sides)
MLG/Actuators
FC Actuators(both sides)
NLG/Actuators
Avionics
Truss structure(Tail rockets)
NASA/USAF Joint System Study
Page 8
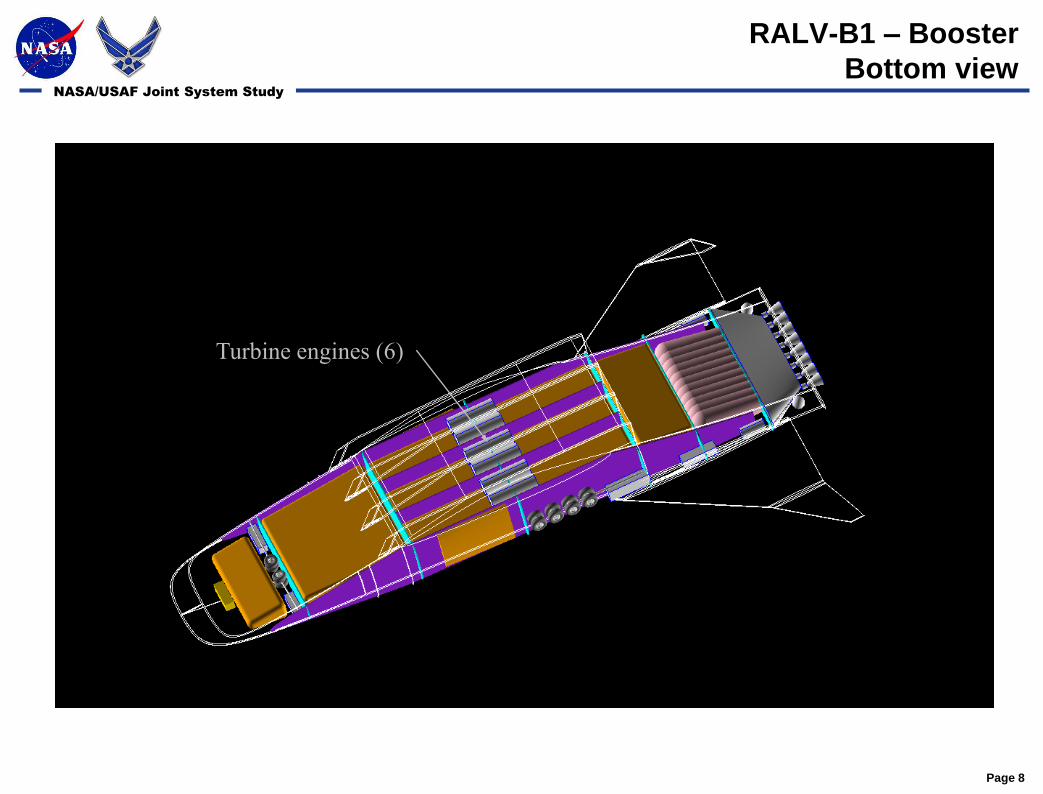
RALV-B1 – Booster
Bottom view
Turbine engines (6)
NASA/USAF Joint System Study
Page 9
NASA/USAF Joint System StudyNational Aeronautics and
Space Administration
High Speed Propulsion
(Highlights shamelessly stolen from Shelly Ferlemann’s slides)
NASA/USAF Joint System Study
Page 10
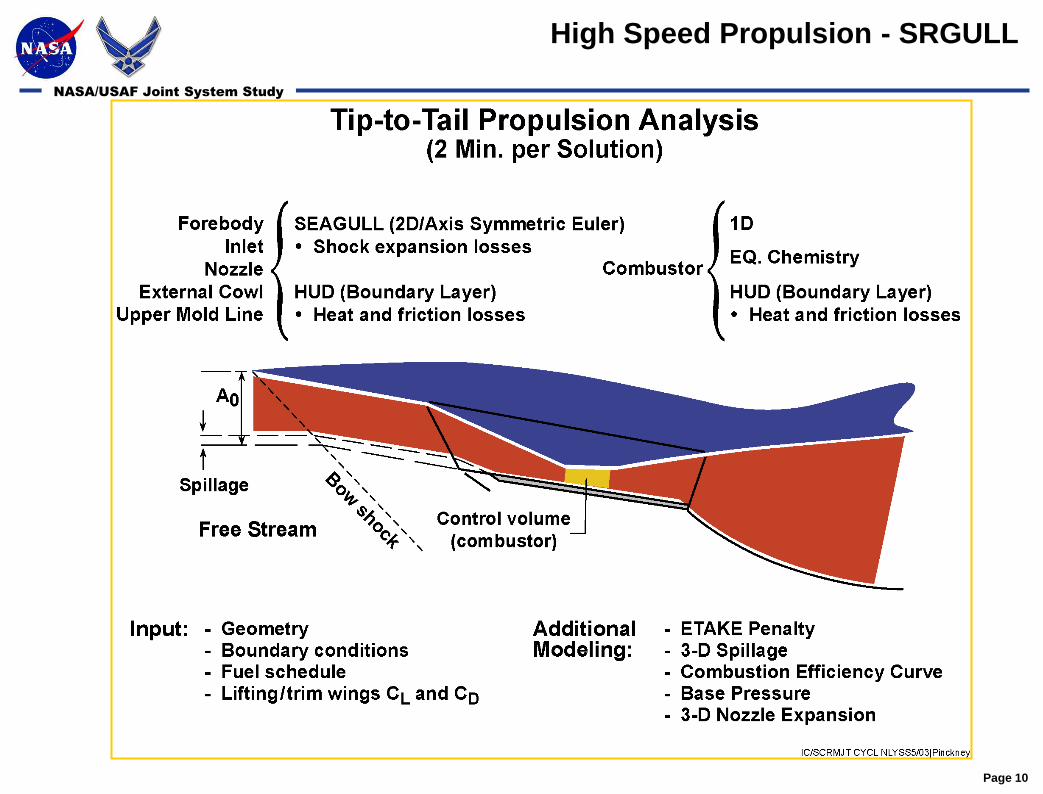
High Speed Propulsion - SRGULL
NASA/USAF Joint System Study
Page 11
Attempt to use MDOE to generate data high speed propulsion data.
MDOE process and data would lend itself to: Easier to design engine at vehicle level
Can account for aero forces and structural/ thermal input …etc.
Can change constraints and not have to go through long design process
Can extract statistical data about how independent variables affect multiple responses
Can give more insight to entire vehicle design team instead of all information with
residing with propulsion discipline
Easier to perform technology trades
Data generated and regression equations generated. Although R2 values
were high (.996 for 500 case Axial Force), the Regression equations at
the extremes of responses did not represent data well. Even giving the
wrong trends!
New dataset for mission analysis generated using lessons-learned from
RALV-A as starting point (with limited scaling capability). Resulting data
addressed most concerns (shortfalls) from previous iteration. Continuing
to work MDOE methodology to address shortcomings uncovered.
High Speed Propulsion
RJ/SJ Performance Summary
NASA/USAF Joint System Study
Page 12
NASA/USAF Joint System StudyNational Aeronautics and
Space Administration
Low Speed Propulsion
NASA/USAF Joint System Study
Page 13
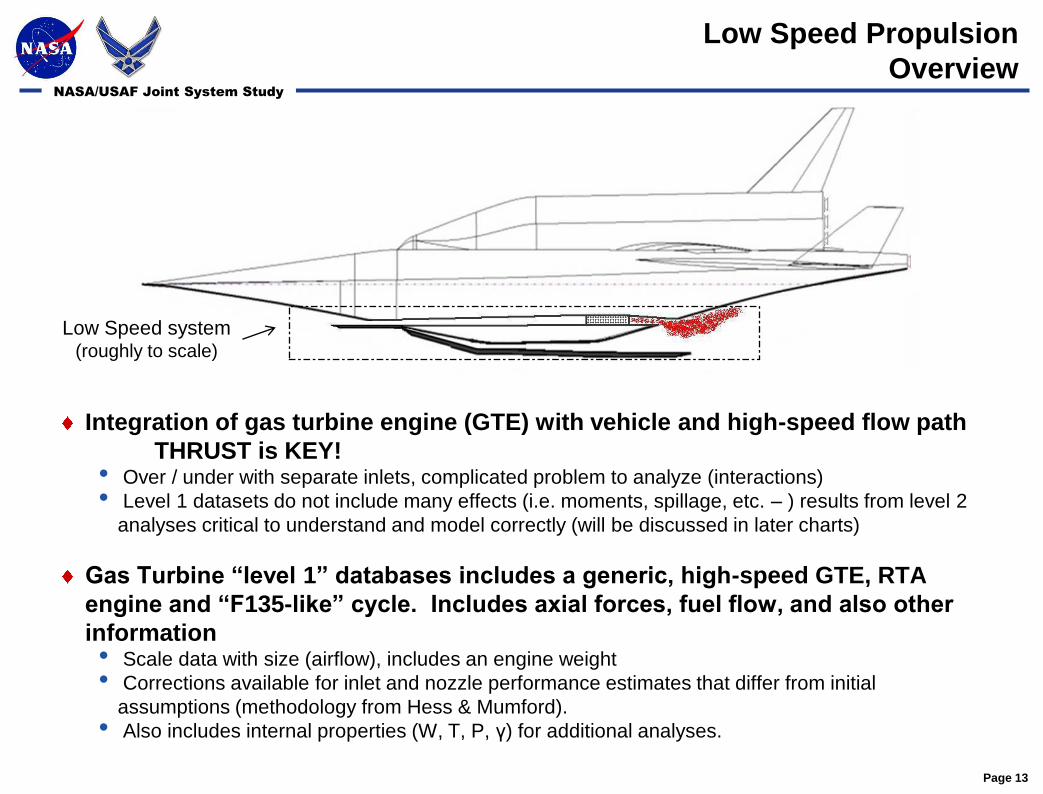
Integration of gas turbine engine (GTE) with vehicle and high-speed flow path
THRUST is KEY! • Over / under with separate inlets, complicated problem to analyze (interactions)
• Level 1 datasets do not include many effects (i.e. moments, spillage, etc. – ) results from level 2
analyses critical to understand and model correctly (will be discussed in later charts)
Gas Turbine “level 1” databases includes a generic, high-speed GTE, RTA
engine and “F135-like” cycle. Includes axial forces, fuel flow, and also other
information • Scale data with size (airflow), includes an engine weight
• Corrections available for inlet and nozzle performance estimates that differ from initial
assumptions (methodology from Hess & Mumford).
• Also includes internal properties (W, T, P, γ) for additional analyses.
Low Speed Propulsion
Overview
Low Speed system(roughly to scale)
NASA/USAF Joint System Study
Page 14
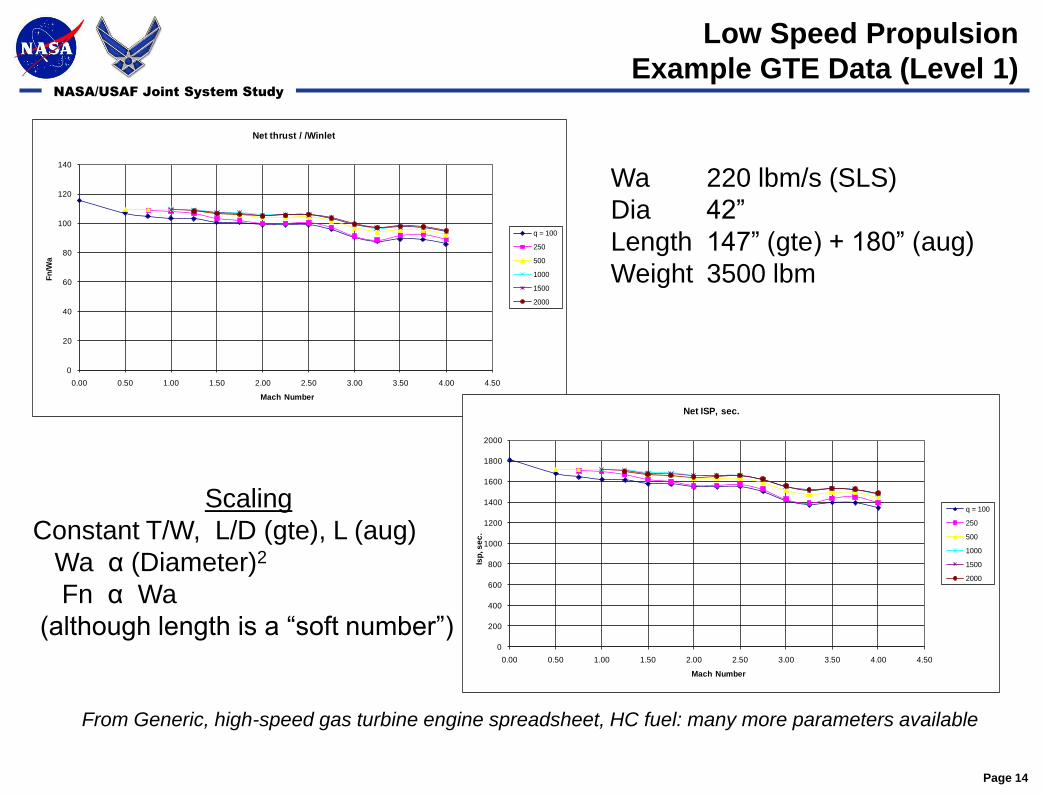
Low Speed Propulsion
Example GTE Data (Level 1)
0
20
40
60
80
100
120
140
0.00 0.50 1.00 1.50 2.00 2.50 3.00 3.50 4.00 4.50
Fn
/Wa
Mach Number
Net thrust / /Winlet
q = 100
250
500
1000
1500
2000
0
200
400
600
800
1000
1200
1400
1600
1800
2000
0.00 0.50 1.00 1.50 2.00 2.50 3.00 3.50 4.00 4.50
Isp
, s
ec
.
Mach Number
Net ISP, sec.
q = 100
250
500
1000
1500
2000
From Generic, high-speed gas turbine engine spreadsheet, HC fuel: many more parameters available
Wa 220 lbm/s (SLS)
Dia 42”
Length 147” (gte) + 180” (aug)
Weight 3500 lbm
Scaling
Constant T/W, L/D (gte), L (aug)
Wa α (Diameter)2
Fn α Wa
(although length is a “soft number”)
NASA/USAF Joint System Study
Page 15
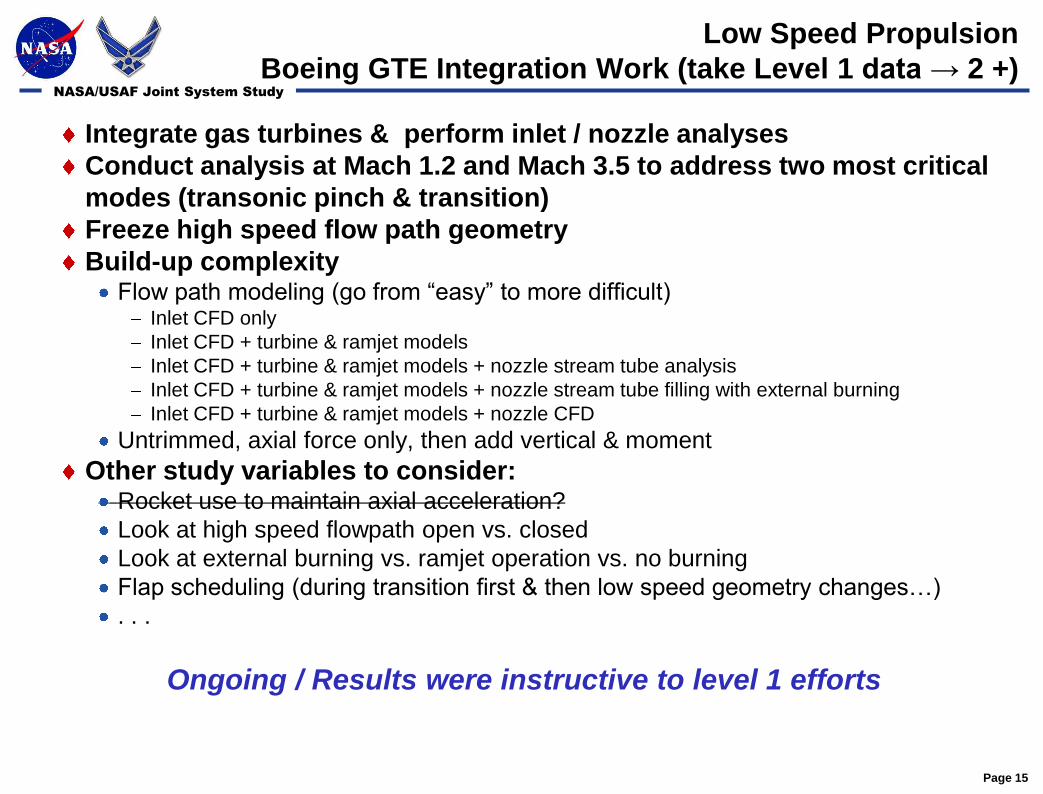
Integrate gas turbines & perform inlet / nozzle analyses
Conduct analysis at Mach 1.2 and Mach 3.5 to address two most critical
modes (transonic pinch & transition)
Freeze high speed flow path geometry
Build-up complexityFlow path modeling (go from “easy” to more difficult)
Inlet CFD only
Inlet CFD + turbine & ramjet models
Inlet CFD + turbine & ramjet models + nozzle stream tube analysis
Inlet CFD + turbine & ramjet models + nozzle stream tube filling with external burning
Inlet CFD + turbine & ramjet models + nozzle CFD
Untrimmed, axial force only, then add vertical & moment
Other study variables to consider:Rocket use to maintain axial acceleration?
Look at high speed flowpath open vs. closed
Look at external burning vs. ramjet operation vs. no burning
Flap scheduling (during transition first & then low speed geometry changes…)
. . .
Ongoing / Results were instructive to level 1 efforts
Low Speed Propulsion
Boeing GTE Integration Work (take Level 1 data → 2 +)
NASA/USAF Joint System Study
Page 16
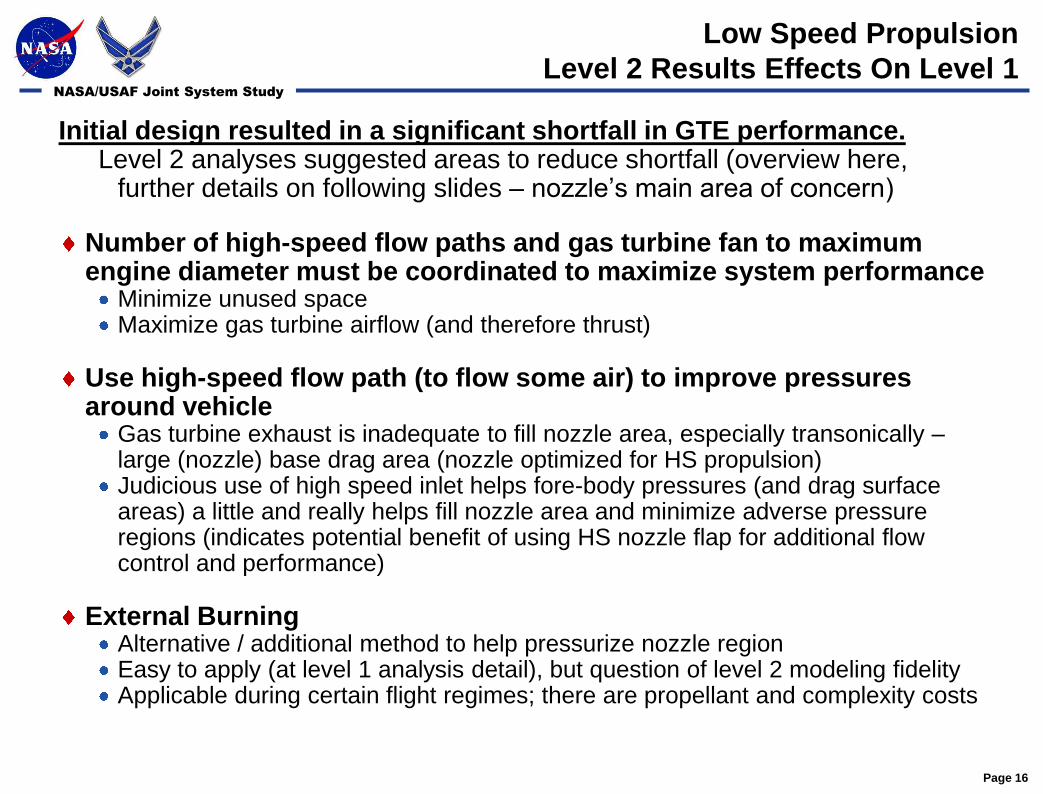
Initial design resulted in a significant shortfall in GTE performance.Level 2 analyses suggested areas to reduce shortfall (overview here,
further details on following slides – nozzle’s main area of concern)
Number of high-speed flow paths and gas turbine fan to maximum engine diameter must be coordinated to maximize system performance
Minimize unused spaceMaximize gas turbine airflow (and therefore thrust)
Use high-speed flow path (to flow some air) to improve pressures around vehicle
Gas turbine exhaust is inadequate to fill nozzle area, especially transonically –large (nozzle) base drag area (nozzle optimized for HS propulsion) Judicious use of high speed inlet helps fore-body pressures (and drag surface areas) a little and really helps fill nozzle area and minimize adverse pressure regions (indicates potential benefit of using HS nozzle flap for additional flow control and performance)
External BurningAlternative / additional method to help pressurize nozzle regionEasy to apply (at level 1 analysis detail), but question of level 2 modeling fidelityApplicable during certain flight regimes; there are propellant and complexity costs
Low Speed Propulsion
Level 2 Results Effects On Level 1
NASA/USAF Joint System Study
Page 17
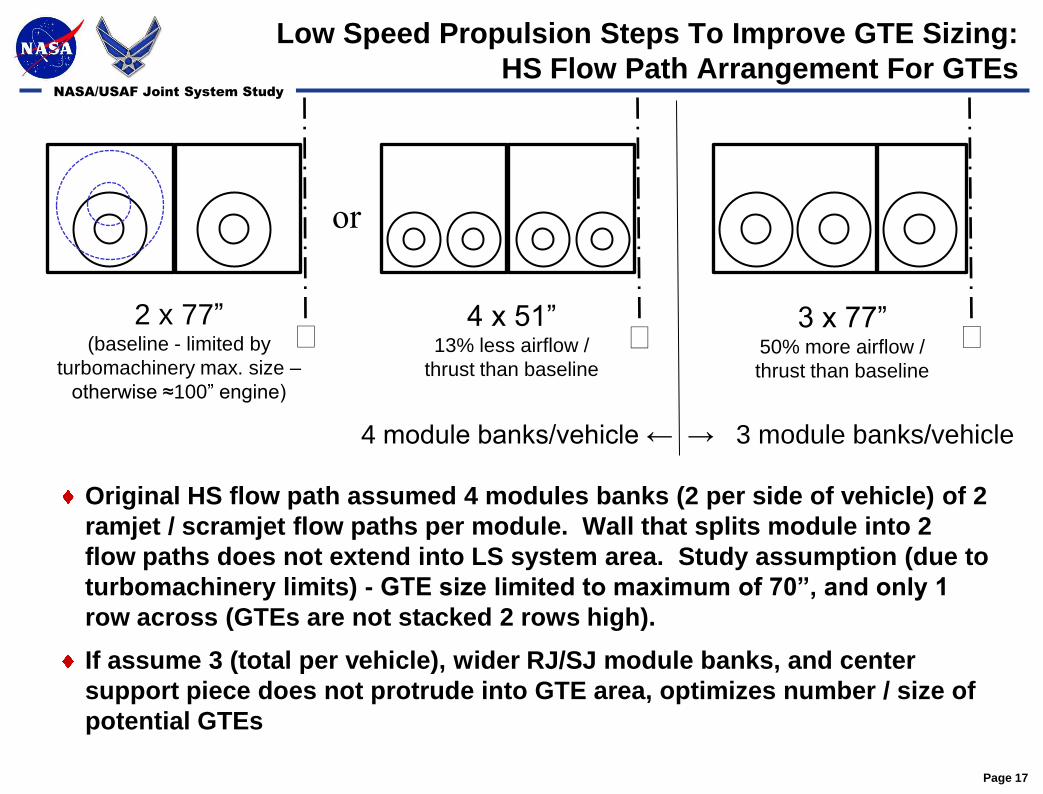
Original HS flow path assumed 4 modules banks (2 per side of vehicle) of 2
ramjet / scramjet flow paths per module. Wall that splits module into 2
flow paths does not extend into LS system area. Study assumption (due to
turbomachinery limits) - GTE size limited to maximum of 70”, and only 1
row across (GTEs are not stacked 2 rows high).
If assume 3 (total per vehicle), wider RJ/SJ module banks, and center
support piece does not protrude into GTE area, optimizes number / size of
potential GTEs
Low Speed Propulsion Steps To Improve GTE Sizing:
HS Flow Path Arrangement For GTEs
2 x 77”(baseline - limited by
turbomachinery max. size –
otherwise ≈100” engine)
or
4 x 51”13% less airflow /
thrust than baseline
3 x 77”50% more airflow /
thrust than baseline
4 module banks/vehicle ← → 3 module banks/vehicle
࠸ ࠸ ࠸
NASA/USAF Joint System Study
Page 18
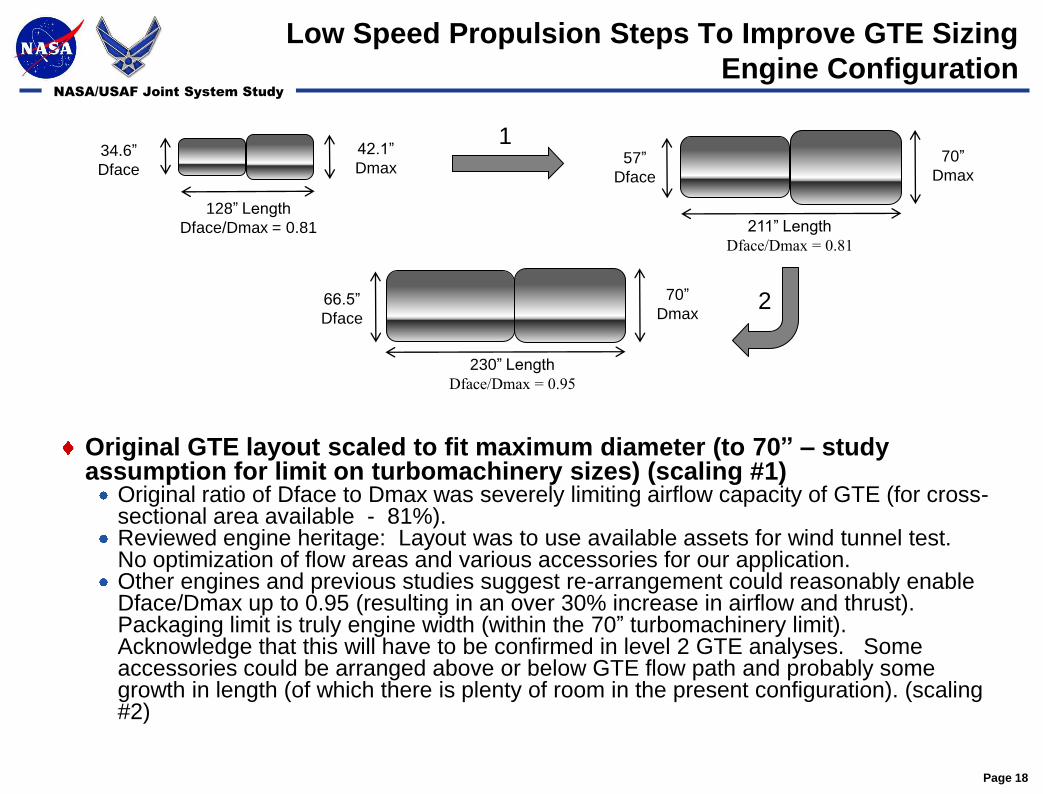
Original GTE layout scaled to fit maximum diameter (to 70” – study assumption for limit on turbomachinery sizes) (scaling #1)
Original ratio of Dface to Dmax was severely limiting airflow capacity of GTE (for cross-sectional area available - 81%).Reviewed engine heritage: Layout was to use available assets for wind tunnel test. No optimization of flow areas and various accessories for our application.Other engines and previous studies suggest re-arrangement could reasonably enable Dface/Dmax up to 0.95 (resulting in an over 30% increase in airflow and thrust). Packaging limit is truly engine width (within the 70” turbomachinery limit). Acknowledge that this will have to be confirmed in level 2 GTE analyses. Some accessories could be arranged above or below GTE flow path and probably some growth in length (of which there is plenty of room in the present configuration). (scaling #2)
Low Speed Propulsion Steps To Improve GTE Sizing
Engine Configuration
34.6”
Dface
42.1”
Dmax
128” Length
Dface/Dmax = 0.81
57”
Dface
70”
Dmax
211” Length
Dface/Dmax = 0.81
66.5”
Dface
70”
Dmax
230” Length
Dface/Dmax = 0.95
1
2
NASA/USAF Joint System Study
Page 19
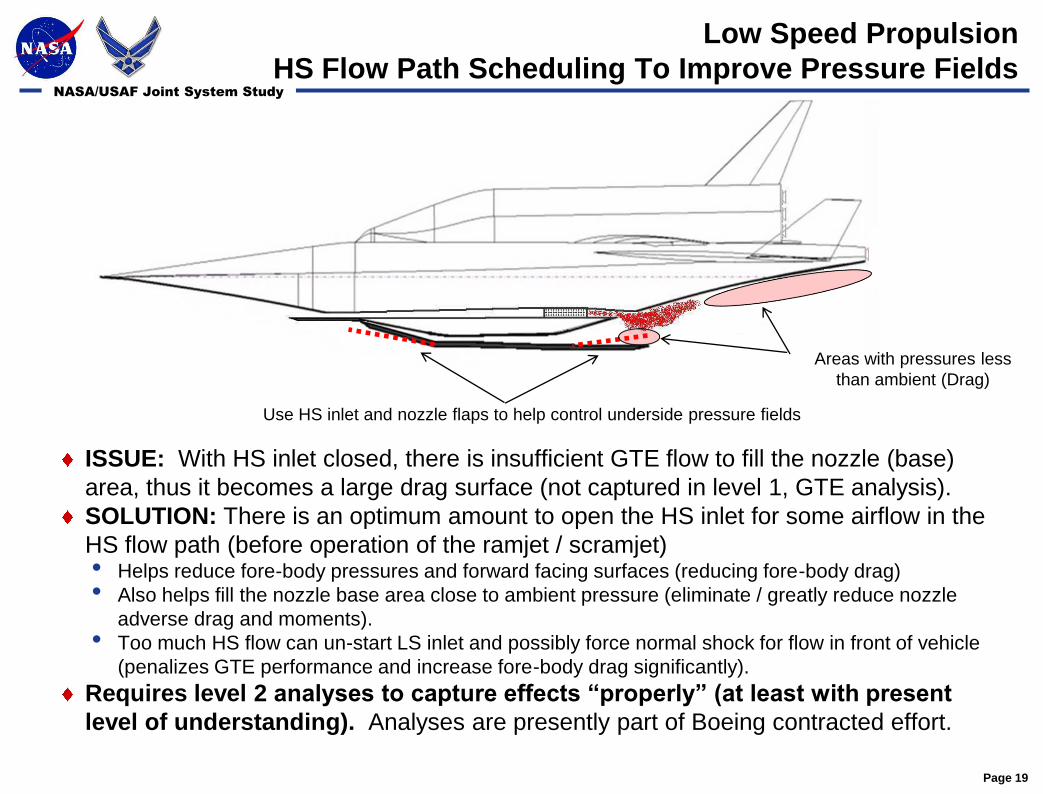
ISSUE: With HS inlet closed, there is insufficient GTE flow to fill the nozzle (base)
area, thus it becomes a large drag surface (not captured in level 1, GTE analysis).
SOLUTION: There is an optimum amount to open the HS inlet for some airflow in the
HS flow path (before operation of the ramjet / scramjet)• Helps reduce fore-body pressures and forward facing surfaces (reducing fore-body drag)
• Also helps fill the nozzle base area close to ambient pressure (eliminate / greatly reduce nozzle
adverse drag and moments).
• Too much HS flow can un-start LS inlet and possibly force normal shock for flow in front of vehicle
(penalizes GTE performance and increase fore-body drag significantly).
Requires level 2 analyses to capture effects “properly” (at least with present
level of understanding). Analyses are presently part of Boeing contracted effort.
Low Speed Propulsion
HS Flow Path Scheduling To Improve Pressure Fields
Areas with pressures less
than ambient (Drag)
Use HS inlet and nozzle flaps to help control underside pressure fields
NASA/USAF Joint System Study
Page 20
Low Speed Propulsion
Use External Burning Help Pressure Nozzle Region
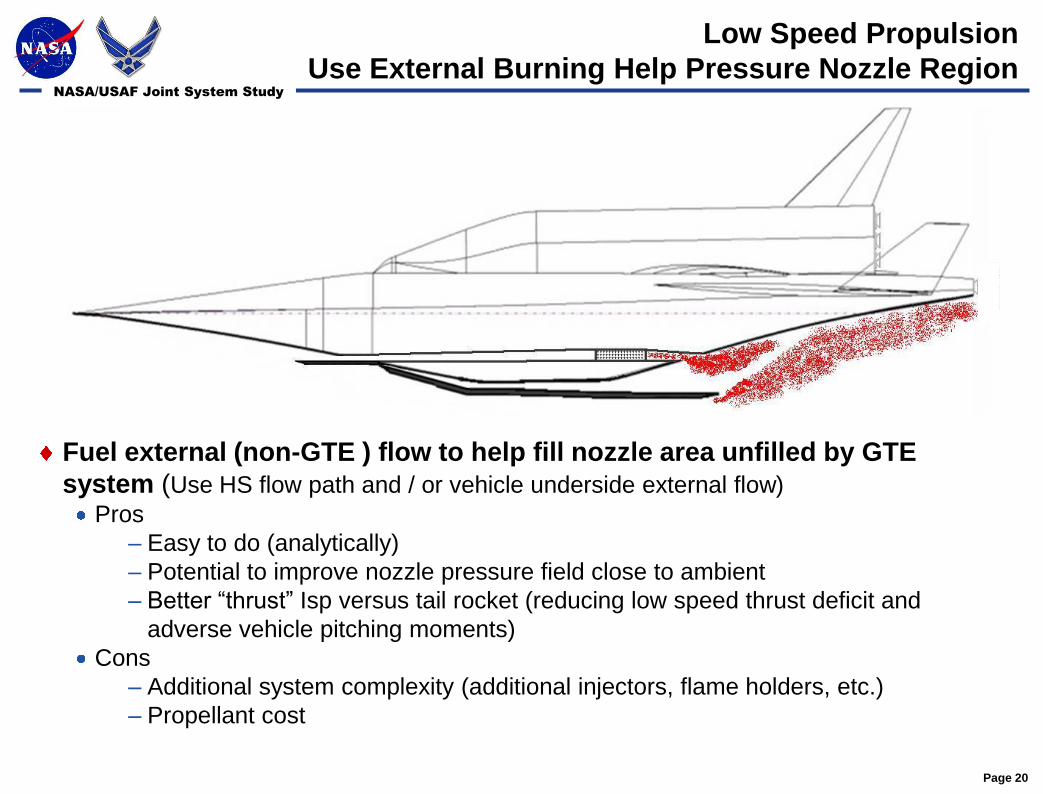
Fuel external (non-GTE ) flow to help fill nozzle area unfilled by GTE
system (Use HS flow path and / or vehicle underside external flow)
Pros
– Easy to do (analytically)
– Potential to improve nozzle pressure field close to ambient
– Better “thrust” Isp versus tail rocket (reducing low speed thrust deficit and
adverse vehicle pitching moments)
Cons
– Additional system complexity (additional injectors, flame holders, etc.)
– Propellant cost
NASA/USAF Joint System Study
Page 21
Some LS propulsion gains achieved after review of initial assumptions
(re-learn from previous studies)Find “low hanging fruit” - after significant shortfall noted, reviewed previous
studies to note differences from this effort (are assumptions limiting us?)Gas Turbine assumption for Dface/Dmax
Limit for gas turbine maximum turbomachinery diameter?
HS and LS arrangements must be coordinated - choose number of HS modules
and structure to optimize GTE number and size
LS propulsion sizing and integration is not optimum. Level 1 methods appear inadequate to capture many LS system dependencies
(vehicle adverse forces and moments) required to optimize overall performance.
Judicious operation of the HS flow path can improve fore-body flow and pressure
fields. More importantly, this flow and external flap position can significantly
mitigate adverse nozzle pressure fields. Level 2 analysis required to properly
quantify effects. (NASA tool deficiency).
Assuming external burning can effectively mitigate effects of adverse nozzle
pressure fields (vary propellant flow requirements to estimate sensitivity – is within
level 1 analyses). But increases analysis uncertainty.
Low Speed Propulsion
Summary - Lessons Learned
NASA/USAF Joint System Study
Page 22
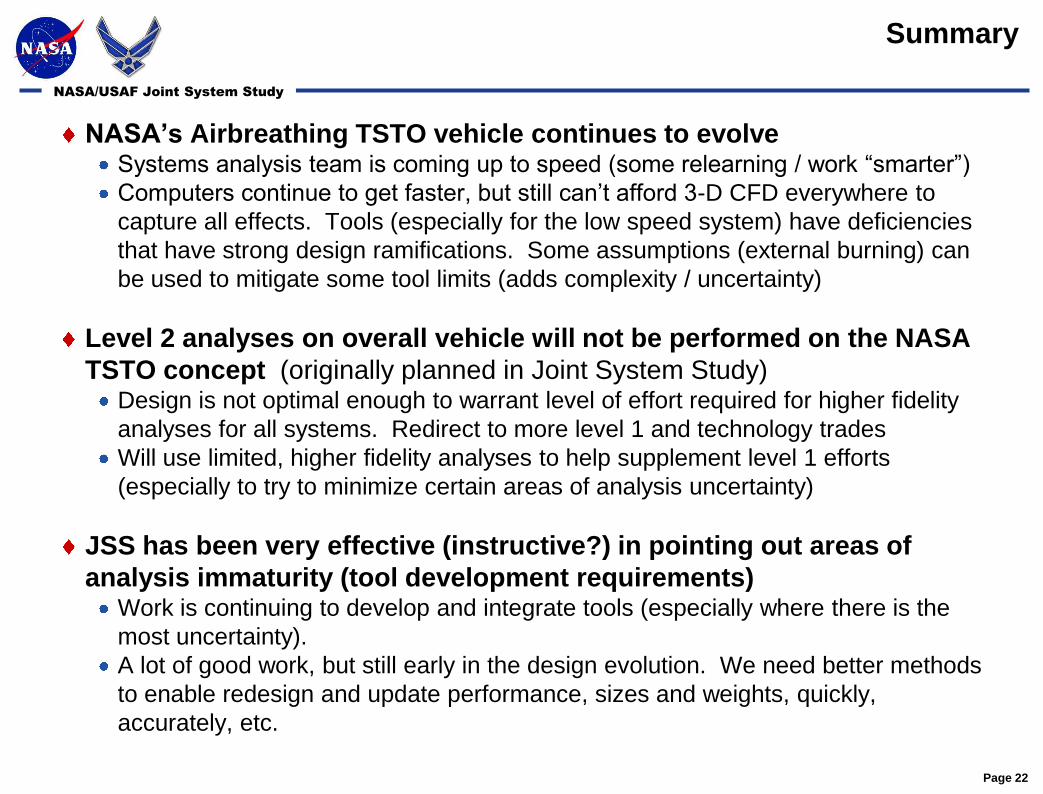
NASA’s Airbreathing TSTO vehicle continues to evolveSystems analysis team is coming up to speed (some relearning / work “smarter”)
Computers continue to get faster, but still can’t afford 3-D CFD everywhere to
capture all effects. Tools (especially for the low speed system) have deficiencies
that have strong design ramifications. Some assumptions (external burning) can
be used to mitigate some tool limits (adds complexity / uncertainty)
Level 2 analyses on overall vehicle will not be performed on the NASA
TSTO concept (originally planned in Joint System Study)Design is not optimal enough to warrant level of effort required for higher fidelity
analyses for all systems. Redirect to more level 1 and technology trades
Will use limited, higher fidelity analyses to help supplement level 1 efforts
(especially to try to minimize certain areas of analysis uncertainty)
JSS has been very effective (instructive?) in pointing out areas of
analysis immaturity (tool development requirements)Work is continuing to develop and integrate tools (especially where there is the
most uncertainty).
A lot of good work, but still early in the design evolution. We need better methods
to enable redesign and update performance, sizes and weights, quickly,
accurately, etc.
Summary
NASA/USAF Joint System Study
Page 23
NASA/USAF Joint System StudyNational Aeronautics and
Space Administration
End