Embed Size (px)
Citation preview

10/26/2017
1
UTILIZING TBEST FOR COMPREHENSIVE TRANSIT
PLANNING (PART II)
CUTR Webcast Series
October 26, 2017
WELCOME
Thanks for taking the time to learn more about TBEST – Transit Boardings Estimation and Simulation Tool
Target Audience – technical professionals and decision-makers involved in transit service planning or transit market analysis who want to learn more about TBEST applications
Objective - familiarize the audience with core TBEST applications and functionality

10/26/2017
2
TBEST TEAM
Rodney Bunner and Ashok KumarServiceEdge Solutions (Tampa and Los Angeles)
Role: TBEST Maintenance, Technical Support, Training
Steve Polzin and Xuehao ChuCenter for Urban Transportation Research (CUTR), Univ. of South Florida (Tampa)
Role: TBEST Strategy, Research-based Methodologies, TBEST Website
FDOT Project Manager: Chris WiglesworthFlorida Department of Transportation (Tallahassee)
Role: Public Sponsorship and Program Guidance
HART COA/TDP PROJECT – TBEST CASE STUDY
Major Transit Development Plan (TDP) update for fiscal years 2018 through 2027
Joint development of TDP and COA offer unique insights for the efforts to inform one another
Prepare transformative service operational assessment as an input to TDP Strategic Plan
Balance Public Needs, Demand, New Technologies and Cost Feasibility
TBEST specified by HART for TDP and COA analysis

10/26/2017
3
HART COA/TDP PROJECT
Developed HART TBEST Transit System to support diverse study components including: Line by Line Analysis Public Involvement Title VI Evaluation Market Assessment Jurisdictional Assessment Ridership Estimation Walk Access Impacts
Ridership Estimation
Socio-Economic
Market Analysis
Land Use Market Analysis
FTA Title VI Reporting
Network Accessibility
Analysis
Strategic Plan
Analysis
COA
Auto-mation
ToolsSupport
DataTBEST
Scenarios
TBEST HART TRANSIT SYSTEM – SYSTEM INPUT
Define HART Service Area and Operating Conditions to be utilized in TBEST Analysis and Reporting1. System Service Area2. Service Extent by County (allowing for future system
expansion)3. Operational and Policy Settings
Title VI Policy (Walk Distance, Disparate Impact)
Operating Costs (Per Hour and/or Per Mile)
Average In-Service Layover Time
Fare Structure
4. Socio-Economic Growth (MPO)

10/26/2017
4
DemographicCensus 2010 and 2015 American Community Survey (5-Year)
Parcel Land Use 2015 Florida Department of Revenue Parcel Data *Trip generation by land use type
Employment2014 InfoUSA Address-Based
TBEST HART TRANSIT SYSTEM – SE DATA INPUT
Socio-Economic Data assembled from FDOT-provided TBEST Florida state-wide data including:
TBEST BASE TRANSIT NETWORK – GTFS IMPORT
TBEST Base Network imported from 2016 HART operational GTFS Aggregates IVTT, service span, trips into time
periods (AM & PM Peak, Off Peak, Night, Sat, Sun)
Maintains GTFS route pattern structure
Network segmented at time points
Integrated connecting routes from regional transit providers (PSTA and PCPT)

10/26/2017
5
TBEST BASE TRANSIT NETWORK – STOP RIDERSHIP
Integrated Stop-Level Observed Ridership for COA
TBEST supplemental GTFS file specification
Scripted output from HART APC data system
Data post processed for TBEST format
Includes boardings and alightings
Specific to GTFS route, pattern and stop
Ridership averaged to TBEST time period
Populates to TBEST scenario network during GTFS import
TBEST BASE TRANSIT NETWORK – FINALIZATION Finalized HART base network within TBEST:
Fare (by Route Type and Mode)
Transfer Station Locations
Special Generators
Amenities
Route-Level Ridership (Validation)
Entered Socio-Economic Growth Rates
Validated the TBEST System to 2016 Service:
Creates route-level adjustment factors
Updates the socio-economic data to base year

10/26/2017
6
TBEST - COA Workflow Support Tool Delineated HART route service by jurisdiction
for Line by Line Analysis
Evaluated service-levels and performance within jurisdictions
TBEST COA SUPPORT – LINE BY LINE ANALYSIS
Utilized TBEST stop-level ridership compile pattern/stop boardings and alightings by line, segment and jurisdiction
Line and segment level performance evaluations with population/employment
Developed max load and load ratios per line and compared to HART KPI’s (TBEST Loaded Network)
AM Mid PM Night Weekday Saturday Sunday
Boardings 132 258 143 62 596 0 0
Revenue Service Miles 76 152 76 62 366 0 0
Revenue Service Trips 6 12 6 5 29 0 0
Revenue Service Hours 7 14 7 5 33 0 0
Boardings Per Service Mile 1.7 1.7 1.9 1.0 1.6 0 0
Boardings Per Service Trip 22 22 24 12 21 0 0
Boardings Per Service Hour 19 19 21 12 18 0 0
Route Service and Performance SummaryRoute 4
MTC ‐ M/W M/W ‐ A A‐B B‐C
0.63 2.33 3.35 7.45
Population 3,914 2,434 2,779 1,411
Employment 29,665 10,228 1,387 283
Boardings 275 10 6 12
Alightings 2 14 23 25
B‐C A‐B M/W ‐ A MTC ‐ M/W
4.89 3.42 2.66 0.59
Population 2,104 2,676 2,083 4,192
Employment 362 1,455 4,050 33,429
Boardings 23 39 11 27
Alightings 4 21 10 298
Per Mile
Southbound
Northbound
Segment
Length (miles)
Per Mile
Segment
Length (miles)
Line Segment Summary
Line Summary by Time of Day
TBEST COA SUPPORT – LINE BY LINE ANALYSIS
Line-LevelLoad Ratios

10/26/2017
7
Public Involvement
Travel Time Heat Maps to Major Transit Hubs
Accessibility
TBEST SCENARIO ALTERNATIVES DEVELOPMENT
Constructed HART Alternative Scenarios: 2018 COA Network (Frequent Network)
2027 Funded Network (Frequent + Targeted Express + Hyperlink)
2027 Needs Network (Frequent + Regional + Hyperlink + South County)
Add/Edit/Remove Routes, Patterns, Segments and Stops Modify Service Span, Headway, Travel Times
Combination of TBEST Network Editor and imported Remix GTFS HART and TOA planners would sketch routes in Remix -> Alternative GTFS Files
Utilize TBEST GTFS Import Tool to integrate Remix GTFS
Not entirely seamless conflation of Remix to TBEST network

10/26/2017
8
TBEST SCENARIO ALTERNATIVES DEVELOPMENTBase Network 2018 COA Network
2027 Funded
2027 Needs
HART TBEST RIDERSHIP ESTIMATION
TBEST Ridership Estimation Model responds to: service-level adjustments
route re-structuring
fare changes
transfers
walk markets
destination markets
Modeled Networks
2018 COA Network 2027 Funded Network 2027 Needs Network
System, Route Type and Line-Level Comparison with Base performance
TBEST Scenario Summary Tool – new report filters based on HART TDP summarization methods
RouteAverageWeekdayDailyRidership
(2018)
AverageWeekdayDailyRidership(2027Needs)
AbsoluteChange(2018‐2027Needs)
GrowthRate(2018‐
2027Needs)
Local Routes
1 4,766 7,234 2,468 51.8%
5 1,805 2,525 720 39.9%
6 4475 7,846 3,371 75.3%
7 1,142 2,363 1,221 106.9%
8 1,806 3,639 1,833 101.5%
9 1,844 2,612 768 41.6%
11 ‐ 2,944 2,944 100.0%
12 3,035 5,083 2,048 67.5%
14 452 766 314 69.5%
15 1,242 2,122 880 70.9%
16 859 1,539 680 79.2%
17 166 190 24 14.5%
19 1,024 2,140 1,116 109.0%
30 1250 3710 2,460 196.8%
31 279 456 177 63.4%
32 1,385 1,756 371 26.8%
33 1,026 1,840 814 79.3%
34 3,524 6,947 3,423 97.1%
36 1,588 2,313 725 45.7%
36 EXT ‐ 224 224 100.0%
37 728 1,224 496 68.1%
38 261 378 117 44.8%
39 2332 3958 1,626 69.7%
42 1394 2040 646 46.3%
45 736 966 230 31.3%
46 185 202 17 9.2%
49 ‐ 1462 1462 100.0%
53 ‐ 191 191 100.0%
58 ‐ 717 717 100.0%
96 120 129 9 7.5%
97 ‐ ‐ ‐ ‐
Big Bend Circulator ‐ 23 23 100.0%
Subtotal 37,424 69,539 32,115 85.8%
HARTTBESTWeekdayRidershipandGrowthRates(2018–2027Needs)
10/26/2017
9
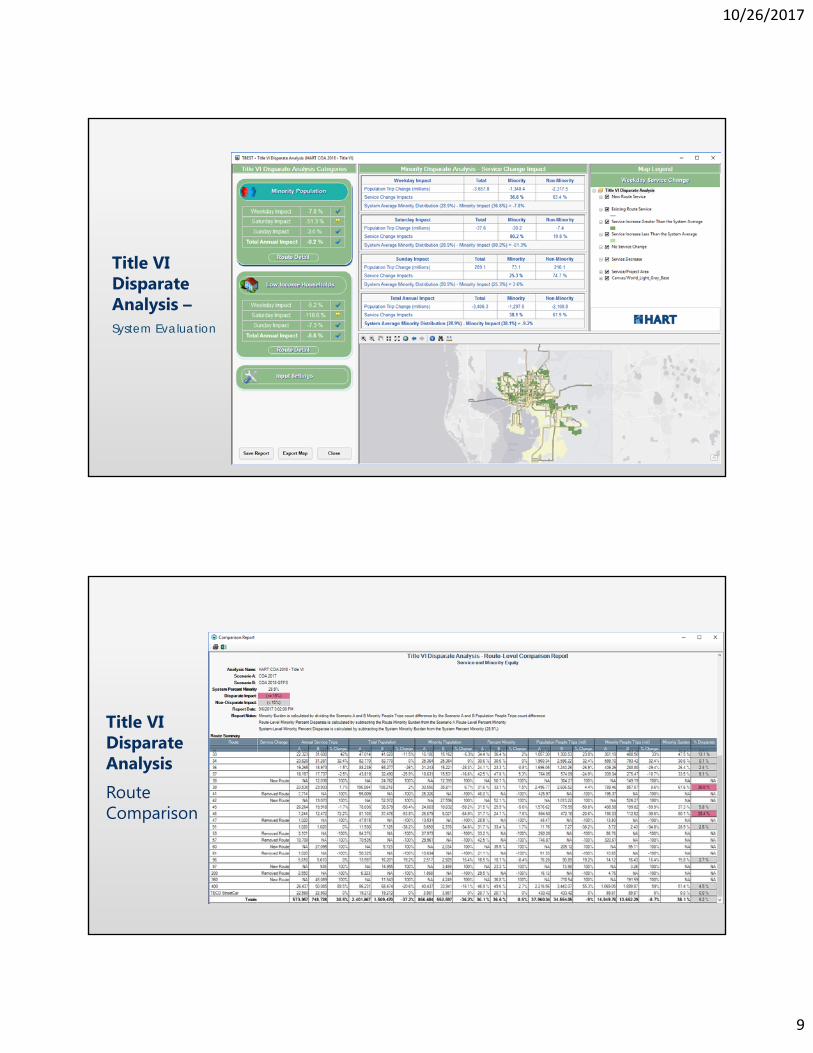
Title VI Disparate Analysis –System Evaluation
Title VI Disparate Analysis
Route Comparison

10/26/2017
10
Market Assessment
Walk Access to Transit by distance (½, ¼, and ¾ miles)
Evaluated HyperLink zone Markets
Utilized growth and coverage to estimate HyperLink riders in 2027
TBEST ACCESSIBILITY MEASURES
2018 High Frequency Routes

10/26/2017
11
TBEST ACCESSIBILITY MEASURES
2027 Funded High Frequency Routes
TBEST ACCESSIBILITY MEASURES
2027 Needs High Frequency Routes
10/26/2017
12
HART COA/TDP STUDY - RESULTS
Project Outcomes TBEST streamlined transit analysis and reporting to save time and money Fulfilled FDOT TDP ridership estimation requirements Detailed COA assessment formed the base of the TDP strategic plan Communicated complex analysis results to HART staff, HART Board, county officials, and the general public Fulfilled multiple elements of the COA and TDP data and analytical requirements Integration with other systems and software including APC data and Remix GTFS files TBEST software improvements based on study components furnished to all TBEST users
Future TBEST Improvements and Activities Operational GTFS Export from TBEST Park-n-Ride Model Structure FDOT-sponsored Florida seminar training in 2018
Rodney Bunner, ServiceEdge Solutions
Email: [email protected]
Phone: (727) 455-4059 www.myserviceedge.com
www.tbest.org
Steve Polzin, CUTR
Email: [email protected]
Phone: (813) 974-9849
Chris Wiglesworth, FDOT
Email: [email protected]
Phone: (850) 414-4532
TBEST CONTACTS