Embed Size (px)
Citation preview
TC-PTP REGULATES THE IL-7 TRANSCRIPTIONAL RESPONSE DURING MURINE
EARLY T CELL DEVELOPMENT
K.A. Pike1, T. Hatzihristidis1,2, S. Bussières-Marmen1,3, F. Robert1, N. Desai1,3, D. Miranda-
Saavedra4,5, J. Pelletier1,2 and M.L. Tremblay1,2,3
1Rosalind and Morris Goodman Cancer Centre, McGill University, Montréal QC H3A 1A3,
Canada.2Division of Experimental Medicine, Department of Medicine, McGill University,
Montréal, QC H3A 1A3, Canada. 3Department of Biochemistry, McGill University, Montréal QC
H3A 1A3, Canada.4Centro de Biología Molecular Severo Ochoa, CSIC/Universidad Autónoma de
Madrid, 28049 Madrid, Spain. 5Department of Computer Science, University of Oxford, Wolfson
Building Parks Road, OXFORD, OX1 3QD, UK
Corresponding author: M.L. Tremblay 1160 Pine Avenue West Office Room 612; Lab Room 603 Montreal, Quebec H3A 1A3 Tel (514) 398-7290 Fax (514) 398-6769 Email: [email protected]
Short title: TC-PTP, IL-7 and T cell development
Supplementary Information
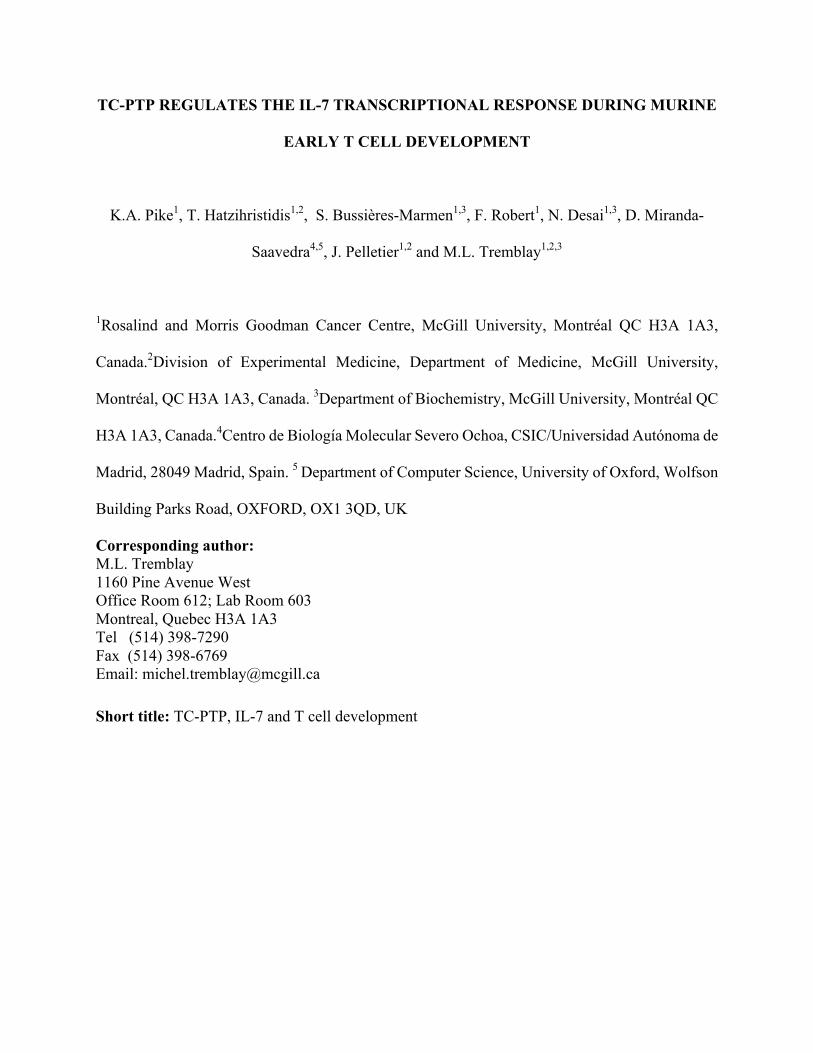
Supplemental Table S1. Differentially expressed genes in tc-ptp-/- DN3 cells differentiated in
OP9-DL1 co-culture compared to tc-ptp+/+ DN3 cells. Average fragments per kilobase (FPKM)
derived from 3 biological replicates.


Supplemental Figure S1. It has been previously reported that the distinct stages of early T cell
development are each associated with gene clusters identified by similar patterns of expression.
Each cluster being identified by a characteristic gene27. No significant overlap was observed
between the tc-ptp-/- differentially expressed gene set and gene clusters associated with the loss
of progenitor potential, T lineage commitment, Notch signaling or β-selection.

Supplemental Figure S2. Generation of an inducible TC-PTP shRNA mouse. (A) In vivo
monitoring of GFP expression in mice treated 7 days with Dox (1mg/ml). Epi-fluorescence scale
in photons/second (bar = 0.5x10⁻³) where bright yellow to darker red correlates with high to low
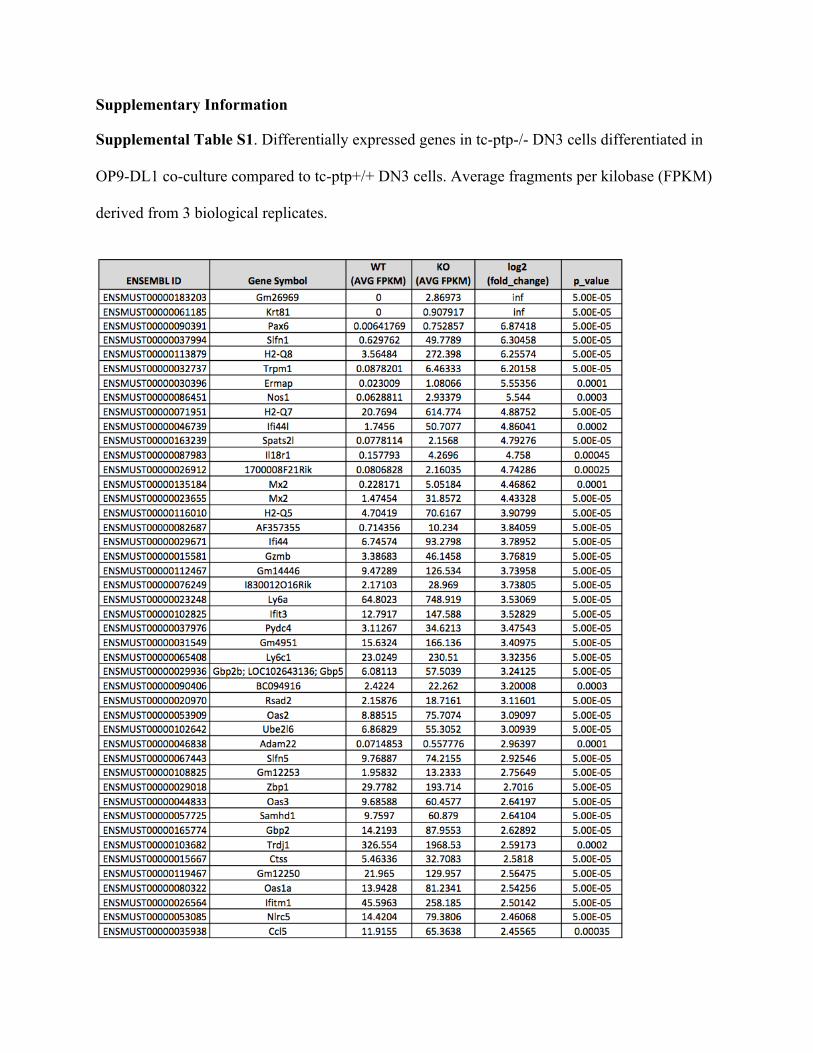
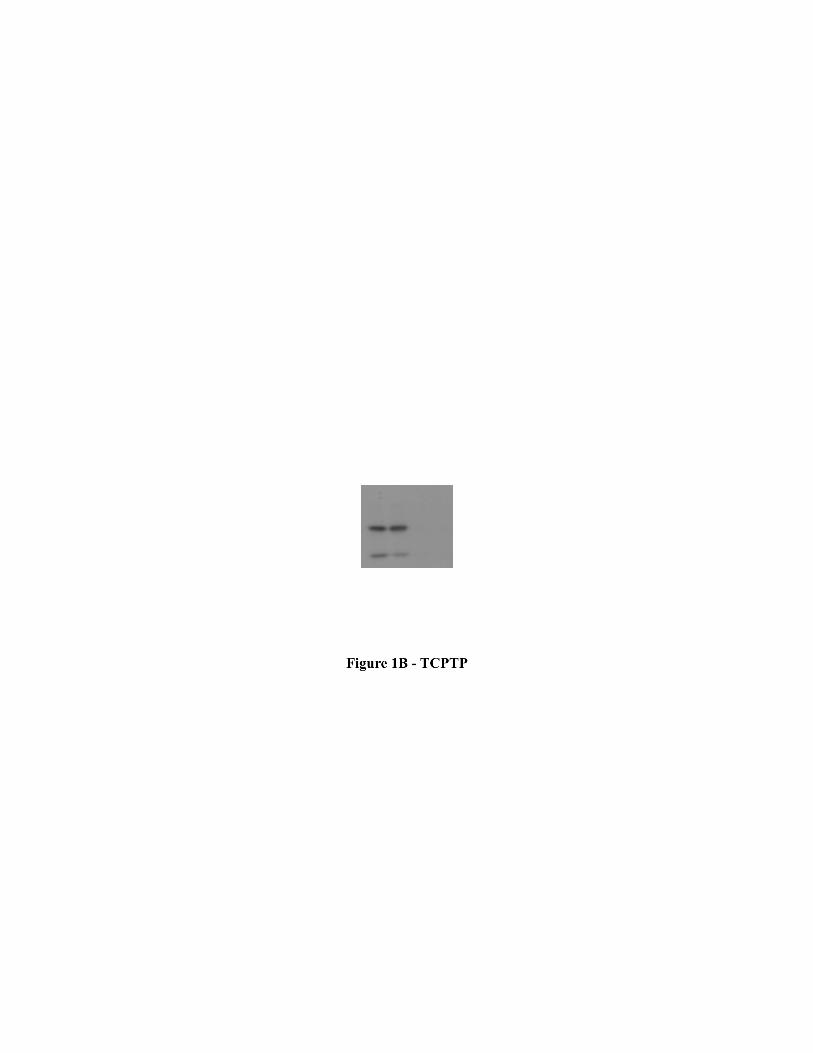
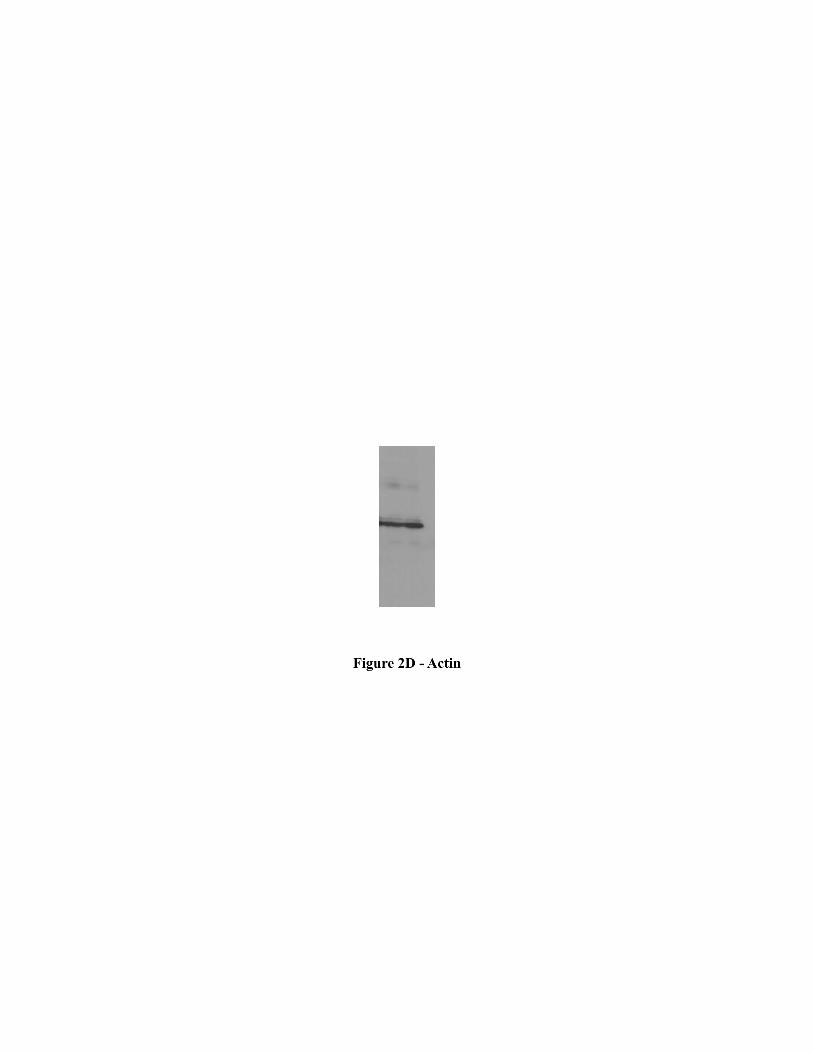
expression of GFP. D) Western blot on thymic cells isolated from TSI/cre, mice, TSI/cre+ mice
with the shRNA only on one allele (sh/WT) or both alleles of ColA1 (sh/sh). All mice were
treated with Dox (1mg/ml) for 7 days. (B) Thymic cells from the TSI/cre+ mouse treated with
different concentrations of Dox (0-1000 ug/ml). Percentage of GFP+ cells assessed by flow
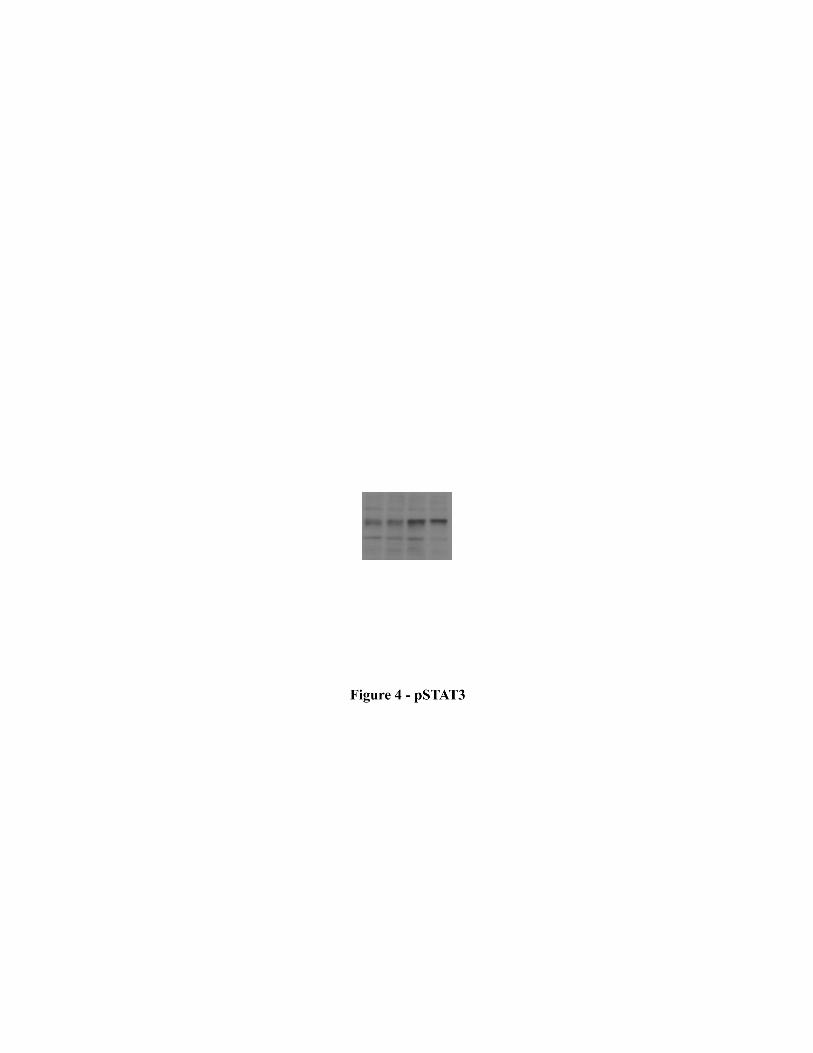
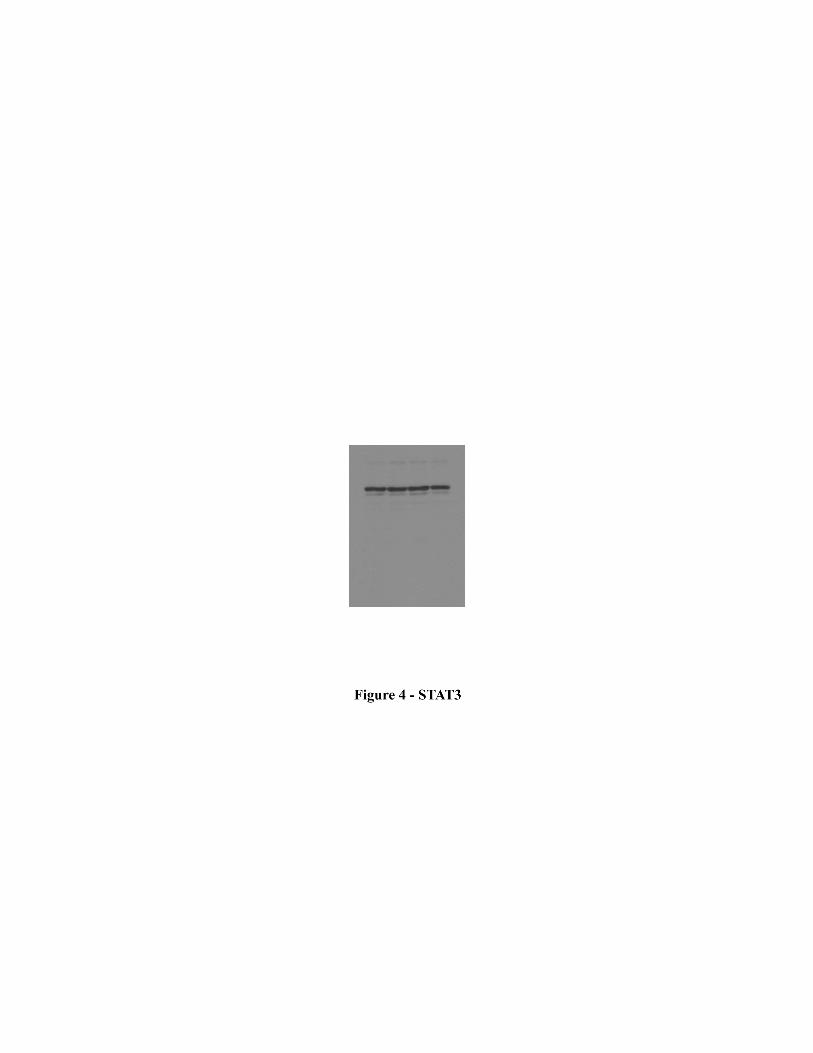
cytometry, gated on live cells (7AAD- ). (C) Protein analysis of thymii from mice receiving the
water treatment with different concentrations of Dox ranging from 0,1,10,100,1000 ug/ml (+:
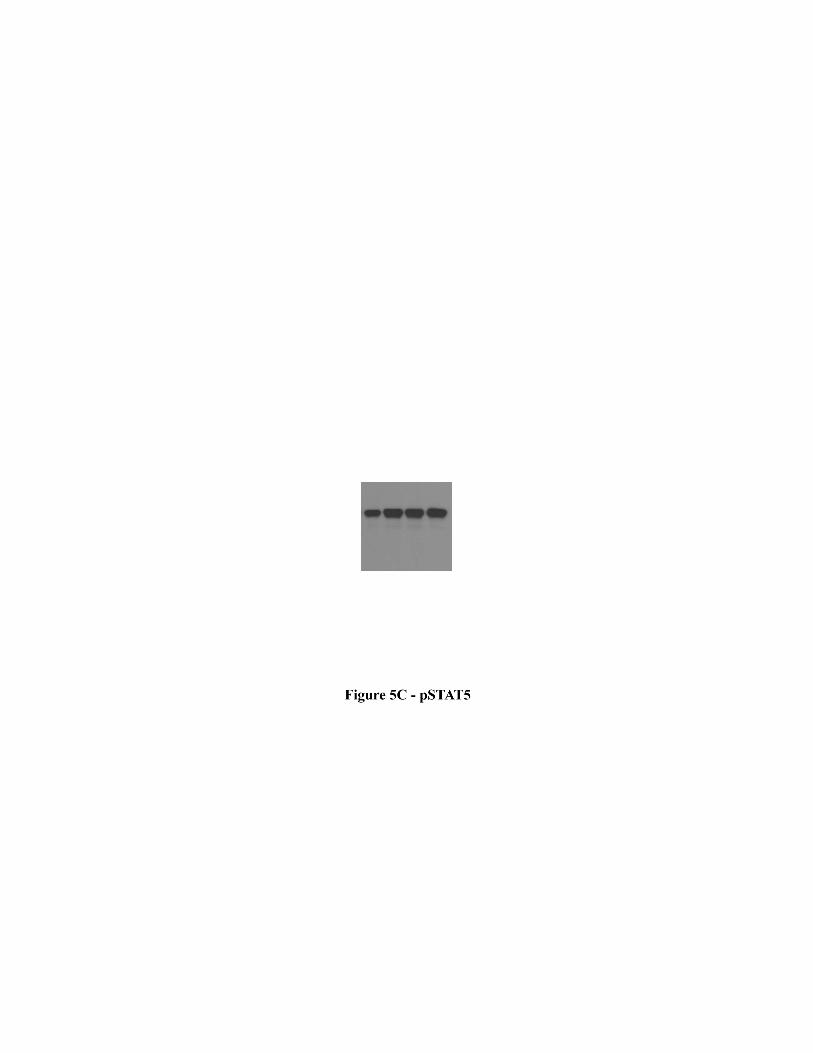
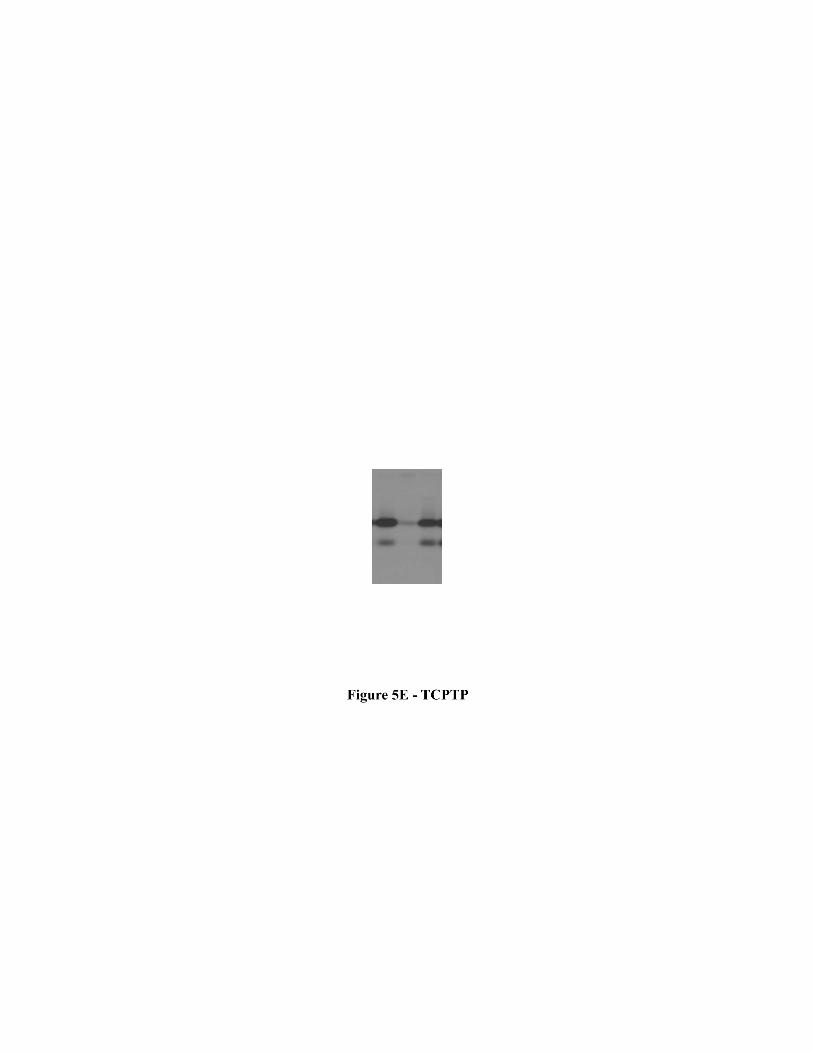
1000ug/ml). Membrane blotted for TC-PTP, GFP, p-STAT1, STAT1, PTP-1B and actin as a
loading control.


![Protein tyrosine phosphatase PTP-RR regulates ... · Lyte™ MFP Protein Phosphatase Assay Kit (AnaSpec, San Jose, CA) [13]. Immunopurified PTP-RR or PP2A were added into assay buffer](https://img.pdfslide.net/doc/110x75/6064d84663cb5514f86a31a5/protein-tyrosine-phosphatase-ptp-rr-regulates-lytea-mfp-protein-phosphatase.jpg)