Embed Size (px)
Citation preview
User Guide
Version 11 (Beta)

Copyright
© 2011 Worden Brothers, Inc.
All rights reserved. Printed in the United States of America. Except as permitted under the
Copyright Act of 1976, no part of this publication may be reproduced or distributed in any
form or by any means, or stored in a database or retrieval system, without the prior written
permission of the publisher.
Information has been obtained by Worden Brothers, Inc. from sources believed to be
reliable. However, because of the possibility of human or mechanical error by our sources,
Worden Brothers, Inc. does not guarantee the accuracy, adequacy or completeness of any
information contained herein and is not responsible for any errors or omissions or the results
obtained from the use of such information.
www.Worden.com
Worden Brothers, Inc.
Five Oaks Office Park
4905 Pine Cone Drive
Durham, NC 27707
Customer Service: 1-800-776-4940
Technical Support: 1-919-408-0542
Fax: 1-919-408-0545
Updated January 31, 2011

TC2000 User Manual (Beta)
Introduction .................................................................................................................................................................. 1
Things to Know about TC2000 ................................................................................................................................. 2
Terms to Know ............................................................................................................................................................ 2
Quick Tour .................................................................................................................................................................... 3
Online Access .............................................................................................................................................................. 3
Import TeleChart 2007 Settings ................................................................................................................................ 4
System Settings ........................................................................................................................................................... 4
Chart Basics .................................................................................................................................................................. 4
Display Price Plot........................................................................................................................................................ 4
Time Frames ................................................................................................................................................................ 6
Indicators ...................................................................................................................................................................... 6
WatchList ..................................................................................................................................................................... 7
News/Notes .................................................................................................................................................................. 9
Zoom & Pan ............................................................................................................................................................... 11
Pointer Mode ............................................................................................................................................................. 11
Drawing Tools ........................................................................................................................................................... 12
Live Chat (Platinum Only) ....................................................................................................................................... 13
Chart Scaling ............................................................................................................................................................. 15
Chart Template .......................................................................................................................................................... 16
Sorting ........................................................................................................................................................................... 17
From Library .............................................................................................................................................................. 17
From Chart ................................................................................................................................................................. 17
QuickSort ................................................................................................................................................................... 20
Personal Criteria Formulas ...................................................................................................................................... 24
Custom Date Sort ...................................................................................................................................................... 25
EasyScan ...................................................................................................................................................................... 26
My Universe .............................................................................................................................................................. 26
Fundamentals ............................................................................................................................................................. 27
Alerts .............................................................................................................................................................................. 27
Alert Types ................................................................................................................................................................. 27
Alert Manager ............................................................................................................................................................ 27
Delivery Settings ....................................................................................................................................................... 27
Saving ............................................................................................................................................................................ 28
Save Chart .................................................................................................................................................................. 28
Save Layout ............................................................................................................................................................... 28
Resources ..................................................................................................................................................................... 29
Index .............................................................................................................................................................................. 30

1
INTRODUCTION
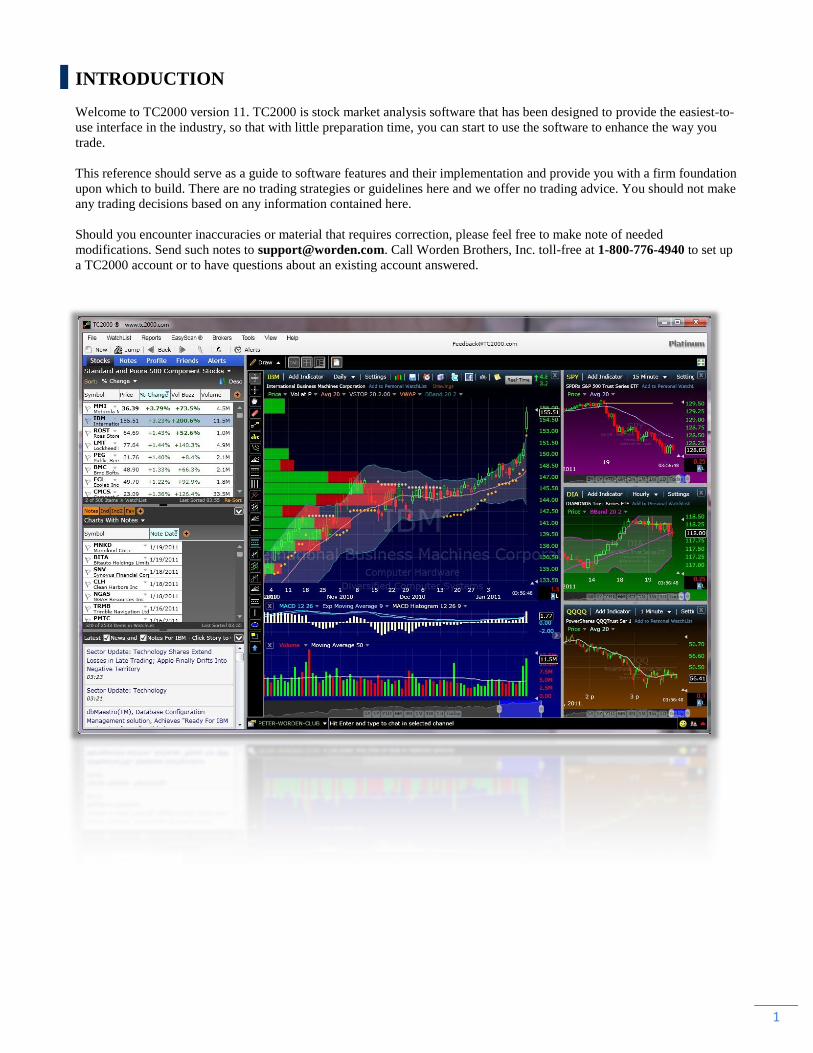
Welcome to TC2000 version 11. TC2000 is stock market analysis software that has been designed to provide the easiest-to-
use interface in the industry, so that with little preparation time, you can start to use the software to enhance the way you
trade.
This reference should serve as a guide to software features and their implementation and provide you with a firm foundation
upon which to build. There are no trading strategies or guidelines here and we offer no trading advice. You should not make
any trading decisions based on any information contained here.
Should you encounter inaccuracies or material that requires correction, please feel free to make note of needed
modifications. Send such notes to [email protected]. Call Worden Brothers, Inc. toll-free at 1-800-776-4940 to set up
a TC2000 account or to have questions about an existing account answered.
2
THINGS TO KNOW ABOUT TC2000:
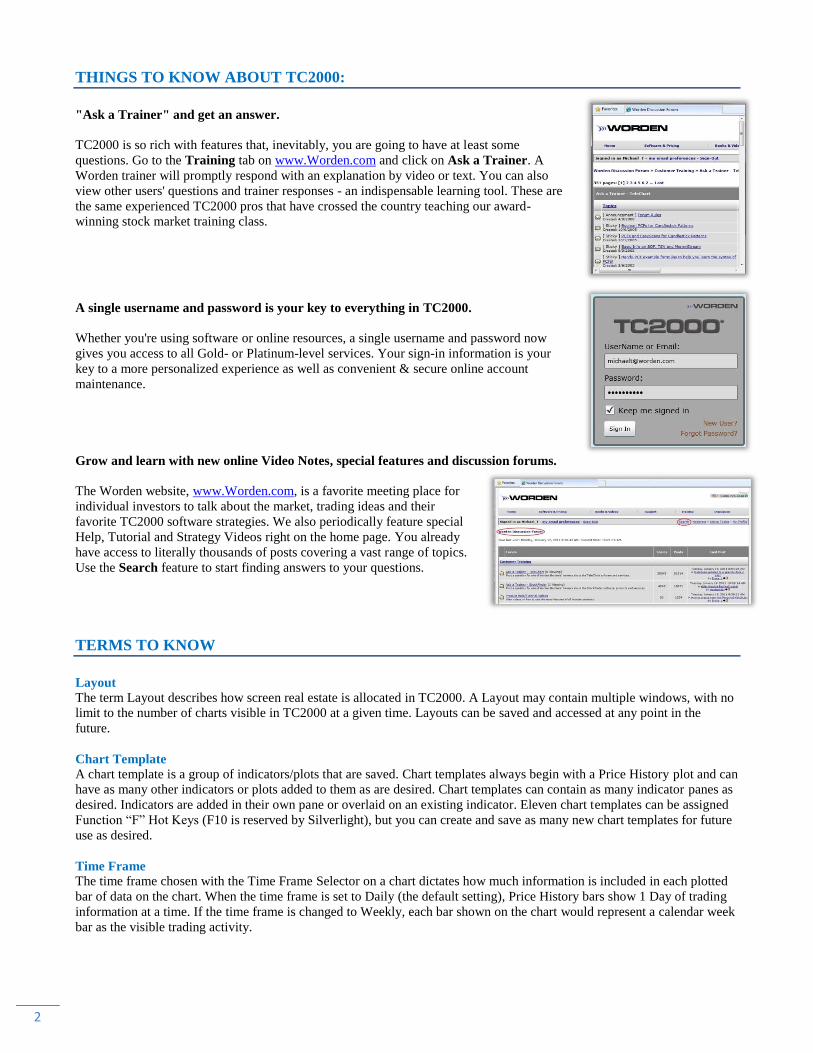
"Ask a Trainer" and get an answer.
TC2000 is so rich with features that, inevitably, you are going to have at least some
questions. Go to the Training tab on www.Worden.com and click on Ask a Trainer. A
Worden trainer will promptly respond with an explanation by video or text. You can also
view other users' questions and trainer responses - an indispensable learning tool. These are
the same experienced TC2000 pros that have crossed the country teaching our award-
winning stock market training class.
A single username and password is your key to everything in TC2000.
Whether you're using software or online resources, a single username and password now
gives you access to all Gold- or Platinum-level services. Your sign-in information is your
key to a more personalized experience as well as convenient & secure online account
maintenance.
Grow and learn with new online Video Notes, special features and discussion forums.
The Worden website, www.Worden.com, is a favorite meeting place for
individual investors to talk about the market, trading ideas and their
favorite TC2000 software strategies. We also periodically feature special
Help, Tutorial and Strategy Videos right on the home page. You already
have access to literally thousands of posts covering a vast range of topics.
Use the Search feature to start finding answers to your questions.
TERMS TO KNOW
Layout
The term Layout describes how screen real estate is allocated in TC2000. A Layout may contain multiple windows, with no
limit to the number of charts visible in TC2000 at a given time. Layouts can be saved and accessed at any point in the
future.
Chart Template
A chart template is a group of indicators/plots that are saved. Chart templates always begin with a Price History plot and can
have as many other indicators or plots added to them as are desired. Chart templates can contain as many indicator panes as
desired. Indicators are added in their own pane or overlaid on an existing indicator. Eleven chart templates can be assigned
Function ―F‖ Hot Keys (F10 is reserved by Silverlight), but you can create and save as many new chart templates for future
use as desired.
Time Frame
The time frame chosen with the Time Frame Selector on a chart dictates how much information is included in each plotted
bar of data on the chart. When the time frame is set to Daily (the default setting), Price History bars show 1 Day of trading
information at a time. If the time frame is changed to Weekly, each bar shown on the chart would represent a calendar week
bar as the visible trading activity.
3
Zoom & Pan
The Zoom & Pan control located at the bottom of each chart allows control over how much historical information is
displayed on a chart at a given time. Using the scroll wheel on your mouse, zoom out to see a lot of historical plotted values
or zoom in to get an up close view.
WatchList
A WatchList is any group of ticker symbols that are displayed together as a list. The active symbol in the list is the one for
which information will be displayed on all charts (that have not specifically been assigned other tickers). Click any ticker
symbol within a WatchList to display its information on the charts. WatchLists can be sorted by symbol, indicator value,
stocks that are passing a scan, or many other criteria.
Indicator
An indicator is a graphical plot displayed within a chart's pane. Indicator values are displayed in increments determined by
the Time Frame assigned to the indicator's chart. TC2000 includes dozens of technical indicators which can be manipulated
in unlimited ways.
Worden Market Indicators (T2s)
A Market Indicator is an indicator whose job it is to calculate some value across a list of issues (as opposed to a single stock
or Exchange Traded Fund). The US Market Indicators are a list of breadth indicators that have been included for you to
analyze the state of the broad market.
Personal Criteria Formula (PCF)
A PCF is a user-defined formula that can be evaluated either to return a TRUE/FALSE reading or a specific value that can
be utilized to plot a custom indicator or in the creation of a scan to identify stocks displaying specific behaviors.
EasyScan™
An EasyScan creates a WatchList of stocks that meet one or more user-defined criteria. Once an EasyScan has been created,
selection of the scan's name within the WatchList pull-down at any point reveals a dynamic list of items that display the
included scan criteria.
QUICK TOUR
ONLINE ACCESS
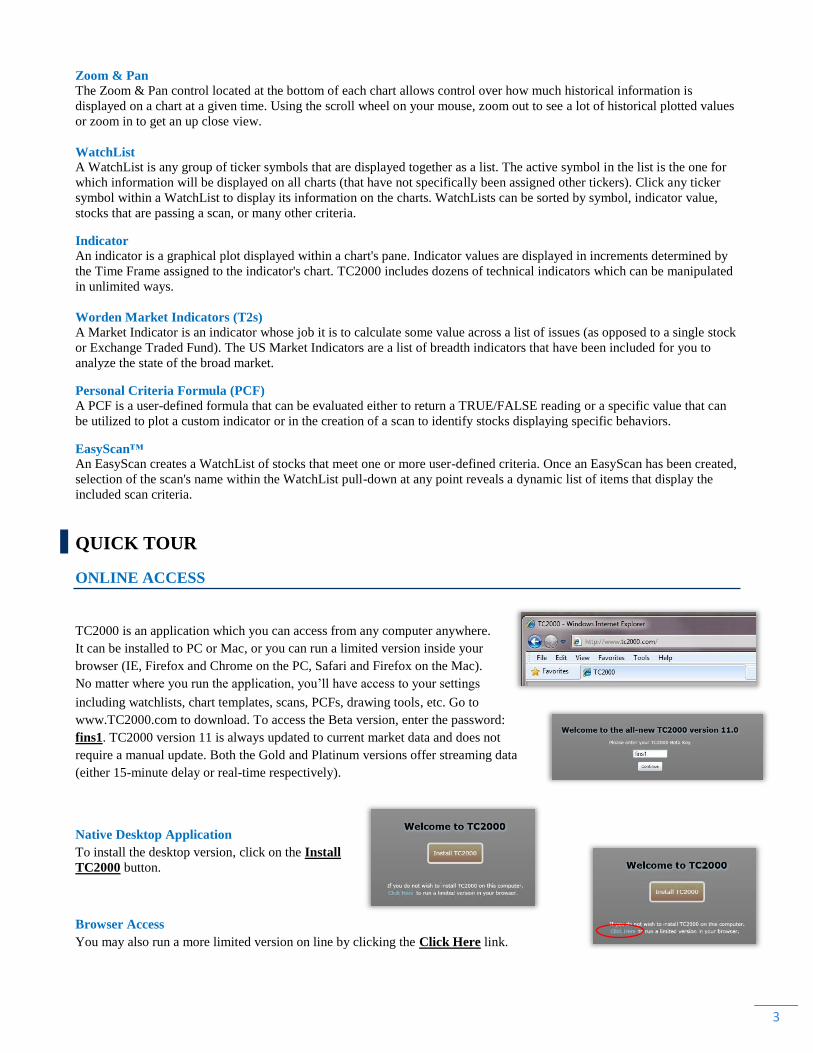
TC2000 is an application which you can access from any computer anywhere.
It can be installed to PC or Mac, or you can run a limited version inside your
browser (IE, Firefox and Chrome on the PC, Safari and Firefox on the Mac).
No matter where you run the application, you‘ll have access to your settings
including watchlists, chart templates, scans, PCFs, drawing tools, etc. Go to
www.TC2000.com to download. To access the Beta version, enter the password:
fins1. TC2000 version 11 is always updated to current market data and does not
require a manual update. Both the Gold and Platinum versions offer streaming data
(either 15-minute delay or real-time respectively).
Native Desktop Application
To install the desktop version, click on the Install
TC2000 button.
Browser Access
You may also run a more limited version on line by clicking the Click Here link.
4
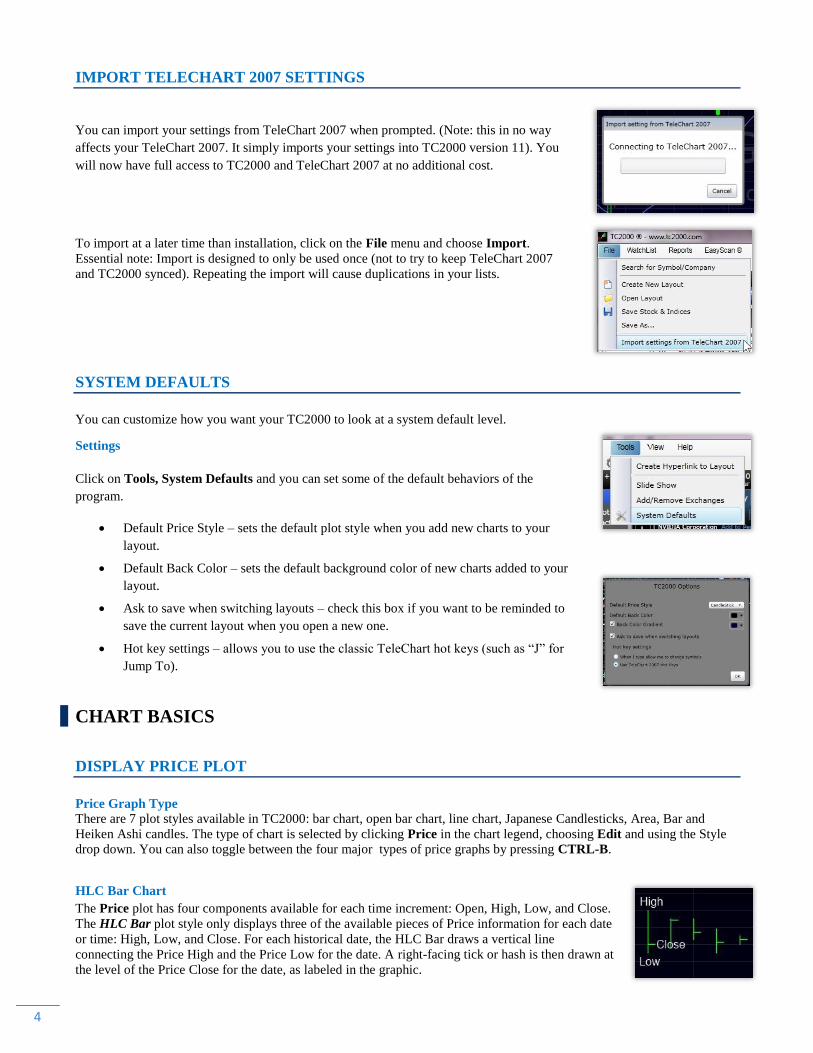
IMPORT TELECHART 2007 SETTINGS
You can import your settings from TeleChart 2007 when prompted. (Note: this in no way
affects your TeleChart 2007. It simply imports your settings into TC2000 version 11). You
will now have full access to TC2000 and TeleChart 2007 at no additional cost.
To import at a later time than installation, click on the File menu and choose Import.
Essential note: Import is designed to only be used once (not to try to keep TeleChart 2007
and TC2000 synced). Repeating the import will cause duplications in your lists.
SYSTEM DEFAULTS
You can customize how you want your TC2000 to look at a system default level.
Settings
Click on Tools, System Defaults and you can set some of the default behaviors of the
program.
Default Price Style – sets the default plot style when you add new charts to your
layout.
Default Back Color – sets the default background color of new charts added to your
layout.
Ask to save when switching layouts – check this box if you want to be reminded to
save the current layout when you open a new one.
Hot key settings – allows you to use the classic TeleChart hot keys (such as ―J‖ for
Jump To).
CHART BASICS
DISPLAY PRICE PLOT
Price Graph Type
There are 7 plot styles available in TC2000: bar chart, open bar chart, line chart, Japanese Candlesticks, Area, Bar and
Heiken Ashi candles. The type of chart is selected by clicking Price in the chart legend, choosing Edit and using the Style
drop down. You can also toggle between the four major types of price graphs by pressing CTRL-B.
HLC Bar Chart
The Price plot has four components available for each time increment: Open, High, Low, and Close.
The HLC Bar plot style only displays three of the available pieces of Price information for each date
or time: High, Low, and Close. For each historical date, the HLC Bar draws a vertical line
connecting the Price High and the Price Low for the date. A right-facing tick or hash is then drawn at
the level of the Price Close for the date, as labeled in the graphic.
5
Bar Chart with Open
The Price plot has four components available for each time increment: Open, High, Low, and Close.
The OHLC Bar plot style only displays all four of the available pieces of Price information for each
date or time: Open, High, Low, and Close. For each historical date, the OHLC Bar draws a vertical
line connecting the Price High and the Price Low for the date. A left-facing tick or hash is drawn at
the level of the Price Open for the date, and a right-facing tick or hash is then drawn at the level of
the Price Close for the date, as labeled in the graphic.
Line Graph
The Price plot has four components available for each time increment: Open, High, Low, and Close.
The Line plot style draws a point at the Price Close value for each date, as illustrated in the graphic.
Each point is then connected by a line to the next point on the chart. The connecting line has no data
behind it; the line's only purpose is to connect the values of sequential data points.
Candlestick
The Price plot has four components available for each time increment: Open, High, Low, and Close.
The Candlestick plot style displays all four components of Price for each historical date. A candlestick
may either be opaque or transparent. An opaque candlestick represents the four Price components as
labeled in the graphic. A transparent candlestick represents the four Price components as labeled in the
graphic.
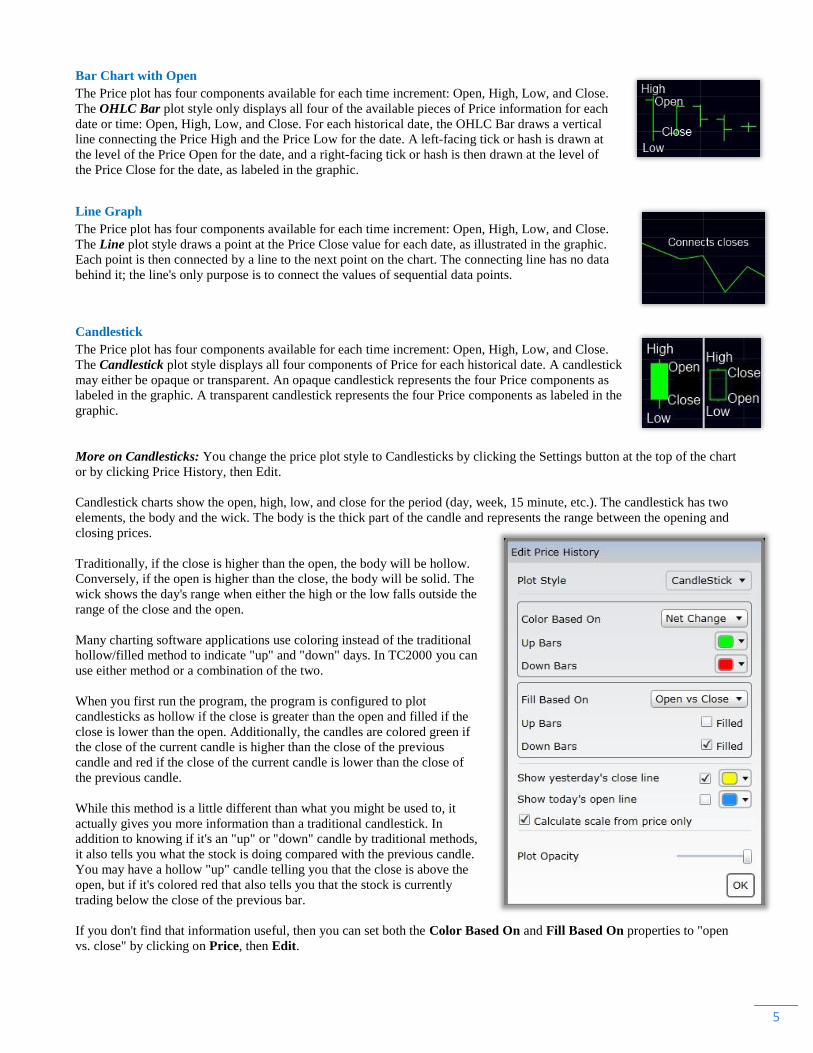
More on Candlesticks: You change the price plot style to Candlesticks by clicking the Settings button at the top of the chart
or by clicking Price History, then Edit.
Candlestick charts show the open, high, low, and close for the period (day, week, 15 minute, etc.). The candlestick has two
elements, the body and the wick. The body is the thick part of the candle and represents the range between the opening and
closing prices.
Traditionally, if the close is higher than the open, the body will be hollow.
Conversely, if the open is higher than the close, the body will be solid. The
wick shows the day's range when either the high or the low falls outside the
range of the close and the open.
Many charting software applications use coloring instead of the traditional
hollow/filled method to indicate "up" and "down" days. In TC2000 you can
use either method or a combination of the two.
When you first run the program, the program is configured to plot
candlesticks as hollow if the close is greater than the open and filled if the
close is lower than the open. Additionally, the candles are colored green if
the close of the current candle is higher than the close of the previous
candle and red if the close of the current candle is lower than the close of
the previous candle.
While this method is a little different than what you might be used to, it
actually gives you more information than a traditional candlestick. In
addition to knowing if it's an "up" or "down" candle by traditional methods,
it also tells you what the stock is doing compared with the previous candle.
You may have a hollow "up" candle telling you that the close is above the
open, but if it's colored red that also tells you that the stock is currently
trading below the close of the previous bar.
If you don't find that information useful, then you can set both the Color Based On and Fill Based On properties to "open
vs. close" by clicking on Price, then Edit.
6
Bar
Also known as a "bar graph", this is a chart with rectangular bars which are proportional to the values
they represent. Not typically used to plot prices since a Line chart will give you the same information
and not clutter up the chart as much. Bar charts are more widely used to plot volume and indicators like
a MACD histogram which has values above and below zero.
Heiken-Ashi
According to Investopedia, "The Heiken-Ashi technique is extremely useful for making candlestick
charts more readable - trends can be located more easily, and buying opportunities can be spotted at a
glance. When properly used, this technique can help you spot trends and trend changes from which you
can profit!"
Area
Shades the area below the price line graph. This type of chart displays the trend of values over time or
categories emphasizing the magnitude of change in a more three-dimensional way.
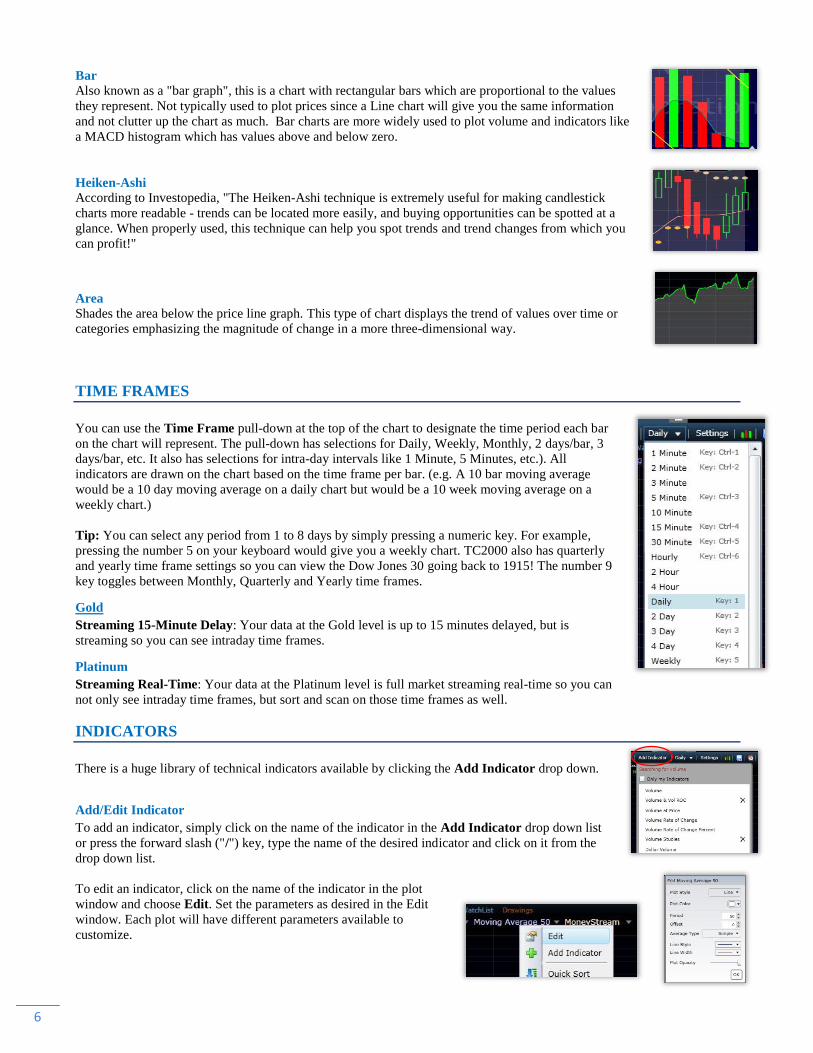
TIME FRAMES
You can use the Time Frame pull-down at the top of the chart to designate the time period each bar
on the chart will represent. The pull-down has selections for Daily, Weekly, Monthly, 2 days/bar, 3
days/bar, etc. It also has selections for intra-day intervals like 1 Minute, 5 Minutes, etc.). All
indicators are drawn on the chart based on the time frame per bar. (e.g. A 10 bar moving average
would be a 10 day moving average on a daily chart but would be a 10 week moving average on a
weekly chart.)
Tip: You can select any period from 1 to 8 days by simply pressing a numeric key. For example,
pressing the number 5 on your keyboard would give you a weekly chart. TC2000 also has quarterly
and yearly time frame settings so you can view the Dow Jones 30 going back to 1915! The number 9
key toggles between Monthly, Quarterly and Yearly time frames.
Gold
Streaming 15-Minute Delay: Your data at the Gold level is up to 15 minutes delayed, but is
streaming so you can see intraday time frames.
Platinum
Streaming Real-Time: Your data at the Platinum level is full market streaming real-time so you can
not only see intraday time frames, but sort and scan on those time frames as well.
INDICATORS
There is a huge library of technical indicators available by clicking the Add Indicator drop down.
Add/Edit Indicator
To add an indicator, simply click on the name of the indicator in the Add Indicator drop down list
or press the forward slash ("/") key, type the name of the desired indicator and click on it from the
drop down list.
To edit an indicator, click on the name of the indicator in the plot
window and choose Edit. Set the parameters as desired in the Edit
window. Each plot will have different parameters available to
customize.
7
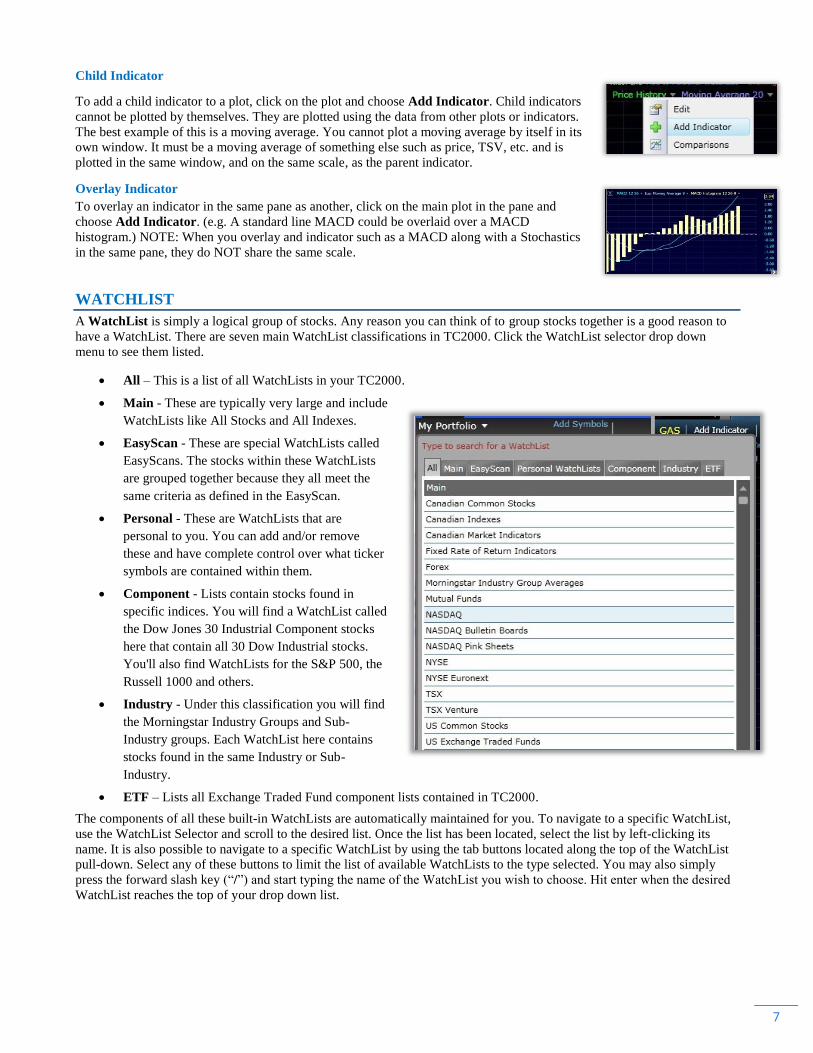
Child Indicator
To add a child indicator to a plot, click on the plot and choose Add Indicator. Child indicators
cannot be plotted by themselves. They are plotted using the data from other plots or indicators.
The best example of this is a moving average. You cannot plot a moving average by itself in its
own window. It must be a moving average of something else such as price, TSV, etc. and is
plotted in the same window, and on the same scale, as the parent indicator.
Overlay Indicator
To overlay an indicator in the same pane as another, click on the main plot in the pane and
choose Add Indicator. (e.g. A standard line MACD could be overlaid over a MACD
histogram.) NOTE: When you overlay and indicator such as a MACD along with a Stochastics
in the same pane, they do NOT share the same scale.
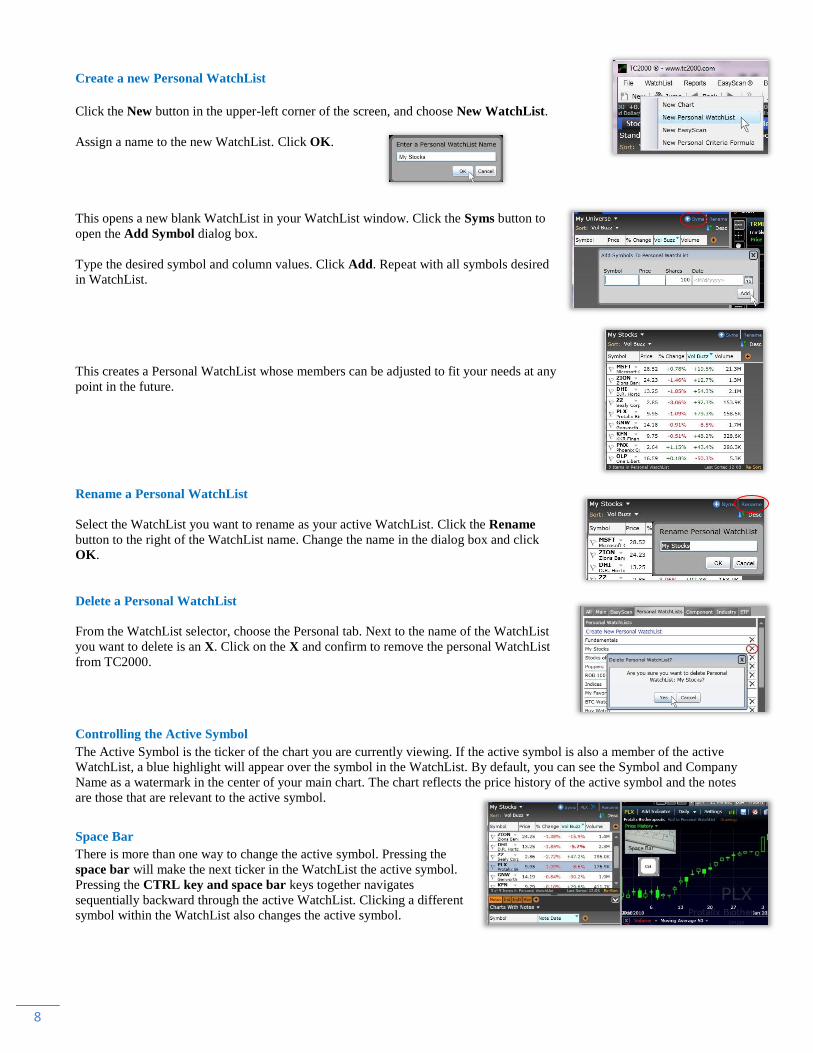
WATCHLIST
A WatchList is simply a logical group of stocks. Any reason you can think of to group stocks together is a good reason to
have a WatchList. There are seven main WatchList classifications in TC2000. Click the WatchList selector drop down
menu to see them listed.
All – This is a list of all WatchLists in your TC2000.
Main - These are typically very large and include
WatchLists like All Stocks and All Indexes.
EasyScan - These are special WatchLists called
EasyScans. The stocks within these WatchLists
are grouped together because they all meet the
same criteria as defined in the EasyScan.
Personal - These are WatchLists that are
personal to you. You can add and/or remove
these and have complete control over what ticker
symbols are contained within them.
Component - Lists contain stocks found in
specific indices. You will find a WatchList called
the Dow Jones 30 Industrial Component stocks
here that contain all 30 Dow Industrial stocks.
You'll also find WatchLists for the S&P 500, the
Russell 1000 and others.
Industry - Under this classification you will find
the Morningstar Industry Groups and Sub-
Industry groups. Each WatchList here contains
stocks found in the same Industry or Sub-
Industry.
ETF – Lists all Exchange Traded Fund component lists contained in TC2000.
The components of all these built-in WatchLists are automatically maintained for you. To navigate to a specific WatchList,
use the WatchList Selector and scroll to the desired list. Once the list has been located, select the list by left-clicking its
name. It is also possible to navigate to a specific WatchList by using the tab buttons located along the top of the WatchList
pull-down. Select any of these buttons to limit the list of available WatchLists to the type selected. You may also simply
press the forward slash key (―/‖) and start typing the name of the WatchList you wish to choose. Hit enter when the desired
WatchList reaches the top of your drop down list.
8
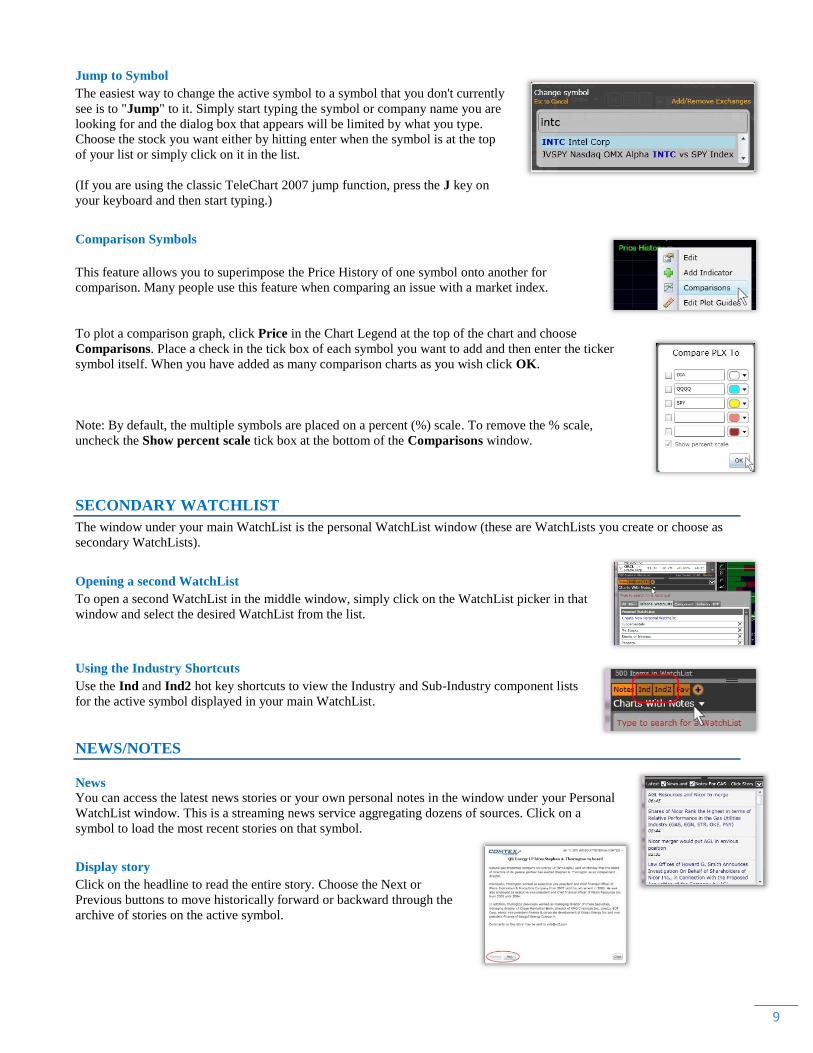
Create a new Personal WatchList
Click the New button in the upper-left corner of the screen, and choose New WatchList.
Assign a name to the new WatchList. Click OK.
This opens a new blank WatchList in your WatchList window. Click the Syms button to
open the Add Symbol dialog box.
Type the desired symbol and column values. Click Add. Repeat with all symbols desired
in WatchList.
This creates a Personal WatchList whose members can be adjusted to fit your needs at any
point in the future.
Rename a Personal WatchList
Select the WatchList you want to rename as your active WatchList. Click the Rename
button to the right of the WatchList name. Change the name in the dialog box and click
OK.
Delete a Personal WatchList
From the WatchList selector, choose the Personal tab. Next to the name of the WatchList
you want to delete is an X. Click on the X and confirm to remove the personal WatchList
from TC2000.
Controlling the Active Symbol
The Active Symbol is the ticker of the chart you are currently viewing. If the active symbol is also a member of the active
WatchList, a blue highlight will appear over the symbol in the WatchList. By default, you can see the Symbol and Company
Name as a watermark in the center of your main chart. The chart reflects the price history of the active symbol and the notes
are those that are relevant to the active symbol.
Space Bar
There is more than one way to change the active symbol. Pressing the
space bar will make the next ticker in the WatchList the active symbol.
Pressing the CTRL key and space bar keys together navigates
sequentially backward through the active WatchList. Clicking a different
symbol within the WatchList also changes the active symbol.
9
Jump to Symbol
The easiest way to change the active symbol to a symbol that you don't currently
see is to "Jump" to it. Simply start typing the symbol or company name you are
looking for and the dialog box that appears will be limited by what you type.
Choose the stock you want either by hitting enter when the symbol is at the top
of your list or simply click on it in the list.
(If you are using the classic TeleChart 2007 jump function, press the J key on
your keyboard and then start typing.)
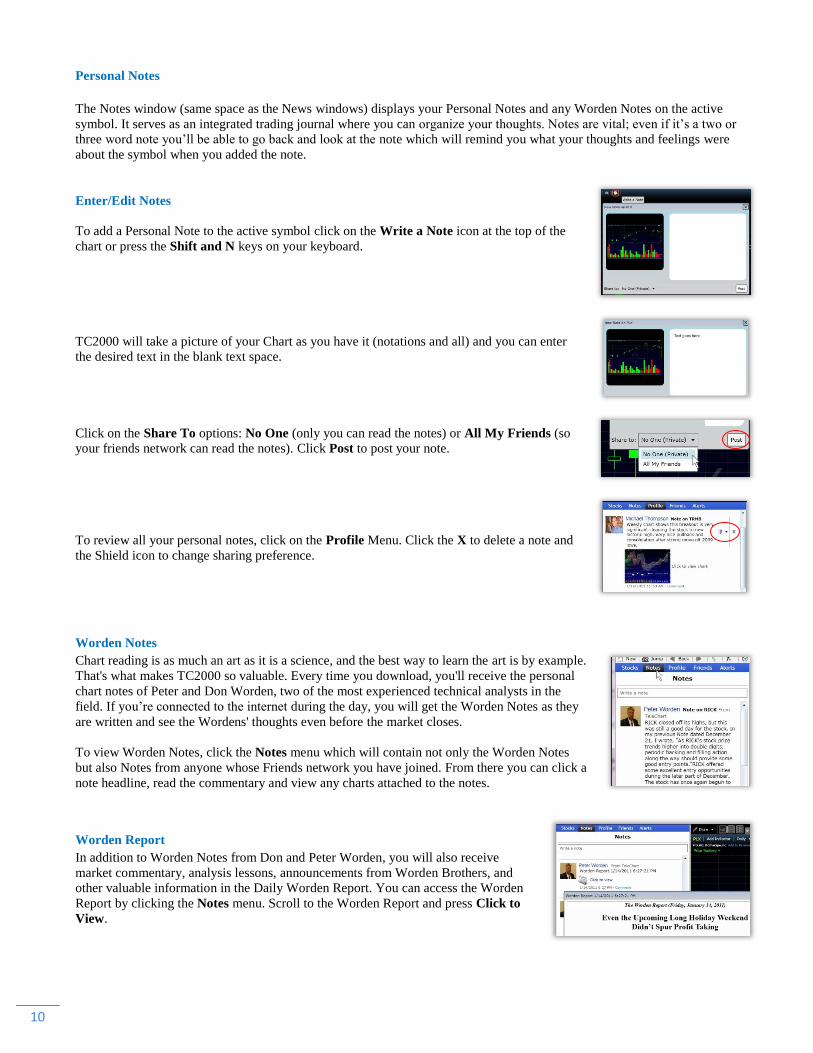
Comparison Symbols
This feature allows you to superimpose the Price History of one symbol onto another for
comparison. Many people use this feature when comparing an issue with a market index.
To plot a comparison graph, click Price in the Chart Legend at the top of the chart and choose
Comparisons. Place a check in the tick box of each symbol you want to add and then enter the ticker
symbol itself. When you have added as many comparison charts as you wish click OK.
Note: By default, the multiple symbols are placed on a percent (%) scale. To remove the % scale,
uncheck the Show percent scale tick box at the bottom of the Comparisons window.
SECONDARY WATCHLIST
The window under your main WatchList is the personal WatchList window (these are WatchLists you create or choose as
secondary WatchLists).
Opening a second WatchList
To open a second WatchList in the middle window, simply click on the WatchList picker in that
window and select the desired WatchList from the list.
Using the Industry Shortcuts
Use the Ind and Ind2 hot key shortcuts to view the Industry and Sub-Industry component lists
for the active symbol displayed in your main WatchList.
NEWS/NOTES
News You can access the latest news stories or your own personal notes in the window under your Personal
WatchList window. This is a streaming news service aggregating dozens of sources. Click on a
symbol to load the most recent stories on that symbol.
Display story
Click on the headline to read the entire story. Choose the Next or
Previous buttons to move historically forward or backward through the
archive of stories on the active symbol.
10
Personal Notes
The Notes window (same space as the News windows) displays your Personal Notes and any Worden Notes on the active
symbol. It serves as an integrated trading journal where you can organize your thoughts. Notes are vital; even if it‘s a two or
three word note you‘ll be able to go back and look at the note which will remind you what your thoughts and feelings were
about the symbol when you added the note.
Enter/Edit Notes
To add a Personal Note to the active symbol click on the Write a Note icon at the top of the
chart or press the Shift and N keys on your keyboard.
TC2000 will take a picture of your Chart as you have it (notations and all) and you can enter
the desired text in the blank text space.
Click on the Share To options: No One (only you can read the notes) or All My Friends (so
your friends network can read the notes). Click Post to post your note.
To review all your personal notes, click on the Profile Menu. Click the X to delete a note and
the Shield icon to change sharing preference.
Worden Notes
Chart reading is as much an art as it is a science, and the best way to learn the art is by example.
That's what makes TC2000 so valuable. Every time you download, you'll receive the personal
chart notes of Peter and Don Worden, two of the most experienced technical analysts in the
field. If you‘re connected to the internet during the day, you will get the Worden Notes as they
are written and see the Wordens' thoughts even before the market closes.
To view Worden Notes, click the Notes menu which will contain not only the Worden Notes
but also Notes from anyone whose Friends network you have joined. From there you can click a
note headline, read the commentary and view any charts attached to the notes.
Worden Report
In addition to Worden Notes from Don and Peter Worden, you will also receive
market commentary, analysis lessons, announcements from Worden Brothers, and
other valuable information in the Daily Worden Report. You can access the Worden
Report by clicking the Notes menu. Scroll to the Worden Report and press Click to
View.
11
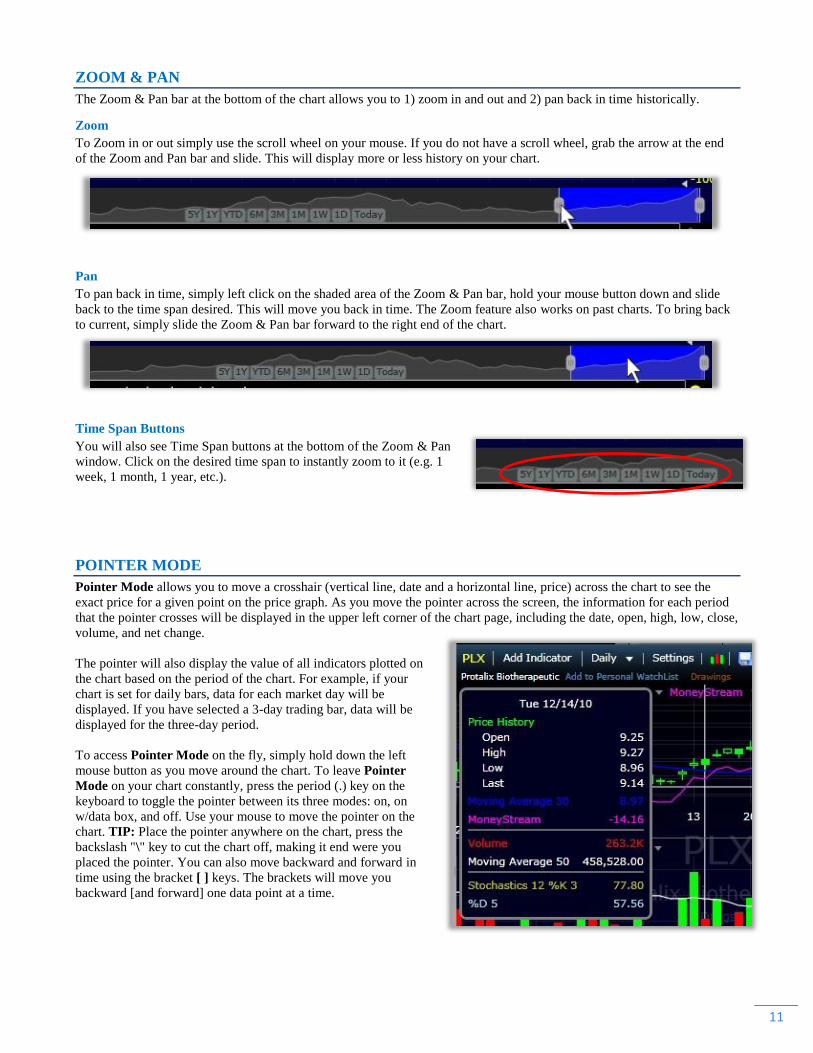
ZOOM & PAN
The Zoom & Pan bar at the bottom of the chart allows you to 1) zoom in and out and 2) pan back in time historically.
Zoom
To Zoom in or out simply use the scroll wheel on your mouse. If you do not have a scroll wheel, grab the arrow at the end
of the Zoom and Pan bar and slide. This will display more or less history on your chart.
Pan
To pan back in time, simply left click on the shaded area of the Zoom & Pan bar, hold your mouse button down and slide
back to the time span desired. This will move you back in time. The Zoom feature also works on past charts. To bring back
to current, simply slide the Zoom & Pan bar forward to the right end of the chart.
Time Span Buttons
You will also see Time Span buttons at the bottom of the Zoom & Pan
window. Click on the desired time span to instantly zoom to it (e.g. 1
week, 1 month, 1 year, etc.).
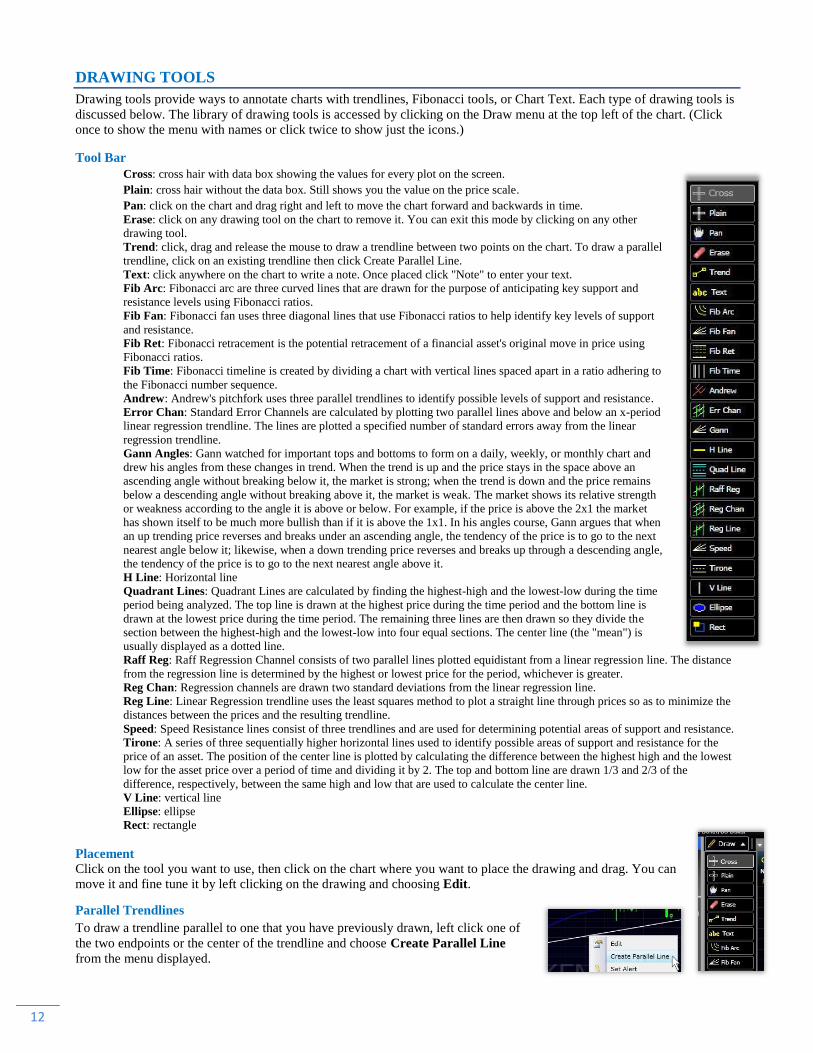
POINTER MODE
Pointer Mode allows you to move a crosshair (vertical line, date and a horizontal line, price) across the chart to see the
exact price for a given point on the price graph. As you move the pointer across the screen, the information for each period
that the pointer crosses will be displayed in the upper left corner of the chart page, including the date, open, high, low, close,
volume, and net change.
The pointer will also display the value of all indicators plotted on
the chart based on the period of the chart. For example, if your
chart is set for daily bars, data for each market day will be
displayed. If you have selected a 3-day trading bar, data will be
displayed for the three-day period.
To access Pointer Mode on the fly, simply hold down the left
mouse button as you move around the chart. To leave Pointer
Mode on your chart constantly, press the period (.) key on the
keyboard to toggle the pointer between its three modes: on, on
w/data box, and off. Use your mouse to move the pointer on the
chart. TIP: Place the pointer anywhere on the chart, press the
backslash "\" key to cut the chart off, making it end were you
placed the pointer. You can also move backward and forward in
time using the bracket [ ] keys. The brackets will move you
backward [and forward] one data point at a time.
12
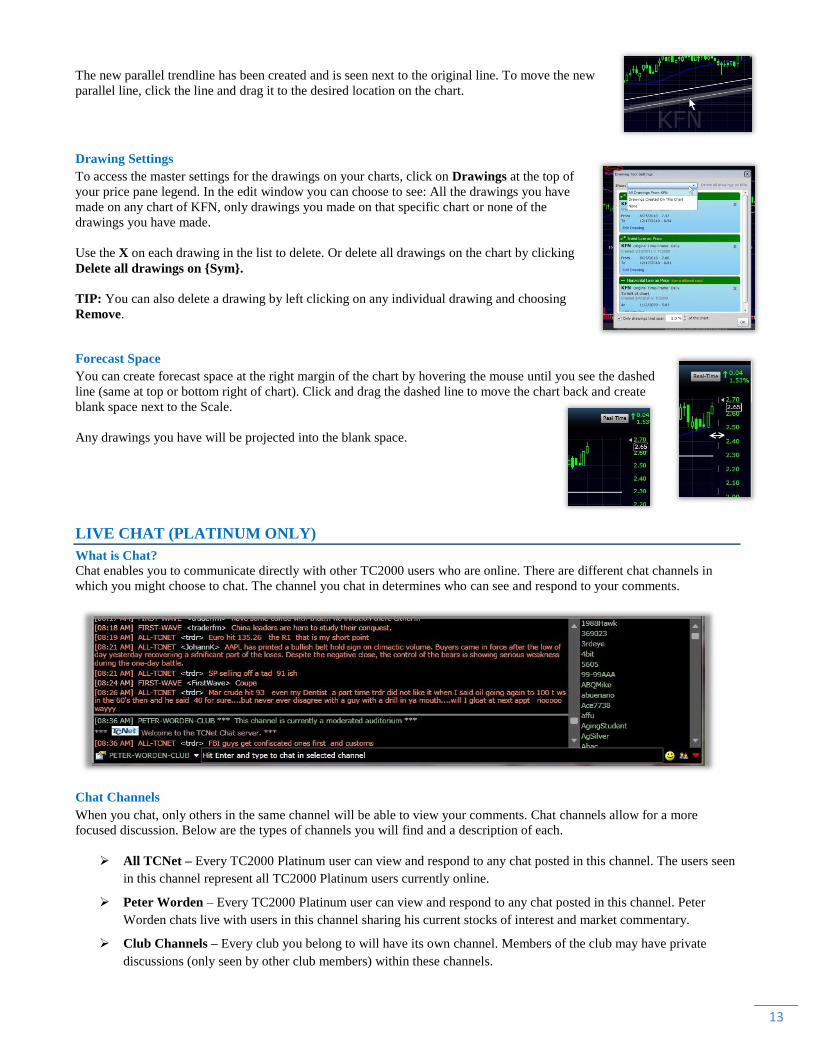
DRAWING TOOLS
Drawing tools provide ways to annotate charts with trendlines, Fibonacci tools, or Chart Text. Each type of drawing tools is
discussed below. The library of drawing tools is accessed by clicking on the Draw menu at the top left of the chart. (Click
once to show the menu with names or click twice to show just the icons.)
Tool Bar
Cross: cross hair with data box showing the values for every plot on the screen.
Plain: cross hair without the data box. Still shows you the value on the price scale.
Pan: click on the chart and drag right and left to move the chart forward and backwards in time.
Erase: click on any drawing tool on the chart to remove it. You can exit this mode by clicking on any other
drawing tool.
Trend: click, drag and release the mouse to draw a trendline between two points on the chart. To draw a parallel
trendline, click on an existing trendline then click Create Parallel Line.
Text: click anywhere on the chart to write a note. Once placed click "Note" to enter your text.
Fib Arc: Fibonacci arc are three curved lines that are drawn for the purpose of anticipating key support and
resistance levels using Fibonacci ratios.
Fib Fan: Fibonacci fan uses three diagonal lines that use Fibonacci ratios to help identify key levels of support
and resistance.
Fib Ret: Fibonacci retracement is the potential retracement of a financial asset's original move in price using
Fibonacci ratios.
Fib Time: Fibonacci timeline is created by dividing a chart with vertical lines spaced apart in a ratio adhering to
the Fibonacci number sequence.
Andrew: Andrew's pitchfork uses three parallel trendlines to identify possible levels of support and resistance.
Error Chan: Standard Error Channels are calculated by plotting two parallel lines above and below an x-period
linear regression trendline. The lines are plotted a specified number of standard errors away from the linear
regression trendline.
Gann Angles: Gann watched for important tops and bottoms to form on a daily, weekly, or monthly chart and
drew his angles from these changes in trend. When the trend is up and the price stays in the space above an
ascending angle without breaking below it, the market is strong; when the trend is down and the price remains
below a descending angle without breaking above it, the market is weak. The market shows its relative strength
or weakness according to the angle it is above or below. For example, if the price is above the 2x1 the market
has shown itself to be much more bullish than if it is above the 1x1. In his angles course, Gann argues that when
an up trending price reverses and breaks under an ascending angle, the tendency of the price is to go to the next
nearest angle below it; likewise, when a down trending price reverses and breaks up through a descending angle,
the tendency of the price is to go to the next nearest angle above it.
H Line: Horizontal line
Quadrant Lines: Quadrant Lines are calculated by finding the highest-high and the lowest-low during the time
period being analyzed. The top line is drawn at the highest price during the time period and the bottom line is
drawn at the lowest price during the time period. The remaining three lines are then drawn so they divide the
section between the highest-high and the lowest-low into four equal sections. The center line (the "mean") is
usually displayed as a dotted line.
Raff Reg: Raff Regression Channel consists of two parallel lines plotted equidistant from a linear regression line. The distance
from the regression line is determined by the highest or lowest price for the period, whichever is greater.
Reg Chan: Regression channels are drawn two standard deviations from the linear regression line.
Reg Line: Linear Regression trendline uses the least squares method to plot a straight line through prices so as to minimize the
distances between the prices and the resulting trendline.
Speed: Speed Resistance lines consist of three trendlines and are used for determining potential areas of support and resistance.
Tirone: A series of three sequentially higher horizontal lines used to identify possible areas of support and resistance for the
price of an asset. The position of the center line is plotted by calculating the difference between the highest high and the lowest
low for the asset price over a period of time and dividing it by 2. The top and bottom line are drawn 1/3 and 2/3 of the
difference, respectively, between the same high and low that are used to calculate the center line.
V Line: vertical line
Ellipse: ellipse
Rect: rectangle
Placement
Click on the tool you want to use, then click on the chart where you want to place the drawing and drag. You can
move it and fine tune it by left clicking on the drawing and choosing Edit.
Parallel Trendlines
To draw a trendline parallel to one that you have previously drawn, left click one of
the two endpoints or the center of the trendline and choose Create Parallel Line
from the menu displayed.
13
The new parallel trendline has been created and is seen next to the original line. To move the new
parallel line, click the line and drag it to the desired location on the chart.
Drawing Settings
To access the master settings for the drawings on your charts, click on Drawings at the top of
your price pane legend. In the edit window you can choose to see: All the drawings you have
made on any chart of KFN, only drawings you made on that specific chart or none of the
drawings you have made.
Use the X on each drawing in the list to delete. Or delete all drawings on the chart by clicking
Delete all drawings on {Sym}.
TIP: You can also delete a drawing by left clicking on any individual drawing and choosing
Remove.
Forecast Space
You can create forecast space at the right margin of the chart by hovering the mouse until you see the dashed
line (same at top or bottom right of chart). Click and drag the dashed line to move the chart back and create
blank space next to the Scale.
Any drawings you have will be projected into the blank space.
LIVE CHAT (PLATINUM ONLY)
What is Chat?
Chat enables you to communicate directly with other TC2000 users who are online. There are different chat channels in
which you might choose to chat. The channel you chat in determines who can see and respond to your comments.
Chat Channels
When you chat, only others in the same channel will be able to view your comments. Chat channels allow for a more
focused discussion. Below are the types of channels you will find and a description of each.
All TCNet – Every TC2000 Platinum user can view and respond to any chat posted in this channel. The users seen
in this channel represent all TC2000 Platinum users currently online.
Peter Worden – Every TC2000 Platinum user can view and respond to any chat posted in this channel. Peter
Worden chats live with users in this channel sharing his current stocks of interest and market commentary.
Club Channels – Every club you belong to will have its own channel. Members of the club may have private
discussions (only seen by other club members) within these channels.
14
Chat Users
Clicking on any of the profile names listed within a chat window allows you to send a
private message, view that user‘s profile, or ignore their comments.
Chat Options
Click the chat settings icon in the lower-left corner of the chat window to access the Chat Options
dialog. There are three Chat Options tabs: Channels, General, and Ignore. Each tab allows you to
adjust different chat options as described below.
Channels –
Under this tab you can select which channels you would like to view chat for, change the color of
the chat for each channel, and adjust your chat notification options.
General –
Under this tab you can adjust the size of the chat, mute all chat sounds, adjust floating chat
properties, and change how TC2000 notifies you when you receive a private message.
Ignore –
Options under this tab allow you to choose not to view the comments of selected TC2000 users.
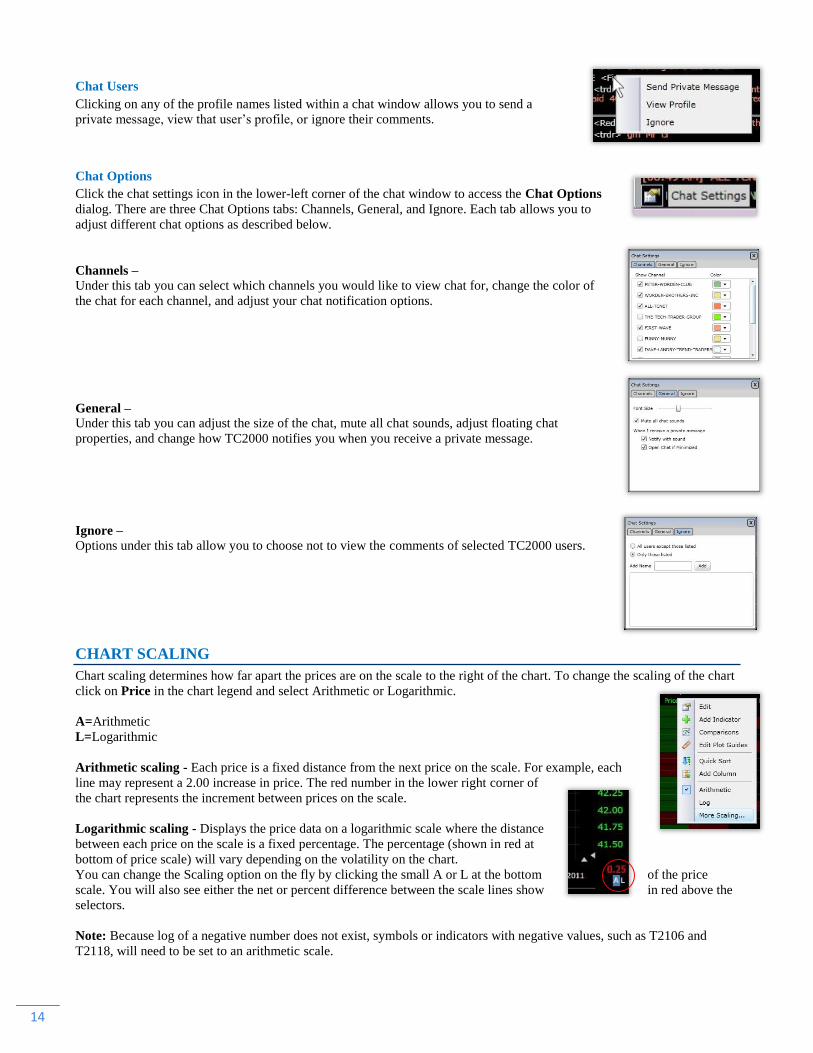
CHART SCALING
Chart scaling determines how far apart the prices are on the scale to the right of the chart. To change the scaling of the chart
click on Price in the chart legend and select Arithmetic or Logarithmic.
A=Arithmetic
L=Logarithmic
Arithmetic scaling - Each price is a fixed distance from the next price on the scale. For example, each
line may represent a 2.00 increase in price. The red number in the lower right corner of
the chart represents the increment between prices on the scale.
Logarithmic scaling - Displays the price data on a logarithmic scale where the distance
between each price on the scale is a fixed percentage. The percentage (shown in red at
bottom of price scale) will vary depending on the volatility on the chart.
You can change the Scaling option on the fly by clicking the small A or L at the bottom of the price
scale. You will also see either the net or percent difference between the scale lines show in red above the
selectors.
Note: Because log of a negative number does not exist, symbols or indicators with negative values, such as T2106 and
T2118, will need to be set to an arithmetic scale.
15
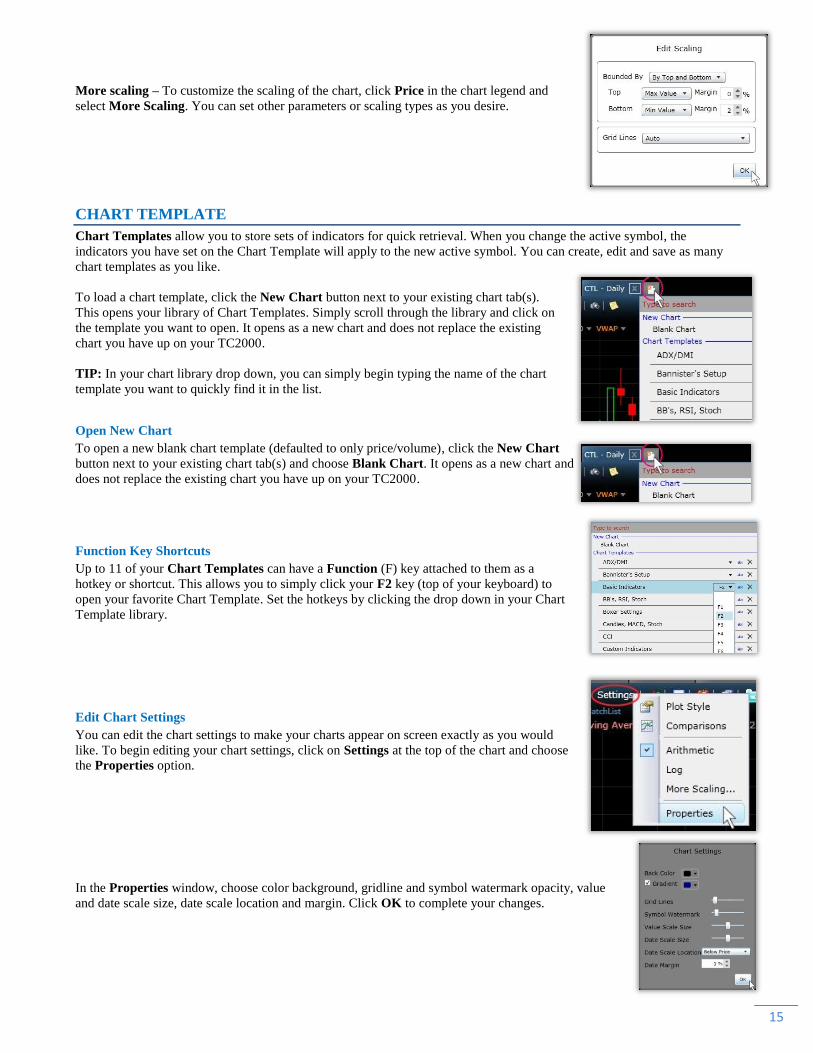
More scaling – To customize the scaling of the chart, click Price in the chart legend and
select More Scaling. You can set other parameters or scaling types as you desire.
CHART TEMPLATE
Chart Templates allow you to store sets of indicators for quick retrieval. When you change the active symbol, the
indicators you have set on the Chart Template will apply to the new active symbol. You can create, edit and save as many
chart templates as you like.
To load a chart template, click the New Chart button next to your existing chart tab(s).
This opens your library of Chart Templates. Simply scroll through the library and click on
the template you want to open. It opens as a new chart and does not replace the existing
chart you have up on your TC2000.
TIP: In your chart library drop down, you can simply begin typing the name of the chart
template you want to quickly find it in the list.
Open New Chart
To open a new blank chart template (defaulted to only price/volume), click the New Chart
button next to your existing chart tab(s) and choose Blank Chart. It opens as a new chart and
does not replace the existing chart you have up on your TC2000.
Function Key Shortcuts
Up to 11 of your Chart Templates can have a Function (F) key attached to them as a
hotkey or shortcut. This allows you to simply click your F2 key (top of your keyboard) to
open your favorite Chart Template. Set the hotkeys by clicking the drop down in your Chart
Template library.
Edit Chart Settings
You can edit the chart settings to make your charts appear on screen exactly as you would
like. To begin editing your chart settings, click on Settings at the top of the chart and choose
the Properties option.
In the Properties window, choose color background, gridline and symbol watermark opacity, value
and date scale size, date scale location and margin. Click OK to complete your changes.
16
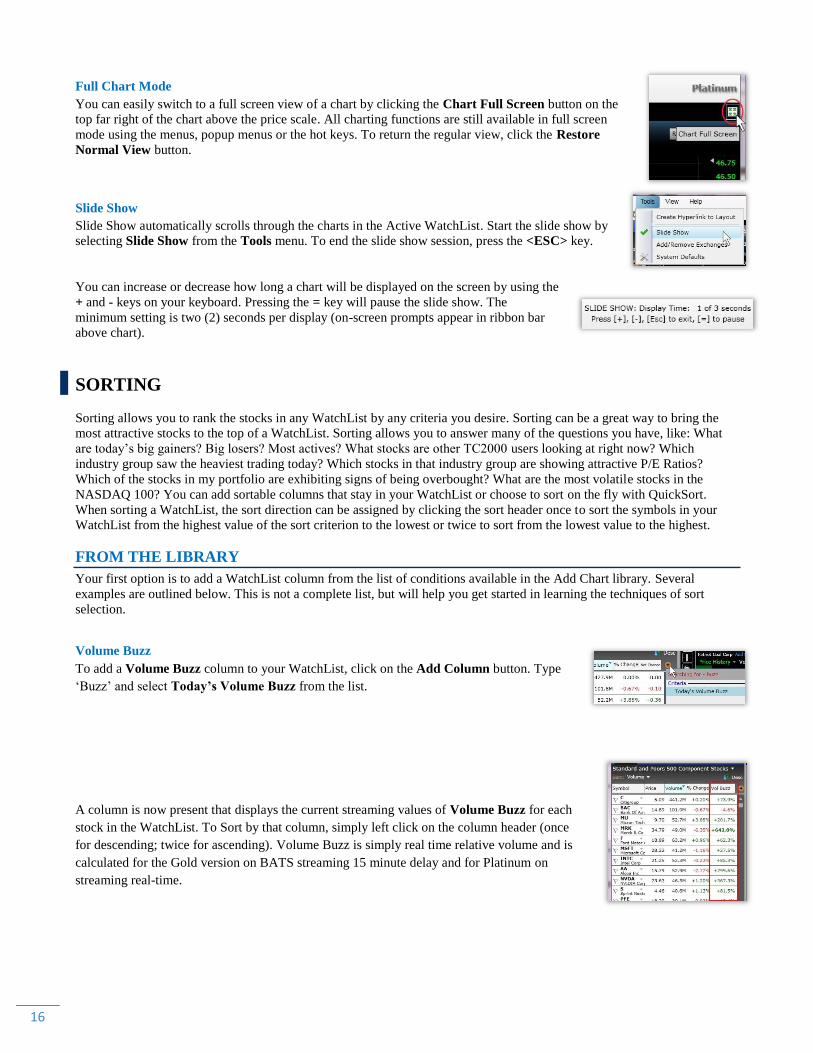
Full Chart Mode
You can easily switch to a full screen view of a chart by clicking the Chart Full Screen button on the
top far right of the chart above the price scale. All charting functions are still available in full screen
mode using the menus, popup menus or the hot keys. To return the regular view, click the Restore
Normal View button.
Slide Show
Slide Show automatically scrolls through the charts in the Active WatchList. Start the slide show by
selecting Slide Show from the Tools menu. To end the slide show session, press the <ESC> key.
You can increase or decrease how long a chart will be displayed on the screen by using the
+ and - keys on your keyboard. Pressing the = key will pause the slide show. The
minimum setting is two (2) seconds per display (on-screen prompts appear in ribbon bar
above chart).
SORTING
Sorting allows you to rank the stocks in any WatchList by any criteria you desire. Sorting can be a great way to bring the
most attractive stocks to the top of a WatchList. Sorting allows you to answer many of the questions you have, like: What
are today‘s big gainers? Big losers? Most actives? What stocks are other TC2000 users looking at right now? Which
industry group saw the heaviest trading today? Which stocks in that industry group are showing attractive P/E Ratios?
Which of the stocks in my portfolio are exhibiting signs of being overbought? What are the most volatile stocks in the
NASDAQ 100? You can add sortable columns that stay in your WatchList or choose to sort on the fly with QuickSort.
When sorting a WatchList, the sort direction can be assigned by clicking the sort header once to sort the symbols in your
WatchList from the highest value of the sort criterion to the lowest or twice to sort from the lowest value to the highest.
FROM THE LIBRARY
Your first option is to add a WatchList column from the list of conditions available in the Add Chart library. Several
examples are outlined below. This is not a complete list, but will help you get started in learning the techniques of sort
selection.
Volume Buzz
To add a Volume Buzz column to your WatchList, click on the Add Column button. Type
‗Buzz‘ and select Today’s Volume Buzz from the list.
A column is now present that displays the current streaming values of Volume Buzz for each
stock in the WatchList. To Sort by that column, simply left click on the column header (once
for descending; twice for ascending). Volume Buzz is simply real time relative volume and is
calculated for the Gold version on BATS streaming 15 minute delay and for Platinum on
streaming real-time.
17
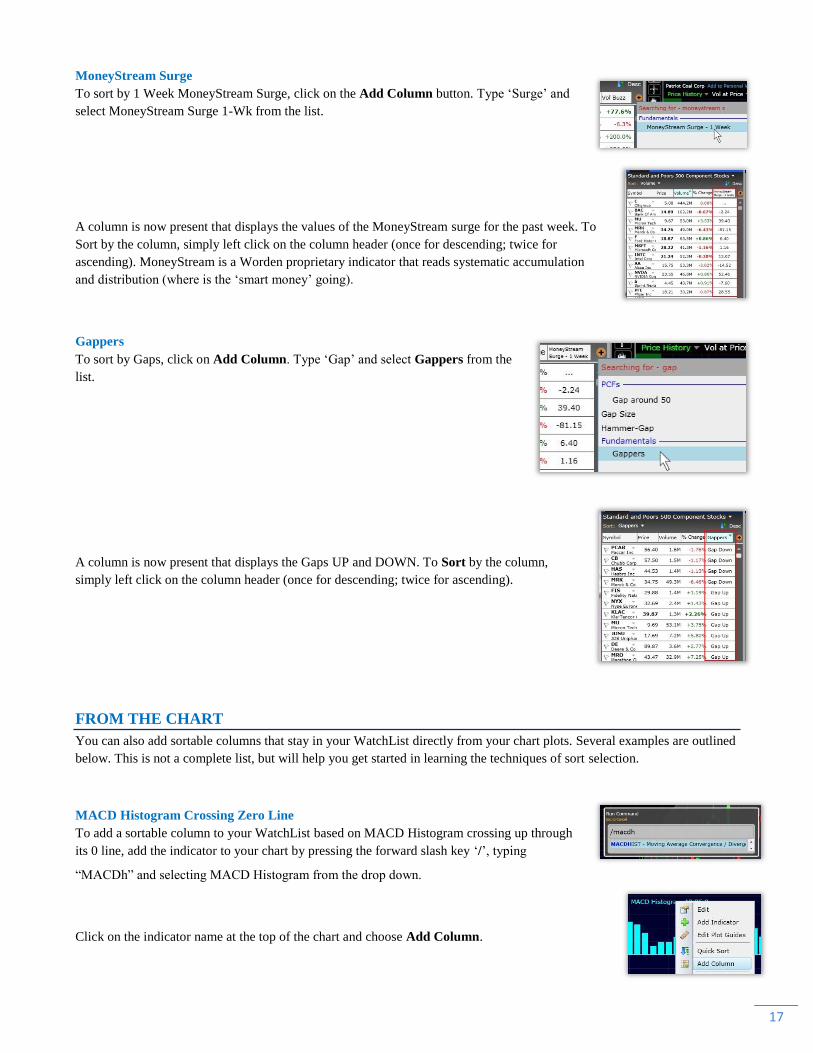
MoneyStream Surge
To sort by 1 Week MoneyStream Surge, click on the Add Column button. Type ‗Surge‘ and
select MoneyStream Surge 1-Wk from the list.
A column is now present that displays the values of the MoneyStream surge for the past week. To
Sort by the column, simply left click on the column header (once for descending; twice for
ascending). MoneyStream is a Worden proprietary indicator that reads systematic accumulation
and distribution (where is the ‗smart money‘ going).
Gappers
To sort by Gaps, click on Add Column. Type ‗Gap‘ and select Gappers from the
list.
A column is now present that displays the Gaps UP and DOWN. To Sort by the column,
simply left click on the column header (once for descending; twice for ascending).
FROM THE CHART
You can also add sortable columns that stay in your WatchList directly from your chart plots. Several examples are outlined
below. This is not a complete list, but will help you get started in learning the techniques of sort selection.
MACD Histogram Crossing Zero Line
To add a sortable column to your WatchList based on MACD Histogram crossing up through
its 0 line, add the indicator to your chart by pressing the forward slash key ‗/‘, typing
―MACDh‖ and selecting MACD Histogram from the drop down.
Click on the indicator name at the top of the chart and choose Add Column.
18
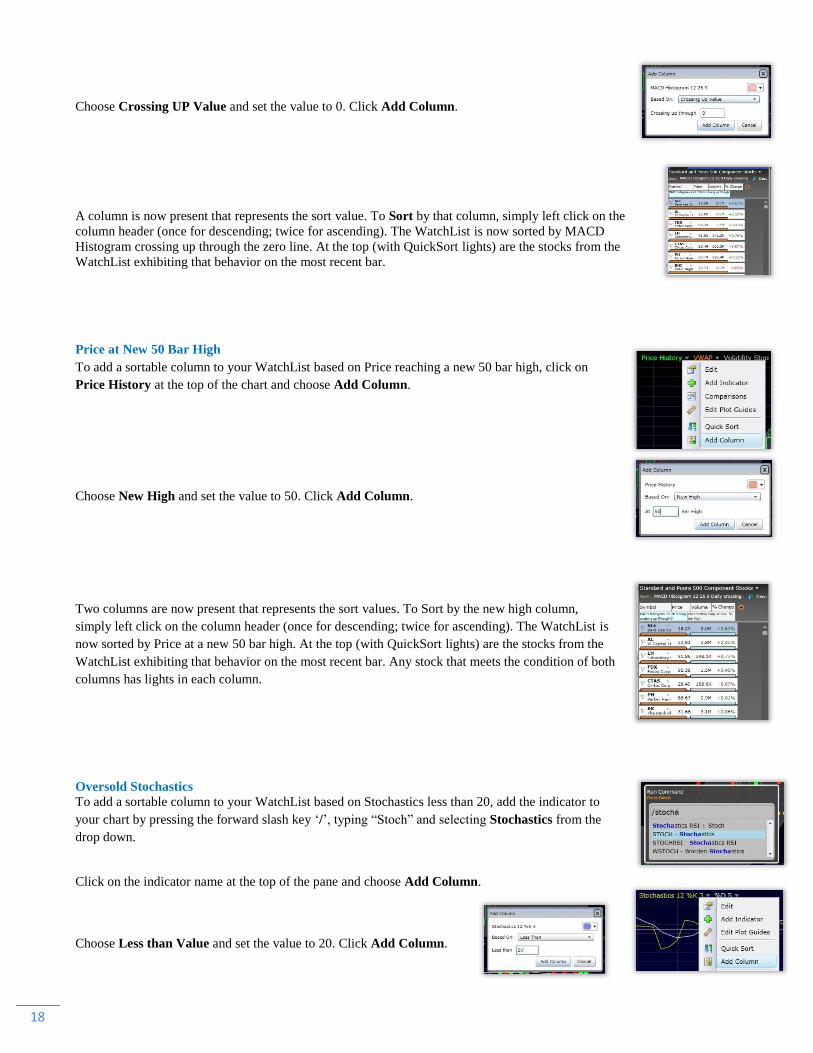
Choose Crossing UP Value and set the value to 0. Click Add Column.
A column is now present that represents the sort value. To Sort by that column, simply left click on the
column header (once for descending; twice for ascending). The WatchList is now sorted by MACD
Histogram crossing up through the zero line. At the top (with QuickSort lights) are the stocks from the
WatchList exhibiting that behavior on the most recent bar.
Price at New 50 Bar High
To add a sortable column to your WatchList based on Price reaching a new 50 bar high, click on
Price History at the top of the chart and choose Add Column.
Choose New High and set the value to 50. Click Add Column.
Two columns are now present that represents the sort values. To Sort by the new high column,
simply left click on the column header (once for descending; twice for ascending). The WatchList is
now sorted by Price at a new 50 bar high. At the top (with QuickSort lights) are the stocks from the
WatchList exhibiting that behavior on the most recent bar. Any stock that meets the condition of both
columns has lights in each column.
Oversold Stochastics
To add a sortable column to your WatchList based on Stochastics less than 20, add the indicator to
your chart by pressing the forward slash key ‗/‘, typing ―Stoch‖ and selecting Stochastics from the
drop down.
Click on the indicator name at the top of the pane and choose Add Column.
Choose Less than Value and set the value to 20. Click Add Column.
19
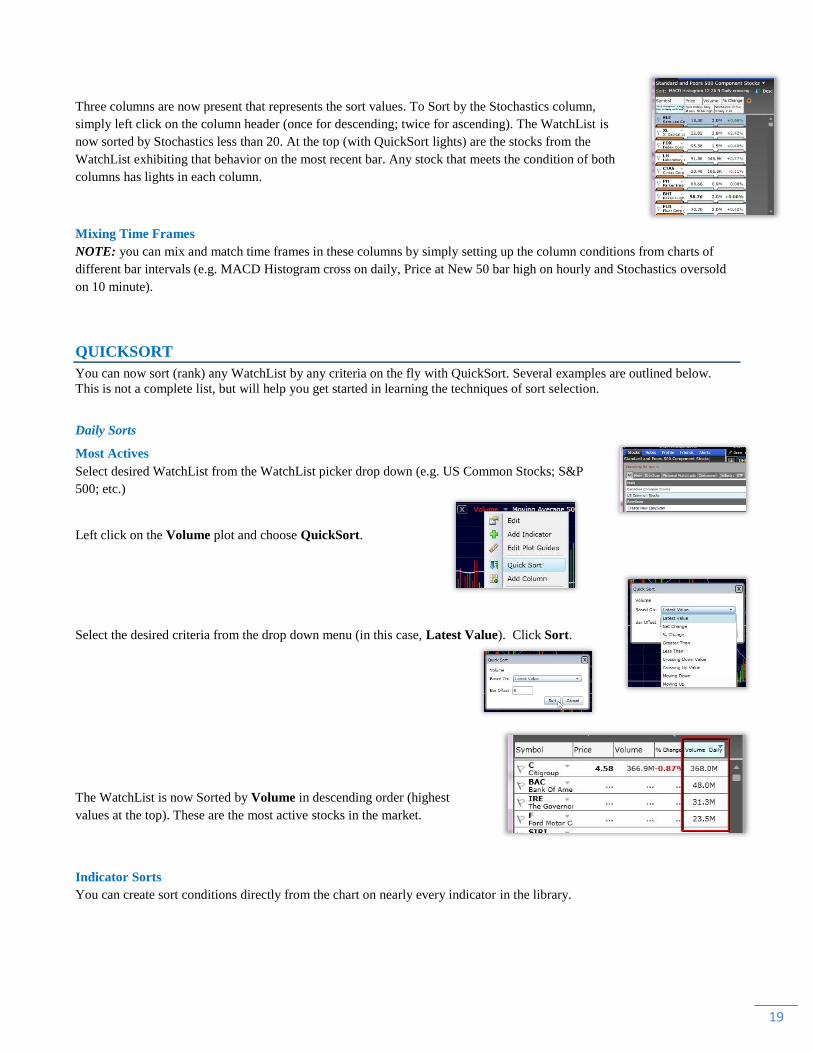
Three columns are now present that represents the sort values. To Sort by the Stochastics column,
simply left click on the column header (once for descending; twice for ascending). The WatchList is
now sorted by Stochastics less than 20. At the top (with QuickSort lights) are the stocks from the
WatchList exhibiting that behavior on the most recent bar. Any stock that meets the condition of both
columns has lights in each column.
Mixing Time Frames
NOTE: you can mix and match time frames in these columns by simply setting up the column conditions from charts of
different bar intervals (e.g. MACD Histogram cross on daily, Price at New 50 bar high on hourly and Stochastics oversold
on 10 minute).
QUICKSORT
You can now sort (rank) any WatchList by any criteria on the fly with QuickSort. Several examples are outlined below.
This is not a complete list, but will help you get started in learning the techniques of sort selection.
Daily Sorts
Most Actives
Select desired WatchList from the WatchList picker drop down (e.g. US Common Stocks; S&P
500; etc.)
Left click on the Volume plot and choose QuickSort.
Select the desired criteria from the drop down menu (in this case, Latest Value). Click Sort.
The WatchList is now Sorted by Volume in descending order (highest
values at the top). These are the most active stocks in the market.
Indicator Sorts
You can create sort conditions directly from the chart on nearly every indicator in the library.
20
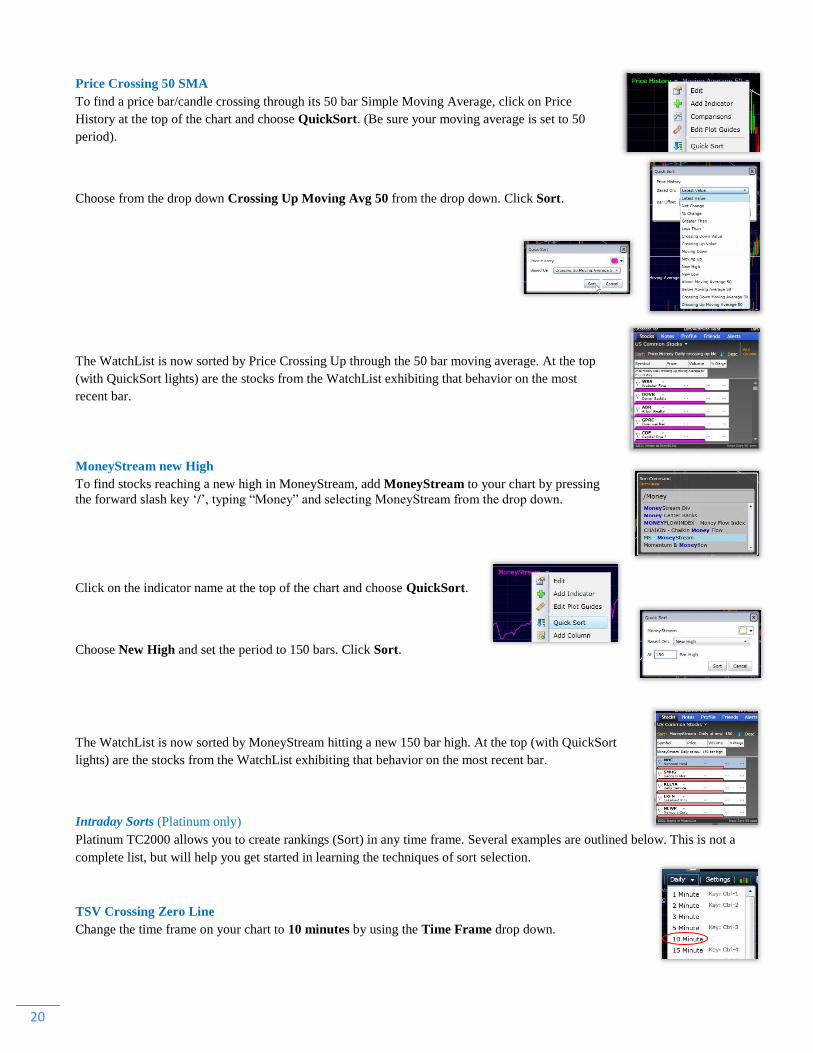
Price Crossing 50 SMA
To find a price bar/candle crossing through its 50 bar Simple Moving Average, click on Price
History at the top of the chart and choose QuickSort. (Be sure your moving average is set to 50
period).
Choose from the drop down Crossing Up Moving Avg 50 from the drop down. Click Sort.
The WatchList is now sorted by Price Crossing Up through the 50 bar moving average. At the top
(with QuickSort lights) are the stocks from the WatchList exhibiting that behavior on the most
recent bar.
MoneyStream new High
To find stocks reaching a new high in MoneyStream, add MoneyStream to your chart by pressing
the forward slash key ‗/‘, typing ―Money‖ and selecting MoneyStream from the drop down.
Click on the indicator name at the top of the chart and choose QuickSort.
Choose New High and set the period to 150 bars. Click Sort.
The WatchList is now sorted by MoneyStream hitting a new 150 bar high. At the top (with QuickSort
lights) are the stocks from the WatchList exhibiting that behavior on the most recent bar.
Intraday Sorts (Platinum only)
Platinum TC2000 allows you to create rankings (Sort) in any time frame. Several examples are outlined below. This is not a
complete list, but will help you get started in learning the techniques of sort selection.
TSV Crossing Zero Line
Change the time frame on your chart to 10 minutes by using the Time Frame drop down.
21
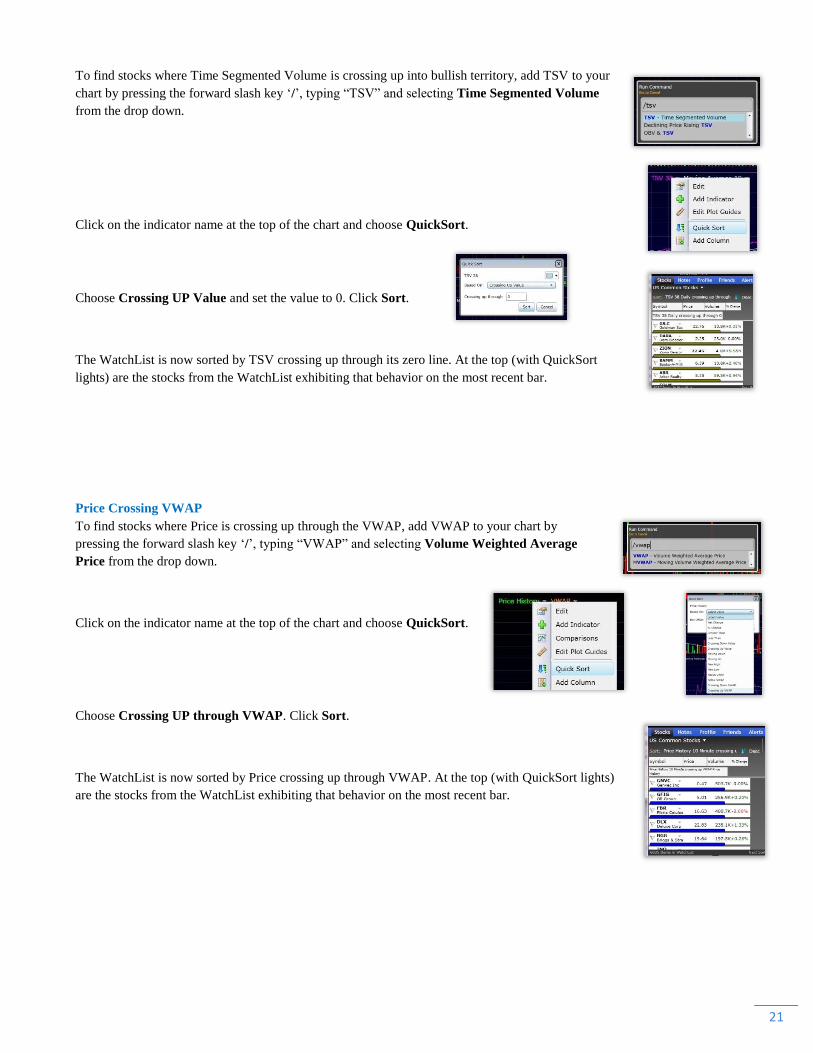
To find stocks where Time Segmented Volume is crossing up into bullish territory, add TSV to your
chart by pressing the forward slash key ‗/‘, typing ―TSV‖ and selecting Time Segmented Volume
from the drop down.
Click on the indicator name at the top of the chart and choose QuickSort.
Choose Crossing UP Value and set the value to 0. Click Sort.
The WatchList is now sorted by TSV crossing up through its zero line. At the top (with QuickSort
lights) are the stocks from the WatchList exhibiting that behavior on the most recent bar.
Price Crossing VWAP
To find stocks where Price is crossing up through the VWAP, add VWAP to your chart by
pressing the forward slash key ‗/‘, typing ―VWAP‖ and selecting Volume Weighted Average
Price from the drop down.
Click on the indicator name at the top of the chart and choose QuickSort.
Choose Crossing UP through VWAP. Click Sort.
The WatchList is now sorted by Price crossing up through VWAP. At the top (with QuickSort lights)
are the stocks from the WatchList exhibiting that behavior on the most recent bar.
22
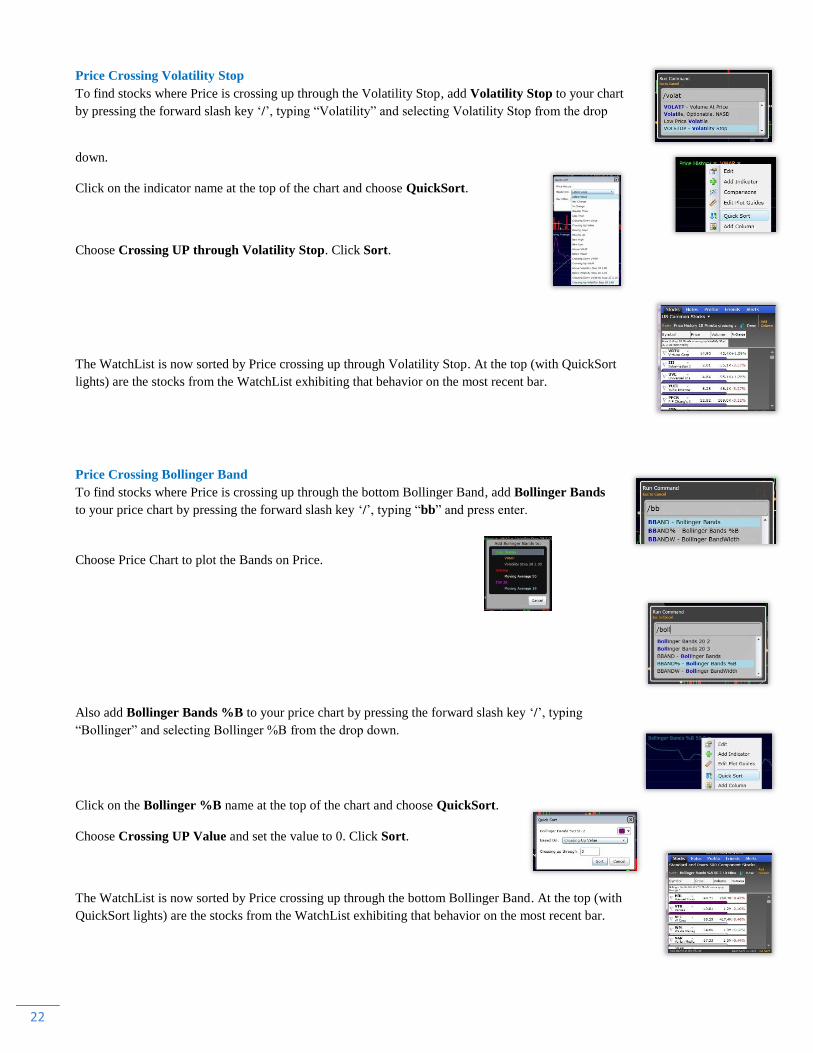
Price Crossing Volatility Stop
To find stocks where Price is crossing up through the Volatility Stop, add Volatility Stop to your chart
by pressing the forward slash key ‗/‘, typing ―Volatility‖ and selecting Volatility Stop from the drop
down.
Click on the indicator name at the top of the chart and choose QuickSort.
Choose Crossing UP through Volatility Stop. Click Sort.
The WatchList is now sorted by Price crossing up through Volatility Stop. At the top (with QuickSort
lights) are the stocks from the WatchList exhibiting that behavior on the most recent bar.
Price Crossing Bollinger Band
To find stocks where Price is crossing up through the bottom Bollinger Band, add Bollinger Bands
to your price chart by pressing the forward slash key ‗/‘, typing ―bb‖ and press enter.
Choose Price Chart to plot the Bands on Price.
Also add Bollinger Bands %B to your price chart by pressing the forward slash key ‗/‘, typing
―Bollinger‖ and selecting Bollinger %B from the drop down.
Click on the Bollinger %B name at the top of the chart and choose QuickSort.
Choose Crossing UP Value and set the value to 0. Click Sort.
The WatchList is now sorted by Price crossing up through the bottom Bollinger Band. At the top (with
QuickSort lights) are the stocks from the WatchList exhibiting that behavior on the most recent bar.
23
SORT MENU
You can also sort (rank) any WatchList by any criteria on the fly from the Library of preconfigured conditions.
Criteria Library
Several examples are outlined below. This is not a complete list, but will help you get started in learning the techniques of
sort selection.
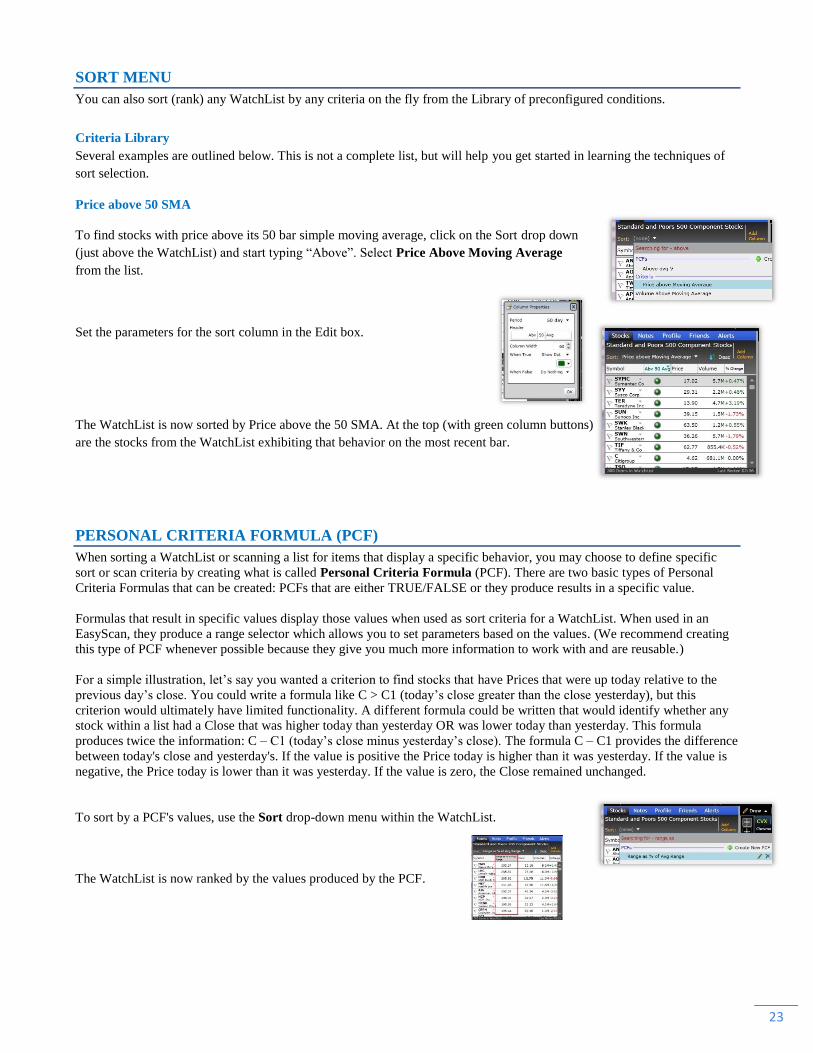
Price above 50 SMA
To find stocks with price above its 50 bar simple moving average, click on the Sort drop down
(just above the WatchList) and start typing ―Above‖. Select Price Above Moving Average
from the list.
Set the parameters for the sort column in the Edit box.
The WatchList is now sorted by Price above the 50 SMA. At the top (with green column buttons)
are the stocks from the WatchList exhibiting that behavior on the most recent bar.
PERSONAL CRITERIA FORMULA (PCF)
When sorting a WatchList or scanning a list for items that display a specific behavior, you may choose to define specific
sort or scan criteria by creating what is called Personal Criteria Formula (PCF). There are two basic types of Personal
Criteria Formulas that can be created: PCFs that are either TRUE/FALSE or they produce results in a specific value.
Formulas that result in specific values display those values when used as sort criteria for a WatchList. When used in an
EasyScan, they produce a range selector which allows you to set parameters based on the values. (We recommend creating
this type of PCF whenever possible because they give you much more information to work with and are reusable.)
For a simple illustration, let‘s say you wanted a criterion to find stocks that have Prices that were up today relative to the
previous day‘s close. You could write a formula like C > C1 (today‘s close greater than the close yesterday), but this
criterion would ultimately have limited functionality. A different formula could be written that would identify whether any
stock within a list had a Close that was higher today than yesterday OR was lower today than yesterday. This formula
produces twice the information: C – C1 (today‘s close minus yesterday‘s close). The formula C – C1 provides the difference
between today's close and yesterday's. If the value is positive the Price today is higher than it was yesterday. If the value is
negative, the Price today is lower than it was yesterday. If the value is zero, the Close remained unchanged.
To sort by a PCF's values, use the Sort drop-down menu within the WatchList.
The WatchList is now ranked by the values produced by the PCF.
24
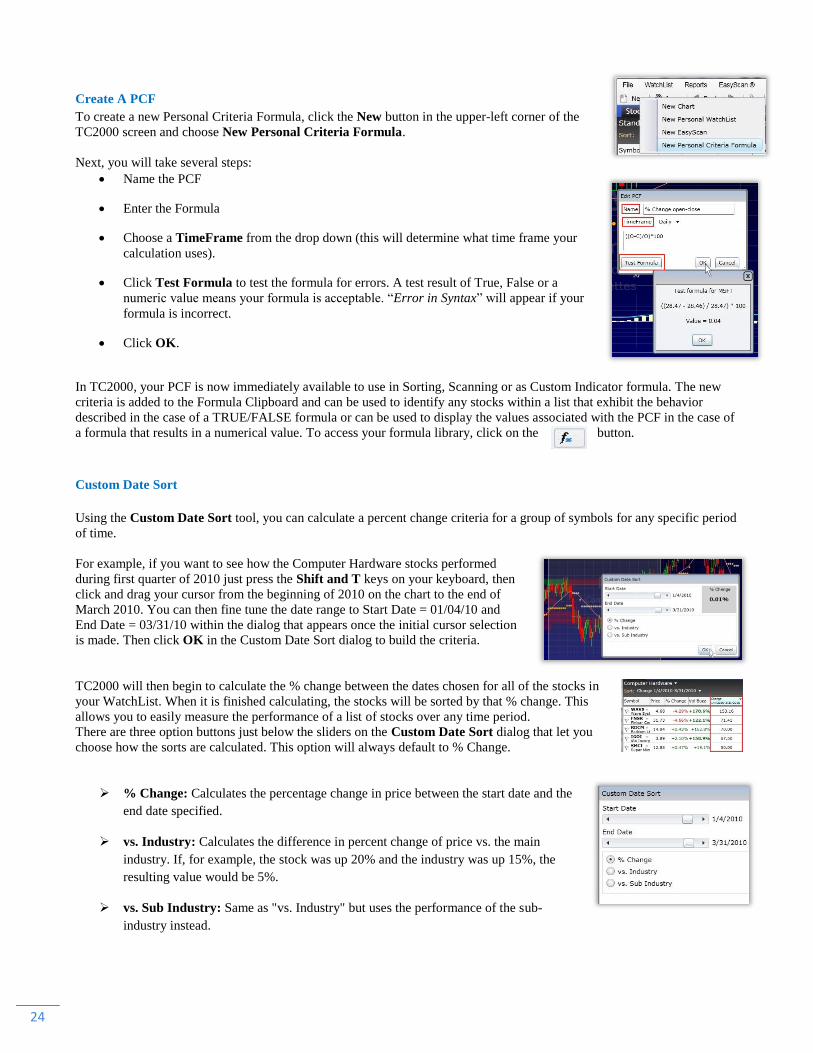
Create A PCF
To create a new Personal Criteria Formula, click the New button in the upper-left corner of the
TC2000 screen and choose New Personal Criteria Formula.
Next, you will take several steps:
Name the PCF
Enter the Formula
Choose a TimeFrame from the drop down (this will determine what time frame your
calculation uses).
Click Test Formula to test the formula for errors. A test result of True, False or a
numeric value means your formula is acceptable. ―Error in Syntax‖ will appear if your
formula is incorrect.
Click OK.
47
In TC2000, your PCF is now immediately available to use in Sorting, Scanning or as Custom Indicator formula. The new
criteria is added to the Formula Clipboard and can be used to identify any stocks within a list that exhibit the behavior
described in the case of a TRUE/FALSE formula or can be used to display the values associated with the PCF in the case of
a formula that results in a numerical value. To access your formula library, click on the button.
Custom Date Sort
Using the Custom Date Sort tool, you can calculate a percent change criteria for a group of symbols for any specific period
of time.
For example, if you want to see how the Computer Hardware stocks performed
during first quarter of 2010 just press the Shift and T keys on your keyboard, then
click and drag your cursor from the beginning of 2010 on the chart to the end of
March 2010. You can then fine tune the date range to Start Date = 01/04/10 and
End Date = 03/31/10 within the dialog that appears once the initial cursor selection
is made. Then click OK in the Custom Date Sort dialog to build the criteria.
TC2000 will then begin to calculate the % change between the dates chosen for all of the stocks in
your WatchList. When it is finished calculating, the stocks will be sorted by that % change. This
allows you to easily measure the performance of a list of stocks over any time period.
There are three option buttons just below the sliders on the Custom Date Sort dialog that let you
choose how the sorts are calculated. This option will always default to % Change.
% Change: Calculates the percentage change in price between the start date and the
end date specified.
vs. Industry: Calculates the difference in percent change of price vs. the main
industry. If, for example, the stock was up 20% and the industry was up 15%, the
resulting value would be 5%.
vs. Sub Industry: Same as "vs. Industry" but uses the performance of the sub-
industry instead.
25
EasyScan
Sorting orders the items in a WatchList based on a single criteria value specified by you. Scanning is a process by which
specific items within a list are identified based on a behavior or special requirement defined by you with multiple
simultaneous criteria.
EASYSCAN™
TC2000 is able to scan your entire databank for the symbols which meet the criteria you specify in about a second.
EasyScan is the process by which this occurs. EasyScans can be molded on the fly to produce the exact list of symbols you
are looking for. Simply select values and rankings from a range selector and you'll see how many stocks fit into your scan as
you build it.
The results of the EasyScan are a type of WatchList, so viewing the results of a scan is as simple as changing your active
WatchList to the name of the EasyScan you wish to view. You will notice the EasyScans grouped together when you click
on the EasyScan tab in the WatchList dropdown. TC2000 allows you to simultaneously scan for long-term technical
conditions, fundamental conditions and intra-day conditions all within the same EasyScan. Several examples are outlined
below. This is not a complete list, but will help you get started in learning the techniques of sort selection.
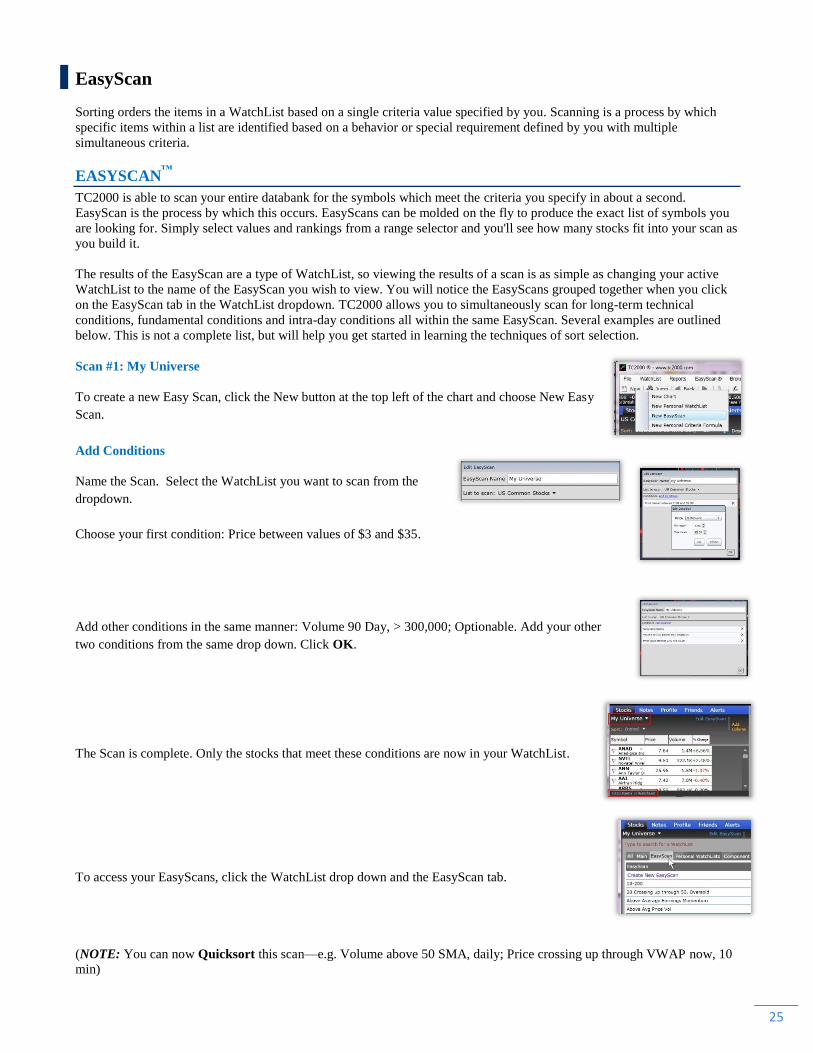
Scan #1: My Universe
To create a new Easy Scan, click the New button at the top left of the chart and choose New Easy
Scan.
Add Conditions
Name the Scan. Select the WatchList you want to scan from the
dropdown.
Choose your first condition: Price between values of $3 and $35.
Add other conditions in the same manner: Volume 90 Day, > 300,000; Optionable. Add your other
two conditions from the same drop down. Click OK.
The Scan is complete. Only the stocks that meet these conditions are now in your WatchList.
To access your EasyScans, click the WatchList drop down and the EasyScan tab.
(NOTE: You can now Quicksort this scan—e.g. Volume above 50 SMA, daily; Price crossing up through VWAP now, 10
min)
26
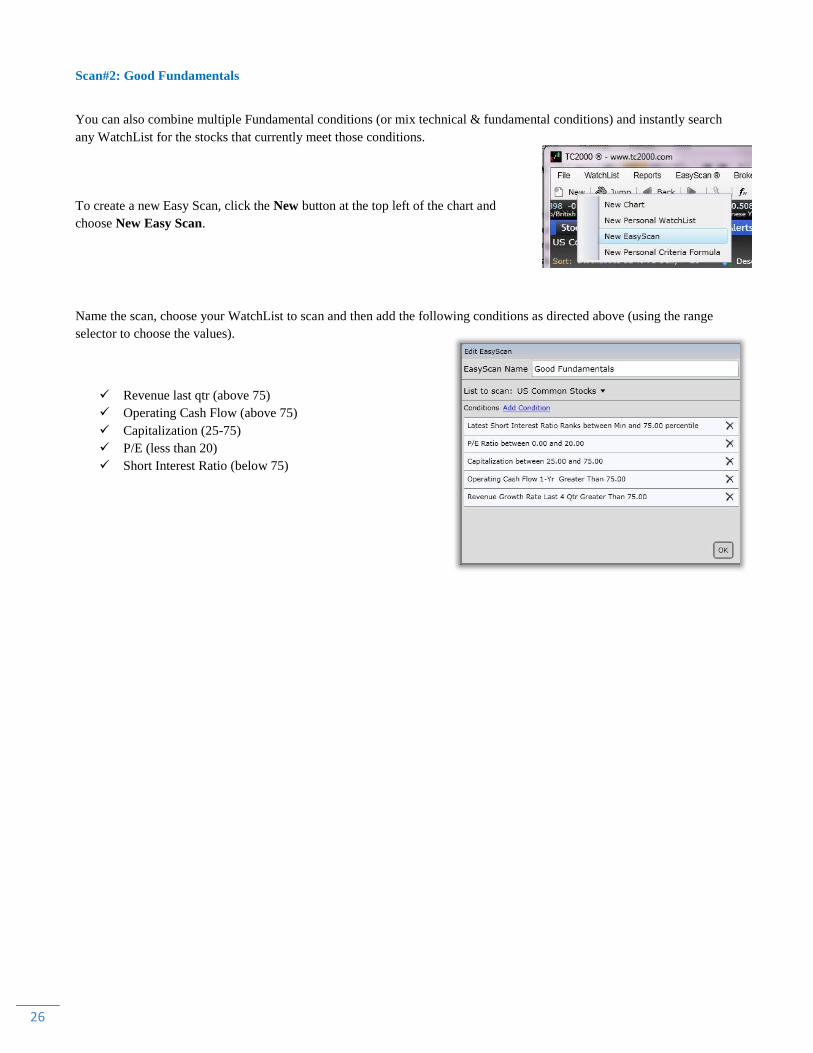
Scan#2: Good Fundamentals
You can also combine multiple Fundamental conditions (or mix technical & fundamental conditions) and instantly search
any WatchList for the stocks that currently meet those conditions.
To create a new Easy Scan, click the New button at the top left of the chart and
choose New Easy Scan.
Name the scan, choose your WatchList to scan and then add the following conditions as directed above (using the range
selector to choose the values).
Revenue last qtr (above 75)
Operating Cash Flow (above 75)
Capitalization (25-75)
P/E (less than 20)
Short Interest Ratio (below 75)
27
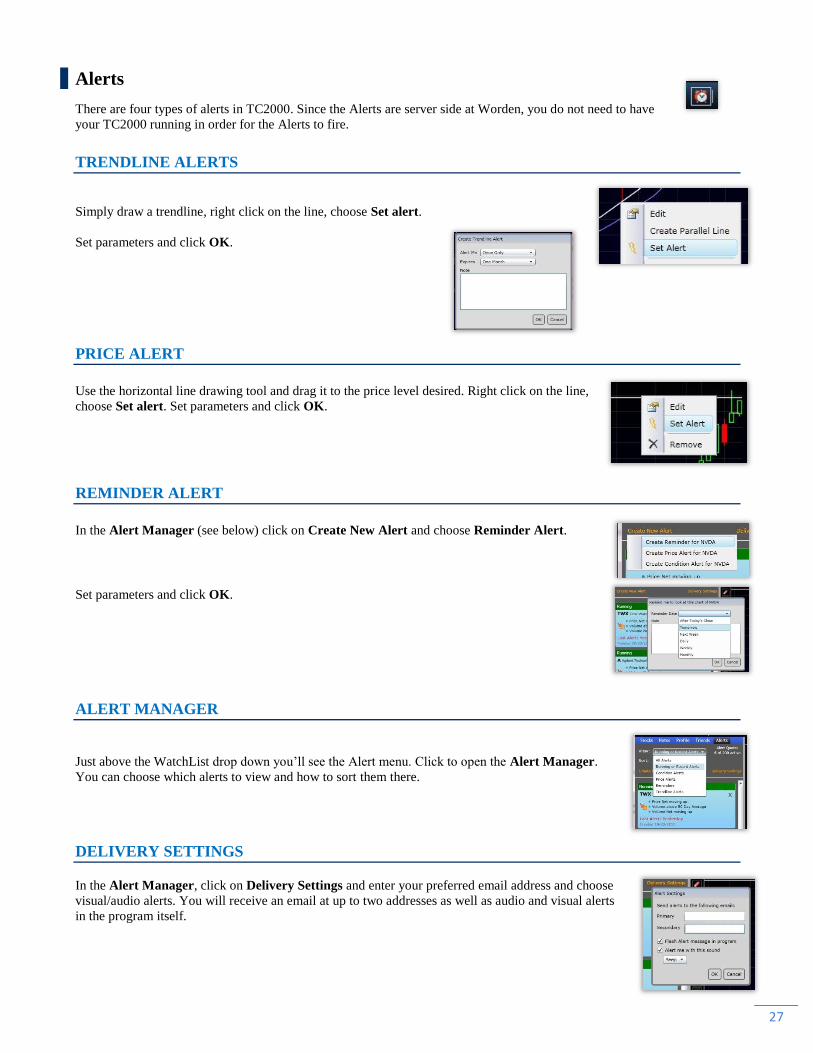
Alerts
There are four types of alerts in TC2000. Since the Alerts are server side at Worden, you do not need to have
your TC2000 running in order for the Alerts to fire.
TRENDLINE ALERTS
Simply draw a trendline, right click on the line, choose Set alert.
Set parameters and click OK.
PRICE ALERT
Use the horizontal line drawing tool and drag it to the price level desired. Right click on the line,
choose Set alert. Set parameters and click OK.
REMINDER ALERT
In the Alert Manager (see below) click on Create New Alert and choose Reminder Alert.
Set parameters and click OK.
ALERT MANAGER
Just above the WatchList drop down you‘ll see the Alert menu. Click to open the Alert Manager.
You can choose which alerts to view and how to sort them there.
DELIVERY SETTINGS
In the Alert Manager, click on Delivery Settings and enter your preferred email address and choose
visual/audio alerts. You will receive an email at up to two addresses as well as audio and visual alerts
in the program itself.
28
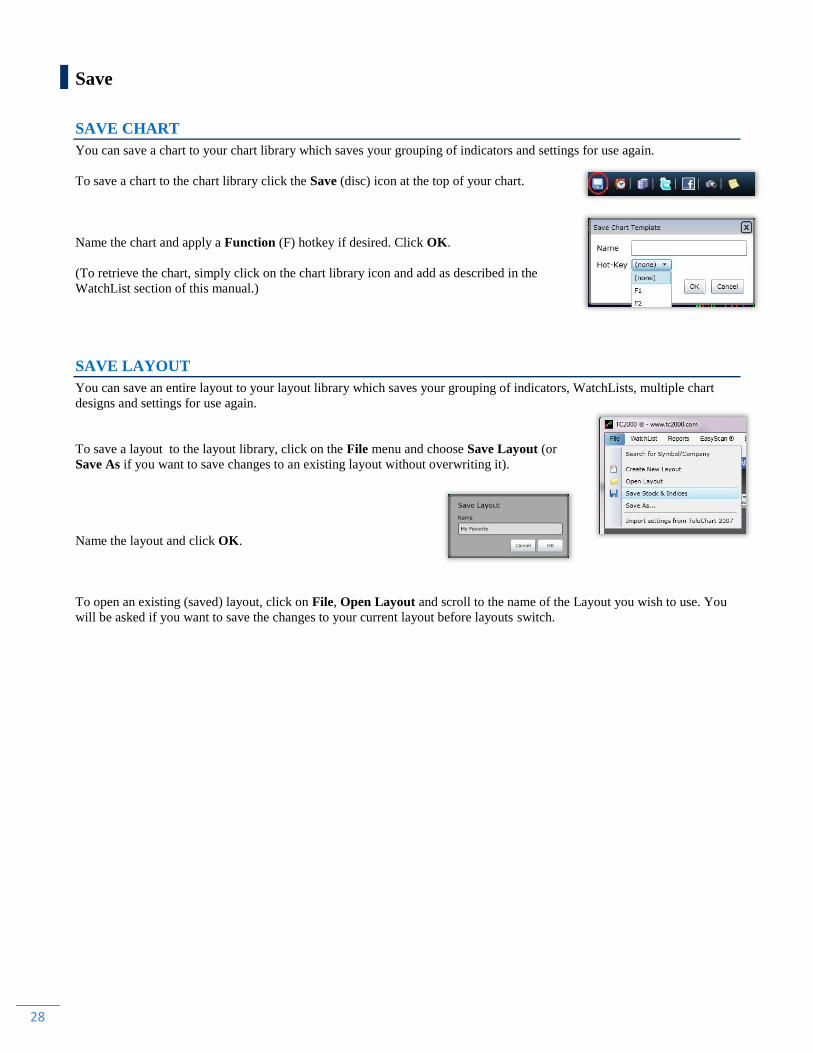
Save
SAVE CHART
You can save a chart to your chart library which saves your grouping of indicators and settings for use again.
To save a chart to the chart library click the Save (disc) icon at the top of your chart.
Name the chart and apply a Function (F) hotkey if desired. Click OK.
(To retrieve the chart, simply click on the chart library icon and add as described in the
WatchList section of this manual.)
SAVE LAYOUT
You can save an entire layout to your layout library which saves your grouping of indicators, WatchLists, multiple chart
designs and settings for use again.
To save a layout to the layout library, click on the File menu and choose Save Layout (or
Save As if you want to save changes to an existing layout without overwriting it).
Name the layout and click OK.
To open an existing (saved) layout, click on File, Open Layout and scroll to the name of the Layout you wish to use. You
will be asked if you want to save the changes to your current layout before layouts switch.
29
Resources
WEBINARS Join our Worden Webinars which cover each of our products as well as bring you quality guests to help in your trading
education. Webinars are held many Tuesday evenings, 8 p.m. EST. You can learn about and register for the next webinar at
the home page of www.Worden.com.
WEBSITES Get more information about TC2000 as well as access to lots of training materials and program download links at
www.Worden.com. FYI: sign into all websites with your TC2000 sign-in credentials.
FORUMS To access the Discussion Forums, click on the Discussion tab at www.Worden.com if you have general questions about
TC2000 going forward and need help setting something up.
Search
o To Search the Forums, click on Search (top right of Forum page). Fill in each field. Be as specific as
possible for narrower results. You can choose which Forum you wish to search from the drop-down menu.
Results will be returned as a list of related discussion threads.
Ask a Trainer
o The Ask a Trainer forum (for TC2000) is available for you to ask any specific questions related to "how
to" do anything in the software (e.g. How to write a specific pcf, build a scan, perform a sort, etc.). To ask
a question, simply click on New Topic, enter your question and post. (You can choose to follow the
discussion to receive an email when responses are posted.)
TECHNICAL SUPPORT
If you have any technical issues with TC2000, please contact Technical Support. Hours of operation:
Mon - Fri: 9:00 am - 9:00 pm ET
Sat: 9:00 am - 3:00 pm ET
Phone: 919-408-0542
Fax: 919-408-0545
For email support: [email protected]
For program feedback or suggestions: [email protected]
30
INDEX:
Alert Manager, 1, 32, 33
Alerts, 1, 32
Bar, 7, 8, 11, 15, 22
Bollinger Band, 27
Browser, 5
Candlestick, 7, 8
Change active symbol, 11, 18
Chart, 7
Chart Template, 1, 4, 18, 19
Chat, 1, 16, 17
Child indicators, 9
Column, 20, 21, 22, 23
Comparisons, 12
Conditions, 30
Criteria, 1, 5, 27, 28
Custom Date, 1, 29
Default, 6
Desktop version, 6
Drawing tools, 5, 15, 16
EasyScan, 1, 5, 10, 28, 29, 30
Edit, 7, 8, 9, 13, 16, 18, 19, 27
Forecast Space, 16
Forward slash key, 10, 21, 22, 24, 25, 26, 27
Full Screen, 19
Fundamentals, 1, 31
Gaps, 21
Gold, 4, 5, 9, 20
Heiken-Ashi, 8
Hot Keys, 4, 6
Import, 1, 6
Indicator, 4, 5, 9, 21, 22, 24, 25, 26, 29
Industry, 10, 12, 29
Jump, 6, 11
Layout, 1, 4, 6, 33
Macintosh, 5
MACD, 8, 9, 21, 22, 23
Market Indicators, 5
MoneyStream, 20, 21, 24, 25
Morningstar, 10
Most active, 23
New Chart, 18, 19
new high, 22, 24
News, 1, 12, 13
Notes, 1, 4, 12, 13, 14
Pan, 14, 15
Personal Criteria Formula /PCF, 5, 28, 29
Peter Worden, 14, 17
Platinum, 1, 4, 5, 9, 16, 17, 20, 25
Plot styles, 7
Pointer Mode, 1, 14, 15
Price Graph Type, 7
Price History, 4, 7, 12, 22, 24
Profile, 13
Properties, 19
QuickSort, 1, 20, 22, 23, 24, 25, 26, 27
Reminder Alert, 32
Rename, 11
Save, 1, 33
Scaling, 9, 12, 15, 18, 19
Settings, 1, 6, 7, 16, 19, 32, 33
Share, 13
Sign-in, 4
Slide Show, 19
Sort/Sorting, 1, 9, 20, 21, 22, 23, 24, 25, 27, 28, 29, 30,
32, 34
Stochastics, 9, 22, 23
System default, 6
T2s, 5
TC2000, 1, 3, 4, 5, 6, 7, 8, 9, 10, 11, 13, 16, 17, 18, 19,
20, 25, 28, 29, 30, 32, 34
TeleChart 2007, 1, 6, 12
Time Frame, 1, 4, 5, 8, 23, 25, 28
Time Segmented Volume, 25
Time Span Buttons, 14
Trendline, 15, 16, 32
TSV, 9, 25
Volatility Stop, 26
Volume Buzz, 20
VWAP, 25, 26, 30
WatchList, 1, 5, 10, 11, 12, 19, 20, 21, 22, 23, 24, 25, 26,
27, 28, 29, 30, 31, 32, 33
Worden Market Indicators (T2s), 5
Worden Notes, 13
Worden Report, 13, 14
Zoom, 1, 5, 14