Embed Size (px)
Citation preview
TCI Investor Conference, New YorkMike Franczak – EVP Operations
17 June 2014
FO
R P
ER
SO
NA
L U
SE
ON
LY
Important notice
No Reliance on this document
This document was prepared by Aurizon Holdings Limited (ACN 146 335 622) (referred to as “Aurizon” which includes its related bodies corporate). Whilst Aurizon has
endeavoured to ensure the accuracy of the information contained in this document at the date of publication, it may contain information that has not been independently
verified. Aurizon makes no representation or warranty as to the accuracy, completeness or reliability of any of the information contained in this document.
Document is a summary only
This document contains information in a summary form only and does not purport to be complete and is qualified in its entirety by, and should be read in conjunction with, all
of the information which Aurizon files with the Australian Securities Exchange. Any information or opinions expressed in this document are subject to change without notice.
Aurizon is not under any obligation to update or keep current the information contained within this document. Information contained in this document may have changed
since its date of publication.
No investment advice
This document is not intended to be, and should not be considered to be, investment advice by Aurizon nor a recommendation to invest in Aurizon. The information provided
in this document has been prepared for general informational purposes only without taking into account the recipient’s investment objectives, financial circumstances,
taxation position or particular needs. Each recipient to whom this document is made available must make its own independent assessment of Aurizon after making such
investigations and taking such advice as it deems necessary. If the recipient is in any doubts about any of the information contained in this document, the recipient should
obtain independent professional advice.
No offer of securities
Nothing in this presentation should be construed as a recommendation of or an offer to sell or a solicitation of an offer to buy or sell securities in Aurizon in any jurisdiction
(including in the United States). This document is not a prospectus and it has not been reviewed or authorised by any regulatory authority in any jurisdiction. This document
does not constitute an advertisement, invitation or document which contains an invitation to the public in any jurisdiction to enter into or offer to enter into an agreement to
acquire, dispose of, subscribe for or underwrite securities in Aurizon.
Forward-looking statements
This document may include forward-looking statements which are not historical facts. Forward-looking statements are based on the current beliefs, assumptions,
expectations, estimates and projections of Aurizon. These statements are not guarantees or predictions of future performance, and involve both known and unknown risks,
uncertainties and other factors, many of which are beyond Aurizon’s control. As a result, actual results or developments may differ materially from those expressed in the
forward-looking statements contained in this document. Aurizon is not under any obligation to update these forward-looking statements to reflect events or circumstances
that arise after publication. Past performance is not an indication of future performance.
No liability
To the maximum extent permitted by law in each relevant jurisdiction, Aurizon and its directors, officers, employees, agents, contractors, advisers and any other person
associated with the preparation of this document, each expressly disclaims any liability, including without limitation any liability arising from fault or negligence, for any errors
or misstatements in, or omissions from, this document or any direct, indirect or consequential loss howsoever arising from the use or reliance upon the whole or any part of
this document or otherwise arising in connection with it.
2

3
FO
R P
ER
SO
NA
L U
SE
ON
LY
Aurizon is on the journey to World Class
Return on Invested Capital (ROIC)(2)Operating Ratio(1)
1) Operating Ratio = 1 – EBIT margin
2) ROIC = Underlying EBIT/(Net Working Capital + Net PP&E + AUC+ Gross Intangible Assets)
90.0
88.0
FY2010 FY2011
79.8
FY2013
83.4
FY2012
-1.4ppt
1H FY2014
78.4
8.6
8.0
6.7
4.4
2.0
1H FY2014
+0.6ppt
FY2013FY2012FY2011FY2010

4
Operating ratios below 70% are achievable for Aurizon, but it is a long term journey (often 10+ years)
All Class 1's have steadily improved returnson capital since 2004, moving towards 12% ROIC
1. Class 1 metrics based on calendar year data from December 1995 through to December 2012. Aurizon metrics based on financial year data from June 2011 through to December 2013.
2. ROIC = Return on Invested Capital
3. ‘Rest of Class 1average’ comprises metrics for BNSF, UP, NS, KCS and CP
Source: Analysis of Class 1 Railroads (Association of American Railroads (AAR)) & Company reports
North American Class 1's have shown operating ratios <65% and ROICs >12% are achievable – Aurizon is on its way
0
4
8
12
16
ROIC (%)
13121110090807060504030201009998979695 14
Aurizon
Aurizon
Aurizon
CSX
CN
Rest of Class 1 average
60
70
80
90
100
Operating ratio (%)
1109 1008070605 12 1304030201009998979695 14
CN (leader in delivering gains)
Aurizon
CSX (largest shift of all Class 1s)
Rest of Class 1 average

5
FO
R P
ER
SO
NA
L U
SE
ON
LY
Transformation journey
IPO
Implementation of functional model to remove operating silos
Voluntary Redundancy (VR) program to reduce headcount
New holistic business model -Integrated Operating Plan (IOP)
Asset/fleet productivity + rationalisation
Crew efficiency Coordinated cross business
planning Improved contract
structures and service
Increasing value through sustainable, replicable and continuous improvement
Longer term outcome (post 75%) highly influenced by outcome of Enterprise Agreement (EA) negotiations
November 2010
December 2011
March 2012
July 2013
FutureMay 2014
Aurizon is evolving to an improved business model

6
FO
R P
ER
SO
NA
L U
SE
ON
LY
We focus on 5 core business principles
to drive value
Core design considerations guide our
work
What’s
changed?
Coordinated planning (where permitted) across functions and lines of business
Common KPIs / metrics to drive Enterprise outcomes
Continuous improvement focus with a replicable and adaptable model
Standardisation
Eliminate waste
Maximise train payloads
Balanced volumes
Multi-user; multi-cargo trains
Reliability based maintenance
Flexibility
Increase velocity
Energy efficient
Network planning –localised execution
Technology
Safe working practices Enterprise view
Asset focus / fungibility of assets
The IOP is underpinned by key business and operational principles….

7
FO
R P
ER
SO
NA
L U
SE
ON
LY
… and is being rolled out across all key national corridors
Aurizon’s operations footprint
NorthernTerritory
New South Wales
South Australia
Western Australia
Victoria
Queensland
Tasmania
Cairns
Townsville
Mackay
Rockhampton
BRISBANE
NewcastleSYDNEY
CANBERRA
MELBOURNE
HOBART
ADELAIDE
Alice Springs
Mt Isa
DARWIN
Port Hedland
Geraldton
Esperance
Kalgoorlie
Port AugustaPERTH
Aurizon operations
Do not operate
Hunter Valley Coal
South West Corridor
Coal North Corridor
North West Corridor
North Coast Line
Western Australian Corridors
Coal South Corridor
Interstate Intermodal
8
FO
R P
ER
SO
NA
L U
SE
ON
LY
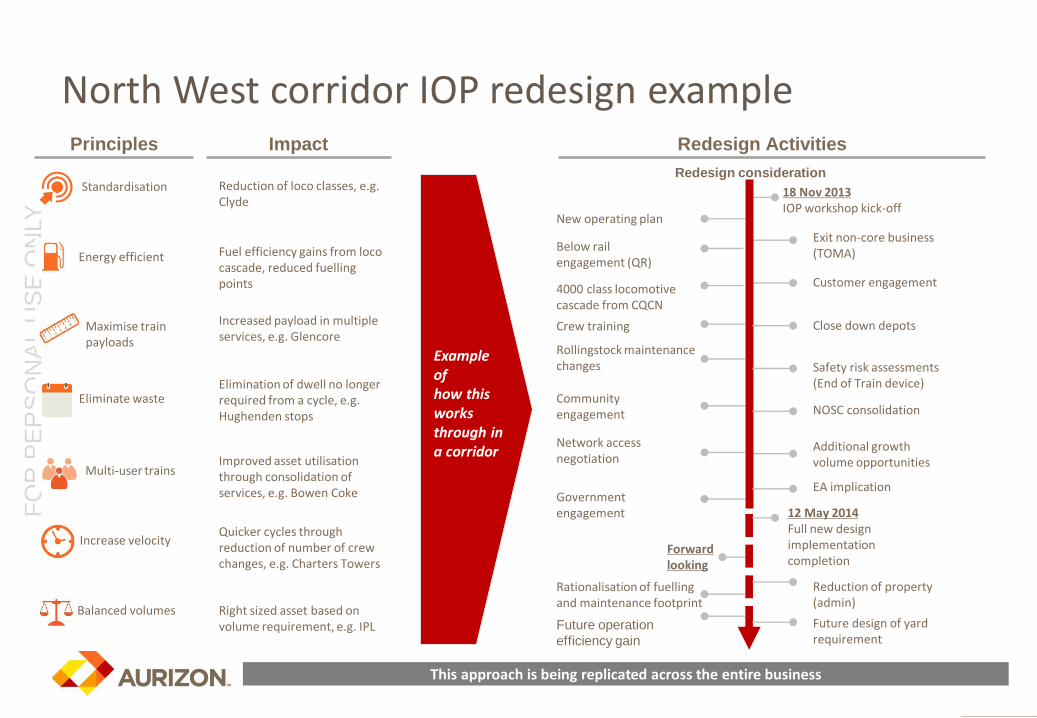
Redesign Activities
18 Nov 2013IOP workshop kick-off
New operating plan
Exit non-core business (TOMA)
Below rail engagement (QR)
Customer engagement
Community engagement
Government engagement
Additional growth volume opportunities
Rationalisation of fuelling and maintenance footprint
Redesign consideration
This approach is being replicated across the entire business
Principles Impact
Close down depotsCrew training
Rollingstock maintenance changes
Forward looking
12 May 2014Full new design implementation completion
Safety risk assessments (End of Train device)
NOSC consolidation
Network access negotiation
Energy efficient Fuel efficiency gains from loco cascade, reduced fuelling points
Standardisation Reduction of loco classes, e.g. Clyde
Multi-user trainsImproved asset utilisation through consolidation of services, e.g. Bowen Coke
Maximise trainpayloads
Increased payload in multiple services, e.g. Glencore
Increase velocityQuicker cycles through reduction of number of crew changes, e.g. Charters Towers
Eliminate wasteElimination of dwell no longer required from a cycle, e.g. Hughenden stops
Balanced volumes Right sized asset based on volume requirement, e.g. IPL
Reduction of property (admin)
Future operation
efficiency gain
Future design of yard requirement
EA implication
Example of how this works through in a corridor
4000 class locomotive cascade from CQCN
North West corridor IOP redesign example
9
FO
R P
ER
SO
NA
L U
SE
ON
LY
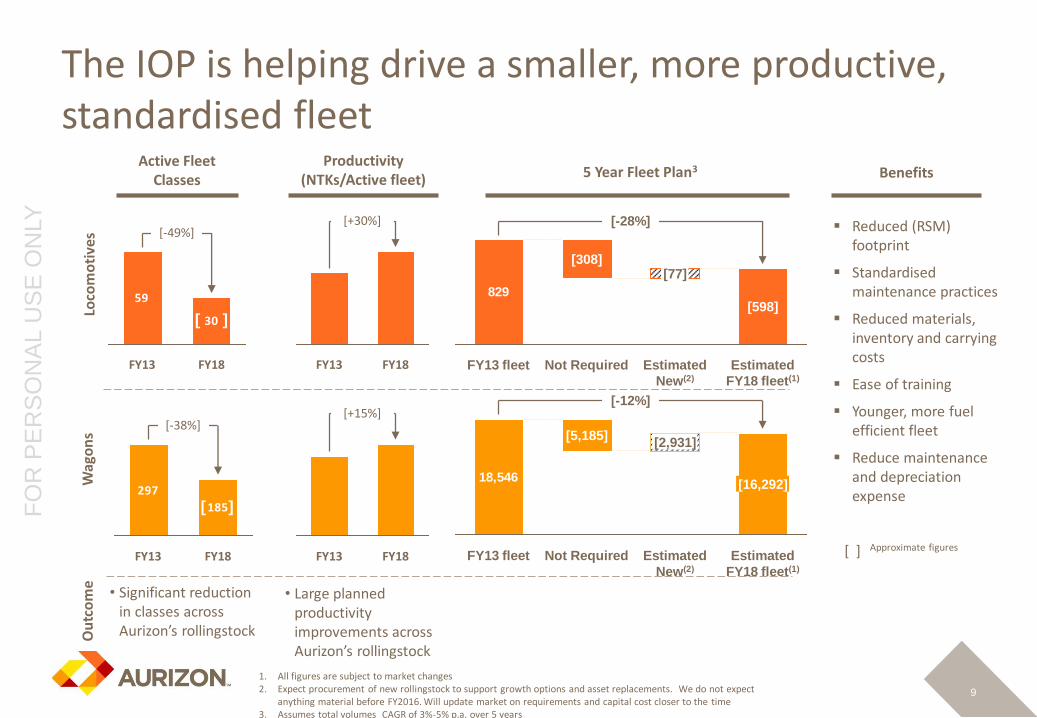
The IOP is helping drive a smaller, more productive, standardised fleet
1. All figures are subject to market changes2. Expect procurement of new rollingstock to support growth options and asset replacements. We do not expect
anything material before FY2016. Will update market on requirements and capital cost closer to the time3. Assumes total volumes CAGR of 3%-5% p.a. over 5 years
59
30
[-49%]
FY18FY13
[+30%]
FY18FY13
829
[77]
FY13 fleet Not Required Estimated
FY18 fleet(1)
[598]
[-28%]
[308]
Estimated
New(2)
Loco
mo
tive
s
297
185
[-38%]
FY13 FY18 FY13
[+15%]
FY18
18,546
FY13 fleet
[5,185]
Estimated
New(2)
[2,931]
Not Required
[16,292]
Estimated
FY18 fleet(1)
[-12%]
Wag
on
s
Active Fleet Classes
Productivity(NTKs/Active fleet) 5 Year Fleet Plan3
[ ] Approximate figures
Reduced (RSM) footprint
Standardised maintenance practices
Reduced materials, inventory and carrying costs
Ease of training
Younger, more fuel efficient fleet
Reduce maintenance and depreciation expense
• Significant reduction in classes across Aurizon’s rollingstock
• Large planned productivity improvements across Aurizon’s rollingstock
Ou
tco
me
Benefits
[ ]
[ ]

10
FO
R P
ER
SO
NA
L U
SE
ON
LY
Technology is helping Aurizon re-engineer its work to drive leading edge improvements in safety, efficiency and capacity
• Fewer equipment failures
• Moving from interval to condition based maintenance
• Reduced dwell time in yards
• Improved asset reliability and productivity
• Improved labour productivity (finders become fixers)

11
FO
R P
ER
SO
NA
L U
SE
ON
LY
Operations transformation programs delivering a strong 1H FY2014 performance
1. The NTK/Employee metric for the half year is annualised for operational purposes and uses monthly average FTE2. Monthly average3. CQCN = Central Queensland Coal Network4. Operations costs base includes Coal, Iron Ore and Freight costs (unless otherwise noted) but excludes Access, Electricity and
Intermodal road solutions costs
Metric1H
FY20141H
FY20131H
Variance2H
FY2013
Pro
du
ctio
n
Net tonne kilometres (bn) 38.2 33.5 14.0% 33.5
Tonnes (m) 149.4 133.8 11.7% 133.9
Peo
ple
1 Full time equivalents2 5,464 5,807 5.9% 5,520
NTK/Employee (FTE)1,2 14.00 11.56 21.1% 12.17
Flee
t2 NTK/Active loco2 9.63 7.91 21.7% 8.16
NTK/Active wagon2 0.41 0.34 20.6% 0.35
Pro
du
ctiv
ity
& e
ffic
ien
cy
Average Payload Coal (tonnes)2 7,921 7,651 3.5% 7,769
Turnaround time - CQCN3 (hrs)2 25.14 26.73 5.9% 27.69
Fuel consumption (l/dGTK) 3.51 3.64 3.6% 3.58
Operating expenses (c/NTK)4 have improved by ~14%

12
FO
R P
ER
SO
NA
L U
SE
ON
LY
Operational transformation of Aurizon is well underway….
Aurizon has demonstrated a track record of improvement and transformation
Aurizon is poised to deliver future value
1
2
Key Takeaways

TCI Investor Conference, New YorkMike Franczak – EVP Operations
17 June 2014