Embed Size (px)
Citation preview

Fare Policies, Structures andTechnologies: Update
TRANSIT COOPERATIVERESEARCHPROGRAMTCRP
REPORT 94
Sponsored by
the Federal
Transit Administration

TCRP OVERSIGHT AND PROJECTSELECTION COMMITTEE(as of October 2002)
CHAIRJ. BARRY BARKERTransit Authority of River City
MEMBERSDANNY ALVAREZ Miami-Dade Transit AgencyKAREN ANTIONKaren Antion ConsultingGORDON AOYAGIMontgomery County GovernmentJEAN PAUL BAILLYUnion Internationale des Transports PublicsRONALD L. BARNESCentral Ohio Transit AuthorityLINDA J. BOHLINGERHNTB Corp.ANDREW BONDS, JR.Parsons Transportation Group, Inc.JENNIFER L. DORNFTANATHANIEL P. FORD, SR.Metropolitan Atlanta RTACONSTANCE GARBERYork County Community Action Corp.FRED M. GILLIAMCapital Metropolitan Transportation AuthorityKIM R. GREENGFI GENFARESHARON GREENESharon Greene & AssociatesKATHERINE M. HUNTER-ZAWORSKIOregon State UniversityROBERT H. IRWINBritish Columbia TransitCELIA G. KUPERSMITHGolden Gate Bridge, Highway and
Transportation DistrictPAUL J. LARROUSSENational Transit Institute DAVID A. LEEConnecticut TransitCLARENCE W. MARSELLADenver Regional Transportation DistrictFAYE L. M. MOORESoutheastern Pennsylvania
Transportation AuthoritySTEPHANIE L. PINSONGilbert Tweed Associates, Inc.ROBERT H. PRINCE, JR.DMJM+HARRIS JEFFERY M. ROSENBERGAmalgamated Transit UnionRICHARD J. SIMONETTApbConsultPAUL P. SKOUTELAS Port Authority of Allegheny CountyLINDA S. WATSONCorpus Christi RTA
EX OFFICIO MEMBERSWILLIAM W. MILLARAPTAMARY E. PETERSFHWAJOHN C. HORSLEYAASHTOROBERT E. SKINNER, JR.TRB
TDC EXECUTIVE DIRECTORLOUIS F. SANDERSAPTA
SECRETARYROBERT J. REILLYTRB
TRANSPORTATION RESEARCH BOARD EXECUTIVE COMMITTEE 2003 (Membership as of March 2003)
OFFICERS
Chair: Genevieve Giuliano, Director and Prof., School of Policy, Planning, and Development, USC, Los AngelesVice Chair: Michael S. Townes, Exec. Dir., Transportation District Commission of Hampton Roads, Hampton, VA Executive Director: Robert E. Skinner, Jr., Transportation Research Board
MEMBERS
MICHAEL W. BEHRENS, Executive Director, Texas DOTJOSEPH H. BOARDMAN, Commissioner, New York State DOTSARAH C. CAMPBELL, President, TransManagement, Inc., Washington, DCE. DEAN CARLSON, Secretary of Transportation, Kansas DOTJOANNE F. CASEY, President, Intermodal Association of North AmericaJAMES C. CODELL III, Secretary, Kentucky Transportation CabinetJOHN L. CRAIG, Director, Nebraska Department of RoadsBERNARD S. GROSECLOSE, JR., President and CEO, South Carolina State Ports AuthoritySUSAN HANSON, Landry University Prof. of Geography, Graduate School of Geography, Clark UniversityLESTER A. HOEL, L. A. Lacy Distinguished Professor, Depart. of Civil Engineering, University of VirginiaHENRY L. HUNGERBEELER, Director, Missouri DOTADIB K. KANAFANI, Cahill Prof. and Chair, Dept. of Civil and Environmental Engineering, University of
California at Berkeley RONALD F. KIRBY, Director of Transportation Planning, Metropolitan Washington Council of GovernmentsHERBERT S. LEVINSON, Principal, Herbert S. Levinson Transportation Consultant, New Haven, CTMICHAEL D. MEYER, Professor, School of Civil and Environmental Engineering, Georgia Institute of
TechnologyJEFF P. MORALES, Director of Transportation, California DOTKAM MOVASSAGHI, Secretary of Transportation, Louisiana Department of Transportation and DevelopmentCAROL A. MURRAY, Commissioner, New Hampshire DOTDAVID PLAVIN, President, Airports Council International, Washington, DCJOHN REBENSDORF, Vice Pres., Network and Service Planning, Union Pacific Railroad Co., Omaha, NECATHERINE L. ROSS, Executive Director, Georgia Regional Transportation AgencyJOHN M. SAMUELS, Sr. Vice Pres.-Operations Planning & Support, Norfolk Southern Corporation,
Norfolk, VAPAUL P. SKOUTELAS, CEO, Port Authority of Allegheny County, Pittsburgh, PAMARTIN WACHS, Director, Institute of Transportation Studies, University of California at BerkeleyMICHAEL W. WICKHAM, Chairman and CEO, Roadway Express, Inc., Akron, OH
EX OFFICIO MEMBERS
MIKE ACOTT, President, National Asphalt Pavement Association MARION C. BLAKEY, Federal Aviation Administrator, U.S.DOT REBECCA M. BREWSTER, President and CEO, American Transportation Research Institute, Atlanta, GATHOMAS H. COLLINS (Adm., U.S. Coast Guard), Commandant, U.S. Coast Guard JENNIFER L. DORN, Federal Transit Administrator, U.S.DOT ELLEN G. ENGLEMAN, Research and Special Programs Administrator, U.S.DOT ROBERT B. FLOWERS (Lt. Gen., U.S. Army), Chief of Engineers and Commander, U.S. Army Corps of
Engineers HAROLD K. FORSEN, Foreign Secretary, National Academy of Engineering EDWARD R. HAMBERGER, President and CEO, Association of American Railroads JOHN C. HORSLEY, Exec. Dir., American Association of State Highway and Transportation Officials MICHAEL P. JACKSON, Deputy Secretary of Transportation, U.S.DOT ROGER L. KING, Chief Applications Technologist, National Aeronautics and Space Administration ROBERT S. KIRK, Director, Office of Advanced Automotive Technologies, U.S. DOERICK KOWALEWSKI, Acting Director, Bureau of Transportation Statistics, U.S.DOT WILLIAM W. MILLAR, President, American Public Transportation Association MARY E. PETERS, Federal Highway Administrator, U.S.DOT SUZANNE RUDZINSKI, Director, Office of Transportation and Air Quality, U.S. EPA JEFFREY W. RUNGE, National Highway Traffic Safety Administrator, U.S.DOT ALLAN RUTTER, Federal Railroad Administrator, U.S.DOT ANNETTE M. SANDBERG, Deputy Administrator, Federal Motor Carrier Safety Administration, U.S.DOT WILLIAM G. SCHUBERT, Maritime Administrator, U.S.DOT
TRANSIT COOPERATIVE RESEARCH PROGRAM
Transportation Research Board Executive Committee Subcommittee for TCRP
GENEVIEVE GIULIANO, University of Southern California, Los Angeles (Chair)E. DEAN CARLSON, Kansas DOT JENNIFER L. DORN, Federal Transit Administration, U.S.DOT LESTER A. HOEL, University of VirginiaWILLIAM W. MILLAR, American Public Transportation Association ROBERT E. SKINNER, JR., Transportation Research BoardPAUL P. SKOUTELAS, Port Authority of Allegheny County, Pittsburgh, PAMICHAEL S. TOWNES, Transportation District Commission of Hampton Roads, Hampton, VA

T R A N S P O R T A T I O N R E S E A R C H B O A R DWASHINGTON, D.C.
2003www.TRB.org
T R A N S I T C O O P E R A T I V E R E S E A R C H P R O G R A M
TCRP REPORT 94
Research Sponsored by the Federal Transit Administration in Cooperation with the Transit Development Corporation
SUBJECT AREAS
Public Transit
Fare Policies, Structures andTechnologies: Update
MULTISYSTEMS, INC.Cambridge, MA
With
MUNDLE & ASSOCIATES, INC.Philadelphia, PA
SIMON & SIMON RESEARCH AND ASSOCIATES, INC.Ellicott City, MD

TRANSIT COOPERATIVE RESEARCH PROGRAM
The nation’s growth and the need to meet mobility,environmental, and energy objectives place demands on publictransit systems. Current systems, some of which are old and in needof upgrading, must expand service area, increase service frequency,and improve efficiency to serve these demands. Research isnecessary to solve operating problems, to adapt appropriate newtechnologies from other industries, and to introduce innovations intothe transit industry. The Transit Cooperative Research Program(TCRP) serves as one of the principal means by which the transitindustry can develop innovative near-term solutions to meetdemands placed on it.
The need for TCRP was originally identified in TRB SpecialReport 213—Research for Public Transit: New Directions,published in 1987 and based on a study sponsored by the Urban MassTransportation Administration—now the Federal Transit Admin-istration (FTA). A report by the American Public TransportationAssociation (APTA), Transportation 2000, also recognized the needfor local, problem-solving research. TCRP, modeled after thelongstanding and successful National Cooperative HighwayResearch Program, undertakes research and other technical activitiesin response to the needs of transit service providers. The scope ofTCRP includes a variety of transit research fields including plan-ning, service configuration, equipment, facilities, operations, humanresources, maintenance, policy, and administrative practices.
TCRP was established under FTA sponsorship in July 1992.Proposed by the U.S. Department of Transportation, TCRP wasauthorized as part of the Intermodal Surface TransportationEfficiency Act of 1991 (ISTEA). On May 13, 1992, a memorandumagreement outlining TCRP operating procedures was executed bythe three cooperating organizations: FTA, The National Academies,acting through the Transportation Research Board (TRB); and the Transit Development Corporation, Inc. (TDC), a nonprofiteducational and research organization established by APTA.TDC is responsible for forming the independent governing board,designated as the TCRP Oversight and Project Selection (TOPS)Committee.
Research problem statements for TCRP are solicited periodicallybut may be submitted to TRB by anyone at any time. It is theresponsibility of the TOPS Committee to formulate the researchprogram by identifying the highest priority projects. As part of theevaluation, the TOPS Committee defines funding levels andexpected products.
Once selected, each project is assigned to an expert panel,appointed by the Transportation Research Board. The panels prepareproject statements (requests for proposals), select contractors, andprovide technical guidance and counsel throughout the life of theproject. The process for developing research problem statements andselecting research agencies has been used by TRB in managingcooperative research programs since 1962. As in other TRB activ-ities, TCRP project panels serve voluntarily without compensation.
Because research cannot have the desired impact if products failto reach the intended audience, special emphasis is placed ondisseminating TCRP results to the intended end users of theresearch: transit agencies, service providers, and suppliers. TRBprovides a series of research reports, syntheses of transit practice,and other supporting material developed by TCRP research. APTAwill arrange for workshops, training aids, field visits, and otheractivities to ensure that results are implemented by urban and ruraltransit industry practitioners.
The TCRP provides a forum where transit agencies cancooperatively address common operational problems. The TCRPresults support and complement other ongoing transit research andtraining programs.
TCRP REPORT 94
Project A-25 FY’01ISSN 1073-4872ISBN 0-309-08764-3Library of Congress Control Number 2003108814
© 2003 Transportation Research Board
Price $27.00
NOTICE
The project that is the subject of this report was a part of the Transit CooperativeResearch Program conducted by the Transportation Research Board with theapproval of the Governing Board of the National Research Council. Suchapproval reflects the Governing Board’s judgment that the project concerned isappropriate with respect to both the purposes and resources of the NationalResearch Council.
The members of the technical advisory panel selected to monitor this project andto review this report were chosen for recognized scholarly competence and withdue consideration for the balance of disciplines appropriate to the project. Theopinions and conclusions expressed or implied are those of the research agencythat performed the research, and while they have been accepted as appropriateby the technical panel, they are not necessarily those of the TransportationResearch Board, the National Research Council, the Transit DevelopmentCorporation, or the Federal Transit Administration of the U.S. Department ofTransportation.
Each report is reviewed and accepted for publication by the technical panelaccording to procedures established and monitored by the TransportationResearch Board Executive Committee and the Governing Board of the NationalResearch Council.
Special Notice
The Transportation Research Board of The National Academies, the NationalResearch Council, the Transit Development Corporation, and the Federal TransitAdministration (sponsor of the Transit Cooperative Research Program) do notendorse products or manufacturers. Trade or manufacturers’ names appear hereinsolely because they are considered essential to the clarity and completeness of theproject reporting.
Published reports of the
TRANSIT COOPERATIVE RESEARCH PROGRAM
are available from:
Transportation Research BoardBusiness Office500 Fifth Street, NWWashington, DC 20001
and can be ordered through the Internet athttp://www.national-academies.org/trb/bookstore
Printed in the United States of America

The National Academy of Sciences is a private, nonprofit, self-perpetuating society of distinguished schol-ars engaged in scientific and engineering research, dedicated to the furtherance of science and technology and to their use for the general welfare. On the authority of the charter granted to it by the Congress in 1863, the Academy has a mandate that requires it to advise the federal government on scientific and techni-cal matters. Dr. Bruce M. Alberts is president of the National Academy of Sciences.
The National Academy of Engineering was established in 1964, under the charter of the National Acad-emy of Sciences, as a parallel organization of outstanding engineers. It is autonomous in its administration and in the selection of its members, sharing with the National Academy of Sciences the responsibility for advising the federal government. The National Academy of Engineering also sponsors engineering programs aimed at meeting national needs, encourages education and research, and recognizes the superior achieve-ments of engineers. Dr. William A. Wulf is president of the National Academy of Engineering.
The Institute of Medicine was established in 1970 by the National Academy of Sciences to secure the services of eminent members of appropriate professions in the examination of policy matters pertaining to the health of the public. The Institute acts under the responsibility given to the National Academy of Sciences by its congressional charter to be an adviser to the federal government and, on its own initiative, to identify issues of medical care, research, and education. Dr. Harvey V. Fineberg is president of the Institute of Medicine.
The National Research Council was organized by the National Academy of Sciences in 1916 to associate the broad community of science and technology with the Academy’s purposes of furthering knowledge and advising the federal government. Functioning in accordance with general policies determined by the Acad-emy, the Council has become the principal operating agency of both the National Academy of Sciences and the National Academy of Engineering in providing services to the government, the public, and the scientific and engineering communities. The Council is administered jointly by both the Academies and the Institute of Medicine. Dr. Bruce M. Alberts and Dr. William A. Wulf are chair and vice chair, respectively, of the National Research Council.
The Transportation Research Board is a division of the National Research Council, which serves the National Academy of Sciences and the National Academy of Engineering. The Board’s mission is to promote innovation and progress in transportation through research. In an objective and interdisciplinary setting, the Board facilitates the sharing of information on transportation practice and policy by researchers and practitioners; stimulates research and offers research management services that promote technical excellence; provides expert advice on transportation policy and programs; and disseminates research results broadly and encourages their implementation. The Board’s varied activities annually engage more than 4,000 engineers, scientists, and other transportation researchers and practitioners from the public and private sectors and academia, all of whom contribute their expertise in the public interest. The program is supported by state transportation departments, federal agencies including the component administrations of the U.S. Department of Transportation, and other organizations and individuals interested in the development of transportation. www.TRB.org
www.national-academies.org

COOPERATIVE RESEARCH PROGRAMS STAFF
ROBERT J. REILLY, Director, Cooperative Research ProgramsCHRISTOPHER W. JENKS, TCRP ManagerGWEN CHISHOLM, Senior Program OfficerEILEEN P. DELANEY, Managing EditorBETH HATCH, Assistant Editor
PROJECT PANEL A-25 Field of Operations
AGAPITO DIAZ, ASC State and Local Solutions, Washington, DC (Chair)PETER BENJAMIN, Washington Metropolitan Area Transit Authority (WMATA) MICHAEL F. BLONDIN, Merrimack Valley Area Transportation, Haverhill, MA TOULLA CONSTANTINOU, Cemusa Inc., Chicago, ILRUSSELL DRIVER, Metropolitan Transportation Commission–Oakland, CALAWRENCE F. HUGHES, Transit Alliance, Jamaica, NYMARTIN HULL, Baker Engineering NY, Inc., Albany, NYTHOMAS PARKER San Francisco Bay Area Rapid Transit District (BART) JAMES REDEKER, New Jersey Transit CorporationJOSEPH C. SIMONETTI, Metavante Corporation, Clarendon Hills, ILSEAN RICKETSON, FTA Liaison RepresentativePAMELA BOSWELL, APTA Liaison RepresentativePETER SHAW, TRB Liaison Representative
AUTHOR ACKNOWLEDGMENTSThe research described in this report was performed under TCRP
Project A-25 by Multisystems, Inc., with assistance from Mundle &Associates, Inc. and Simon & Simon Research and Associates, Inc.
Daniel Fleishman of Multisystems served as Principal Investiga-tor for the project and is the author of this final report. The case stud-ies were prepared by Daniel Fleishman, Rick Halvorsen, Joana
Conklin, Doug Parker and Larry Englisher of Multisystems; GeorgePierlott and Subhash Mundle of Mundle & Associates; and RosalynSimon, Monica Simon and Robert Carlson of Simon & SimonResearch and Associates.
The guidance of Gwen Chisholm, the TCRP Program Officer forthe project, and the Project Panel is also acknowledged.

FOREWORDBy Gwen Chisholm
Staff OfficerTransportation Research
Board
TCRP Report 94: Fare Policies, Structures and Technologies: Update identifies,describes, and evaluates key fare structures, policies, and technologies that are being con-sidered by transit agencies, with a focus on their impact on customers, operations man-agement, and effective and equitable fare integration. The report includes data on farestructures, policy-making procedures, and ongoing efforts to implement fare technology.
This report provides guidance on making decisions related to fare policies, struc-tures, and technologies. It includes practical information that can be readily used bytransit professionals and policy makers in fare-related planning and decision making.This report updates information presented in TCRP Reports 10 and 32 and presents thelatest developments and research results related to fare policy and technology issues.
Every transit agency must periodically address fare policy, structure, and technol-ogy issues. While each of these areas has been evaluated separately, it is important tounderstand the interrelationships among them. Policy generally guides the direction forfare structure, but technology changes can also affect structure decisions. Emergingelectronic payment technologies, in particular, facilitate the consideration of new typesof pricing strategies and payment options. TCRP Report 10, Fare Policies, Structuresand Technologies, published in 1996, explored developments and issues related to poli-cies, structures, and technologies; it presented the experiences of transit agencies inselecting and using various approaches, as well as the advantages and disadvantages ofemerging payment technologies. Subsequently, TCRP Report 32, Multipurpose Tran-sit Payment Media, published in 1998, further examined the role of emerging tech-nologies, with a focus on the use of smart cards in “multipurpose” payment programs.TCRP Report 32 included various institutional, financial, technological, legal, and customer-related issues associated with linking a transit agency’s payments with thoseof other transit agencies, nontransit modes (e.g., tolls, parking), and nontransportationentities (e.g., financial institutions, telecommunications companies, universities, andgovernment agencies).
In the years since publication of TCRP Reports 10 and 32, there have been furtheradvances in development and use of emerging technologies—including both magneticstripe and smart cards—and concomitant changes in fare policies and structures. Anumber of the innovative programs identified in those reports as being in the concep-tual stage have now been implemented—or terminated, in some cases—and major newprojects have been initiated. Important lessons are now available that will aid agenciesconsidering the new technologies or pricing approaches.
This report provides updated information and guidance on the latest developmentsin the areas of fare policies, structures, and technologies.
Multisystems, Inc., in association with Mundle & Associates, Inc. and Simon &Simon Research and Associates, Inc., reviewed trends and developments of the past

few years related to fare structure/policy design and technological advancements. Theresearch team identified and described emerging types of fare-related initiatives andpartnerships, defined evaluation criteria and measures, and evaluated each type of pro-gram or initiative in terms of its impact on the agency’s customers and operations. Theresearch also included 13 case studies, covering a range of system sizes and modes andvarious types of fare structure and technology initiatives.

1 SUMMARY
PART I Overview
11 CHAPTER 1 Introduction and Research ApproachIntroduction, 11TCRP Project A-25 and Overview of the Final Report, 11
13 CHAPTER 2 Fare Policy and Structure Issues and TrendsIntroduction, 13Issues Influencing Fare Policy Decisions, 13Fare Structure Trends, 14Payment Options Facilitated by Electronic Fare Media, 21Trends in Type of Fare Collection, 23
26 CHAPTER 3 Fare Payment Technology DevelopmentsIntroduction, 26Magnetic Farecards, 26Smart Cards, 29Emerging Electronic Payment Applications, 39
48 CHAPTER 4 Emerging Fare-Related Issues and ProgramsIntroduction, 48Equity and Environmental Justice Issues, 48University Programs, 53Employer Benefits Programs, 59Access-to-Jobs Programs, 66
72 CHAPTER 5 Summary of FindingsIntroduction, 72Fare Policy and Structure Issues and Trends, 72Fare Payment Technology Developments, 73Emerging Fare-Related Issues and Programs, 77Concluding Remarks, 79
80 REFERENCES: Part I
PART II Case Studies
83 INTRODUCTION TO PART II
85 CASE STUDY 1: Akron Metropolitan Regional Transit Authority(Akron, OH)
90 CASE STUDY 2: Chapel Hill Transit (Chapel Hill, NC)
94 CASE STUDY 3: Chicago Transit Authority
110 CASE STUDY 4: Connecticut Transit
117 CASE STUDY 5: King County Metro Transit (Seattle, WA)
123 CASE STUDY 6: Maryland Mass Transit Administration (Baltimore, MD)
132 CASE STUDY 7: Metropolitan Transportation Commission (San Francisco Bay Area)
141 CASE STUDY 8: New Jersey Transit
147 CASE STUDY 9: Orange County Transportation Authority (Orange Co., CA)
153 CASE STUDY 10: TransitCenter (New York City)
160 CASE STUDY 11: Tri-County Metropolitan Transportation District (Portland, OR)
166 CASE STUDY 12: Ventura County Transportation Commission (Ventura Co., CA)
173 CASE STUDY 13: Washington Metropolitan Area Transit Authority
CONTENTS

184 REFERENCES: Part II
A-1 APPENDIX A: Bibliography
B-1 APPENDIX B: Key Study Resources
C-1 APPENDIX C: Estimation of Fare System Costs
D-1 APPENDIX D: Study Framework and Methodology

The overall goal of Transit Cooperative Research Program Project A-25 was to pro-vide transit agencies with guidance in making decisions related to fare policies, structuresand technologies. The research entailed a study of the trends and emerging developmentsin each of these areas and consisted of the following major elements:
• Comprehensive review of relevant literature and research findings to identify bothtrends and developments of the past few years and strategies now being consideredby transit agencies in areas related to fare structure and policy design and techno-logical advancements.
• Identification and description of emerging types of fare-related initiatives (e.g.,new payment options based on the use of electronic fare media) and partnerships(e.g., with universities, employers, and social service agencies).
• Development of an evaluation framework and methodology to facilitate the assess-ment of the various types of fare programs and initiatives; a set of evaluation cri-teria and measures was defined; and each type of program or initiative was evalu-ated to determine its impact on a transit agency’s customers and operations.
• Case studies of agencies that have recently put in place, or are in the process ofintroducing, various types of fare programs and initiatives. Thirteen case studieswere conducted, covering a range of system sizes and modes—as well as a rangeof fare technologies and structural characteristics:
(1) Akron Metropolitan Regional Transit Authority (Akron, OH)(2) Chapel Hill Transit (Chapel Hill, NC)(3) Chicago Transit Authority(4) Connecticut Transit (5) King County Metro Transit (Seattle, WA) (6) Maryland Mass Transit Administration (Baltimore, MD)(7) Metropolitan Transportation Commission (San Francisco Bay Area)(8) New Jersey Transit(9) Orange County Transportation Authority (Orange Co., CA)
(10) TransitCenter (New York City)(11) Tri-County Metropolitan Transportation District (Portland, OR)
SUMMARY
FARE POLICIES, STRUCTURES AND TECHNOLOGIES: UPDATE

(12) Ventura County Transportation Commission (Ventura Co., CA)(13) Washington Metropolitan Area Transit Authority
The key findings of the study are summarized below.
FARE POLICY AND STRUCTURE ISSUES AND TRENDS
• Transit agency fare levels are increasing. The basic single-ride peak fare hasincreased significantly in recent years, as evidenced by the fact that roughly a thirdof North American agencies had fares of $1 or more in 1994, while two-thirds ofthese agencies had reached this level in 2000; the most common fare in 1994 was$0.75 (20% of agencies), while in 2000 it was $1 (19%). In 2001, the $2 level wasreached by a couple of agencies. Although few agencies directly tie fare increasesto inflation rates, many agencies have more or less tracked inflation in makingmoderate fare increases. For instance, a $1 fare in 1994 would have risen to $1.15in 2000 if adjusted for inflation.
• The transit industry continues to favor simplified fare structures. Even with theavailability of electronic payment options, most agencies continue to utilize flatfare structures (i.e., with no fare zones or peak/off-peak differentials). The per-centages of agencies using fare differentials has actually declined in recent years,as several agencies have reduced the complexity of their fare structures (e.g., byeliminating or reducing the number of zones).
• A growing number of agencies has eliminated free or low-priced transfers in con-junction with the sale of 1-day passes on buses and in rail stations. There has alsobeen an increase in the use of short-term passes (i.e., 1- to 3-day) in general, bothfor visitors and regular riders.
• Agencies are introducing an increasingly broad range of payment options that seg-ment the market based on frequency of use and willingness to prepay. Most agen-cies now offer one or more types of unlimited-ride pass as well as some form of dis-counted multiride option. However, the percentage discounts—or bonuses—offeredwith multiride options (tickets, tokens or stored value farecards) has declined some-what in the past few years, with fewer agencies providing “deep discounts.”
FARE PAYMENT TECHNOLOGY DEVELOPMENTS
Influence of Electronic Payment on Fare Policy and Payment Options
• An increasing number of agencies are implementing electronic payment tech-nologies, and many of these agencies have selected—or are at least strongly considering—smart cards.
• Electronic payment technologies have facilitated a range of flexible new fare pay-ment options, including stored value or stored rides, “rolling” time-based passes(which are activated on first use), frequency-based discounts, automated transfersand fare differentials, guaranteed last ride (or “negative balance”) policies, andguaranteed lowest fare strategies.
• The introduction of electronic payment has significantly influenced the basic farestructure for some agencies, but most agencies have simply increased the range ofpayment options offered without making significant changes in the basic farestructure.
2

3
Issues Associated with Use of Smart Cards
• The decision to use contactless—or sometimes dual interface—smart cards forfare collection has grown rapidly in the past several years. In the United States,smart cards are currently in use in half a dozen locations, and more than a dozenother programs are in the planning stages. Abroad, large regional programs are inplace or are being implemented in most world capitals.
• One of the key concerns regarding smart card use is the high cost of the cards them-selves. Some agencies have sought to encourage retention of the cards—and tocover their purchase cost—by levying a card issuance charge (e.g., $5); this chargetypically allows the cardholder to register the card with the agency and receive bal-ance protection in the case of loss of the card. Other strategies for addressing highcard costs include the development of (1) low-priced paper contactless tickets tar-geted for distribution to one-time or occasional riders, and (2) recycling systemsdesigned to capture the smart card (or smart “token” in one system) after it hasbeen used.
• One of the major concerns within the transit industry has been how to promotestandardization and interoperability among the different contactless card tech-nologies. Vendors have begun to address this issue by developing cards and read-ers that combine multiple card interfaces. From the agency side, there are severalefforts underway, in the United States and abroad, to establish industry-wide stan-dards or guidelines for transit smart card applications.
• In light of interoperability concerns, a major technical issue/constraint facing allof the agencies seeking to add smart card capability to an existing fare collectionsystem is insuring compatibility with the existing system. Integrating one vendor’ssmart card system into another vendor’s equipment has proven to be a significantchallenge.
• Using electronic fare media in a proof-of-payment (POP) system requires specialprocedures and equipment. Electronic farecards cannot be directly used in a POPenvironment, since POP requires the rider to display a validated ticket or a flashpass to a fare inspector. Thus, in a POP system, the rider must validate the cardand the inspector must be able to check the validity of the card. The most commonapproach being implemented in U.S. systems is to provide in-station card pro-cessing units and to have the inspectors carry hand-held card readers.
Development of Regional Fare Integration Programs
• Electronic payment media are increasingly being introduced to serve multiple tran-sit agencies in a region—i.e., to facilitate seamless travel using a single farecard.Use of electronic fare media allows each agency to retain its own fare structurewhile accepting a regional farecard (e.g., with payments made from a commonstored value purse). In a smart card-based system, a customer would presumablyalso be able to load individual payment options (e.g., a pass) from one or moreagencies onto the same card.
• Integrating multiple agencies has been shown to be a complicated undertaking,likely requiring fundamental changes from the way each individual agency man-ages fare collection on its own. Complex partnership agreements are typicallyneeded to establish responsibilities, ownership, and allocation of costs and rev-enues. A separate clearinghouse or back-end payment settlement system can bedeveloped to manage these processes, but all participating agencies must reachagreement on revenue management policies and procedures.

Potential for Developing Multiapplication Programs
• The growing use of smart cards for various types of uses (e.g., electronic toll collection, parking, financial services, mobile commerce, loyalty programs, andidentification/access/security) provides opportunities to combine transit and otherapplications on one card. While most smart card programs focus on a single appli-cation, the goal of many issuers is to ultimately provide multiple functions on a card.
• Transit fare payment is increasingly seen as a key application, regardless of the pri-mary use and issuer of the card. Thus, a broad range of new types of transit agencypartnerships can now be considered with entities that would issue a smart card,accept one for payment of their goods and services, or both. A number of U.S. agen-cies are already testing—or at least plan on pursuing—multiapplication arrange-ments, and several transit smart card projects abroad have established multiappli-cation arrangements. Moreover, the recent announcements by Visa and MasterCardof tests of contactless credit/debit applications could further pave the way for tran-sit’s participation in multiapplication partnerships.
Benefits and Impacts of Electronic Payment Programs
• Electronic payment programs have been shown to benefit both agencies and theircustomers. Some of these benefits result from an agency implementing electronicpayment in general (i.e., magnetic or smart card), while others can be attributedspecifically to use of smart cards.
• Electronic payment programs in general provide customers more convenience anda greater variety of payment options, such as rolling activate-on first use passesand stored-value/stored-ride farecards.
• The major customer benefits related to use of smart cards include (1) the avail-ability of features such as registration/balance protection, autoload, and negativebalance; (2) the ability to use the same card with multiple agencies (if available);and (3) the improved convenience of the contactless interface (i.e., the card doesnot have to be removed from a wallet or purse). Other potential benefits of smartcards for customers include multiapplication capabilities and innovative fare struc-ture options (e.g., a frequency-based discount or guaranteed lowest fare strategy).
• Besides facilitating the implementation of a greater range of fare options for cus-tomers, electronic payment systems in general have been shown to have the fol-lowing benefits to agencies: allowing agencies to more carefully track ridership andrevenue impacts of different fare initiatives; reducing the use of cash for fare pay-ment; reducing fare collection costs associated with producing/selling/distributingfixed-calendar period passes; reducing opportunities for fare abuse and evasion;reducing operator requirements for administering fare collection; and reducing theextent of rider-operator confrontations regarding the validity of passes and transfers.
• With regard to overall cost impacts, though, agencies implementing electronicpayment systems have typically found that there are invariably new costs associ-ated with introducing the new technology. Thus, while certain expenses should belowered, implementation of an electronic payment system will not necessarilyresult in an overall reduction of fare collection costs.
• Beyond the above benefits linked to electronic payment in general, there are anumber of benefits associated with introducing contactless smart cards, includingfaster boarding or throughput than fare media that have to be inserted or swiped;lower maintenance requirements than magnetic card readers (since the contact-
4

5
less units are sealed and have no moving parts); facilitation of innovative types offare options; and potential to use data on card usage to improve service planning.
• The cost to an agency associated with smart card implementation and operationwill depend on the specific nature of the program. An agency may have to pay allof the capital costs, or these costs may be partially covered by the initiating agencyin a regional program. In any type of regional system, however, the individualagencies will have to cover at least some operating costs on their own (i.e., relatedto such areas as administration, reporting, and equipment maintenance). More-over, each agency will ultimately have to pay for clearinghouse and support ser-vices associated with such activities as card management and revenue allocation;such payments may be in the form of a fee per smart card transaction or on a per-centage of smart card-based fare revenue.
• Where an agency is participating in a regional smart card program, the costs relatedto the new system are likely to add to, rather than replace, the agency’s existingfare collection costs. For this reason, those agencies that have developed smartcard systems in particular tend to view them primarily as a means of better serv-ing their customers—and, hopefully, attracting new customers—while also improv-ing revenue management.
EMERGING FARE-RELATED ISSUES AND PROGRAMS
Equity and Environmental Justice Issues
• Environmental justice initiatives to insure that all population segments receive fairtreatment are increasingly affecting transit agencies’ consideration of potentialfare changes. Such initiatives have resulted in legal challenges to proposed fareincreases in several cities; moreover, even where such challenges have not provensuccessful—or have not actually entered the courts—they have influenced the farepolicy decision-making process.
• In some cases, equity-based challenges have resulted in modifications to fare pro-posals or legal restrictions on future changes. In others, they have merely requiredthe agencies to go to great lengths to explain and defend their rationale for raisingfares. Moreover, because of such challenges, many transit agencies, especiallythose in other large cities, feel that they must now pay greater attention to equityconcerns in considering possible fare changes.
University Programs
• Many universities have established partnerships with the local transit agencies toprovide specially priced passes or other payment options to students. The basic typesof programs include special pass and unlimited-access programs; special reducedsingle-fare arrangements; and joint transit agency–university farecard programs.
• By providing a low-cost and convenient form of transit payment to the universitycommunity, the transit agency should see increased ridership, while building “brandloyalty” to the transit system in terms of likely future use by students. Meanwhile,the university may be able to ease on-campus parking requirements by shiftingsome drivers to transit.
• It is important to carefully design the pricing parameters of a university pass pro-gram so as to minimize the potential negative revenue impact on the agency. In par-ticular, an agreement should be structured so that it allows the agency to increasethe amount paid per person based on actual usage.

Employer Benefits Programs
• Transit agencies have long pursued partnerships with employers to facilitate, if notsubsidize, employees’ use of transit to commute to and from work. These part-nerships were originally limited to the distribution of monthly passes by employ-ers to employees. The programs subsequently became more flexible with the intro-duction of transit vouchers that the employees could use to acquire the transitpayment option of their choice. These basic approaches have since evolved, fueledboth by a steady increase in the tax-free transit benefit employees could receiveand the emergence of electronic payment technologies. Key types of employer-oriented benefit programs now in place include annual pass programs, transitvoucher programs, and automated benefits distribution programs.
• Employer pass and voucher programs have been shown to benefit employees,employers, and transit agencies. The simpler—and less costly—it is for an employerto administer such a program, the more likely it is for an employer to participatein it. Similarly, the more convenient it is for employees to take advantage of com-muter benefits, the more likely it is that they will use transit to get to and fromwork. Annual pass programs have made participation convenient for both employ-ers and employees. However, it is important in establishing these programs thattransit agencies structure pricing in such a way that they protect themselves againstlosing revenue; the pricing should be able to capture at least some revenue fromthe new trips being generated.
• In voucher-type programs, the direct provision of farecards and the emergingautomation of benefits distribution are also greatly improving the convenience forall parties. As the use of electronic payment options spreads, more and more agen-cies will be able to offer such mechanisms within their regions, thereby expand-ing the range of options available.
Access-to-Jobs Programs
• Addressing welfare-to-work transportation issues has required creation of newcollaborations among public agencies and private organizations, establishment ofnew transportation services, and development of innovative funding strategies.However, an important element of all access-to-jobs programs has been the pro-vision of a mechanism for individuals to pay for these services, in terms of bothsubsidizing travel and furnishing the actual payment media. This has resulted invarious types of special transit payment arrangements. The use of electronic pay-ment media has also been proposed as a means of improving these arrangements.
• Access-to-jobs partnerships have been shown to benefit eligible riders by provid-ing affordable access to employment and training sites. However, since these pro-grams often involve participation by a number of different entities, it is importantthat the participants clearly understand—and be sensitive to—each other’s goalsand concerns in developing and implementing the program.
In summary, transit agencies have, in recent years, increasingly considered fare policyand fare structure changes and new payment options that target the needs of specificuser groups and make use of emerging subsidy arrangements—while at the same timeaddressing local concerns pressed by community and environmental groups. In gen-eral, agencies have had to broaden the context in which they considered fare-relatedinitiatives, and, consequently, they have sought to take greater advantage of opportu-nities to participate in new types of partnerships and funding programs linked to spe-
6

7
cific market segments (e.g., university, employer, and access-to-jobs programs). At thesame time, the expanded capabilities of electronic payment technologies (i.e., magneticstripe farecards and smart cards) have benefited agencies by facilitating the provisionof a range of flexible payment options and increasing the efficiency of methods for dis-tributing transit benefits and fare media to customers. Electronic fare media have alsofacilitated development of the aforementioned types of partnerships and have provideda framework for regional multiagency fare integration. All of these initiatives promiseto aid transit agencies in better serving their existing markets while also attracting newriders.

PART I:OVERVIEW

11
CHAPTER 1
INTRODUCTION AND RESEARCH APPROACH
INTRODUCTION
Transit agencies have begun, over the last several years,to develop and implement fare policies, structural changes,and new payment technologies and payment options intendedto target the needs of specific user groups, types of travel,subsidy arrangements, and environmental issues. Respond-ing to the demands of specific market segments and com-munity groups (e.g., low income riders and environmentalactivists), as well as to opportunities to participate in newtypes of partnerships and funding programs (e.g., related touniversity programs and to access-to-jobs and other bene-fits programs), agencies have had to broaden the context inwhich they consider fare structure and fare collection changesbeyond the traditional set of policy goals (e.g., increase rid-ership, increase revenue, maximize convenience, minimizefare evasion).
Meanwhile, the continued evolution and increasingly wide-spread usage of electronic payment technologies has facili-tated the above types of efforts by making possible a greaterrange of payment options and offering a more efficient meansof distributing transit benefits and fare media. Electronic pay-ment, particularly in the form of smart cards, is also support-ing such strategies as regional fare integration and partner-ships with nontransit entities (e.g., parking authorities, tolloperators, financial institutions, universities, employers, andsocial service agencies). These multiapplication initiativesoffer the potential to improve transit’s market penetration byincreasing the convenience of using transit and the establish-ment of loyalty programs; these new partnerships may alsooffer the opportunity to share administrative costs and, pos-sibly, generate new revenues for the transit operator.
TCRP Report 10, Fare Policies, Structures and Technolo-gies, published in 1996 (1), studied the state of the art of devel-opments in each of these fare system components and exploredthe interrelationships among the parameters. TCRP Report 32,Multipurpose Transit Payment Media, published in 1998(2), focused specifically on the decisions necessary in devel-oping and implementing multiapplication smart card pro-grams. However, as Automatic Fare Collection (AFC) hascontinued to expand the potential roles of, and opportunitiesfor, fare payment, it has further magnified the need for transitagencies to understand the relationships among fare policy,
structure, and technology. At the same time, the parallelgrowth of social, environmental, and political influences hasfurther complicated these relationships.
TCRP PROJECT A-25 AND OVERVIEW OF THEFINAL REPORT
In light of the above trends and developments, it was feltthat an update of the findings of the two previous studies waswarranted. TCRP Project A-25, Fare Policies, Structures andTechnologies: Update, was therefore initiated with the over-all goal of revisiting these fare system parameters and theirinterrelationships. The resulting study provides a compilationand distillation of lessons learned regarding the implementa-tion and application of emerging fare policies, structures, andtechnologies.
The chapters of the report are as follows:
• Chapter 2: Fare Policy and Structure Issues andTrends. This chapter reviews trends and developmentsof the past few years in areas related to fare policy andstructure decisions.
• Chapter 3: Fare Payment Technology Developments.This chapter reviews trends and developments related toelectronic fare payment technologies (i.e., magnetic fare-cards and smart cards); the chapter includes a review ofemerging electronic payment applications (e.g., regionalpayment integration and multiapplication programs).
• Chapter 4: Emerging Fare-Related Issues and Pro-grams. This chapter discusses emerging fare-relatedissues (e.g., related to equity and environmental justiceconcerns) and partnership opportunities (e.g., with socialservice agencies, employers, and universities).
• Chapter 5: Summary of Findings. This chapter sum-marizes the key findings of the research.
The appendices provide additional information as fol-lows: bibliography; summary of key study resources; guid-ance on the estimation of fare system costs; the process andpreliminary results of the evaluation of the various types offare initiatives; and the process followed in identifying and
12
conducting the case studies, as well as the reports for each ofthe case studies.
(1) Akron Metropolitan Regional Transit Authority(Akron, OH)
(2) Chapel Hill Transit (Chapel Hill, NC)(3) Chicago Transit Authority(4) Connecticut Transit (5) King County Metro Transit (Seattle, WA) (6) Maryland Mass Transit Administration (Baltimore,
MD)
(7) Metropolitan Transportation Commission (San Fran-cisco Bay Area)
(8) New Jersey Transit(9) Orange County Transportation Authority (Orange
Co., CA)(10) TransitCenter (New York City)(11) Tri-County Metropolitan Transportation District
(Portland, OR)(12) Ventura County Transportation Commission (Ventura
Co., CA)(13) Washington Metropolitan Area Transit Authority

13
CHAPTER 2
FARE POLICY AND STRUCTURE ISSUES AND TRENDS
INTRODUCTION
As explained in TCRP Report 10, the primary parametersof a transit agency’s fare system—policy, structure, and tech-nology—are closely interrelated: “Policy generally sets thedirection for the strategy and specific structure, but technol-ogy choices can also affect the structure selected (1).” Thus,it is important to review the issues and trends associated witheach of these parameters.
ISSUES INFLUENCING FARE POLICYDECISIONS
General Policy Factors
“A transit agency’s fare policy establishes the principlesand goals underlying and guiding the agency’s pricing-relateddecisions” (1). While some agencies establish formal farepolicies that govern fare-related decisions, most agencies’fare system changes are made in response to a particular issueor problem (e.g., a revenue shortfall or, possibly, introductionof a new mode). Report 10 noted that, according to the Amer-ican Public Transportation Association (APTA), only 3% ofrespondents to the 1994 APTA Fare Summary reported thatthey make fare changes on a regularly scheduled basis; theremaining 97% reportedly make fare changes only “as needed”(1). According to a more recent survey (1998) (3), more thanhalf of transit agencies have a regular fare review process,although “unexpected revenue shortfall,” “major route/servicerestructuring,” and “installation of new technology” are alsosignificant triggers for reviewing the fare structure; the resultsof this survey question are summarized in Table 2-1.
As indicated in Table 2-1, a mandated fare recovery ratiotriggers a fare review at just under a quarter of the respond-ing agencies. Table 2-2 presents the incidence of fare recov-ery ratio requirements and goals as reported in the 2000 APTAFare Summary. As shown in Table 2-2, roughly equal num-bers of agencies have fare recovery requirements and goals,although nearly 60% of agencies report that they have nei-ther. Compared to the 1994 APTA figures, the percentage ofagencies having fare recovery requirements is roughly thesame; however, the percentage reporting fare recovery goalshas increased from 15% in 1994 to 24% in 2000. Thus, a grow-ing number of agency governing bodies are at least estab-
lishing fare revenue targets for their agencies, if not going sofar as to mandate specific levels.
Emerging Factors and Issues
While most agencies continue to initiate fare structurechanges primarily in response to specific problems (e.g., rev-enue shortfalls, declining ridership, or introduction of newmodes of service), fare policy and pricing initiatives have beenincreasingly influenced by developments related to a range ofissues and opportunities for new types of partnerships and pay-ment options. Key issues and emerging developments relatedto fare policy and pricing include the following:
• Equity and environmental justice concerns. Themovement to insure that all population segments—particularly low income and minority groups—receiveequal treatment with regard to environmental issues isincreasingly encompassing the fare decision-makingprocess. This has led to concerted opposition to (and insome cases legal action against) proposed fareincreases. Such actions have resulted in the “ConsentDecree” in Los Angeles, for instance, that has legallylimited the extent to which the LACMTA can raise faresfor a specified period of time.
• New programs and partnership opportunities. Pro-grams such as the following are presenting transit agen-cies with new pricing partnership opportunities: – Partnerships with other entities and programs.
Social service agencies (for access-to-jobs and otherbenefits programs), employers, and universities areincreasingly establishing partnerships with local tran-sit agencies to provide low-priced passes or other spe-cial payment arrangements.
– Multiapplication programs. The introduction ofsmart cards presents opportunities to establish pay-ment partnerships with other nontransit entities (e.g.,parking authorities, toll operators, financial institu-tions, retailers and government agencies).
– Focus on providing for “seamless travel.” Withtravel patterns increasingly requiring transferringbetween adjoining transit agencies’ services, there hasbeen a growing emphasis on the development of

14
multiagency agreements and integrated regional pay-ment arrangements.
Thus, while pricing level decisions are increasingly beinginfluenced by political and equity concerns, transit agenciesare also focusing more and more on meeting the needs of par-ticular market segments through partnerships and specialpayment and pricing arrangements. The result has typicallybeen the establishment of such options as special low-pricedpasses—or full-price passes subsidized by another entity(e.g., social service agency, university, or employer). Exam-ples of the types of fare initiatives associated with the aboveissues and programs are discussed in the remainder of thisreport.
With regard to regional fare integration, agencies operatingin the same region are moving from simple interagency trans-fer agreements to more comprehensive integrated regionalpayment options. As indicated in Table 2-3, a significantnumber of agencies currently have some type of joint passarrangement with at least one other agency. In other cases,
agencies have transfer—or fare upgrade—provisions withagencies with which they intersect; in other words, Agency 1accepts a transfer from someone coming from Agency 2, orelse charges only the difference between the two base fares.(It must be kept in mind that many agencies operate in regionsin which they are the only transit provider; these agencieswould not be candidates for any type of multiagency arrange-ment.) The emergence of electronic payment options, partic-ularly smart cards, has facilitated the increasing focus onintegrated multiagency payment systems—i.e., introducing aregional farecard that is accepted at any participating agency.This trend is discussed further in the next chapter, Fare Pay-ment Technology Developments.
FARE STRUCTURE TRENDS
As explained in TCRP Report 10, the fare structure consistsof three basic elements: fare strategy, payment options, andpricing levels. Fare strategy refers to the general type of fare
TABLE 2-1 Triggers for agency fare structure review process
Action/Event Number of Agencies Percentage of Total
Regular review process 37 53*
Unexpected revenue shortfall 35 50
Major route/service restructuring 24 34
Installation of new technology 20 29
Mandated fare recovery ratio 16 23
Addition of new type of service (e.g., LRT) 16 23
Other short-term "crisis" 16 23
SOURCE: Survey of agencies in Multisystems, Transit Fare Collection Decision Models for Fare Policy and Cost Analysis—Final Report, for U.S. DOT/SBIR Program, November 1998.*Respondents were allowed to select more than one option; thus, total does not add to 100%.
TABLE 2-2 Fare recovery ratio requirements and goals
Type of System
Number of Systems
Systems With
Required Fare
Recovery Ratio
Mean Ratio To
Be Recovered
Systems With Fare Recovery
Ratio Goal
Mean Ratio To Be Recovered
Systems With No
Goal or Requirement
Bus 251 50 32% 55 32% 146
Heavy rail 15 5 43% 4 51% 6
Light rail 22 7 37% 7 41% 8
Commuter 18 6 46% 6 39% 6 rail
SOURCE: 2000 APTA Transit Fare Summary, 2000.

15
collection and payment approach (i.e., flat versus differenti-ated fares) and to the transfer pricing and policy; differentiatedfares include zonal charges, peak/off-peak differentials, andexpress or rail surcharges. Payment options include cash,period pass, single or multiride tickets or tokens, and stored-value/ride farecard. The final piece of the fare structure is theactual pricing levels of each payment option, including per-centage discounts (if any) for prepaid options. Trends in eachof these areas are reviewed below.
Trends in Fare Levels
Although it is often paid by a relatively small percentageof an agency’s riders, the peak period full fare (commonlyknown as the “base fare”) is typically the most visible andmost often criticized (e.g., by politicians and communitygroups) element of an agency’s fare structure. Table 2-4shows the changes in base fare levels between 1994 and 2000for North American transit systems, as reported in the APTATransit Fare Summary. As would be expected, fares haveincreased somewhat during this period. Whereas 64% of theagencies reported base fares under $1 in 1994, that percentagedropped to 36% by 2000; the most common fare was $0.75 in
1994, but rose to $1 in 2000. In 2000, 22% of agencies hadfares of $1.25 or more, double the percentage in 1994. Per-haps most significantly, in 2001, two agencies (MTDB in SanDiego and SEPTA in Philadelphia) became the first to raisethe base fare (for noncommuter rail service) to $2—andNYMTA followed suit with its decision to increase its basesubway and bus fare to $2 in early 2003. MTDB subsequentlyannounced its intention to move to a $2.25 fare in 2003.
The increase in organized opposition to fare increases,coupled with a general preference to keep fares low, has ledmany agencies to keep fares at the same level for as long aspossible (i.e., until a serious revenue shortfall requires achange). At this point, very few agencies have programmedregular fare increases (e.g., X% every two or three years, oras necessary to keep pace with inflation). As indicated ear-lier, some agencies do undertake regular reviews of their farestructures, but these reviews apparently seldom result in any-thing other than very minor fare structure modifications.
Of course, in considering fare levels, it is instructive toexamine the extent to which they have kept pace with infla-tion. Table 2-5 shows what 1994 fare levels would havebeen in 2000 if allowed to rise according to inflation (basedon the national Consumer Price Index). Thus, for instance,an increase of the base fare from $1 (1994) to $1.15 (2000)
TABLE 2-3 Multiagency fare arrangements
Reduced Arrangement with 1 Other Agency Type of Number of Multiagency 1-month 2-week 1-week System Systems Regional Pass pass pass pass Other*
Bus 251 42 51 14 14 36 Heavy rail 15 1 4 4 3 3 Light rail 22 5 7 3 3 5 Commuter rail
18 4 13 3 1 5
SOURCE: 2000 APTA Transit Fare Summary, 2000.
* Other arrangements include annual pass, stored value card, 10-ride card, and 1- to 4-day passes.
TABLE 2-4 Changes in base fare levels, 1994–2000
Number of <$0.50 $0.50 $0.51 -- $0.75 $0.76 -- $1.00 $1.01 -- $1.25 -- $1.50 >$1.50
Type of Systems $0.74 $0.99 $1.24 $1.49
System 94 00 94 00 94 00 94 00 94 00 94 00 94 00 94 00 94 00 94 00 94 00
Bus 293 249 13 5 40 14 35 10 60 48 40 13 57 91 15 12 20 33 7 12 6 11
Heavy rail 15 15 1 1 2 2 3 2 4 5 3 4 2 1
Light rail 18 22 1 1 3 6 6 2 3 3 9 3 3 1
Commuter 18 18 2 1 1 3 1 1 1 13
rail
SOURCE: 1994 APTA Transit Fare Summary, 1994, and 2000 APTA Transit Fare Summary, 2000.

16
seen as able to generate greater revenues than lower flat fares,since the users of the higher-cost services (e.g., longer dis-tance) have often been found to be less price-sensitive thanthose using the lower-cost services.
Table 2-6 compares the incidence of fare differentials in2000 to that in 1994, the year of the data reported in TCRPReport 10. The percentage of agencies using any of the threebasic types of differentiation has declined since 1994 with theexception of light rail systems, which show a slight increasein both zonal pricing and peak/off-peak differential; mostcommuter rail systems continue to use zonal rather than flatfare structures—and this mode also has by far the highestincidence of time of day differentials. Thus, despite argu-ments such as those cited above, most agencies have contin-ued to display a preference for the simplicity of flat fares. Asnoted in TCRP Report 10, “Transit agencies by and largesimply do not seem willing to address the complexities asso-ciated with designing, implementing, administering, and mar-keting” distance-based/zonal strategies (1). In fact, severalagencies have sought to simplify their fare structures in recentyears by eliminating or reducing the number of zones (e.g.,in Baltimore, in Norfolk, in Raleigh-Durham, in severaltowns in Connecticut, throughout Delaware, and on buses inWashington, DC) or removing peak/off-peak differentials(e.g., has been proposed in Denver). The impacts of fare sim-plification efforts at two agencies (Maryland MTA and Con-necticut Transit) were considered as part of the case studiesfor this project.
Transfer Pricing and Policy
The other key fare strategy element is transfer pricing andpolicy. Many systems are designed so as to require many rid-ers to transfer either between bus routes or between bus andrail; thus, the pricing, rules, and policy regarding transfers arefundamental aspects of an agency’s fare structure. While obvi-ously important for riders, transfer pricing and rules also rep-resent major issues for operators, as there can be disagree-ments as to the validity of a transfer on a particular route at aparticular time. Many agencies have also experienced prob-
would simply be tracking the overall inflation trend. Thus,while very few agencies directly tie fare increases to inflationrates, many agencies are more or less adjusting for inflationwhen they make moderate fare increases.
Fare Strategy Trends
Flat versus Differentiated Fares
Basic fare strategies fall into two general categories: flatand differentiated. In a flat fare structure, riders are chargedthe same fare, regardless of the length of the trip, time of day,speed, or quality of service. Alternatively, fares can be dif-ferentiated by one or more of those parameters, resulting indistance-based or zonal fares, time-based (e.g., peak/off-peak)differential, and/or service-based differential (e.g., expresssurcharge or bus-rail differential). Each of these approacheshas certain advantages and disadvantages, mainly related torelative ease of use and administration versus impact on rid-ership and revenue; however, the principal arguments infavor of differentiation have focused on issues related to effi-ciency and equity. In particular, it has been argued that ahigher fare should be charged to cover the higher operatingcosts associated with serving longer trips, operating peakperiod service and providing premium service, such as expressbus or rail; otherwise, the users of the higher-cost services areeffectively cross-subsidized by the users of shorter-distance,off-peak, or local bus services. Differentiated fares are also
TABLE 2-5 Inflation-adjustedfare levels
1994 Fare Level
1994 Fare Level in 2000,
Adjusted for Inflation
$0.25 $0.29 0.50 0.57 0.75 0.86 1.00 1.15 1.25 1.44 1.50 1.73 1.75 2.03
TABLE 2-6 Incidence of fare differentials: 1994–2000
Percent of Total Percent of Total Percent of Total with Zonal or with Time of with Express
Type of Distance Fare Day Differential Surcharge System 2000 1994 2000 1994 2000 1994
Bus 30 37 4 6 23 27 Heavy rail 20 33 7 7 0 7 Light rail 27 21 14 11 5 5 Commuter rail 89 94 28 24 0 0
SOURCE: 1994 APTA Transit Fare Summary, 1994, and 2000 APTA Transit Fare Summary, 2000.
lems related to theft or fraudulent resale of transfers. There isthus a tradeoff between the convenience of a free or low-pricedtransfer for the passenger and the foregone revenue and otheradministrative issues for the operator. For a more detaileddiscussion of the issues associated with transfer practices, seeR. Stern, TCRP Synthesis of Transit Practice 19, PassengerTransfer System Review (4).
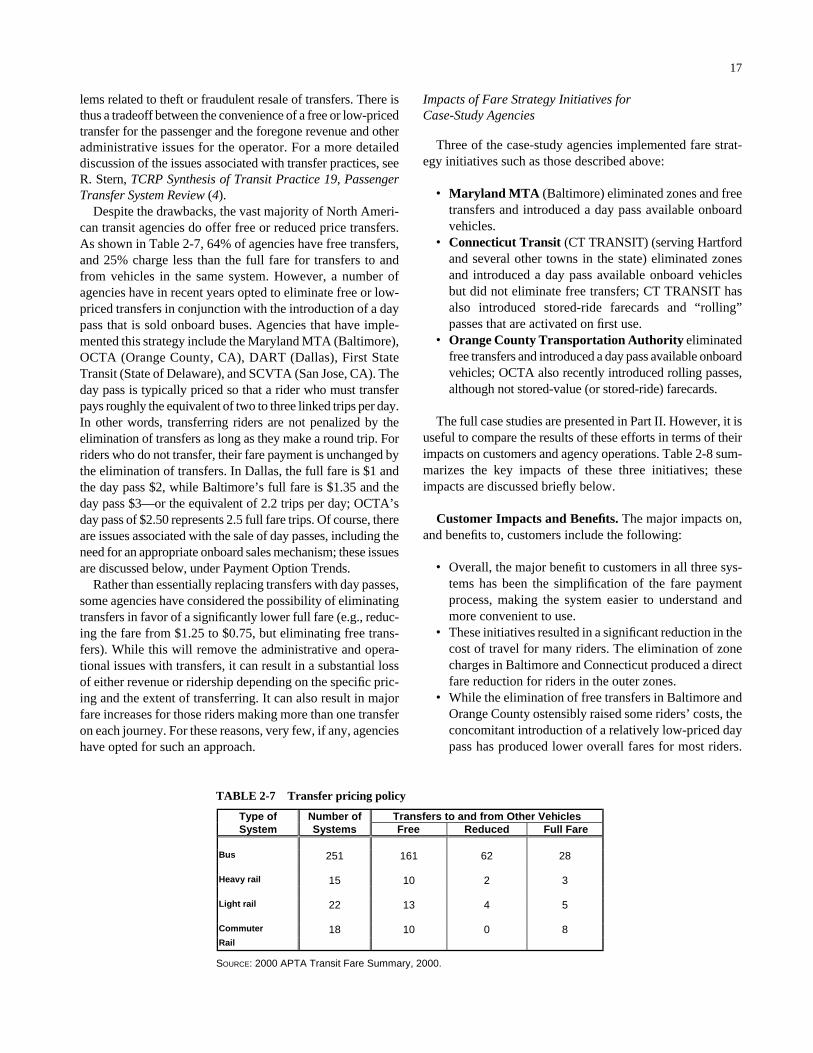
Despite the drawbacks, the vast majority of North Ameri-can transit agencies do offer free or reduced price transfers.As shown in Table 2-7, 64% of agencies have free transfers,and 25% charge less than the full fare for transfers to andfrom vehicles in the same system. However, a number ofagencies have in recent years opted to eliminate free or low-priced transfers in conjunction with the introduction of a daypass that is sold onboard buses. Agencies that have imple-mented this strategy include the Maryland MTA (Baltimore),OCTA (Orange County, CA), DART (Dallas), First StateTransit (State of Delaware), and SCVTA (San Jose, CA). Theday pass is typically priced so that a rider who must transferpays roughly the equivalent of two to three linked trips per day.In other words, transferring riders are not penalized by theelimination of transfers as long as they make a round trip. Forriders who do not transfer, their fare payment is unchanged bythe elimination of transfers. In Dallas, the full fare is $1 andthe day pass $2, while Baltimore’s full fare is $1.35 and theday pass $3—or the equivalent of 2.2 trips per day; OCTA’sday pass of $2.50 represents 2.5 full fare trips. Of course, thereare issues associated with the sale of day passes, including theneed for an appropriate onboard sales mechanism; these issuesare discussed below, under Payment Option Trends.
Rather than essentially replacing transfers with day passes,some agencies have considered the possibility of eliminatingtransfers in favor of a significantly lower full fare (e.g., reduc-ing the fare from $1.25 to $0.75, but eliminating free trans-fers). While this will remove the administrative and opera-tional issues with transfers, it can result in a substantial lossof either revenue or ridership depending on the specific pric-ing and the extent of transferring. It can also result in majorfare increases for those riders making more than one transferon each journey. For these reasons, very few, if any, agencieshave opted for such an approach.
17
Impacts of Fare Strategy Initiatives for Case-Study Agencies
Three of the case-study agencies implemented fare strat-egy initiatives such as those described above:
• Maryland MTA (Baltimore) eliminated zones and freetransfers and introduced a day pass available onboardvehicles.
• Connecticut Transit (CT TRANSIT) (serving Hartfordand several other towns in the state) eliminated zonesand introduced a day pass available onboard vehiclesbut did not eliminate free transfers; CT TRANSIT hasalso introduced stored-ride farecards and “rolling”passes that are activated on first use.
• Orange County Transportation Authority eliminatedfree transfers and introduced a day pass available onboardvehicles; OCTA also recently introduced rolling passes,although not stored-value (or stored-ride) farecards.
The full case studies are presented in Part II. However, it isuseful to compare the results of these efforts in terms of theirimpacts on customers and agency operations. Table 2-8 sum-marizes the key impacts of these three initiatives; theseimpacts are discussed briefly below.
Customer Impacts and Benefits. The major impacts on,and benefits to, customers include the following:
• Overall, the major benefit to customers in all three sys-tems has been the simplification of the fare paymentprocess, making the system easier to understand andmore convenient to use.
• These initiatives resulted in a significant reduction in thecost of travel for many riders. The elimination of zonecharges in Baltimore and Connecticut produced a directfare reduction for riders in the outer zones.
• While the elimination of free transfers in Baltimore andOrange County ostensibly raised some riders’ costs, theconcomitant introduction of a relatively low-priced daypass has produced lower overall fares for most riders.
TABLE 2-7 Transfer pricing policy
Type of Number of Transfers to and from Other Vehicles System Systems Free Reduced Full Fare
Bus 251 161 62 28
Heavy rail 15 10 2 3
Light rail 22 13 4 5
Commuter 18 10 0 8 Rail
SOURCE: 2000 APTA Transit Fare Summary, 2000.

18
TABLE 2-8 Case study comparison: fare strategy initiatives
Case-Study Agency/ Type of Program (Year Initiated)
Maryland MTA (Baltimore)/ Eliminated Zones/Transfers (1996)
Connecticut Transit (CT)/ Eliminated Zones (1996)
OCTA (Orange Co., CA)/ Eliminated Transfers (1999)
Nature of Program
Eliminated zones and transfers; introduced day pass (sold onboard)
Eliminated zones, introduced day pass (sold onboard) &
rolling passes
Eliminated free transfers, introduced day pass (sold onboard) & rolling passes
Transit Agency Goals of Program
Simplify fare structure, increase ridership and revenue
Simplify fare structure, increase ridership, reduce operator
requirements
Reduce transfer abuse and rider-operator conflicts
Customer Impacts and Benefits
Usage rates Day pass used 4 times/day Day pass used 4.25 times/day Day pass used 4.6 times/day at $2.50, 4 at $2
Attitude toward program/other benefits
System easier to understand and use; improved convenience with
onboard sale of Day Pass
System easier to understand; more convenient with day pass, rolling passes; seamless travel through use of same card on all
CT systems in state
Improved convenience with onboard sale of day pass and
rolling passes
Cost of travel Riders in outlying zones had fare reductions as high as 40%. Elim. of
$.10 transfers offset by $3 Day Pass
Reduced cost in outer zones; low priced day pass ($2.50)
Reduced cost for many with day pass
Agency Impacts and Benefits Ridership Ridership grew by 6% after
change; demand has continued to grow since then
Ridership fell by <1% in first year, but then returned to
prechange; steady since then
Ridership has grown signif. since change, but change
unlikely a key factor Revenue Revenue grew by >12% after
change; revenue hasn’t grown since then (due to heavy use of
Day Pass)
Revenue fell by 2% in first year, has fallen somewhat since (due
to heavier use of passes)
Revenue grew by 17% after elimination of transfers, then
by 6% after day pass increase
Other Impacts/Benefits Reduced fare disputes with operators, reduced evening
boarding times
Reduced operator requirements regarding zones; reduced use
of cash and fare collection costs
Reduced operator requirements, fare disputes;
and use of cash Liability to agency Economic liability Risk of revenue loss with
elimination of zones, but elimination of transfers and sale of Day Pass offset possible loss. Also some risk of abuse of Day Passes,
but no evidence of this
Risk of revenue loss with elimination of zones, but
minimal loss (due to range of new options and fact that most
riders were Zone 1)
Risk of revenue loss with introduction of day passes
(due to lack of controls initially); shift to electronic distribution has improved
controls Political/legal liability Possibility of complaints regarding
elimination of transfers, but introduction of Day Pass (priced at
2.2 trips) offset opposition
None Possibility of complaints regarding elimination of
transfers, but introduction of day pass (priced at 2.5 trips)
offset opposition Constraints and Barriers Technical Requires day pass issuers Issues regarding confusion over
purchase of day pass on bus. Rolling passes require
Automatic Fare Collection
Problem regarding controls over distribution of day
passes addressed with new equipment
Institutional/Funding Intensive outreach/visioning process (with staff and public)
minimized any potential barriers
CT conducted extensive marketing campaign in
introducing changes
None
Required Equipment and Technology
Day pass issuing units Read/write technology Read/write technology

As indicated in the table, riders in all three systems usethe day pass four or more times a day on average.
Agency Impacts and Benefits. The major impacts on, andbenefits to, the agencies include the following:
• The elimination of zone charges did not result in a sig-nificant loss of fare revenue, as might have beenexpected. In both Baltimore and Connecticut, the sim-plification of the fare structure, coupled with introduc-tion of new fare options, attracted new riders and thusoffset the loss of zonal surcharge revenue. Revenue inBaltimore actually rose following the fare restructuring,and has continued to grow since that time.
• The sale of day passes onboard buses effectively off-set the expected loss of ridership—as well as rider complaints—that might be expected with the eliminationof free or low-priced transfers. Moreover, these initia-tives resulted in significant revenue increases in bothBaltimore and Orange County.
• These initiatives greatly reduced the extent of transferabuse and the incidence of rider-operator argumentsregarding the validity of transfers.
In short, all three of these agencies feel that they have ben-efited considerably from these fare strategy initiatives. How-ever, it should be kept in mind that, while none of these strate-gies have any specific technology requirements, the onboarddistribution of day passes requires some type of pass-issuingunit if the agency is to avoid having operators be responsiblefor manual distribution of the passes. Moreover, the use ofmore flexible payment options (e.g., stored-value farecardsor rolling passes) clearly requires some type of electronictechnology; these options are discussed further in the nextsection.
Payment Option Trends
Types of Payment Options and Fare Instruments
The other major element of the fare structure is the pay-ment options that are available. As described in TCRP Report10 (1), the basic types of payment options are:
• Single-ride• Multiride• Period pass• Stored value• Postpayment
These generic payment options can be in the form of var-ious fare instruments or payment media, including:
• Cash• Token
19
• Paper ticket• Magnetic stripe ticket or farecard• Smart card• Credit/debit/ATM card• Transit voucher
While most of these payment media are used for actualpayment of the fares, several (i.e., credit/debit/ATM cards andtransit vouchers) are primarily used to purchase a fare instru-ment. However, it should be noted that credit cards have alsobeen used in a postpayment mode for direct fare payment inone U.S. transit system (Valley Metro in Phoenix). This strat-egy was in place for several years, but was discontinued inmid-2002. Because there was no on-line validation of thecards, Valley Metro was subject to fraudulent card usage; theagency ultimately decided that it was losing too much rev-enue through fraud, and thus opted to end the program.
With regard to transit vouchers, certain programs issuethem in the form of farecards (e.g., in New York City andWashington, DC), so that they can be used for direct farepayment; this approach is discussed further in Chapter 4 andin individual case studies (Part II). Most of the emergingdevelopments related to payment options are tied to the intro-duction of electronic payment technologies and are discussedbelow. The rest of this section reviews general trends regard-ing use of passes and discounted multiride options.
Prepayment and Market-Based Pricing
TCRP Report 10 identified market-based pricing as anotherform of differentiated pricing: differential fares are offeredbased on frequency of use and willingness to prepay, ratherthan service or time of day differentials. A market-basedpricing strategy typically includes some combination of periodpasses and discounted tickets, tokens, or stored value fare-cards. Such a strategy provides the agency an opportunity totarget different market segments (e.g., frequent versus occa-sional riders), while also gaining the operational and admin-istrative benefits associated with prepayment (e.g., reducingcash-handling requirements). Table 2-9 shows the percent-ages of fare revenue agencies receive from prepayment. Asindicated, the most common percentage range is 20% to 39%;however, nearly half of the agencies represented in the tablereceive 40% or more of their fare revenues through prepaidoptions. Those agencies operating rail understandably havethe highest percentages, as they tend to have the highest faresand therefore a greater incentive for regular riders to buypasses or multiride options.
With regard to types of prepaid options, Table 2-10 showsthat three-quarters of North American agencies offer at leastone type of unlimited-ride period pass, with monthly passesby far the most dominant category. As indicated, the overallpercentage of agencies with passes is virtually unchangedsince 1994. Among the other pass types, a third of the agen-cies have short-term (1- to 3-day) passes, 17% offer 1-week

passes, and 5% 2-week passes; in addition, 8% have someform of 12-month pass. As discussed below, a number ofagencies have begun to convert their passes to rolling passes(i.e., activated on first use); this requires the installation ofelectronic payment capabilities.
The use of short-term passes, particularly day passes, isgrowing, and they are increasingly being targeted to both reg-ular riders and tourists. Such passes have traditionally beenprovided primarily for out-of-town visitors, as many agencieshave sold them only through hotels, convention centers, andother off-site locations. However, as discussed earlier, agen-cies are beginning to view day passes as alternatives to low-priced transfers, and several are now selling them onboardbuses and in rail stations. Some agencies have even consideredpartial-day passes. Portland Tri-Met, for instance, recentlyintroduced its 6-hour Quik Tik at a price ($3) lower than its daypass ($4); this pass is sold at Ticket Vending Machines(TVMs) and onboard buses (see the Tri-Met Case Study inPart II). Meanwhile, a few agencies offer passes that are validonly after a certain time of day; for instance, WMATA’s “daypass” is good beginning at 9:30AM. With the growth of elec-tronic payment, we can expect to see an increase in the typesof passes offered to riders.
While not as widespread as passes, discounted multirideoptions are offered by many agencies. These options vary interms of the number of trips that must be purchased to receive
20
the discount, as shown in Table 2-11. The most common num-ber of tickets or tokens for a discount is 10, although someagencies offer different discounts at different trip thresholds.As indicated in the table, 13% of agencies now utilize storedvalue as a payment option; as discussed further below, the inci-dence of this option will certainly increase with the growth ofelectronic payment.
With regard to the level of the discount offered, Table 2-12shows that there is a fairly even distribution of agencies withdiscounts of less than 10%, 10–19%, and 20% or more. How-ever, the table also reveals that there has been a general shiftover the past few years toward lower percentage discounts.While the incidence of discounts in the 10–19% range is vir-tually unchanged since 1994, the percentage of agencies withdiscounts under 10% has nearly doubled, with the percentageabove 20% declining accordingly. In some cases, this shifthas occurred as agencies have moved from paper tickets ortokens to stored value farecards. In Chicago, for instance, theCTA’s stored value farecard has a discount (actually a pur-chase bonus) of 10% (i.e., $11 value for $10). Prior to intro-ducing electronic payment, the CTA had sold 10 tokens at a17% discount; the discount had been as high as 28%, but hadbeen reduced as part of subsequent fare changes. While CTA,NYMTA, WMATA and other agencies that have introducedstored value currently offer a simple purchase bonus (typi-cally 10%), there are a number of alternative approaches for
TABLE 2-9 Percentage of fare revenue from prepayment
Number of Systems by Percentage of Fare Type of Number
of Revenue from Prepaid Fare Options
System Systems <20% 20–39% 40–59% 60–79% 80–100%
Bus 180 26 65 44 32 13
Heavy rail 14 0 1 3 2 8
Light rail 14 0 2 4 3 5
Commuter 15 0 1 1 2 11 Rail
SOURCE: 2000 APTA Transit Fare Summary, 2000.
TABLE 2-10 Incidence of passes among transit systems
Total Number of Systems with
Type of Number of
Number with
Percent of Total Each Type of Pass
System Systems Passes 2000 1994 1-mo. 2-wk 1-wk 12-mo. 1-3–day
Bus 251 187 75 74 187 13 43 20 84
Heavy rail 15 12 80 77 12 2 9 1 9
Light rail 22 22 100 100 22 1 8 6 15 Commuter rail 18 18 100 76 18 0 9 2 3
SOURCE: 1994 APTA Transit Fare Summary, 1994, and 2000 APTA Transit Fare Summary, 2000.

providing bonuses or discounts with stored value media; theseare reviewed in the next section.
PAYMENT OPTIONS FACILITATED BYELECTRONIC FARE MEDIA
Electronic Payment Options
As suggested earlier, electronic fare media—generallyeither magnetic stripe farecards or smart cards—facilitateconsideration of a range of new types of payment options.Some agencies have used electronic media essentially toautomate their existing options, while others have totallyrevamped their fare structures with the installation of elec-tronic technology. The CTA took the former approach,replacing its discounted tokens with stored value (with a pur-chase bonus) and converting its passes from fixed calendarperiods to a rolling/activate-on first use basis. The NYMTArepresents the most graphic example of the latter approach,as it moved from the most basic fare structure in the industry—featuring no multiride discounts, prepaid passes, or dis-counted transfers—to an automated system that includes
21
stored value (with a purchase bonus), several types of rollingpasses, and free intermodal transfers.
The basic payment options possible with electronic faremedia and their purchase parameters can be summarized asfollows:
• Value-based or trip-based options. These can be eitheruser-encoded or pre-encoded (with a fixed amount).Agencies vary in their requirements for a minimum ini-tial payment for user-encoded cards. For instance, theCTA, WMATA and BART all permit purchase of a fare-card containing just enough for a single trip (althoughwithout any discount or bonus at that level); in contrast,the NYMTA requires that at least $3 be placed on aMetroCard. There is typically a higher minimum value toobtain a purchase bonus: CTA and WMATA each pro-vide a 10% bonus if the rider buys a farecard worth morethan $10 and $20, respectively; BART offers a 6.7%bonus for a $30 farecard. NYMTA had offered a 10%bonus with purchase of a $15 farecard, but increased thebonus to 20% (when buying a $10 farecard) in conjunc-tion with its May 2003 fare increase.
TABLE 2-11 Incidence of discounted tickets, tokens, farecards
Type of Number of Trips Needed for Discount* Stored System Systems 1 2–4 5–9 10–19 20–39 >40 Value
Bus 251 5 4 10 103 35 17 33
Heavy rail 15 2 2 5 6 2 3 8
Light rail 22 1 1 5 13 1 2 1
Commuter 18 1 6 0 11 1 0 1 rail
SOURCE: 2000 APTA Transit Fare Summary, 2000.*categories not mutually exclusive (e.g., an agency might have 5- and 10-trip tickets with different discounts).
TABLE 2-12 Incidence of discounts (for 10-ride options): 1994–2000
Percentage of Systems with Type of Discount (from Base Fare) of System <10% 10–19% 20–29% >30%
2000 1994 2000 1994 2000 1994 2000 1994
Bus 33 18 38 40 17 27 12 15
Heavy rail 33 29 17 29 33 14 17 29
Light rail 46 30 23 50 23 0 8 20
Commuter 0 11 64 67 27 22 9 0 rail
SOURCE: 1994 APTA Transit Fare Summary, 1994, and 2000 APTA Transit Fare Summary, 2000.

• Time-based options. These can either allow unlimited-rides (during the specified period) or be capped at a cer-tain number of rides (during the specified period). Asindicated above, the key pass development related toelectronic payment has been the conversion of fixed timeperiod passes (e.g., “September” or “September 16–30”)to rolling passes good for a specified number of days(e.g., “30 days” or “14 days”), or perhaps even a certainnumber of hours (e.g., “24 hours” or “4 hours”). Suchpasses are activated the first time they are used. Thisincreases the rider’s flexibility considerably; for exam-ple, a rider who will be on vacation for a week duringthe month can buy 3 weeks’ worth of 7-day passes ratherthan a single 30-day pass. The use of rolling passes can
also reduce the administrative burden onthe agency, since pass purchases nolonger occur solely within a short timeperiod (e.g., at the end of a month, or dur-ing the first few days of the next month).Rolling passes are currently in use by a number of agencies, including CTA,NYMTA, WMATA, OCTA, HoustonMetro and Connecticut Transit. Agenciesare increasingly utilizing this approach asthey introduce electronic payment.
• Combined value and time-based options. Electronicfare media are capable of carrying both stored-value andpass options. This may be in the form of stored value foruse on one mode or operator’s service, along with atime-based pass that can be used on another mode orservice in the region; for example, WMATA has offereda variety of farecards containing stored value for use onMetro rail that also serve as flash passes that can be usedon specific bus services. In an integrated regional pay-ment system, a rider could have a farecard that hasstored value for occasional use on all participating agen-cies’ services, as well as a period pass for the serviceregularly used.
• An electronic payment system can also automaticallyfacilitate a fare differential (by time of day, mode or dis-tance) or a transfer discount that would otherwise haveto be handled using a separate paper transfer.
The other key parameter for farecards is the type and levelof discount or bonus provided as an incentive to purchase anduse the card (and to use transit in general). The basic types ofdiscount and bonus options that might be considered are asfollows:
• Initial purchase bonus. This is the most common formof stored-value bonus, as described above.
• Add-value bonus. An alternative approach is designedto encourage retention of a farecard: a bonus is not pro-
22
vided on initial purchase of a farecard, but rather onlyon additional value; this has been suggested as a possi-ble strategy for use with smart cards in particular, giventhe cards’ high unit cost.
• Frequency-based per-ride discount (above a thresh-old number). A reduced fare is charged for each rideabove a certain minimum number of rides taken with aparticular farecard.
• Farecard discount relative to use of cash. A farecardcan carry a lower per-trip fare than if paying cash.
While the above strategies can be used with any type ofelectronic payment, the greater memory and processing capa-bilities of smart cards—coupled with the fact that they areintended to be used for a much longer period—make it possi-ble to consider additional pricing innovations that would notbe feasible with magnetic media; these include the following:
• Guaranteed last ride (or negative balance). In thisoption, a ride is guaranteed, regardless of the remainingvalue on the farecard. In other words, if a rider boards abus or enters a faregate and the farecard is revealed tohave insufficient value for that trip, a “negative bal-ance” (up to the value of a single ride) is permitted. Thenext time the cardholder adds value to the card, theamount of that ride is deducted from the total valueadded. This strategy was tested by the CTA in its smartcard pilot project and is being considered in a number ofother programs.
• Guaranteed lowest fare. This option is a variation onthe frequency-based per-ride discount mentioned above.As proposed for introduction in the Washington, DCSmarTrip program (where it is known as “Fair Fares”),this strategy assures riders that they will automatically becharged the lowest fare for which they are eligible (i.e.,based on their extent of usage of their farecards). Acounter on the card keeps track of each card’s use withina certain time period, and the fare system is programmedso that the rider pays the lowest possible fare, based onactual usage. For instance, once a cardholder has taken acertain minimum number of rides during a day, the cardautomatically becomes treated like an unlimited use daypass, and all subsequent rides that day become free. Evenat this point, however, rides continue to be tracked; thus,if the cardholder uses the card a sufficient number oftimes in a 7-day period, the card becomes treated like aweekly pass (and subsequently a two-week pass, and ulti-mately a monthly pass—assuming these are offered bythe agency). A variation on this basic strategy is to useit in conjunction with postpayment. In Groningen,Netherlands, for instance, the “Tripperpas” smart cardprogram offers cardholders a “best price” guarantee, butthe card does not carry stored value; rather, the card-

holder establishes an account and the cost of travel isdeducted from this account (i.e., similar to an electronictoll system). Such an arrangement, which is similar toan electronic toll account, is also being tested in Frank-furt, Germany, and Sapporo, Japan.
All of these discount and bonus strategies are intended toprovide incentives to purchase and use a farecard as opposedto paying with cash or using a token or paper ticket. Some ofthe approaches (i.e., add-value bonus and frequency-baseddiscount) also serve to encourage retention of a farecard.However, the incentives differ in their relative impacts onridership and revenue. Thus, it is important that an agencycarefully consider these impacts in selecting a pricing strat-egy. A guaranteed last ride option, for instance, is attractiveto riders in that it addresses concerns about running out offarecard value where it may be inconvenient to add value(i.e., on most bus routes). However, this approach discour-ages the retention and reuse of a single farecard, and canpotentially result in significant revenue loss, if people abusethe privilege; thus using this strategy also requires some typeof strong incentive to retain and reload cards.
A guaranteed lowest fare option also has the potential toresult in some revenue loss, as it converts rides that wouldotherwise have been paid for to free rides. An agency willthus have to balance the possible revenue loss against thelikely gain in ridership—and general marketing benefit—associated with the strategy. A more straightforward fre-quency-based per-ride discount would presumably have asmaller revenue impact—since it charges for each ride—although it may not offer an agency quite as compelling amarketing angle. As with any of these pricing strategies, theimpacts on both revenue and ridership will ultimatelydepend on the exact nature of the bonus or discount relativeto the full fare—and compared to the discount offered bypasses and other prepayment options (if any). The agencywill also have to determine the relative importance of itsgoals (maximize ridership, maximize revenue, maximize riderconvenience, maximize prepayment, etc.) in establishing anoverall set of payment options.
The next section reviews trends related to the basic typesof fare collection in the transit industry.
23
TRENDS IN TYPE OF FARE COLLECTION
Type of fare collection refers to the manner in whichfares are paid or inspected; the basic options are as follows:
• Barrier (i.e., pay onentering and/or exit-ing a station or load-ing area). Involvesturnstiles, faregates,and ticket agents orsome combination ofall three; may involveentry control only or entry and exitcontrol, particularlyfor a distance-basedsystem.
• Pay on boarding(i.e., on entering thevehicle). Typicallyinvolves a farebox or a ticket or card processing unit.
• Self-service/barrier-free or proof-of-payment (POP).The rider is required to carry a valid ticket or pass whenon the vehicle and is subject to random inspection byroving inspectors; typically involves ticket vending/validating machines.
• Conductor-validated. The rider can either prepay orbuy a ticket onboard from a conductor.
Each fare collection approach has become closely associ-ated with a particular mode of transportation (see Table 2-13for a summary of the application of these approaches to spe-cific modes). Heavy rail lines are typically barrier systems,although POP (in Los Angeles) and pay on boarding (in Cleve-land) are also in use. In North America, virtually all buseshave pay on boarding, while a number of European bus sys-tems use POP. While some light rail systems have employedbarrier (Boston, for underground stations) and pay on board-ing (Pittsburgh and Boston, for surface stations), POP has beenadopted for most Light Rail Transit (LRT) lines. POP is thenewest fare collection approach and, with the rapid expansion
TABLE 2-13 Use of fare collection approaches by mode
Approach Light Rail Heavy Rail Commuter
Rail Bus Rapid Transit Bus
Proof of Payment
Barrier Pay on boarding
Conductor-validated
✓ ✓
✓
✓
✓
✓
✓
✓
✓
✓
✓
✓

of LRT service in the United States, has seen increasing useover the last two decades. POP is also expected to be used in anumber of the new bus rapid transit services now being devel-oped or implemented, although barrier and pay on boardingsystems are also being considered. (A separate TCRP project(A-24) has developed A Toolkit for Self-Service Barrier-FreeFare Collection (5), which provides guidelines for implement-ing and managing a POP fare system.) Finally, conductor-
24
validated fare collection is used by many commuter rail sys-tems, although the newer systems have tended to opt for POPinstead. In many cases, the choice of approach is clearly sug-gested by the operating restrictions or requirements of theservice, while in other instances, the agency will have to weighthe costs and benefits of two or more alternatives. Table 2-14presents a comparison of these approaches with regard toseveral defining parameters.
TABLE 2-14 Comparison of fare collection approaches
Factor/Issue Proof of Payment
(POP) Barrier Conductor-validated
Pay on boarding
Equipment needed
Ticket Vending Machines (TVMs), validators, Ticket Office Machines (TOMs), hand-held readers*
Faregates, TVMs, add-fare machines
TVMs,* TOMS,* validators,* hand-held readers*
Fareboxes, ticket processing units*
Station or platform characteristics
Open (elevated) or on-street platform
Requires space for gates and TVMs, and defined entry/exit
Open platform NA
Handling large passenger volumes
Crowded cars can interfere with inspection. May require high number of TVMs
Doesn’t affect ability to collect fares.
Crowded cars can interfere with inspection.
Slows boarding
Fare evasion Depends on inspection pattern, fine structure, level of crowding
Caused by faregate “jumping,” short-swiping farecards
Minimal, since conductor inspects or collects fare from everyone; could be problem at congested times
Caused by using invalid pass or transfer. Also caused by crowding at boarding point
Handling Intermodal transfers
Transfer from bus can be used as POP on LRT; POP can include transfer to bus
Transfer from bus must be machine-readable; transfer to bus must be issued with rail ticket
Transfer from other mode can be shown to conductor
(see other approaches)
Handling zonal fares
More complicated (to use and to enforce); must include origin for validation
Requires exit gates and add-fare machines
Commuter rail lines invariably zoned
Rider tells driver destination (or zone), pays accordingly
Use of Automatic Fare Collection (AFC)
Use to buy POP ticket, or have to validate farecard—or have pass (inspectors need hand-held readers)
Faregates read farecard and deduct value or indicate valid pass
Conductors need hand-held farecard readers / processing units
Need ticket processing units/card readers; ease of revaluing is issue
Security and customer service
Inspectors provide presence on vehicles and platforms. Added security needed at other times
If no ticket agents, security needed in stations and on trains
Conductors provide presence on all trains
Driver responsible for security and customer assistance on bus
Customer Convenience
Needs validation of multiride or stored value tickets; may be queues to buy or validate, but not to board
Depends on types of payment accepted in gates (easiest if cash accepted); may be queues
No need to prepay or validate, no need for exact change, and no queuing to pay or board
Needs either prepayment (pass or multiride option) or exact change;** may be queues
Capital costs Lower than barrier, unless high vol. Requires many TVMs
Cost of faregates high, but requires fewer TVMs than for POP (validation at faregate)
Lower than POP; may be lowest (depending on number of TVMs used)
Lowest costs: fareboxes, but no TVMs
Operating costs Higher labor cost than barrier
Lower labor cost than POP
Highest labor cost Lowest labor cost
* optional; may be required if AFC is used
** validating fareboxes will not require exact change, but change will be in form of stored-value card

A decision on fare payment technology is separate fromchoosing a basic fare collection approach. However, thetype of technology selected can have definite implicationson the approach. For barrier, pay on boarding and conductor-validated systems, the major implication of electronic pay-ment is the need for appropriate equipment (e.g., magnetic/smart card readers and vending/add-value machines for bar-rier and pay on boarding, hand-held readers for conductor-validated). For POP, however, there are additional consid-erations. As noted in the Toolkit for Self-Service Barrier-FreeFare Collection [SSFC], “The major challenge is that storedvalue farecards (either magnetic stripe or smart card) cannot
25
be directly used in a proof of payment environment, as SSFCrequires the rider to display a validated ticket or a flash passto an inspector. A faregate or farebox equipped to read elec-tronic farecards automatically identifies the validity of thecard and deducts the proper fare value (i.e., if the card is notan unlimited ride pass). This is infeasible with a TVM andvisual fare inspection. Thus, use of farecards in a SSFC sys-tem requires special accommodations to allow the user tovalidate the card and the inspector to check the validity ofthe card” (5). The alternative methods for incorporatingelectronic payment into a POP system are discussed in thenext chapter.

26
CHAPTER 3
FARE PAYMENT TECHNOLOGY DEVELOPMENTS
INTRODUCTION
As indicated earlier, an increasing number of transit agen-cies are implementing electronic fare payment strategies. Theuse of electronic payment has influenced fare policy and hasfacilitated the introduction of a range of new payment options(e.g., stored-value farecards, rolling passes, and regional), aswell as the opportunity to establish new types of partnershipsand new fare media distribution methods. Developmentsrelated to the types of technology being employed and emerg-ing applications are reviewed in this chapter.
Two basic electronic payment technologies have been usedin fare systems:
• Magnetic stripe cards or tickets• Smart cards, also known as “integrated circuit” or “chip”
cards
Either technology can accommodate a wide range of pay-ment options. There are differences, however, in a number ofparameters; these differences, as well as the relative advan-tages, are discussed below and are summarized in Table 3-1.
MAGNETIC FARECARDS
There are two basic types of magnetic stripe media: read-only swipe cards and read-write stored-value cards. Ineither case, magnetic variations along longitudinal “tracks”in the stripe can store a certain amount of data. The read-only technology is similar to that used for credit or debitcards, and allows the automatic determination of the valid-ity of an unlimited-ride pass. (Other “read-only” paymentmedia technologies targeted to the transit market include theC-Card “CoinCard” and InkSure’s “TicketSure” technology.The CoinCard is a read-only “capacitive” card in which storedrides are encoded in a laser-etched polyester film. The Ticket-Sure fare media are machine-readable paper tickets printedwith a special ink (“SmartInk”) that makes counterfeitingvery difficult; these tickets offer a possible replacement forpaper transfers or single-ride fare tickets. Both of these tech-nologies can be used to complement electronic (read-write)payment systems.) In contrast, read-write technology, usedwith a ticket processing unit (TPU) or bus ticket validator
(BTV), can accommodate stored value and other automatedpayment options. The TPU can be in the form of either aswipe reader (as in the NYMTA MetroCard system) or amotorized transport (as in the CTA, WMATA and BARTsystems) that grabs the ticket after insertion and moves itover the read/write heads at a controlled speed. The ticket isreturned to the passenger through the original slot or someother slot in the reader. A TPU can process an existing fare-card, and some bus TPUs can be configured to issue sometypes of fare media (e.g., a transfer or a 1-day pass, or evenstored value).
Development of Magnetic Farecard Systems
As noted in TCRP Report 10, fare collection systems usingmagnetic stored-value farecards date from the 1960s, firstintroduced on rail systems in Chicago (Metra Electric ICGRRLine) and Philadelphia (PATCO), and subsequently used(also on rail only) at BART in San Francisco and WMATAin Washington DC in the 1970s. Magnetic farecards can be made of plastic or paper and may or may not include print-ing (i.e., of value remaining) on the card. The BART andWMATA systems are examples of the paper option, and bothprint remaining value on the ticket. The newer stored-valuesystems, such as those at New York MTA and CTA (Chicago),use thin polyester cards that are more durable than the papertickets; these systems do not print remaining value on thecards. Both types of card are relatively inexpensive, rangingfrom under $0.02 to about $0.10 apiece, depending on the spe-cific characteristics of the card and the volume purchased.
The use of magnetic farecards on bus systems is a morerecent development, but read-write technology had beenimplemented by over 30 U.S. bus operators (as of late 2002).Most of these utilize GFIGenfare’s Ticket Reading/Issuing Machine (TRiM) technology. The TRiM unit is aTPU that mounts on the side of the GFI Cents-A-Bill fare-boxes. In addition to reading a ticket inserted by the passen-ger, a TRiM unit can also issue a magnetic ticket/transferfrom an internal supply of blanks. Several systems use Cubic’sBus Ticket Processing Unit, either in conjunction with GFIfareboxes (i.e., in Chicago, on CTA and Pace buses) or withCubic’s own fareboxes (i.e., NYMTA, Houston Metro andAMA in San Juan, PR).

27
TABLE 3-1 Comparison of electronic payment technologies
Magnetic Farecard Smart Card Description • Cards are paper (like WMATA farecards) or
thin, flexible plastic or polyester (like NYMTA MetroCard), with a magnetic stripe.
• Cards are rigid plastic (like a credit card) with an embedded microchip. Paper tickets are now being introduced.
• Read-write Ticket Processing Unit in fareboxes or faregates use motorized transport or swipe reader to check pass validity or decrease a stored value/rides balance.
• Contactless card readers in fareboxes (or standalone) or faregates communicate with cards brought within close proximity to check pass validity or decrement a stored value/rides balance.
• Attended or unattended devices are used to purchase or load value/rides (or a pass). Prevalued cards can also be sold (e.g., by merchants selling other fare media).
• Attended or unattended devices are used to load value/rides (or a pass). Cards are purchased at ticket offices, by mail, or Internet.
• A card with both contact and contactless
interfaces enables multiapplication partnerships with banks, social service agencies, campuses, or other entities.
Strengths • Cards are inexpensive (less than $0.10). • Cards can be readily vended from point of
sale devices (e.g., Ticket Vending Machines [TVMs]) or possibly from fareboxes. (TVMs that vend smart cards are much more expensive.)
• If cards are used for stored value (rather
than rides), when the card balance drops to
a small level (e.g., $0.05–$0.10), some customers may purchase a new card rather than revaluing the old one. This means that the residual value may never be used. This unused value becomes additional revenue to the issuing transit agency.
• The smart card has the data capacity and security features needed to support multiple card applications. Such partnerships can help spread system costs and make card use more attractive.
• The data capacity and processing
capabilities of smart cards also enable the introduction of special features, such as: • Registering the card, so that a lost
card can be cancelled and the value restored on the replacement card.
• Automatically revaluing a card from a credit card account when the balance gets low; the card is updated the next time it is used.
• Automatically adding monthly employer or other transit benefits to cards in a similar manner.
• Contactless cards easy to use (e.g., for
disabled/seniors).Weaknesses • Data capacity may be too limited to support
multiple agency pass or multiride options. Multiple agency use may be limited to stored value.
• Card readers require considerable
maintenance/cleaning. In addition, card slots are vulnerable to insertion of foreign items. In contrast, contactless smart card readers have no slots or moving parts—and thus require much less maintenance.
• Card readers tend to be more expensive to
purchase than contactless smart card readers
•
• Variety of card interfaces in market place
(both standardized and proprietary) complicate potential to integrate with other regions or other applications.
Cards are expensive ($1.50–$10 each). To insure that a card is retained for long-term use, a card fee/deposit may be needed; this may raise equity objections from lower-income riders. Smart cards are not well-suited for one-time users (e.g., visitors). New TicketSure paper tickets will be much cheaper, but still more expensive than magnetic cards.

28
The latest generation of fareboxes are “validating” fare-boxes, such as GFI’s “Odyssey.” All bills and coins are val-idated, including larger denomination ($5, $10, and $20)bills; change from a larger bill payment can be returned to theboarding passenger as stored value on a magnetic stripeticket. Other validating fareboxes should soon be available inthe North American marketplace as well. For instance,Scheidt & Bachmann and a consortium of C-Card and Dia-mond Manufacturing have each announced that they havedeveloped a validating farebox. Agent Systems had previ-ously introduced a validating farebox, the “Smart Box,” butthis unit was no longer in production (as of mid-2003).
It should be noted that the use of a vendor’s magnetic tech-nology by multiple agencies does not in itself ensure that allof the agencies will be able to read a common farecard. Dif-ferent versions have software variations that often make dif-ferent agencies’ equipment incompatible. Thus, providingcompatibility among several operators in a region mayrequire upgrading existing units to the same version of thecard processing software or replacing the units altogether.Similarly, a NYMTA MetroCard would not be read correctlyat the CTA even though both are Cubic systems of the samevintage.
Examples of Magnetic Farecard Systems
The major examples of multiple operator magnetic sys-tems are as follows.
• New York City. The New York City Transit Metro-Card system, completed in 1997, is a Cubic system usedon MTA-NYCT buses and rail, as well as Long IslandBus and NY Department of Transportation (DOT)buses; MetroCard equipment is now being installed onthe Port Authority’s PATH rail system as well. The
subway faregatesrequire that theticket be swiped,like a credit card,while the bus fare-boxes use a motor-ized transport. Asindicated above,remaining value isnot printed on thecards; value is dis-played on the TPU
or faregate—as well as in ticket vending machines andspecial card value units in subway stations.
• Chicago. Cubic also installed the stored value AFC sys-tem for the CTA and Pace (the suburban bus operator).As in NY, the card can be used on bus and rail. Unlikethe NY MetroCard, however, the card must be insertedin rail faregates, rather than swiped. The Chicago Tran-
sit Card system installation was completed in 1997. Asmart card pilot project was completed in 2001, and afull system-wide rollout of smart cards (to complementthe magnetic cards) has been initiated. (See CTA CaseStudy in Part II for additional information.)
• State of Connecticut. Connecticut Transit operates ser-vice in the cities of Hartford, New Haven, and Stamford.These and several other systems all accept commonmagnetic fare media (e.g., 1-day pass, 7-day rollingpass, 31-day rolling pass and stored-ride farecard).These fare media are accepted by eight participatingsystems. The fare collection system uses GFI’s TRiMunits. (See CT TRANSIT Case Study in Part II for addi-tional information.)
• Southern California. Five transit operators in southernCalifornia accept a common farecard (Metrocard). ThisGFI system was initiated in 1994 with three operators,and two others have since been added. The largest agencyin the region, the Los Angeles County MTA, is now inthe process of developing a region-wide Unified FareSystem (UFS) that will include these initial agencies, aswell as other operators in the region. UFS will featuresmart cards as the primary regional fare medium, butmagnetic cards will continue to be accepted by at leastsome of the participating agencies.
Thus, magnetic farecards are used in several regions bymore than one operator. However, no region has as yet estab-lished a true universal magnetic system covering all of thetransit providers in the region.
As suggested above, LACMTA plans to implement a fullregional system, but this system will be based primarily onsmart cards, rather than magnetics. In Chicago, the com-muter rail operator (Metra) does not accept CTA’s TransitCard. In New York, discussions have taken place for severalyears among the largest transit operators (NYMTA, New Jer-sey Transit, and PATH) regarding the potential for a com-mon farecard, and, as said above, PATH will now be accept-ing the MTA’s MetroCard. An eventual region-wide faresystem could be based on further expansion of the Metro-Card or could involve introduction of smart cards.
Several other regional payment efforts are in develop-ment—and several already exist overseas—but these are allbased primarily on smart cards; these programs are discussedlater in this chapter.
Impacts of Magnetic Farecard Systems forCase-Study Agencies
The following case-study agencies have installed magneticfarecard systems:
• Chicago Transit Authority has introduced stored-valuefarecards and rolling passes that can be used on CTAbuses and trains and Pace buses.

29
• Connecticut Transit has introduced stored-ride fare-cards and rolling passes that can be used on any of theagency’s services throughout the state.
• Orange County Transportation Authority recentlyintroduced rolling passes, although not stored-value (orstored-ride) passes
The full case studies are presented in Part II. However, itis useful to compare the results of these efforts in terms oftheir impacts on customers and agency operations.
Customer Impacts and Benefits
Farecards have proven very popular with customers. Forinstance, within 3 months of initial implementation, a third ofall CTA trips were being made with Transit Cards. At pres-ent, 95% of rail riders pay their fares with farecards, as do68% of bus riders. At CT TRANSIT, the use of 1-day and7-day passes in particular has grown steadily since their intro-duction; overall pass use has increased by more than a thirdsince the introduction of electronic payment.
These electronic payment systems have produced a num-ber of benefits to customers, including a greater variety of,and more convenient, payment options, such as the following:
• Purchase and activation without being constrained to aparticular calendar timeframe (rolling passes).
• The benefits of an unlimited use pass without having tomake the cash outlay required with a 30- or 31-day pass(7-day rolling pass offered by CTA and CT TRANSIT).
• Prepayment for customers who do not want to buylonger-term passes (stored-value/stored-ride cards offeredby CTA and CT TRANSIT and 1-day passes sold onboardbuses by CT TRANSIT and OCTA.
• Reduced cost of travel for many riders through 1-daypasses or purchase bonuses.
• Seamless travel on multiple transit systems (CTA/Pace;CT TRANSIT/eight participating transit systems).
Agency Impacts and Benefits
Electronic payment systems have had the following majorimpacts on, and benefits for, CTA and CT TRANSIT:
• These systems have facilitated the implementation ofmore fare options for customers, many of which aremore convenient and cost-effective. The systems alsoallow the agencies to track ridership and revenue impactsof different fare initiatives more carefully.
• These systems have considerably reduced the use of cashfor fare payment: At CTA, 16% of boardings are cur-rently made using cash, compared to 27% pre-electronicpayment. At CT TRANSIT, the use of cash is 9% lowerthan when the new system was implemented.
• The popularity of the farecards has enabled CTA to elim-inate tokens completely, thereby eliminating the costsassociated with selling and redistributing tokens. CTTRANSIT’s token use dropped by almost half follow-ing the introduction of stored-ride cards.
• The use of rolling passes has reduced fare collectioncosts associated with producing, selling, and distribut-ing fixed calendar period passes. For instance, the agen-cies no longer need to print weekly and monthly passesthat may be discarded if they are not purchased.
• These systems have significantly reduced opportunitiesfor fare abuse and evasion through automatic verificationof validity of fare media, and by curtailing counterfeit-ing of passes. The systems have also reduced operatorrequirements for administering fare collection, as wellas the extent of rider-operator confrontations regardingthe validity of passes and transfers.
• The use of stored-value has produced expired-value rev-enue associated with unused farecards This results fromthe fact that many people use magnetic farecards once ortwice and then dispose of them, even if they still havesome value—or, in some cases (e.g., CTA), farecards areactually issued with an expiration date. CTA estimatesthat on the order of $3 million per year is left on farecardsthat have reached their expiration dates (12 to 14 monthsafter a card is issued). WMATA, whose case study is dis-cussed in the next section, estimates that between $3 mil-lion and $5 million in unused value is written off annually.
• The total cost of implementing the CTA’s system was$106 million. Of this total, 74% was for equipment,13% for station construction, 5% for field forces, 4% forconsultants, 2% for CTA engineering and administra-tion, and 1% for marketing and start-up—total does notadd to 100% due to rounding. (Estimated costs forimplementing both magnetic farecard and smart cardsystems are presented in Appendix C.)
• With regard to potential cost savings, CTA initiallyenvisioned that implementation of electronic paymentwould result in a personnel cost savings since they wouldhave a reduced need for rail ticket agents. However, thenew fare technology required a significant outreach andcustomer service effort on the part of the agency, andmany of the rail ticket agents were converted to cus-tomer assistants. Therefore, CTA has not realized theanticipated personnel cost savings.
SMART CARDS
Types of Cards
Unlike a magnetic farecard, a smart card is generally madeof rigid plastic, like a credit card, and contains a small embed-ded computer chip (lower-cost—and lower function—papersmart cards and recyclable smart tokens are also available).The earliest chips had memory but no microprocessors. Thesecards—still in use for certain applications—were developed to

30
provide a data storage location that had more capacity and wasless vulnerable to tampering than the magnetic stripe on fare-cards. Communications between the reader and the chip canbe either through a set of small metallic contacts on the face ofthe card (for a contact card) or through a short-range wirelessinterface (for a contactless card).
The first use of contact cards, primarily in Europe begin-ning in the 1980s, was for prepaid telephone cards and limited-purpose stored-value cards. More sophisticated chips withmicroprocessors began to be used later. These allowed dataencryption calculations to be completed in both the card andthe reader. Card uses were subsequently extended to general-purpose stored-value (also known as an electronic purse ore-cash) schemes and other types of bank cards.
Smart cards are being introduced for an increasingly widerange of applications, including toll and parking payments,Internet access, mobile commerce, electronic benefits trans-fer, campus (university and corporate) functions, and loyaltypurchase programs. The processing and storage capabilitiesof smart cards have made it possible to consider multiuse ormultiapplication programs, including two or more of theseuses on a single card. Such arrangements offer the potentialto increase customer convenience—for all participatingapplications—as well as to spread card issuance costs.
While most types of applications have tended to use con-tact cards, contact transactions have generally been found tobe too slow for transit fare payment. Contactless, or proxim-ity, cards, developed in the early 1990s, need only be passedwithin an inch or two of the card reader, and thus allow farepayment to be completed very quickly. A contactless trans-action is typically completed within about one-fifth of a sec-ond. Early contactless cards achieved short transaction timesby avoiding the sophisticated security calculations needed bybanks. However, with faster microprocessors, these cards cannow complete secure calculations quickly. This has led to therecent development of contactless chips for use for credit/debitand other nontransit applications, not all of which make use ofplastic cards, for contactless chips can be integrated into manydevices, including pagers, mobile phones, personal digitalassistants (PDAs), wrist watches, and key fobs.
Banking and other nontransit applications continue to relyon contact cards where there is an installed infrastructure,particularly in Europe. However, Visa and MasterCard bothannounced in 2002 that they have developed contactlessspecifications for credit and debit functions. This suggeststhat, at least in the United States, where there is a very smallexisting contact card infrastructure, the growth in the use ofcontact cards may be rather limited in the coming years. Thereis at present growing use of contact cards for a variety of non-banking applications such as parking payments, electronicbenefits transfer, campus uses, network security/ID, and retailloyalty programs. However, any widespread adoption of con-tactless technology by banks and other financial institutionscould ultimately cause other functions to shift to contactlessinterfaces as well; the extent and timing of such a shift remainsto be seen.
Given the use of contact cards for most applications atpresent and the need for contactless transactions for transit pur-poses, the interest in linking transit and other types of transac-tions has understandably led to development of a new type ofcard, a dual interface card, that incorporates both a contact andcontactless interface. With such a card, for instance, an e-pursecould be loaded with value through a retrofitted ATM andthen used for transit via the contactless interface. Alterna-tively, a card could be used for both transit and parking pay-ments or for transit and university campus purposes. Ofgrowing interest to transit and social service agencies is thepotential to deliver electronic benefits (e.g., access-to-jobssubsidies) to cards that can then be used directly on transit.While most smart card programs have specified either con-tact or contactless cards to date, many transit agencies havebegun to order dual interface cards for new programs. Giventhe apparent shift of focus of the financial sector—at least inNorth America and Asia—to contactless technology, how-ever, transit agencies may soon be able to consider multi-application opportunities without contact card functionality.
Examples of Smart Card Programs
After some early pilots in Europe in the late 1980s, severallarger-scale transit smart card systems were implemented inAsia in the late 1990s. The largest of these are in Hong Kongand Seoul. There are now over fifty transit smart card systemsin place or being implemented around the world; these includemany of the world’s major cities, such as Paris, London,Berlin, Rome, Sydney, Moscow, Shanghai, Tokyo, and Singa-pore. While smart cards have been slower to catch on in theUnited States, there has been a surge in activity in the past cou-ple of years, and there are now a number of programs in placeor under development. At this point, smart cards are in use onat least a limited basis in transit systems in Washington, DC;Chicago; the San Francisco Bay Area; Ventura County, CA;and Newark, NJ. Smart cards are also being introduced as partsof overall fare collection system upgrades or regional pro-grams in a number of other locations. Table 3-2 summarizesthe United States smart card programs in place, being pur-chased, or being planned as of late 2002.
Several key U.S. programs are described briefly below.Case studies of these efforts are included in Part II; their cus-tomer and agency impacts are compared below.
• Washington, DC. WMATAlaunched the SmarTrip sys-tem in May 1999, with smartcard acceptance at all Metrosubway faregates as well asat park and ride lots. As ofmid-2003, over 325,000 cardshad been issued. To obtain a
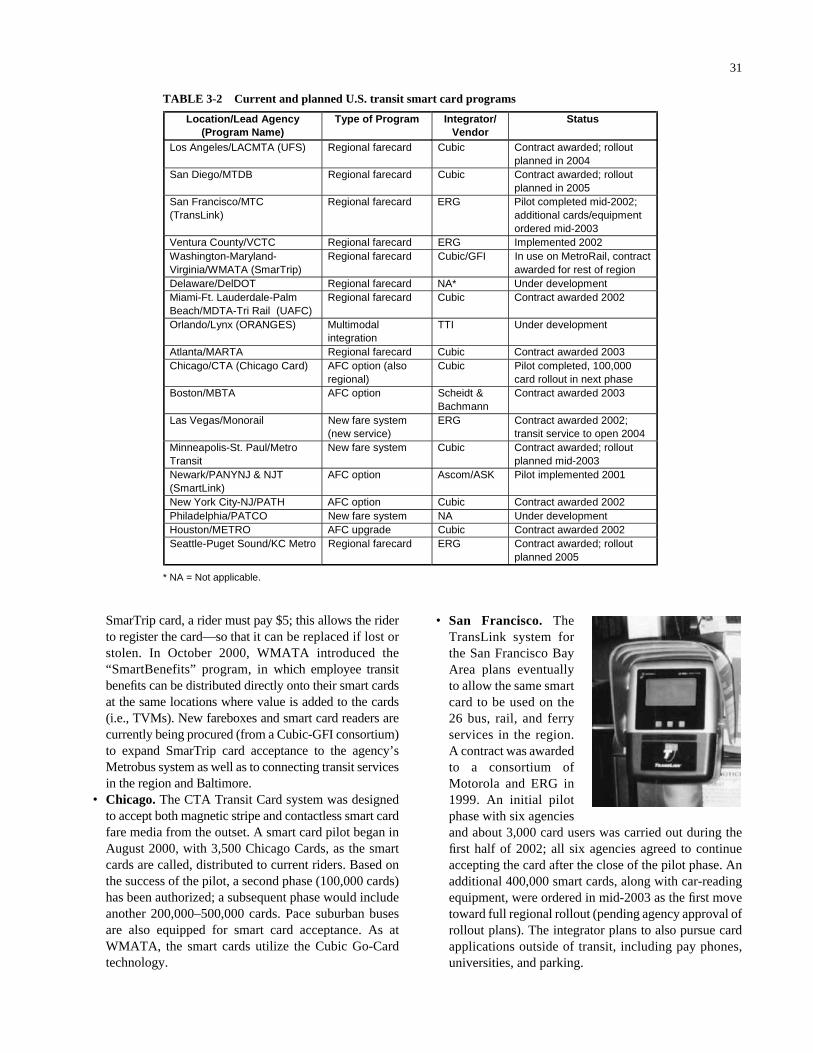
31
SmarTrip card, a rider must pay $5; this allows the riderto register the card—so that it can be replaced if lost orstolen. In October 2000, WMATA introduced the“SmartBenefits” program, in which employee transitbenefits can be distributed directly onto their smart cardsat the same locations where value is added to the cards(i.e., TVMs). New fareboxes and smart card readers arecurrently being procured (from a Cubic-GFI consortium)to expand SmarTrip card acceptance to the agency’sMetrobus system as well as to connecting transit servicesin the region and Baltimore.
• Chicago. The CTA Transit Card system was designedto accept both magnetic stripe and contactless smart cardfare media from the outset. A smart card pilot began inAugust 2000, with 3,500 Chicago Cards, as the smartcards are called, distributed to current riders. Based onthe success of the pilot, a second phase (100,000 cards)has been authorized; a subsequent phase would includeanother 200,000–500,000 cards. Pace suburban busesare also equipped for smart card acceptance. As atWMATA, the smart cards utilize the Cubic Go-Cardtechnology.
• San Francisco. TheTransLink system forthe San Francisco BayArea plans eventuallyto allow the same smartcard to be used on the26 bus, rail, and ferryservices in the region.A contract was awardedto a consortium ofMotorola and ERG in1999. An initial pilotphase with six agenciesand about 3,000 card users was carried out during thefirst half of 2002; all six agencies agreed to continueaccepting the card after the close of the pilot phase. Anadditional 400,000 smart cards, along with car-readingequipment, were ordered in mid-2003 as the first movetoward full regional rollout (pending agency approval ofrollout plans). The integrator plans to also pursue cardapplications outside of transit, including pay phones,universities, and parking.
TABLE 3-2 Current and planned U.S. transit smart card programs
Location/Lead Agency (Program Name)
Type of Program Integrator/ Vendor
Status
Los Angeles/LACMTA (UFS) Regional farecard Cubic Contract awarded; rollout planned in 2004
San Diego/MTDB Regional farecard Cubic Contract awarded; rollout planned in 2005
San Francisco/MTC (TransLink)
Regional farecard ERG Pilot completed mid-2002; additional cards/equipment ordered mid-2003
Ventura County/VCTC Regional farecard ERG Implemented 2002 Washington-Maryland-Virginia/WMATA (SmarTrip)
Regional farecard Cubic/GFI In use on MetroRail, contract awarded for rest of region
Delaware/DelDOT Regional farecard NA* Under development Miami-Ft. Lauderdale-Palm Beach/MDTA-Tri Rail (UAFC)
Regional farecard Cubic Contract awarded 2002
Orlando/Lynx (ORANGES) Multimodal integration
TTI Under development
Atlanta/MARTA Regional farecard Cubic Contract awarded 2003 Chicago/CTA (Chicago Card) AFC option (also
regional) Cubic Pilot completed, 100,000
card rollout in next phase Boston/MBTA AFC option Scheidt &
Bachmann Contract awarded 2003
Las Vegas/Monorail New fare system (new service)
ERG Contract awarded 2002; transit service to open 2004
Minneapolis-St. Paul/Metro Transit
New fare system Cubic Contract awarded; rollout planned mid-2003
Newark/PANYNJ & NJT (SmartLink)
AFC option Ascom/ASK Pilot implemented 2001
New York City-NJ/PATH AFC option Cubic Contract awarded 2002 Philadelphia/PATCO New fare system NA Under development Houston/METRO AFC upgrade Cubic Contract awarded 2002 Seattle-Puget Sound/KC Metro Regional farecard ERG Contract awarded; rollout
planned 2005
* NA = Not applicable.

32
• Ventura County, CA. The Ventura County Transporta-tion Commission (VCTC) implemented the Go Venturaproject in early 2002. Seven transit systems in thecounty are participating in this integrated regional smartcard program. This follows completion of an earlierregional smart card demonstration, the Smart Passportproject. Like TransLink, the Go Ventura system is sup-plied by the Motorola/ERG consortium. Like the earlierSmart Passport system, the new system includes con-tactless smart card readers, automated passenger coun-ters, and an automated vehicle location system. The dualinterface card technology will provide future flexibilityin allowing for the addition of nontransit functions atsome future point; these may include, for instance, cer-tain university applications.
Notable transit smart card examples from abroad includethe following:
• London, United Kingdom. The Oyster system (origi-nally called PRESTIGE) will ultimately provide smartcards for use in the entire London Underground rail sys-tem and all 30 London Transport Bus Operating Com-panies. As of mid-2002, more than 16,000 card readershad been installed at 274 Underground stations and on6,000 buses. The TranSys consortium (which includesCubic and EDS, as well as several other companies) isfinancing the capital cost of the system and will operateit for 17 years. TranSys will receive an ongoing streamof payments throughout the operating period as long asperformance standards are achieved. The consortiumbegan to issue cards to transit agency employees in late2002; a trial involving over 30,000 transit systememployees will operate until the card is issued to ridersbeginning in late-2003. Two different types of contact-less cards will be used in the system, using chips fromPhilips Semiconductors (Mifare) and Cubic. Nontransitapplications currently envisioned for the Oyster cardinclude parking, school-based services, electronic ben-efits, and retail/loyalty programs.
• Paris, France. RATP, the major transit agency in Paris,has established a consortium that includes financial insti-tutions (Société Général and Caisses d’Epargne, amongothers), telecommunications and postal entities (FranceTelecom and La Poste, respectively), and system ven-dors and integrators (including fare collection equip-ment vendor Ascom/Monetel and smart card companiesASK and SchlumbergerSema) to develop and manage aregional multiapplication smart card system. The consor-tium, called Modeus, plans to eventually to issue 5 mil-lion cards that can be used for fare payment, small retailpurchases, pay phone calls, and perhaps other types oftransactions. Modeus recently announced that it willinclude the German Geldkarte e-purse scheme on at least
some of the cards. While the e-purse will initially beused via a contact interface (i.e., on dual interface cards),the consortium would like to adapt the system to even-tually operate in the contactless mode as well.
• Hong Kong, China.Hong Kong’s Octopussystem was launchedin 1996. As of the endof 2002, nearly 9 mil-lion cards had beenissued. The Octopusstored-value card canbe used with eight bus,rail, and ferry operators in the region. The system wasdeveloped, and is operated by, a joint venture of the par-ticipating transit agencies known as Octopus Cards, Ltd.(originally called Creative Star). Central clearinghousesoftware and overall systems integration was providedby ERG, with Sony cards and readers. In early 2000,the consortium was granted a deposit-taking license bythe government. This allowed nontransit use of the card,such as for retail purchases (currently accepted at morethan 3,000 vending machines and 160 retail establish-ments, including Starbucks, Watsons, 7-Eleven conve-nience stores, and Hong Kong’s two largest grocerystore chains), parking meters, and telephone calls. Suchexternal participants pay transaction fees to Octopus fortheir smart card transactions. In 2002, Octopus launcheda loyalty program in connection with the retail applica-tions; this has reportedly increased the retail usage ofthe cards considerably. Octopus has also begun to seekopportunities outside of Hong Kong, and, by early 2003,had signed a contract to provide a multiapplication faresystem for a city in mainland China and had submittedbids to several cities in Europe.
• Pusan, South Korea. In 2000, Pusan Bank of SouthKorea began to issue dual interface multiapplicationcards, called the Digital Pusan Card, that allow card-holders to pay transit fares, pay taxes over the Internet,and make retail store and vending machine purchases.The cards also carry digital certificates as well as credit/debit and loyalty applications. The transit and bank appli-cations are separate, but linked so that fares and otherpayments can be deducted from either purse. DigitalPusan Cardholders can use the cards on existing readerson the city’s buses and trains, as the Hanaro Trans-portation Authority had previously installed a contact-less card system; 2 million transit-only cards had beenissued for this system. While the initial technology isdual interface cards (Philips Semiconductors’ MifareProcards), developments are underway ultimately to switchall applications to contactless mode. The system wasdeveloped by Korean Electronic Banking Technology(KEBT). A second bank, Kyongnam Bank, has also

33
launched its own similar multiapplication card that canbe used for transit payments.
• Curitiba, Brazil. A dual interface multiapplication card,the SchlumbergerSema Easyflex City card, has beenintroduced in Curitiba for use in transit and other func-tions. A smart card trial began in 1997, when 5,000 gov-ernment employees were provided with cards for use asIDs, for securing pay advances, and for purchases inlocal grocery stores. Transit access was added in 2001,parking payment in 2002; other applications, such asrecording health records, building access and paymentsin restaurants and gas stations are under consideration.
Impacts of Smart Card Programs
Several of the agencies in our case studies have smart cardinitiatives, including CTA, the Metropolitan TransportationCommission (San Francisco Bay area), Ventura County(CA) Transportation Commission, and WMATA. The fullcase studies are presented in Part II. However, it is useful tocompare these efforts in terms of their impacts on customersand agency operations, as is done in Table 3-3. Highlights inthe table include the following.
Customer Impacts and Benefits
• The major benefits to customers of smart cards haveincluded (1) the availability of features such as registra-tion/balance protection, employer autoload, and nega-tive balance; (2) the ability to use the same card on mul-tiple operators; and (3) the improved convenience of thecontactless interface, i.e., the card does not have to beremoved from a wallet or purse.
• Potential benefits of smart cards for customers includemultiapplication capabilities (e.g., use of the card fornontransit purposes) and innovative fare options (e.g.,WMATA’s planned Fair Fares strategy, which wouldguarantee that the customer is paying the “lowest possi-ble fare” for each ride).
• Users of smart cards have expressed generally high levelsof satisfaction with the cards and programs. For instance,in Chicago, 93% of survey respondents were satisfied orvery satisfied with the cards, and 86% expressed willing-ness to continue using the card after the conclusion ofthe pilot period and to recommend the card to others. Inthe TransLink program, both survey respondents andfocus group participants expressed a high level of satis-faction with the program. Moreover, two-thirds of non-card users surveyed said that they are “very likely” totry the card. Sales of the SmarTrip card in Washingtonhas grown steadily since its introduction, despite thefact that WMATA has done very little marketing of theprogram.
• In contrast to the use of magnetic cards, customers mustoften pay an initial fee to acquire a smart card. This costis $5 in Chicago and Washington. There is no charge inthe Go Ventura and TransLink programs (at least forthe TransLink pilot), but a customer must pay $5 forcard replacement and balance protection in these pro-grams. The $5 charge was the aspect of the programliked least by survey respondents in Chicago (cited by30% of respondents). The charge reportedly has not beenan issue in Washington to-date, although expansion ofthe program to buses could conceivably produce somecomplaints.
Agency Impacts and Benefits
Due to the short time frame and limited scope of all ofthese programs to-date, it is difficult to identify significantactual impacts and benefits. There are a number of potentialbenefits to agencies associated with use of electronic pay-ment in general and contactless smart cards in particular (seeTable 3-1), and the case study programs all anticipate suchbenefits over time as the use of smart cards is expandedthroughout each of the transit systems. The major types ofimpacts and benefits expected for these programs include thefollowing:
• Contactless cards allow faster boarding or throughputthan do fare media that have to be inserted or swiped.This could ultimately translate into service reliabilityimprovements (i.e., as higher percentages of boardingsare made using contactless cards).
• Higher data capacity and processing capabilities of smartcards facilitate the consideration of innovative types offare options and the use of data on card usage to improveservice planning.
• Smart card capabilities also facilitate convenience featuressuch as autoload arrangements (including employer-basedprograms). For instance, the SmarTrip (through Smart-Benefits) and TransLink programs both include employerautoload programs that make it easier for employers toprovide commuter benefits to their employees.
• Smart cards offer the opportunity to include transit andnontransit applications (e.g., parking or retail payments,university or employer ID/access, and other functions)on the same card. For instance, as indicated earlier, theSmarTrip card can currently be used in WMATA park-ing facilities, and the agency has established pilot proj-ects with First Union Bank and the General ServicesAdministration (GSA). VCTC has established Go Ven-tura partnerships with a university and with county socialservice agencies. MTC and CTA both plan to pursuenontransit partnerships as well.

TABLE 3-3 Case study comparison: smart card initiatives
Case-Study Agency/ Name of Program (Year Pilot Initiated)
Chicago Transit Authority/ Chicago Card (2000)
Metropolitan Transportation Commission/TransLink (2002)
Ventura County/ Go Ventura (1994)
Washington Metro/ SmarTrip (1999)
Nature of Program Smart card pilot; plan for phased full rollout
Regional pilot (6 agencies); plan for use by >26 agencies; plan for
multiapplication
Regional smart card system (7 agencies); access-to-jobs,
university applications
Smart card use on Metrorail and parking; plan for regional use;
multiapplication Special Features Negative balance, balance
protection Employer autoload,
negative balance, balanceprotection
Onboard autoload, negative balance, balance protection
Employer autoload,balance protection, “best fare”capability (being considered)
Other Participants Cubic, clearinghouse operator Transit agencies, employers, system developer/operator (ERG
consortium)
Transit agencies, CSUCI, social service Agencies, Caltrain, SCRRA,
ERG
Other transit agencies in region, First Union Bank, GSA, employers,
Cubic Transit Agency Goals of Program Improved customer convenience,
better data Improved customer convenience,
better data, seamless travel Improved customer convenience,
better data, seamless travel Improved customer convenience,
better data, seamless travel
Customer Impacts and Benefits Usage rates 3,500 cards used in pilot; plan for
200,000–500,000 in full rollout
7,500 cards issued, about 3,000 used in pilot
2200 cards (mid-2002) 325,000 cards (mid-2003)
Attitude toward program/other benefits 93% “satisfied/very satisfied”; 86% willing to continue to use card; key
benefit security of card balance
High level of satisfaction with program in surveys and focus
groups; also 67% of noncard-using transit riders said they are “very
likely” to try out card, 22% “somewhat likely”
Positive reactions to system; improved convenience through
above features
Very popular with riders: steady growth of sales, with no formal
marketing
Cost of travel $5 charge for card; this was attribute liked least
No charge for card, but $5 for balance protection and autoload
No initial charge for card, but $5 for card replacement
$5 charge for card
Agency Impacts and Benefits Benefits/advantages Faster throughput/boarding, lower
maintenance requirements; better ridership data
Demonstrated feasibility of implementing multiagency system;
greater flexibility regarding fare options
Greater flexibility regarding fare options
Flexibility/opportunities (e.g., for multiapplication, regional
integration), faster throughput
Costs/disadvantages Key disadvantage is cost of cards ($6/card for pilot); little additional
capital cost for pilot
Capital costs covered by MTC; minimal operating and maintenance costs in pilot, but will increase in full
rollout (e.g., fees)
Little cost to agencies (capital costs covered by VCTC/Caltrans/FTA)
Cost of expansion to bus: $20 million for equipment, plus fees to
regional clearinghouse, plus operating and maintenance costs
Constraints/Barriers/Issues Economic or political liability Potential negative impact on
revenue (loss of expired value from unused magnetic cards)
Potential negative impact on revenue for BART (loss of expired value from unused magnetic cards)
Problems with pilot, but these were addressed in new system
Potential negative impact on revenue (loss of expired value from unused magnetic cards); potential political (equity) issue regarding provision of smart cards only on
bus Technical or institutional barriers or issues None; card readers preinstalled in
AFC equipment Integrating readers into existing
equipment, developing fee Pilot had equipment reliability and
various institutional challenges Whether to provide magnetics on bus; whether to to provide only
structure; problems with hand-held readers (for POP)
smart cards

35
Agency Cost and Revenue Impacts
With regard to costs associated with smart card implemen-tation and operation, limited data were available for these pro-grams; however, it must be kept in mind that all of these effortsrepresent relatively small portions of the agencies’ overallfare collection systems. In two of the examples (TransLinkand Go Ventura), the bulk of the costs are being covered bythe regional planning agencies, using largely federal andstate funds. General cost estimates for procuring and imple-menting both smart card and magnetic farecard systems arepresented in Appendix C. Cost information identified for eachof the case-study programs can be summarized as follows:
• In Chicago, the card-reading equipment had alreadybeen installed (as part of the original AFC system). Thus,the major costs associated with the pilot project were forthe purchase of the cards themselves ($6 apiece for theinitial order; $5 apiece for the subsequent order) andexpenditures related to market research.
• In Washington, the card cost was initially $10 (for thepilot), but subsequently dropped to under $5 apiece. Thecosts associated with the expansion of SmarTrip toMetrobus will include capital costs for card readers andsupporting equipment (e.g., computer systems, spareparts). The total capital cost, including the cost of newfareboxes, is approximately $20 million. However, fare-boxes would be needed whether or not SmarTrip was tobe expanded; thus the entire cost cannot be attributedto SmarTrip. Additional costs for the regional expan-sion of SmarTrip include the expenses associated withthe regional clearinghouse; the methodology for alloca-tion of these costs had not yet been determined as of thiswriting. (Maryland MTA will experience the same typesof costs for its components of the SmarTrip program.)
• In Ventura County, the contract with the vendor of the GoVentura system was approximately $1.8 million. Withregard to the cards, the initial order price for the dualinterface cards was $8.50 apiece. These costs were cov-ered through capital grants from the California Depart-ment of Transportation and the Federal Transit Admin-istration (FTA). The agencies’ revenue collection andmanagement costs reportedly have not been significantlyaffected to-date. VCTC, however, has incurred additionalcosts in managing the project. In particular, a new datamanager has been hired to handle analysis and reportingfunctions.
• For TransLink, the capital cost (i.e., including systemdevelopment and provision of initial equipment) throughthe end of the pilot phase was roughly $22 million; thecapital cost for full system rollout is expected to totalanother $25 to 30 million. The operating expense for thepilot was on the order of $750,000; the total full systemoperating cost is projected at $8 to $14 million per year,depending on the level of usage of the cards and the
nature of the fees collected; the specific type of fee pay-ment arrangement for operating costs had not yet beendeveloped for the full program rollout as of this writing.While MTC has covered all capital costs and the bulk ofthe operating costs to-date, most of the individual tran-sit agencies have reported some expenses as part of theirparticipation. As noted in the evaluation of the pilot pro-gram, the types and levels of detail on costs reported bythe agencies varied widely and did not necessarily cor-relate with either the types of equipment installed or thelevel of usage of TransLink cards (6). These costs rangedfrom under $2,000 per month (for Golden Gate Transit)to approximately $20,000 per month (for BART). Agen-cies’ costs were predominantly listed under categoriessuch as equipment-related, administrative, or revenueand financial services.
The TransLink evaluation report also presented esti-mates of potential cost savings for several of the transitagencies involved in the pilot phase. In each case, thesesavings assumed extensive system-wide usage of thesmart cards and replacement of much, if not all, of theagency’s existing paper fare media. The savings wouldthus result from eliminating the agency’s own cost ofproducing and distributing fare media in favor of centralprocurement and distribution by the privately operatedservice center/clearinghouse. The estimates of potentialannual savings for each agency reported in the evalua-tion ranged from roughly $500,000 to 1,000,000, on theorder of 50 to 60% of current annual fare media pro-duction and distribution costs. Of course, it must be keptin mind that not all of the agencies’ own costs will becompletely eliminated in these cases, but rather replacedby some type of fee (e.g., per transaction) paid to theservice center. Thus, it remains to be seen how realisticthese estimates prove to be.
Constraints and Barriers and Issues.
Besides the capital and operating costs associated withthese programs, these agencies have faced, or may face atsome point, certain economic or political liabilities as well astechnical or institutional barriers in implementing and oper-ating smart card programs. Key liabilities and other issuesaffecting the case-study programs include the following:
• A potential economic liability facing all of the agenciesthat currently utilize stored-value magnetic farecards(CTA, WMATA, and BART) is the loss of expired-valuerevenue associated with unused farecards. WMATA andCTA each estimate that they accrue at least $3 million inexpired/unused value each year. In converting customersfrom magnetic farecards to smart cards, the agenciesstand to lose some of this unused revenue. In contrast tothe disposable nature of paper magnetic farecards, the

36
purchase fee and registration process ensures that mostsmart cards will be retained and reloaded time after time,effectively eliminating the possibility of expired value.As such, these smart card programs will result in reduc-tion of this unofficial source of revenue.
• The guaranteed lowest fare strategy, Fair Fare, underconsideration by WMATA and Maryland MTA couldalso have a negative impact on fare revenue—though itshould also result in some increase in ridership. Asexplained earlier, the strategy essentially converts ridesthat would otherwise have been paid for from storedvalue to free rides once the rider has reached the thresh-old usage level to have the card be read as a pass. Theextent of revenue loss, if any, will depend on the exactstructure and pricing of the program (e.g., number ofrides needed to reach certain pass levels, pass breakevenlevels) at each agency, as well as the number of ridersusing the strategy versus purchasing passes from theoutset.
• For WMATA, there is also a potential political liabilityassociated with the plan to continue charging an initialfee for obtaining the SmarTrip card when the system isexpanded. While this approach has not been an issue forMetrorail riders, the situation could change when theprogram expands to buses, where, unlike on rail, riderswill not have the option to use magnetic farecards (at noinitial cost) to obtain the discounts or bonuses attachedto use of electronic fare media. This situation, coupledwith the fact that the bus market tends to be lower incomethan the rail market, could conceivably generate equity-related complaints from riders or from community orga-nizations representing riders. Hopefully, WMATA willbe able to avoid such complaints by providing free (orvery low-cost) cards to low income riders and by educat-ing these rider markets as to the benefits to be received bybuying the card (e.g., registration and replacement ofvalue if cards are lost).
• A major technical constraint facing all of the agenciesseeking to add smart card capability to an existing farecollection system is insuring compatibility with the exist-ing system. For instance, in an effort to facilitate installa-tion of the SmarTrip readers into the Metrorail faregates,WMATA opted to sole source the implementation to theexisting rail fare collection vendor (Cubic). CTA hasavoided this issue, since smart card capabilities were builtinto the original AFC equipment; of course, in order totake advantage of the preinstalled card readers, CTAalso had to sole source the provision of smart cards toCubic. In TransLink, developing a strategy for integrat-ing the ERG smart card system into the BART faregatesbeing provided by Cubic has proven to be a significantchallenge.
• Development and implementation of the regional smartcard programs has required the establishment of oftencomplicated agreements among the various participants
on a broad range of institutional, financial, technical,and operational issues. These include details such as gov-ernance framework, cost and revenue allocation and set-tlement procedures, operator reporting requirements andcustomer service responsibilities, among others.
Smart Card Issues
As suggested above, there are a number of issues related tothe use of smart cards that a transit agency or region must con-sider. Several of the major issues are discussed further below.
Card Cost Issues
In most of the above smart card examples, as well as inmost others around the world, the smart card is intended tosupplement the agencies’ existing paper or magnetic faremedia. The primary reason for this use of multiple technolo-gies is that smart cards are currently much more expensivethan magnetic cards or tickets: $1.50 to $10 for the former(depending on card processing and storage capabilities, aswell as quantity ordered) versus $0.02 to $0.10.
In order to encourage retention of the smart card—as wellas to defray their cost—some agencies have imposed a cardissuance charge. The fee charged by WMATA has not provento be a barrier to demand for smart cards to-date; sales of theSmarTrip card have grown steadily, despite the fact thatWMATA has done very little marketing of the card thus far.Moreover, according to the agency, sales have been rela-tively evenly distributed among various purchaser incomelevels—including those with very low incomes.
The currently high card cost also makes it difficult for anagency to consider providing smart cards to one-time or occa-sional riders, since these people will certainly resist paying apurchase fee. To address this issue, much less expensivesmart cards, as well as card recycling strategies, are currentlybeing developed by the technology vendors. For instance,ASK SA, a French card-maker, has introduced its C-ticket, acontactless paper ticket intended for one-time or short-termuse; ASK actually has two versions of the ticket, one with 64bytes of memory, the other with 32 bytes. As of mid-2003,these tickets were being offered at a price reportedly as lowas $0.20 apiece for very large orders (i.e., at least several mil-lion), and around $0.40 apiece for somewhat smaller orders.Paris transit operator RATP began testing these tickets inmid-2002 and may eventually use them to replace magnetictickets for tourists and other infrequent riders; the paper tick-ets would thus become part of the family of different typesof smart cards to be offered in the Paris regional paymentprogram now being implemented. As of late 2002, over 2 million C-tickets had been shipped to RATP. RATP wouldlike to eventually get the per ticket price as low as $0.05apiece (i.e., for as many as 100 million tickets per year),although there is skepticism within the industry as to whether

37
this goal can be achieved in the foreseeable future (7). In late2002, ASK also announced a shipment of more than 2.5 mil-lion C-tickets for use on the Italian Island of Capri’s transitsystem; however, even with these low-price cards, ridersmust pay a deposit (equivalent to U.S.$0.50) to obtain a card.Meanwhile, Philips Semiconductors has introduced its owncontactless paper ticket, called Mifare UltraLight; the 64 byteticket is also expected to sell for an estimated $0.30 apiece inquantities of a million or more. In somewhat smaller quanti-ties, contactless paper tickets are expected to be offered atprices of $0.50 or less.
Another approach is being taken by Sony, which has devel-oped a recyclable contactless token. The plastic tokens arebeing introduced in New Delhi, India, for use on bus and sub-way; the system also uses conventional contactless plasticcards, similarly based on Sony’s FeliCa technology. Eachtoken will be good for a one-way trip or round-trip. On com-pletion of the trip(s), the token will be inserted into a slot tobe recycled.
Cubic has developed a different type of card recycling sys-tem for its fare collection system for Singapore. In this system,visitors can use a credit card (in a TVM) to acquire a card goodfor a day of transit use, including a deposit; when the card isreinserted into the TVM at the end of the day, the amount ofthe initial deposit is recredited to the person’s account. Ascomhas developed a similar technology. While such strategies maynot eliminate the need to charge regular users for their smartcards, they do offer potential opportunities for providing cardsto one-time or occasional users cost-effectively, therebyavoiding the need to provide a parallel magnetic system.
For regular riders, the alternative to charging a purchasefee for a card is to treat the initial fee as a deposit. This is theapproach in Hong Kong; the fee is refunded on demand if thecard is returned. The basic fee is the equivalent of aboutU.S.$6, although an option to get balance protection and $4“overdraft” protection for about U.S.$20 has also been pop-ular. The Octopus card has proven to be very popular inHong Kong, as the ratio of smart card to magnetic card usehas been around 5 to 1.
Smart Card Standards and Interoperability
One of the key smart card–related concerns in the transitindustry has been how to promote standardization and inter-operability among different technologies. Agencies want tofacilitate the availability of multiple sources of cards as theyintroduce smart card systems. Moreover, in regional systems,the integration of fare payment among multiple agenciesrequires each of the participants to be able to accept cardsissued by the other participating agencies. Thus, it is essentialthat all participating agencies agree to procure the same sys-tem or agree on a common technology standard that insuresinteroperability if agencies select systems from different ven-dors. While there exist certain standards for contactless cards,and broader standardization/guidelines efforts have been initi-
ated, the contactless card systems implemented to date haveutilized several different types of contactless interface:
• Several contactless systems, beginning in the mid-1990s(primarily in Europe and Asia) have used the “Mifare”interface developed by Mikron, a subsidiary of PhilipsSemiconductors; the Mifare technology has been licensedto several smart card manufacturers. The Seoul andPusan systems (implemented by Korean integratorsIntec and KDE, respectively) use Mifare-based cards, asdoes the recently announced Freiburg, Germany, regionalsystem (implemented by Cubic). Other examples includethe Ajax and Burlington bus systems outside of Toronto(both implemented by Canadian integrator Precursor).The Mifare technology is also being used in the LondonOyster project (along with Cubic’s Go Card).
• When Cubic began marketing a smart card upgrade for itsmagnetic systems in the mid-1990s, it used its own pro-prietary Go-Card. The WMATA SmarTrip and Chicagosmart card systems utilize the latest version of Cubic’scontactless communications interface. Cubic has alsobeen awarded contracts to provide cards and equipmentfor several other systems, including Los Angeles andSan Diego.
• Cards for the Hong Kong Octopus system (implementedby ERG) were developed by Sony and represent yetanother communications interface. Sony’s FeliCa cardsare also utilized in transit systems in Singapore, Tokyo,and Shenzen, China, and have been introduced for retaile-purse and credit card applications in Japan as well.
• Regional systems now in place or being implemented byERG in San Francisco, Ventura County, Seattle, Berlin,Rome and elsewhere are using cards based on a con-tactless chip developed by Motorola with yet a fourthcommunications interface. (Most of these contracts wereawarded to a consortium of ERG and Motorola. How-ever, Motorola has officially withdrawn from the tran-sit smart card market and ERG has assumed responsi-bility for all of these contracts.) The same interface isalso being used in chips/cards developed by severalother companies, including OTI (Israel) and ST Micro-electronics (France). This type of card is now being usedin several French systems, including Nice and Lyon(both implemented by French integrator Ascom), as wellas the Paris regional system.
Contactless card standards have been the focus of theInternational Organization for Standardization (ISO) 14443standards development group. At this point, the Mifare andMotorola/OTI/ST interfaces have been adopted as dual stan-dards (Type A and Type B, respectively). Sony, Cubic andseveral others have sought to have their cards adopted asadditional ISO contactless standards, but these proposalshave not been accepted thus far.

38
For a contactless card system to replace some of its com-ponents, such as cards, readers or system software, with com-ponents from another vendor, several interfaces need to beinteroperable:
• The “low-level” electrical details of the wireless com-munications link need to be compatible (i.e., Type A orB, or, if a proprietary interface, the cards or other com-ponents must be from the same vendor).
• The software on the card chip needs to share a commoncommand set and message formatting with the softwarein the reader, and these software applications must alsohave shared security codes.
• The software in card readers and revaluing devices mustto be able to complete data transfers with the centralclearinghouse system.
In light of the lack of a single technology, or even a singlestandard, vendors have addressed the interoperability issue bydeveloping both cards (actually chips) and readers that com-bine multiple interfaces. Several multi-interface products havebeen developed thus far (8). Samsung has made a chip thatsupports Types A and B and can be configured to accept athird interface as well; Infineon has created two chips, one thatwill support Types A and B and one, a joint effort with Sony,that will support Type B and Sony’s FeliCa. On the readerside, as mentioned above, Cubic’s “Tri-Reader” is capable ofreading Type A, Type B, and Cubic’s own contactless cards;the Tri-Reader is being used in London to support Mifare(Type A) and Cubic cards. Several other vendors, includingAscom, ASK, and SchlumbergerSema, also offer multi-interface readers, typically ones capable of reading TypesA and B.
Of course, it must be kept in mind that sharing a commonlow-level interface does not guarantee interoperability; as indi-cated above, software communications must also be compati-ble and there must be shared security data. At the softwarecommunications level, different suppliers are rarely compat-ible. Thus, unless they plan to rely on a single vendor, it isimportant that agencies participating in an integrated pay-ment program agree on a common set of specifications for allsmart card system components.
One example of an effort to promote interoperability is themultinational CALYPSO system. Developed by transit agen-cies in Paris, Venice, Lisbon, Brussels, and Constance, Ger-many, between 1998 and 2000, CALYPSO is a smart cardsystem standard that can be licensed by any interestedagency. It specifies the different aspects of a ticketing trans-action between a terminal and a card. Eleven vendors are cur-rently licensed to produce CALYPSO-compatible cards andreaders.
There are also several efforts underway to establish industry-wide—or at least regional—system specifications or guide-lines for transit smart card applications; these include thefollowing:
• ITSO. A public-private partnership of transit operatorsand government agencies in the United Kingdom, knownas the Integrated Transport Smartcard Organisations(ITSO), has developed a specification for the provisionof “interoperable contactless smart card transport tick-eting and related services in the United Kingdom” (9).
• APTA. The Universal Transit Farecard Standards Proj-ect, sponsored by APTA and FTA, is aimed at develop-ing an industry standard and set of guidelines U.S. tran-sit agencies can use in developing electronic paymentsystems. A working group consisting of federal govern-ment, transit agency, card and equipment vendor, andconsultant representatives has been established to pur-sue development of these standards and guidelines. Ini-tially, a regional fare system “Scoping Study” was con-ducted under TCRP Project J-6 (Task 42) (10). A secondTCRP project (A-26: Smart Card Interoperability Issuesfor the Transit Industry), scheduled to begin in mid-2003, seeks to develop a standard transit smart cardapplication that will facilitate interoperability among dif-ferent agencies.
• U.S.DOT/FTA/Volpe Center. The electronic pay-ment guidelines and specifications documents “definea framework for developing and implementing multi-application and other smart card–based transportationpayment systems” (11). Guidelines documents have beendeveloped to address regional multiagency integration,transit-financial partnerships, transit-university partner-ships, and transit-employer partnerships.
• New York Regional Smart Card Interface Specifica-tion. The Port Authority of New York and New Jersey,in conjunction with other agencies in the region, hasdeveloped an “Interface Specification” designed to facil-itate interoperability among payment systems imple-mented in the coming years by the region’s transitproviders.
Use of Smart Cards in a POP System
Incorporating electronic farecards into a POP systemrequires the provision of special equipment and proceduresthat allow the cardholder to properly validate the card foreach trip and the inspector to check the validity of the card.The alternative approaches to facilitate use of smart farecardsin POP are as follows:
• Modification of TVMs (or installation of separatevending/validating equipment in stations) to allow therider to use the stored value to buy a validated paperPOP ticket for that ride.
• Installation of stand-alone card processing units that willdeduct value for a ride and validate the card for that ridebut not print out a paper ticket. In this approach, the fareinspectors must be equipped with hand-held card read-

39
ers; they will then be able to determine whether the riderhas paid for the trip (or has a valid pass).
• Contactless smart card readers can be mounted at eachdoor of an LRT car, allowing a rider to “tag on” and “tagoff” on boarding and alighting the vehicle.
• In any arrangement in which the inspectors have hand-held units, a cardholder with an electronic pass—ratherthan stored value—does not have to stop and validatethe card at a TVM or card reader on every trip.
• Use of cards (or “sleeves” into which cards can beinserted) containing built-in LCD or LED displays. Therider presses a button on the card to display the fare pay-ment details (e.g., expiration date of a pass, or the dateand time of the most recent stored-value transaction),allowing the inspector to verify proper fare payment.
Given the development of new light rail, commuter rail,and bus rapid transit services, the use of POP fare collectionis seeing considerable expansion. Thus, many agencies con-sidering introduction of electronic payment must address thisissue. In the United States, the smart card systems now inplace or being developed in the San Francisco, Los Angeles,San Diego, Ventura County, Seattle/Puget Sound, Miami,Minneapolis, and Washington regions will all have to developa POP-related strategy, for instance. In most of these cases,provision of in-station card processing units and hand-heldreaders is the approach being used or proposed. Tag-on/tag-off units are used in several European systems, although fareinspectors also carry hand-held units in some of these loca-tions. In at least one case—the use of Ventura County’s GoVentura card on the Metrolink commuter rail service—thecurrent plan is that the smart card will be used to purchase apaper POP ticket from a TVM.
EMERGING ELECTRONIC PAYMENTAPPLICATIONS
As discussed above, the capabilities of electronic paymentmedia and related equipment have allowed the use of farepayment mechanisms to be expanded beyond the single oper-ator. Smart cards in particular are often being used to facili-tate multioperator regional payment strategies and are alsobeing considered in a range of multiapplication schemeslinking transit payments with one or more other functions.
Regional Payment Integration
As suggested earlier, electronicpayment media are increasinglybeing introduced to serve multi-ple operators in a region. Theobjective is to allow the samecard to be used for payment on
any participating system to facilitate seamless travel within aregion. True regional fare integration would entail all agen-cies adopting a common fare policy, based on regional passesalong with free or discounted interoperator transfers. How-ever, the use of electronic fare media effectively permits eachagency to retain its own fare structure while agreeing toaccept a common fare medium. A rider can thus pay for rideson multiple systems with a single card.
In a smart card system, the rider typically would also havethe option to load individual payment instruments (e.g., apass) from one or more agencies onto the same card. Ofcourse, a smart card could readily support a regional pass aswell; the card would track the use of the pass on the differentservices, permitting allocation of revenue from pass salesamong the participating agencies. Finally, a regional smartcard could facilitate linked-trip discounts for interoperatortransfers.
Of course, establishing a regional payment system is com-plicated. As explained in the National Guidelines and Tech-nical Specifications for Electronic Payment Systems, “Imple-menting a regional multiple agency payment system willrequire fundamental changes from the way each individualagency operates on its own. The integration of card/revenuemanagement functions from several agencies can be chal-lenging. Complex partnership agreements must be developedto address responsibilities, ownership, and allocation of costsand revenues. A clearinghouse or payment settlement processcan be established to manage these processes, but all partic-ipating agencies must come to agreement on revenue man-agement policies and procedures” (11).
The types of issues and requirements that must be consid-ered in developing a regional fare system generally fall underthe following categories (11):
• Overall Policy and Business Rules. Establishing thebusiness structure, including the financial and gover-nance framework and system procurement strategy;addressing customer concerns; setting fare policy forthe region.
• Technical Requirements. Developing system architec-ture and technology standards;, identifying effectiveimplementation staging.
• Administrative and Customer Support Functions.Establishing revenue settlement and data-sharing pro-cedures, as well as customer service functions.
The National Guidelines (11) describe these requirements.Regional fare system requirements are also discussed inTCRP Report 32 (2). Issues addressed in specific regionalintegration efforts are discussed in the following case studiesin Part II: Connecticut Transit, Maryland MTA, TransLink,Ventura County, and WMATA.
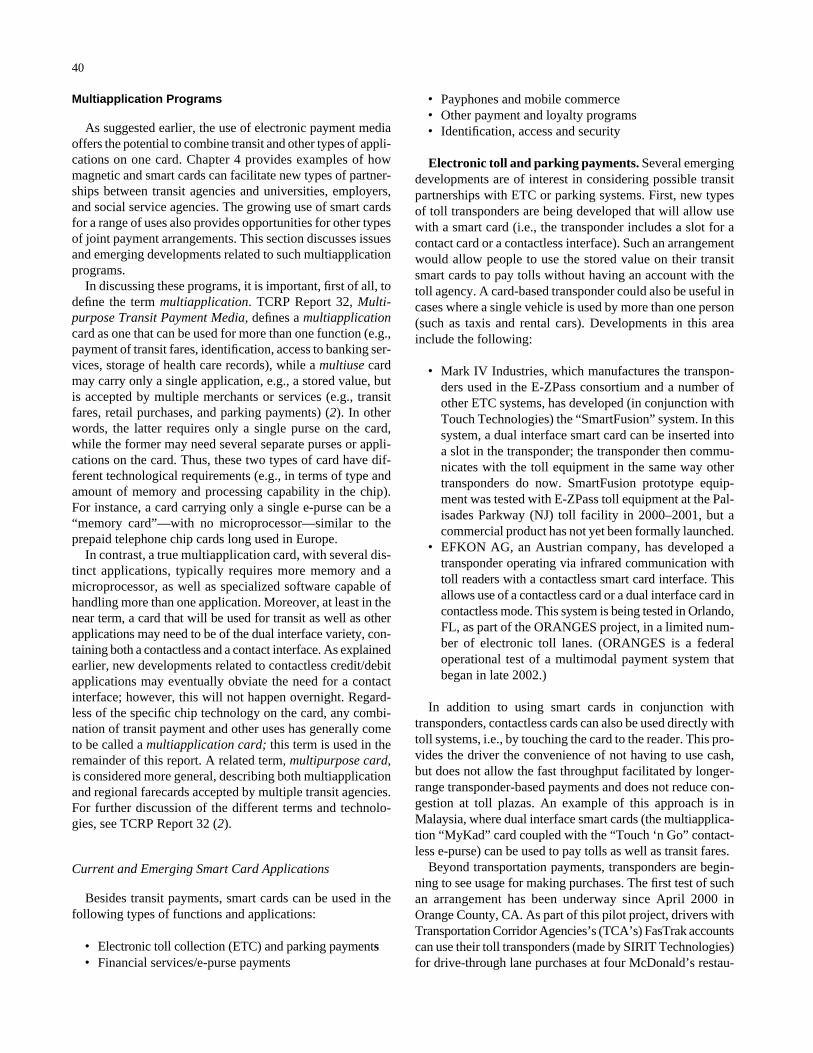
40
Multiapplication Programs
As suggested earlier, the use of electronic payment mediaoffers the potential to combine transit and other types of appli-cations on one card. Chapter 4 provides examples of howmagnetic and smart cards can facilitate new types of partner-ships between transit agencies and universities, employers,and social service agencies. The growing use of smart cardsfor a range of uses also provides opportunities for other typesof joint payment arrangements. This section discusses issuesand emerging developments related to such multiapplicationprograms.
In discussing these programs, it is important, first of all, todefine the term multiapplication. TCRP Report 32, Multi-purpose Transit Payment Media, defines a multiapplicationcard as one that can be used for more than one function (e.g.,payment of transit fares, identification, access to banking ser-vices, storage of health care records), while a multiuse cardmay carry only a single application, e.g., a stored value, butis accepted by multiple merchants or services (e.g., transitfares, retail purchases, and parking payments) (2). In otherwords, the latter requires only a single purse on the card,while the former may need several separate purses or appli-cations on the card. Thus, these two types of card have dif-ferent technological requirements (e.g., in terms of type andamount of memory and processing capability in the chip).For instance, a card carrying only a single e-purse can be a“memory card”—with no microprocessor—similar to theprepaid telephone chip cards long used in Europe.
In contrast, a true multiapplication card, with several dis-tinct applications, typically requires more memory and amicroprocessor, as well as specialized software capable ofhandling more than one application. Moreover, at least in thenear term, a card that will be used for transit as well as otherapplications may need to be of the dual interface variety, con-taining both a contactless and a contact interface. As explainedearlier, new developments related to contactless credit/debitapplications may eventually obviate the need for a contactinterface; however, this will not happen overnight. Regard-less of the specific chip technology on the card, any combi-nation of transit payment and other uses has generally cometo be called a multiapplication card; this term is used in theremainder of this report. A related term, multipurpose card,is considered more general, describing both multiapplicationand regional farecards accepted by multiple transit agencies.For further discussion of the different terms and technolo-gies, see TCRP Report 32 (2).
Current and Emerging Smart Card Applications
Besides transit payments, smart cards can be used in thefollowing types of functions and applications:
• Electronic toll collection (ETC) and parking payments• Financial services/e-purse payments
• Payphones and mobile commerce• Other payment and loyalty programs• Identification, access and security
Electronic toll and parking payments. Several emergingdevelopments are of interest in considering possible transitpartnerships with ETC or parking systems. First, new typesof toll transponders are being developed that will allow usewith a smart card (i.e., the transponder includes a slot for acontact card or a contactless interface). Such an arrangementwould allow people to use the stored value on their transitsmart cards to pay tolls without having an account with thetoll agency. A card-based transponder could also be useful incases where a single vehicle is used by more than one person(such as taxis and rental cars). Developments in this areainclude the following:
• Mark IV Industries, which manufactures the transpon-ders used in the E-ZPass consortium and a number ofother ETC systems, has developed (in conjunction withTouch Technologies) the “SmartFusion” system. In thissystem, a dual interface smart card can be inserted intoa slot in the transponder; the transponder then commu-nicates with the toll equipment in the same way othertransponders do now. SmartFusion prototype equip-ment was tested with E-ZPass toll equipment at the Pal-isades Parkway (NJ) toll facility in 2000–2001, but acommercial product has not yet been formally launched.
• EFKON AG, an Austrian company, has developed atransponder operating via infrared communication withtoll readers with a contactless smart card interface. Thisallows use of a contactless card or a dual interface card incontactless mode. This system is being tested in Orlando,FL, as part of the ORANGES project, in a limited num-ber of electronic toll lanes. (ORANGES is a federaloperational test of a multimodal payment system thatbegan in late 2002.)
In addition to using smart cards in conjunction withtransponders, contactless cards can also be used directly withtoll systems, i.e., by touching the card to the reader. This pro-vides the driver the convenience of not having to use cash,but does not allow the fast throughput facilitated by longer-range transponder-based payments and does not reduce con-gestion at toll plazas. An example of this approach is inMalaysia, where dual interface smart cards (the multiapplica-tion “MyKad” card coupled with the “Touch ‘n Go” contact-less e-purse) can be used to pay tolls as well as transit fares.
Beyond transportation payments, transponders are begin-ning to see usage for making purchases. The first test of suchan arrangement has been underway since April 2000 inOrange County, CA. As part of this pilot project, drivers withTransportation Corridor Agencies’s (TCA’s) FasTrak accountscan use their toll transponders (made by SIRIT Technologies)for drive-through lane purchases at four McDonald’s restau-

41
rants in Orange County. The restaurants pay the TCA a $0.25handling fee for each food transaction. This type of programcould potentially be used in conjunction with a transit storedvalue card inserted into a transponder. More recently, twoMcDonald’s drive-throughs on Long Island started acceptingpayment with E-ZPass transponders in July 2001 as part of aNew York MTA demonstration program. A similar test hasbeen initiated in the Dallas area.
Parking meters in a growing number of cities are beingequipped to accept smart cards, making it unnecessary tohave exact change for a meter; smart cards can also be usedin some parking lots. Card-accepting meters can be pro-
grammed to allow the user to payonly for the length of time a car isparked rather than the driver’s hav-ing to guess in advance how muchto pay. In New Britain, CT, forexample, parkers initially selectthe length of time they wish to parkand prepay accordingly; however,someone returning earlier thananticipated can insert the smart cardin the meter and have the unuseddifference restored to the card.
Examples of smart card-based parking applications linkedwith transit usage are as follows:
• In Washington, DC, WMATA’s SmarTrip card can beused at the agency’s rail station parking lots.
• In Orlando, the ORANGES project involves a centralstored-value purse system to link transit, parking, andtoll payment systems in the region. Payment transactionscompleted with the smart card readers operated by indi-vidual agencies are to be transmitted to the ORANGESclearinghouse for reimbursement. The plan is that smartcard revaluing devices operated by any of the agencieswill ultimately be able to be used to add to someone’sORANGES stored-value account balance.
Given that the payment requirements for parking meters andtransit are similar (i.e., the need for exact payment at a devicethat does not give change), there is a clear opportunity to linkpayments for these modes on a single stored-value card. Exist-ing smart card parking meters have been designed to acceptonly contact cards, thereby requiring the use of dual interfacecards. As of this writing, the major parking meter manufactur-ers (e.g., Duncan, Mackay, NS POM) have not yet introducedmeters equipped for contactless smart cards to their productlines. However, development is reportedly under way on con-tactless meters; and, indeed, a contactless interface should ulti-mately be more reliable than a contact interface, especially incold climates, where card slots can become jammed with ice.Regardless of the type of card needed, as the use of smart cardsfor both modes expands, there is likely to be an increase inintegration.
There could also be growth in the linking of transit and tollpayments, e.g., through the use of card-accepting transpon-ders. However, at least in the near term, such integration isprobably more likely to take the form of accessing a common“transportation account,” but not necessarily using the samepayment medium. In other words, a customer would set up anaccount, either tied to a credit card or through some type ofprepayment, much like the typical ETC account; this accountcould then be used for ETC payments as well as to automat-ically replenish the stored value on a transit/parking card.Since the ETC transponder remains in the car, there wouldbe no need for someone with a central account to insert asmart card into the transponder. As suggested above, the pur-pose of a card-accepting transponder would be to enablesomeone without an account to use ETC or to facilitate useof a car/transponder by more than one person.
Financial services/e-purse payments. The smart cardfocus of U.S. financial institutions has changed somewhat overthe past several years. As discussed in TCRP Report 32 (2),Visa, MasterCard and some banks at one point envisionedwidespread growth of general purpose e-purse cards suchas Visa Cash and Mondex. However, trials of Visa Cash inAtlanta during the Olympics in 1996 and both Visa Cash andMondex on the Upper West Side of Manhattan in 1997–98failed to attract significant interest from either consumers orretailers. The use of an e-purse as a replacement for cash forsmall retail purchases simply does not seem to have theappeal originally envisioned by the financial institutions.
However, in the past couple ofyears, U.S. financial institutionshave shown renewed interest insmart card technology in gen-eral. American Express and Visa(through several member banks)now issue smart cards—thoughthey each continue to have magnetic stripes as well—tar-geted primarily to secure use of the Internet. As of mid-2002,an estimated 12 million Visa cards and 3 million AmericanExpress smart cards had been issued in the United States.MasterCard has also introduced its OneSmart card that canbe issued by interested member banks. Citibank, for exam-ple, began taking orders for its MasterCard CitiSmart cardsin late 2001.
When combined with a card reader, cards such as the AmexBlue Card and the Fleet Fusion Card can be used for anony-mous small value purchases or for increased security whenmaking purchases on the Internet. These and other issuershave announced the intention to add loyalty programs andeventually credit and debit functions to the chip. Meanwhile,financial institutions are also partnering with specific retail-ers to issue branded smart cards that offer special discountsor loyalty rewards to users. For example, Target Corp. hasissued nearly 9 million Visa smart credit cards, which can be

42
used at Target stores equipped with readers; Target hadbegun the process of installing some 37,000 smart card read-ers in 1,000 stores by late 2002 and expects to offer elec-tronic coupons through the cards in 2003.
In contrast to the United States, e-purse programs arewidely available in other parts of the world (12). There aremore than 80 different e-purse systems currently operating in40 countries. These include international “brands” such asVisa Cash and Clip, as well as schemes that are affiliatedwith specific countries (e.g., Danmont in Denmark). Thereare multiple competing schemes in a number of countries(e.g., Chipper and ChipKnip in the Netherlands, and Geld-karte and PayCard in Germany). To further complicate thesituation, several systems that originated as country-specificschemes have been adopted in other countries as well. Forinstance, the German Geldkarte e-purse is now issued byseveral banks in France (under the name Moneo), and wasrecently selected as the purse to be included in cards to beissued by the Modeus transit card consortium in Paris.Finally, a number of smart card technology platforms, suchas Belgium-based Proton and Finland-based Setec Oy, offere-purse systems that can be included as standalone applica-tions on multiapplication cards (e.g., issued by a transit agencyor telecommunications company) or under other brand names.There have been several efforts to promote interoperabilityamong e-purse systems. The latest initiative is the adoptionof the Common Electronic Purse Specification (CEPS) by anumber of major e-purse issuers, including Visa, AmericanExpress, Europay, Proton World, and several European banks.CEPS is designed to create an open global standard for e-pursesmart cards, and has defined card and device applications,interfaces, data elements and messaging formats for e-purseschemes so as to allow cardholders to use compliant cardsthroughout the world. Of course, the advent of a commoncurrency across Europe has considerably reduced the needfor international e-purse specifications such as CEPS.
The use of the European e-purse schemes has actuallyshown dramatic increases in the past couple of years, i.e.,since the introduction of the euro (13). Usage of most of thee-purse schemes had been generally disappointing, with manystruggling since their introduction. Recently, however, moreand more consumers have begun to use e-purses for smalltransactions rather than carry small euro coins.
While a number of European e-purse products can beused to purchase transit fare media, direct use of e-purseprograms for transit fare payment has seen the greatestadvancement in southeast Asia. As explained earlier in thischapter, the Octopus card in Hong Kong contains an e-pursethat can be used for purchases in convenience stores andsupermarkets, and there are two different bank-sponsoredmultiapplication schemes involving transit in Pusan, SouthKorea. In Daejon City, South Korea, Hana Bank will be issu-ing a dual interface card containing a Visa Cash e-purse thatcan be used for a variety of applications, including transitfares; about half of the cards will also include Visa credit
functionality. In Japan, an association of 39 transit operatorsin the Osaka-Kyoto-Kobe region has awarded a contract fordual interface smart cards to JCB, the nation’s largest cardissuer. The cards will also include credit functionality, andJCB has begun recruiting merchants along transit routes toaccept the cards for purchases. Finally, in Singapore, thetransit agency is working with a bank to establish a partner-ship to co-issue a dual interface MasterCard that can be usedin the EZ-Link smart card-based transit payment system.
One of the more significant aspects of several Asian e-purseprograms is that they use (or plan to use) a contactless inter-face for nontransit transactions. All Octopus Card uses arecurrently contactless, and developments are underway inPusan to switch all applications ultimately to the contactlessmode. Another e-purse program, the nationwide Edy systemin Japan, also operates in a contactless mode. While the Edysystem does not currently extend to transit, it is based on thesame Sony technology utilized in the Octopus system andthus could be combined with transit applications in Tokyo andelsewhere. Edy is operated by BitWallet, Inc., a consortiumof banks, telecommunication companies, and technology ven-dors headed by Sony that also includes NTT DoCoMo (amajor telecom carrier) Sumitomo Mitsui Banking Corp.,Bank of Tokyo, Toyota, Fujitsu, Mitsubishi, and KDDI (atelecom).
In the United States as well, the aforementioned Visa andMasterCard plans to issue contactless credit/debit cards couldwell facilitate greater collaboration between banks and tran-sit agencies. While the card associations intend to focus ini-tially on applications such as fast food and conveniencestore purchases, transit applications could be added. Mas-terCard, along with Citibank, JP Morgan Chase, and MBNA,initiated the 6-month “PayPass” pilot project in Orlando,FL, in January 2003. The three banks planned to issue15–20,000 credit cards (containing both a Type B contact-less chip and a magnetic stripe) during the pilot; and a num-ber of merchants had been recruited to participate, includ-ing Friendly’s restaurants, Chevron service stations,Loew’s movie theaters, and Wolf and Ritz camera shops.MasterCard had previously tested the card with its employ-ees in the cafeteria at its corporate headquarters and foundthat the use of credit cards for payments there rose from 2%to 28% (14).
Bank-sponsored e-purse programs may eventually seeacceptance in this country as well, although it is widely feltthat an e-purse card would be of greater interest to both con-sumers and merchants if combined with applications such astransit and parking meter payments—i.e., applications thatrequire prepayment using exact payment amounts. In theAtlanta Visa Cash project, while the cards saw relatively lit-tle use overall, transit represented the largest single use;moreover, one assessment of the Manhattan trial was that itmight have been much more successful had it included tran-sit as an application. Thus, as smart cards see greater use intransit and other markets, we may begin to see transit agen-

43
cies accept bank-issued e-purse cards or include commerciale-purse schemes on transit farecards.
In the meantime, banks may also seek to partner with tran-sit agencies in other ways. For instance, WMATA and CTAhave each pursued agreements with local banks related to theissuance of fare media:
• In April 2000, WMATA and First Union Bank initiateda pilot project involving the combination of WMATA’sSmarTrip contactless transit application and First Union’smagnetic ATM application in a single card. These cards,issued to about 1,000 interested First Union account
holders, allow the users toload value from their ATMaccounts into the transit chipat WMATA automated vend-ing machines. As of late2002, this trial was continu-ing. (The future of this pro-gram was cast in doubt with
the 2002 purchase of First Union Bank by WachoviaBank. While the existing cards could continue to beused, Wachovia had shown [as of mid-2003] no incli-nation to issue new bank cards carrying the SmarTripapplication.)
• The CTA has established a preliminary agreement withLaSalle Bank to conduct a pilot project to vend CTA’smagnetic stored-value cards through LaSalle ATMs at adozen downtown and inner suburban locations. The planis that a person buying a transit card will be required tohave an account with the bank, at least during the pilotproject, as the cost of the card will be withdrawn fromthe purchaser’s bank account. (As of early 2003, thisproject had not been approved by the CTA’s Board ofDirectors.)
Payphones and mobile commerce. Smart cards have longbeen used in Europe for payphones, and several U.S. tele-phone companies, such as GTE and U.S. West, have nowbegun equipping payphones for smart card acceptance in thiscountry as well. Meanwhile, telecommunications companiesaround the world are starting to develop multiapplication pro-grams, both for payphones and for personal mobile phones. InMexico, for instance, a large smart card system (6 millioncards are planned) is being rolled out for use in Tel-Mex pay-phones and for retail and fast food purchases; it will be pos-sible to reload the cards via the payphones, a well as at bankATMs and stand-alone kiosks. Those cards issued to BancoInbursa customers are also being equipped with chip-basedcredit/debit functionality. In South Korea, SK Telecom (SKT)recently joined with five banks to launch a multiapplicationcard that will include the Visa Cash e-purse and a credit ordebit application; several of the banks also plan to offer acontactless transit application, and other functions being con-
sidered include loyalty and Internet security applications. Allthree of South Korea’s telecoms—SKT, LG TeleCom, andKT Freetel—have also recently announced strategies formobile phones. These programs involve special dual interfacesmart cards for mobile handsets and, in some cases, creditapplications stored in the handsets themselves; two of theseprograms will include transit applications, as is described fur-ther in the example below.
Smart cards are also being used as subscriber identity mod-ule (SIM) cards with certain types of mobile phones. EachSIM card contains unique user identification features, allow-ing the card to be used with any compatible device (freeingthe cardholder from reliance on a single phone). SIM cardsare most widely used with Global System for Mobile com-munications (GSM) phones; GSM is the dominant mobilephone architecture in Europe, but is not currently supportedin the United States. However, SIM-type cards are also beingintroduced for other cellular architectures, such as CDMA(widely used in Asia) and TDMA (the most common formatin North America).
Some of the more recent SIM cards use a larger amount ofmemory and support additional applications—one of whichcan be a small web browser suited for use with web sitesequipped to communicate using the Wireless ApplicationsProtocol (WAP). Although initial consumer reaction has beengenerally lukewarm to browsing under the limitations of thesmall display, some mobile service providers in Europe nowuse SIM applications to allow the customer to purchase itemsviewed at WAP sites. Typically, the customer uses the mobilephone to enter a PIN, which is authenticated over the phoneby the SIM payment application. The SIM card then uses thephone to authorize the WAP site to complete the purchase(e.g., using prestored credit or debit card information, addingthe value to the mobile phone bill, or deducting from a pre-paid balance).
In the general area of mobile commerce (commonly calledm-commerce), a possibly significant development is that fourof the major international card companies, Visa International,MasterCard International, American Express, and JCB Co.(Japan), have recently established a joint mobile commercegroup to facilitate wireless card-based transactions. The non-profit Mobile Payment Forum is seen as linking the financialand mobile communications industries and will seek partici-pation from a full range of merchants, vendors, and systemoperators.
Several recent technological m-commerce developmentsare of direct interest to the transit industry; these include thefollowing:
• As indicated above, South Korean telecoms KT Freetel(KTF) and SKT are introducing m-commerce schemesfor mobile phones that will include transit applications(15). KTF planned to launch its “K-merce” system bythe end of 2002. The system will include a credit appli-cation (via credit card issuers Kookmin Bank or BC

44
Card) either embedded in the handset or stored in a dualinterface card that will let customers pay transit faresthat are then billed to the credit account; the alternativemechanism will be to reload the transit purse wirelesslyand pay the fare from the purse. SKT’s m-commercescheme, also scheduled to be rolled out in late 2002, willalso allow transit fare payment via a dual interface cardused with a mobile phone. A third-generation mobilephone operator, KT ICOM, also plans to include a tran-sit application—via an embedded contactless chip—inits new system planned for late 2003.
• A mobile transit ticketing system was tested in 2001 inHelsinki, Finland, that allowed purchase of transit tick-ets via mobile phones using the Short Message Service(i.e., text paging). In this system, developed by PlusDialMTSP and Add2Phone, the user requests and receivesan electronic ticket on the phone. The ticket (displayedon the phone’s screen) is then shown to the transit oper-ator as proof of payment; the system also provides forchecking service schedules via the phone. The initialtest of this technology was very successful, and HKL(the Helsinki transit agency) planned to conduct furthertesting as of early 2002.
• A related m-commerce technology strategy being pro-duced by smart card system developers OTI and FungeSystems will also facilitate contactless downloads andpayments via mobile phones and PDAs. The user willload funds online or via telephone to a SIM-type card.The “smart phone” can then be used for purchases atcompatible contactless point of sale devices, such as tran-sit ticket vending machines. To obtain a transit ticket—oran item from another type of vending machine—the userwill only have to hold the phone or PDA near the con-tactless reader (i.e., like using a contactless smart card);the cost of the ticket will be automatically deducted fromthe value stored in the phone or PDA. Thus, a secureoff-line transaction will be feasible without the need fora phone call to authorize the purchase.
• In 2001, the Japanese mobile phone network operatorNTT DoCoMo conducted a 6-month trial of a PDA-based m-commerce system in Sapporo. The PDAs con-tained Sony contactless chips, which carried an e-purse.The unit could be used to pay for subway fares, vendingmachine purchases, and other purchases, such as con-cert tickets. NTT DoCoMo, along with other mobiletelecoms, is also involved in negotiations with JR EastRail in Tokyo to store the Suica fare payment applica-tion on miniature contactless smart cards that would beused with mobile phones.
Thus, transit fare payment would appear to be a naturalapplication of m-commerce schemes. As emerging short-range wireless technologies such as Bluetooth begin to seewider usage, m-commerce strategies should expand as well;the emerging Bluetooth standard would allow payment appli-
cations in PDAs to communicate about thirty feet, a longerrange than a contactless smart card interface can transmit.
Other payment and loyalty programs. Beyond bank-sponsored e-purse initiatives, a variety of other types of pay-ment purchasing and loyalty program applications also offerpotential tie-ins with transit payment. For instance, smartcards have been used by sports arenas, movie theaters, andother entertainment venues for such functions as ticketing,purchase of food or merchandise, and loyalty rewards pro-grams. The County of Honolulu, for example, plans to imple-ment a smart card system that can be used for transit andattractions, such as the local zoo. The City of Anaheim hasreceived proposals to develop a smart card system for theAnaheim Resort; the purpose of this card is to give visitorsaccess to the privately sponsored Anaheim Resort Transitsystem, facilitate point of sale retail transactions, and providefor other resort-related uses.
As indicated above, smart cards are being promoted as ameans of providing secure online transactions, e.g., overthe Internet via personal computers. This requires a readerattached to the computer, through either a wireless or directconnection. Smart cards are also seeing use with digital tele-vision set-top boxes; the cards are used for pay-per-view andfor identification purposes. Meanwhile, some companies haveintroduced smart cards as digital gift certificates; for instance,Sony Canada offers such a card, and Rite Aid has tested thisconcept in its pharmacies, in the United States. Finally, smartcards have been used by various other types of entities thatrequire low-value cash payments or exact change; examplesinclude laundromats, vending machines, and copy centers.One example of a laundry industry card is the Speed QueenCardMate Plus program; this proprietary card can be usedinstead of coins to pay for washers and dryers operated byHOF Laundry Systems in the Washington, DC, area (16).
While such applications typically use cards as the paymentmedium, electronic commerce programs are also being intro-duced using noncard media. The m-commerce strategies dis-cussed above represent one approach; another is the use ofradio frequency identification (RFID) key fob devices, suchas the ExxonMobil Speedpass. Speedpass, which is linked toa user’s preregistered credit or checking account, has beenavailable for buying gasoline at Mobil and Exxon stationssince 1997; as of early 2003, more than 6.5 million Speed-passes had been issued and could be used at nearly half of the16,000 Exxon and Mobil service stations; it is estimated thatas many as 20% of transactions at these stations are beingmade with the device (17). Speedpass’s functionality hasrecently been expanded, as the device can now be used to payfor purchases at 440 McDonalds’ restaurants in Chicago.Speedpass is also being tested in several Stop and Shopsupermarkets in Massachusetts, with plans to eventuallyexpand to all of the company’s stores; the Stop and Shoppilot is testing out a new feature in which retailers can oper-ate their own loyalty programs. ExxonMobil plans to further

expand the use of Speedpass, as it has established a sub-sidiary (Speedpass Network) that is pursuing partnershipswith grocery stores and other merchant chains (18).
Other fuel companies, including Shell Oil (“EasyPay”)and Phillips Petroleum (“Philpass”), have also tested theirown versions of the contactless device, although Shell hasapparently ended its RFID testing in the United States (19).Meanwhile, a number of independent station owners haveinstalled a similar system, provided by Verifone, called Veri-pass. Veripass differs from the other devices in that it has asmart card-type chip (provided by OTI) that can accommo-date a loyalty program and other applications; Speedpass,produced by Texas Instruments, has limited memory and noprocessing capabilities, carrying only an ID number that ties
the device to the user’saccount. Either technol-ogy could conceivablybe deployed for transitpayment, but, while adevice such as Veripasscould be configured tocarry a prepaid transitapplication, a Speed-pass-type device wouldhave to operate in apostpayment mode (18).
Identification, access, and information. In addition topayment-related applications, smart cards and other chip-based devices are used for a variety of identification, access,and information functions. There has been some activity insecurity-related smart card areas over the past few years.However, the terrorist attacks of September 11, 2001, havecreated a renewed focus on the security and identificationcapabilities of smart cards. As indicated earlier, secure Inter-net access has been a key focus of cards issued by severalfinancial institutions. However, smart cards are also seen asan excellent medium for providing identification and secureaccess in a range of other environments, including computernetworks, airports, and government facilities. For instance,as companies and agencies develop public key infrastruc-tures (PKIs) to ensure network security, smart cards can beused to carry digital certificates or private “keys” that employ-ees need to access networks. Thus far, the federal govern-ment has been the major user of PKIs, but use by privatecompanies is expected to grow.
Smart cards are also being considered, often in conjunc-tion with biometrics, for providing various types of personalidentification; among the suggested applications have been a“national ID card” for all U.S. citizens and a “trusted trav-eler” card for use by frequent travelers (i.e., to facilitatequicker passage through airport security checkpoint). The ideaof any type of mandatory ID card is a controversial notion andhas engendered strong opposition in Congress and in the BushAdministration, primarily due to privacy concerns. However,
45
a voluntary ID card, such as the frequent traveler card, is lesscontroversial, and has sparked interest among business trav-elers and the airline industry. In fact, several airlines and air-ports are reportedly working on developing a trial of the con-cept (20). In Canada, a smart card is under development bygovernment agencies that will utilize iris-recognition tech-nology to expedite identification of cardholders at customsand immigration booths in major Canadian airports. Similarcards have been proposed by U.S. airlines and governmentofficials.
Federal agencies in the United States have actually begunto issue cards for access, identification, and other purposes.The GSA awarded a $1.5 billion Government Wide Acqui-sition Contract to five companies (EDS, Logicon, PRC, 3-GInternational, and KPMG Consulting) in May 2000 for thedelivery of smart cards to federal agencies, and the GSAhas been testing smart cards for its own employees since1999. For a multiapplication trial initiated in August 2000,100 dual interface cards were issued to GSA employees.Each of these cards included the WMATA SmarTrip transitapplication, contactless building access, biometric networkaccess, medical emergency information, digital signaturesfor signing e-mail, and credit card capabilities. As of 2002,this trial remained in progress. The Department of Defense,beginning with the Navy, is in the process of issuing whatcould turn out to be as many as 4 million smart cards toemployees and contractors; these cards provide for identifi-cation and secure building and network access and can alsobe used for some purchases. Finally, the U.S. TransportationSecurity Administration (TSA) has proposed a Transporta-tion Workers Identification Credential (TWIC) card for alltransportation industry employees. TSA planned to conducta 5-month pilot beginning in mid-2003 to evaluate alterna-tive card technologies (smart card, optical memory card,magnetic stripe, and bar codes), followed by a 7-month pro-totype development phase. TSA would then roll out theTWIC as early as 2004.
One of the newest uses of smart (and RFID) cards in theUnited States is to access vehicles in emerging car-sharing,or short-term auto rental, programs. These programs, run bycompanies such as Zipcar, Flexcar and Carlink, allow regis-tered participants to rent a car by the hour; the cars are typi-cally distributed among several locations in an urban area,perhaps including one or more rail stations. The companiesprovide registered users with smart cards or RFID devicesthat can unlock the cars’ doors; similar companies in Europealso use smart cards to start the car. Given transit agencies’growing interest in issuing smart cards, car-sharing compa-nies see a natural link with transit card programs. In fact,WMATA has considered entering into a partnership withFlexcar, Inc., allowing transit riders to use their SmarTripcards to access the company’s cars. The company is report-edly pursuing similar partnerships with other transit agenciesas well, and the other car-sharing companies are similarly dis-cussing possible partnerships with transit agencies in otherlocations (21).

Other purposes proposed for smart cards include improvingthe functionality of driver’s licenses and providing for the con-venient storage of individuals’ health records. Several stateshave investigated automating driver’s licenses, although nonehave made the move to smart cards as yet. Utah and New Jer-sey each proposed smart driver’s license programs, but failedto get them approved by their state legislatures. Other states,including Maryland and Connecticut, have also studied thisoption. At the national level, a push for a standardized dri-ver’s license by the American Association of Motor VehicleAdministrators (AAMVA) has met with strong resistancefrom Congress, leaving any advanced technology strategy upto the individual states. In Canada, the Province of Ontariohas announced plans to establish a card for all residents thatwould include the driver’s license, as well as health records,birth certificate, and possibly other applications. Meanwhile,smart cards have been used extensively for maintaininghealth records in other parts of the world, including nationalprograms in Germany (the system also covers Austria),France, Italy, and Taiwan.
Multiapplication Program Business Strategies
A transit payment application could conceivably be linkedto one or more of the above functions through one of the fol-lowing basic strategies:
• Allowing expanded use of the transit stored-value purse(e.g., for small retail purchases).
• Adding one or more other applications to the transitfarecard.
• Including a transit application on another entity’s smartcard—or allowing a commercial e-purse scheme to beused for transit payments.
Thus, a key set of issues to be addressed in establishing amultiapplication arrangement relates to the nature of the busi-ness structure, including the financial and governance frame-work and the system procurement strategy. Such programsmay involve complex partnership agreements that clearlylay out each party’s position with regard to responsibilities(e.g., for card issuance, account settlement/clearing, datareporting), system ownership, allocation of program costsand revenues, and card branding and other contractual terms/conditions. (For a discussion of these issues, see the NationalGuidelines (11). Modules in this study most relevant to thissection include the Transit-Financial Module, April 1999, theTransit-Financial Collaboration Requirements Module—Summary, August 2000, and Smart Card Based Transit FareCollection System Requirements—Overall Summary, August2000.
Also at issue is whether the multiapplication program willbe established as an open or closed system or some variationthereof. These approaches can be defined as follows (2):
46
• The term open system is defined in different ways,although a truly open system is one in which there aremultiple card issuers and multiple service providers ormerchants; for instance, credit and debit cards operatein an open system. However, the term “open” is also fre-quently used, particularly in the transit industry, todescribe a payment system in which an outside entity’s(e.g., a bank) card is accepted for use by a transit agency(or other type of entity).
• A closed system is one in which the card is issued by asingle entity and can be used only for that entity’s ser-vices. Transit fare payment has traditionally operated ina closed system, for instance; other examples include auniversity campus card or a prepaid telephone card.
• A closed multiapplication system is emerging. In such asystem, a transit agency’s card can be used for morethan one purpose. The integrated regional farecard orthe expanded use transit card represents an example ofsuch a system.
• An intersecting closed system is one in which one typeof card carries another type of closed system applica-tion; an example is a university card that is loaded witha transit application.
As noted in TCRP Report 32, “Clearly, there is somethingof a continuum between open and closed; moreover, a sys-tem may well evolve from closed to open. For a transitagency, however, the key distinction is whether it is (1) issu-ing its own card or (2) accepting a card issued by one or morenontransit entities” (2). In other words, if a rider can use acard issued by a local bank to ride transit, this can be con-sidered an open system.
The most common type of open payment system is thebasic e-purse scheme, mentioned above. There are severaldifferent business models through which a transit agency—ora regional consortium—could participate in an open system:
• The agency could be a “merchant” service provider in anopen system program. In this model, the transit agencywould typically pay fees for fare transaction settlement.
• The agency could be a card issuer and a service pro-vider in an open system. Issuer fees would offset ser-vice provider transaction fees, but the agency would alsocarry the various financial risks associated with being anissuer in an open system. This model is unlikely in aVisa- or MasterCard-sponsored system, since card issu-ance in such systems is limited to association members,all of which are typically banks.
• The agency or consortium could develop and operate anopen system of its own. The agency would typically bean issuer and a service provider in this system and wouldalso allow other entities to issue or accept cards, pro-vided they met the basic program requirements. In thisapproach, the agency would carry the risks associatedwith both issuer and system operator.

Given the risks associated with becoming an open systemissuer and operator, it is expected that most transit agencieswould be reluctant to assume such a role. Thus, the firstmodel, participating as a merchant/service provider only, isa much more likely form of transit participation in an opensystem for the foreseeable future.
Summary: Multiapplication Programs
The introduction of electronic payment media, particularlysmart cards, presents transit agencies with opportunities tolink transit fare payment to a range of other uses. The focusin many types of programs is increasingly on providing mul-tiple functions on a card; transit fare payment is often con-sidered an important application, regardless of the primaryuse and issuer of the card. New types of transit agency part-nerships can now be considered with toll and parking sys-tems, employers, universities, financial institutions, telecom-munications companies, and various other entities that couldissue or accept a smart card to access or pay for their goodsor services.
As indicated above, several U.S. transit agencies are test-ing—or at least plan on pursuing—multiapplication arrange-ments. For instance, WMATA’s SmarTrip card can be used
47
for certain parking applications, and the agency is involvedin trials of integration with a bank and government agencies,as well as plans to partner with a short-term auto rental pro-gram. LYNX in Orlando (FL) is involved in development ofa multimodal payment system. Ventura County (CA) hasimplemented an integrated regional smart card system andis developing a plan to tie it in with a local university.TransLink in the San Francisco Bay Area plans to pursuelinks to parking and other functions. Other regions develop-ing integrated electronic payment systems (e.g., Seattle, LosAngeles, San Diego, Boston, and Atlanta) are also likely toconsider multiapplication opportunities. Meanwhile, a num-ber of projects abroad have established various types ofmultiapplication arrangements in which transit is a majorfocus. For instance, in the Hong Kong Octopus system, theOctopus card is accepted by Watsons and 7-Eleven conve-nience stores, Starbucks coffee shops, vending machines,and designated parking meters and payphones.
Such projects demonstrate the broad range of both institu-tional and business settings and potential combinations offunctions that can be included in a transit-oriented multi-application program. As the use of smart cards for both tran-sit payment and other purposes spreads in the United States inthe coming years, the opportunities for linking multiple appli-cations on a single card should show considerable expansion.

48
CHAPTER 4
EMERGING FARE-RELATED ISSUES AND PROGRAMS
INTRODUCTION
As suggested in the previous chapters, fare policy and pric-ing initiatives are increasingly influenced by developmentsrelated to a range of issues and opportunities to establish var-ious types of partnerships. Key issues and partnership oppor-tunities include the following.
• Environmental justice. The movement to insure thatall population segments are treated equitably with regardto environmental issues is increasingly encompassingand affecting the fare decision-making process.
• University programs. Many universities have estab-lished partnerships with local transit agencies to providespecially priced passes or other payment options to stu-dents, faculty, and staff.
• Employer benefits programs. In conjunction with theallowance of pretax employee transit benefits ($100 permonth per employee as of January 2002), several typesof employer-oriented programs have been developed.
• Access-to-jobs programs. Access-to-jobs programs areprompting transit agencies—along with social serviceagencies and employers—to consider special arrange-ments for providing transit payment options to programparticipants.
Environmental justice factors in particular have directlyinfluenced final fare structure decisions in a number of cities,through concerted opposition to (and in some cases secur-ing injunctions against) proposed fare increases or changes;political concerns in general have affected the decision-making process at other agencies. Meanwhile, the emergenceof partnerships and special payment or pricing arrangementsinvolving universities, employer benefits programs, access-to-jobs programs, and various other types of programs orentities represents another important development relatedto fare policy. The result has typically been the establishmentof such options as special low-priced passes or full-pricepasses subsidized by another entity (e.g., social service agency,university, or employer). Examples of, and developmentsrelated to, such programs and initiatives are discussed in thischapter.
EQUITY AND ENVIRONMENTAL JUSTICEISSUES
Environmental justice refers to efforts to insure that all pop-ulation segments, including low-income and minority groups,receive fair treatment with regard to environmental and civilrights issues in the provision of publicly funded services. “Fairtreatment” is defined by the U.S. Environmental ProtectionAgency to mean that “. . . no group of people, including racial,ethnic, or socio-economic group, should bear a disproportion-ate share of the negative environmental consequences . . .”resulting from federal, state or local programs (22). Environ-mental justice and other environmental (e.g., air quality) andequity-based efforts are increasingly affecting transit agen-cies’ consideration of potential fare changes. As suggestedabove, such initiatives have resulted in legal challenges toproposed fare increases in several cities; moreover, evenwhere such challenges have not proven successful—or havenot actually entered the courts—they have certainly influencedthe fare policy decision-making process. Notable examples offare-related environmental justice and other environmentaland equity-based efforts over the past few years include thefollowing:
• The Los Angeles County Metropolitan Transporta-tion Authority is currently bound by a consent decreethat has legally limited the extent to which the MTA canraise fares over the past several years. This action resultedfrom a suit filed by a community-based coalition seekingto prevent implementation of a fare increase and the pro-posed elimination of monthly passes.
• In Philadelphia, a number of community-based law-suits have led to changes in the process by which theSoutheastern Pennsylvania Transportation Authorityadopts fare changes. One of these suits also led SEPTAto introduce highly discounted tokens (only two tokensneed be purchased to receive a 28% discount.)
• When the New York Metropolitan TransportationAuthority proposed fare increases in 1995, several com-munity organizations filed suit to block the changes. Thesuit claimed that the fact that the increase on subway andbus (20% increase) was higher than that on the commuterrailroads (9% increase) was discriminatory.

49
• Following the June 2000 approval of a fare increase bythe Metropolitan Atlanta Rapid Transit AuthorityBoard of Directors, a coalition of community groups fileda discrimination complaint against the agency. TheAtlanta City Council and the Fulton County Commis-sion also adopted resolutions opposing the fare increase.
• Opposition by community and environmental groups inBoston to a Fall 2000 fare increase led the Massachu-setts Bay Transportation Authority to introduce freebus-bus transfers as well as a low-price weekly pass forthe first time.
While these examples share certain common themes, theoutcomes—in terms both of legal rulings and the impact onthe fare decision making of the transit agencies—have dif-fered considerably. The initiatives and results in each city aresummarized in Table 4-1 and described below.
Los Angeles
In September 1994, a coalition of several local commu-nity organizations and transit advocacy groups, includingthe Labor/Community Strategy Center and the Bus RidersUnion, filed suit against the MTA. The plaintiffs sought toprevent the implementation of a new fare structure that wouldraise the bus fare (from $1.10 to $1.35) and eliminatemonthly passes (priced at $42). The plaintiffs alleged that theMTA was trying to operate a “discriminatory two tier, sepa-rate and unequal system of public transportation—one forpoor minority bus riders and another designed to serve pre-dominantly white and relatively wealthy rail riders” in viola-tion of the Fourteenth Amendment to the U.S. Constitution,
the Civil Rights Act of 1866, Title VI of the Civil Rights Actof 1964, and U.S. DOT regulations. In filing the suit, theplaintiffs claimed that the MTA:
• Was spending 71% of its resources on rail projects,despite the fact that 94% of MTA patrons are bus riders,
• Refused to provide service to minority communities orto connect them to other areas,
• Provided inferior bus service,• Imposed arbitrary transfers in minority communities, and• Made racially motivated changes in rapid rail plans.
The U.S. District Court judge granted a temporary restrain-ing order in October 1994 blocking the proposed fare changeon the grounds that:
• Any harm to the defendants from being enjoined paled incomparison to the harm to plaintiffs if the fare changeswere implemented; and
• The plaintiffs had presented more than sufficient evidenceto meet their burden of showing that (1) the MTA’sactions adversely affected minorities, (2) the MTA’sactions were not justified by business necessity, and (3) the MTA had rejected less discriminatory alternatives.
In January 1995, the parties entered into a tentative agree-ment and the restraining order was lifted. Thus, in February1995, the MTA implemented a modified fare change, raisingthe cash fare to $1.35, but keeping the monthly pass. TheMTA initially increased the pass price to $49, but was sub-sequently ordered to return it to the original $42 price and tointroduce a weekly pass ($11 per week).
TABLE 4-1 Equity and environmental justice challenges to fare increases
Location Proposed Fare Change Year Lawsuit? Outcome
New York City 20% increase (NYCTA) 9% increase (LIRR, MNCR)
1995 Yes Fare increase upheld
Los Angeles $1.10 to $1.35 eliminate passes
1995 Yes Fare increase upheld, but passes retained (at lower price); consent decree imposed on MTA
Philadelphia* $1.60 to $2 2001 Yes Fare increase upheld Philadelphia $1.25 to $1.50 1990 Yes Fare increase upheld, but
SEPTA agreed to offer discounted token in 2-packs (had been only 10)
Philadelphia $1 to $1.25 1986 Yes Fare increase upheld, but plaintiffs given right to review all SEPTA public records
Atlanta $1.50 to $1.75 2000 No Fare increase retained Boston $0.85 to $1 (rail)
$0.60 to $0.75 (bus) 2000 No Negotiated introduction of
free bus-bus transfers and 1-wk passes
*Only selected cases are included for Philadelphia; others are described in the text.

50
The litigation and negotiations continued until October1996, when the court approved a consent decree (23). Theconsent decree provided for additional bus service in minor-ity areas and established specific criteria to reduce crowdingon buses, including target maximum passenger load factorsand dates by which these targets must be met. The consentdecree also called for the creation of a Joint Working Group(JWG), composed of an equal number of representatives ofthe MTA and the plaintiff’s class. The MTA was required toconsult with the JWG in formulating and implementing itsplan for reducing overcrowding, although the MTA wouldhave discretion in determining how the targets would be met.The MTA was also required to work with the JWG in thedevelopment and implementation of bus service improvementplans, on fare adjustment issues, and on the methodology andprocedures for ridership surveys. The consent decree allowedthe MTA to consider a fare increase after October 1, 1998. Asof late 2002, the MTA had not raised fares, although theagency has considered possible changes.
Disputes under the Consent Decree on issues involving theJWG are initially addressed by the JWG. If the JWG cannotresolve the dispute, it is referred to the attorneys for the partiesand then, if necessary, to a Special Master appointed by theU.S. District Court. The District Court is monitoring compli-ance for 10 years, although it may terminate the decree after7 years if the MTA is found to be in compliance and has a ser-vice plan projecting compliance for the following 5 years.
Philadelphia
Beginning in 1970, SEPTA has faced legal challenges tomost of its proposed fare changes; in fact, as indicated above,the 2001 fare change is currently being appealed in the courts.Several of the earlier challenges resulted in changes in thestatutes governing SEPTA or in the process by which SEPTAadopts fare changes; these lawsuits and their results are brieflyreviewed here.
1970. The City of Philadelphia opposed a proposed fareincrease, was outvoted on the SEPTA Board, and then chal-lenged the fare increase on the grounds that it violated a sep-arate contract between SEPTA and the City. The trial courtupheld the City’s position, but the appeals court, after chastis-ing both the City and SEPTA for acting as adversaries, heldthat SEPTA could not contract away its right to set fares andthat SEPTA could not meet its obligations without a fareincrease or some other source of additional revenue (24).This decision was upheld by the Pennsylvania Supreme Courton appeal (25), which emphasized that the statute governingfare increases by SEPTA limited review of these increases to“manifest and flagrant abuse of discretion or error of law”(26). Since neither of the parties could identify a specificalternative source of additional revenue, SEPTA’s fareincrease was upheld.
1977. In early 1976, SEPTA proposed a fare increase, tobe adopted in May of that year, and public hearings wereheld. However, the fare increase was vetoed by the City ofPhiladelphia’s representatives on the Board. The Board con-tinued to discuss a possible fare increase during 1976 andearly 1977. Following a 45-day strike in March 1977, theBoard approved a fare increase smaller than what had beenproposed in 1976. The Coalition for Better Transportation inthe City filed suit, arguing that the original fare proposal andhearing had expired and that the Board could not adopt a fareincrease without filing a new proposal and holding a newhearing. While this was sufficient to win the plaintiffs a tem-porary restraining order, at a hearing 2 days later the judgedissolved the restraining order and dismissed the lawsuit.This was affirmed on appeal, where the court held that theoriginal proposal had not expired and that the 1976 publichearing, together with continued discussions of budgets andfare increases, met the requirements for public hearings andpublic participation (27).
1986. The Consumer Education and Protective Associa-tion asked for a broad range of documents prior to the publichearings on a proposed fare increase on the grounds that theyneeded the documents to prepare for the hearing. These doc-uments included all the backup documentation for SEPTA’soperating budget, all liability insurance policies and liabil-ity claims data, all documents relating to the proposed fareincrease and all alternatives considered, and all documentsdescribing SEPTA’s efforts to get more county, state or fed-eral subsidies. SEPTA provided only the operating budgetproposal and those documents SEPTA planned to introduceinto the hearing record. The plaintiffs claimed that they hada right to all documents to prepare for the hearing. WhileSEPTA won at the trial level, the plaintiffs were successfulin part at the appeals level in 1989, where the court held thatthey had a right to review all public records (28). Thisincluded all data integral to developing SEPTA’s budget pro-posal, SEPTA’s liability policies, documents relating to theimpact of the proposed fare increases, documents related toefforts to obtain more subsidies, monthly management reports,recent audits, and similar documents. In 1994, this decisionwas codified, making SEPTA specifically subject to the Penn-sylvania Right-to-Know Act (29).
1988. The Committee for a Better North Philadelphia(CBNP) challenged a fare increase in federal court on thegrounds that SEPTA’s allocation of federal subsidies had adiscriminatory impact on the minority community of Philadel-phia. SEPTA admitted that the City Transit Division mighthave a higher percentage of minority riders than the RegionalRail Division and that the fares of the City Transit Divisionwould be lower if SEPTA allocated subsidies in proportionto fare revenues rather than in response to operating deficits;however, the agency argued that its actions were necessaryto accomplish its goals of stabilizing Regional Rail fares,

51
maintaining service to the area, luring back Regional Railridership, and keeping a balanced budget in all of its divi-sions. The trial court held that while CBNP had shown a dis-parate impact on the minority community and had presentedtwo alternative plans that would maintain balanced budgetsfor all of SEPTA’s divisions, these plans would not accom-plish SEPTA’s legitimate goal of supporting the RegionalRail Division. Summary judgment was therefore granted toSEPTA (30).
1989. The Association of Community Organizations forReform Now filed suit claiming that SEPTA (1) had held animproper hearing because the hearing examiner curtailed somequestions by the organization’s attorney, (2) had not properlyconsidered the impacts of its fare proposal; and (3) should notincrease fares because the agency would be rescued by stateand local government. The trial court accepted these argumentsand vacated the fare increase. The appeals court reversed thetrial court and permitted the fare increase to be implemented.The appeals court specifically stated that (1) SEPTA had pro-vided adequate evidence that it had considered the social andeconomic impact of the proposed fare increases; and (2) thetrial court did not have the right to assume that the Com-monwealth of Pennsylvania would rescue SEPTA with addi-tional subsidies if its fares did not increase or to substitute itsopinion for that of SEPTA’s Board regarding an appropriatelevel for SEPTA’s fares (31).
1990. In early 1990, SEPTA proposed a fare increase, andpublic hearings were held in accordance with the statute andregulations. Following this, the Board adopted a fare increasewith a lower increase in the price of tokens and the plaintiffsappealed, alleging that SEPTA needed to hold a new hearingregarding this lesser fare increase and that the Board had con-sidered additional information in making its decision. Thecourt held that because the Board has the ultimate authorityand duty to set fares, under the facts of this case no new hear-ing was required. Thus, the proposed fare increase (to $1.50)was allowed to stand. However, complaints regarding the abil-ity of low-income riders to pay the cost of a ten-pack of tokens($10.50) upfront resulted in SEPTA agreeing to offer the samelevel of discount with the purchase of only two tokens, i.e., twofor $2.10; a five-pack was also introduced ($5.25).
2001. In April 2001, SEPTA announced its intention toraise fares. The Board initially proposed increasing the basecash fare from $1.60 to $1.90; passes and other fare elementswere also to be increased. Following a series of public hear-ings in May 2001, the Hearing Examiners upheld SEPTA’sproposed increases despite complaints by various commu-nity groups that (1) the fare increase would place too great aburden on low-income riders and students, and (2) the increaseeffectively rejected recommendations from a fare studySEPTA had recently undertaken that the agency considerreducing fares. The Board then further angered the commu-
nity groups—as well as three City Councilors—when it revis-ited the proposed increase and decided to implement a basefare of $2, rather than $1.90. A coalition of community groupsand the City Councilors then sought an injunction blocking theJuly 1 fare increase, contending that the SEPTA Board ille-gally modified the fare increase after the public hearings; theplaintiffs claimed that this was in violation of the state’s “sun-shine laws” that require government agencies to deliberate anddecide issues (such as the a fare increase) “in public.” This suitwas dismissed in the courts in July (32), and the $2 fare wasallowed to stand. The plaintiffs subsequently appealed thedecision, which was upheld on appeal (33).
Thus, since 1970, most of the fare changes that SEPTA hasproposed have encountered legal challenges by communitygroups. In several cases, the suits led to changes in the statutesgoverning the agency or in the process by which fare changescould be adopted. For instance, as a result of these decisions,SEPTA has been required to provide additional informationto residents of its service area when it is proposing a fareincrease. At the same time, however, the courts have consis-tently supported SEPTA’s “right and duty” to set fares at alevel that will provide sufficient revenues and that will accom-plish other agency goals.
New York City
In mid-1995, the New York MTA proposed a 20% increasein subway and bus fares to become effective in November1995; at the same time, a smaller percentage increase (9%) wasproposed for the Long Island Railroad (LIRR) and the MetroNorth Commuter Railroad (MNCR). In October, the NewYork Urban League, the Straphangers Campaign, the NYCEnvironmental Justice Alliance, and West Harlem Environ-mental Action filed a lawsuit in Federal District Court seek-ing a preliminary injunction to prevent the fare increase fromgoing into effect. The plaintiffs claimed that the fare hike wasbeing fueled by the state government’s reduction in aid tocity subways and buses by $86 million at the same time thatit was providing a $12 million increase in aid to the com-muter railroads. The plaintiffs also claimed that fares paid60% of New York City Transit’s operating costs and only56% of MNCR’s operating costs and 45% of LIRR’s operat-ing costs. The lawsuit was based on the Civil Rights Act of1964 and alleged that the state was trying to close its budgetgap by forcing minority city residents to pay a disproportion-ate share of the funds for mass transit. The specific claim wasthat the disparity in the share of costs borne by the two groupsof passengers (minority city residents and white suburbanresidents) violated U.S.DOT regulations promulgated underTitle VI. Along with the lawsuit, the plaintiffs and other tran-sit advocates in New York City called on transit riders to boy-cott the $1.50 token that the MTA had put on sale.
In November 1995, the Manhattan Federal District Courtheld a hearing regarding a preliminary injunction to halt the

52
$1.50 fare. The District Court Judge granted the injunctionon the grounds that he believed that the plaintiffs were likelyto succeed on the merits of the case and that allowing the fareincrease to proceed would cause immediate harm (34).
However, the District Court injunction was subsequentlystayed by a Federal Appeals Court, and the fare hike went intoeffect November 12. A hearing on the District Court’s rulingwas held November 14 before the U.S. Court of Appeals. Atthe time, the defendants argued that the District Court hadfailed to address issues relating to the larger policy reasonsfor subsidizing commuter rail transportation, i.e., as a meansto discourage suburban residents from driving into the city,thereby indirectly benefiting minority riders of the city masstransit system by (1) minimizing congestion and pollution,(2) encouraging business to locate in the city, and (3) provid-ing additional fare-paying passengers for the mass transitsystem. The Court of Appeals vacated the injunction a fewweeks later on the grounds that the District Court ruling wasbased on insufficient evidence (35). Specifically, the Courtof Appeals stated that even if the record supported a show-ing of different impacts on individuals of different races(“disparate impact”), the District Court needed to examinewhether the defendants had shown a substantial legitimatejustification for the challenged allocation of subsidies.
The Court of Appeals also stated that, since the theory ofthe complaint was that mass transit users received a dispro-portionate subsidy—not that mass transit riders paid too higha fare—blocking the fare increase was an inappropriateremedy. Appropriate remedies could include reducing thesubsidy to commuter rail or increasing the subsidy to masstransit, but neither of these was equivalent to (or wouldnecessarily lead to) a reduction in the mass transit fare. Fol-lowing the Court of Appeals decision, the MTA reached asettlement agreement with the plaintiffs. The agreement wasthat the MTA would fund a fare study and would then con-sider the recommendations. The study was completed andreviewed by the MTA; however, the MTA did not accept therecommendation—that the fare should not be increased. The$1.50 fare therefore remained in place. (The New York CityDepartment of Transportation, the secondary transit systemserving the City, similarly raised the peak period fare to$1.50 at this time, but reduced the off-peak cash fare from$1.25 to $1.00. However, due to limitations with MetroCard(also accepted by NYCDOT) and concerns with transfer pol-icy between NYCDOT buses and MTA subways, MetroCardusers must pay $1.50 at all times on NYCDOT.)
Atlanta
In June 2000, the MARTA Board approved a fare change,raising the base fare from $1.50 to $1.75 and increasing otherelements of the fare structure as well. This proposal passed theBoard despite strong opposition from local governments andcommunity groups. The previous month, the Atlanta CityCouncil (with a unanimous vote) and Fulton County Commis-
sion had both adopted resolutions opposing the fare increase;these resolutions claimed that the proposed fare change wouldhave a “. . . disproportionately negative impact on low-incomeriders, the vast majority of whom reside in Atlanta, Fulton andDeKalb Counties, and who already pay a 1% sales tax, whichsubsidizes the other metro users” (36). Thus, “several MARTABoard appointees representing Atlanta and Fulton Countyapparently ignored the resolutions passed by the elected offi-cials from these districts” (36).
Following the Board’s approval of the fare hike, a consor-tium of community groups, the Metropolitan Atlanta Trans-portation Equity Coalition (MATEC), filed an administrativecomplaint with the U.S.DOT, charging MARTA with violat-ing Title VI of the Civil Rights Act of 1964 and the Ameri-cans with Disabilities Act through “disparate treatment ofminority and disabled riders” (36). This complaint addresseda range of service-related issues; however, the basis of theclaim against the proposed fare change was as follows (36):
• The fare change would adversely affect minority resi-dents;
• There was no documented business need for a fareincrease; and
• The agency had available less discriminatory alternativesthan a fare increase.
The complainants in this case included the NAACP, theRainbow/PUSH Coalition, and several neighborhood andenvironmental groups. In preparing its case against MARTA,MATEC met with representatives of the coalition that hadfiled suit against the LACMTA to learn about their experiencein the Los Angeles case. MATEC was also supported in itsefforts by the Environmental Justice Resource Center (EJRC)in Atlanta, which conducted an analysis of the likely impactof the fare increase on low-income and minority riders. TheEJRC’s analysis concluded that “. . .any benefit to the agencyis likely to be outweighed by the substantial losses of incomeand mobility for the transit dependent. . . .” (36)Nevertheless,MARTA’s fare increase was allowed to remain in effect.
Boston
Whereas equity issues similar to those cited above havebeen raised over proposed fare increases in Boston, theMBTA’s fare decision-making process has been affected pri-marily by concerns over the potential environmental (e.g., airquality) impacts of fare changes. In fact, the MBTA has longbeen required (through the Massachusetts EnvironmentalPolicy Act) to conduct an Environmental Impact Review(EIR) before implementing any fare change that is expectedto result in system-wide fare increases of 30% or more duringany three-year period. Due largely to the EIR requirement,fare changes in Boston have been infrequent, none occurringbetween 1991 and 2000.

53
In Fall 2000, the MBTA proposed a fare increase thatwould raise the bus cash fare from $0.60 to $0.75 and the railfare from $0.85 to $1; pass prices would also rise accordingly.Nevertheless, the 2000 fare change was strongly opposed byvarious environmental and community groups (ConservationLaw Foundation, Federation for Public Transportation, Alter-natives for Community and Environment, Clean Buses forBoston, and Transit Riders Union), claiming it would worsenan already bad traffic congestion problem in the region andthat the new fares would be too high for low-income riders.The MBTA, concerned that the opponents would pursuelegal action seeking to halt the increase, negotiated with thegroups and agreed to mitigate the impact of the higher faresby introducing free bus-bus transfers as well as a low-priceweekly pass. Previously, there were no reduced-price trans-fers between buses or between bus and rail and no weeklypasses. The new weekly pass actually represented a fare reduc-tion, since the $12.50 pass is less than one-fourth the cost ofa monthly pass ($57). Thus, in this case, fare policy was clearlydriven by pressure from the community rather than beingbased solely on the agency’s revenue objectives.
Summary
Thus, U.S. transit agencies have been increasingly facedwith organized opposition to—or even lawsuits seeking toblock—proposed fare hikes in recent years. In some cases,such challenges have resulted in modifications to fare pro-posals or legal restrictions on future changes. In others, theyhave merely required the agencies to go to great lengths toexplain and defend their rationale for raising fares. Regard-less of the formal outcomes, however, all of these equity orenvironmental justice–based initiatives have certainly affectedthe local agencies’ fare policy decision-making processes.Moreover, the challenges in these cities have not gone unno-ticed in other cities; many transit agencies, especially thosein other large cities, feel that they must now pay greaterattention to equity and civil rights concerns in consideringpossible fare structure changes.
UNIVERSITY PROGRAMS
Public transportation is an important travel option formany college students, faculty, and campus staff for travelingbetween the campus and off-campus housing—or for intra-campus circulation on large campuses. Some universities pro-vide their own campus area transit services, but many cam-puses are served by the local transit operator. Where the latteris the case, many universities have established partnershipswith the local transit agencies to provide specially pricedpasses or other payment options to students; according to the2001 APTA Transit Fare Summary, 74 U.S. transit agencieshave some type of “subsidized fare program for university stu-dents” (37). The basic types of programs are as follows:
• Special pass and unlimited-access programs. A num-ber of universities have joined with transit agencies toestablish special programs that provide free unlimited-access or low-cost passes for students (and sometimesfaculty and staff).
• Special reduced-fare arrangements. Some universi-ties have arranged with the local transit operators to pro-vide for reduced single-ride fares for their students.
• Joint transit agency-university electronic farecardprograms. As increasing numbers of universities intro-duce magnetic or smart cards for their students (for iden-tification, building access, library usage, purchases atcampus stores, etc.), local transit agencies have begunto pursue arrangements to enable transit payments usingthe same cards.
By providing a low-cost and convenient form of transit pay-ment to the university community, the transit agency may wellsee increased ridership. Meanwhile, the university may be ableto ease on-campus parking requirements by shifting somestudents and others to transit. The above types of university-transit partnerships and programs are discussed below.
Low-Cost Pass and Unlimited-AccessPrograms
The university pass/unlimited-access program representsone of the oldest types of fare-related transit partnership, withsome (e.g., University of Massachusetts-Amherst, Universityof California-San Diego) dating back several decades. Theseprograms, often called “U-Pass” or something similar, fea-ture various formats. One option involves the university pay-ing the transit agency an annual lump sum per student inreturn for unlimited transit use for each participating student,faculty, and staff member; this type of arrangement has beengiven the generic name “Unlimited Access” (38). In thisoption, students typically need only present their campus IDcard to board a transit vehicle. A second option entails theuniversity purchasing monthly—or perhaps longer-term—passes from the transit agency, either at the regular price or ata reduced price, and then selling them to interested students—usually at a significant price reduction. These may be flashpasses or stickers affixed to campus ID cards.
There are also differences in terms of participation for stu-dents, faculty, and staff; three basic options are as follows (38):
• Voluntary (“opt in”) participation. Students decideif they want to buy passes at the university’s rate; forexample, UC-Irvine buys passes from Orange County(CA) Transportation Authority for $33.50 per monthand sells them to students for $13 per month.
• Voluntary (“opt out”) participation. Students auto-matically receive passes unless they elect not to partic-ipate; for example, University of Washington (Seattle)

54
students are charged $33 per quarter and faculty andstaff are charged $46.50 per quarter.
• Mandatory participation. Students automaticallyreceive passes and cannot opt out of the program; forexample, University of Colorado (Boulder) students arecharged a mandatory transit fee of $19.52 per semester.
In some cases, arrangements involve a single universityor college, while in others, the transit agency provides thesame basic deal to any interested institution. In Chicago, forinstance, the CTA’s U-PASS program is available to anyuniversity/college in the area; as of mid-2002, 22 universitiesor colleges were participating. In Atlanta, the MARTA U-Passprogram has expanded from 4 colleges/universities when itwas introduced in 1998 to 25 in 2002.
With regard to the extent of university pass programs, 38of 251 agencies (15%) reporting to APTA (2001 APTA Tran-sit Fare Summary) offer multimonth passes to students; 32 ofthese have passes good for a semester/quarter, while the oth-ers have passes valid for periods of 3 months to 1 year (37).Where implemented, university pass programs have typi-cally proven quite successful at increasing transit ridership,while also providing guaranteed revenue to the transit agency(38). For instance, an analysis of unlimited-access programsby researchers at UCLA’s Institute of Transportation Studiesfound that (38):
• Unlimited access seems to have resulted in a net aver-age ridership increase of over 7% per year at 13 transitagencies with university programs for the 2 years imme-diately following introduction of the program.
• At five universities that collected ridership data before theinitiation of the pass program, the first year student tran-sit ridership increased between 71% and 200%; in subse-quent years, there were annual increases of 2% to 10%.
Regarding the cost and usage of these programs, theUCLA researchers found the following in their survey of 35programs (38):
• The average cost per student per year for unlimitedaccess is $30; the range among these programs is $4(U. of Florida) to $99 (UC-Santa Cruz).
• The average cost per ride is $0.61, with a range of $0.19(U. of Florida) to $3.50 (Western Michigan University).
• Eleven of the universities charge no student fee for theprogram, while the highest annual fee is $90 (U. Texas);the median annual student fee for the program is $24.
• The average number of rides per student per year is 50;the range is 8 (UC-San Diego) to 151 (U. Texas).
Thus, there is a considerable range in the financial parame-ters associated with university pass programs. Nevertheless,such programs have generally succeeded in shifting significantnumbers of students (and sometimes faculty and staff) to tran-sit, thereby improving access to—and perhaps around—thecampus and easing demand for campus parking.
Reduced-Fare Arrangements
An alternative—or perhaps a complement—to providingpasses to students is for the transit agency to offer reducedsingle-ride fares. The 2001 APTA Transit Fare Summaryindicates that 43 of the 249 (17%) transit agencies reportingoffer reduced single-fare rides to students (37). In 11 of these(4% of the total), students receive free fares (see Table 4-2).In addition, three of the agencies offer free fares to all riders:UMass Transit Service, Skagit Transit, and East ChicagoPublic Transit. One free system not included in the table isChapel Hill (NC) Transit, which recently (January 2002)eliminated fares for all riders. The University of North Car-olina agreed to use student fees, parking permit fees, and
TABLE 4-2 Transit agencies with free fares for college students
Agency (Location) Full Fare
Akron (OH) Metro RTA $1.00 Altoona (PA) Metro $1.25 UMass Transit Service (Amherst, MA) $0.00 Eagle Co. RTA (Avon, CO) $2.00 AppalCART (Boone, NC) $0.50 Skagit Transit (Burlington, WA) $0.00 East Chicago (IN) Public Transit $0.00 Unitrans (Davis, CA) $0.50 Transfort (Ft. Collins, CO) $1.00 Kalamazoo (MI) Transportation Division $1.00 Missoula (MT) Urban Transportation District $0.85 Ventura County Transportation Comm. (Oxnard, CA) $1.00 TALTRAN (Talahassee, FL) $1.00 Kelley Transit Co. (Torrington, CT) $1.00
SOURCE: 2000 APTA Transit Fare Summary, 2000.

55
departmental funds to cover the cost of routes used primarilyby students, faculty, and staff; the towns of Chapel Hill andCarrboro cover the remaining costs. The table also leaves outsystems owned or operated by the universities themselves;many of these have free fares as well. (The Chapel Hill ini-tiative, as well as the Akron program listed in Table 4-2, aredescribed in case studies in Part II.)
An example of a reduced-fare program is that in Lansing,MI, where CATA, for several years, charged Michigan StateUniversity (MSU) and other local college students $0.25 for asingle ride—versus the regular full fare of $1; students couldalso buy low-price semester passes, or reduced-price monthlypasses. In this case, the low fare was first introduced (in 1996)as a special promotion for MSU students. The promotionalfare was subsequently expanded to other area students (includ-ing elementary and secondary students) and was ultimatelyextended through Fall 2001; this agreement stipulated that stu-dent pass fares could not be changed until Spring 2002 andlimited the extent of increases to both single-ride and passprices. The student fare was raised to $0.50 in 2002.
Joint Transit Agency-University FarecardPrograms
Many universities issue magnetic stripe or smart cards tostudents, faculty, and staff. Given the emergence of elec-tronic payment at transit agencies of all sizes, transit agen-cies and universities in some areas have begun to considerarrangements through which transit payments can be madeusing these same cards. There are various possible forms ofsuch partnerships, but the basic approaches can be summa-rized as follows:
• The university card is swiped or inserted in a farebox orfaregate, and the number of student (and perhaps facultyand staff) rides is tracked by the fare system. The agencythen bills the university for rides actually taken.
• The university card carries a stored value purse thatcan be used to ride transit, as well as for on-campusexpenditures.
• The university card is a smart card (and includes a con-tactless interface in addition to or instead of a contactinterface) that can be loaded with a transit application(e.g., stored value or some type of pass) usable on thetransit system.
• The transit agency issues a smart card that can be loadedwith certain university applications usable on the campus.
• A third party (e.g., a financial institution or system inte-grator or vendor) operates a smart card system that sup-ports both the university and the transit agency.
In each case, it is likely that the transit agency would issueits own farecards for nonuniversity riders. The smart cardoptions would require that both the university and agency—
or the third-party operator—provide card loading devices asappropriate. Depending on the specific type of issuance, dis-tribution and loading arrangements, it may be appropriate forthe university or the transit agency to pay transaction fees(for processing fare transactions, as well as for loading appli-cations or value to the cards) to the other partner; alterna-tively, both parties could have to pay fees to a third partyadministering the program (11).
An existing example of the first approach, the tracking ofactual usage, is UCLA’s BruinGO partnership with the SantaMonica Big Blue Bus. In this program, students swipe theiruniversity ID cards through readers on the bus fareboxes, andthe agency then bills the university $0.70 per ride (the samediscounted fare as is charged to regular riders using the stored-value Metrocard). The university card contains a chip thatcovers several campus applications, as well as a magneticstripe that is used for transit and certain campus functions.BruinGO was inaugurated as an 8-month pilot program (Sep-tember 2000–June 2001), but was subsequently adopted forthe following school year (39). In early 2003, BruinGO wasmade a permanent program.
Smart card–based transit-university partnerships have beenexplored in several locations. For example, the Ann ArborTransit Authority briefly accepted the University of Michi-gan’s campus card (a contact card known as M-Card) for farepayment during a trial in 1997; however, the transaction time(nearly 4 seconds per boarding) was found to be too long tobe viable in the bus environment, and the experiment wasdiscontinued. Meanwhile, the Greater Cleveland RegionalTransit Authority (GCRTA) developed an agreement withCleveland State University (CSU) in 1999 under which stu-dents were issued dual interface smart cards, funded jointlyby CSU and GCRTA. The plan was that GCRTA would theninstall smart card readers on the primary bus route servingthe campus and students would be able to load their cardswith a transit application (initially stored value only) and usethe university cards to pay the fare on the designated route.The GCRTA went so far as to issue a request for proposals(RFP) for a smart card system, but never completed the pro-curement process, and the demonstration was never initiated.
Several transit smart card programs now in place or underdevelopment are exploring joint university-transit arrange-ments. For instance, the Ventura County (CA) Transporta-tion Commission has been working with the new CaliforniaState University-Channel Islands (CSUCI) campus to allowjoint use of smart cards for university and transit functions(see case study, Part II). While CSUCI uses magnetic stripecards for the primary campus functions (including ID andbookstore purchases), VCTC and the University have dis-cussed the possibility of adding the magnetic stripe to thetransit smart card. In this scenario, the smart card could alsobe used to supplement the applications included on the stripe(e.g., to maintain student’s medical records, to pay for park-ing, and perhaps other uses). The smart card system beingdeveloped for the Seattle/Central Puget Sound region also

56
includes plans to establish a university-transit partnershipwith the University of Washington.
As suggested above, the university-transit relationship is asymbiotic one, as both parties stand to benefit. Given thecapability of electronic payment media to address multiplefunctions, it is expected that a growing number of university-transit partnerships will be pursued in the coming years as theuse of smart cards in both types of settings increases.
Impacts of University Programs on Case StudyAgencies
Five of the case-study agencies have implemented part-nerships with universities as described above:
• Chicago Transit Authority established its U-PASSprogram in 1998 and now has arrangements with 22schools to provide reduced-price CTA passes.
• Connecticut Transit established its Upass program in2000 and provides reduced-price transit passes to twoHartford-area colleges: Trinity College and Capital Com-munity College.
• King County Metro Transit (Seattle) established itsU-PASS program, which provides reduced-price transitpasses to the University of Washington (UW), in 1991;neighboring Community Transit also participates withUW in the program.
• Akron (OH) Metropolitan Regional Transit Author-ity has operated a free-fare program for University ofAkron students, faculty, and staff having valid Univer-sity IDs since 1995.
• Chapel Hill (NC) Transit began its Free Fare Programin 2002; no fare is charged on any of the agency’s reg-ular fixed route service; the University of North Car-olina helps pay the cost of providing service.
The full case studies are presented in Part II. It is useful tocompare the results of these efforts in terms of their impactson customers and agency operations. Table 4-3 summarizesthe key impacts of the first three programs, Table 4-4 the lat-ter two. These impacts are discussed briefly below.
Customer Impacts and Benefits
The major impacts on, and benefits to, customers from thecase study programs include the following:
• “U-pass” arrangements provide members of the univer-sity community with low-cost, if not free, transit service.This has led to significant mode shifts at participatingcampuses. In Seattle, for instance, the number of singleoccupant vehicles commuting to the UW campus is sig-nificantly lower than prior to introduction of U-PASS.Transit service to the campus has also increased since the
introduction of the U-PASS program, due to the growthin demand.
• Such programs have been well-received by students,faculty, and staff at participating schools: in Chicago,for instance, most survey respondents found the pro-gram very easy to use and 90% expressed the desire forthe program to be continued; in Seattle, 90% of surveyrespondents were either “satisfied” or “very satisfied”with the program.
• The universities themselves have been able to avoid newparking lot construction (UW) or, at least, to better man-age available parking (certain Chicago-area schools and,likely, Capital Community College when it moves todowntown Hartford) through the increased transit modeshare for commuting students, faculty, and staff. In Seat-tle, 86% of eligible university students, faculty, and staffparticipate in the U-PASS program. In Chicago, morethan 40,000 eligible college students are using theCTA’s U-PASS program.
Agency Impacts and Benefits
The major impacts on, and benefits to, the agencies fromthe case-study programs include the following:
• These programs can be quite successful at increasingtransit usage. In Chicago, U-PASS accounts for over 10million rides per year; a quarter to a third of these are con-sidered to be new transit rides, and half of total U-PASSridership is felt to take place in midday and eveninghours. In Seattle, U-PASS accounts for over 8 millionrides per year (more than 10% of all Metro and Com-munity Transit rides); 45% of these are estimated to benew transit rides. Ridership on Chapel Hill Transit isover 50% higher since the removal of fares compared tothe previous year.
• These programs can build “brand loyalty” to the transitsystem. In Chicago, the vast majority of survey respon-dents said that they would continue to use CTA aftergraduation. In Chapel Hill, the introduction of free fareshas significantly improved the overall public perceptionof Chapel Hill Transit.
• Depending on the specific pricing of the program, thetransit agency risks losing revenue by providing ridesfor a lower fare than it had previously received from thesame riders. The CTA’s program, for instance, has likelyresulted in some revenue loss; however, the estimatedloss amounts to less than 0.01% of total annual fare rev-enue, and the agency feels that any such loss has beenmore than offset by the program’s benefits (e.g., growthof off-peak ridership and the creation of a declaredintention to use CTA after graduation). CT TRANSITalso lost revenue during the program’s first 2 years, butsubsequent adjustments to the funding formula resulted

57
TABLE 4-3 Case study comparison: university pass programs
Case-Study Agency/ Name of Program (Year Initiated)
Chicago Transit Authority/ U-PASS Program (1998)
Connecticut Transit/ Upass Program (2000)
King County Metro (Seattle)/ U-PASS Program (1991)
Nature of Program
Magnetic pass provided to all students at a school. Students pay for pass as part of fees.
Each school pays CTA $.55/student/day.
Pass provided on request. Schools pay CT $.65/ride
taken, up to ceiling of $20/full-time student.
Pass provided at registration to all students; if not returned,
student charged $33/quarter. Faculty/staff can get pass for
$46.50/quarter. Other Participants 22 colleges; any accredited
college eligible Trinity College, Capital
Community College (CCC)U. of Washington (can also
use Community Transit) Transit Agency Goals of Program Increase off-peak ridership,
create brand loyalty for CTA Increase ridership Increase transit ridership,
improve access to campus
Customer Impacts and Benefits Usage rates 1.27 rides/day/pass 1.3 rides/day/pass (CCC) NA* Attitude toward program/other benefits
Most survey respondents indicated U-PASS very
convenient, easy to use; 90% want program continued
NA 65% of survey respondents “very satisfied,” 25% “satisfied”
with U-PASS program
Cost of travel Much cheaper than full fare Much cheaper than full fare Much cheaper than full passes Agency Impacts and Benefits Ridership 10.6m rides/year (2000–01);
25–38% are new rides; 50% of U-PASS rides during midday or
evening hrs.
152,000 total rides (2001–02);
19,000/mo. (CCC); 1300/mo. (Trinity)
8.5m rides/year (2000-01); 45% new rides
Revenue CTA receives about $.45/trip; loses about $2m/yr for rides that would be taken without U-PASS
(<.01% total annual fare revenue)
CT lost revenue in first 2 yrs. For CCC, until ceiling rate
increased; revenue/ride roseto $.65; no loss for Trinity
Metro receives $9.6 million/year from UW,
compared to $5 million from UW community pre-U-PASS
Other Impacts/Benefits Almost all survey respondents said they’d use CTA after
graduation
NA Metro’s costs have risen with added service to meet
demand; UW pays some costs of added service
Impact on/Benefits to Partners Market penetration Used by >40k students (‘01) 500 passes issued (CCC) 86% of students, faculty, staff Other (e.g., need for parking) Students consider it a key benefit
of attending that particular school; schools can better
manage parking
Access will be important for CCC (a commuter school)
when it moves to downtown Hartford; will reduce amount
of parking needed
Student transit commuting mode share 35%; UW able to
avoid new parking construction despite large increase in
population; without U-PASS, new parking would have cost
$100m Liability to agency Economic liability See Revenue above Depends on ceiling rate Depends on pass pricing Political/legal liability None None None Constraints and Barriers Technical None None None Institutional/Funding Need to develop formula
acceptable to colleges Need to develop acceptable
pricing agreement that protects agency against
revenue loss
Need to develop acceptable pricing agreement that protects agency against revenue loss
Required Equipment and Technology
None, but AFC allows tracking U-PASS rides
AFC, to track rides None
*NA = Not applicable.

58
TABLE 4-4 Case study comparison: university reduced-fare programs
Case-Study Agency/ Name of Program (Year Initiated)
Akron METRO RTA/ University ID/Pass Program (1995)
Chapel Hill Transit/ Free Fare Program (2002)
Nature of Program
Students, faculty, staff ride free when showing valid University ID. METRO
also provides separate Campus Shuttle Loop Service
Free fare on all regular fixed route transit service in Chapel Hill and
Carrboro
Other Participants University of Akron UNC-Chapel Hill, Towns of Chapel Hill and Carrboro
Transit Agency Goals of Program Increase ridership, address parking/congestion problems at
University
Address parking shortage in and around campus, increase access to and around campus, increase transit
access for transit dependent in general
Customer Impacts and Benefits Usage rates NA* NA Attitude toward program/other benefits
NA Overall public perception of CH Transit has improved as a result of free fare
Cost of travel Free with valid ID Free Agency Impacts and Benefits Ridership 151k rides/year (2001) in Pass and
Shuttle service programs 400k rides/mo. (April, 2002), 54%
higher than ridership in same month in prior year
Revenue METRO receives approx. $350k/year for pass program and shuttle service;
pass program varies (roughly $50k/year); contract generates about
$.55/ride
No fare revenue (previous full fare had been $.75)
Other Impacts/Benefits Reduces amount of cash METRO has to handle
Capital/operating costs have increased considerably to meet higher demand
(13 new buses, 7 more next year) Impact on/Benefits to Partners Market penetration Available to anyone with valid ID Free throughout system Other (e.g., need for parking) No reduction in demand for parking, but
free service not marketed heavily Enhanced mobility, lower demand for parking on campus, improved service
(higher bus frequency to accommodate higher demand)
Liability to agency Economic liability Limited loss, since most riders would
otherwise walk, bike or drive Increase in operating and capital
costs, with no fare revenue to cover these costs
Political/legal liability Complaints could arise from nontransit users regarding use of parking fees for
transit
None
Constraints and Barriers Technical None None Institutional/Funding Originally Congestion Mitigation and Air
Quality (CMAQ) funding; CMAQ funding ended in 1997; now funded from
parking fees and University general funds
Required agreements among UNC and the two towns to significantly
increase contributions to CH Transit; students pay $16/semester fee
Required Equipment and Technology
ID cards must be manually viewed, None since current fareboxes can’t read
magnetic ID cards
* NA = Not applicable.

59
in no revenue loss in the latest year. In Seattle, the pric-ing formula has been carefully designed (i.e., includingperiodic adjustments) so as to protect the transit agen-cies from losing revenue.
• In the free-fare programs, the agencies obviously losefare revenue; however, this loss should be offset throughincreased contributions from the universities and otherfunding partners, as is the case in Chapel Hill and Akron.
• Depending on the success of the university program(i.e., at attracting riders), there may be added costs to theagency, due to the need to provide additional service tomeet the increased demand. In Seattle, Metro’s costshave risen considerably with the provision of additionalservice to the UW campus; however, UW pays a portionof the increased costs, and Metro’s revenue recoveryrate for the new services has been comparable to its sys-temwide average. Chapel Hill Transit’s capital and oper-ating costs have increased dramatically as a result of themuch higher demand following the elimination of fares.The level of usage has not been high enough in Hartfordor Akron to increase operating costs, and the dispersednature of the CTA’s program (i.e., with more than 20schools throughout the service area) has similarly hadno significant impact on service requirements.
Thus, the case study findings suggest that university-transitagency partnerships are capable of generating significantincreases in ridership, while also building interest in contin-uing to use transit after graduation. However, it is importantto design the pricing parameters of university pass programscarefully so as to minimize the potential negative revenueimpact on the agencies. In particular, the agreement shouldbe structured so that it allows the agency to increase theamount paid per person to reflect actual usage rates.
EMPLOYER BENEFITS PROGRAMS
Transit agencies have long pursued partnerships withemployers to facilitate, if not subsidize, employees’ use oftransit to commute to and from work. These partnershipswere originally limited to the distribution of monthly passesby employers to their employees, often with at least a partialsubsidy of the pass price; such programs remain an importantstrategy for facilitating and promoting employee transit use,although not discussed here as a distinct approach. The pass-distribution programs subsequently became more flexiblewith the introduction of transit vouchers that the employeescould use to acquire the transit payment option of their choice.In the last decade, these basic approaches have evolved andbroadened, fueled both by a steady increase in the tax-freetransit benefit employees could receive and the emergenceof electronic payment technologies. Key types of employer-oriented transit benefit programs and strategies now in placeinclude the following:
• Annual pass programs. In these programs, employerbuys passes for employees (at significantly less thanthe normal monthly cost of passes) based on a predeter-mined formula set by the transit agency.
• Transit voucher programs. In these programs, employ-ees receive vouchers that can then be redeemed for tran-sit passes or other payment options. In some cases, thevouchers are in the form of stored value farecards thatcan be used directly for fare payment.
• Automated benefits distribution programs. Otherstrategies for distributing transit benefits to employeesare emerging as well, including the ability to downloadthe value of the benefit to an employee’s smart cardautomatically.
Examples of these types of strategies are described in thefollowing section, following a review of the nature the cur-rent “commuter choice” benefits program.
The Commuter Choice Benefits Program
Commuter Choice is a provision of the TransportationEquity Act for the 21st Century (TEA-21) that was signedinto law in June 1998. TEA-21, along with the Taxpayer ReliefAct of 1997, amended Internal Revenue Code Section 132(f),which already provided certain commuter program tax ben-efits. This tax code amendment significantly improved thestatus of employer-sponsored commute incentive programs.Commuter Choice allows employers to let their employeesset aside up to $100 a month, or $1200 a year, of their pretaxsalary to pay for transit or vanpool commuting, and $175 amonth ($2100 a year) for qualified parking expenses. Prior toTEA-21, commuter benefits had been allowed only in theform of a direct employer subsidy to an employee.
Commuter Choice is the most recent federal tax codeamendment related to qualified transit fringe benefits. TheDeficit Reduction Act of 1984 provided the first commute ben-efit by allowing for limited tax-free benefits for transit costs,up to $15 a month. In 1991 this amount was increased to $21,and the Comprehensive Energy Policy Act of 1992 creatednew categories of qualified transportation benefits (e.g., van-pools) and raised the monthly benefit limit to $60; this Act alsoprovided for annual changes to the tax-free benefit limit (tiedto the Consumer Price Index). Indeed, the TEA-21 and federaltax code amendments required the maximum benefit toincrease from $65 to $100 a month as of January 2002.
A number of states have also introduced their own legisla-tion providing state tax credits to employers who offer Com-muter Choice benefits to their employees; these states includeMaryland, Delaware, Oregon, and Georgia. Moreover, severalbills have been introduced before Congress in the last few yearsto improve the transit benefit. For instance, the CommuterBenefit Equity Act, introduced in both the House and Senatein 2001—and a similar bill introduced in 2003—proposedto amend the Internal Revenue Code of 1986 to equalize
60
the maximum amount of the tax-free transportation benefitallowed for transit and parking; as explained above, underthe existing regulations, the allowable parking benefit is con-siderably higher than that for transit. While this bill did notpass, it is likely that similar bills will be introduced in thecoming years.
Because employers benefit (e.g., through reduced payrolltaxes) as well as their employees, the incentive for employersto participate in Commuter Choice will thus likely increase fur-ther. The methods through which employers have worked withtransit agencies to provide transit benefits are reviewed below.
Annual Pass Programs
One type of program that has become increasingly popu-lar in the last few years involves employers purchasingannual transit passes for each of their employees at a pricemuch lower than the cost of a normal monthly pass. In mostcases, the per employee price can vary from one company tothe next, based on a formula that considers such factors ascompany size, location, and relative access to transit service.The transit agency can offer such a price since not all employ-ees will actually use the pass. However, because all employ-ees receive passes, the potential exists for a dramatic increasein commuter ridership.
The Denver Regional Transit District’s (RTD’s) Eco Passprogram, started in 1991, was the first program of this typein the United States, with pricing based on the “group insur-ance” concept (i.e., spreading the cost of employees’ transituse among all employees at a company). Since then, a num-ber of agencies have adopted similar programs. These pro-grams typically seek to increase commuter ridership whilemaintaining revenue neutrality. Examples of annual pass pro-grams of this type are as follows:
• Dallas, TX (E-Pass) • Minneapolis/St. Paul, MN (Metropass) • Portland, OR (PASSport) • Salt Lake City, UT (Eco Pass) • San Jose, CA (Eco Pass) • Seattle, WA (FlexPass)
These represent the range of current industry practices in thearea of employer-subsidized annual unlimited use pass pro-
grams. Although anumber of theseagencies originallybased their pro-grams on the EcoPass in Denver,most have subse-quently modifiedtheir programs tobetter fit their indi-
vidual goals or needs, while RTD itself announced in early2003 its intention to terminate the Eco Pass program at theend of the year as part of a fare change proposed for 2004 tooffset a serious revenue shortfall; RTD felt that it was losingtoo much revenue through the program, as the pricing for-mula was not insuring revenue neutrality. In general, the dif-ferences in the programs fall into the following categories:
• Method of pass price determination, e.g., ridership ateach specific company, relative level of transit service acompany receives, or, in some cases, company size.
• Minimum contract requirements, e.g., minimum num-ber of employees for a company to participate or a min-imum contract amount.
• Goals of the program, e.g., increase company partici-pation and thus commuter ridership, or maintain rev-enue neutrality.
The differences in the above agencies’ programs are shownin Table 4-5 and can be summarized as follows (40).
Method of Pass Price Determination. Five of these agen-cies (all except Minneapolis/St. Paul Metro and Tri-Met)base prices on zones determined by level of service (and, insome cases, company size). Minneapolis/St. Paul Metro andTri-Met both base pass prices on the transit mode share ateach specific company. As explained in a case study (Part II),Tri-Met recently changed from using a combination of geo-graphic zones, zone-wide average transit mode splits, andindividual transit mode splits. A principal reason for thischange was the availability of data on the transit mode splitof each company; Tri-Met uses a survey that companies with50 or more employees are required by the Oregon Depart-ment of Environmental Quality to conduct each year.
In contrast to Tri-Met, King County Metro originally usedthe mode share approach but recently converted to a zonetype of pricing structure (see case study in Part II). The pri-mary rationale for this change, and the reason several otheragencies originally adopted the zonal structure, is that theregular surveys required for individualized pricing are expen-sive and administratively difficult. Moreover, basing the passprice on changesin individual com-pany mode shareresults in a higherlevel of uncertaintyfor the companiesand may thereforelimit participation.The advantage ofthe individualizedpricing structure is that it is easier to measure the preciseimpact of the program on both ridership and revenue and,thus, to adjust pricing if there is a significant loss of revenue.

61
Minimum Contract Requirements. Four of the sevenagencies have implemented a minimum contract requirementfor companies to participate in the pass program. A majorreason for this is to discourage very small companies—conceivably having very high transit mode shares—from join-ing the program. Such companies’ participation could wellproduce revenue losses for the agency. If very small compa-nies are permitted to join, they may be required to pay a pre-mium for the pass so as to protect the agency from this poten-tial revenue loss. Utah Transit Authority (UTA) requires thatcompanies have a minimum number of employees, DenverRTD mandates a minimum number of passes, Dallas AreaRapid Transit (DART) imposes a minimum contract cost; andTri-Met has a minimum price per employee for each zone.
Goals of the Pass Program. The final key aspect in whichthe programs differ is in the agencies’ goals. In all cases, theprimary reason for implementing the program was to increasecommuter ridership. Where the agencies differ is in how theyevaluate revenue recovery. Most of the agencies want theirprograms to be “revenue-neutral”; however, their definitionsof revenue neutrality vary. Most of the agencies, includingDenver RTD and Minneapolis/St. Paul Metro, define revenueneutrality as recovering at least as much revenue from thecommuter market as was being collecting prior to programimplementation. Tri-Met, on the other hand, defines revenueneutrality as recovering the same amount of revenue as wouldbe collected from commuters paying full fare. If the program
succeeds in generating additional riders, the Tri-Met defini-tion leads to higher pass prices in order to recover revenuefrom these riders. On the opposite end of the spectrum isUTA, which has been relatively unconcerned with revenuerecovery, at least in the initial stages of the program. ForUTA, the primary concern is increasing commuter ridership;the agency feels that any initial revenue loss is worth the rid-ership gain and that revenue is likely to recover over time.
Based on the experiences of the above agencies, there areseveral key points that should be kept in mind in developingsimilar programs:
• The design and pricing of the program are highly depen-dent on the agency’s goals and concerns. If an agency isconcerned primarily with revenue recovery, it may opt toimplement a program that focuses on surveying individ-ual companies in order to set prices. This method willreduce the risk of revenue loss to the agency by directlymonitoring increases in ridership. However, this type ofdesign is difficult to administer and increases the risk toparticipating companies—since future program costs areuncertain. Therefore, if the primary agency goal is toincrease company participation and thus commuter rid-ership, it may be advisable to consider a more regionalpricing approach.
• Pricing assumptions should be updated regularly in orderto account for ridership increases. Since all employees
TABLE 4-5 Employer-based annual pass programs
Agency—Program Method of Price Determination Minimum Contract Requirement
DART (Dallas)—E-Pass Zones/level of service, size ofcompany
Minimum contract: $720 (equivalent of 1 pass for 12 mos.)
Denver RTD- Eco Pass Zones/level of service, size of company
Minimum of 5 passes
Minn.-St. Paul Metro—Metropass
Transit mode share of company
None
Portland Tri-Met—PASSport
Transit mode share of company*
Minimum price per employee
UTA (Salt Lake City)—Eco Pass
Zones/level of service Minimum of 35 employees (does not apply to state agencies)
SCVTA (San Jose)—Eco Pass
Zones/level of service, size of company
None
King Co. Metro (Seattle)—FlexPass
Zones/level of service** None
* Tri-Met recently converted from a combination zone and mode share basis to mode share only.** KC Metro recently converted from mode share to a combination zonal-level of service basis.

62
at a company receive an unlimited-use pass, the transitagency can expect to see an increase in commuter rider-ship. However, since initial pass prices are normallybased on preprogram transit mode share, the pass maybecome under-priced if mode share assumptions are notupdated regularly. Denver RTD’s announced intentionto discontinue its Eco Pass program due to excessiverevenue loss demonstrates the danger of failing to ade-quately update the pricing assumptions and formula.
• As electronic fare payment becomes more prevalent, itwill become easier for transit agencies to design pro-grams for specific companies and to monitor programeffects. Agencies that do not currently have electronicpayment must conduct individual company surveys inorder to monitor changes in ridership levels. However,electronic payment may allow an agency to collectcompany-level data without the administrative burdenof administering surveys. This data can then be used toset prices for individual companies more accurately andto assure the company of the program’s success inincreasing transit ridership, possibly even allowing thecompany to decrease its parking costs.
Finally, it should be noted that such programs have givenrise to a variation on the employer-based pass program:neighborhood pass programs. Denver RTD has made subsi-dized annual passes available to groups of households in cer-tain designated areas, and Santa Clara Valley TransportationAuthority (SCVTA) has done this for certain residentialcomplexes. For instance, neighborhoods in Boulder, CO,have been able to take advantage of RTD’s Eco Pass arrange-ment. A “neighborhood” in Boulder consists of a group ofcontiguous city blocks containing at least 100 housing units.Using the program formula, RTD calculates a yearly fee perhousing unit, based on all of the residents of the neighbor-hood participating in the program. In reality, the fee paid byeach participating household depends on the proportion ofhousing units agreeing to participate in the program and onany agreements made among households in the neighbor-hood. For example, if the quoted cost per housing unit is$100 per year for all the housing units on a given block, butonly 50% of households agree to pay for the program, theactual cost per household would be $200.
Transit Voucher Programs
Beyond the direct distribution of passes, employers canprovide transit benefits for employees through strategiessuch as voucher programs. In programs such as TransitCheck(New York City area), CommuterCheck (San Francisco, Den-ver, Boston, elsewhere), and Metrochek (Washington, DC),employees are given vouchers that can be redeemed for tran-sit passes or other payment options. In some cases (e.g., NewYork City and Washington), the vouchers are in the form of
stored-value farecards and can thus be used directly for farepayment where accepted—or redeemed for fare options forother agencies in the applicable region; these two programsare covered in case studies, in Part II.
While voucher programs are present in some areas domi-nated by a single transit operator (e.g., Boston, Denver), theyare particularly useful in multioperator regions (e.g., NewYork City/Northern NJ, Philadelphia, San Francisco, Wash-ington), since employees at any given company in such loca-tions may well use a range of transit systems. This signifi-cantly complicates the employer’s ability to directly providepasses to each employee who uses transit. With a voucherprogram, the employer can instead provide a common voucherto all interested employees. An employee then uses thevoucher to purchase a pass, tickets, tokens, or stored-valuefarecard. Many employers subsidize vouchers (i.e., providethem to employees at no charge or at a reduced price) and infact purchase vouchers priced at the level they are willing tosubsidize up to the maximum benefit described above.
Because voucher programs are relatively simple for anemployer to administer, they tend to appeal to small andmedium-sized companies; in the Washington, DC, metro-politan area, for instance, the average size of the privatecompanies participating in the Metrochek program is 18—although federal agency participation there brings the overallper employer average to 57. A total of nearly 3,000 employ-ers currently participate in the Metrochek program. In NewYork City, over 14,000 employers offer TransitCheck to morethan 350,000 employees, the average number of employeesusing it being about 29.
New York’s TransitCheck, introduced in 1987, was the firstvoucher program in the United States. TransitCheck is admin-istered by a private nonprofit organization, TransitCenter,that was established with a demonstration grant from the fed-eral Urban Mass Transportation Administration (UMTA, nowthe FTA) and was subsequently funded by the transit agenciesin the region. Programs in other regions are typically adminis-tered by MPO’s or transit agencies; but in many of theseregions, fulfillment is provided by private for-profit companies(e.g., Commuter Check Services Corp. in San Francisco,Philadelphia, Boston, Denver and elsewhere). There are alsoseveral companies, such as WageWorks and Sodexho Pass,that handle all aspects of an employer’s transit subsidyarrangements, including delivery of vouchers and passes.
Automated Benefits Distribution Programs
The emergence of electronic payment media such as smartcards has created new strategies for distributing transit bene-fits to employees. One approach, mentioned above, is thedirect provision of stored-value farecards, as is done in Wash-ington, New York, and Chicago. A variation introduced in2000 in New York City is the Premium TransitCheck designedfor City employees and other large employers. In this pro-

63
gram, TransitCenter issues employees special MetroCardsonce a year. The City or employer deducts the $63 cost of a30-day pass from the employees’ paychecks each month andtransfers these funds, along with an active list, to Transit-Center; as long as an employee’s payment status remainsactive, the card will remain active. As of early 2002, morethan 30,000 Premium TransitChecks were in use.
The use of smart cards further expands the ability to auto-matically distribute transit benefits. The primary existing exam-ple of such a strategy is WMATA’s “SmartBenefits” program,launched in September 2000. In this program, an employerestablishes an account for each participating employee (andsubsequently identifies any changes to an employee’s status)via a WMATA website. Each month, the employee can thenautomatically download the value of the benefit to a Smar-Trip smart card at any WMATA farecard vending machine.As of mid-2003, over 550 employers and 17,000 employeeswere participating in the SmartBenefits program; while par-ticipation was growing at a slower pace than the agency hadanticipated, the concept should take greater hold as thenumber of employees at each company using the SmarTripcard increases and once SmarTrip is expanded to buses inthe region and to transit service in Baltimore over the nextfew years.
A second example of an automated benefits distributionarrangement is that introduced in 2002 in the TransLink(San Francisco Bay Area) regional smart card program pilot.As described in the TransLink Case Study (in Part II), the“employer-based autoload” strategy was in use by about adozen employers—for roughly 50 employees—as of the endof the pilot period (July 2002). Automated downloading oftransit benefits was also available to Bay Area participants inthe Commuter Check program by the end of the pilot period.
An alternative approach to that used in SmartBenefits andTransLink would be for an employer to provide some type ofon-site download and revaluing device. This could either beattended (i.e., by a designated administrative employee) orself-service. In either case, the transit benefit would be down-loaded to the employee’s farecard each month. A self-servicedevice could be considered, particularly at locations whereemployees’ smart cards can also be used for purposes suchas vending machine or cafeteria purchases.
A final approach that employers might consider for cover-ing their employees’ transit commuting costs is postpayment.With electronic payment media, a transit agency can track thetransit usage of an employee’s farecard; the agency could theninvoice (e.g., monthly, bimonthly, or perhaps semi-annually)each employer for the actual cost of its employees’ rides dur-ing the billing period. An existing example of this strategy isthe BusCard Plus program at Valley Metro (Phoenix, AZ). Inthis program, launched in 1991 to help local employers meetthe local Travel Reduction Ordinance, participating employ-ees’ transit usage is tracked by card readers in the fareboxesvia their use of a magnetic monthly pass; employers are billedat the end of each month for their employees’ transit use. The
cost for each trip is the full cash fare, but the total monthlycost is capped at the cost of a regular monthly pass; someemployers subsidize only the commuter trips (trips are iden-tified by time of day and route number), requiring the employ-ees to reimburse them for nonwork trips. The CTA alsointends to introduce a postpayment option for its ChicagoCard in 2003; the ability to establish transit accounts with theagency will facilitate postpayment by individual riders andemployer billing based on actual use of the system.
Thus, the combination of commuter choice legislation andthe emergence of electronic payment technologies has resultedin a range of distribution strategies that facilitate the provi-sion of transit benefits to employees.
Impacts of Employer Benefits Programs forCase Study Agencies
Four of the case studies describe transit employer benefitsprograms such as those discussed above:
• King County Metro Transit introduced its FlexPassannual transit pass program for area employers in 1993.
• Tri-County Metropolitan Transit District (Portland,OR) introduced its PASSport annual transit pass pro-gram for area employers in 1997.
• TransitCenter (New York City) began issuing Tran-sitCheck transit vouchers (or actual MetroCard fare-cards) to employees of participating employers in1987. The recently established Premium TransitCheckprogram involves issuance of annual MetroCards toparticipating employees.
• Washington Metropolitan Area Transit Authoritybegan to issue MetroChecks (for direct use on Metrorailor use as a voucher for other services in the region) in1997. WMATA has also recently introduced the Smart-Benefits program allowing automatic downloads of tran-sit benefits via the Internet and employee access using aSmarTrip farecard.
The full case studies are presented in Part II. (Anothercase-study program, TransLink, also included an automatedbenefits distribution arrangement similar to WMATA’sSmartBenefits; but it is not included in this discussion of pro-gram impacts because of the limited use of this option dur-ing the TransLink pilot project.) However, it is useful tocompare the results of these efforts in terms of their impactson customers and agency operations. Table 4-6 summarizesthe key impacts of the first two programs, Table 4-7 the lat-ter two. These impacts are discussed briefly below.
Customer Impacts and Benefits
The major impacts on, and benefits to, employees andemployers from the case-study programs include the following:

64
• Both annual pass and the various forms of voucher pro-grams provide employees with low-cost (often free) tran-sit service payment options.
• Annual pass programs, provision of vouchers in theform of electronic farecards, and automated downloadoptions (like SmartBenefits) are particularly convenient
for employees, since the options do not require theemployees to go out of their way to purchase separatefare instruments.
• These programs also represent convenient mechanismsfor employers to manage the distribution of commutebenefits to employees. Besides providing a tangible ben-
TABLE 4-6 Case study comparison: annual employer pass programs
Case-Study Agency/ Name of Program (Year Initiated)
King County Metro (Seattle)/ FlexPass Program (1993)
Tri-Met (Portland, OR) PASSport Program (1997)
Nature of Program
Annual transit passes are provided to all employees at a participating company at a deeply
discounted fixed cost
Annual transit passes are provided to all employees at a participating company at a
deeply discounted fixed cost Other Participants Area employers Area employers Transit Agency Goals of Program Increase ridership and revenues Increase ridership and revenues
Customer Impacts and Benefits Usage rates Employee transit use increases >90%, on
average, in first year employer participates 57% increase in transit trips at participating
employers after first year of program Attitude toward program/other benefits
Provides for convenient, low cost (usually free) transit service
Provides for convenient, low cost (often free) transit service
Cost of travel Only 10% of employers require employees to contribute to cost of FlexPass; employers can’t charge more than 50% of employer’s cost per
pass
Even if employer requires some contribution, employees receive deep discount; maximum cost of pass is $362, compared to maximum
(all-zone) full annual pass price of $615 Agency Impacts and Benefits Ridership 825k new rides generated by FlexPass (2000) PASSport passes account for 7.6% of Tri-Met’s
overall ridership Revenue $651k in new revenue generated by FlexPass
(2000) Revenue based on actual transit usage, and
usage has increased due to program Other Impacts/Benefits Administration of entire Commute Partnership
Program (includes FlexPass) costs Metro $1.4m/year (45% covered by federal grants); cost
of FlexPass will drop with new Area FlexPass program
Administration of program handled by 4 Tri-Met sales representatives and administrative assistants plus some management time
Impact on/Benefits to Partners Market penetration 122 employers, >80,000 employees 210 employers, 59,000 employees Other (e.g., need for parking) Helps employers address Commute Trip
Reduction requirements; lower administration cost than a monthly program (because annual);
may allow employers to reduce amount of parking needed
Helps employers address Employee Commute Options (ECO) Rule; lower administration cost
than a monthly program (because annual); may allow employers to reduce amount of parking
needed Liability to agency Economic liability Program designed to eliminate risk of losing
revenue; new Area FlexPass has higher risk since based on average transit use in an area and companies with highest transit use may be
most likely to adopt program
Program designed to be revenue neutral (i.e., employer pays same amount of revenue as would be collected if all riders were buying
monthly passes)
Political/legal liability Some equity concerns since focused on large employers; Area FlexPass designed to alleviate
that concern
Social equity has been concern in establishing pricing (i.e., that commuters not pay less than other riders); this has led to revenue neutral
pricing requirement Constraints and Barriers Technical None None Institutional/Funding Need to develop acceptable pricing agreement
with each employer has limited size of program (and size of employers); Area FlexPass
represents attempt to provide more uniform pricing to attract smaller companies.
Since program grew out of ECO Rule, Tri-Met was able to move from being seen as an
opponent of employers (because it’s funded by payroll tax) to a partner in meeting ECO
requirements Required Equipment and Technology
None None

65
TABLE 4-7 Case study comparison: transit voucher programs
Case-Study Agency/ Name of Program (Year Initiated)
TransitCenter (New York City)/ TransitChek, Premium TransitChek (1987)
WMATA (Washington, DC) Metrochek, SmartBenefits Programs (1993)
Nature of Program
TransitCenter (or employer) issues vouchers (or MetroCards, for NYCT riders) to employees
of participating employers. For Premium TransitChek, once payroll deduction set up,
TransitCenter issues annual MetroCard directly to employees
WMATA provides employers with Metrochecks;can be used directly on Metrorail or as
vouchers for fare media for other services. In SmartBenefits, employer authorizes employee’s
benefit via Internet; employee downloads monthly benefit to SmarTrip card via TVM
Other Participants NYMTA, other operators, area employers Other operators, area employers Transit Agency Goals of Program
Increase ridership, simplify agency and employer administration requirements for
benefits
Increase ridership, simplify employer administration requirements for transit commute
benefits
Customer Impacts and Benefits Usage rates NA* NA Attitude toward program/other benefits
Direct receipt of MetroCards convenient; Premium TransitChek is annual pass
Direct use of Metrochek convenient for Metrorail riders; SmartBenefits very convenient
Cost of travel Tax savings; also often subsidized (or provided free) by employer
Tax savings; also often subsidized (or provided free) by employer
Agency Impacts and Benefits Ridership Results in increased transit use (average of
>240 additional trips reported in 1994 survey) NA
Revenue Use by new riders increases revenue $134m in Metrochek sales; 90% of Metrochek value used on WMATA (vs. other operators in
region) Other Impacts/Benefits NYMTA pays commission for MetroCard
distribution (less than that paid retail distributors)
NA
Impact on/Benefits to Partners Market penetration >14k employers, >350k employees; current
growth rate 2k employers/25k employees/year; Premium TransitChek used by >30k employees
Metrochek used by >2,500 private companies and 269 federal agencies; SmartBenefits used by >550 employers and >17,000 employees
Other (e.g., need for parking) Employers get payroll tax savings; TransitCenter will handle distribution.
Employers pay commission to TransitCenter
Employers get payroll tax savings; SmartBenefits allows employers to easily
manage their benefit programs (via Internet) Liability to agency Economic liability None, since vouchers used to purchase fare
media at full price Due to outstanding Metrocheks that have not
yet been used, WMATA must carry a contingent liability of >$10m on its books;
SmartBenefits allows employers to remove unclaimed benefits from system. No risk for
other operators since vouchers used to buy fare media at full price
Constraints and Barriers Technical MetroCard (and thus Premium TransitChek)
can only be used with agencies that have MetroCard AFC system (NYCT, NYC DOT; being implemented by PATH and others)
Metrochek can only be used directly on Metrorail, and SmartBenefits requires smart
card; expansion of SmarTrip program will allow expansion of SmartBenefits, but not expanded
use of Metrocheks Institutional/Funding Difficulty attracting larger employers, who
perceive high administration cost; Premium TransitChek seeks to address this concern. TransitCenter now self-sufficient, but initially
Since 3⁄4 of Metrocheks are distributed to federal employees, Transportation
Administrative Services Center is involved in managing program for most agencies; due to
(first decade) funded by agencies and federal/state grants
magnitude of program, federal employer sales cycle lead time much longer than for private
employers Required Equipment and Technology
None for agencies (although MetroCard is AFC system)
Requires AFC: Metrochek is magnetic card, SmartBenefits uses contactless smart card
* NA = Not applicable.

efit to their employees, employers benefit from suchprograms through payroll tax savings and the potentialto reduce parking requirements.
• Such programs help employers address state or local tripreduction ordinances; the existence of such requirementswas a key factor leading to the establishment both KingCounty Metro’s and Tri-Met’s annual pass programs.
• Monthly programs have higher administrative costsfor employers than do annual programs, although auto-mated strategies like SmartBenefits should reduce theemployer’s administrative requirements. In voucher pro-grams, like TransitCheck, the voucher company (e.g.,TransitCenter) handles distribution to employees, butemployers pay a commission on each voucher.
Agency Impacts and Benefits
The major impacts on, and benefits to, transit agenciesfrom the case study programs include the following:
• These programs typically result in increased transitusage. For instance, in Seattle, FlexPass has resulted inan average increase in employees’ transit use in the firstyear of the company’s participation of over 90%. InPortland, the average employee transit use increase hasbeen measured at 57% during the first year; PASSportpasses account for over 7% of Tri-Met’s overall systemridership. In New York, a 1994 survey indicated anaverage of over 240 additional transit rides per year perTransitCheck recipient.
• Both of the annual pass programs are structured so as toprevent net revenue loss; in fact, both have generatedadditional revenue for the transit agencies.
• The voucher programs generate revenue for the localagencies in that the vouchers or farecards are sold toemployers at the regular pass price.
• There are certain costs to the agencies for these pro-grams. For instance, administration of the overall Com-mute Partnership Program, of which FlexPass is onepart, costs King County Metro roughly $1.4 million peryear; 45% of this is covered by federal grants. In Port-land, the administration of the PASSport program ishandled by four Tri-Met sales representatives, along witha portion of a manager’s time. The New York MTApays a commission to TransitCenter for the distributionof TransitCheck MetroCards; however, this is a lowercommission than the MTA pays retail pass sellers.
Thus, employer pass and voucher programs have beenshown to benefit employees, employers, and transit agencies.Clearly, the simpler—and less costly—it is for employers toadminister these programs, the more likely they will be toparticipate. Similarly, the more convenient it is for employ-
66
ees to take advantage of commuter benefits, the more likelythey will be to use transit to get to and from work. Annualpass programs have made participation convenient for bothemployers and employees. However, it is important in estab-lishing these programs that transit agencies structure pricingin such a way that they protect themselves against losing rev-enue; the pricing should be able to capture at least some rev-enue from the new trips being generated.
In voucher-type programs, the direct provision of farecardsand the emerging automation of benefits distribution are alsogreatly improving the convenience for all parties. As theuse of electronic payment options spreads, more and moreagencies will offer such mechanisms within their regions,thereby expanding the range of options available to allow bothemployers and employees to take advantage of commuterchoice benefits.
ACCESS-TO-JOBS PROGRAMS
Federal welfare reform legislation, passed in 1996, radi-cally changed the American welfare system, emphasizing themove of individuals from welfare-to-work. In implementingthe resulting welfare reform programs, states and localitiesquickly realized the importance of ensuring access to reliableand affordable transportation services for residents attempt-ing to make this transition.
Addressing welfare-to-work transportation issues hasrequired creation of new collaborations among public agenciesand private organizations, establishment of new transportationservices, and development of innovative funding strategies.However, an important element of all access-to-jobs programshas been the provision of a mechanism for individuals to payfor these services, in terms of both subsidizing travel and fur-nishing the actual payment media. This has resulted in vari-ous types of special transit payment arrangements. The use ofelectronic payment media has also been proposed as a meansof improving these arrangements. This section reviews exam-ples of the following types of strategies currently in place orunder consideration:
• Special payment arrangements. In some cases, wel-fare recipients are directly provided with transit passes(or other fare media) for specified periods of time. Inother cases, recipients must purchase their own faremedia; they may then be reimbursed (e.g., by the respon-sible social service agency). Finally, where new ser-vices are created specifically to address access-to-jobsneeds, the service may be free to eligible users, whereasmembers of the general public using the service wouldhave to pay a fare.
• Use of electronic payment media. Electronic farecardsmake it possible to track actual use of the service by an
individual and can also potentially facilitate combiningthe distribution of access-to-jobs transit benefits withelectronic benefits transfer (EBT) programs.
These categories of fare-related strategies are discussedbelow, following a summary of the funding sources for theseprograms
Funding Sources
State and local agencies have used a variety of fundingsources to cover welfare transportation-related costs. (For amore complete discussion of these funding sources and otheraspects of welfare-to-work transportation services and issues,see Multisystems et al., TCRP Report 64: Guidebook forDeveloping Welfare-to-Work Transportation Services, Trans-portation Research Board, 2000.) Programs have been fundedby a combination of federal, state, local and sometimes pri-vate sources. The primary federal funding sources have beenthe following:
• Temporary Assistance to Needy Families (TANF)block grants given to the states. Each state can use thegrant money to finance transportation and other supportservices that will make it easier for welfare recipients tofind and retain employment. TANF funds can be used fora range of transportation purposes, including reimburse-ment, a cash allowance for work-related transportationexpenses, and purchase of transit passes or vouchers—by TANF recipients. (The TANF block grant programwas established in the Personal Responsibility and WorkOpportunity Reconciliation Act (PRWORA) of 1996(Pub. L. 104-193) and is administered by the U.S. Depart-ment of Health and Human Services.)
• Welfare-to-Work program grants have been awarded (inFY1998–99) to states as well as individual communities.These grants were intended to benefit the hardest-to-employ TANF recipients and provided funds for variouspurposes, including transportation. (The Welfare-to-Workformula and competitive grant program was authorizedby the Balanced Budget Act of 1997 (Pub. L. 105-33)amending Title VI-A of the Social Security Act, and isadministered by the U.S. Department of Labor.)
• The Job Access and Reverse Commute (JARC) pro-gram was established to help develop transportationservices to link welfare recipients and others to jobsand support services. Funds are awarded on a compet-itive basis, and projects must be the result of a coordi-nated human services/public transit planning process.Eligible types of projects include promotion of use oftransit vouchers by eligible individuals and other activ-ities to facilitate the use of transit for access to jobs bywelfare recipients. JARC funds cannot be used to sub-
67
sidize fares on existing services. (The JARC grant pro-gram was authorized under the Transportation EquityAct for the 21st Century (TEA-21) and is administeredby U.S. DOT)
A number of states have used the above federal sources tosupport local or regional transportation projects. In New Jer-sey, for example, the state DOT established a TransportationInnovation Fund (TIF) to provide seed money for local orregional programs on a competitive basis. Several otherstates, including California, Connecticut, Michigan and Wis-consin, have set up similar programs, i.e., to provide com-petitive local grants (2). Finally, access-to-jobs programshave received grants and donations from a variety of privatesources, including employers, community organizations,foundations and faith-based organizations.
Special Payment Arrangements
As suggested above, fare-related programs instituted toassist welfare recipients have taken various forms, includingdirect provision of passes or vouchers, reimbursement for pur-chase of fare media and even free transit. In some cases, pro-grams essentially fall under the commuter benefits arrange-ments discussed previously.
• State of New Jersey. In order to address the require-ments of a statewide welfare reform initiative known asWork First New Jersey (WFNJ), the New Jersey Depart-ments of Transportation and Human Services, in con-junction with New Jersey Transit (NJT), mandated thateach county in the state develop a Community Trans-portation Plan. Each county has thus developed servicesor programs aimed at meeting the transportation needsof welfare recipients. One of the key programs utilizedby the counties has been WorkPass. In this program,NJT monthly transit passes are provided to participants—although at least one county (Essex) chose to provideup-front payments of the pass price rather than thepasses themselves. For those WFNJ clients who mustuse an operator other than NJT (e.g., PATH or a privatecarrier), an end of the month transportation-relatedexpense (TRE) reimbursement is provided (41). (TheWorkPass program is discussed further in the New Jer-sey Transit Case Study, in Part II.)
• Delaware Transit Corporation (DTC). DTC hasestablished several access-to-jobs fare programs. JobsWorks provides eligible individuals free transit rides(through the statewide DART First State transit service)to and from job interviews. Once hired, individuals areeligible to receive free transit passes for up to three weeksthrough the Get a Job Get a Ride program (42).

• Missouri Bootheel Transportation Outreach Pro-gram. The Bootheel program was established in south-east Missouri to address access-to-jobs needs. Riderseither purchase a pass for use on the service or employerswithhold the price of the pass from workers’ paychecksto cover the cost of transit. In either case, the riders arereimbursed for their travel by the State Department ofFamily Services. The routes are also open to the generalpublic, although these riders must pay the full fare (i.e.,without reimbursement).
• San Luis Obispo County (CA). A Universal TransitPass valid on any of the six operators in the county wascreated based on a request from the County Departmentof Social Services (DSS). The DSS had previously beenrequired to buy separate passes from the different oper-ators to accommodate the differing needs of its clients.The Universal Transit Pass was seen as significantly sim-plifying both the DSS’s administrative requirements andthe use of transit by clients.
• City of Philadelphia. The Mayor’s Office of Policy andPlanning provides a transitional transit subsidy to eligi-ble individuals once they’ve secured employment.
• Akron (OH) Metropolitan Regional Transit Author-ity. Under the Ohio Works First Pass Program, eligiblecounty residents can ride fixed-route transit for free.(This program is discussed in the Akron METRO RTACase Study, in Part II.)
• Capital District Transportation Authority (CDTA).As part of a comprehensive access-to-jobs program,CDTA (Albany, NY) operates a transit pass programproviding “round the clock” access to various servicesprovided and supported by the authority.
• Suburban Mobility Authority for Regional Trans-portation (SMART). SMART, which operates transitin the Detroit area, has a Get a Job Get a Ride programthat provides new employees their first month’s bus fareat no charge.
• City of Bradenton (FL). The statewide WAGES coali-tion buys and distributes monthly passes and multiridetickets to eligible individuals.
• Rochester-Genesee Regional Transportation Author-ity (R-GRTA). R-GRTA (Rochester, NY) uses personalcomputers as one means of distributing transit passes toprogram participants. Computers at more than twentylocations are networked to the authority’s central com-puter and each is connected to a printer. R-GRTA invoicesthe county department of social services on a monthlybasis for all TANF passes.
There are many similar programs throughout the UnitedStates, and, as suggested by the examples, such programs areadministered by different types of entities or collaborationsamong multiple entities. With regard to transit agencies inparticular, the 2001 APTA Transit Fare Summary reports that78 agencies (out of the roughly 250 reporting overall) have
68
fare programs involving subsidies from social service agen-cies; 45 agencies report offering special fare media for “low-income persons” (37).
Use of Electronic Payment Media
The use of electronic farecards offers the potential toimprove the efficiency and effectiveness of distribution ofaccess-to-jobs transit benefits. For instance, these technolo-gies make it possible to track actual use of a transit serviceby an individual; this can provide documentation for reim-bursement purposes. Farecards also offer the opportunity tocombine the distribution of access-to-jobs transit benefitswith other electronic benefits (e.g., food stamps) to eligibleindividuals.
While the use of electronic media (magnetic in particular)is well established for general transit payments, its use inaccess-to-jobs applications is just beginning. Current exam-ples of use of magnetic or smart card systems to track transitusage by program clients include transit agencies in Lub-bock, TX, Rochester, NY, and Ventura County, CA. In theVentura County Go Ventura project, for instance, six access-to-jobs centers have been equipped for the distribution andloading of Go Ventura smart cards with subsidized passes ore-purse value for eligible agency clients; the card readers trackusage of the access-to-jobs cards, allowing the subsidizingcenters to pay for their clients’ rides and ensure that theclients are traveling to job sites as intended. VCTC providessmart cards to the centers at no cost.
Programs such as TRIP (Transportation Resources andInformation Project) in Cincinnati and the WorkPlace inBridgeport (CT) have also explored the possible use of smartcards to enable the tracking of client transit usage. TRIPundertook a study of paperless options, and the result was arecommendation for a smart card system. The WorkPlacerecently participated in a study that considered the feasibil-ity of implementing a regional farecard for use by all publictransportation providers in southwestern Connecticut (43).The desire to provide an integrated payment option foraccess-to-jobs clients was one of the key drivers behind thisstudy; in fact, one of the first access-to-jobs services estab-lished in that region (the Coastal Link) involves three differ-ent operators, which makes fare payment somewhat unpre-dictable and thus inconvenient. A regional farecard is thusseen as significantly improving the convenience of using thisservice.
The potential to provide the delivery of access-to-jobsbenefits on the same card as EBT programs has not yet beendemonstrated but is being explored in several locations. Forexample, the University of New Mexico (Albuquerque) isworking on development of a public transportation farecardsystem that will utilize the NM Human Services Depart-ment’s existing magnetic EBT card as the base card. Essen-tially, people whose transit use is sponsored (e.g., with TANFor Welfare-to-Work funds) will use the EBT card for fare

payment; however, rather than a pass or stored value resid-ing on the card, the number of authorized transit trips foreach client will be stored in a database. When the clientboards a vehicle and swipes the card through the card reader,the client identification number will be stored in the reader’smemory; information on the trips taken with each card willthen be downloaded (at the end of the day) to a central com-puter. The validity of each trip for reimbursement (i.e., basedon the restrictions of the specific funding program) will thenbe checked and the person’s account updated. The Universityissued an RFP for this system in January 2001 and receivedtwo proposals; the project is moving forward, although, as oflate 2001, a contractor had not yet been selected.
Cincinnati’s TRIP has apparently looked at the possibilityof tying into the State of Ohio Direction Card a smart cardissued by the Department of Human Services to distributefood stamp benefits throughout the state. This card has alsobeen considered for possible integration with transit fare pay-ment in general (i.e., not specifically tied to access-to-jobspurposes) in a smart card feasibility study by the GreaterCleveland RTA. In both cases, linking other types of appli-cations to the Direction Card was not deemed feasible giventhe current configuration of the card and the economics ofconverting to a different card platform under the existingcontract (with Citibank).
Another project that sought to link transit and EBT appli-cations was the Access NJ initiative proposed in the late1990s. A pilot was planned for 2000 in Mercer County thatwould include a transit application on a dual interface EBT/identification card: EBT recipients and state employees woulduse the card ID with online terminals to access state programsand would also be able to use a stored-value transit purse topay bus fares on designated routes. The long term plan wasfor Access NJ to support and share its program costs withmany state and private sector applications, some directly onthe card and some linked to the card ID and available only viaonline terminal access. The pilot had not been initiated as ofmid-2002.
Thus, while there is widespread interest in the potential ofelectronic media for improving the delivery and use of access-to-jobs transit benefits, there has been relatively little testingof such applications to date. As smart cards in particular seemore use in transit and various other applications, there shouldbe greater opportunities for integrating transit and other typesof human service benefits.
Impacts of Access-to-Jobs Programs for Case-Study Agencies
Two of the case studies describe access-to-jobs programssuch as those discussed above:
• Akron (OH) Metropolitan Regional Transit Author-ity operates a free-fare program for eligible county
69
access-to-jobs clients under the Ohio Works First PassProgram; clients ride free when showing a valid photo ID.
• New Jersey Transit operates the WorkPass Program aspart of the statewide access-to-jobs initiative, Work FirstNew Jersey. WorkPass provides monthly passes orsingle-ride tickets to eligible individuals.
The full case studies are presented in Part II. However, it isuseful to compare the results of these efforts in terms of theirimpacts on both partner agencies and clients, as well as on thetransit agencies. Table 4-8 summarizes the key impacts of thetwo programs. These impacts are discussed briefly below.
Customer Impacts and Benefits
The major impacts on, and benefits to, partner agencies andclients from the case study programs include the following:
• Convenient access to transit service for employmentand training travel—as well as other types of trips—byeligible riders.
• Service for free (Akron) or at a fare significantly lowerthan the regular fare (NJT).
• Positive response by partner entities. In New Jersey, forinstance, over 75% of the counties participate in the pro-gram, along with more than 40 social service agencies.More than 5,000 passes and tickets are distributedthrough the program each month.
• Considerable cost savings because of New Jersey Tran-sit’s WorkPass program for the participating socialservice agencies. An agency can save over 50% incomparison to the previous Transportation Reimburse-ment Expense (TRE) Program that covered access-to-jobs trips.
Agency Impacts and Benefits
The major impacts on, and benefits to, transit agenciesfrom the case study programs include the following:
• Increased ridership from these programs. Akron METRORTA provides an average of 50,000 rides per monththrough the program, and most of these are considerednew rides. New Jersey Transit has also seen ridershipincreases.
• Improved public opinion of the agencies. For instance,New Jersey Transit has been seen as a key part of thedevelopment of a workable approach to addressing thestate’s access-to-jobs needs.
• For New Jersey Transit, considerable resistance at thecounty level in planning and implementing the Work-Pass program; New Jersey Transit had to work closely

70
TABLE 4-8 Case study comparison: access-to-jobs fare programs
Case-Study Agency/ Name of Program (Year Initiated)
Akron METRO RTA/ Ohio Works First Pass Program
New Jersey Transit/ WorkPass Program (1997)
Nature of Program
Ohio Works First Department of Job and Family Services (DJFS) clients ride free
when showing valid photo ID.
WorkPass provides monthly passes or single-ride tickets to eligible individuals
through county welfare offices and social service agencies
Other Participants Summit Co. (DJFS) NJ Dept. of Human Services, NJ DOT, NJ Dept. of Labor, NJ Employment & Training Comm., county welfare offices and social
service agencies Transit Agency Goals of Program Provide employment and training access to
eligible DJFS clients Provide safe, reliable, and convenient
transportation to Work First NJ program clients and other transit dependents
Customer Impacts and Benefits Usage rates NA* NA Attitude toward program/other benefits
Program clients are generally satisfied and are using transit on a regular basis;
program is easy to use
Provides riders improved flexibility (i.e., unlimited transfers for entire month, for
both work and other purposes) Cost of travel Free with valid ID Free or lower than regular fare; extent of
benefit depends on specific eligibility/status of client
Agency Impacts and Benefits Ridership 50k rides/mo.; most of these are new rides Results in additional ridership (varies by
county) Revenue METRO receives $200k/year from DJFS Depends on specific WorkPass program Other Impacts/Benefits Program has apparently improved the
public’s opinion of METRO in general NJT seen as part of the solution
Impact on/Benefits to Partners Market penetration Available to anyone with valid ID 16 of 21 counties and >40 soc. service
agencies participate, >5k passes/tickets distributed each month
Other (e.g., need for parking) Facilitates provision of access to jobs and training; eliminates agency’s concerns
about the cost of this transportation
>$2m in cost savings for agencies over previous Transportation Reimbursement Expense (TRE) program; average TRE
benefit had been $120 per month, while 1-month bus pass is <$60
Liability to agency Economic liability METRO currently unable to limit free trips
to work/training trips, but little economic risk since amount of contract can be
adjusted to match ridership.
NJT provides free passes in some cases.
Political/legal liability None None Constraints and Barriers Technical None None Institutional/Funding TANF, Title XX and DJFS funds Program met resistance from counties
over perceived obstacles. Funding from counties (using TANF or General Assistance funds through NJDHS)
Required Equipment and Technology
ID cards must be manually viewed, since they contain photos; plan is to ultimately
provide magnetic cards that can be read in farebox.
None
* NA = Not applicable.
with the various partner entities to resolve the perceivedobstacles; these included, for instance, concerns thatWorkPass would mean more work for program repre-sentatives and that WorkPass would remove clients’flexibility to spend part of their transit payments on foodfor their families. (As indicated above, these and otherobstacles were ultimately overcome, and counties andsocial service agencies have become participants in theprogram.)
71
Thus, access-to-jobs partnerships have been shown to ben-efit eligible riders by providing affordable access to employ-ment and training sites. However, since these programs ofteninvolve participation by a number of different entities, it isimportant that the participants clearly understand—and besensitive to—each other’s goals and concerns in developingand implementing the program.
The key findings of this and the previous chapters arereviewed in the next chapter.
72
CHAPTER 5
SUMMARY OF FINDINGS
INTRODUCTION
In their efforts to maintain, if not expand, their share of thetraveler market in recent years, transit agencies have facedboth new challenges and new opportunities. While growingoperating costs and dwindling subsidies have forced agenciesto consider steeper or more frequent fare increases, organizedcommunity opposition to higher fares has grown as well.Moreover, the continuing dispersal of travel patterns withinregions has forced agencies to continually refine servicedesign and to target marketing efforts to specific market seg-ments.
Perhaps no aspect of transit management and operationshas been affected by these trends as fundamentally as fare pol-icy. Over the last several years, transit agencies have increas-ingly considered fare policy and fare structure changes andnew payment options that target the needs of specific usergroups and make use of emerging subsidy arrangements—while at the same time needing to address local concernspressed by community and environmental groups. In general,agencies have had to broaden the context in which they con-sider fare-related initiatives, and consequently they havesought to take greater advantage of opportunities to participatein new types of partnerships and funding programs linked tospecific market segments (e.g., related to university, employer,and access-to-jobs programs).
At the same time, the expanded capabilities of electronicpayment technologies (i.e., magnetic stripe farecards andsmart cards) have benefited agencies by facilitating the provi-sion of a range of flexible payment options and more efficientmethods for distributing transit benefits and fare media to cus-tomers. Electronic fare media have also facilitated develop-ment of the aforementioned types of partnerships and pro-vided a framework for regional multiagency fare integration.The capabilities of smart cards in particular have createdpotential opportunities for transit agencies to establish part-nerships with nontransit entities such as parking authorities,toll operators, financial institutions, and retail establishments.Such multiapplication arrangements offer the potential toexpand transit’s market by increasing the convenience ofpaying fares and the establishment of loyalty programs; thesenew partnerships may also eventually offer the opportunityto share administrative costs and generate new revenues forthe transit agency.
Key issues and emerging developments related to andaffecting fare policy and pricing include the following:
• Equity and environmental concerns. Pricing and farepolicy are increasingly being influenced by factors relatedto equity and environmental issues, including concertedopposition to proposed fare increases based on environ-mental justice.
• New programs and partnership opportunities. Transitagencies are increasingly entering into fare-related part-nerships with a variety of entities, including social serviceagencies (e.g., for access-to-jobs benefits), employers,and universities, often to provide low-priced passes orother special payment arrangements. The introductionof smart cards presents opportunities to develop part-nerships with other types of nontransit entities.
• Focus on providing for “seamless travel.” There hasbeen a growing emphasis on the development of multi-agency agreements and integrated regional paymentarrangements.
TCRP Project A-25 has investigated these areas within thecontext of the overall trends and developments related to farepolicies, structures, and technologies over the past severalyears. This report presents the research methodology andresults of the study. Key findings of the study are summa-rized below.
FARE POLICY AND STRUCTURE ISSUES AND TRENDS
Key trends and developments related to fare structures andpayment options are as follows:
• Increase in fare levels. Fares have risen significantlyover the past few years: roughly one-third of NorthAmerican transit agencies had peak fares of $1 or morein 1994, while two-thirds of these agencies were at thislevel in 2000; the most common fare was $0.75 in 1994(20% of agencies), $1 in 2000 (19%). In 2001, twoagencies became the first (among noncommuter rail sys-tems) to reach the $2 peak fare level, and one of theseagencies announced in 2003 the intention to raise its

73
fare to $2.25. Of course, while few agencies directlylink fare increases to inflation rates, many agencies havemore or less simply tracked inflation in making moder-ate fare increases. For instance, a $1 fare in 1994 wouldhave risen to $1.15 in 2000 if adjusted for inflation.
• Simplification of fare structures. Despite the growthof electronic fare systems, agencies continue to opt forsimplified basic fare structures, generally choosing notto introduce fare zones or peak/off-peak differentials. Infact, the percentages of agencies using these strategieshas declined in the last few years, as several agenciesthat already had such differentials have moved to reducethe complexity of their fare structures (e.g., eliminatingor reducing the number of zones).
• Elimination of transfers and introduction of daypasses. Some agencies have opted to eliminate the pro-vision of free or low-priced transfers in conjunctionwith selling 1-day passes on buses and in rail stations.There has been an increase in the use of short-termpasses (i.e., 1- to 3-day, as well as partial day) in gen-eral, both for visitors and regular riders.
• Increase in market-based pricing strategies. Agenciesare increasingly offering a range of payment options thatsegment the market based on frequency of use and will-ingness to prepay. These options typically include oneor more type of unlimited-ride pass as well as someform of discounted multiride option. However, the per-centage discounts—or bonuses—offered with multirideoptions (tickets, tokens or stored-value farecards) hasdecreased somewhat, with fewer agencies providing“deep discounts”: in 1994, 42% of North American agen-cies offered multiride discounts of more than 20%, whilethis percentage dropped to 29% of all agencies in 2000.
While transit agencies are raising fares and generally seek-ing to simplify their basic fare structures, they are expandingthe range of payment options they are offering riders. Thisincrease in payment options has been fueled in part by the intro-duction of electronic payment technologies, reviewed below.
FARE PAYMENT TECHNOLOGYDEVELOPMENTS
An increasing number of agencies are implementing elec-tronic fare payment strategies and many are introducing—orat least strongly considering—smart cards. Key findings relatedto this area are summarized below.
Influence of Electronic Payment on Fare Policyand Payment Options
Electronic payment technologies have facilitated the intro-duction of a range of flexible new fare payment options,including various forms of stored-value, “rolling” time-based
passes (activated on first use), frequency-based discounts,automated transfers and fare differentials, and guaranteedlast ride (or “negative balance”) policies. Some agencies areeven considering a “guaranteed lowest fare” strategy, whichessentially eliminates the need for the rider to decide on aspecific payment method in advance.
In some cases (e.g., NYMTA’s MetroCard program), theintroduction of electronic payment has significantly influ-enced fare policy as agencies have taken advantage of the newcapabilities to significantly modify their basic fare structures.Other agencies (e.g., CTA), on the other hand, have increasedthe range and flexibility of payment options offered but havenot made significant changes in the basic fare structure.
Issues Associated with Use of Smart Cards
Contactless—or sometimes dual interface—smart cardsare already in use in a number of locations and are planned formany others. In the United States, smart cards are now in use,at least on a trial basis, in Washington, DC; Chicago; VenturaCounty, CA; the San Francisco Bay area; Orlando, FL; andNewark, NJ. Other programs are planned for implementationin over a dozen other cities or regions over the next few years.Abroad, very large regional efforts have been in place for sev-eral years in Hong Kong, Seoul, and Pusan and are underdevelopment in London, Paris, Rome, Berlin, Tokyo, and anumber of other world capitals.
Key issues related to the use of smart cards by transit agen-cies include the following:
• Addressing the cost of smart cards. One of the keyconcerns regarding smart card use is the relatively highcost of the cards themselves. Some agencies have soughtto encourage retention of the cards—as well as to defraytheir purchase cost—by imposing a card issuance charge(e.g., $5); this charge typically allows the cardholder toregister the card with the agency and receive balanceprotection in the case of loss of the card. Other strategiesthat have been developed (although not yet available forall vendors’ systems) include (1) low-priced paper con-tactless tickets targeted for distribution to one-time oroccasional riders, and (2) recycling systems designed toensure that the smart card (or token, in one system) isreturned to the agency after it has been used.
• Addressing concerns regarding smart card standardsand interoperability. One of the major concerns withinthe transit industry has been how to promote standard-ization and interoperability among the different contact-less card technologies. Vendors have begun to addressthis issue by developing cards and readers that combinemultiple card interfaces. From the agency side, there areseveral efforts underway, in the United States and abroad,to establish industry-wide standards or guidelines fortransit smart card applications.

74
• Insuring compatibility with existing equipment. Inlight of interoperability concerns, a major technical issuefacing all of the agencies seeking to add smart cardcapability to an existing fare collection system is insur-ing compatibility with the existing system. For instance,in an effort to facilitate installation of the SmarTripreaders into the Metrorail faregates, WMATA opted tosole source the implementation to the existing rail farecollection vendor. CTA has avoided this issue, sincesmart card capabilities were built into the original AFCequipment; of course, in order to take advantage of thepreinstalled card readers, CTA also had to sole sourcethe provision of smart cards to the original vendor. InTransLink, developing a strategy for integrating onevendor’s smart card system into the BART faregatesbeing installed by a second vendor has proven to be asignificant challenge.
• Using electronic fare media in a proof-of-payment(POP) system. Electronic farecards (either magneticstripe or smart card) cannot be directly used in a POPenvironment, since POP requires the rider to display avalidated ticket or a flash pass to a fare inspector. Afaregate or farebox equipped to read electronic fare-cards automatically identifies the validity of the cardand deducts the proper fare value (unless the card is anunlimited-ride pass). This is infeasible with a TVM andvisual fare inspection. Therefore, use of farecards in aPOP system requires special accommodations to allowthe user to validate the card and the inspector to check thevalidity of the card. The most common approach beingimplemented in U.S. systems—planned for smart cardsystems in San Francisco, San Diego, Los Angeles, Seat-tle, Miami, Minneapolis, and Washington/Baltimore—isto provide in-station card processing units and to have theinspectors carry hand-held card readers.
Development of Regional Fare IntegrationPrograms
As suggested above, electronic payment media are increas-ingly being introduced to serve multiple transit agencies in aregion—i.e., to facilitate seamless travel using a single fare-card. Regional fare integration should ultimately entail allagencies in a region adopting a common fare policy, basedon regional passes along with free or discounted transfers.However, use of electronic fare media allows each agency toretain its own fare structure while accepting a regional fare-card (e.g., with payments made from a common stored valuepurse). In a smart card-based system, a customer would pre-sumably also be able to load individual payment options(e.g., a pass) from one or more agencies onto the same card.
As evidenced by the experiences of those regions that havedeveloped integrated systems, this is invariably a rather com-plicated undertaking. Establishing a multiagency payment
system is likely to require fundamental changes from the wayeach individual agency manages fare collection on its own.Complex partnership agreements are typically needed toestablish responsibilities, ownership, and allocation of costsand revenues. While a separate clearinghouse or back-endpayment settlement system can be developed to manage theseprocesses, all participating agencies must come to agreementon revenue management policies and procedures. The typesof issues and requirements that must be considered in devel-oping a regional fare system generally fall under the follow-ing categories:
• Overall Policy and Business Rules. Establishing thefinancial and governance framework and system pro-curement strategy; addressing customer concerns; andsetting fare policy for the region.
• Technical Requirements. Developing system architec-ture and technology standards, and identifying effectiveimplementation staging.
• Administrative and Customer Support Functions.Establishing revenue settlement and data-sharing pro-cedures, as well as customer service functions.
The regions pursuing regional fare integration to date havetaken various approaches to addressing these requirements.The U.S. efforts are all in the early stages of implementationor testing; as these programs become operational in the nextfew years, their lessons will provide guidance to other regionsconsidering such initiatives.
Potential for Developing MultiapplicationPrograms
The growing use of smart cards for various types of uses(e.g., electronic toll collection, parking, financial services,mobile commerce, loyalty programs and identification/access/security) provides opportunities to combine transit and otherapplications on one card. While most smart card programsfocus on a single application, the goal of many issuers is toultimately provide multiple functions on a card.
Transit fare payment is increasingly seen as a key appli-cation, regardless of the primary use and issuer of the card.Thus, a broad range of new types of transit agency partner-ships can now be considered with entities that would issue asmart card, accept one for payment of their goods and services,or both. Indeed, agencies in Washington, DC; Orlando, FL;Ventura County, CA; and San Francisco are already testing—or at least plan on pursuing—multiapplication arrangements.Other regions developing new electronic payment systems(e.g., Seattle, Los Angeles, San Diego, and Boston) have alsoindicated that they will likely pursue multiapplication oppor-tunities. Meanwhile, a number of transit smart card projectsabroad (Hong Kong, Pusan, Paris, Curitiba, and elsewhere)have established multiapplication arrangements.

75
As the use of smart cards for all types of purposes expandsin the coming years, the opportunities for establishing multi-application programs will grow as well. A number of transitagencies have opted for dual interface (contactless/contact)cards so as to best position themselves to take advantage ofsuch opportunities. Moreover, the recent announcements byVisa and MasterCard of specifications for contactless credit/debit applications could pave the way for transit’s participa-tion in multiapplication partnerships.
Benefits and Impacts of Electronic PaymentPrograms
Electronic payment programs have been shown to benefitboth agencies and their customers. Some of these benefitsresult from an agency implementing electronic payment ingeneral (i.e., magnetic or smart card), while others can beattributed specifically to use of smart cards. As revealed bythe case studies undertaken for this report, the key types ofbenefits—and impacts—associated with electronic fare mediaare summarized below.
Customer Benefits and Impacts (All Electronic Media)
• A greater variety of, and more convenient, paymentoptions, such as rolling activate-on first use passes,stored-value/stored-ride farecards, and 1-day passes soldon buses. Farecards have also reduced the cost of travelfor many riders by offering low-price 1-day passes or apurchase bonus.
• Popularity with customers. About 95% of CTA’s railriders pay their fares with farecards, as do 68% of busriders. At CT TRANSIT, overall pass use has increasedby more than a third since the introduction of electronicpayment, and the use of 1-day and 7-day passes in par-ticular has grown steadily since their introduction.
Customer Benefits and Impacts (Smart Cards)
• Current benefits: (1) the availability of features suchas registration/balance protection, autoload and nega-tive balance; (2) the ability to use the same card withmultiple agencies, if available; and (3) the improvedconvenience of the contactless interface (i.e., the carddoes not have to be removed from a wallet or purse).
• Potential benefits: (1) multiapplication capabilities and(2) innovative fare structure options, such as a frequency-based discount or even a guaranteed lowest fare strategy.
• Customer satisfaction: Users of smart cards haveexpressed high levels of satisfaction with the cards andprograms. For instance, in Chicago, 93% of survey
respondents were “satisfied” or “very satisfied” with thecards and 86% expressed willingness to continue usingthe card after the conclusion of the pilot period and torecommend the card to others. In the TransLink pro-gram, both survey respondents and focus group partici-pants expressed a high level of satisfaction with the pro-gram. Moreover, two-thirds of noncard users surveyedsaid that they are “very likely” to try the card. Sales ofthe SmarTrip card in Washington have grown steadilysince its introduction, despite the fact that WMATA hasdone very little marketing of the program.
• Customer concern: In contrast to the use of magneticcards, customers must often pay an initial fee to acquirea smart card. This cost is $5 in Chicago and Washing-ton, for instance. There is no charge in the Go Venturaand TransLink programs (at least for the TransLinkpilot), but a customer must pay $5 for card replacement/balance protection in these programs. The $5 chargewas the smart card aspect liked least by survey respon-dents in Chicago (cited by 30% of respondents). Thecard fee reportedly has not been an issue in Washingtonto-date, although expansion of the program to busescould conceivably produce some customer complaints(because, unlike the case on Metrorail, there will not bea magnetic farecard available without an initial charge).
Agency Benefits and Impacts(All Electronic Media)
• More careful tracking of ridership and revenue impactsof different fare initiatives and facilitated implementa-tion of a greater range of fare options for customers.
• Considerably reduced use of cash for fare payment: At CTA, for instance, only 16% of boardings are cur-rently made using cash, compared to 27% pre-electronicpayment.
• Reduced or even eliminated tokens. For example, CTAwas able to eliminate tokens altogether following theintroduction of stored-value farecards, thereby remov-ing expenses associated with their sale and redistribu-tion. CT TRANSIT’s token use dropped by almost halffollowing the introduction of stored-ride cards.
• Reduced fare-collection costs associated with produc-ing, selling, and distributing fixed-calendar period passesbecause of use of rolling passes. For instance, an agencyno longer has to print weekly and monthly passes thatmay be discarded if they are not purchased.
• Reduced opportunities for fare abuse and evasion throughautomatic verification of validity of fare media, and bycurtailing counterfeiting of passes. These systems canalso reduce operator requirements for administering farecollection and the extent of rider-operator confronta-tions regarding the validity of passes and transfers.

76
• New costs associated with introducing a new technol-ogy. For example, CTA initially envisioned that imple-mentation of electronic payment would result in a per-sonnel cost savings since there would be a reduced needfor rail ticket agents. However, the new program requireda significant outreach and customer service effort on thepart of the agency, and many of the rail ticket agents wereconverted to “customer assistants” located in the stationsto help riders use the new system. Due to these and othernew staff requirements, CTA has not realized the person-nel cost savings originally expected.
Agency Benefits and Impacts (Smart Cards)
Due to the short operational period—and generally limitedscope—of U.S. smart card programs to-date, it is difficult toidentify significant agency impacts and benefits. However,beyond the above benefits associated with electronic pay-ment in general, there are a number of benefits—and costs—associated with introducing smart cards:
• Faster boarding or throughput than with fare media thathave to be inserted or swiped. This could ultimately trans-late into service reliability improvements as higher per-centages of boardings are made using contactless cards.
• Facilitated consideration of innovative types of fareoptions and the use of data on card usage to improveservice planning due to higher data capacity and pro-cessing capabilities of smart cards.
• Inclusion of convenience features such as autoloadarrangements (including employer-based programs).For instance, the SmarTrip (through SmartBenefits) andTransLink programs both include employer autoloadprograms that make it easier for employers to providecommuter benefits to their employees.
• Multiapplication opportunities, as indicated above. Forinstance, the SmarTrip card can currently be used inWMATA parking facilities, and the agency has estab-lished multiapplication pilot projects with First UnionBank and GSA. VCTC has pursued Go Ventura part-nerships with a university and with county social serviceagencies.
• Reduced equipment costs: Contactless card readers tendto be less costly to purchase than comparable magneticunits. Thus, an agency that accepts only smart cards(i.e., in addition to cash—at least on buses) should expe-rience a lower capital expenditure than if it acceptedonly magnetic cards. However, many agencies deem itnecessary or appropriate to accept both types of faremedia, thereby neutralizing any net cost savings associ-ated with the smart card equipment.
• Reduced maintenance costs: Contactless card readersshould also have lower maintenance requirements than
magnetic card readers, since the contactless units aresealed and have no moving parts; the extent of the impacton overall system maintenance costs will depend on theagency’s mix of types of equipment (i.e., are there alsoelectronic or validating fareboxes and magnetic cardreaders?).
• Cost and funding issues: the cost to an agency associ-ated with smart card implementation and operation willdepend on the specific nature of the program. If it is partof a regional system, most or all of the initial capitalcosts will in some cases (e.g., TransLink, Go Ventura)be covered by the initiating agency (i.e., MTC andVCTC in those two cases), using largely federal andstate funds. In other regional models (e.g., SmarTrip),each agency is responsible for procuring its own equip-ment. If an agency is implementing a smart card systemon its own, it will clearly be responsible for the full cost.However, planning ahead can minimize the capital costof adding smart cards; for example, CTA procured itsinitial (magnetic) electronic payment system with smartcard capability built into all of the new equipment.
• Agency costs: in any type of regional system, the indi-vidual agencies will have to cover at least some operat-ing costs on their own (i.e., related to such areas asadministration, reporting, and equipment maintenance).Moreover, each agency will ultimately have to pay forclearinghouse/support services associated with suchactivities as card management and revenue allocation;such payments may be in the form of a certain fee persmart card transaction or based on a percentage of smartcard-based fare revenue.
Electronic payment technologies clearly offer a numberof customer-related and operational benefits. Such systemsimprove customer convenience in terms of both purchase anduse of fare media, while allowing agencies to offer a broaderrange of flexible payment options and to better manage theoverall revenue collection function (including improvingdata collection and reporting capabilities and controllingrevenue loss through fare evasion). However, while certainexpenses should be lowered (e.g., through reduction of useof cash, replacement of at least a portion of existing pay-ment media, or lower equipment purchase and maintenancerequirements), agencies should understand that implementa-tion of an electronic payment system will not necessarilyresult in an overall reduction of fare collection costs—particularly in the short term. There are costs associated withimplementing any new technology, and, where an agency isparticipating in a regional smart card program, the costsrelated to the new system are likely to add to, rather thanreplace, the agency’s existing fare collection costs. For thisreason, those agencies that have developed smart card systemsin particular tend to view them primarily as a means of bet-ter serving their customers—and hopefully attracting new

77
customers—while also improving revenue management.While cost reduction may well be a reasonable long-term goal,it should not drive an agency’s interest in an advanced paymentsystem.
EMERGING FARE-RELATED ISSUES ANDPROGRAMS
A number of types of fare policy and pricing strategies andinitiatives are emerging in response to (1) equity and envi-ronmental justice issues and (2) partnership opportunitiesthrough university, employer, and access-to-jobs programs.
Equity and Environmental Justice Issues
Environmental justice initiatives to insure that all popula-tion segments, including low-income and minority groups,receive fair treatment with regard to environmental issues areincreasingly affecting transit agencies’ consideration of poten-tial fare changes. Such initiatives have resulted in legal chal-lenges to proposed fare increases in several cities; moreover,even where such challenges have not proven successful—orhave not actually entered the courts—they have certainly influ-enced the fare policy decision-making process. Major legalchallenges over the past few years include the following:
• A suit filed by a community-based coalition sought toprevent implementation of a fare increase and pro-posed elimination of monthly passes by the Los Ange-les County Metropolitan Transportation Authority.LACMTA is currently bound by a consent decree that haslegally limited the extent to which the MTA can raisefares over the past several years.
• In Philadelphia, a number of community-based law-suits have led to changes in the process by which theSoutheastern Pennsylvania Transportation Author-ity adopts fare changes. One of these suits also ledSEPTA to introduce highly discounted tokens (only twotokens need be purchased to receive a 28% discount).SEPTA’s latest fare increase is currently being appealedin the courts by community groups.
• When the New York Metropolitan TransportationAuthority proposed fare increases in 1995, severalcommunity organizations filed suit to block the changes.The suit claimed that the fact that the increase on sub-way and bus (20% increase) was higher than that on thecommuter railroads (9% increase) was discriminatory.
• Following the June 2000 approval of a fare increase bythe Metropolitan Atlanta Rapid Transit AuthorityBoard of Directors, a coalition of community groupsfiled a discrimination complaint against the agency. TheAtlanta City Council and the Fulton County Commis-sion also adopted resolutions opposing the fare increase.
• Opposition by community and environmental groups inBoston to a Fall 2000 fare increase led the Massachu-setts Bay Transportation Authority to introduce freebus-bus transfers as well as a low-price weekly pass forthe first time.
In some cases, these challenges have resulted in modifica-tions to fare proposals or legal restrictions on future changes.In others, they have merely required the agencies to go togreat lengths to explain and defend their rationale for raisingfares. Regardless of the formal outcomes, however, all ofthese initiatives have had a significant impact on the localagencies’ fare policy decision-making processes. Moreover,the challenges in these cities have not gone unnoticed inother cities; many transit agencies, especially those in otherlarge cities, feel that they must now pay greater attention toequity and civil rights concerns in considering possible farestructure changes.
University Programs
Public transportation is an important travel option formany college students, faculty, and campus staff for travel-ing between the campus and off-campus housing and forintracampus circulation on large campuses. Some universi-ties provide their own campus area transit services, but manycampuses are served by the local transit operator. Where thelatter is the case, many universities have established partner-ships with the local transit agencies to provide speciallypriced passes or other payment options to students. The basictypes of programs are as follows:
• Special pass and unlimited-access programs. A num-ber of universities have joined with transit agencies toestablish special programs that provide free unlimited-access or low-cost passes for students (and, sometimes,faculty and staff).
• Special reduced-fare arrangements. Some universi-ties have arranged with the local transit operators to pro-vide for reduced single-ride fares for their students.
• Joint transit agency-university farecard programs. Asincreasing numbers of universities introduce magnetic orsmart cards for their students (for identification, buildingaccess, library usage, purchases at campus stores, etc.),local transit agencies have begun to pursue arrangementsto enable transit payments using the same cards.
By providing a low-cost and convenient form of transitpayment to the university community, the transit agencyshould see increased ridership, while building brand loyaltyto the transit system in terms of likely future use by students.Meanwhile, the university may be able to ease on-campusparking requirements by shifting some drivers to transit.

78
However, it is important to carefully design the pricing pa-rameters of university pass programs so as to minimize thepotential negative revenue impact on the agencies. In partic-ular, the agreement should be structured so that it allows theagency to increase the amount paid per person so as to reflectactual usage.
Employer Benefits Programs
Transit agencies have long pursued partnerships withemployers to facilitate, if not subsidize, employees’ use oftransit to commute to and from work. These partnerships wereoriginally limited to the distribution of monthly passes byemployers to their employees, often with at least a partial sub-sidy of the pass price. The programs subsequently becamemore flexible with the introduction of transit vouchers that theemployees could use to acquire the transit payment option oftheir choice. In the last decade, these basic approaches haveevolved and broadened, fueled both by a steady increase inthe tax-free transit benefit employees could receive and theemergence of electronic payment technologies. Key types ofemployer-oriented benefit programs now in place include thefollowing:
• Annual pass programs. In these programs, employersbuy passes for employees at significantly less than thenormal monthly cost of passes, based on a predeter-mined formula set by the transit agency. Examples ofthis approach include King County Metro’s FlexPassand Portland Tri-Met’s PASSport.
• Transit voucher programs. In these programs (e.g.,TransitCheck in the New York City region, Metrochekin the Washington, DC, region, and CommuterCheck invarious cities), employees receive vouchers that canthen be redeemed for passes or other options. In somecases (e.g., in New York City and Washington, DC), thevouchers are in the form of farecards that can be useddirectly for fare payment.
• Automated benefits distribution programs. The firstexample of this approach is WMATA’s SmartBenefitsprogram, in which an employer can establish an accountfor each participating employee that enables the employeeto automatically download the value of the benefit to theSmarTrip smart card; a similar approach is also beingtested in the TransLink program in northern California.
Employer pass and voucher programs have been shownto benefit employees, employers, and transit agencies. The simpler—and less costly—it is for employers to administerthese programs, the more likely they will be to participate.Similarly, the more convenient it is for employees to takeadvantage of commuter benefits, the more likely they will beto use transit to get to and from work. Annual pass programshave made participation convenient for both employers and
employees. However, it is important that transit agenciesestablishing these programs structure pricing in such a waythat they protect themselves against losing revenue; thepricing should be able to capture at least some revenue fromthe new trips being generated.
In voucher-type programs, the direct provision of fare-cards and the emerging automation of benefits distributionare also greatly improving the convenience for all parties. Asthe use of electronic payment options spreads, more and moreagencies will be able to offer such mechanisms within theirregions, thereby expanding the range of options available toallow both employers and employees to take advantage ofcommuter choice benefits.
Access-to-Jobs Programs
Addressing welfare-to-work transportation issues hasrequired creation of new collaborations among public agen-cies and private organizations, establishment of new trans-portation services, and development of innovative fundingstrategies. However, an important element of all access-to-jobsprograms has been the provision of a mechanism for individ-uals to pay for these services, in terms of both subsidizingtravel and furnishing the actual payment media. This hasresulted in various types of special transit payment arrange-ments. The use of electronic payment media has also beenproposed as a means of improving these arrangements. Thissection reviewed examples of the following types of strate-gies currently in place or under consideration:
• Special payment arrangements. In some cases, wel-fare recipients are directly provided with transit passes(or other fare media) for specified periods of time. Inother cases, recipients must purchase their own faremedia and then may be reimbursed (e.g., by the respon-sible social service agency). Finally, where new servicesare created specifically to address access-to-jobs needs,the service may be free to eligible users, whereas mem-bers of the general public using the service would haveto pay a fare.
• Use of electronic payment media. Electronic farecardsmake it possible to track actual use of the service by anindividual and can also potentially facilitate combiningthe distribution of access-to-jobs transit benefits withEBT programs.
Access-to-jobs partnerships have been shown to benefit eli-gible riders by providing affordable access to employment andtraining sites. However, since these programs often involveparticipation by a number of different entities, it is importantthat the participants clearly understand—and be sensitive to—each other’s goals and concerns in developing and imple-menting the program.
79
CONCLUDING REMARKS
In summary, transit agencies are faced with a growingarray of both demands and opportunities that affect theirdecisions on fare structures and payment methods. Agenciesare responding by entering into new types of partnerships andby introducing new types of payment options and pricingstrategies. The availability of electronic payment technolo-gies has facilitated partnerships with social service agencies,employers, and universities—as well as offering the poten-
tial to consider new partnerships with entities such as park-ing or toll operators, financial institutions, and governmentagencies. These technologies have also increased agencies’abilities to link payments with other agencies operating in thesame region and have greatly increased the range of paymentoptions that agencies can offer their riders. Agencies can nowdevelop market-oriented pricing strategies based on a flexi-ble new set of payment options. These options represent anopportunity to better serve the existing rider markets whilealso attracting new riders.

80
REFERENCES: PART I
1. Fleishman, D., N. Shaw, A. Joshi, R. Freeze, and R. Oram.Fare Policies, Structures, and Technologies. TransportationResearch Board, TCRP Report 10, 1996.
2. D. Fleishman, C. Schweiger, D. Lott, and G. Pierlott. TCRPReport 32: Multipurpose Transit Payment Media, 1998.
3. Survey of agencies in Multisystems, Transit Fare CollectionDecision Models for Fare Policy and Cost Analysis—FinalReport, for USDOT/SBIR Program, November 1998.
4. Stern, R. Passenger Transfer System Review. TCRP Synthesisof Transit Practice 19, 1996.
5. Multisystems, Inc., Mundle & Associates, Inc., and ParsonsTransportation Group, Inc. A Toolkit for Self-Service Barrier-Free Fare Collection. TCRP Report 80, September 2002.
6. Charles River Associates. Evaluation of the TransLink Demon-stration (Final Report), for Metropolitan Transportation Com-mission [Oakland, California], September 2002.
7. “Wave of the Future?” Card Technology, January 2002.8. Card Technology Magazine, November 2002, pp. 20–23.9. Integrated Transport Smartcard Organisation. The ITSO Specifi-
cation for Interoperable Public Transport Ticketing Using Con-tactless Smart Cards, Part 1: Overview and Business Model,November 2000.
10. Lobron Consultancy, Ltd., Develop a Recommended Standardfor Automated Fare Collection for Transit—Scoping Study FinalReport, November 2002.
11. USDOT/Volpe Center and Multisystems, Inc. National Guide-lines and Technical Specifications for Electronic PaymentSystems—Smart Card-Based Transit Fare Collection SystemRequirements (Overall Summary), August 2000.
12. Excerpted from USDOT/Volpe Center and Multisystems, Inc.Transit-Financial Collaboration Requirements Module—Summary, August 2000.
13. Card Technology, November 2002.14. “MasterCard Tests a Faster Way to Pay,” CardTechnology.
com. Accessed December 13, 2002. 15. Card Technology, October 2002.16. E-Squared Engineering. Introduction to Electronic Payment
Systems and Transportation, ITS America, April 2000.17. Boston Globe, December 9, 2002.18. Card Technology, September 2001.19. “Tollbooth Technology Meets the Checkout Lane,” NY Times,
July 7, 2002.20. Card Technology, September 2002.21. Card Technology, November 2001.22. U.S. Environmental Protection Agency web site, available online
at http://www.epa.gov/compliance/environmentaljustice/.Accessed May 29, 2003.
23. U.S. District Court for Central District of California (WesternDivision): Case No. CV 94-5936 TJH (Mcx), Labor/Commu-nity Strategy Center et al. (Plaintiffs) vs. Los Angeles CountyMTA and Joseph Drew, MTA Acting CEO (Defendants)—
Stipulation and Order re (Amended Proposed) Consent Decree(October 24, 1996).
24. Philadelphia v. Southeastern Pennsylvania TransportationAuthority, 1 Pennsylvania Commonwealth 101; 271 A.2d 504(1970).
25. Philadelphia v. Southeastern Pennsylvania TransportationAuthority, 441 Pa. 518, 272 A.2d 921 (1970).
26. 74 Pa. C.S. § 1741.27. Coalition for Better Transportation in the City v. Southeastern
Pennsylvania Transportation Authority, 6 Pa. D&C 3d 422(1977).
28. Consumer Education and Protective Assoc. v. SoutheasternPennsylvania Transportation Authority, 125 Pennsylvania Com-monwealth 125; 557 A.2d 1123 (1988).
29. 65 Pa. C.S. §§66.1–66.4.30. Committee for a Better North Philadelphia v. Southeastern
Pennsylvania Transportation Authority, 1990 WL121177 (E.D.Pa.) (1990), affirmed without opposition 935 F.2d 1280 (3rd Cir-cuit 1991).
31. Southeastern Pennsylvania Transportation Authority v. Asso-ciation of Community Organizations for Reform Now, 563A.2nd 565 (Pennsylvania Commonwealth 1989).
32. Court of Common Pleas of Philadelphia County in an unre-ported decision.
33. Association of Community Organizations for Reform Now v.Southeastern Pennsylvania Transportation Authority, No.1932 C.D. 2001 (Pennsylvania Commonwealth 2002).
34. New York Urban League v. Metropolitan TransportationAuthority, 905 F. Supp. 1266 (S.D. N.Y. 1995).
35. New York Urban League v. State of New York, 71 F. 3d 1031(2nd Circuit 1995).
36. Transportation Equity, a Newsletter of the Environmental Jus-tice Resource Center at Clark Atlanta University, vol. 2, no. 1(Summer 2000).
37. American Public Transportation Association. 2001 APTA Tran-sit Fare Summary. 2001.
38. “Unlimited Access,” Transportation. Vol. 28, (233–267) 2001.39. Brown, J., D.B. Hess, D. Shoup. “UCLA’s BruinGO Pilot Pro-
gram: An Evaluation,” UCLA Institute of Transportation Stud-ies, October 2001.
40. Conklin, J.M., R.D. Halvorsen, D.M. Fleishman, R.L. Oram,“Employer-Based Annual Transit Pass Programs: A Survey ofCurrent Practice in the Public Transit Industry.” Paper pre-sented at the 81st Annual TRB Meeting, January 13–17, 2002.
41. Multisystems, Inc. Community Transportation Plan—EssexCounty, prepared for NJDOT, NJDHS and NJT; October 1998.
42. Passenger Transport, July 23, 2001.43. Multisystems, Inc. and Howard/Stein-Hudson Associates.
Regional Transit Card Implementation Study, Final Report,prepared for South Western Regional Planning Agency, Novem-ber 2001.

PART II:CASE STUDIES
83
INTRODUCTION TO PART II
SELECTING THE CASE STUDIES
The study team conducted a set of case studies of agenciesthat have recently put in place, or are in the process of intro-ducing, various types of fare initiatives or programs. The goalin selecting case study sites was to choose agencies that repre-sent both a range of system sizes and modes and a range oftechnological and structural characteristics. A set of 20 candi-date sites was initially suggested; this list was then narrowedto a set of 13 recommended sites (as well as 4 backups, in casethe recommended agencies chose not to participate). The rec-ommendations were presented to the TCRP A-25 Panel atthe Interim Panel Meeting in April 2002, and this list wasapproved by those Panel members in attendance.
The research team next prepared a data collection plan andinterview form and contacted key staff at case-study agenciesto determine willingness to participate in the case study effortand, if so, to arrange for site visits. A letter was sent to eachagency, outlining the study and identifying the types of data/information needed.
CONDUCTING THE CASE STUDIES
The research team conducted a total of 13 case studies:
• Akron Metropolitan Regional Transit Authority (Akron,OH)
• Chapel Hill Transit (Chapel Hill, NC)• Chicago Transit Authority• Connecticut Transit • King County Metro Transit (Seattle, WA) • Maryland Mass Transit Administration (Baltimore, MD)• Metropolitan Transportation Commission (San Francisco
Bay Area)• New Jersey Transit• Orange County Transportation Authority (Orange Co.,
CA)• TransitCenter (New York City)• Tri-County Metropolitan Transportation District (Port-
land, OR)• Ventura County Transportation Commission (Ventura
Co., CA)• Washington Metropolitan Area Transit Authority
A broad range of specific fare initiatives and programsidentified in the study were represented by at least one case
study. With regard to distribution by size, the case study sys-tems included the following:
• 4 systems with more than 500,000 riders per weekday.• 4 systems with between 100,000 and 500,000 daily
riders.• 4 systems with under 100,000 daily riders.• 1 regional program covering a number of systems (Trans-
Link in the Bay Area).
This list represents what the team considered a reasonabledistribution of agencies by size, modes, and types of fare ini-tiatives and programs. The case study sites and initiatives aresummarized in Table II-1.
Each case study site was visited by at least one member ofthe research team. The first visit was made in May 2002, andthe others were completed between June and August. Basedon information compiled during the site visits, coupled withdata and information from written reports related to various ofthese fare initiatives, the research team prepared the attachedcase study working papers. Each paper includes the followingsections:
• Introduction and Background. Describes the agencyin terms of services/modes provided, numbers of vehi-cles, annual ridership; and introduces the fare initiativesto be reviewed.
• Development and Implementation of Fare Initia-tives. Discusses the process and issues involved in devel-oping and implementing each of the fare initiatives underconsideration.
• Results and Impacts of Fare Initiatives. Discusses theresults of each initiative in terms of customer impactsand benefits, ridership and revenue impacts, and agencyadministrative and operational issues and impacts.
• Conclusions and Lessons Learned. Summarizes thefindings in terms of the various evaluation criteria pre-sented in Appendix D (see Table D-2) and the key lessonslearned from the case study.
In conducting the case studies, the intent was to collect andpresent information pertaining to each of the evaluation cri-teria listed in Table D-2. However, detailed information wasnot available for all of these items in all cases. A number ofthe initiatives were still in the planning or implementationstages or were simply too new to be able to provide data on

impacts. Moreover, detailed operating cost data (e.g., fordesign and implementation costs, maintenance costs, revenuecollection and management costs) were not readily availablefor most of the fare initiatives studied. Because we were, inmost cases, focused on one or more of an agency’s specificfare initiatives and programs—rather than on the overall farecollection system—the agencies typically could not easilybreak out the cost details pertaining to those particular initia-tives. The limited scope and time frame of these case studiesdid not allow the researchers to track down information thatwas not readily provided by agency contacts.
84
The level of detail thus varies somewhat among the casestudies. Nevertheless, we feel that we have been able to com-pile and present information and analysis for each of thesefare initiatives that will prove useful to other agencies con-sidering these types of programs.
All of the agency contacts, as well as additional staff inter-viewed on site or via telephone, were gracious with their timeand very helpful in contributing to our understanding of theissues and impacts associated with these fare initiatives. Inseveral cases, we were also able to take advantage of previ-ous analyses undertaken by agency staff on certain initiatives.
TABLE II-1 Case study sites
Site/Agency
Focus of Case Study
Systems with > 500,000 riders/day
Chicago/CTA • AFC program (including stored value, rolling passes) • Smart card pilot (including guaranteed last ride feature) • U-PASS program
NY City/TransitCenter • TransitCheck and Premium TransitCheck New Jersey/NJ Transit • WorkPass program
• Development of fare increase Washington/WMATA • SmarTrip program (including First Union, GSA pilots)
• Plan for regional expansion of SmarTrip • SmartBenefits and MetroCheck employer-based programs
San Francisco Bay Area/MTC • TransLink regional smart card pilot Systems with 100,000 – 500,000 riders/day
Baltimore/MTA • Elimination of transfer/onboard sale of day pass • Elimination of zones • Plan to implement SmarTrip/regional integration
Orange County, CA/OCTA • Elimination of transfer/onboard sale of day pass • Implementation of validating fareboxes
Portland/Tri-Met
• “QuikTik” 6-hr. pass • PASSport annual employer pass program
Seattle/Kings County Metro • U-PASS program • FlexPass annual employer pass program
Systems with < 100,000 riders/day
Akron/METRO • Free student fare program • Access-to-jobs program (free rides on METRO)
Chapel Hill, NC/CH Transit • Elimination of fare on Chapel Hill Transit Connecticut/CT TRANSIT • AFC (including rolling passes, common farecard for all CT TRANSIT
systems) • Elimination of zones • University pass program
Ventura County, CA/VCTC • Smart Passport regional smart card demonstration • GoVentura regional smart card program • Joint transit-university (CSUCI) card program
85
CASE STUDY 1
AKRON METROPOLITAN REGIONAL TRANSIT AUTHORITY
INTRODUCTION
Akron Metropolitan Regional Transit Authority (METRORTA) is a small public transit bus system that serves all ofSummit County, Ohio, which encompasses the cities of Akron,Barberton, Cuyahoga Falls, and Stow. The transit agency hasan active fleet of 204 passenger vehicles that includes 136100 percent accessible full-size buses, 68 paratransit vehi-cles, and 4 trolleys. With an average weekday ridership of22,200, the transit agency provides 6 million passenger tripsannually. METRO RTA is funded by federal and state sup-port and a local dedicated .25 percent sales tax. FY 2001 oper-ating expenses were $27.1 million and operating revenueswere $26 million, including $3.5 million collected in passen-ger fares.
METRO RTA fixed route bus service consists of 43routes, including 32 fixed routes, 2 Neighborhood Circula-tor routes, 5 Town Center routes, and 2 express routes intoCleveland. METRO RTA SCAT provides Americans with Dis-abilities Act (ADA) complementary paratransit and demand-responsive transportation for older adults and people with dis-abilities. The passenger fare structure, summarized in TableCS1-1, includes cash, monthly passes, and a variety of multi-ride tickets.
This case study reviews two specific fare initiatives under-taken by METRO RTA:
• The University of Akron ID Pass Program• The Ohio Works First Photo ID Pass Program
DEVELOPMENT AND IMPLEMENTATION OF FARE INITIATIVES
University of Akron Pass Program
METRO RTA serves the University of Akron with unlim-ited access via an ID Card/pass to regular route and Cam-
pus Shuttle Loop service. The loop service consists of fourMETRO RTA-operated vehicles traveling along six presetloops around the campus. The loop service transports morethan 1,500 students during the school year. The Campus Shut-tle Loop Service is not available during the summer.
The regular route service is also available free of charge touniversity students, faculty, and staff with a valid Universityof Akron identification card. The service is available Sundaythrough Saturday during METRO RTA regular hours of oper-ation. The service is not available on holidays, during semes-ter breaks or other times when the University is closed.
The goals of the University Pass Program are to:
• Increase access to and from the university• Reduce on campus parking requirements• Increase transit ridership
Traffic congestion mitigation in and around the Universityof Akron campus, adequate parking, and convenient accessto the campus were concerns of the University as early as themid-1990s. It became evident that public transportation ser-vices were needed to alleviate these concerns. The Universityapplied for federal funding assistance through the Conges-tion Mitigation/Air Quality (CMAQ) Improvement Program,initially authorized under the 1991 Intermodal Surface Trans-portation Efficiency Act (ISTEA). The request was funded,establishing a cooperative agreement among the Universityof Akron, the Ohio Department of Transportation, METRORTA, and U.S. DOT. CMAQ funding covered the majorcosts of the transportation program, and the University fundedthe remaining amount through student, faculty, and staff park-ing fees and general budget funds.
In 1995, the University entered into a contract with METRORTA to provide Campus Shuttle Loop Service and regularroute transportation to and from the campus at no cost to Uni-versity students, faculty, and staff. By showing a valid Uni-versity identification card as a “pass,” students, faculty, andstaff would have unlimited access to transportation to, from,and around the University without paying any additional fare.
Each year the University and METRO RTA negotiate afixed contract amount based on student enrollment for theyear. METRO RTA provides unlimited trips to individualsdisplaying the University identification card when school isin session. The driver codes University boardings using the
Fare Program/Initiatives
University pass programAccess-to-jobs pass program

#7 on the farebox keypad. When school is not in session, rid-ers pay $1 per trip, but during these periods ridership is at aminimum.
In 1997, the CMAQ funding period ended. The Universityeliminated the free regular route service (Pass Program) andcontinued the Loop Service with reduced funding (FigureCS1-1). However, campus building expansion subsequentlyprovided the impetus for the restoration of the Pass programand increased Loop service in 2000. New construction requiredthe relocation of parking lots and street closures, which sig-nificantly affected automobile use. In 2000, the Universityincreased funding for the Loop service by 43 percent (nearly$99,000) and provided $50,000 for the Pass Program. Fund-ing for the University Pass and Loop services is currentlymaintained at $350,000 annually.
Ohio Works First Pass Program
Utilizing a similar Identification Card/Pass model, METRORTA has partnered with the Summit County Department of
86
Job and Family Services (DJFS) to provide employment-related transportation for Ohio Works First (OWF) clients. Inthis program, DJFS contracts with METRO RTA for freeclient transportation through the use of a photo ID card as abus pass. The program is intended to meet the transportationof needs of Summit County residents on public assistancewho are transitioning into employment.
Prior to the OWF Pass program, the DJFS had purchasedand distributed METRO RTA tickets to clients. Upon pre-sentation of a nonphoto ID card, METRO RTA accepted thetickets as fare payment. Alleged abuse of the program wasreported in numerous cases where individuals other than theOWF clients would use the ID cards. To ameliorate the situa-tion, the program was revised. Currently, DJFS provides aphoto ID card to eligible clients. However, plans are in processto transfer the production and distribution of the ID cards toMETRO RTA. Through a supplemental contract of $36,000(separate from the fare revenues budget), METRO RTA willpurchase the necessary equipment to produce and distributethe OWF photo ID cards.
The OWF Pass program was intended to provide employ-ment and employment training transportation only. However,in practice, eligible OWF clients have unlimited access to freetransportation without trip-purpose restrictions. Discussionswere held between DJFS and METRO RTA about allowinga specific number of work or education trips. METRO RTArecognized that attempting to identify and regulate trip pur-pose would be a formidable task. The County acknowledgedthat many trips may actually be employment-related but notdirectly identifiable as such. For example, a working parentmight need to drop off children at daycare facilities or needto stop on the way home for food or medical supplies. It wasdecided that limiting the number of trips or trying to identify
TABLE CS1-1 METRO RTA fares
General Fare $1.00 each way Older adults & persons with disabilities (proof of $0.50 each way age, SCAT, D&S ID or Medicare Card) SCAT Fare (Older adults & persons with disabilities)
$1.15 each way
General Monthly Pass $32.00 per month Older Adult/Disability Pass $20.00 per month Full-Service Ticket $20.00 10-Ride Ticket $8.50 Employee Pass Program $29.00 per month North Coast Express Fare (Cleveland) $3.00 each way North Coast 10 Ride Ticket (Cleveland) $25.00
$0
$50,000
$100,000
$150,000
$200,000
$250,000
$300,000
$350,000
$400,000
$450,000
96 97 98 99 00 01Fiscal Years
Fu
nd
ing
Lev
el
Univ Pass Prog
Loop Routes
Figure CS1-1. Transit funding levels.

trip purpose would artificially encumber the passenger andprove counterproductive to the overall OWF program.
Ultimately the ID cards are intended to have a magneticstripe that can be read at the farebox, allowing uses to be ver-ified and tracked. The OWF pass program is very new anddata is not yet available to establish comparisons with the for-mer methods of fare collection and verification of eligibility.
RESULTS AND IMPACTS OF FARE INITIATIVES
University Pass Program
In the two years of the CMAQ-funded program,METRO RTA provided approximately 300,000–400,000total trips annually. In 1997, when the CMAQ fundingended, ridership suffered a major decline due to elimina-tion of the free fare initiative. As shown in Figure CS1-2,ridership recovered somewhat the following year. The sub-sequent restoration of the Pass Program and enhancement ofthe Loop service (2000) then resulted in a substantial rider-ship increase in 2001, although ridership did not reach theprevious levels.
Another factor that influenced ridership was that the Uni-versity changed traffic patterns on campus. Valuable landspace previously in use as parking lots is now used for class-room and administrative purposes. The area for parking spaceshas been consolidated and placed farther from the campuscore. This construction and turnover in land use have cre-ated greater distances for automobile users to travel betweentheir cars and their campus destinations. Corresponding tran-
87
sit use increases have been observed, though not analyzedas yet.
The University Pass program eliminates the need forMETRO RTA to handle cash, which reduces the burden ofcarrying, sorting, counting, reconciling and depositing approx-imately $180,000 per annum. However, the Pass Programalso reduces METRO RTA’s revenue, because the contractamount is not directly tied to ridership levels; the amountvaries from year to year. Prior to 1995, METRO RTA’s rev-enue from the program was $3,000 to $4,000 per month; dur-ing the CMAQ funding period, revenue rose to $20,000 to$25,000 per month and since that time, it has dropped backto $8,000 to $9,000 per month.
In 2001, on bus routes other than the Campus Loop, theaverage fare per ride was $0.55. There is very little additionalcost involved in providing the University trips since theyoccur on established public routes. The Loop routes thatserve the campus are dedicated and the University pays thecosts of operating those routes. Six Loop routes were pro-vided in 2001 for a total cost of $300,000.
Ohio Works First Pass Program
As per the annual fixed dollar amount contract with theSummit County Department of Job and Family Services,METRO RTA is paid $200,000 a year for the provision of50,000 trips a month for individuals on public assistance. Asindicated earlier, METRO RTA will also receive $36,000 tobuy equipment to allow it to produce and distribute the OWFphoto ID cards. The contract specifies that costs will be recov-ered at a billable rate of $1,000 per month for 36 months.
299,340
263,439
30,905
98,499
67,687
91,438
150,801
0
50,000
100,000
150,000
200,000
250,000
300,000
350,000
95 96 97 98 99 00 01
Fiscal Years
An
nu
al T
rip
s
Figure CS1-2. University ridership.

CONCLUSIONS AND LESSONS LEARNED
Customer Impacts and Benefits
The University Pass initiative appears to have benefitedthe University students, faculty, and staff as follows:
• The Pass service is convenient and easy-to-use, and nothaving to pay an onboard fare has improved the ease oftravel. Additional registration is not required, since allstudents and university personnel must obtain a multi-purpose photo ID card.
• Users with valid ID cards do not have to be concernedabout transportation costs or cash on hand to ride thesystem.
• The Pass service increases access to and from the campus.
In general, riders appear satisfied with the program. How-ever, ridership data suggests that the existing University ridersmay not use the service at the same levels if they had to pay.
The key customer impacts and benefits of the Ohio WorksFirst Pass Program include the following:
• The pass program facilitates employment and generallyincreases the mobility of OWF clients who are workingor in training.
• The program is easy to use and eliminates the need for cash as well as client concerns about the cost ofemployment-related transportation. The previous DJFS-managed distribution of trip tickets was more time con-suming for both the customer and the agency.
Program clients are generally satisfied and are using theprogram on a regular basis. Moreover, the program appearsto have improved the public’s opinion of the transit agencyin general.
Agency Impacts and Benefits
The impacts and benefits of the University Pass initiativefor METRO RTA include the following:
• The program has no equipment costs, the university pro-duces the identification cards and fare collection equip-ment is not needed.
• Revenue management has been reduced. The contract isan annual fixed dollar contract that requires no recon-ciliation of funds or ride counts.
• The program has reduced the use of cash for fare pay-ment during the school year.
• When the CMAQ funds expired, ridership decreasedbecause riders had to pay for the service, and service lev-els were accordingly decreased. With the restoration ofthe Pass program, ridership demonstrated a 60 percent
88
increase in 2001, although it has yet to reach the levelsof the CMAQ-funded years.
• There are no reported incidences of program abuse orinappropriate use of University ID cards.
• Eliminating the need to pay fares decreases boarding timesomewhat, but the driver has to view an ID card. Therehas been no perceived impact on service reliability.
The impacts and benefits of the OWF Pass initiative forMETRO RTA include the following:
• The program will incur equipment costs to produce thephoto ID cards, but DJFS is covering these costs undera supplemental contract.
• Revenue management has been reduced. The contract isan annual fixed dollar amount and requires no reconcil-iation of funds. Currently METRO RTA is paid $200,000a year for the provision of 50,000 trips a month to OWFclients.
• Ridership has increased; it currently averages 50,000trips per month. For the most part, these are new regu-lar riders to the system.
Impact and Benefits for Partner Entities
The University Pass initiative has had the following impactson the University of Akron:
• Free transportation to, from, and around the campus isseen as a definite benefit the University provides to uni-versity students and personnel.
• The university has not reported a decrease in parkingdemand, but the free Pass service has not been heavilymarketed.
The OWF Pass initiative has had the following impacts onthe DJFS:
• The goals of the program have been achieved; OWFclients are receiving a free means of getting to work.
• Increased numbers of clients are obtaining ID cards, andthe process will be further streamlined when METRORTA initiates the production and distribution of the cards.
• Requiring a photo ID has helped to eliminate the fraudand abuse that was evident when DJFS administered theprogram. Drivers inspect the photo ID cards and areinstructed to seize cards that are obviously fraudulent.
Liability to Agency
Potential liability issues can be summarized as follows:
• The transit agency does not risk losing significant rev-enue through the University Pass program. If the free

rides were not provided, most of the riders would eitherwalk, bike, or drive instead of paying the daily fares.
• The student ridership and contract revenues generateabout $0.55 per ride, as opposed to the $1.00 publicfare. However, the $0.55 is created at much less expensethan the baseline cost of service provided to the generalpublic.
• Funding is currently derived from student, faculty, andstaff parking fees and University general funds. It ispossible that complaints could arise at some point fromnontransit users about the University use of parking feesto pay for transit service.
• In the OWF Pass program, METRO RTA does not risklosing revenue because the agency can adjust the OWFcontract to match ridership.
• The agency does not see any potential legal/politicalchallenges to the OWF Pass program.
Constraints and Barriers
Issues related to constraints and barriers include the fol-lowing:
• The University ID cards need to be manually viewedbecause the existing fareboxes cannot read the magneticstripes on the cards.
• Timely payments on the OWF contract have been raisedas an issue.
• Funding for the OWF program has not been an issuethus far; it comes from Temporary Assistance for NeedyFamilies (TANF) block grant funds, Title XX, and DJFS.
• Due to the nature and location of some of the jobs, notall employment-related transportation needs can beserved by public transportation.
Required Equipment and Technology
Because these are free fare programs involving photo IDs,there are no particular equipment or technology requirements.However, future plans include converting to some type of“smart card” to monitor and track usage. For the OWF pro-gram, METRO RTA will be purchasing photo ID card pro-duction equipment; these costs will be covered by DJFS.
Lessons Learned
Key lessons learned through the development and imple-mentation of the University Pass program include the fol-lowing:
89
• A free fare program can enhance transportation optionsfor university students, faculty, and staff and offers thepotential to reduce parking space requirements.
• It is important that the transit agency negotiate the con-tract with the University on an annual basis, based onstudent enrollment and potential usage, to prevent lossof revenue through the program.
Key lessons learned through the development and imple-mentation of the OWF Pass Program include the following:
• Welfare reform has facilitated cooperative relationshipswith public transit agencies that can prove beneficial tothe clients, the transit agency, and social service agencies.Results include increased ridership, increased revenueand increased numbers of individuals who are employed.METRO RTA has already demonstrated a major impactin terms of meeting the transportation needs of OWFclients in Summit County.
• To ensure that the transportation benefits reach the indi-viduals who really need them, controls must be in placeto monitor and identify fraud.
CASE STUDY CONTACTS
Information presented in this case study was collected fromtransit agency staff interviews. The following individuals wereinterviewed at the METRO RTA offices:
Robert Pfaff, General ManagerMETRO Regional Transit Authority416 Kenmore BoulevardAkron, Ohio 44301-1099330-762-7267
Dean Harris, Director of FinanceMETRO Regional Transit Authority416 Kenmore BoulevardAkron, Ohio 44301-1099330-762-7267
Alan Smith, Manager of SCATMETRO Regional Transit Authority416 Kenmore BoulevardAkron, Ohio 44301-1099330-762-7267

90
CASE STUDY 2
CHAPEL HILL TRANSIT
INTRODUCTION
Chapel Hill Transit operates public transportation serviceswithin the towns of Chapel Hill and Carrboro, NC, and on thecampus of the University of North Carolina-Chapel Hill.Chapel Hill Transit is a municipal department within the Townof Chapel Hill and was established in 1974. The Town of Carr-boro and the University of North Carolina are partners with theTown of Chapel Hill in the operation of the transit system.
Chapel Hill Transit provides fixed route and demand-responsive service within a roughly 25 square mile servicearea, located in the southeast corner of Orange County, NorthCarolina. The system produces over 100,000 annual hours ofservice, has a $7 million annual budget, and carries over 3 mil-lion passengers per year. The total ridership per month, includ-ing fixed route and demand-responsive service, for the FiscalYear ending June 30, 2000, was approximately 300,000.
Chapel Hill Transit currently has a fleet of 57 buses, 43 ofwhich are lift-equipped, as well as 7 lift-equipped vans and 2trolley buses. The transit agency operates 15 routes that pro-vide coverage throughout most of the community. There are11 arterial bus routes, 2 campus shuttle routes, and 2 Park/Ride routes. Night service includes 4 routes. On Saturdays,
5 routes are operating, and 2 routes operate on Sundays.There is also an interface with Triangle Transit that providessome additional shuttle and commuter services.
Shared Ride services are used on evenings and Sundayswhen there is not enough demand to warrant a fixed route.That service is operated from bus stop to bus stop anywherein the service area that normally has Sunday or evening ser-vice. Bus stop-to-door and door-to-door service is availablefor an additional surcharge.
Weekday Shared Ride Feeder is available for areas that donot receive regular bus service. Transportation is providedbetween the service zone and designated transfer points, whereconnections can be made with fixed route bus service. Tripscan also be taken within the Feeder zone. Transfers to thebuses are issued free of charge. Chapel Hill Transit also oper-ates EZ Rider service, which provides demand-responsiveservice for the area’s senior citizens and persons with dis-abilities. EZ Rider is available to Chapel Hill and Carrbororesidents who cannot use the regular fixed route service.
Effective January 2, 2002, all regular routes became farefree; fares are still charged for use of the Tarheel Express ser-vice to campus sporting and entertainment events. This casestudy reviews the process of establishing this Free Fare pro-gram and discusses the results to-date.
DEVELOPMENT AND IMPLEMENTATION OF FARE INITIATIVE
Transit in Chapel Hill began with a student government-operated shuttle service. As the student population grew and theUniversity expanded, it became evident that service demandsfar exceeded the capability of the shuttle. In the early 1970sa Public Transportation Study Committee was formed to applya federal Technical Studies grant to examine the feasibilityof a permanent community system. Town voters approved a$350,000 bond referendum for local match for capital fund-ing and an ad valorem tax to support transit operations. ChapelHill Transit began operation in August 1974 as a departmentof the town government. As a town agency, the department isresponsible to the Council, the Mayor, and the Town Manager.
The three partners in funding public transit in and aroundChapel Hill are the towns of Chapel Hill and Carrboro andthe University of North Carolina-Chapel Hill. Continuingincreases in University enrollment and the size of the physi-
Fare Program/Initiative
Elimination of transit fares

91
cal plant, coupled with the relatively small amount of landavailable in the town—as well as the desire to minimize airpollution and traffic congestion—were the driving factors inthe creation of Chapel Hill Transit and continue to guidetransit development. Transit’s goal is to provide service to atleast 90 percent of the town’s residents within a quarter mileof a bus route. A Comprehensive Plan adopted by the TownCouncil in 1977 included a set of transportation goals thatspecifically encouraged transit over automobile use in cen-tral areas of Chapel Hill.
As the system grew, so did expenses. The means to fundthe system—and particularly the amount each of the partnershad to pay—thus became an increasingly contentious issue.The partners therefore developed a Memorandum of Under-standing that detailed the benefits to each partner and the costassociated with providing those benefits.
In 1996, discussions were initiated to radically alter themethod of computation used in the partnership. Once all thefederal and state contributions were deducted from the sys-tem’s operating costs, the partners would split the remainingcosts based on their relative populations. The Universitywould pay based on its student and employee head count.The towns of Chapel Hill and Carrboro would use censusdata to determine their shares. This simplified process alsoprovided that any of the partners could request new routes,although that entity would be responsible for paying theentire cost of operating that route during the first year.
Sources of revenue for the system are shown in FigureCS2-1. Using a cost allocation formula, expenses on someroutes were to be paid fully by the University, while otherroutes were paid for entirely by the towns. Costs of shared rideservice would be borne by only two of the partners, as long asthe third partner received only limited service. Revenues weretracked accordingly and credited against the correspondingoperating costs. The number of riders using University-issuedpasses also needed to be factored into the equation. Federaland state operating assistance was to be allocated in the pro-portions each partner contributed to the actual local cost. Thepartners also paid capital costs in the same allocation manner,based on the value of equipment and anticipated service life.
Beginning in 2000, the University and hospital facilitieswere increased in size and the amount of space for student,staff, and visitor parking was reduced accordingly. The expan-sion and construction program was also causing parking lotsto be moved, placing the remaining available parking furtheraway from the center of campus. The University thus soughtincreased use of transit service, leading to preliminary dis-cussions regarding conversion to a free fare system; the ideawas that no fares would be charged for bus rides anywhere inthe system. In support of the proposal, University studentsmobilized to pass a referendum that created a $16 per semes-ter fee that would generate $500,000 per year.
Thus, with the primary goal of addressing on-campus park-ing shortages, the University (and its students) became thechampion of the program to create the free fare policy. How-ever, it was widely recognized that the free fare transit ser-vice would benefit all of the region’s residents, not only thoseaffiliated with the University. Although Chapel Hill has oneof the highest per capita income figures in the state, a num-ber of the area’s residents live at or near the poverty rangeand are heavily transit dependent. Fares prior to the imple-mentation of the free fare initiative were only $0.75, withvarious discounted fare mechanisms. However, the townsrecognized that accessibility to free public transportationwould permit easy access to jobs and educational and recre-ational ventures to students and the public alike. Thus, thethree funding partners agreed to make all regular routes farefree as of January 2, 2002.
The goals of the free fare initiative are to:
• Increase access to and around the University and decreaseparking demand
• Increase the region’s access to public transportation
RESULTS AND LESSONS LEARNED
Customer Impacts and Benefits
The customer impacts and benefits of Chapel Hill Tran-sit’s free fare initiative to date can be summarized as follows:
• Not having to pay a fare—or even present an identifica-tion card—has improved the ease of travel.
• The free fare has eliminated the cost of travel, therebyincreasing transportation access, enhancing mobility, andincreasing the convenience of travel.
• Overall satisfaction among riders is high. The overallpublic perception of Chapel Hill Transit has improvedas a result of the program. There have been very fewcomplaints thus far.
Agency Impacts and Benefits
The impacts and benefits for the agency of the free fare ini-tiative are as follows:
4%
25%
39%
8%
22%
2%Operating
Federal/State
UNC
Carrboro
TOCH
Other
Approximate distribution of total budget.
Figure CS2-1. Sources of revenue.

92
• System ridership has increased considerably since theelimination of fares, As indicated in Figure CS2-2,monthly ridership for 2002 has been as much as 50 per-cent or more higher than for the same month the previ-ous year, reaching a high of roughly 400,000 rides inApril 2002; in April 2001 (and 2000), the ridership hadbeen about 260,000.
• The free fare policy has resulted in improved bus fre-quency, as headways were cut in half on some routes toaccommodate the higher demand.
• Service was increased on some routes that were alreadyat carrying capacity.
• A possible decrease in overall schedule adherence hasbeen reported, due to greater numbers of boardings andalightings in general—and at a greater number of stops.Some routes required adjustments to accommodate thegreater demand. Some drivers have reported riders rid-ing for as little as two stops and exiting the buses. With-out the disincentive of paying a fare for a short trip orfor several linked trips in succession, people are usingthe system more spontaneously and for shorter trips.
• Both capital and operating costs have increased due tothe need for additional vehicles and drivers, as well asthe concomitant increase in maintenance, fuel, etc.
• The elimination of fare media such as passes has alloweda reallocation of some administrative resources towardservice provision. For example, with free fares, passen-gers are no longer reporting missing or lost passes thatrequire administrative time and expense to replace.
• The number of worker’s compensation claims has beenreduced, since there are no heavy moneybags to lift.
• No additional fare equipment is necessary; althoughautomatic passenger counting is now needed. Manual
buttons are currently used on all existing fareboxes tocount passengers.
Impact and Benefits for Partner Entities
The primary benefit to the partner entities has been theincreased access within the area, including to and from theUniversity of North Carolina, and the easing of demand forparking at the University.
Liability to Agency
The primary liability to the agency is the increase in costs—with no fare revenue to cover these costs—to serve the muchhigher demand that has resulted from the free fare program.In the case of Chapel Hill Transit, however, University park-ing, student, and other relevant fees are available to subsidizethe service. In addition, the towns of Chapel Hill and Carr-boro contribute through a transportation tax.
Constraints and Barriers
The establishment of Chapel Hill’s free fare initiative hasrequired development of agreements among three fund-ing partners, the University of North Carolina, the Town ofChapel Hill, and the Town of Carrboro. Funding the programrequired that the three partners all significantly increase theircontributions.
0
50000
100000
150000
200000
250000
300000
350000
400000
450000
Jan Feb Mar Apr May Jun Jul Aug Sep Oct Nov Dec
Month
Mo
nth
ly T
rip
s
2000
2001
2002
Figure CS2-2. Monthly ridership, 2000 to 2002. Free fare program initiated January 2002.
Required Equipment and Technology
There are no particular technology requirements associ-ated with a free fare program. However, the program has hadthe following equipment impacts in Chapel Hill:
• New vehicles were necessary: 13 new buses have beenpurchased, while 7 more are scheduled for purchasenext year.
• New buses have been ordered with fareboxes, in theevent that the policy is changed during the 12-year ser-vice life of the vehicles.
• No new technology is needed for fare collection. How-ever, automatic passenger counting is an indirect need.In the meantime, manual counting is being utilized.
Lessons Learned
• The Chapel Hill free fare initiative demonstrates thepotential of intergovernmental cooperation to develop aninnovative approach to addressing a specific mobility
93
issue—in this case a campus parking shortage—as wellas increasing mobility in general within a community.
• Free fare transit can produce a large increase in rider-ship due to the reduction in the cost of travel and theincreased convenience, but it can also lead to a substan-tial increase in capital and operating costs to serve thegreater demand. Funding mechanisms must be availableto cover these additional costs.
CASE STUDY CONTACT
Information presented in this case study was collectedfrom Chapel Hill Transit. The following individual was inter-viewed at the Chapel Hill Transit office:
Mary Lou Kuschatka, General ManagerChapel Hill Transit306 North Columbia StreetChapel Hill, North Carolina 27516919-968-2755

94
CASE STUDY 3
CHICAGO TRANSIT AUTHORITY
INTRODUCTION
The Chicago Transit Authority operates bus and rail rapidtransit service in the City of Chicago and 38 surroundingsuburbs. Because there are separate suburban bus and com-muter rail operators in the Chicago region as well as CTA,some elements of the CTA fare structure are somewhatcomplex. Table CS3-1 summarizes the current fare structureat the CTA.
CTA has approximately 1,900 buses (1,620 in peak ser-vice) that operate over 140 routes and 1,937 route miles,serving 12,000 posted bus stops. Buses carry roughly 1 mil-lion passenger trips a day. CTA’s approximately 1,200 rapidtransit cars operate over seven routes and 222 miles oftrack and serve 144 stations. On an average weekday, 1.47million rides are taken on the CTA’s system. Total systemridership (unlinked trips) in 2001 was approximately 455million.
CTA has raised cash fares and experimented with differ-ent types of passes and reduced fare tickets starting in 1992.
This case study addresses pass, fare-card, and smart card initiatives thatwere introduced beginning in 1997,when CTA implemented automatedfare collection (AFC). The initia-tives reviewed here are as follows:
• Introduction of stored value farecards, featuring a 10 per-cent purchase bonus
• Replacement of the monthly flash pass with a 30-dayrolling pass (i.e., activated on first use) and implement-ing 1-, 2-, 3-, 5-, and 7-day rolling passes
• Introduction of a smart card pilot program• Introduction of a university pass (“U-PASS”) program
DEVELOPMENT AND IMPLEMENTATION OF FARE INITIATIVES
Introduction of Automated Fare Collection System
In 1995, CTA began the 27-month implementation of anAutomated Fare Collection system on both its bus and railnetworks. The total cost of implementing the AFC systemwas approximately $106 million. For the CTA’s 141 railrapid transit stations, the project included installation of auto-mated vending machines (AVMs) and automated turnstileequipment. Installation on buses involved integrating newfarecard readers with the existing fareboxes. The introduc-tion of AFC at CTA was not accompanied by a major farerestructuring. Rather, the stored value farecard merely repre-sented a new fare medium, which was essentially an alterna-tive to tokens.
When the farecard was introduced in 1997, it was initiallyavailable only for use on the rail system. It was later extendedto the bus system as well. Within 3 months of full imple-mentation, one third of all boardings were made with fare-cards. Some of the factors contributing to the rapid accep-tance of the farecards were:
• Concurrent elimination of discounts on token multipacks • Extensive availability of AVMs• Reduced availability of turnstiles for coins and tokens,
resulting in longer queues at those turnstiles• Implementation of the same technology at the subur-
ban bus operator (Pace), enabling“seamless” transfers between thetwo systems
• Introduction of the card only afterthe system was fully installed
• Prior CTA rider experience withprepayment (i.e., passes and dis-counted token multipacks)
Fare Program/Initiatives
Automated Fare Collectionsystem: stored value farecard, rolling passes
University pass program
Smart card pilot program

Fare Media Cost to Riders
Implementation Date Notes/Characteristics
Cash Fares
Full Fare $1.50 1991 Off-peak bus fares were somewhat lower until 1995, when the off-peak bus fare was raised to the peak fare.
Reduced Fare $0.75 1995 Reduced base fares are available based on rider disability and/or age. Transfer $0.30 1991
Reduced fare transfer $0.15 1995
Transfer allows rider to make another 2 trips within 2 hours. Prior to 1997, transfers were offered on paper slips with hand punched expiration times. With the implementation of AFC, magnetic stripe paper transfer cards were introduced.
Stored Value Farecards
Basic farecard $1.50 min. 1997 Riders can either purchase new cards or add value to existing cards at vending machines located in CTA rail stations. A bonus of $1 is awarded for each $10 of value purchased.
10-trip package (regular) $15.00 Package of 10 one-way transit cards. 20-trip package (reduced) $13.50
Package of 20 one-way reduced fare transit cards.
Prevalued farecards $10.00/ $20.00
1999 Prevalued farecards are sold at currency exchanges, select grocery stores, and over the Internet. There is a 10 percent di scount built into these cards ($10 card worth $11, $20 card worth $22). Prior to 1999, the cost of these farecards was $13.50 and $16.50.
Passes
1-day "Fun Pass" $5.00
2-day Visitor Pass $9.00
3-day Visitor Pass $12.00
5-day Visitor Pass $18.00
7-day rolling pass $20.00
1999
1-, 2-, 3-, 5-, and 7-day passes allow for unlimited rides on all CTA buses and trains for the time period specified (days must all be consecutive). The pass is activated the first time it is inserted into a bus farecard reader or a rail turnstile. Passes are sold at numerous city outlets, or can be ordered in advance via phone or Internet.
30-day rolling pass $75.00 1999 Allows riders to make unlimited rides over any 30-day period beginning with the first use. Prior to implementation of rolling pass, a regular 1-month pass was available.
30-day reduced fare rolling pass $35.00 1999
Allows reduced fare riders to take unlimited rides over any 30-day period beginning with first use.
U-PASS $0.55/ student/day 1999
Sold to full-time students by participating universities and colleges. The U-PASS is valid for one term and students can make unlimited trips on CTA at all times. Students pay for the pass as part of their regular tuition and fees assessed by the participating institution.
TABLE CS3-1 Current CTA fare structure

96
The new AFC system was provided by Cubic and is verysimilar to the Cubic MetroCard system implemented in NewYork City. The CTA Transit Card was introduced with apurchase bonus, offering $15 of stored value for $13.50 (11percent bonus); the purchase and bonus parameters werelater changed (late 1998) in order to increase rider conve-nience. At that time, the minimum purchase necessary toobtain a bonus was reduced from $13.50 to $10 and the bonuswas lowered to $1 (10 percent). The new price reflected theneed to pay with a $10 or $20 bill at AVMs.
At the same time that the purchase and bonus parameterswere changed, CTA also implemented a number of other fareinitiatives, as follows:
• Monthly passes were converted to 30-day rolling (acti-vate on first use) passes and reduced in price from $88to $75. Monthly reduced fare passes were also con-verted to 30-day passes, and the price reduced from $44to $35.
• 7-day rolling passes were introduced at a price of $20.Additionally, 1-, 2-, 3-, and 5-day rolling passes wereintroduced; these were targeted primarily at the tourist/visitor market.
• CTA replaced the prepaid $13.50 and $16.50 farecardswith $10 and $20 prepaid farecards. A 10 percent bonuswas incorporated into these farecards (i.e., they are worth$11 and $22, respectively).
• The minimum vend requirement for a farecard wasreduced from $3.00 to $1.50, which was consistent withthe cost of a single ride on bus or rail.
• Metal tokens were replaced with single-ride TransitCards. Packs of 10 regular farecards were available for$15, and packs of 20 reduced farecards were availablefor $13.50. Sales of tokens ceased completely in January1999, and acceptance of tokens ceased in April 1999.
Installation of AFC facilitated the implementation of thesefare options and has allowed CTA to track more carefully theridership and revenue impacts of the various fare initiatives.
Introduction of the U-PASS Program
CTA introduced its U-PASS program in 1998, about ayear after AFC implementation. In three years, 22 colleges/universities had joined the program, which requires them toenter into a contractual agreement with CTA to provide theU-PASS to all full-time students. Any accredited, postsec-ondary, degree-granting institution in CTA’s service area iseligible to participate in the program. The pass enables thestudents to make unlimited trips on all CTA buses and trainsduring the academic year. Students pay for the pass as part ofthe regular tuition and fees assessed by the participating insti-tutions. The institutions are charged for the U-PASS basedon a daily per student charge that was initially set at 50 cents
but raised to 55 cents in 2001. Note that the equivalent dailycost of a 30-day CTA unlimited ride pass is $2.50, or nearlyfive times the U-PASS cost.
Each U-PASS contains the name of the student and a photoidentification, the name and logo of the school, dates of valid-ity matching the academic year, and a magnetic stripe encodedwith a unique identification number that can be read elec-tronically by the AFC equipment.
CTA’s overall goals of the U-PASS program are to:
• Stimulate an increase in ridership during off-peak hours.• Create a sense of brand loyalty and transit travel pat-
terns among students who will be prospective customersin their postcollege years.
• Measure and assess ridership changes, mode choice, andtravel behavior among college students to evaluate pro-gram effectiveness.
In addition, CTA had a number of specific goals for theU-PASS program, including the following:
• Creating greater visibility and acceptance for U-PASSamong colleges.
• Building experience with U-PASS and assisting the par-ticipating schools with implementation and adminis-tration.
• Establishing a basis for deeply discounted passes to beoffered to college students.
• Identifying the savings that accrue to students and col-leges with the program.
Smart Card Pilot Program
CTA’s smart card pilot program began in August 2000 andoperated for 6 months. The program was designed to testboth the technological feasibility and the customer accep-tance of a contactless smart card for fare payment. CTA hadplanned in advance for eventual use of smart cards. When themagnetic AFC system was installed, all fare equipment wasalso equipped with card readers and touchpads that couldlater be used with Cubic’s proprietary contactless smart cards.(These cards are technologically the same as the SmarTrip®
cards now in use on WMATA’s rail system.) The pilot program was developed with the following fea-
tures:
• A $5 purchase price with a $0 starting balance; valuecould be added to the smart card at CTA AVMs.
• Customers who enrolled in the smart card pilot programagreed to have their contact information entered into adatabase; this information would be accessed if a lost orstolen card was returned to CTA.
• Each participant had a user-defined PIN, which wasused if a replacement card was needed. Replacement

cards could be purchased for $5, and the PIN wouldallow for transfer of the remaining balance on the lostor stolen card.
• The smart card was programmed to operate like a nor-mal farecard, including the same bonus features.
• Multiple riders could use a single card. However, onbuses, drivers were required to push a special key on thefarebox to let more than one person use the smart card.This step was added to prevent a smart card holderstanding close to the farebox from being accidentallycharged for multiple trips.
• Smart cards provided for a “negative balance” or guar-anteed last ride: a ride was guaranteed, regardless of theremaining value on the card; the card could carry a neg-ative balance up to the value of a single ride, and the nexttime value was added to the card, the amount of the neg-ative balance would be deducted from the value added.
During the pilot program, CTA distributed 3,500 smartcards at 16 sites, including selected high-volume rail stationsand over the Internet. The cards were valid for a 5-year period.Surveys were carried out by mail and Internet after 3 monthshad passed. A 37 percent response rate was achieved, provid-ing a rich data set on customer satisfaction. It should be notedthat the participants, although geographically diverse, were aself-selected group of frequent riders who had been usingfarecards and thus do not constitute a random group of riderswhose opinions can be extrapolated to the total rider popula-tion. The results of this survey are discussed in the Results andImpacts section.
Based on the results of the pilot program, CTA decided tomove forward with a broad rollout of the “Chicago Card” pro-gram. CTA planned to make an initial purchase of 300,000smart cards for approximately $1.8 million ($6 per card).The smart cards were issued with the same features as in thepilot program. CTA originally sought to contract with a pri-vate company to launch and manage the smart card distri-bution and customer support process and issued an RFP fora system support vendor; the vendor was expected to takeresponsibility for such functions as marketing, project imple-mentation, and operations management—including orderprocessing/fulfillment, customer service, and reporting. (Theselection of a system support vendor had not been made asof the end of 2002, as the CTA was reconsidering the sup-port strategy.)
RESULTS AND IMPACTS OF FARE INITIATIVES
AFC Program
Customer Usage
The introduction of AFC has significantly affected howCTA riders pay their fares (1–3). The magnetic Transit Cards,carrying stored value or unlimited ride payment options,
97
have become extensively used—although a significant num-ber of riders, particularly on the bus system, still use cash.This is primarily due to less opportunity for these riders toencounter AVMs.
Ridership trends for the first few years of AFC are shownin Figure CS3-1. Once AFC was implemented, token usedecreased steadily (i.e., prior to its discontinuation in 1999),likely due to the elimination of the 11 percent token discount(and subsequent transfer of this discount to farecards). Fare-cards gained immediate popularity upon implementation ofthe AFC system and accounted for an even higher proportionof ridership after the 1999 initiatives. While the use of cashhas decreased since 1996, it still remains a popular—thoughdeclining—fare medium (accounting for roughly 18 percent ofrides in 1999). As described above, the use of passes becameincreasingly popular after the introduction of the 30-dayrolling pass, the various shorter-duration passes, and the U-PASS. The increase in pass use has also been accompaniedby a decline in the use of transfers, suggesting that riders whohad been paying cash and transferring, or transferring with afarecard, began using passes after the changes in 1999.
Figure CS3-2 shows the breakdown of CTA rail and bus rid-ership by fare payment option. From this graph, one can seethat the use of Transit Cards is much more prevalent amongrail riders than bus riders. Nearly 60 percent of CTA’s rail rid-ers used stored value farecards in June 2002, while only 14percent of bus riders used this option. As suggested earlier, thisis primarily because the opportunities for bus riders to pur-chase transit cards are much more limited than for rail riders,who have AVMs available at all rail stations. Note that thepercentage of bus riders using passes is actually higher (28percent) than rail riders (17 percent). With regard to overalluse of the AFC system (i.e., including stored value, pass, andtransfer farecard options), 95 percent of rail riders were usingsome version of the magnetic farecard; on bus, the total was68 percent. These figures have grown steadily; in 1999, thetotals were 80 percent for rail and 44 percent for bus.
This farecard availability issue is further underscored whenone looks at the proportions of bus and rail riders paying withcash. Figure CS3-2 indicates that the proportion of cash farecustomers is much higher on CTA’s bus system than on rail.Whereas a quarter of the bus riders pay with cash, only 1 per-cent of rail riders do. The use of cash on rail decreased from6 percent to 1 percent between 1999 and 2002.
CTA has also found that the use of fare media varies byfrequency of transit system use. Among regular riders (rid-ing 5 or more days a week), 55 percent use a farecard and 13percent use cash. Among infrequent riders (riding 1 to 4 daysa week), cash is a more popular option: 42 percent of theseriders use a farecard and 49 percent use cash.
Naturally, CTA has also been interested in understandingthe shift in fare media use with AFC implementation and therelated fare initiatives. CTA’s analysis to date indicates thatformer token users have primarily switched to either cash orstored value farecards, including the nondiscounted 10-pack

of one-ride farecards. Estimates are that as many as one-thirdof former token users may have switched to multipacks.Studies also show that the 7-day pass, to which much of thepass use increase is attributed, has been successful in divert-ing many users of cash and tokens to pass use. It is estimatedthat as many as 60 percent of 7-day pass users were previ-ously using cash or tokens. Moreover, surveys reveal that thispass has been successful in increasing travel on CTA by 31percent for its users.
Studies have also shown that reduced fare riders (students,seniors, and disabled riders) have converted more slowly toAFC fare payment than have regular riders. At the system-wide level, reduced fare riders are still using cash as a means
98
of fare payment more frequently than farecards. As with full-fare riders, this pattern is more predominant among bus rid-ers than rail riders.
As described previously, part of the 1999 fare initiative wasto decrease the minimum required purchase price for fare-cards from $3 to $1.50 at AVMs. Figure CS3-3 shows thatthis change had a dramatic effect on the average initial saleand the average added recharge amounts. Between 1998 and1999, the average initial farecard sale dropped from $6.58 to$3.83, while the average added recharge dropped from $5.49to $4.78. As shown earlier, the ridership accounted for byfarecards increased during this time. Therefore, it appears thatlowering the minimum purchase price may have had a signif-
0.0%
5.0%
10.0%
15.0%
20.0%
25.0%
30.0%
35.0%
Originating Transit Cards (First
Rides)
Tokens Cash Transfers, Including Transit
Cards
Passes
Per
cen
t o
f to
tal r
ider
ship
1996 1997 1998 1999
Fare Medium
Figure CS3-1. Monthly system ridership, October 1996 to October 1999.
Rail Bus
Transit Cards, Originating
59%
Cash1%
Transfers19%
Passes17%
Free Riders4%
Transit Cards, Originating
14%
Cash24%
Passes28%
Free Riders8%
Transfers26%
Figure CS3-2. Typical weekday rail and bus ridership by fare medium, June2002.

99
percent of users recharged their farecards with a value below$2. In fact, it was found that 55 to 60 percent of CTA’s cus-tomers who purchase farecards at AVMs purchase them on aone-trip basis. Therefore, many of the farecard users were nottaking advantage of the built-in bonus and were essentiallyusing a farecard as a proxy for token or cash. This pattern isseen again in Figures CS3-4 and CS3-5, which show a clear
icant impact on the use of farecards. Moreover, once the priceof 30-day passes was lowered, some of the riders who hadbeen purchasing higher value farecards may have switched tousing passes instead.
CTA found that, in 1999, 34 percent of CTA’s initial fare-card sales were valued at $2 or less, while 26 percent werevalued between $2 and $3. For recharged added value, 41
$6.58
$5.49
$0.25 $0.23
$3.48
$4.78
$0.16 $0.30
$0.00
$1.00
$2.00
$3.00
$4.00
$5.00
$6.00
$7.00
Initial Sale Added Value Purchase Bonus Add Value Bonus
1998 1999
Figure CS3-3. AVM farecard sales, daily average, October 1998 and 1999.
$9.82
$1.17 $0.90
$2.96
$0.25 $0.80 $0.68
$1.20
$2.31
$8.76
$0.00
$2.00
$4.00
$6.00
$8.00
$10.00
$12.00
AVM Recharge
AVM Initial Sale
Prevalued $16.50
Prevalued $13.50
Prevalued $10
$15 10- Packs
$13.50 20- Packs
Prevalued $20
Mo
nth
ly S
ales
(m
illio
ns
of
do
llars
)
1998 1999
Type of Farecard
Figure CS3-4. Monthly farecard sales, October 1998 and 1999.

shift towards initial card sale from recharge between 1998and 1999, both in terms of the number of transactions andtheir value.
As stated previously, one of the fare initiatives undertakenby CTA in 1999 was the implementation of a 7-day pass.While longer-term passes can offer a cost savings to frequentriders, some of these riders (particularly low-income riders)may not necessarily be able to afford the cash outlay requiredto purchase a monthly pass. Therefore, the implementationof a 7-day pass offers these riders a viable option for econo-mizing on their frequent use of the transit system. In fact,since implementing the 7-day pass, CTA has found it to beextremely popular. Among total pass users, the distributionby type of pass is as follows:
Percent of allType of Pass pass users
7-day 3930-day 33U-PASS 5Visitor (1-day) and
Fun (2-, 3-, or 5-day) 5Other (such as Pace or Metra) 18
This distribution varies by frequency of use. However, CTAhas also found that the 30-day passes are still the most com-monly used among regular riders. Among these riders, 30-daypasses account for almost half of pass purchases, while amonginfrequent users, the U-PASS is the most common.
100
Operational and Administrative Impacts
As indicated earlier, the total cost of implementing the AFCsystem was approximately $106 million. The percentage costs,rounded to the nearest whole number, for the different ele-ments of the program were as follows:
• AFC equipment—74 percent• Station construction—13 percent• Field forces—5 percent• Consultants—4 percent• CTA engineering and administration—2 percent• Marketing and start-up—1 percent
The implementation of AFC represented a dramatic changefor CTA and its customers. For instance, implementing thenew system required a shift in duties for some CTA staff,including converting former rail ticket agents into customerassistants and increasing the number of customer service staffto deal specifically with AFC-related inquiries. (CTA had orig-inally envisioned that the implementation of AFC would resultin personnel cost savings, through the elimination of the needfor the rail ticket agents. However, these savings did not mate-rialize, due to the decision to convert these employees to cus-tomer assistants.) Many of these customer service staff werepositioned in the newly formed AFC Express Unit, whichhandles complaints about the AFC system. The AFC ExpressUnit has the ability to process refund requests and Fare Dis-crepancy Reports prepared by customer assistants at rail sta-tions and bus operators who are involved in fare-related dis-
78.0%
3.0% 3.0%
27.0%
1.0% 2.0% 2.0% 2.0%
16.0%
65.0%
0.0%
10.0%
20.0%
30.0%
40.0%
50.0%
60.0%
70.0%
80.0%
90.0%
AVM Recharge
AVM Initial Sale
Prevalued $16.50
Prevalued $13.50
Prevalued $10
$15 10- Packs
$13.50 20- Packs
Prevalued $20
1998 1999
Type of Farecard
Figure CS3-5. Monthly farecard transactions, relative share, October 1998 and 1999.

putes. At the stations themselves, customer assistants havethe ability to provide assistance on the spot and to processrefunds when appropriate.
U-PASS Program (4–5)
Program Usage and Customer Benefits
Through the AFC system, CTA has been able to track U-PASS ridership, providing a good indication of the pro-gram’s ridership characteristics. Approximately 85 to 90percent of the U-PASSES distributed to students at the par-ticipating colleges in 2000–01 were activated and used. In2000–01, U-PASS ridership reached approximately 10.6 mil-lion trips among the more than 40,000 students at the 22 par-ticipating schools. CTA estimates that 2.6 to 4.0 million ofthese trips are new trips credited to U-PASS. Surveys indi-cate that about three-quarters of the new trips made on CTAas a result of the U-PASS were previously made by auto-mobile. The remainder of the new trips were apparentlyadditional trips made by students once they obtained a pass.
Table CS3-2 shows annual U-PASS ridership, by mode,for the first three years of the program’s implementation. Stu-dent travel is estimated to have increased by 25 to 38 percentfor both school and nonschool purposes compared to that inprevious, non-U-PASS school years. This is a measure of thecombined impact of diverted trips and latent demand amongthe student population. In the first school year of the program(1998–1999), when 14 institutions participated, the U-PASSgenerated 1.7 to 2.6 million new rides. In the second schoolyear, when 19 institutions participated, ridership increasedby 43 percent, bringing the new ride estimate to 2.4 to 3.7million. Total CTA ridership increased over this same two-year period by 21.5 million. Thus, U-PASS contributed anestimated 11 to 17 percent share of this growth.
Table CS3-2 also shows that more U-PASS rides are takenon rail than on bus. During the 2000–01 academic year, 59percent of the U-PASS ridership was on rail and 41 percentwas on bus. This contrasts with overall CTA ridership, whereapproximately two-thirds of all trips are made by bus. Ofcourse, the split between bus and rail for U-PASS users isinfluenced by many factors, including the locations of par-ticipating schools and student residences. However, CTA didfind that location next to a rail station was not a necessity fora school to produce high U-PASS ridership. While most of the schools with access to a rail station did produce highU-PASS ridership, other schools, not located near a rail sta-
101
tion but served by bus service, also saw above-average stu-dent ridership.
Figure CS3-6 illustrates how U-PASS ridership variesthroughout the academic year. As one would expect, U-PASSridership is higher during months in which school is in ses-sion. During the summer and holiday seasons, U-PASS rider-ship tends to be lower, as many students may be out of townduring this time.
Using the capabilities of its AFC system, CTA has beenable to measure the number of rides per day per U-PASS. InFebruary 2001, the average number of rides per day for eachU-PASS was 1.12 for 4-year colleges, 1.73 for 2-year col-leges, and 1.27 for all schools. Thus, it is over 50 percenthigher for 2-year college students than for 4-year students,even though total ridership levels are higher for 4-year col-lege students. The most important variable influencing thedifference in trip rates appears to be the daily orientation oftypical student activity patterns at the two types of institu-tions: 2-year students are more likely than 4-year students tocommute between home and school on a daily basis. Most4-year institutions have residential campuses with studenthousing, so students at these schools have less of a need fordaily travel on CTA.
CTA has also analyzed data on the time periods in whichU-PASS users ride transit, as shown in Figure CS3-7. A sig-nificant share of the ridership (36–38 percent) occurs duringthe midday period (9 AM to 3 PM). This is slightly higherthan the 32 percent of all CTA ridership that occurs duringthis time period. In contrast, only 17–18 percent of U-PASSridership occurs in the AM peak (6 to 9 AM), compared with27 percent for total CTA ridership. Higher levels of studentridership also occur in evening hours, when capacity is gen-erally available to serve more riders. This higher concentra-tion of trips in the off-peak is consistent with one of the mainU-PASS program goals.
CTA conducted rider surveys at three schools in May 2000.The survey asked students about their usage of U-PASS andincluded a number of questions about aspects of the programand about their satisfaction with U-PASS. The survey data ontrip-making, adjusted to reflect over-reporting of trips com-pared to system information (illustrated in Figure CS3-8), indi-cates that U-PASS users were primarily making school andwork trips. Consistent with previously shown data, 2-year stu-dents use the U-PASS more frequently for these purposesthan 4-year students, probably because they are more likelyto have jobs and live off-campus. The data also shows thatstudents are using U-PASS for a significant number of non-work or school trips, including social, shopping, and personalbusiness trips.
The survey of participating students also provided a basisfor evaluating user benefits of the U-PASS program. Studentswere asked to rate 12 factors according to their importance.Saving money was the most highly rated benefit, with 86–93percent of students at the three schools surveyed rating it as“very important.” The next highest ratings were given to
TABLE CS3-2 Annual U-PASS ridership, by mode
Millions of Student Rides Year Bus Rail Total
1998–1999 School Year 3.3 3.5 6.8 1999–2000 School Year 4.3 5.4 9.7 2000–2001 School Year 4.3 6.2 10.6

102
0
100
200
300
400
500
600
700
800
900
1000
Aug Sep Oct Nov Dec Jan Feb Mar Apr May Jun
Mo
nth
ly S
tud
ent
Rid
es (
000)
Bus Rail
Figure CS3-6. Monthly U-PASS CTA rides, 2000–01 school year.
27
32
21
12
4.6
16.7
5.8 8
16.3
23.2
38.3
17.6
36.3
17.6
23.6
0
5
10
15
20
25
30
35
40
45
6-9 AM Midday 3-6 PM 6-9 PM Owl
Per
cen
t o
f M
on
thly
Rid
es
All CTA Rides U-Pass Bus Rides U-Pass Rail Rides
Time of Day NOTE: U-PASS data are drawn from all CTA bus routes and rail lines for February, 2001.
Figure CS3-7. Time distribution of student U-PASS ridership.
bus/rail stop close to home, convenience, and avoid driving/parking, each of which was rated as “very important” by 50to 70 percent of students at one or more schools. Third inimportance were have no car, have no license, and to avoidheavy traffic. Rated last were environmental concerns, badweather, extra time to study and extra time to relax.
Students were also asked about their satisfaction with vari-ous U-PASS features. Specifically, they were asked the extentto which they agreed with statements about the pass. Almostall indicated they “would continue riding CTA after gradua-tion,” indicating that U-PASS may be successful in creatinglonger-term “brand loyalty.” Overall, the vast majority felt

“the program should be continued” (87 to 90 percent stronglyagreed). A large majority (64 to 82 percent) strongly agreedthat U-PASS “helps me to get around to more places” and“saves me money on my personal transportation needs.” Manystudents (52 to 71 percent) also strongly agreed with the fol-lowing statements: “I consider the U-PASS among the advan-tages of attending the school I have chosen” and “It’s easy touse the CTA bus/rail system.” Many also strongly agreed thatthe U-PASS helped them find or keep a job while in school,find and/or travel from a cheaper place to live, or visit friends.Fewer, but still significant shares, felt that the U-PASS affectedtheir decision not to purchase a car.
An added feature of the U-PASS program is the “U-PASS,U-SAVE” promotional discount program. Under this pro-gram, U-PASS holders are offered price discounts at muse-ums, theatres, restaurants, and other cultural attractions. Themajority of students (52 to 71 percent) reported that they hadnot taken advantage of the U-PASS, U-SAVE discounts;however, CTA concluded that enough students did takeadvantage to suggest it is worthwhile. CTA agreed that theprogram would benefit from more marketing on the part ofCTA, the schools, and the entities offering the discounts.
Revenue Impact
Based on the above usage data, we have estimated theorder of magnitude revenue impact of the U-PASS program.In 2000–01, 10.6 million trips were made with the U-PASS.
103
CTA estimates that 25 to 38 percent of these trips were newtrips, indicating that 62 to 75 percent (6.6 to 8 million) of thetrips would have been made on CTA even if the U-PASSwere not available. These riders would have either paid fullfare ($1.50), used a transfer ($0.30), or used a pass. Based onFY2000 data, the average fare paid by CTA riders (fixed-route only) was roughly $0.77.
Under the U-PASS program, the fee for a pass is $0.55 perstudent per day. Assuming 2 semesters and 118 days persemester, the CTA receives approximately $130 per studentper year. During the 2000–01 school year, CTA distributedapproximately 40,400 U-PASSes, 90 percent of which wereactivated (36,360 passes). Assuming that each U-PASS usermakes approximately 291 trips per year (10.6 million trips/36,360 passes), CTA is receiving approximately $0.45 pertrip made by U-PASS users. For students who would haveused CTA without the U-PASS program, this results in a netrevenue loss of $0.32 per trip. As stated previously, 6.6 to 8million trips were not new trips on CTA. Therefore, basedon this simplified analysis, it can be estimated that CTAmight be losing on the order of $2 to $2.6 million annuallywith the U-PASS program. While this is a significant figure,it must be noted that this represents a very small percentageof CTA’s over $370 million total annual fare revenue. More-over, the program has dramatically increased student rider-ship, particularly during off-peak periods when capacity isavailable to carry more riders and has apparently generatedconsiderable brand loyalty pointing to future use of transitby the students.
0.39
0.21
0.16 0.13 0.13
0.11
0.63
0.35
0.23 0.2
0.23
0.14
0
0.1
0.2
0.3
0.4
0.5
0.6
0.7
School Work Social Personal Business
Shopping Other
Est
imat
ed M
ean
Rid
es P
er D
ay
4-Year Colleges, Total = 1.13 2-Year Colleges, Total = 1.78
Purpose of Trip
Figure CS3-8. U-PASS rides per pass per day, by trip purpose and type of college, February2000.

Smart Card Pilot Program
A survey of smart card users was designed to obtain cus-tomer ratings of 22 different features of the program, as wellas customer willingness to try—and ratings of—20 potentialsmart card features (6–8). As shown in Table CS3-3, nearlyall (93 percent) of the respondents were “satisfied” or “verysatisfied” with the new fare medium. The vast majority (86percent) were “willing” or “very willing” to continue to usethe card and to recommend it to others.
When asked which attribute they liked best about the smartcard, respondents overwhelmingly responded that they likedthe convenience compared to regular farecards (21 percent ofrespondents), the use of the smart card on the train (15 per-cent), and the time to register the rail fare (13 percent), as
104
shown in Figure CS3-9. Figure CS3-10 shows that the $5 pur-chase fee for the card was the single attribute liked least (30percent). Other negative attributes included adding value to thecard and getting the correct (purchase) bonus. Regarding theformer, some respondents commented that they did not under-stand when they purchased the card that they would have toadd value before trying to use it, and some had problems try-ing to add value at the vending machines. Regarding the bonusissue, several respondents experienced procedural problemsthat resulted in their obtaining a smaller bonus than expected.While respondents rated the use of the smart card on rail favor-ably, there was some dissatisfaction with its use on bus. About10 percent to 15 percent of respondents were dissatisfied withoperator assistance on the bus, bus touch pad operation, use onthe bus, and time to register bus fare. Dissatisfaction with these
TABLE CS3-3 Smart card customer satisfaction
Level of Satisfaction and Willingness to
Recommend the Card to Others
Overall Satisfaction
(percent)
Likelihood of
Continued Use
(percent)
Willingness to
Recommend to Others (percent)
Very Satisfied or Willing 67.3 77.3 68.3 Somewhat Satisfied or Willing 25.8 8.3 17.7 Neutral 3.2 2.4 4.6 Somewhat Unsatisfied or Unwilling 2.3 1.9 2.4 Very Unsatisfied or Unwilling 1.4 10.1 7.1
5.0%
5.7%
6.4%
6.5%
7.8%
12.5%
15.1%
21.2%
0.0% 5.0% 10.0% 15.0% 20.0% 25.0%
Assistance on bus
Use on bus
Bus convenience compared to cash
SmartCard security compared to cash
Rail convenience compared to cash
Time to register rail fare
Use on train
Convenience compared to transit card
Figure CS3-9. Single smart card attribute respondents liked best.

aspects provided useful information to CTA about customerinformation and employee training needs.
When asked about “specific problems with the smart cardprogram in the last 30 days,” the most common problem citedwas assistance on the bus (15 percent) followed by use on thebus (13 percent). Other problems cited included ease ofreplacement (11 percent), time to register bus fare (9 percent),hotline assistance (9 percent) and assistance on rail (9 percent).CTA attributes some of these problems to the scale of the pilotand believes that employee training, as part of a more exten-sive program, would rectify most of these problems. Ease ofreplacement was affected by the need to go to a single locationdowntown to replace a card. This could be addressed by pro-viding additional locations or methods of replacement.
As indicated in Figure CS3-11, program participantsresponded positively to all potential new features of thesmart card except those relating to the use of the card as abank card, credit card or Internet payment tool. Regardingthese features, more than 60 percent of respondents wereeither unwilling to participate or neutral. The most desirablenew features included showing the card for discounts (78 per-cent of respondents were willing to try this feature), recharg-ing at ATMs (75 percent willing), using it on Metro CommuterRail (74 percent), recharging via phone (73 percent), movingvalue from a farecard (73 percent), and recharging via Internetand credit card (69 percent). About two-thirds of respondentswere willing to try using the card to pay for phone calls, to payfor park-n-ride, or to pay for on-street parking, indicating somepotential for a multiapplication card.
105
Comments from users about why they would be likely orunlikely to use the smart card in the future related largely toperceived benefits, such as convenience; speed; better, fasterand more durable than farecards; can get replacement if lost;safer to use; and don’t have to open purse or wallet.
CONCLUSIONS AND LESSONS LEARNED
Customer Impacts and Benefits
Implementation of AFC has proven very popular withCTA’s customers. Within 3 months of initial implementa-tion, one-third of all boardings were being made with fare-cards. At present, 95 percent of rail riders pay their fares withfarecards, as do 68 percent of bus riders. Customers havebenefited from the AFC system and the related fare initiativesin a number of ways, including the following:
• Riders now have a greater variety of fare payment optionsavailable to them.
• Farecard users receive a $1 bonus for each $10 purchaseor recharge.
• With rolling passes, riders can purchase and activate theirpasses at any time, rather than being constrained to aparticular calendar timeframe.
• The 7-day rolling pass allows customers to reap the ben-efits of an unlimited use pass without having to make thecash outlay required with a 30-day pass.
3.9%
4.3%
4.4%
6.2%
6.8%
7.2%
9.0%
11.1%
30.3%
0.0% 5.0% 10.0% 15.0% 20.0% 25.0% 30.0% 35.0%
Ease of replacement
Time to register bus fare
Obtaining a card
Assistance on bus
Use of bus
Bus touch pad operation
Getting correct bonus
Adding value to card
$5 purchase cost
Figure CS3-10. Single smart card attribute respondents liked least.

14%
27%
33%
46%
48%
53%
54%
61%
62%
64%
65%
67%
67%
67%
69%
73%
73%
74%
75%
78%
27%
22%
22%
33%
24%
30%
25%
23%
17%
24%
26%
18%
18%
23%
14%
21%
13%
21%
12%
14%
59%
51%
45%
21%
28%
17%
21%
17%
21%
12%
9%
15%
15%
10%
18%
6%
14%
5%
13%
8%
0% 10% 20% 30% 40% 50% 60% 70% 80% 90% 100%
Pay bills on Internet
Use as credit card
Use as debit or banking card
Use as 7-day pass
Use as picture ID
Use as 30-day pass
Pay rail concessions
Add value to card on bus
Auto-recharge via credit card
Use as annual pass
Use to pay park-n-ride fees
Use to pay for phone calls
Pay on-street parking
Purchase through employer
Internet recharge/credit card
Move value from transit card
Recharge via phone
Use to pay Metra fare
Recharge at ATM
Show for discounts
Willing Neutral Unwilling
Feature
Percent of Customers Willing to Try Feature
Figure CS3-11. Smart card customer willingness to try new features.
• CTA riders can make seamless transfers to and from Pacebuses (since Pace installed the same AFC technology)
The U-PASS program has had the following impacts andbenefits for students:
• Students receive a convenient means of using publictransportation for both school and nonschool purposes.
• Passes are provided, at very low cost, for unlimited rideson the CTA system at all times; this gives all studentsgreater access to higher education.
• Nearly 90 percent of survey respondents feel that theprogram should be continued, and most indicated thatthey would continue to use CTA after graduation.
The smart card pilot and the use of smart cards at the CTAhave had the following types of customer impacts and benefits:
• Smart cards offer improved convenience and ease of use,as the card does not have to be inserted but only passednear the reader.
• Smart cards provide guaranteed security of the card’svalue, as each card is registered when it is obtained,enabling a lost or stolen card to be replaced with theremaining value restored (for a $5 card replacement fee).
• Smart cards provide for a negative balance or guaranteedlast ride: a ride is guaranteed, regardless of the remainingvalue on the card; the card can carry a negative balanceup to the value of a single ride, and the next time valueis added to the card, the amount of the negative balanceis deducted from the value added.
• Smart cards carry a higher cost to customers, given therequirement to pay $5 to purchase the card.
• Nearly all (93 percent) of survey respondents were“satisfied” or “very satisfied” with the cards; the vastmajority (86 percent) were “willing” or “very willing” tocontinue to use the card and to recommend it to others.
• When asked which attribute they liked best about thesmart card, respondents overwhelmingly responded thatthey liked the convenience compared to regular fare-cards (21 percent of respondents); the $5 purchase fee forthe card was the single attribute liked least (30 percent).
Agency Impacts and Benefits
The agency-related impacts and benefits associated withthe implementation of the AFC system include the following:
• The total cost of implementing the AFC system was $106million. Of this total, 74 percent was for equipment, 13percent for station construction, 5 percent for field forces,4 percent for consultants, 2 percent for CTA engineer-ing and administration, and 1 percent for marketing andstart-up.
107
• CTA initially envisioned that implementation of AFCwould result in a personnel cost savings since they wouldhave a reduced need for rail ticket agents. However, thenew fare technology required a significant outreach andcustomer service effort on the part of the agency andmany of the rail ticket agents were converted to customerassistants. Therefore, CTA did not realize the anticipatedpersonnel cost savings.
• With the introduction of rolling passes, CTA no longerneeds to print monthly passes that may be discarded ifthey are not purchased. Therefore, this initiative hasreduced some of the printing costs associated with reg-ular monthly passes.
• The AFC system has considerably reduced the use ofcash for fare payment: 16 percent of boardings are cur-rently made using cash, compared to 27 percent pre-AFC.
• AFC allows the CTA to carefully track ridership and rev-enue impacts of different fare initiatives.
• AFC has significantly reduced opportunities for fareabuse and evasion.
• AFC has facilitated the implementation of more fareoptions for customers, many of which are more con-venient and cost-effective. Moreover, the popularity ofthe farecards has enabled CTA to eliminate tokenscompletely.
The actual or expected agency-related impacts and bene-fits of the U-PASS program are as follows:
• The program has been very successful in increasing rid-ership. CTA estimates that the U-PASS program has gen-erated between 2.6 and 4 million new trips since its incep-tion, three-fourths of which would have otherwise beentaken by automobile. Furthermore, close to one-half of U-PASS ridership is during midday or evening hours,when excess capacity exists on the system.
• U-PASS has helped CTA create a sense of brand loyaltyand transit travel patterns among students, who will beprospective customers in their postcollege years. TheU-PASS program has also helped CTA develop impor-tant partnerships with colleges and universities in thecommunity by helping them with implementation andadministration of the program.
The agency-related impacts and benefits associated withthe smart card pilot and the use of (contactless) smart cardsin general include the following:
• Faster boarding and throughput than with magnetics. • Lower maintenance requirements—and higher reliabil-
ity—of the card reading devices, since they have no mov-ing parts and are sealed (i.e., no slots/openings that canbecome jammed).
• Opportunities for new types of fare options, autoloadarrangements (including employer-based programs), and

the opportunity to include nontransit applications (e.g.,parking or retail payments, university or employer IDand access, or other functions) on the same card; whilemultiapplication scenarios were not pursued as part ofthe pilot program, they may be considered as CTA rollsout a full-scale smart card system.
Smart cards were also seen as having a disadvantage:
• Higher cost of the cards themselves, at least a portion ofwhich ends up being passed along to customers. Thecards provided to the CTA thus far cost $6 apiece, com-pared to $.035 for a magnetic stripe farecard. In the pilotprogram, CTA charged $5 to initially purchase a smartcard with no initial balance. Value then had to be addedat an AVM.
Impacts and Benefits for Partner Entities
In addition to benefiting CTA and student riders, the U-PASS program can also benefit the participating collegesand universities. A survey of students using the U-PASSindicated that most students considered it an important ben-efit of attending their chosen school. Therefore, participationin the U-PASS program can give colleges and universities anadvantage in the increasingly competitive college market.Benefits may also accrue to the institutions to the extent thatthey can better manage on-campus parking and reduce totalparking demand.
Liability to Agency
Because the fare payment and pricing options offered withAFC essentially represent automated versions of the previ-ous manual payment and pricing options, the new system haspresented little risk of fare revenue loss. In fact, the AFC sys-tem has reduced the agency’s overall revenue liability byreducing opportunities for fare evasion and abuse. There issome potential revenue loss related to actual equipment card-reading failures, as well as to complaints over alleged fail-ures and the need to provide refunds when appropriate.
The U-PASS program, on the other hand, has likely resultedin at least some revenue loss to CTA, as some U-PASS userspresumably had previously paid higher fares to ride CTA.However, the agency feels that any revenue loss has beenmore than offset by the program’s benefits, including a sig-nificant increase in student ridership, particularly during off-peak hours, and the creation of a commitment to ride CTAafter graduation.
Constraints and Barriers
The major challenges encountered in implementing andoperating AFC have been as follows:
108
• Retrofitting the new system (including a complexcommunications/data network, as well as new faregatesand AVMs) into the existing rail station infrastructure.
• Integrating the new Cubic farecard readers with theexisting GFI fareboxes; CTA technicians had to developthe physical connections between the two pieces ofequipment. (Since implementation of the AFC program,Cubic and GFI have begun to collaborate on selectedAFC system proposals and installations.)
• Promoting the use of farecards (especially in the storedvalue mode) on bus, due to the lack of convenient sale/reload points: farecard use is significantly higher amongrail riders, who have the convenience of the AVMs inthe rail stations, than bus riders.
• The need to retrain staff, including converting rail ticketagents into customer assistants.
Required Equipment and Technology
For the CTA’s 141 rail rapid transit stations, the AFC proj-ect included installation of AVMs and automated turnstileequipment. Installation on buses involved integrating farecardreaders with the existing GFI fareboxes. The magnetic striperead-write system was provided by Cubic and is very similartechnologically to the MetroCard system implemented inNew York City. Installation of the AFC system enabled CTAto introduce the U-PASS program, as well as a number of otherfare initiatives. Additionally, CTA had planned in advance foreventual use of smart cards by equipping the turnstiles andbus card readers with touchpads that could later be used withCubic’s contactless smart cards.
Lessons Learned
Key lessons learned from CTA’s implementation of AFCinclude the following:
• The introduction of AFC can significantly affect howriders pay their fares; the convenience of using a fare-card, coupled with the discounts available, has resultedin 95 percent of rail riders paying their fares with fare-cards, as well as 68 percent of bus riders.
• Providing convenient locations for purchase and reloadof farecards for bus riders is a major challenge.
• The nature of the minimum farecard purchase level andthe recharge requirement can have an impact on the useof farecards. When these requirements were lowered atCTA, the revenue and ridership accounted for by fare-cards increased. However, CTA has found that morethan half of farecard users purchase the cards on a one-trip basis. Thus, they are using farecards as a proxy for

cash or tokens and are not taking advantage of the bonus.This experience indicates that bonuses may not have assignificant an effect on purchase behavior as might beexpected.
Lessons learned from CTA’s U-PASS program includethe following:
• A university pass program can be very effective at gen-erating increased ridership, especially during midday andevening hours, when there tends to be excess capacityon a system. Such programs can also result in establish-ment of significant “brand loyalty” to the transit systemin terms of students planning to use the system aftergraduation.
• Location near a rail station is not necessary for a schoolto produce high student ridership with the U-PASS pro-gram. Participating schools that are served by buses onlystill generated high student ridership levels.
• Usage of the passes is likely to be higher with 2-yearcollege students than 4-year college students, since theformer are less likely to live on campus and may have ajob outside of school.
The smart card pilot provided sufficient support for CTAto expand its smart card program to full implementation in2002. The program was well received by customers—93 per-cent of survey respondents reported being “satisfied” or “verysatisfied” with the program and 86 percent were “willing” or“very willing” to continue to use the card and recommend itto others. During the smart card pilot, CTA learned the fol-lowing lessons:
• Customers need better upfront explanation of the ratio-nale for an initial purchase fee.
• Customers particularly like the security offered by hav-ing the capability to restore their card balance in the caseof loss or theft of the card.
CASE STUDY CONTACTS AND SOURCES
The following individuals were interviewed at CTAheadquarters:
109
Darwin StuartCTA120 N. Racine Ave.Chicago, IL 60607312-733-7000, ext. [email protected]
Peter FooteCTA120 N. Racine Ave.Chicago, IL 60607312-733-7000, ext. [email protected]
The following documents (in addition to ridership and rev-enue summaries and other sales and operational data) wereused in preparing the case study:
Darwin Stuart. University and College Student RidershipGrowth in Chicago U-PASS Program. Paper presentedAPTA Rapid Transit Conf., Boston, June 2001.
CTA Market Research Department, 2000–01 U-PASS Stu-dent Ridership, Technical Report MR/DSD01-22, August2001.
CTA Market Research Department, 2001 Customer Satis-faction Survey, Technical Report MR02-05, April 2002.
CTA Market Research Strategic Planning Department, CTASmart Card Pilot Program: Customer Satisfaction Survey,Technical Report MR01-03, Feb. 2001.
Peter Foote and Darwin Stuart, Testing Customer Acceptanceof Smart Cards at the Chicago Transit Authority. Paperpresented at Transportation Research Board Annual Meet-ing, January 2002.
Peter Foote, Ross Patronsky, Darwin Stuart. Customer Impactsof CTA’s Automated Fare Collection System. Paper pre-sented at Transportation Research Board Annual Meeting,January 1999.
P. Foote and D. Stuart, Impacts of Transit Fare Policy Ini-tiatives Under an Automated Fare System. TransportationQuarterly, Vol. 54, No. 3, Summer 2000.
P. Foote, R. Patronsky, D. Stuart. Transit Customer Accep-tance of Automated Fare Collection Systems. Journal ofPublic Transportation, Vol. 2, No. 3, 1999.
CTA Smart Card Pilot Program, A Presentation by Tech-nology Management and Finance Division, CTA, Febru-ary 2001.

110
CASE STUDY 4
CONNECTICUT TRANSIT
INTRODUCTION
Connecticut Transit (CT TRANSIT) operates state-ownedtransit systems serving Hartford, New Haven, and Stamford.The three operations have a total peak fleet (FY 1999) of 341buses: 189 in Hartford, 110 in New Haven and 42 in Stam-ford. Total system ridership (FY 1999) was approximately 27million: 15 million in Hartford, 9 million in New Haven, and3 million in Stamford.
This case study reviews a program introduced in June 1998called the New Fare Deal (10). This program included the fol-lowing individual elements:
• Eliminating local fare zones • Introducing an electronic 1-day pass that could be issued
onboard buses• Introducing a 7-day rolling pass (i.e., activated on first use) • Replacing the monthly flash pass with a 31-day rolling
pass • Introducing an electronic 10-ride (i.e., stored-ride) fare-
card
The New Fare Deal program created auniform fare structure for the three CTTRANSIT operations, as well as sev-eral other state-contracted local servicesin Waterbury, New Britain, Bristol, Meri-den, and Wallingford. Any of these elec-tronic payment options could be used onany of the participating services. The pay-ment options were—and continue to be—based on GFI’s TRiM magnetic read-write technology.
This case study reviews the implementation process anddiscusses issues and impacts related to the above fare initia-
tives. The case study also discusses a university pass (Upass)program the agency runs with two local colleges.
DEVELOPMENT AND IMPLEMENTATION OFFARE INITIATIVES
Elimination of Local Fare Zones
The New Fare Deal program was intended to simplify andincrease the convenience of fare payment for Connecticut tran-sit users. The fare structure at CT TRANSIT had previouslybeen quite complicated, with a range of fares based on distancetraveled and type of service (i.e., zone charges for both localand express routes). Each city served by CT TRANSIT had itsown zonal structure, with the base fare ($1) charged withineach urban core area and concentric zones radiating fromthese core areas. Each zone carried a $0.50 surcharge. Themaximum fare for a local trip was $2.50, or the core area plusthree zones. However, roughly 90 percent of all trips werewithin the central urban core zones (9).
While the concentric zone structure was reasonable at atime when transit travel focused on the downtown areas,market research conducted by CT TRANSIT in 1996 deter-mined that “‘downtown’ was no longer the destination for amajority of transit customers” (10). The increase of suburb-to-suburb trips resulted in increasing inequities in trip costs;for instance, someone traveling along a radial route and cross-ing a zone boundary would pay a zonal surcharge despite mak-ing a relatively short trip, while someone making a crosstowntrip could travel a much longer distance without crossing azone boundary.
Adding to the complexity of the zonal structure was the farepayment process itself. On boarding, a rider paid the base fareand was given a “zone check.” On exiting, the rider wasexpected to hand the zone check to the operator and pay theapplicable zone surcharge. This system was apparently con-fusing to riders and difficult for operators to administer, sincethey had to remember where individual riders had boarded.This apparently resulted in numerous confrontations, as someriders would argue that they did not owe a zone surcharge.
The 1996 market research concluded that “The current CTTRANSIT approach to fares has created a fare structure thatis overly complex, not strategically aligned with the oppor-tunities in the marketplace, and inconvenient to use” (10).One of the key recommendations of this study was that CT
Fare Program/Initiatives
Fare simplification:elimination of zonesIntroduction of AFC: common farecard, rolling passes (7- and 31-day), 1-day pass sold onboardIntroduction of university pass program

111
TRANSIT make the fare structure “appear less complex tothe first time user” (9).
Another rationale for eliminating local fare zones was toremove the negative impact of that structure on welfare-to-work trips. The routes bringing inner city residents to jobs insuburban areas (i.e., reverse commuting) typically requiredthat riders pay zone surcharges, meaning that these people wereoften paying higher fares than riders making intra-suburbantrips. The surcharges were seen as a definite barrier to encour-aging reverse commuting.
Finally, CT TRANSIT saw an opportunity to reduce its farecollection costs by eliminating local zones. The zones requiredthe agency to produce multiple denominations of passes, forfull fare riders as well as for other rider categories, such as stu-dents, seniors, and persons with disabilities. (CT TRANSITdid decide to retain the express zonal structure, since much ofthat service continued to be focused on the downtown areas.)
CT TRANSIT’s goals and objectives in eliminating thelocal zone system can be summarized as follows:
• Improve rider ease of understanding and payment offares, and thus increase ridership.
• Reduce operator requirements for administering fare col-lection, and eliminate rider-operator confrontations.
• Support welfare-to-work/reverse commute initiatives.• Reduce administrative costs associated with production
of zone-based passes.
The fare zones were eliminated in June 1998, and the changewas marketed using the slogan “One Fare Everywhere.”
Introduction of New Passes and Stored-RideTickets
In addition to eliminating the local fare zone structure, CTTRANSIT decided at the same time to take advantage of theautomated processing capabilities of its GFI TRiM units andintroduce a series of electronic payment options:
• A 1-day pass ($2.50) that can be pur-chased onboard buses or at any salesoutlet; this pass is activated when pur-chased, if onboard, or when first used,and is then valid for the remainder ofthe service day.
• A 7-day rolling (i.e., activate on firstuse) pass ($12).
• A 31-day rolling pass ($38), whichreplaced the monthly flash pass.
• A stored-ride farecard good for 10 rides ($9, represent-ing one free ride).
Elimination of free transfers was also considered as part ofthis fare initiative, but CT TRANSIT opted to retain this ele-ment of the fare structure. The agency’s chief goals and objec-tives in introducing the new fare options were as follows:
• Improve customer convenience.• Reduce the administrative burden and cost associated
with the sale of passes.• Avoid disputes regarding the validity of passes—by val-
idating passes and farecards electronically.• Reduce the use of tokens: eliminate the Zone 2 token;
have the farecard replace the token 10-pack. (Whileindividual tokens can still be purchased and used, theyare discounted only in rolls of 50; tokens tend to bebought only by social service agencies and schools.)
CT TRANSIT conducted an extensive marketing campaignin implementing these initiatives. The effort included flyersdistributed on buses and at transit agency information andsales locations, press releases, print ads, notices posted insidevehicles, inserts in all mail orders for passes the month prior totheir introduction, and flyers distributed through employers.
Upass Program
In 2000, CT TRANSIT began a pass program with twocolleges in Hartford, Trinity College (approximately 1,900students) and Capital Community College (approximately3,000 students). The Upass is magnetically encoded, allow-ing the number of rides to be tracked (by pass) when insertedinto the TRiM unit. Each school’s Upass shows the name ofthe school and the semester in which it is valid. Students aresometimes asked to show a school ID when boarding in orderto limit sharing of a pass with a nonstudent.
Under the terms of this program, each college pays a CTTRANSIT fare of $0.65 per ride by students carrying theUpass—up to a ceiling of an amount equivalent to $20 perfull-time student per semester. In other words, assuming3,000 students, the ceiling amount for Capital students wouldbe calculated as follows: 3,000 × $20 = $6,000. Thus, at$0.65 per ride, Capital students would have to take 92,308rides in a semester to reach the ceiling amount. Once thenumber of rides in a semester exceeds that figure, the schoolis not charged for additional rides during that semester—meaning that CT TRANSIT effectively “loses” the revenueit would have collected for each ride. The per student ceilingprice started at $12, then rose to $18, before rising to the cur-rent level; the ridership and revenue impacts of the programare discussed below.
RESULTS AND IMPACTS OF FARE INITIATIVES
New Fare Deal Program
Ridership and Revenue Impacts and CustomerBenefits
The ridership and revenue totals for the period since theintroduction of the fare initiatives are summarized in TableCS4-1. Figures CS4-1 and CS4-2 show the distribution of types

112
of fare payment in 1998 and 2002. As indicated in the table andthe figures, the fare program changes described here have hada significant impact on the distribution of fare payment mech-anisms. These impacts can be summarized as follows:
• The use of cash (as a percentage of overall fare types)dropped by 6 percent within a year of the introductionof the New Fare Deal; in 2002, the use of cash is roughly9 percent below the 1998 percentage.
• Following the introduction of stored-ride cards, the useof tokens dropped by 48 percent, although token userose somewhat again in 2001.
• The use of both the 1-day pass and the 7-day pass havegrown steadily since their introduction.
• Overall pass use in 2002 has been 34 percent higher thanpass use in 1998 (i.e., limited to a monthly pass), althoughthe number of monthly pass users has declined (down 18percent in 2002 from the 1998 monthly pass total).
As indicated in Table CS4-1, CT TRANSIT’s overall rid-ership has been relatively steady during this period, althoughridership was 2 percent lower in 2002 than in 1998. Demandactually dropped by 2 percent in the first year following theintroduction of the New Fare Deal, although fare revenue
TABLE CS4-1 Ridership and revenue totals
Annual Total (Percent Change from Previous Year) Fare/Revenue Category FY 1998 FY 1999 FY 2000 FY 2001 FY 2002 System Total 27,422,144
26,875,449
(2.0 percent) 27,341,448
(1.7 percent)27,342,986
(0.0 percent)26,832,700
(1.9 percent) Local Cash 12,562,281
11,842,086
(5.7 percent) 11,847,596
(0.0 percent)11,748,858
(0.8 percent) 11,392,780
(3.0 percent) Local Tokens 850,900
438,780
(48.4 percent) 418,191
(4.7 percent) 472,516
(13.0 percent)448,060
(5.2 percent) Local 10-Ride Tickets
83,064
505,451 (508.5 percent)
456,383 (9.7 percent)
424,397 (7.0 percent)
422,000 (0.1 percent)
Local 1-Day Pass 0
1,223,813 (new)
1,628,306 (33.1 percent)
1,810,642 (11.2 percent)
1,982,150 (9.5 percent)
Local 7-Day Pass 0
184,197 (new)
244,338 (32.7 percent)
280,200 (14.7 percent)
321,945 (15.1 percent)
Local 31-Day Pass 4,452,720
3,976,301 (10.7 percent)
3,779,498 (4.9 percent)
3,967,506 (5.0 percent)
3,652,830 (7.9 percent)
Other Fare Categories*
9,473,179 8,704,821 (8.1 percent)
8,967,136 (3.0 percent)
8,638,867 (3.7 percent)
8,612,935 (0.0 percent)
Total Fare Revenue $20,567,663
$20,405,803 (0.8 percent)
$20,025,189 (1.9 percent)
$20,037,469 (0.1 percent)
$19,195,730 (4.2 percent)
Revenue per Mile $1.85
$1.80 (2.7 percent)
$1.71 (5.0 percent)
$1.72 (0.6 percent)
$1.67 (2.9 percent)
Avg. Fare per Rider $0.75
$0.76 (1.3 percent)
$0.73 (3.9 percent)
$0.73 (0.0 percent)
$0.72 (1.4 percent)
Fare Recovery 37 percent
36 percent (2.7 percent)
35 percent (2.8 percent)
33 percent (5.7 percent)
30 percent (9.1 percent)
SOURCE: CT TRANSIT Ridership and Financial Statistics.* Other Fare Categories include Commuter, Student, Sr./Disabled, and Transfers.
cash46%
monthly pass16%
other35%
10-ride tickets0%
tokens3%
Figure CS4-1. Types of farepayment, 1998.
cash42%
7-day pass1%
31-day pass14%
other32%
10-ride tickets2%
tokens2%
1-day pass7%
Figure CS4-2. Types of fare payment,2002.

experienced a smaller decrease (0.8 percent); this resulted ina small increase in the average fare per rider (from $0.75 to$0.76). Fare revenue has declined further since that point,though: the 2002 total was 4 percent below the 1998 total.This revenue loss is most likely at least partially attributableto the increase in pass sales and usage, particularly the steadygrowth in the use of 1-day and 7-day passes.
The agency could recover some of this revenue loss byraising the price of the 1-day pass and may consider such amove at some point in the future. This pass is currently usedan average of roughly 4.25 times per day. Assuming that mostof these uses represent boardings that would otherwise cost$1 apiece (because riders who can use free transfers presum-ably do not buy passes), the average user of the 1-day passwould still receive a substantial discount if paying $2.75 or$3 per day.
Operational and Administrative Impacts andIssues
CT TRANSIT’s fare initiatives have had a number of oper-ational and administrative impacts; the key impacts and issuesor problems can be summarized as follows:
• Elimination of local zones. This has benefited operatorsby reducing the requirement to issue and collect zonefare checks and by eliminating confrontations with ridersregarding the payment of zonal surcharges. It has alsobenefited the agency by eliminating the need to (1) printdifferent denominations of passes, (2) print and issue zonechecks, and (3) administer two denominations of tokens.
• Onboard sale of 1-day passes. There has been a smallbut consistent incidence of failed transactions involv-ing the onboard sale of 1-day passes. Roughly 2.5 per-
cent of all onboard sales cannot becompleted because riders fail to informthe operator of their intention to buy a pass before inserting money into thefarebox. The operator must initiate aday pass transaction before any moneyis deposited. Instructions are posted oneach bus, but a significant number ofriders fail to follow these instructions.In such cases, a road supervisor subse-quently locates the would-be day pass
buyer and gives him/her a day pass. CT TRANSIT esti-mates that this requires 40 to 60 hours per month in roadsupervisor time.
• Introduction of rolling passes. This has significantlyreduced the administrative requirements and costs asso-ciated with selling and distributing passes. Previously,thousands of calendar-month passes (considerably morethan the number actually sold) had to be printed and dis-tributed to employers and sales locations each month, and
113
the sales/reconciliation effort was concentrated into ashort period from the last few days of a month through thefirst few days of the following month. The use of rollingpasses has allowed bulk distribution (i.e., since passes areno longer tied to a particular month) and has eliminatedthe waste associated with printing extra monthly passesand the need for reconciliation and shredding of unusedpasses each month. The use of electronic media has alsoeliminated the counterfeiting of passes, and has madeoperators’ jobs easier by no longer requiring them tovisually inspect each pass.
Thus, despite the operational issue related to sale of 1-daypasses, the fare initiatives described here have generally ben-efited CT TRANSIT and its operators. (There has been a sig-nificant increase in equipment maintenance costs associatedwith the use of the electronic registering fareboxes and cardprocessing (TRiM) units. However, since CT TRANSIT hadinstalled the new fareboxes and TRiM units before decidingto introduce the new fare options, these costs should not beattributed to these fare initiatives.)
Upass Program
Program Usage
The usage and revenueimpacts of each college’s Upassprogram are summarized inTables CS4-2 and CS4-3. As indicated in Table CS4-2, Capi-tal Community College (CCC) students used the passes for anaverage of roughly 19,000 rides per month during February–April 2002. Usage was down slightly from previous semesters;the highest use occurred in the Fall 2000, at over 23,500 permonth. Ridership failed to reach the ceiling level for the firsttime in Fall 2001. The revenue impacts are discussed below.
Thus far, CCC has distributed on the order of only 500passes to students; therefore, each of these students is usinga pass over 40 or more times per month. Since CCC is a com-muter school, this is a reasonable level of usage. The numberof passes requested and the resulting usage is expected tojump once the school makes its planned move into a down-town Hartford location served by many of CT TRANSIT’sHartford routes. At that point, CT TRANSIT will have toestablish a much higher per student ceiling rate or lose con-siderable revenue.
In contrast, Table CS4-3 shows that Trinity College stu-dents used the passes for only 1,300 rides per month duringFebruary–April 2002; this represents a significant drop fromthe highest use—over 2,400 rides in October 2001. In gen-eral, Trinity College usage has displayed considerable fluc-tuation over the last two years. Trinity students primarily liveon or near campus, and thus use CT TRANSIT for off-campus travel (e.g., to reach community service assign-ments), rather than for commuting.

Revenue Impact
With regard to revenue impact, the Upass program hashad mixed results to-date. As shown in Table CS4-2, CTTRANSIT lost revenue each semester of the first two yearson the CCC portion of the program, although the amount ofthe loss was reduced considerably once the per student ratewas raised from $12 to $18 in 2000–01. The revenue col-lected per ride grew from a low of $0.27 in the Spring of1999–2000 to the full $0.65 the following Spring. With theincrease to $20 in 2001, coupled with a 20 percent drop inusage in the Fall semester (compared to the previous Fall),CCC did not reach the ceiling in either semester. As sug-gested above, however, a major rise in the usage level willrequire a concomitant increase in the per student rate if CTTRANSIT is to avoid a substantial loss of revenue.
With a much lower rate of usage, the Trinity portion of theprogram has not come close to reaching the ceiling level thusfar. For the Spring 2002 semester, for instance, the ceilingamount was approximately $38,000 (i.e., 1,900 students ×$20). Through April, the revenue collected for rides takenwas just over $3,000.
CONCLUSIONS AND LESSONS LEARNED
Customer Impacts and Benefits
The New Fare Deal initiatives appear to have significantlybenefited CT TRANSIT’s riders, as follows:
114
• Simplified the fare structure through elimination of farezones.
• Provided more convenient fare options, including rollingpasses, stored-ride cards, 1-day passes sold onboardbuses, and semester passes to college students.
• Reduced the cost of travel for many riders by offeringlow-price, 1-day passes and via the Upass for partici-pating college students.
• Provided opportunities for seamless travel on any of eightparticipating transit systems in the state (i.e., 51 localroutes operated by CT TRANSIT in Hartford, Stamfordand New Haven, as well as local service operated byother Connecticut DOT contractors in five other towns),as all fare media are accepted on any of these services,regardless of which system issued the pass or farecard.
Finally, while CT TRANSIT has not surveyed its ridersregarding their satisfaction with the fare initiatives, the usageof the new options suggests that riders have embraced them.The 7-day pass and the 1-day pass in particular have experi-enced steady growth, and overall pass use has increased bymore than a third since 1998.
The Upass program has also benefited its customers, twolocal colleges, and their students.
Agency Impacts and Benefits
The New Fare Deal initiatives have also had a generallypositive impact on CT TRANSIT’s administrative and oper-ational fare collection requirements:
TABLE CS4-2 Upass ridership and revenue totals (Capital Community College)
Usage Revenue Lost Usage Revenue Lost Usage Revenue LostCollected Revenue Collected Revenue Collected Revenue
Fall SemesterAug 983 $639 0 $0 231 $150
Sept 19509 $12,681 23358 $15,183 18162 $11,805
Oct 22499 $14,624 27073 $17,597 23136 $15,038
Nov 21661 ($14,080) 24659 $16,028 ($209) 19859 $12,908
Dec 18899 ($12,284) 19043 ($12,378) 13613 $8,848
Semester total 83551 $27,944 ($26,364) 94133 $48,808 ($12,587) 75001 $48,749 $0Average fare/ride $0.33 $0.52 $0.65
Spring SemesterJan 8758 $5,693 9807 $6,375 6445 $4,189
Feb 23089 $15,008 20664 $13,432 18377 $11,945
Mar 23512 $5,299 ($9,983) 21572 $14,022 18418 $11,972
Apr 20254 ($13,165) 21253 $13,814 20595 $13,387
May 18951 ($12,318) 13250 $8,613 ($4,055) na na
Semester total 94564 $26,000 ($35,466) 86546 $56,256 ($4,055) 63835 $41,493 $0Average fare/ride $0.27 $0.65 $0.65
Rate/student: 12.00$ 18.00$ 20.00$
1999-2000 2000-2001 2001-2002

115
• Attracted new riders to the system, as transit usage bystudents is reportedly higher than prior to implementa-tion of the Upass program.
• Under the terms of the pricing agreement, CT TRANSITreceives a lower fare per rider than it receives from otherstudents; moreover, given the nature of the agreement—with a ceiling based on a fixed rate per student—theagency lost revenue during the first two years from CCC,although the loss lessened considerably once the ratewas increased in 2000 (from $12 to $18).
Impacts and Benefits for Partner Entities
CT TRANSIT’s Upass program has benefited the collegestaking part in the program, as follows:
• Allows the colleges to provide their students unlimiteduse of transit service; this will become particularly impor-tant for Capital Community College once the school relo-cates to downtown Hartford (i.e., since CCC is a com-muter school, the Upass program should reduce theamount of parking the school needs to provide).
• The basic per ride fare charged the colleges ($0.65) isdiscounted significantly from the full cash fare ($1), andis even lower than the normal student fare ($0.75); how-ever, given the nature of the payment agreement forthe program—with a ceiling based on a fixed rate perstudent—CCC was able to provide its students rides ata very low rate (as low as $0.27 per ride) before the ratewas adjusted.
• Reduced operator requirements for administering farecollection and eliminated rider-operator confrontationsregarding (1) payment of zonal surcharges and (2) valid-ity of passes; however, a new type of operator-rider dis-pute has arisen, associated with the onboard purchase of1-day passes (i.e., some riders do not realize that theymust inform the operator of their intention to buy a passbefore depositing money in the farebox).
• Reduced fare collection costs associated with (1) sellingand distributing fixed-calendar monthly passes, (2) print-ing different zone denominations of passes, (3) print-ing and issuing zone checks, and (4) administering twodenominations of tokens.
• Reduced the use of cash (9 percent drop since introduc-tion of fare initiatives) and tokens (47 percent drop sinceintroduction of fare initiatives).
• Resulted in a small revenue decline, although the aver-age fare per rider increased in the year following the fareinitiatives.
• Reduced the extent of fare abuse and evasion throughautomatic verification of validity of fare media and bycurtailing counterfeiting of passes.
• Increased fare structure flexibility (i.e., the agency’sability to add or change fare strategies).
• Had no significant impact on service reliability; whilethe use of electronic media has slightly reduced board-ing times, confusion related to purchase of 1-day passeshas offset that improvement on some runs.
The Upass program has had the following impacts on CTTRANSIT:
TABLE CS4-3 Upass ridership and revenue totals (Trinity College)
Usage Revenue Lost Usage Revenue Lost Usage Revenue LostCollected Revenue Collected Revenue Collected Revenue
Fall SemesterAug 75 $49 0 $0 333 $216
Sept 1499 $974 1351 $878 1586 $1,031
Oct 1611 $1,047 1657 $1,077 2414 $1,569
Nov 1353 $879 1270 $826 2266 $1,473
Dec 1053 $685 902 $586 1674 $1,088
Semester total 5591 $3,634 $0 5180 $3,367 $0 8273 $5,377 $0Average fare/ride $0.65 $0.65 $0.65
Spring SemesterJan 581 $378 744 $483 880 $572
Feb 1299 $844 1174 $763 1310 $851
Mar 1478 $961 998 $649 1361 $885
Apr 1081 $703 1143 $743 1302 $846
May 984 $639 652 $424 na na
Semester total 5423 $3,525 $0 4711 $3,062 $0 4853 $3,154 $0Average fare/ride $0.65 $0.65 $0.65
Rate/student: 12.00$ 18.00$ 20.00$
1999-2000 2000-2001 2001-2002

Liability to Agency
CT TRANSIT risked losing revenue in eliminating its zonalsurcharges. However, as indicated above, the loss was mini-mal. This was due to two key factors: (1) the vast majority ofrides occurred within a single zone to begin with; and (2) theagency offered a variety of new fare options that increasedoverall customer convenience. CT TRANSIT also risked los-ing revenue—and in fact did suffer some loss—in its Upassprogram; however, the agency was able to limit further expo-sure by including in the pricing agreement the ability to raisethe per student rate in subsequent years.
With regard to equity considerations, changes in the routestructure and types of trips (i.e., reducing the focus on radialtrips from the suburbs into downtown areas) had made thezonal structure inappropriate for the service areas. The zoneshad actually introduced a level of inequity into the system, andthe structure was inconsistent with several of the agency’s pri-mary goals (including promotion of welfare-to-work/reversecommute initiatives).
Constraints and Barriers
There were no significant constraints or barriers to the suc-cessful implementation of CT TRANSIT’s fare initiatives.The necessary equipment had already been installed at eachof the operations, thereby allowing for the introduction ofelectronic fare options, as well as the use of these options onany of the participating services (i.e., CT TRANSIT’s threeservices and several others across the state).
The establishment of the Upass program did require thedevelopment of a pricing agreement between CT TRANSITand the participating colleges; however, as discussed else-where, the colleges agreed to allow increases in the per stu-dent rate once the usage level had been established.
Required Equipment and Technology
CT TRANSIT was able to introduce rolling passes and astored-ride farecard because it had installed electronic regis-tering fareboxes equipped with electronic (magnetic) fare-card read-write equipment, GFI’s Cents-a-Bill fareboxes andTRiM units.
Lessons Learned
Key lessons learned from the case study include the fol-lowing:
• Elimination of zonal surcharges will not necessarilyresult in a significant loss of fare revenue, as the simplifi-cation of the fare structure—perhaps coupled with intro-duction of new customer-oriented fare options—can
116
attract new riders and thus offset the loss of zonal sur-charge revenue.
• In the onboard sale of 1-day passes (or any type of fareinstrument), riders must be given clear instructions as tothe procedure for purchasing the pass. Even with suchinstructions, however, an agency can expect some ridersto fail to read—or to forget—the instructions, and there-fore must be prepared to deal with the resulting problems.
• In establishing a university pass program structuredsuch as CT TRANSIT’s Upass (i.e., with payment perride taken, up to a ceiling based on a fixed rate per stu-dent), it is important to establish a per student rate thatthe transit agency can adjust to reflect the actual usageof the passes. If the agency is held to an initial rate(derived based on predicted usage), and usage proves tobe much higher than the original estimate, the agencywill experience a considerable revenue “loss” from thearrangement. CT TRANSIT has been able to increasethe rate twice already, and has thereby limited the extentof its lost revenue.
CASE STUDY CONTACTS AND SOURCES
The following individuals were interviewed at CTTRANSIT headquarters (Hartford) as part of this case study:
Philip Fry, Assistant General ManagerCT TRANSIT 100 Leibert Rd.Hartford, CT 06141-0066860-522-8101860-247-1810 (Fax)[email protected]
Nicholas Mangene, Division Transportation ManagerCT TRANSIT (Hartford Division)100 Leibert Rd.Hartford, CT 06141-0066860-522-8101860-247-1810 (Fax)[email protected]
A CT TRANSIT (Hartford) operator
The following documents (in addition to ridership and rev-enue summaries and other sales and operational data) wereused in preparing the case study:
David A. Lee, Introducing Fare Simplification and NewConvenience Fares at Connecticut Transit. TransportationResearch Record 1669 (1999), pp. 109–112.
Ilium Associates, CT TRANSIT Marketing Project: Recom-mendations. Prepared for CT TRANSIT, June 1996.
Connecticut Department of Transportation. Bureau of Pub-lic Transportation—Biennial Report (SFY 1998/99).

117
CASE STUDY 5
KING COUNTY METRO TRANSIT
INTRODUCTION
King County Metro Transit (Metro) is a division of theKing County Department of Transportation. Metro providespublic transportation throughout Seattle, Washington, andthe surrounding King County. It operates a fleet of about1,300 vehicles—including standard and articulated coaches,electric trolleys, dual-powered buses, and streetcars—thatserves an annual ridership of 100 million within a 2,134square mile area. Metro serves riders who are disabled withaccessible fixed route service (all Metro buses have wheel-chair lifts and all routes and trips are accessible), as well asparatransit van service and a taxi scrip program. Metro alsooperates the largest publicly owned vanpool program in thecountry, with more than 700 vans, serving 5,000 people daily,making more than 2.9 million trips per year. The regionalRidematch system helps commuters form and sustain newcarpools and vanpools in seven counties by matching namesin a computer data base. Finally, Metro operates a 1.3 mileelectric bus tunnel underneath downtown Seattle.
This case study reviews two related programs:
• A university pass program (U-PASS), introduced in 1991.• An annual employer pass program (FlexPass), intro-
duced in 1993.
Both programs involve making deeply discounted passesavailable to all members of a group (e.g., students andemployees of a university or employees of a company), pro-viding benefits for pass users and revenue guarantees forMetro. This case study reviews the development and mar-keting of these two programs—including the steps that weretaken to address internal concerns—as well as their resultsand impacts.
DEVELOPMENT AND IMPLEMENTATION OFFARE INITIATIVES
U-PASS Program
The U-PASS is an arrangement between the Universityof Washington (UW) and Metro (and other operators in theregion) in which a discounted transit pass is made availableto students, faculty, and staff. The U-PASS provides unlim-ited access to transit service (Metro, as well as CommunityTransit in Snohomish County, and Sound Transit’s Soundercommuter rail service), vanpool subsidies, carpool subsidies,discounted parking incentives for high occupancy vehicles(HOVs), and a guaranteed ride home.
The U-PASS grew out of the UW’s traffic and parkingproblems of the late 1980s. In 1983, the UW had (pursuantto an agreement with the City of Seattle) created a Trans-portation Management Plan (TMP) that specified that theUW would not add parking spaces, increase current trafficlevels, or increase the number of vehicles parking in nearbyneighborhoods. Despite this, by the late 1980s, campus park-ing lots were reaching capacity, students increasingly soughtstreet parking in surrounding neighborhoods, and all types ofHOV use had also declined. In addition, the UW had adopteda new development plan that would increase the number ofstudents, faculty, and staff coming to campus and require upto 3,600 new parking spaces—at a cost of up to $100 million.Neighbors of the UW were strongly opposed to the addition ofparking spaces, and the UW faced tremendous legal and polit-ical pressure to reduce the amount of traffic it was generating.
The UW, Metro, and other transit agencies in the regioncreated a task force, including representatives of universityfaculty, staff, and students, to seek solutions to the Univer-sity’s transportation and parking issues. One program thatwas of considerable interest was the type of student pass pro-gram offered by the University of Oregon (and other univer-sities) in which students could ride local transit buses by pre-senting their student IDs. The task force proposed a similarprogram that would also serve the UW’s employees.
The proposed program included several key elements:
• Revenue Neutrality. Metro’s finance group raised theconcern that any discounted pass could result in Metro
Fare Program/Initiatives
University pass programAnnual employer pass program

losing money. The program therefore provided that theUW would guarantee Metro that it would receive atleast as much revenue from UW pass holders as it wascurrently receiving from selling retail-priced passes tothe campus community.
• Increased Service Levels. While many buses to the uni-versity district ran with empty seats, the UW and Metroassumed that deeply discounted bus passes would increaseridership on some routes beyond existing capacity. Theprogram therefore provided for a 20 percent increase inservice to the UW, with the cost of that service to besplit evenly between the UW and Metro.
• Opt Out Procedure for Students. Each UW studentwould receive a bus pass in his or her registration mate-rials. Unless the student returned the pass, the UW wouldadd a small charge to his or her tuition bill ($20 per quar-ter when the program started in 1991).
• Faculty and Staff Option. Faculty and staff were giventhe option to purchase subsidized passes. To encouragethem to try U-PASS, faculty and staff were guaranteedthat if they decided that they did not like the U-PASSwithin 6 months, they could get back their parking per-mit and lot assignment, without being sent back to thebottom of the waiting list.
• Additional Benefits. U-PASS holders were provided witha variety of other services designed to discourage single-occupancy vehicle (SOV) commuting. These includedbicycle lockers, free rides on a night shuttle, free carpooland vanpool parking, and discounts from local mer-chants. Faculty and staff who opted to turn in their park-ing permits could purchase discounted single day permitsfor days when they needed to drive (70 percent discountfor U-PASS holders, 50 percent discount for others). Fac-ulty and staff U-PASS purchasers also received a reim-bursed ride home benefit. (Faculty and staff who have anemergency and whose usual means of transportation isunavailable may call a taxi and be reimbursed for 90 per-cent of the fare for up to 50 miles of travel each quarter.)
• UW Funding. As part of both managing SOV travel andfunding the U-PASS program, the UW raised SOV per-mit parking prices by 50 percent when the U-PASS pro-gram was first implemented.
In March 2001, a new benefit was added to the U-PASS,Flexcar. Flexcar, a private membership-based carsharing pro-gram, provides vehicles for occasional use on a per-hourbasis. The UW signed an agreement allowing Flexcar to basethree vehicles at its Seattle campus in return for providing adiscount on Flexcar membership to U-PASS holders. Sincethat time, 311 U-PASS members have taken advantage of thisoption.
FlexPass Program
Following the success of U-PASS, some Metro staff sug-gested that other employers be given the opportunity to par-ticipate in a similar plan, i.e., having an employer guarantee
118
Metro’s existing fare revenue from its employees in return forMetro providing deeply discounted passes to all interestedemployees. In the short term, this would result in significantridership growth, filling some of Metro’s existing emptyseats. In the long run, the increased ridership would allowMetro to raise the price of the FlexPass in the future, therebyincreasing Metro’s revenue. However, other Metro staff wereconcerned about the possibility that employees not using theirsubsidized passes could give them to others who would other-wise pay the full retail price, thereby decreasing Metro’stotal revenue. In 1993, Metro’s management authorized a20-employer demonstration of the new FlexPass.
FlexPass was designed to provide annual transit passes to allemployees at a participating company at a deeply discountedfixed cost. Metro began by conducting a survey at each partic-ipating employer to determine the number of transit-ridingemployees at the company. Metro would then use the follow-ing formula to determine the company’s initial FlexPass cost:
Annual FlexPass price = Current bus riders × Average system fare (annualized)
Because Metro fares are based on zones and time of day, thesystem fare was calculated as a weighted average of the costper ride and therefore took into account these differentials. Theprice calculated in this way would entitle the company topasses for all of its employees, regardless of company size.
Metro planned to increase the price annually to reflectincreased ridership. In order to determine the revised price,Metro surveyed the employees at the demonstration sitestoward the end of the first year. To the surprise of many, thesurvey indicated that employees’ transit use increased by anaverage of 90 percent after receiving the FlexPass. Antici-pating that the employers would not accept a price increaseof 90 percent, Metro adopted a policy of phasing in the costincrease over a four-year period; it was felt that this wouldallow the employers enough time to adjust to, and budget for,the increased cost. The final pricing policy was as follows:
• First year. Employer pays the full cost (as explainedabove) of pre-FlexPass transit ridership by its employ-ees, minus an incentive (usually 10 percent of the price)provided by federal grant money.
• Second year. Employer pays the first year price plusone-third of the entire increase in price associated withnew transit rides.
• Third year. Employer pays the first year price plus two-thirds of the entire increase in price associated with newtransit rides.
• Fourth and all subsequent year(s). Employer pays thefull price associated with employees’ actual ridership.
This pricing structure has resulted in a 95 percent renewalrate for FlexPass. In addition to companies being given enoughtime to budget for the program, Metro also attributed the highrenewal rate to the fact that, by the fourth year, employees

viewed the FlexPass as an important benefit. Therefore,employers did not want to upset their employees by elimi-nating the program. Moreover, the annual surveys allowedcompanies to keep track of usage, so that they could reeval-uate parking supply and other transportation-related issues.In this way, companies were able to better quantify theadvantages of participating in the FlexPass program.
Initially, FlexPass differed from U-PASS in two majorways. First, the program focused on increasing ridership onexisting services rather than incorporating new subsidizedbus service. Second, the program did not include any otherelements to decrease SOV use, such as increased parkingprices. Over the next several years, however, Metro experi-mented with offering a variety of services and products, includ-ing vanpool and carpool matching, Home Free Guarantee—a guaranteed ride home benefit for transit, carpool, andvanpool riders—and Commuter Bonus Plus—vouchers tosubsidize the cost of vanpools, carpools, and alternativemodes of travel (e.g., the cost of walking shoes or a bicycleat a recreational equipment store). These services and prod-ucts were offered both separately and in combination with FlexPass, depending on the needs of each individual employer.Metro generally subsidized employers’ first year’s cost, usinga combination of ISTEA funds and a small allocation ofMetro’s operating funds.
As FlexPass and the other options grew, administration ofthese programs became a significant burden, especially sinceeach employer had a customized agreement with the specificcombination of service and products that it felt useful. Fur-thermore, small employers were generally excluded from theprogram since they did not have the resources available tohandle the employee surveys necessary to calculate the annualFlexPass price. (Large employers were required by state lawto conduct a survey on commute modes which could be usedto calculate the annual FlexPass price.) The result was thatMetro began experimenting with a new program designed toestablish a less complex combination of services and pricefor employers with between 25 and 499 employees; this pro-gram became the Area FlexPass.
The goals of the Area FlexPass are the following:
• Increase ridership and revenues to King County Metroand Sound Transit.
• Simplify the FlexPass concept for internal and externalcustomers.
• Integrate transit, vanpool, Home Free Guarantee, andCommuter Bonus Plus into a per-employee pass price.
• Reduce staff time requirements for the program.
The most recent pricing guidelines for the Area FlexPassare the following:
• The Metro service area is divided into 10 pricing areas.• Separate prices are set for new companies and ongoing
(or prior) participants based on the average HOV usewithin each group in each pricing area.
119
• Employers are charged for 50 percent of the growth intrips over two years.
• After two years, new employers are moved to the par-ticipant group.
• The state Commute Trip Reduction survey and vanpoolridership data will be used to update prices.
• Employers receive a discount of one-twelfth of the costof the annual pass, matching the discount provided bythe retail annual pass.
Another variant on the FlexPass is the Downtown Seat-tle Access Project, designed to help alleviate access issuesfor downtown employers, employees, and building man-agers. Under this project, Metro teamed with the Down-town Seattle Association to extend trip reduction options tothe smaller employers in downtown Seattle, including sell-ing transit passes. Metro also cooperated with building man-agers to develop building-wide trip reduction initiatives.
One element aiding the success of FlexPass is that, in 1990,King County was on the edge of being required to implementsteps under the Clean Air Act to improve air quality. Inresponse, the state in 1991 passed the Commute Trip Reduc-tion Act, requiring employers with more than 100 employeesin the state’s largest counties to survey employees regardingcommute habits and strive to reduce SOV commuting. In1995, the state added a carrot to this stick—employers wouldreceive a tax credit of 50 percent of their commute trip reduc-tion expenses, up to $60 per year per employee and a totalcap of $100,000 per year. Public and nonprofit employerscould receive a grant in place of the tax credit. The State ofWashington ruled that implementing a FlexPass compliedwith the Commute Trip Reduction Act and that the cost ofthe FlexPass program qualified for the tax credit. The taxcredit was eliminated in 2000 due to Washington State’sfiscal crisis.
RESULTS AND IMPACTS OF FARE INITIATIVES
U-PASS Program
Ridership and Revenue Impacts and CustomerBenefits
The U-PASS has made transit and other HOV use moreaffordable and convenient for students, faculty, and staff at theUW. In the first year of operation, more than 70 percent of stu-dents and employees participated in the program. SOV use bystudents dropped from 25 percent to 14 percent, while totalSOV access to the UW dropped from 33 percent to 23 percent.Transit commuting by students rose from 21 percent to 35 per-cent, while total transit commuting increased from 21 percentto 33 percent. Even with an increased number of students andstaff on campus, parking utilization had decreased. By thethird year of the program, total campus transit ridership hadgrown 60 percent.

The U-PASS program has now been in existence for overten years. During this period, the total number of faculty,staff, and students who work or attend classes has grown by19 percent (although because of telecommuting and sched-ule changes the daily population of campus has only grownby 16 percent). There are currently approximately 37,400students and 23,500 faculty/staff at the UW Seattle campus.U-PASS prices have grown significantly, increasing from $20per quarter for students in 1991 to $33 per quarter in 2001; theprice for a faculty or staff member is $46.50 per quarter.Despite the price increase, participation in the U-PASS pro-gram has also grown, reaching a record high of 86 percentin the 2000–2001 school year. SOV commuting has grownslightly since the first few years of the program, with studentSOV commuting having risen to 16 percent and overall SOVcommuting having risen to 25 percent, which is still signifi-cantly lower than prior to the implementation of U-PASS.Student commuting by transit has remained fairly constant at35 percent; however, total commuting by transit has fallen to31 percent—again still significantly above the level prior tothe U-PASS.
Total U-PASS transit ridership is now approximately 8.5million, compared with 4.7 million transit trips to the UWprior to the U-PASS. Approximately 10 percent of all transitrides provided by Metro and Community Transit are U-PASStrips. The overall revenue impact of U-PASS has been posi-tive. The UW currently pays Metro $9.6 million per year forU-PASSes and additional service to UW campuses. In com-parison, Metro received less than $5 million in revenue fromthe university and students prior to U-PASS. Metro’s costshave increased with additional service to campus, but its rev-enue recovery rate for these services is comparable with itssystemwide average.
The U-PASS program has high levels of support on cam-pus. In surveys conducted in 1996, 1998, and 2000, between63 percent and 65 percent of respondents stated that they were“very satisfied” with the program. An additional roughly 25percent of respondents were “satisfied” with the program.
Administrative Impacts and Issues
The administration of the U-PASS program is conductedpredominantly by the UW; therefore, there is little adminis-trative impact on Metro. With 10 percent of Metro’s ridespaid for with the U-PASS, farebox wear and revenue collec-tion costs are believed to be slightly lower than if U-PASSdid not exist. A similar minor positive impact is believed toexist with regard to the speed of boarding and disembarkingon the routes serving the UW.
The U-PASS is also believed to contribute to Metro’s gen-erally high approval rates. Previous U-PASS users are believedto retain a good opinion of Metro, and the sight of full busesserving the UW helps to demonstrate to nonriders that Metrois successful at providing a public benefit.
120
Impact on the University of Washington
Largely due to U-PASS and the related transit serviceimprovements, the UW has been able to maintain a constantnumber of parking spaces despite significantly increasing thepopulation of the campus and the average number of dailytrips to the campus. The UW’s total program cost, includingpayments to transit agencies for the U-PASSes, was $10.9million in FY 2001–2002. Approximately 47 percent of thisis paid for from user fees (payments from students, faculty,and staff), and another 41 percent is paid for by the increasein the cost of parking permits and daily parking implementedwith and after the start of U-PASS. Only 12 percent of thecost of the program, approximately $1.3 million per year,comes from other UW sources. This compares with the up to$100 million it would have cost the UW to provide sufficientparking without the U-PASS.
FlexPass Program
Ridership and Revenue Impacts and CustomerBenefits
Information on the number of employers, FlexPass riders,and transit revenue is summarized in Table CS5-1. Ridershipand revenue are both divided between base and new, withbase representing the previous year’s trips among both par-ticipating and nonparticipating companies and new repre-senting the new revenue and ridership generated each year bythe FlexPass.
By 1999, over 80,000 employees were covered by theFlexPass program. Employee transit use increases over 90percent, on average, in the first year of FlexPass. In addition,over 2,300 vanpool riders receive an employer subsidy viatheir Flex Pass.
For employees, the FlexPass has resulted in a dramaticreduction in the cost of commuting. Only 10 percent ofemployers offering a FlexPass require the employee to con-tribute to the cost of the FlexPass, and these employers cannotcharge the employee more than 50 percent of the employer’scost per pass.
For Metro, the FlexPass has resulted in significant newridership and revenue, predominantly accommodated by exist-ing capacity and regular service increases.
Administrative Impacts and Issues
Administration of the entire Commute Partnership Pro-gram, which includes FlexPass, currently costs Metro approx-imately $1.4 million per year, 45 percent of which is paid forby federal grants. Costs have not been specifically allocatedbetween FlexPass and other products. However, the intro-duction of the Area FlexPass is anticipated to reduce the costof administering FlexPass significantly.

CONCLUSIONS AND LESSONS LEARNED
Customer Impacts and Benefits
U-PASS and FlexPass appear to have significantly bene-fited Metro’s riders at the participating sites, as follows:
• Provided more convenient fare payment, utilizing stu-dent or employee IDs valid for one year (FlexPass) orone quarter (student U-PASS).
• Reduced the cost of travel for many riders (both Flex-Pass and U-PASS are deeply discounted when sold tothe employer or University, and employees pay no morethan 50 percent of the employer’s cost of the pass).
• Reduced commute costs for carpool and vanpool riders.• Increased service to the UW and, therefore, the conve-
nience of riding transit.
Surveys of UW students, faculty, and staff have shown con-sistently high satisfaction with the U-PASS, which is reflectedin the increased participation in the program and increaseduse of transit serving the UW.
Agency Impacts and Benefits
The U-PASS and FlexPass have also had a generally pos-itive impact on Metro, including the following:
• Significant increases in both ridership and revenue.• Reduced use of cash and fare collection costs, by con-
verting riders to these fare instruments in place of cashand tickets.
• Possibly improved service reliability through theincreased use of passes (compared with payment withcash and tickets).
Impacts and Benefits for Partner Entities
Metro’s U-PASS program has benefited the UW as follows:
121
• Allows UW to provide its students unlimited use oftransit service at a deeply discounted price.
• Reduces UW’s need for parking, greatly reducing theneed to build additional expensive parking spaces.
The FlexPass program impacts and benefits for employerswere as follows:
• Helps them address Commute Trip Regulation require-ments.
• Facilitates distribution of commute benefits to employeesat a lower administrative cost than in a regular monthlypass program—because it is an annual program.
• Encourages employees to use commute alternatives todriving alone and, therefore, may allow employers toreduce the amount of parking required.
Liability to Agency
Both U-PASS and FlexPass were carefully designed toeliminate the risk of losing revenue from the specific cus-tomer being dealt with, although there was still the potentialof lost revenue from fraud (e.g., sharing of passes). Use ofstudent and employee IDs helps to reduce the risk of fraud,and Metro has not noticed any significant fraud associatedwith either of these projects.
The new Area FlexPass, however, involves a higher riskof revenue loss than the original FlexPass program. The pric-ing of the Area FlexPass is based on average transit use in aspecific area. Those companies that have the most transitsupportive policies, and consequently the highest transit use,may be the most likely to adopt the Area FlexPass. Sincethose companies’ transit use is above average, their cost forthe Area FlexPass would be below the current amount they,and their employees, pay, resulting in a net loss of revenuefor Metro. This will need to be monitored as Area FlexPassexpands.
FlexPass has given rise to some equity concerns, since it isfocused on serving large employers. The Area FlexPass pro-gram is designed to alleviate that concern. Of course, the Area
TABLE CS5-1 FlexPass ridership and revenue impacts
Year
Employers
Base Revenue (dollars)
New Revenue (dollars)
Base Ridership
New Ridership
1994 3 $49,173 $24,351 23,640 23,191 1995 7 $60,326 $13,342 45,183 37,526 1996 16 $550,614 $24,827 502,082 45,929 1997 32 $1,317,412 $184,016 1,056,148 466,456 1998 63 $2,928,112 $462,388 2,302,221 653,303 1999 104 $5,024,324 $1,069,637 3,417,749 924,522 2000 122 $5,128,711 $650,978 4,486,118 825,410
FlexPass is also believed to contribute to Metro’s generally high approval rates. Metro receivesvirtually no complaints regarding the program and does receive a significant number of requestsfor additional service to FlexPass employers.

FlexPass gives rise to its own equity concern, since prices forthe pass can be significantly different on opposite sides ofwhat is, in many cases, an arbitrary service area boundary.
Constraints and Barriers
The establishment of the U-PASS and FlexPass programshas involved development of agreements among Metro, otherregional transit agencies, and the UW or other employers. Forthe FlexPass, the need to negotiate separate agreements witheach employer ultimately limited the size of the program, aswell as the size of the firms that could participate.
For both the U-PASS and the FlexPass programs, actionsby the City of Seattle, King County, and the State of Wash-ington to reduce SOV commuting significantly assisted in theimplementation of the programs. Metro was able to promotethese programs as ways of addressing requirements imposedby these other governmental entities, assisting the UW andthe employers rather than trying to sell them solely on thebenefits of promoting transit use.
Required Equipment and Technology
No special equipment or technology was required for eitherprogram.
Lessons Learned
Finally, key lessons learned from the case study includethe following:
• University pass arrangements can result in significantincreases in ridership and revenue, as well as generalgoodwill toward an agency. However, it is importantthat the agency take steps to protect itself against losingrevenue through these programs. In particular, the rider-ship generated by a university pass can result in the needfor a significant increase in service, and an agency shouldtake steps to insure that revenue increases with theincrease in service (e.g., by cost-sharing provisions orincreases in the university pass pricing).
• Increases in parking pricing can contribute to the suc-cess of the university pass. Providing discounted park-ing for occasional trips by U-PASS users, providing latenight service and allowing pass users to surrender thepass and get back their parking permit are all steps that
122
can relieve concerns associated with obtaining the uni-versity pass and increase the willingness of individualsto try the pass.
• In establishing an annual employer pass program, suchas the FlexPass, agencies need to protect themselvesagainst losing revenue and should insure that they cancapture at least some revenue from the new trips beinggenerated. The dramatic increase in ridership that canresult from these programs means that phasing in costincreases tied to ridership should be considered.
• In designing employer programs, a trade-off needs to beestablished between the ability to customize offeringsfor each employer (thereby facilitating sales) and theprovision of uniform product offerings at a lower admin-istrative cost for the agency. Metro chose to begin witha highly customized program for large companies andrecently implemented a uniform product, at uniformpricing, for smaller companies. While the customizedprogram has been highly successful, the success of thenew program remains to be seen.
CASE STUDY CONTACTS AND SOURCES
The following individual was interviewed at Metro head-quarters as part of this case study:
Matt Hansen, Market Development PlannerMetro Transit DivisionDepartment of Transportation400 Yesler WaySeattle, WA 98104-2615206-263-3598206-684-2058 (Fax)[email protected]
The following documents (in addition to ridership and rev-enue summaries and other sales and operational data, con-tracts, and pricing guidelines) were used in preparing thecase study:
The Gilmore Research Group, The U-PASS Telephone Sur-vey. Prepared for the King County Department of Trans-portation and the University of Washington, January 2001.
University of Washington. U-PASS Annual Report 2000–2001.Serena Dolly, Commute Partnerships. A case study prepared
for the University of Washington’s Daniel J. Evans Schoolof Public Affairs.

123
CASE STUDY 6
MARYLAND MASS TRANSIT ADMINISTRATION
INTRODUCTION
The Maryland Mass Transit Administration (MTA) is anagency of the Maryland Department of Transportation. TheMTA operates transit services throughout the State of Mary-land, with most of its service concentrated in the Baltimoremetropolitan area. MTA services consist of five modes:fixed-route Bus (Local and Commuter), heavy rail (Metro),light rail (MTA Light Rail), commuter rail (MARC), andparatransit.
MTA’s core services include Bus, Metro, and Light Rail.Together these modes account for nearly 95 percent ofMTA’s systemwide ridership, which is approximately 100million passengers annually. In FY 2001, MTA carried 71million passengers by Bus, 14 million by Metro, and 9 mil-lion by Light Rail. MARC Commuter Rail ridership for thesame period was nearly 6 million passengers. MTA’s para-transit service carries a little more than 650,000 patronsannually.
This case study focuses on two fare initiatives:
• Fare simplification attained through the elimination ofzones and transfers and the introduction of the day pass.The initiative was implemented in 1996.
• Regional fare integration through the implementationof a smart card technology. This has yet to be fullyimplemented.
The implementation issues and impacts of these fare ini-tiatives are further described below.
DEVELOPMENT AND IMPLEMENTATION OFFARE INITIATIVES
Fare Simplification
In the years prior to 1996, MTA’s ridership and revenuehad decreased. Since MTA is required to recover 50 percentof its operating costs through fare revenues, this situationhad become problematic. Rather than simply institute a fareincrease, MTA reevaluated its entire fare structure and farepolicy. Prior to 1996, MTA’s fare structure had slowly evolvedover the course of more than 100 years in response to numer-ous pressures and constraints (11). As a result, MTA’s farestructure had become very complex, making it confusing forpatrons to understand and difficult for employees to enforce.
To correct these problems, MTA launched a market researcheffort involving both its patrons and members of its staff. Theobjective of the research effort was to develop an under-standing of the best and worst attributes of MTA’s fare sys-tem (11). The results of the research were as follows (11).
MTA’s customers responded positively to the followingfare system components:
• Weekly and monthly passes• Fare payment options• Fare payment locations• Flat fare on Light Rail
The fare system components that customers did not likeincluded:
• Zone fares (complex, too many)• Transfers confusing• No integration between MARC/WMATA• Evasion perceived high
In response to the research results, MTA considered manydifferent fare structure options, including different zone con-figurations, premium fares for different types of services(e.g., commuter and express bus) and different times of theday, flat fares, various discounts, different prepayment optionsand different transfer options. Each individual alternative wasassessed based on its ability to support MTA’s ridership and
Fare Program/Initiatives
Fare Simplification: elimination of zones and transfers and introduction of Day PassesRegional Fare Integration: implementation of integrated smart card technology

revenue goals and its 50 percent recovery ratio requirement.Based on the findings of the analysis, the following changesto MTA’s fare structure were made:
• The five zones in MTA’s core service area were elim-inated.
• Transfers were eliminated.• A day pass was implemented.
These changes were implemented in March 1996. In con-junction with the fare simplification, MTA also reduced ser-vice by 4 percent (11). Although other changes were alsoimplemented as a result of the fare simplification—reductionof the monthly pass discount, increase in Commuter Bus andMARC fares, and increase in the discount for senior and dis-abled patrons—these changes were minor compared to thethree that are the focus of the case study.
Regional Fare Integration
MTA’s service area overlaps with that of numerous otheroperators. As a result, MTA’s services interface with many ofthese other transit systems. The largest of these is the Wash-ington Metropolitan Area Transit Authority (WMATA), whichoperates the Washington, D.C., area’s Metrorail and Metro-bus services. MTA’s Commuter Bus service and MARC Com-muter Rail service provide service to Washington, D.C. Assuch, there are many opportunities for MTA passengers to takeadvantage of WMATA’s Metrobus and Metrorail services. Inaddition to WMATA’s services, MTA also interfaces with anumber of other transit providers in the Baltimore-Washingtonregion. Table CS6-1 lists the various operators that have con-nections with MTA services.
In December 2000, the State of Maryland published theMaryland Comprehensive Transit Plan (MCTP). The goal ofthe MCTP is to double ridership by 2020. Towards this end,the MCTP developed numerous recommendations, which are
124
organized according to “Nine Themes for Success,” includingregional integration and coordination of transit services.Among the recommendations for promoting regional integra-tion were two related to a “unified fare collection system” (12).These were:
• Initiate a “Smart Card” unified fare collection system bycompleting the purchase and beginning the installationof smart card readers on MTA, WMATA, and otherselected local transit system vehicles in the Baltimore-Washington region.
• Expand the smart card program statewide, includingcommuter bus and rail services.
The MTA has subsequently undertaken three projects thatare designed to make a regional smart card fare collectionsystem a reality. Two of these projects are joint procurementswith WMATA:
• Regional Bus Fare Collection System. This is a jointprocurement involving MTA and WMATA. The vendor,Cubic Transportation Systems, is providing a commonvalidating farebox with smart card capabilities, as well asall supporting garage and central computer systems andsoftware. In addition to MTA and WMATA, many ofthe smaller Maryland and Virginia bus operators in theBaltimore-Washington-Northern Virginia region alsowill be purchasing equipment through this procurement.The Baltimore “style” of the farebox includes dual smartcard and magnetic farecard capabilities. In addition, theprocurement includes a Stand Alone Smartcard System(SASS) for MTA’s Commuter Bus operators. The SASSwill be capable of reading smart cards, but will only be able to add value through “autoload” transactions(described later in this report).
Currently, MTA is conducting the first article testing(FAT). Upon completion of the FAT, MTA will com-
TABLE CS6-1 MTA inter-operator transit connections
Operator
MTA Local Bus
MTA Commuter
Bus
MTA Metro
MTA Light Rail
MARC Commuter
Rail
WMATA Metrorail ✓ ✓
WMATA Metrobus ✓ ✓ ✓ ✓
Howard Co. CTC ✓ ✓ ✓ ✓
Connect-A-Ride ✓ ✓ ✓ ✓
The Bus (P.G. County) ✓
Ride-On (Montgomery Co.) ✓ ✓
PRTC-Omniride ✓
Annapolis Transit ✓ ✓
Harford Co. Transp. Services ✓
Frederick Transit ✓ ✓Virginia Railway Express ✓

mence in-service quality testing (ISQT). ISQT is expectedto last approximately 3 months. Following ISQT, MTAwill begin installing the new fareboxes on its entire fleet.Once the installation on its own system is complete,MTA will begin assisting the Maryland locally operatedtransit systems with the installation of the new equip-ment on their systems.
• Smart Card AFC System. This project involves onlyMTA. MTA is procuring the necessary equipment tooutfit its rail modes (Metro, Light Rail and MARC Com-muter Rail) with smart card capabilities. – Metro. All of Metro’s TVMs and faregate arrays will
be replaced. The TVMs will issue magnetic fare cardsand allow smart card loading. The TVMs will acceptcoins, cash, credit cards, and debit cards as payment.The faregates will be outfitted with both smart cardand magnetic read-write units.
– Light Rail. All Light Rail TVMs will be replaced.The TVMs will issue magnetic fare cards and allowsmart card loading. The TVMs will accept coins, cash,credit cards, and debit cards as payment. While inspec-tion of fare cards on Light Rail will still be done visu-ally, inspectors will have Hand Held Units (HHUs) toread and validate smart cards.
– MARC. Rather than TVMs, MARC station platformswill be outfitted with smart card only Express RechargeMachines (ERMs). The ERMs will allow patrons toadd value to their smart cards using credit cards ordebit cards or through an autoload transaction. ERMswill not accommodate cash transactions. MARC con-ductors will be issued HHUs to inspect and validatesmart cards onboard.This project also includes the necessary computer
systems to integrate all of MTA’s modes.• Regional Customer Service Center. WMATA is
spearheading the effort to establish the Regional Cus-tomer Service Center (RCSC). Once fully implemented,the RCSC will provide the following services to theBaltimore-Washington region:– Customer Service Center to respond to customer ques-
tions, complaints and disputes, as well as setting upaccount information and processing smart card regis-trations and special transactions.
– Clearing, settlement and financial management func-tions in order to process smart card transactions and
125
move funds to the appropriate participants in theregional smart card program.
– Establishing a point-of-sale network to distribute smartcards and provide locations where patrons can loadvalue.In January 2003, WMATA selected the ERG Group
to install and operate the RCSC. ERG plans to use itsexisting central computer system, installed in the SanFrancisco Bay Area to support the TransLink project, toperform the clearing, settlement and financial manage-ment functions for the Washington-Baltimore region.Local smart card management, distribution and cus-tomer service will be performed by ERG’s subcontractor,Northrup-Grumman IT.
Once the bus farebox, AFC system, and RCSC projects arecomplete, the entire system will enable passengers to trans-fer seamlessly among any of the participating operators in theBaltimore-Washington-Northern Virginia region.
RESULTS AND IMPACTS OF FARE INITIATIVES
Fare Simplification
Customer Impacts and Benefits
One of the immediate benefits of the fare simplification fora number of MTA’s patrons was reduction in their base fare.As shown in Table CS6-2, passengers in outlying zones sawa reduction in their base fare of as much as 40 percent. Pas-sengers in Zone 2 experienced no change and passengers inZone 1 experienced a modest increase.
The second immediate benefit to customers was the intro-duction of the Day Pass. With the elimination of the 10¢transfer, the Day Pass provided passengers a means to meettheir travel needs where a linked trip was involved. Priced at$3.00, the Day Pass permitted unlimited travel and was notrestricted to any time period (e.g., off-peak only). As shownin Table CS6-3, for many passengers the Day Pass proved tobe more economical than their fares had been under the pre-vious fare structure.
One of the unforeseen impacts of the introduction of theDay Pass was the increased truancy among students thatresulted (11). Prior to the fare simplification effort, studentswere issued serialized tickets by the Board of Education.
TABLE CS6-2 Comparison of base fare before and after simplification
Old Zone Previous Fare
(dollars) New Fare (dollars)
Percent Change
1 1.25 1.35 8.0 2 1.35 1.35 0.0 3 1.55 1.35 -12.9 4 1.85 1.35 -27.0 5 2.25 1.35 -40.0

MTA accounted for all tickets used and billed the Board ofEducation for the trips taken. After the fare simplification, astudent Day Pass was implemented in addition to the Adultand Senior/Disabled Day Passes. However, it soon becameapparent that the students were abusing the pass privileges.
In order to solve this problem, MTA discontinued theSchool Pass and Student Tickets were reintroduced. Toaccommodate students requiring a linked trip, MTA intro-duced a “Continuation Pass,” which permitted additionaltravel for 60 minutes after issuance.
Agency Impacts and Benefits
The most significant operational impact of the fare simpli-fication was the introduction of the Day Pass. The issuesassociated with the new ticket type were how it would beissued and used on each of MTA’s core service modes (i.e.,Bus, Metro and Light Rail). The strategies pursued for eachmode were as follows:
• Bus. At first, MTA planned to give operators books ofDay Passes to be sold on board. However, bus operatorswere concerned with risks associated with handlingwhat was perceived to be a valuable commodity, thusmaking them targets for robbery (11). MTA solved theproblem by purchasing Almex machines, which consistof a control panel connected to a thermal printer. Thesewere installed onto the bus fareboxes. A passenger wish-ing to purchase a Day Pass would insert cash into thefarebox and the operator would then issue the pass usingthe Almex machine. These machines are also used toissue Continuation Passes to students. On subsequent
126
trips, the Day Pass or Continuation Pass holder simplyflashes the pass on boarding.
• Metro. The Almex machines (and fareboxes) were alsoinstalled at the station attendants’ booths at each Metrostation. These worked the same as on the buses; how-ever, the station attendant would also issue a pre-encodedmagnetic “Exit Ticket” so that patrons could exit thesystem at their destinations. This procedure is necessarysince the Day Pass issued by the Almex machines doesnot have a magnetic stripe and is unusable at the Metroturnstiles.
• Light Rail. Since the TVMs were easily reconfigured toissue Day Passes, Light Rail did not pose as much of achallenge as the other two modes. Day Passes issued atLight Rail TVMs are also non-magnetic and must be usedas flash passes. Passengers using these passes on Bus andMetro follow the same procedures as passengers usingthe Almex-issued Day Passes.
Several operational improvements were identified as aresult of the fare simplification. It was noted, for instance,that fare disputes between patrons and operators decreased,boarding times improved (especially in the evening peak)and ridership increased in the off-peak periods (11).
A comparison of ridership before and after the fare sim-plification effort is shown in Table CS6-4. The time periodsused are roughly 6 months before the simplification (October1995) and 6 months after (October 1996). Overall ridershipincreased by more than 6 percent, with the largest percentageincrease occurring on Metro. This increased level of rider-ship has generally been sustained. Between FY1997 andFY2000, MTA’s core service ridership increased approxi-mately 11 percent, from 98 to 109 million.
TABLE CS6-3 Comparison of day pass to previous fare for linked roundtrip
Old Zone Previous Fare
(dollars) Day Pass (dollars)
Percent Change
1 2.70 3.00 11.1 2 2.90 3.00 3.4 3 3.30 3.00 -9.1 4 3.90 3.00 -23.1 5 4.70 3.00 -36.2
NOTE: Previous fare includes two one-way fares and two transfers.
TABLE CS6-4 Ridership by mode, before and after fare simplification
Mode October 1995 October 1996 Percent Change
Bus 6,634,891 6,957,215 4.9 percent
Metro 1,013,774 1,176,864 16.1 percent
Light Rail 516,653 549,687 6.4 percent
Total 8,165,318 8,683,766 6.3 percent
SOURCE: MTA Finance Division, Monthly Revenue and Passenger Statistics.

A comparison of fare revenue collected before and after thefare simplification effort is shown in Figure CS6-1. This com-parison shows a significant reduction in the amount of cashfare revenue. In October 1995 cash fare revenue accounted for52 percent of fare revenues collected, while in October 1996,cash fares accounted for 27 percent of revenue.
At first glance, this may appear to have had the desirableeffect of reducing the amount of cash handled. Consideringthat the majority of MTA passengers are bus riders, this seem-ing reduction in cash riders would have the double benefit ofreducing fare collection costs as well as reducing boardingtimes. However, since the Day Pass is sold onboard and thecash is collected via the farebox, the amount of cash handledthrough the farebox would remain virtually unchanged. Asshown in Figure CS6-1, the share of fare revenue attributedto cash in October 1995 (52 percent) is roughly equivalent tothe share of cash and Day Pass revenue combined in October1996 (56 percent). However, this explains the reduction inevening boarding times, since many transactions (i.e., DayPass purchases) are concentrated in the morning peak.
All other categories of fare revenue showed little changefollowing the fare simplification. Token revenue remainedthe same, while Weekly and Monthly Passes exhibited slightdecreases.
Overall, MTA’s fare simplification did have the desiredeffect of increasing fare revenues. As shown in Table CS6-5,total revenue increased by more than 12 percent, with thelargest gains occurring on Metro. As a result, in the yearsimmediately following the fare simplification MTA revenueswere sufficient to meet the state-mandated fare box recovery
127
ratio (11). Since 1996, passenger fares have remained steady.Between FY1997 and FY2000, systemwide passenger rev-enue changed less than 1 percent, from $72.8 million inFY1997 to $72.7 million in FY2000. The apparent discon-nect between the growth in ridership and the lack of growthin revenue since the fare simplification appears to be largelythe result of the heavy use of Day Passes throughout theMTA’s core services.
Regional Fare Integration
Customer Impacts and Benefits
Although MTA has not yet implemented the regionalsmart card system, there are a number of features associatedwith the use of smart cards that can be expected to benefitcustomers. Key potential benefits include the following:
• Ability to restore the card’s remaining value if thecard is lost or stolen. This will require customers toregister their cards with the MTA.
• Ease of use. The contactless technology allows for eas-ier and faster access to the system at fare gates, particu-larly for many passengers with disabilities.
• Multiple payment options and seamless travel. Thetechnology has the capability to accommodate multiplepayment options (as well as multiple modes and opera-tors). Since the smart cards will be used throughout theBaltimore-Washington-Northern Virginia region, they
October 1996
Cash Fare27%
Monthly13%Weekly
17%
Day Pass29%
Tokens2%
Other12%
SOURCE: MTA Finance Division, Monthly Revenue and Passenger Statistics.
October 1995
Cash Fare52%
Monthly15%
Weekly18%
Tokens2%
Other13%
Figure CS6-1. Comparison of fare revenue by category, October 1995 and 1996.
TABLE CS6-5 Comparison of revenue by mode, October 1995 and 1996
Category October 1995
(dollars) October 1996
(dollars) Percent Change
Bus 4,960,873 5,533,654 11.5
Metro 789,447 936,058 18.6
Light Rail 386,299 437,212 13.2
Total 6,136,619 6,906,924 12.6
SOURCE: MTA Finance Division, Monthly Revenue and Passenger Statistics.

will have the ability to store more than one type of fareproduct. For example, a MARC patron with a smart cardmonthly pass may wish to add a WMATA stored valueapplication to the smart card. As such, the patron wouldonly need one card to use many different services. (AMARC monthly pass currently permits passengers unlim-ited rides for the calendar month on MTA Bus, Metroand Light Rail.) When the card is used on each system,the fare collection equipment will identify its own fareproduct if loaded on the card.
• Autoload Functionality. This feature enables a smartcard user to have value automatically loaded on to the cardfrom virtually any fare collection system component (i.e.,fareboxes, faregates, TVMs, and point-of-sale devices).The types of autoload envisioned include the following:– Commuter Benefits. Employees receiving a qualified
transit benefit could arrange with the employers tohave these benefits loaded onto their smart cards atthe start of each month.
– Minimum Value Replenishment. Smart card userscould establish an account tied to their credit cards orbank accounts that would automatically load a prede-termined value when the user reached a minimumthreshold.
– Directed Load. Smart card users could purchase valuevia the phone or Internet using their credit or debitcards. The value would then be added the next time thepatron boarded a bus or used a faregate or TVM.
The smart card technology also offers the opportunity tointroduce innovative fare structure and payment options. Forinstance, MTA is considering the following strategy:
• “Best Fare” Strategy. This option would enable asmart card user to enjoy the benefits of an unlimited ridepass without buying a pass. A counter on the card keepstrack of each card’s use within a certain time period, andthe fare system is programmed so that the rider pays thelowest possible fare, based on usage. For instance, oncea cardholder has taken a certain minimum number ofrides during a day, the card is automatically treated likean unlimited use day pass, and all subsequent rides thatday become free. Even at this point, however, rides con-tinue to be tracked; thus, if the cardholder uses the card asufficient number of times in a 7-day period, the cardbecomes treated like a weekly pass (and subsequently atwo-week pass) The flexibility of the software furtherpermits the Best Fare to be implemented on either a cal-endar or a rolling period basis. Moreover, future policiesand interagency agreements could even extend the BestFare practices to include multiple operators. Best Farecould attract new riders, as it essentially guarantees that arider will pay the lowest possible fare for a particular trip.
Unlike the new WMATA fareboxes, the new MTA fare-boxes will include both a Smart Card Processing Unit with
128
the ability to read and write to contactless smart cards and aMagnetic Card Processing Unit with the ability to read, write,and issue magnetic fare cards (ISO size). This will permit theagency to consider offering the following capabilities, nei-ther of which will be feasible on WMATA’s buses:
• Credit card acceptance. MTA would have the optionto accept credit card payment onboard.
• “Change card” issuance. The farebox has a change cardcapability, which is a magnetic stored value card thatcan be issued to a passenger in lieu of change, thus elim-inating the need for passengers to have exact fare.
Among the possible negative impacts facing customers arethe following:
• Privacy concerns. There could be concerns amongsome customers regarding the registration of cards withthe agency. However, this has deterred very few Smar-Trip card purchasers at WMATA. Privacy concerns haveapparently not been an issue with customers; WMATAhas established a very strict privacy policy, promisingits SmarTrip customers that their personal informationwill never be sold or released to a third party. As aresult, more than 98 percent of all SmarTrip customerschoose to register their cards.
• Plan to charge $5 for initial purchase of smart card.MTA plans on transferring some of the cost of the smartcards to its passengers by having them purchase theircards. Currently, the plan is to charge $5 per card, as isdone in the current WMATA SmarTrip system. Prelim-inary MTA focus groups have indicated that passengersare willing to pay this fee, although the presumption ofthese passengers is that the smart cards will provide themwith a better value than other fare media. As is the casewith SmarTrip on Metrorail, MTA passengers will havea choice to use magnetic farecards and will presumablyreceive at least some of the benefits that will be providedwith smart cards. (In contrast, WMATA is not providinga magnetic option on its bus system.) However, the con-cern that passengers will have to purchase the $5 smartcard in order to take advantage of most of the aforemen-tioned benefits could lead to equity-related complaintsfrom lower-income passengers or, more likely, fromorganizations representing these riders. It will clearly beimportant that MTA conduct an effective marketing cam-paign, educating passengers as to the nature of the bene-fits of buying the card (e.g., registration and replacementof value).
Operational and Administrative Impacts andBenefits
One of the main benefits that MTA expects to derive fromimplementing the regional smart card program is the flexi-

bility and opportunities that the technology provides. Besidesthe ability to provide seamless connections to other operatorsin the region, these opportunities include, for instance, the BestFare strategy or the ability to develop an automated commutertransit benefit program (i.e., like WMATA’s SmartBenefits).
Operationally, use of contactless smart cards allows fasterpayment than other media. Reduced maintenance costs aregenerally considered another key benefit of contactless smartcard technology due to their having fewer moving parts sincetransports and thermal printers are not needed. However,MTA has not estimated the operating and maintenance costimpacts of the new program as yet. Indeed, as is the case withWMATA, MTA sees smart cards and regional integration asa way to provide improved customer convenience via a flex-ible state-of-the-art technology rather than as a means ofreducing operating costs.
Meanwhile, depending on the fare policy and pricingchanges MTA implements, there could potentially be nega-tive revenue impacts. In particular, the Best Fare strategyunder consideration could well have a negative impact on farerevenue—though it should also result in some increase inridership. The strategy essentially converts rides that wouldotherwise have been paid for (i.e., from stored value) to freerides (i.e., once the rider has exceeded the threshold usagelevel to turn the card into a pass). The extent of revenue loss,if any, will depend on the exact structure and pricing of theprogram (e.g., number of rides needed to reach certain passlevels, pass break-even levels) and the number of riders usingBest Fare versus purchasing passes from the outset. MTA hasnot yet analyzed the revenue impacts of different smart card-based pricing strategies.
Beyond the impacts of introducing smart cards, the imple-mentation of the regional payment system will also likelyhave a range of impacts on MTA’s operations and adminis-tration. The development of partnership agreements amongthe participants, particularly regarding the establishment ofthe Regional Customer Service Center, has been challenging.It has been necessary to resolve a range of issues in develop-ing the structure of the proposed RCSC, including overallpolicy and business rules, technical requirements, and admin-istrative and customer support functions. Moreover, even ifthe RCSC handles the bulk of the responsibilities for man-aging and supporting the regional program, MTA and theother agencies in the program may have increased internalfare collection and data reporting responsibilities.
With regard to costs, the most immediate impact on MTAwill be the capital cost associated with the new system. Thebus farebox project is estimated to cost $23.3 million for allof the equipment (i.e., fareboxes, computer systems, receivervaults, smart card readers, spare parts and warranty). Theoverall AFC system for MTA Rail is projected to cost nearly$41 million. Included in this amount are the costs of equip-ment (i.e., faregates, TVMs, computer systems, etc.), andsoftware for the various features that MTA is considering.
129
The actual cost will depend on which of these features MTAchooses to implement.
Finally, there will also be costs associated with MTA’suse of the RCSC (e.g., some type of transaction or revenue-based fee arrangement), as well as ongoing costs associatedwith maintaining the equipment and with any agency per-sonnel needs in participating in the program (including addingstaff where necessary and training operators and other sup-port staff).
CONCLUSIONS AND LESSONS LEARNED
Customer Impacts and Benefits
The MTA’s Fare Simplification effort resulted in severaltypes of benefits to MTA’s customers, including the following:
• Less confusion regarding fare payment through the elim-ination of fare zones and transfers.
• Improved convenience of fare payment with the imple-mentation of the Day Pass.
• Reduction in cost of travel for many customers throughthe elimination of fare zones and the introduction of theDay Pass.
• Greater flexibility in multivehicle and multimodal travel.• Faster boarding times in the afternoon and evening peaks.
The Regional Smart Card Program is expected to have thefollowing customer benefits and impacts:
• Improved ease of use via contactless interface.• Ability to travel seamlessly using public transit through-
out the Baltimore-Washington-Northern Virginia regionregardless of mode or operator.
• Improved flexibility through ability to carry more thanone agency’s fare medium on the card and through poten-tial for innovative fare structure and payment options(e.g., Best Fare strategy).
• Improved convenience, through (1) ability to registerthe card and restore value if card lost or stolen, (2) abil-ity to accommodate multiple payment options, and (3)autoload capability.
• Slightly higher cost to customers, given expectedrequirement to pay $5 to purchase the smart card; pas-senger acceptance of this charge remains to be deter-mined, although focus groups indicated a willingness topay; also, such a charge has been readily accepted byWMATA’s Metrorail customers.
Agency Impacts and Benefits
Generally, the impacts of the fare simplification effort onMTA were positive. The impacts and benefits to MTA includethe following:

• Reduced fare disputes between operators and customers.• Increased ridership, particularly in the off-peak periods;
overall ridership grew by more than 6 percent in the 6months following the change; among the different modes,the greatest increase was on Metro (16 percent), with 5percent on Bus and over 6 percent on Light Rail; over-all ridership has continued to grow since then.
• Increased revenue; overall system fare revenue grewby more than 12 percent in the 6 months following thechange.
• Reduced cash fare category by nearly 50 percent, but didnot really lower amount of cash collected on buses—sincemost Day Passes are purchased (with cash) onboard; shareof fare revenue attributed to cash before fare change was52 percent, and combination of cash and Day Pass afterchange was 56 percent.
• Made boardings in the downtown area easier and fasterin the afternoon and evening periods (because Day Passpurchases are concentrated in the morning peak period).
Increased ridership and efficiency in fare collection areamong the benefits that MTA and the other participants areanticipating as a result of the implementation of the RegionalSmart Card Program. Some of the other impacts and benefitsmay include the following:
• There may be improved flexibility in terms of the abilityto add new fare structure and payment options (e.g., BestFare strategy).
• While the plan is for the RCSC to maintain overall respon-sibility for managing and supporting the regional pro-gram, internal fare collection and data reporting respon-sibilities may increase since the new AFC equipmentwill be capable of storing and tracking more data thanexisting equipment.
• There may be some revenue loss if the Best Fare strategyis implemented. The extent of revenue loss will dependon the pricing of the program and the number of ridersusing Best Fare versus purchasing passes from the outset.
• The cost impacts on MTA include (1) the capital costassociated with the program (an estimated $23 millionfor all of the new bus equipment, and about $41 millionfor rail equipment); (2) fees associated with the agency’suse of the RCSC; and (3) ongoing operating and main-tenance costs, including training of personnel, hiring newpersonnel, and maintaining the equipment.
The Regional Smart Card Program is a complex undertak-ing, entailing a range of institutional, operational and finan-cial challenges. MTA and the other agencies have addressedone of the major challenges in developing a common tech-nology procurement strategy; in order for full regional inte-gration to occur, it is now necessary to complete the processof establishing the clearinghouse.
130
Impacts and Benefits for Partner Entities
The introduction of smart card technology offers the poten-tial to establish partnerships with various types of entities. Forinstance, as described in the WMATA case study, WMATAhas entered into several types of partnerships related to itsSmarTrip card; these include a bank (First Union) and a largegovernment agency (the GSA). While these pilots have beenquite limited in scope, they have demonstrated the feasibilityof establishing multiapplication card arrangements; sucharrangements offer the potential to significantly improve mar-ket penetration, for both transit riders and users of the part-ner applications.
Other key potential partners are employers. Automated ben-efits programs, along the lines of WMATA’s SmartBenefits,can benefit employers in several ways. These programs pro-vide payroll tax benefits and also provide employers con-venient means of distributing transit commuter benefits toemployees. For instance, SmartBenefits allows employers toeasily manage their benefit programs via the Internet.
Liability to Agency
The MTA risked losing revenue in the fare simplificationeffort through the elimination of the fare zones. However, asindicated above, the combination of the elimination of zoneswith the elimination of transfers and introduction of Day Passesresulted instead in a substantial revenue increase. One ongoingpotential liability noted by MTA staff is the ease with whichDay Passes can be abused. Since the Almex machine is notwired to the farebox, operators have the ability to print as manyas 15 Day Passes at one time without it registering in the fare-box. As such, fraudulent transactions would not be reflected inthe farebox reports. Although there have been cases in whichemployees have stolen Day Passes in this manner, there seemsto be no evidence that this sort of activity is rampant.
The Regional Smart Card Program carries some economicliability in terms of the potential loss of revenue associatedwith the Best Fare strategy. While any such loss is not expectedto turn out to represent a substantial percentage of the over-all system revenue, the possible impacts should be kept underconsideration if the MTA decides to pursue that strategy. Inaddition, there may be some political liability for the agencyassociated with the plan to charge an initial fee for obtaininga smart card. Since a rider will have to pay for a smart cardto take advantage of the full range of potential benefits, thispolicy could conceivably generate equity-related complaintsfrom riders or from community organizations representingriders. Hopefully, MTA will be able to avoid such complaintsby educating riders as to the benefits to be received by buy-ing the card (e.g., registration and replacement of value) and,perhaps, by providing free (or very low-cost) cards to low-income riders.

Constraints and Barriers
Before implementing the fare simplification project, MTAconducted an intensive visioning process, which includedstakeholder meetings, public outreach, and public informa-tion campaigns. By using the visioning process to develop thenew fare policies and structures, MTA minimized many of thebarriers they might otherwise have encountered in imple-menting such significant fare structure changes. As a result,both internal and external reactions have been positive.
Given the number of parties involved and the complexity ofthe necessary agreements, there are many potential constraintsand barriers related to implementation and operation of theRegional Smart Card Program. In order for the program toreach fruition, the participating entities will need to developand agree on a broad range of processes that will enable all par-ticipants to interface with each other in a seamless manner.The participants will need to make substantial changes in someof their current business practices in order to make the programwork. Among the issues that need to be resolved are thoserelated to governance (e.g., how will the regional program becontrolled and managed), cost allocation details (e.g., thenature of the participant fee structure), revenue allocation andsettlement procedures, operator reporting requirements, andoperator customer service responsibilities.
Required Equipment and Technology
Apart from the Almex Day Pass-issuing machines, MTAdid not require any additional equipment to implement the ele-ments of the fare simplification project. MTA had originallyplanned to give operators books of Day Passes to be sold onboard. However, the operators expressed concern that han-dling what was perceived to be a valuable commodity wouldmake them potential targets for robbery. MTA addressed thisconcern by installing the Almex units.
The Regional Smart Card Program will rely on a regionalstandard for fare collection equipment and smart cards. Thejoint farebox procurement will ensure that all bus operators inthe region will have a common farebox; and the rail AFCSproject will ensure that MTA’s rail equipment will be com-patible not only with the bus fareboxes but also with the exist-ing fare collection equipment in use on WMATA’s Metrorailsystem. Finally, one of the requirements of the RCSC pro-curement is to ensure that the systems associated with thecustomer service, clearing, settlement functions, and point-of-sale network are fully compatible with the fare collectionequipment deployed throughout the region.
Lessons Learned
The key lessons learned from the Maryland MTA’s faresimplification effort are as follows:
131
• A financially driven fare increase can serve as an oppor-tunity to examine existing policies and structures in orderto develop alternatives that not only meet the agency’sfinancial needs but also provide tangible benefits to itscustomers and staff.
• By using a strategic planning approach, an agency canminimize the barriers to implementing a major farechange, while at the same time identifying the needs ofits customers and stakeholders and developing beneficialsolutions.
• By balancing fare simplification (e.g., elimination offare zones) with new initiatives (e.g., elimination of trans-fers and introduction of onboard sale of day passes), an agency can meet its goal of increasing revenues inorder to meet the required recovery ratio, while at thesame time increasing ridership across all of its core ser-vice modes.
CASE STUDY CONTACTS AND SOURCES
The following individuals assisted in providing informa-tion included as part of this case study:
Collin DavidsonMaryland MTA1515 Washington BoulevardBaltimore, MD 21230410-454-7035410-454-7037 (Fax)[email protected]
Simon TaylorMaryland MTAWilliam Donald Schaefer Tower6 St. Paul StreetBaltimore, MD [email protected]
The following documents (in addition to ridership and rev-enue summaries and other data) were used in preparing thecase study:
Taylor, Simon, and Douglas Carter. Maryland Mass TransitAdministration Fare Simplification: Effects on Ridershipand Revenue, Transportation Research Record 1618, pp.125–130.
Getting On Board: The Maryland Comprehensive TransitPlan, Volume I Executive Report, Maryland Mass TransitAdministration, December 2000.
132
CASE STUDY 7
METROPOLITAN TRANSPORTATION COMMISSION
INTRODUCTION
The Metropolitan Transportation Commission (MTC) isresponsible for the allocation of transportation resourcesamong the more than 26 public transportation operators in theSan Francisco (CA) Bay Area. These systems together oper-ate over 3,000 peak vehicles, carrying an average of 1.5 mil-lion weekday riders (or more than 465 million trips per year).
In February 2002, the MTC launched the first phase (thepilot project) of the TransLink® regional smart card program.The project is being implemented and managed through adesign-build-operate-maintain (DBOM) arrangement with thesystem integrator, ERG. The six-month pilot involved six ofthe region’s operators: AC Transit, BART, Caltrain, GoldenGate Transit, San Francisco Muni and Santa Clara ValleyTransportation Authority (VTA). Based on the successfulcompletion of the pilot, the ultimate plan for full rollout is toserve approximately 26 of the region’s transit providers witha single farecard. This case study reviews the development ofthe overall TransLink program and issues associated with theimplementation of the initial pilot phase of the program.
DEVELOPMENT AND IMPLEMENTATION OFFARE INITIATIVE
Development of the TransLink Program
A plan to develop a regionalfarecard for the Bay Areadates back to the late 1970s,when MTC first proposedthe idea of a universal pay-ment instrument as a way toimprove transit access amongthe many transit systems. MTC
began by working with the transit operators to develop interimmultiagency passes and tickets. System design for a regional
program was initiated in the mid-1980s, and the original Trans-Link farecard, using magnetic technology very similar toBART’s stored value system, was tested at BART and two busoperators (BART Express and Central Costa County TransitAuthority) beginning in 1994. However, following a trialperiod, it was decided not to proceed with the original plan.MTC commissioned a study to determine the most appropriatetechnology and implementation strategy (13). This effort, com-pleted in December 1995, evaluated technology and clearing-house options, including the potential for private involvement.This study led to recommendations that (1) the regional systemshould be based on contactless smart cards and (2) private enti-ties should be invited to participate in a range of system man-agement and operational elements, particularly those related toclearinghouse and equipment maintenance functions.
An RFP was subsequently issued, and a contract wasawarded to a consortium led by Motorola and ERG in 1999.(Subsequent to the award of the contract, Motorola made acorporate decision to get out of the smart card business. Nev-ertheless, Motorola is still the Prime Contractor for the proj-ect; moreover, the cards being used are those developed byMotorola.) The contract was structured to consist of twophases. The initial phase, the pilot project, is intended toaddress the following basic goals (14):
• Validate that the system meets the contractual require-ments and specifications.
• Provide transit operators experience with new equip-ment and systems.
• Provide data for assessment of program’s fiscal impact.• Test consumer satisfaction with services and systems.
The second phase would entail systemwide rollout through-out the region.
Implementation of the Pilot Project
Installation of equipment for the pilot phase of TransLinkwas completed in late 2001. By the end of the pilot period,the TransLink card could be used on the following services/locations:
• 8 Golden Gate Transit bus routes and 3 Golden Gateferry terminals. On buses, a card reader is mounted near
Fare Program/Initiatives
Implementation ofintegrated regional farecardprogram

133
the farebox; stand-alone devices such as that shownbelow have been installed in the ferry terminals.
• 9 BART stations. A card reader is installed in the fare-gates.
• 18 AC Transit bus routes. A card reader is mounted nearthe farebox.
• All 6 Muni light rail lines. The stand-alone device shownbelow is used in stations and on some platforms; a bus-type card reader is also mounted inside the vehicles.
• 3 VTA light rail lines and 4 VTA bus routes. On lightrail, only cards carrying monthly passes can be used; onbuses, a card reader is mounted near the farebox (thus,both e-cash and passes can be used).
• 9 Caltrain stations. Thestand-alone device isinstalled on platforms, andconductors carry hand-helddevices to check the cardsfor proof of payment (i.e.,that the card carries a validpass or that the proper cashfare has been deducted frome-cash).
The system was initiallytested by several hundredtransit agency employees who
were given TransLink cards in late 2001 for use in getting toand from work. Recruitment of general public card usersbegan in the summer of 2001. Transit riders were interceptedin stations or at bus stops and asked if they would be willingto participate in the pilot project. A total of about 4,000 cardswere subsequently sent to those individuals who hadexpressed interest; each card was preloaded with $3 in e-cash value. The system went live in February 2002. Another1,700 cards were distributed through a second recruitmenteffort, beginning in March 2002.
The equipment utilized in the pilot project consists of con-tactless smart card readers. However, the cards are “dual inter-face,” operating in both a contactless and contact mode. Atpresent, the contact interface is being used for all add valuetransactions (i.e., at Add-Value Machines, Ticket Office Ter-minal, and third party merchant locations) and in conjunctionwith hand-held card readers by Caltrain conductors. However,the contact interface will provide future flexibility in allowingfor the addition of nontransit functions early in Phase II of theproject; these may include, for instance, payment for parking,telephone calls, retail or purchases or other applications.
Farecard Purchase and Usage Parameters
• A card can be loaded with three forms of fare payment:up to $200 of stored value (called “e-cash” in TransLink
marketing literature); an unlimited-ride pass for one ormore specific agencies, or stored rides (for those agen-cies that offer multiride tickets or tokens).
• Any applicable usage discount offered by an individualagency (e.g., comparable to pricing for multiride ticketsor tokens) is applied with use of the TransLink card; thisis currently in place at Golden Gate Transit and VTA.At present, however, there is no purchase bonus or dis-count (e.g., $11 value for payment of $10); a purchasebonus will only be considered if all participating agen-cies agree on the parameters.
• The card keeps track of all rides and automaticallyprocesses any applicable transfer discounts (i.e., betweenoperators or within a single operator’s service).
• A rider is allowed to complete a trip even if paying thefare results in the TransLink card’s value falling below$0 (i.e., the value in the e-cash purse is allowed to gonegative for one transaction). The rider must then fundthe negative transaction the next time value is added tothe card.
• Cards can be loaded at designated Add-Value Machines(AVMs) in stations, at retail sales outlets, at participat-ing transit agency ticket offices, and at the TransLinkCustomer Service Center (by telephone, mail or e-mailrequest).
• Users can also enroll in the “Autoload Program” by pay-ing a $5 fee. In this program, whenever an enrolled card-holder’s e-cash or stored-ride balance falls below a des-ignated level—or when a pass is due for renewal—thecard is automatically reloaded via a secure electronicfunds transfer from an authorized bank account or creditcard the next time it is used.
• An employer-based autoload program is also available.An employee of a participating employer goes to a des-ignated website (managed by Wage Works, Inc.) andspecifies the type of transit payment option (i.e., pass, e-cash, or stored rides) desired. The payment option is auto-matically loaded onto that person’s TransLink card thenext time it is presented to a card reader. Employees ofemployers participating in the Commuter Check transitbenefit program will also now be able to opt for automateddownloading of the monthly transit benefit, although thisprogram provides e-cash only.
• At present, there is no fee for initial acquisition of a card,but there is a $5 charge to register a card for “balanceprotection” (i.e., replacement of the card and restorationof the value remaining on the card at the end of the dayon which it is reported lost or stolen). If a cardholder hasnot signed up for Balance Protection, the card is still reg-istered and will be blocked from further use if reportedlost or stolen; however, remaining value will not berestored. (In Phase II, cards not signed up for BalanceProtection might be kept anonymous; as of this writing,a decision had not yet been made about “hot listing”anonymous cards).

134
• Remaining card value is displayed each time a fare ispaid, but it can also be checked at an AVM, at a retailoutlet or ticket office, or by calling the Customer Ser-vice Center.
All clearinghouse functions, including customer support,data reporting, card distribution and management, revenueallocation and settlement, and funds pool management areprovided by the system vendor. ERG carries out these func-tions at a dedicated TransLink service center, which isstaffed by 20 to 25 people. For the pilot phase, MTC is cov-ering all TransLink costs. In full operation, though, the sys-tem is designed to be supported through fees paid by the indi-vidual transit agencies to ERG. The exact fee structure hadnot yet been established as of this writing, although the finalstructure will likely comprise a mixture of two or more typesof fees (e.g., a fee per TransLink transaction or a fee basedon revenue collected).
As suggested above, MTC and ERG are also seeking tosecure nontransit uses of the TransLink card (e.g., parking),both to minimize the amount needed in transit agency fees andto expand penetration of the card within the region. Moreover,the plan is to achieve cost efficiencies through using theTransLink clearinghouse to support other regions’ transitpayment programs; in particular, ERG has proposed thisstrategy for the Seattle/Central Puget Sound program nowunder development, and the Ventura County program willlikely be transitioned from its current arrangement (settle-ment is handled by the Ventura County Transportation Com-mission) to the TransLink service center as well (see VenturaCounty case study).
MTC has developed a comprehensive set of marketingmaterials in implementing the pilot phase of the program. Forinstance, the TransLink Welcome Package distributed withthe card contains a User’s Guide that explains the overallprogram and the above features; and a Transit Guide for eachparticipating operator, explaining how and where to use theTransLink card in that system. The system is also describedon a special TransLink website, www.translink.org.
RESULTS AND IMPACTS OF FARE INITIATIVES
The pilot project was completed in July 2002. The evalua-tion contractor subsequently submitted an evaluation reporton this first phase in September 2002. The evaluation assessedthe extent to which the pilot met or exceeded the expectedoutcomes for a series of objectives related to (1) system per-formance, (2) program costs and fiscal impacts, and (3) cus-tomer acceptance.
As of the end of the pilot project, five of the six operatorshad agreed to continue using the equipment past the end ofthe six-month pilot period. BART was unable to make sucha commitment at that time because it was in the process ofreplacing its faregates and thus had to remove the TransLink
card readers along with the old faregates; MTC and BARThad not yet settled on a strategy for facilitating the reading ofTransLink cards in the new faregates. (The primary optionsunder consideration included (1) installation of ERG’s cardreaders in the Cubic faregates, and (2) adapting Cubic’s Tri-Readers to be able to process the TransLink card.) Never-theless, MTC was optimistic that a satisfactory solution wouldbe developed and that TransLink would be extended through-out the region. Indeed, based on the successful completion ofthe pilot project, MTC decided in early 2003 to order $8 mil-lion in card reading equipment and 400,000 cards, which willallow the program to move toward a full-scale rollout; this roll-out was scheduled for April 2004. As of this writing (March2003), the six agencies that had participated in the pilot had yetto approve their participation in the full rollout, but MTCexpected the agencies to approve rollout plans within the com-ing months.
Customer Usage and Benefits
Including those given to agency employees, a total of 7,500cards had been distributed by the end of the pilot period;roughly 3,000 of these (40 percent) eventually turned up in thesystem. The MTC project manager feels that there was proba-bly too long a delay between recruitment of initial card usersand the opening of the system, that many of the envelopesmailed out likely were never even opened. This contention issupported by the fact that a much higher percentage, nearly60 percent, of the 1,700 cards distributed through the follow-up recruitment (once the pilot system was in place) showedup in the system.
The distribution of numbers of general public cardholdersand usage by operator is summarized in Table CS7-1. As canbe seen in the table, the Golden Gate Ferry has received themost usage to-date, with nearly thirty rides per card. BARTand Muni have actually received fares from more cardhold-ers than has the Ferry, but at a lower rate of usage. At theother end of the spectrum, VTA has seen very little use of thecards, with an average of only three rides per card. Overall,the table indicates that the average TransLink card has beenused more than 24 times, and that the average e-cash balancewas just under $15 per card.
TransLink has been developed with a focus on customerservice. Seamless travel using multiple transit operators isclearly a key objective, as is convenience in obtaining andloading the farecards—as demonstrated by the range of load-ing and usage parameters mentioned earlier. With regard tothe numbers of operators used per card, MTC reports that,through mid-June, 64 percent of cards had been used on asingle operator, 27 percent on two operators, and 9 percenton three or more operators.
With regard to use of the different loading options, TableCS7-2 displays the distribution of payment and load meth-ods. As shown, the average load value per card (includingpasses and stored rides, as well as e-cash) was approximately
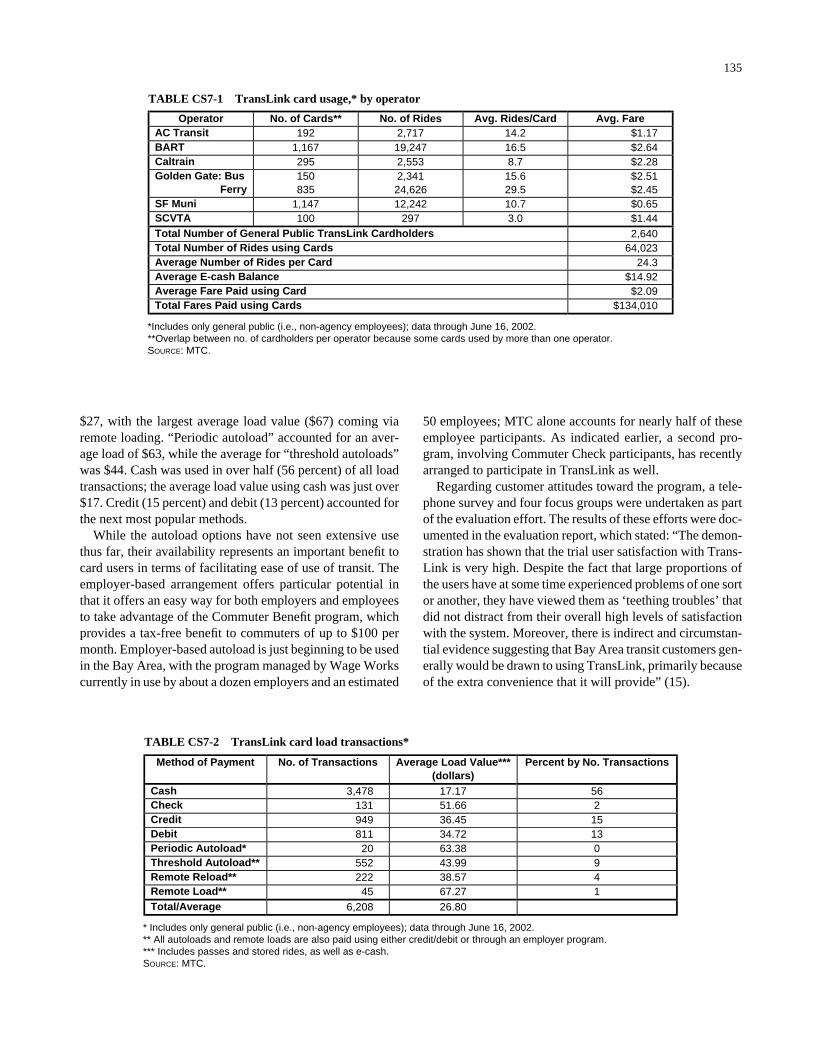
$27, with the largest average load value ($67) coming viaremote loading. “Periodic autoload” accounted for an aver-age load of $63, while the average for “threshold autoloads”was $44. Cash was used in over half (56 percent) of all loadtransactions; the average load value using cash was just over$17. Credit (15 percent) and debit (13 percent) accounted forthe next most popular methods.
While the autoload options have not seen extensive usethus far, their availability represents an important benefit tocard users in terms of facilitating ease of use of transit. Theemployer-based arrangement offers particular potential inthat it offers an easy way for both employers and employeesto take advantage of the Commuter Benefit program, whichprovides a tax-free benefit to commuters of up to $100 permonth. Employer-based autoload is just beginning to be usedin the Bay Area, with the program managed by Wage Workscurrently in use by about a dozen employers and an estimated
135
50 employees; MTC alone accounts for nearly half of theseemployee participants. As indicated earlier, a second pro-gram, involving Commuter Check participants, has recentlyarranged to participate in TransLink as well.
Regarding customer attitudes toward the program, a tele-phone survey and four focus groups were undertaken as partof the evaluation effort. The results of these efforts were doc-umented in the evaluation report, which stated: “The demon-stration has shown that the trial user satisfaction with Trans-Link is very high. Despite the fact that large proportions ofthe users have at some time experienced problems of one sortor another, they have viewed them as ‘teething troubles’ thatdid not distract from their overall high levels of satisfactionwith the system. Moreover, there is indirect and circumstan-tial evidence suggesting that Bay Area transit customers gen-erally would be drawn to using TransLink, primarily becauseof the extra convenience that it will provide” (15).
TABLE CS7-1 TransLink card usage,* by operator
Operator No. of Cards** No. of Rides Avg. Rides/Card Avg. Fare AC Transit 192 2,717 14.2 $1.17 BART 1,167 19,247 16.5 $2.64 Caltrain 295 2,553 8.7 $2.28 Golden Gate: Bus Ferry
150 835
2,341 24,626
15.6 29.5
$2.51 $2.45
SF Muni 1,147 12,242 10.7 $0.65 SCVTA 100 297 3.0 $1.44 Total Number of General Public TransLink Cardholders 2,640 Total Number of Rides using Cards 64,023 Average Number of Rides per Card 24.3 Average E-cash Balance $14.92 Average Fare Paid using Card $2.09 Total Fares Paid using Cards $134,010 *Includes only general public (i.e., non-agency employees); data through June 16, 2002.
**Overlap between no. of cardholders per operator because some cards used by more than one operator.SOURCE: MTC.
TABLE CS7-2 TransLink card load transactions*
Method of Payment No. of Transactions Average Load Value*** (dollars)
Percent by No. Transactions
Cash 3,478 17.17 56 Check 131 51.66 2 Credit 949 36.45 15 Debit 811 34.72 13 Periodic Autoload* 20 63.38 0 Threshold Autoload** 552 43.99 9 Remote Reload** 222 38.57 4 Remote Load** 45 67.27 1 Total/Average 6,208 26.80 * Includes only general public (i.e., non-agency employees); data through June 16, 2002.
** All autoloads and remote loads are also paid using either credit/debit or through an employer program.*** Includes passes and stored rides, as well as e-cash.SOURCE: MTC.

136
Operational and Administrative Benefits andImpacts
Potential Benefits
The limited time frame and scope of the pilot project makeit difficult to assess the nature of TransLink’s operational andadministrative impacts on the participating agencies. How-ever, a number of potential longer-term benefits have beenidentified; these will have to be determined once the systemhas been fully deployed on a wider scale and has achievedsignificant market penetration. The key potential benefits tooperators include the following (14):
• Additional data for service planning, marketing and finan-cial accounting.
• Additional flexibility in setting fares (time of day, inno-vative discounts).
• Decrease in operating losses due to fare evasion andfraud.
• Possible reduction in costs of collecting fares.• Better equipment reliability with contactless system.• Minimum operator intervention to operate system.• Increased throughput.• New marketing opportunities (including employers and
social services).• Save on long-term capital cost due to regional standard-
ization and procurement economies of scale.• Provide customers with single point of interface, which
is understandable and marketable, to make transit morecompetitive with other forms of travel.
The TransLink evaluation report did present potential costsavings estimates for several of the transit agencies involvedin the pilot phase. In each case, these savings assumed exten-sive system-wide usage of the smart cards and replacement ofmuch, if not all, of the agency’s existing paper fare media. Thesavings would thus result from eliminating the agency’s owncost of producing and distributing fare media in favor of cen-tral procurement and distribution by the privately operatedservice center or clearinghouse. The estimates of potentialannual savings for each agency reported in the evaluation areas follows (14):
• AC Transit. $475,000 (out of total cost of $860,000) forfare media manufacture, sales commissions and securityrelated to current fare collection, as well as up to $240,000(2.85 full-time equivalent employees) in labor related topass sales/delivery.
• BART. $500,000 in printing of current paper magneticfarecards.
• VTA. $600,000 (out of total of $1 million for currentfare media procurement/distribution cost).
• SF Muni. $1.16 million, to a maximum of $2.14 millionif TransLink cards replace all current fare media (and ifcash use is reduced by 60 percent).
• GGT and Caltrain. None provided.
Of course, it must be kept in mind that not all of the agen-cies’ own costs will be completely eliminated in these cases,but rather replaced by some type of fee (e.g., per transaction)paid to the service center. Thus, it remains to be seen howrealistic these estimates prove to be.
Potential Impacts and Issues
The above cost-related benefits raise issues associatedwith the extent and treatment of capital and operating costs:what are these costs, and how will they be allocated amongthe participating agencies (i.e., MTC, as well as the opera-tors)? Several of the participating operators expressed a con-cern over the ultimate costs: how much will participation inTransLink increase their overall fare collection costs giventhat they will still have to continue operating their existingfare systems as well.
As explained earlier, the type of fee payment arrangementfor operating costs has not yet been developed for the full pro-gram rollout. It will be necessary to identify a fee scenario thatfeels equitable to all participating operators and that reflectstheir relative level of participation (e.g., the expected usage ofthe TransLink card on their services, as well as their adminis-trative and reporting requirements associated with the pro-gram). Indeed, there are differing views on the most appro-priate fee basis; some operators have expressed a preferencefor a fee per card transaction, while others prefer a fee basedon revenue. As suggested above, the eventual payment struc-ture will likely involve a combination of two or more typesof fees.
The capital cost (i.e., including system development andprovision of initial equipment) through the end of the pilotphase was roughly $22 million; the capital cost for full sys-tem rollout is expected to total another $25–30 million. Theoperating expense for the pilot was on the order of $750,000;the total full-system operating cost is projected at $8–14 million per year, depending on the level of usage of the cardsand the nature of the fees collected. While MTC has coveredall capital costs and the bulk of the operating costs to-date,most of the individual transit agencies have reported someexpenses as part of their participation. As noted in the eval-uation of the pilot program, the types and levels of detail oncosts reported by the agencies varied widely and did not nec-essarily correlate with either the types of equipment installedor the level of usage of TransLink cards (14). These costsranged from under $2,000 per month (Golden Gate Transit)to approximately $20,000 per month (BART). Agencies’ costswere predominantly listed under categories such as “equip-ment-related,” “administrative,” and “revenue and financialservices.”

137
issue is how to provide more customized reporting anddata access to each operator.
• Requirements for monitoring and/or direct use ofTransLink equipment (e.g., driver log-in and devicemonitoring on buses; or fare inspector use of hand-heldcard reader devices on light rail or commuter rail).
• Customer service responsibilities for each operator.
These and related issues have been addressed to the extentpossible through the pilot project; however, some policiesand procedures will have to be modified before the programcan realistically be extended to other operators in the region.
CONCLUSIONS AND LESSONS LEARNED
Customer Impacts and Benefits
The fare initiative discussed in this case study has had—or is expected to have—the following customer-relatedimpacts and benefits:
• Improved ease of transit usage through ability to use sin-gle farecard for seamless travel within the region; alsoimproved ease of use due to contactless nature of cards.
• Greater flexibility of fare payment through ready accessto payment options (e.g., passes, stored rides) providedby individual agencies, as well as e-cash for use on anyparticipating agency.
• Improved customer convenience through features suchas allowance of a negative balance (in e-cash), range ofpass or e-cash loading options, optional balance protec-tion (i.e., guaranteed replacement of the pass or e-cashbalance if the card is lost or stolen), optional autoloadcapability, and employer-based autoload arrangements.Autoload can take three basic forms: value limit (e.g.,when the e-cash value drops below $5), periodic (e.g.,load pass at the beginning of each month), or one-timeautoload.
Agency Impacts and Benefits
The agency-related impacts and benefits of the TransLinkprogram experienced to date, or anticipated as a result of fullsystem rollout, include the following:
• All capital costs and most of the operating costs thus farhave been covered by MTC, although each agency expe-rienced some costs as part of its participation in thepilot. In the full system rollout, the operators will haveto pay their shares of system operating costs throughsome type of fee structure (e.g., per transaction or basedon revenue).
• Usage of the TransLink cards has been relatively limitedto date. However, the pilot project was intended to test the
Other financial and governance issues and operating rulesthat will have to be addressed as the program is rolled outinclude the following:
• Pricing of card-based services to riders and refund/replacement policies (e.g., whether to charge for the cardinitially, or simply for replacement).
• Funds pool management (e.g.,how to share revenue fromfloat among the participants).
• Fare policies among the oper-ators (i.e., related to such areasas interagency transfer poli-cies, uniform purchase orusage discounts associatedwith the TransLink card, andwhether or not to move towardsome type of regional pass thatcan be administered throughthe TransLink clearinghouse).
• Treatment of nontransit rev-enues (e.g., use to reduce coststo agencies or, perhaps, sharerevenues among agencies).
• Governance of the program:should MTC continue to be the lead agency or should itbe led by some type of new or existing joint organiza-tion (e.g., along the lines of the Joint Powers Board thatoversees Caltrain)?
Operationally, TransLink is a stand-beside or overlay sys-tem; the card readers are not fully integrated into the operators’existing fare collection. For instance, on buses, the TransLinkreaders are mounted separately from the fareboxes; the abovephoto shows the card reader installed in a BART faregate.Thus, data from card use is maintained separately from recordson other fare payment methods (e.g., flash passes, cash infareboxes, BART’s magnetic farecards, or proof-of-paymenttickets). Most of the equipment used in the pilot project (e.g.,the various types of card readers) apparently worked quitewell. The exception to this was the hand-held devices pro-vided to conductors on Caltrain; the original units did notoperate reliably with any reasonable consistency. ERG hashad to replace these with a different unit.
The stand-beside nature of the system raises interface issuessuch as the following:
• Each operator’s maintenance responsibilities for Trans-Link equipment and the technical capabilities neededfor this maintenance. These responsibilities have beendefined in the maintenance plan for Phase I and haveproven to be minimal thus far.
• Data access and reporting requirements for each opera-tor. There is a comprehensive set of reports now, but one

138
reliability to date. However, use of contactless cards canspeed boardings; thus, extensive usage of TransLinkcards could eventually reduce dwell times somewhat andtherefore contribute to service reliability improvements.
In short, the TransLink pilot project demonstrated the gen-eral feasibility of developing and implementing an integratedregional payment system through a private-public design-build partnership. However, the true test of the program willcome in the effort to expand it to the other twenty operatorsin the region and to generate extensive usage among riders.
Impact and Benefits for Partner Entities
TransLink seeks to enlist other (nontransit) partners andapplications, including parking payments and retail uses.Partnerships with employers have already been initiated, andthe employer-based autoload arrangement benefits bothemployers and their employees by facilitating distribution ofcommuter benefits. Partnerships with all such entities shouldalso serve to increase the market penetration and overall use-fulness of the TransLink cards.
Liability to Agency
As long as each agency maintains its own fare structure,there should not be a risk associated with losing fare revenue.
Perhaps the major area of liability to MTC associated withthe pilot project was the potential loss of interest in cooperat-ing on the full rollout on the part of one or more of the partic-ipating transit agencies. The pilot project apparently demon-strated sufficient promise to convince the six pilot agenciesto continue accepting the cards for payment after the close ofthe pilot period. However, the agencies had yet to approvefull rollout plans as of early 2003.
Constraints and Barriers
TransLink is an extremely ambitious and complicatedendeavor. Any multiagency integrated payment project mustovercome a broad range of technical, operational, institutionaland financial constraints and barriers; in TransLink, the effortto include as many as 26 different agencies significantly com-pounds these challenges. Some of the major issues the projecthas faced to-date and will have to address as it expands areas follows:
• A strategy for integrating TransLink card readers intoBART’s new faregates has been a challenge; as of theend of the pilot period, an agreement on such a strategyhad not yet been reached.
• Significant problems have occurred with the hand-helddevices provided to conductors on Caltrain, althoughmost of the equipment has worked well. ERG had to
systems and the overall concept; thus, there was no majorpush to generate a high level of usage. Usage has beengreatest on the Golden Gate Ferry, with an average of nearly thirty rides per card. BART and Muni havereceived the highest number of cards, though both haverecorded many fewer uses per card than has the Ferry.Caltrain, AC Transit, Golden Gate Bus and SCVTA haveeach seen little use of TransLink cards to-date. The totalnumber of TransLink rides (as of mid-June) was just over64,000, producing revenues of $134,000.
• The limited use of the TransLink cards suggests that thepilot project had minimal impact on the agencies’ useof cash; however, as card penetration expands in thefull system rollout, the use of cash should eventuallydecrease. Moreover, participating agencies should beable to reduce their expenses associated with productionand distribution of paper-based fare media.
• The TransLink pilot project effectively addressed itsbasic goals. It “validated that the system meets the con-tractual requirements and specifications,” “provided tran-sit operators experience with new equipment and sys-tems,” “provided data for assessment of the program’sfiscal impact,” and “tested consumer satisfaction withservices and systems.” In terms of other objectives for aregional multiagency project, the pilot project “createda seamless universal fare medium” and “demonstratedthe feasibility of implementing a multiagency paymentsystem” (15).
• The revenue reconciliation/settlement system workedvery well in the pilot project. The system (includingthe missing transactions/claims process) proved to beextremely accurate, reportedly keeping track of everytransaction and every cent. This ensured that the opera-tors knew exactly what they were owed—unlike thecase with current multioperator payment arrangements(e.g., the BARTPlus pass), which estimate the alloca-tion of revenue.
• The limited level of usage suggests that the TransLinkpilot project did not have a significant impact on fareabuse and evasion to date. However, the use of any typeof electronic fare payment offers the potential to controlabuse and evasion; therefore, over time, TransLink wouldlikely reduce participating agencies’ extent of fare abuseand evasion.
• TransLink provided greater flexibility to the operatorsin terms of the ability to offer additional fare options(e.g., e-cash as well as passes).
• MTC assigned a full-time project manager, as well asthree support staff for implementation and managementof the program. The project has not resulted in any addi-tional personnel for the operating agencies to date. Theprivately run service center will ultimately have a staffof 20 to 25.
• The limited level of usage suggests that the TransLinkpilot project did not have a significant impact on service

replace these units with a different unit. The operators’responsibilities for maintenance of TransLink equip-ment is also an issue.
• A structure for the payment of fees by the operators tocover system operating costs had yet to be establishedas of the end of the pilot period. At issue was (1) thebasis for fees (e.g., transactions, revenues, perhaps acombination of these), and (2) the level of the fee(s).
• There were other financial, governance and operatingrules, such as the following: (1) allocation of nonfaresystem revenues (e.g., from float or fees from nontran-sit applications), (2) regional fare policies, (3) pricing ofcard-based services to riders, (4) operators’ data accessand ability to receive customized reports, (5) operators’customer service responsibilities, and (6) the overallgovernance of the program (i.e., which agency shouldserve as the lead in the full system).
• Early in the development and implementation process,there was considerable turnover among contractor staff.This was partly due to the fact that Motorola withdrewfrom the smart card business after being awarded thecontract. The situation stabilized once the pilot projectwas underway.
These and related challenges will have to be addressed ifthere is to be a successful rollout of the full TransLink program
Required Equipment and Technology
The TransLink program is based on use of a contactless,dual interface smart card technology. The first test of the con-cept was done using magnetic technology, but there were sig-nificant operational problems with this system, and a compre-hensive assessment determined that smart card technologywould better serve the goals of the program.
Lessons Learned
A number of key lessons have been learned from thedevelopment and early testing of the TransLink project; theseinclude the following:
• A complex undertaking, such as a regional farecard pro-gram, needs a local champion to spearhead the effort.
• Staff resources and capabilities need to be commensu-rate with the scope and complexity of the project andneed to be in place at the beginning of the project.
• Regular and open communication is needed among allthe stakeholders throughout the development and imple-mentation process to promote buy-in. Even with such anapproach, however, reaching agreement among multi-ple participants on key issues is extremely challengingand will not always be possible.
139
• A private-public design-build partnership can be a rea-sonable approach to developing and operating a projectsuch as this.
• Even with a “stand-beside” system, integrating the newequipment into existing fare collection systems can bechallenging.
• Using smart card technology enhances the program’sability to offer a range of automated loading methods,thereby maximizing card users’ convenience. Employer-based autoload arrangements can be beneficial to bothemployers and employees.
• Using smart card technology offers opportunities to bringin nontransit partnerships and applications and thus either(1) hold down the operating cost to the transit participantsor (2) generate additional revenues for these participants.
• Recruiting card users for a pilot project as closely aspossible to the actual initiation of the service is advan-tageous. If there is too long a gap between distributionof cards and the ability to use them, many people willlose the cards, forget they received them, or, perhaps, nolonger be using transit.
CASE STUDY CONTACTS
This case study is based on discussions with the followingindividuals:
Russell DriverTransLink Project ManagerMTC101 Eighth StreetOakland, CA 94607510-464-7808510-464-7848 (fax)[email protected]
Carol LawsonCaltrainPeninsula Joint Powers Board1250 San Carlos Ave.San Carlos, CA 94070650-508-332
Dan RosenSF Muni401 Van Ness Ave.San Francisco, CA 94102415-554-1741
Aaron WeinsteinBay Area Rapid Transit District800 Madison St.Oakland, CA 94604510-464-6199

Alan ZahradnickGolden Gate Bridge, Highway and Transportation DistrictPresidio Station, P.O. Box 9000San Francisco, CA 94129415-257-4475
The following documents (in addition to various Trans-Link program usage reports) were used in preparing thecase study:
140
Benton International, TransLink Program Plan. Prepared forthe MTC, December 1995.
Russell Driver, presentation on TransLink (at MBTA Stake-holder Workshop), November 1, 2000.
Charles River Associates, Evaluation of the TransLink Demon-stration—Final Report, September 2002.
Multisystems, Inc. et al. Fare Policies, Structures and Tech-nologies (TCRP Report 10), 1995.
Transactions, MTC newsletter, December 2001.TransLink website: www.translink.org

141
CASE STUDY 8
NEW JERSEY TRANSIT
INTRODUCTION
New Jersey Transit (NJ TRANSIT, or NJT) is a public tran-sit corporation created by the Public Transportation Act of1979. NJ TRANSIT operates transit services throughout theState of New Jersey, covering a service area of 5,325 squaremiles. NJ TRANSIT operates several modes of transit ser-vices: fixed-route bus, paratransit, light rail, and commuter rail.
NJ TRANSIT is the nation’s third largest transit serviceprovider, with 238 bus routes and 12 rail lines statewide. Itprovides transportation links to major New Jersey cities anddestinations and commuter services to New York City andPhiladelphia. NJ TRANSIT serves more than 380,000 cus-tomers daily, providing almost 224 million passenger tripseach year.
This case study focuses on two fare initiatives:
• Programmed fare increases for all NJ TRANSIT ser-vices beginning in 2002.
• An access-to-jobs transit benefit program, increasing thetransit opportunities of welfare-to-work participants.
DEVELOPMENT AND IMPLEMENTATION OFFARE INITIATIVES
Fare Increase and Policy Changes
In its 5-year plan, NJ TRANSIT’s Call to Action, a cumu-lative funding gap of $3.1 billion was projected over the next5 years (16). As a result, a multiyear fare policy initiative wasdeveloped in order to achieve the following:
• Generate additional revenue (approximately $44 millionannually).
• Address the estimated budget shortfall for FY2003.• Provide a more secure source of revenue.• Reduce the agency’s reliance on capital funds to pay for
a portion of operating costs, thus enabling capital proj-ects to advance as programmed.
• Streamline some fare administrative procedures.
Numerous fare change proposals were developed by NJTRANSIT staff. Through its public hearing and internalreview process, a number of proposed changes were elimi-nated. Table CS8-1 identifies the proposed changes, as wellas those subsequently approved by the NJ TRANSIT Boardof Directors for final implementation.
The fare increase implemented on April 1, 2002, was thefirst fare increase in 11 years (i.e., since FY1991). This farechange was the first step in a multiyear fare policy initiativeapproved by the NJ TRANSIT Board of Directors earlier inthe year. The initiative established a 10 percent increase thefirst year, followed by subsequent increases in the next 5years (FY2003 through FY2007) based on an inflation index.
The April 2002 changes represented an average increaseof 10 percent on all bus, rail, Newark City Subway, and busservices under contract to NJ TRANSIT, including Access-Link. The new Hudson-Bergen Light Rail Line was not sub-ject to this increase but will be included in subsequentincreases in the plan.
Subsequent increases are tied to the Zone of Rate Freedom(ZORF) index, which is approved annually by the New Jer-sey Commissioner of Transportation. The ZORF is estab-lished by state law and is applied to the fares that privatebus carriers charge. With this multiyear authorization, NJTRANSIT can increase fares annually according to the ZORFor apply the cumulative increase if fare increases are imple-mented less frequently. However, NJ TRANSIT must holdpublic hearings prior to implementing these changes.
In addition to the pricing changes, a number of other farepolicy changes were implemented in the April 2002 initia-tive. For example, round trip excursion tickets are no longeraccepted on weekday evening peak trains leaving New York,Newark, and Hoboken; the onboard surcharge for rail wasincreased from $3 to $5 to encourage use of NJ TRANSIT’sinvestment in ticket technology; and the fares were stan-dardized from the Newark stations. An equal number of pro-posals did not survive the iterative deliberations on the farechange proposals.
Fare Program/Initiatives
Fare increase and policychanges: programmedincreasesAccess-to-jobs: transit benefit payment arrangements
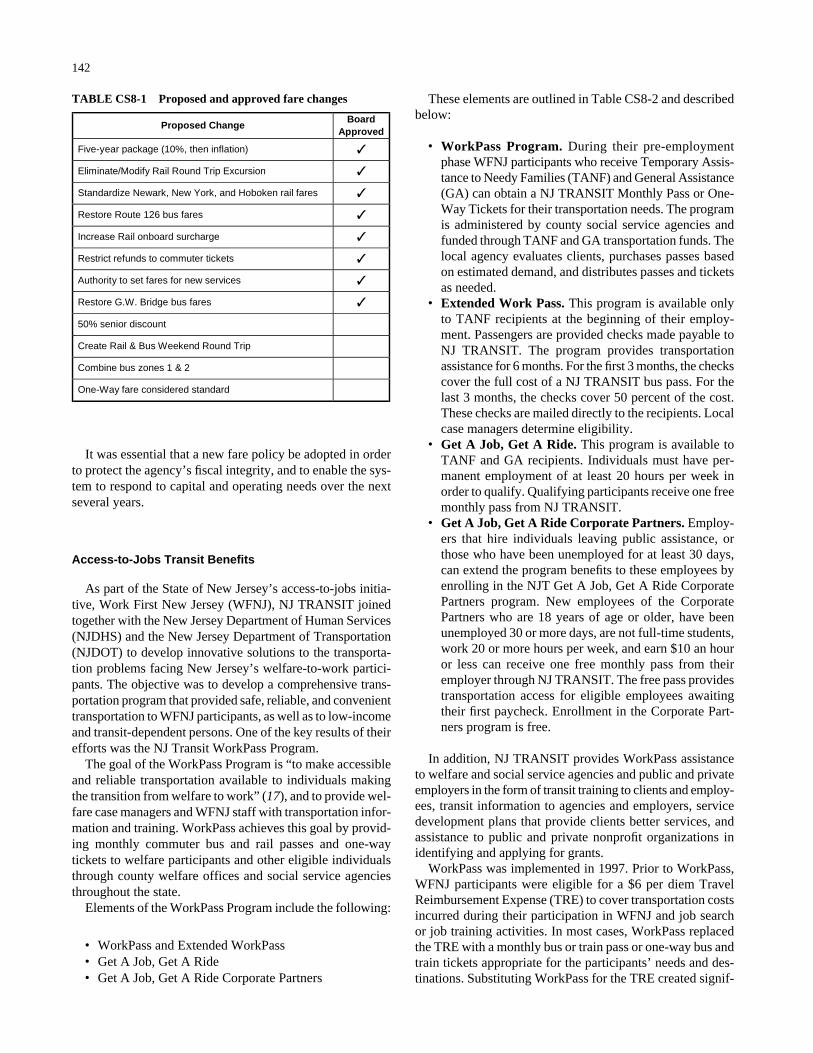
It was essential that a new fare policy be adopted in orderto protect the agency’s fiscal integrity, and to enable the sys-tem to respond to capital and operating needs over the nextseveral years.
Access-to-Jobs Transit Benefits
As part of the State of New Jersey’s access-to-jobs initia-tive, Work First New Jersey (WFNJ), NJ TRANSIT joinedtogether with the New Jersey Department of Human Services(NJDHS) and the New Jersey Department of Transportation(NJDOT) to develop innovative solutions to the transporta-tion problems facing New Jersey’s welfare-to-work partici-pants. The objective was to develop a comprehensive trans-portation program that provided safe, reliable, and convenienttransportation to WFNJ participants, as well as to low-incomeand transit-dependent persons. One of the key results of theirefforts was the NJ Transit WorkPass Program.
The goal of the WorkPass Program is “to make accessibleand reliable transportation available to individuals makingthe transition from welfare to work” (17), and to provide wel-fare case managers and WFNJ staff with transportation infor-mation and training. WorkPass achieves this goal by provid-ing monthly commuter bus and rail passes and one-waytickets to welfare participants and other eligible individualsthrough county welfare offices and social service agenciesthroughout the state.
Elements of the WorkPass Program include the following:
• WorkPass and Extended WorkPass• Get A Job, Get A Ride• Get A Job, Get A Ride Corporate Partners
142
These elements are outlined in Table CS8-2 and describedbelow:
• WorkPass Program. During their pre-employmentphase WFNJ participants who receive Temporary Assis-tance to Needy Families (TANF) and General Assistance(GA) can obtain a NJ TRANSIT Monthly Pass or One-Way Tickets for their transportation needs. The programis administered by county social service agencies andfunded through TANF and GA transportation funds. Thelocal agency evaluates clients, purchases passes basedon estimated demand, and distributes passes and ticketsas needed.
• Extended Work Pass. This program is available onlyto TANF recipients at the beginning of their employ-ment. Passengers are provided checks made payable toNJ TRANSIT. The program provides transportationassistance for 6 months. For the first 3 months, the checkscover the full cost of a NJ TRANSIT bus pass. For thelast 3 months, the checks cover 50 percent of the cost.These checks are mailed directly to the recipients. Localcase managers determine eligibility.
• Get A Job, Get A Ride. This program is available toTANF and GA recipients. Individuals must have per-manent employment of at least 20 hours per week inorder to qualify. Qualifying participants receive one freemonthly pass from NJ TRANSIT.
• Get A Job, Get A Ride Corporate Partners. Employ-ers that hire individuals leaving public assistance, orthose who have been unemployed for at least 30 days,can extend the program benefits to these employees byenrolling in the NJT Get A Job, Get A Ride CorporatePartners program. New employees of the CorporatePartners who are 18 years of age or older, have beenunemployed 30 or more days, are not full-time students,work 20 or more hours per week, and earn $10 an houror less can receive one free monthly pass from theiremployer through NJ TRANSIT. The free pass providestransportation access for eligible employees awaitingtheir first paycheck. Enrollment in the Corporate Part-ners program is free.
In addition, NJ TRANSIT provides WorkPass assistanceto welfare and social service agencies and public and privateemployers in the form of transit training to clients and employ-ees, transit information to agencies and employers, servicedevelopment plans that provide clients better services, andassistance to public and private nonprofit organizations inidentifying and applying for grants.
WorkPass was implemented in 1997. Prior to WorkPass,WFNJ participants were eligible for a $6 per diem TravelReimbursement Expense (TRE) to cover transportation costsincurred during their participation in WFNJ and job searchor job training activities. In most cases, WorkPass replacedthe TRE with a monthly bus or train pass or one-way bus andtrain tickets appropriate for the participants’ needs and des-tinations. Substituting WorkPass for the TRE created signif-
TABLE CS8-1 Proposed and approved fare changes
Proposed Change Board
Approved
Five-year package (10%, then inflation) ✓
Eliminate/Modify Rail Round Trip Excursion ✓
Standardize Newark, New York, and Hoboken rail fares ✓
Restore Route 126 bus fares ✓
Increase Rail onboard surcharge ✓
Restrict refunds to commuter tickets ✓
Authority to set fares for new services ✓
Restore G.W. Bridge bus fares ✓
50% senior discount
Create Rail & Bus Weekend Round Trip
Combine bus zones 1 & 2
One-Way fare considered standard

icant cost savings for the service agencies. The monthly TREbenefit was approximately $120; a monthly bus pass costs$54 to $59. NJDHS allowed the agencies to keep those sav-ings and use them to develop supplemental transportationservices or use the savings as matching funds for transporta-tion grants such as WFNJ Transportation Block Grants, FTAJobs Access and Reverse Commute Program, and the NJTransportation Innovation Fund. However, the TRE is stillprovided on an as needed basis.
RESULTS AND IMPACTS OF FARE INITIATIVES
Fare Increase and Policy Changes
Customer Impacts
The fare increase initiative has established fare increasesas modest, routine changes over the next 6 years. In the past,fare changes were very infrequent, meaning that, whenchanges were made, the amount of the increases tended to besubstantial. Moreover, the future increases will be tied to aninflationary index, assuring riders that the fare changes arebased on economic trends in the state. Though there is author-ity for a multiyear program of changes, no change will beimplemented without a public hearing.
Agency Impacts
The authority to increase fares based on inflationaryimpacts gives NJ TRANSIT a more certain level of passenger
143
revenue for the current and subsequent fiscal years. Theagency also now has the authority to set fares for new servicesbeing introduced and to include them in the overall plan.Thus, with a multiyear program, NJ TRANSIT can proceedto program these fare revenues over the next few years forexisting services as well as possible service improvements.The first fare increase was implemented April 1, 2002; dataare not yet available to determine the overall impact of thechanges on NJ TRANSIT ridership and revenue.
More certain passenger fare revenue, combined with suf-ficient state general fund appropriations, would allow NJTRANSIT to safeguard its capital funds for capital projects.In the past, without a regular program of fare increases, it wassometimes necessary to use funds designated for capital proj-ects to balance the operating budget.
Access-to-Jobs Transit Benefits
Customer Impacts
The NJ TRANSIT WorkPass Program has provided numer-ous benefits for WFNJ individual customers. Key benefits forindividuals/clients include the following:
• Improved reliability. WorkPass monthly passes and one-way tickets give WFNJ participants access to a reliabletransportation source.
• Improved flexibility. Passes give participants unlimiteduse of transit services for the entire month, allowing usefor both employment and personal needs.
TABLE CS8-2 WorkPass program elements
Program Eligibility Benefit(s) Funding Implementation
WorkPass Temporary Asssistance to Needy Families (TANF) and General Assistance (GA) recipients
NJT Monthly Pass or One-Way Tickets; Travel Reimbursement Expense (TRE) still available as needed
Counties—TANF, GA transportation funds through New Jersey Department of Human Services (NJDHS)
Agency evaluates clients, purchases and distributes passes/tickets as needed
Extended Work Pass TANF recipients only 6 months transportation assistance (3 months free, 3 months 50 percent cost)
NJDHS Case manager determines eligibility; client receives check made out to NJ TRANSIT
Get A Job, Get A Ride
TANF and GA recipients; 20 hour minimum work week
One free monthly pass
NJ TRANSIT Case worker provides application to individual; Individual mails application to NJT; NJT mails pass to eligible user
Get A Job, Get A Ride Corporate Partners
New employees of NJT Corporate Partners (18+ years old; unemployed 30+ days; not full-time students; work 20+ hours/week; earn $10/hour or less)
One free monthly pass
NJ TRANSIT Free enrollment in Corporate Partners for employers; NJT provides Partners with monthly passes for eligible employees

• Life skills. Encouraging the use of public transportationteaches valuable commuting skills useful for finding andkeeping jobs.
Agency Impacts
The WorkPass Program also provides important benefitsto NJ Transit, such as:
• Additional ridership.• Valuable information and understanding of county
demographics and existing local transportation servicesand needs; this information can enhance NJ TRANSIT’sservice planning efforts.
Also, by taking a visible role early in the developmentprocess, NJ TRANSIT has been seen as “part of the solution,rather than part of the problem.”
CONCLUSIONS AND LESSONS LEARNED
Customer and Agency Impacts and Benefits
The fare increase initiative clearly raises the costs of travelfor riders. However, the program of inflation-based increaseswill mean that future increases should be less substantial thanthe past, infrequent changes. The increases will also benefitNJ TRANSIT by generating a more predictable level of rev-enue growth and by allowing the agency to raise fares asneeded.
The access-to-jobs initiative has had numerous positiveimpacts on and benefits for both WFNJ participants and ser-vice agencies, as well as for NJ Transit. After overcomingsome initial resistance, WorkPass has been positively acceptedby both intermediate and end users of the program. Some indi-cations of the program’s success as of 1999, when the pro-gram’s impacts were last reviewed, include the following:
• 16 of the 21 New Jersey counties participate in the pro-gram.
• Over 40 social service agencies participate in the pro-gram.
• Over 5,000 passes and tickets are distributed each month.• Over 500 county and social service agency personnel
have received WorkPass training.• Over $2,000,000 in cost savings have been realized over
the TRE per diem program.
Impacts and Benefits for Partner Entities
The NJ TRANSIT WorkPass Program has provided numer-ous benefits for social service agency institutional customers.Key benefits include the following:
144
• Cost savings. Agencies can save over 50 percent versusthe cost of TREs. Savings may be recycled into supple-mental transportation services or as matching funds fortransportation grants.
• Transit training and education. NJ TRANSIT pro-vides agencies with transit training and materials to helpboth agency personnel and customers better understandhow to access and use public transportation.
Liability to Agency
Should NJ TRANSIT determine that additional revenuesare needed at some point beyond what can be generatedthrough an inflation-based increase, the fare increase initia-tive and its reliance on the inflation index to determine theextent of increase will limit the agency’s ability to raise faresas high as necessary for the duration of the initiative.
Constraints and Barriers
Implementing the fare increase proposal required exten-sive public input and staff and Board discussion; for instance,a series of public hearings was held statewide. Certain farechange proposals had to be modified or eliminated through-out the iterative process. Moreover, implementing the subse-quent fare increases is not automatic. A public hearing mustprecede each change.
NJ TRANSIT faced several obstacles, both major andminor in nature, in planning and implementing the WorkPassProgram. Most of the resistance to the program occurred dur-ing the county-level planning and implementation phase; theprogram encountered few department-level barriers and nolegal barriers. By working closely with its partner entities, NJTRANSIT was able to overcome most of the barriers toensure the program would succeed. Some of the biggestobstacles centered on the following perceptions:
• WorkPass means more work for program representa-tives. Many county social workers believed that theWorkPass Program would mean more work for them.Many felt that they were already overburdened with case-loads and the last thing they wanted was another programlayer to administer. NJ TRANSIT was able to overcomethis barrier by starting small. The agency implementedthe pilot program in Gloucester County, then used thatsuccess, and the caseworkers who were won over, to helpsell the program to the rest of the counties.
• Transit is not accessible to everyone. This barrier stillexists to a certain extent. WorkPass was never intendedto be the end-all solution to the state’s transportationproblems, just a reasonable alternative for the majorityof consumers. Some participants in the program simplycannot access public transit for various reasons. For

those individuals, other aspects of the WorkPass Pro-gram can help, such as identifying or establishing alter-native means of transportation (van/carpools, shuttle ser-vices, feeder services, etc.). Also, the TRE program stillexists for those who cannot access any other transporta-tion alternative.
• WorkPass diverts economic resources from those most inneed. This perception was difficult to overcome. Thoughthe TRE per diem was designated for transportation-related expenses, many caseworkers believed that par-ticipants often used their per diem (up to $120 a month)to supplement their family’s food budget. Once the TREcheck was cut to the participant, there was no account-ability for how the funds were actually spent. Some rep-resentatives therefore felt that WorkPass would be takingfood away from disadvantaged children. Fortunately, thisbarrier proved to be less serious than originally thought.Most WorkPass participants were pleased with the newprogram, and very few complaints were received aboutreplacing the TRE with the monthly transit pass.
Other barriers to implementation that were encounteredincluded:
• The concern that Work Pass does not address child careneeds or problems.
• Pass distribution problems in counties with large case-loads.
• Difficulties in estimating the number of passes to orderin advance.
• Some conflicts in the goals and objectives of partnersand agencies.
• Certain NJ TRANSIT fare policies and procedures thatneeded to be changed to make it work.
Another problem that arose with WorkPass was solved bythe implementation of a new fare category. WFNJ partici-pants expressed concern about the cost of transporting chil-dren on public transportation to childcare centers, schools,and other transit destinations. NJ TRANSIT responded byestablishing a discounted child fare equal to one half the reg-ular adult fare. NJ TRANSIT produced discounted children’stickets for children aged 5 to 11: children under 5 ride freewith an adult, while those 12 and older must use existingadult fare media.
Required Equipment and Technology
No changes in equipment or technology were needed toimplement either the fare increase initiative or the WorkPassProgram.
145
Key Factors and Influences
The fare increase initiative was prompted by a strategicplanning effort, which identified needs and funding gaps (i.e.,it was not an independent fares-only initiative). The develop-ment and approval of a multiyear fare increase was tied to rais-ing funds to protect the agency’s fiscal integrity and to enableit to proceed with the strategic plan. The inflation index relieson an existing approach, currently in use for private bus car-rier fares; the index is thus codified in New Jersey law.
Lessons Learned
Several key lessons emerged from the development of theWorkPass Program, but perhaps the most important was theneed for effective partnerships. NJ TRANSIT partnered withthe NJDOT, NJDHS, New Jersey Department of Labor, NewJersey State Employment and Training Commission, and eachindividual county in planning and developing the WorkPassProgram. Two particularly important elements in developingsuccessful partnerships were stressed:
• Understanding each partner’s goals and objectives in set-ting common goals
• Sensitivity to the needs and concerns of each partner
Other important lessons noted by those interviewed forthis case study include the following:
• Be persistent. Change is never easy; don’t give in toresistance.
• Be patient. Give the program enough time to work out.Gradually build the program and avoid unattain-able goals. NJ TRANSIT started WorkPass as a pilotprogram in one county, Gloucester, and used thatexperience—including the success there—to sell theprogram in the rest of the state.
• Be flexible. Be ready and able to make changes to theprogram to meet the needs of the partners and users. Inthis case, the WorkPass Program was adapted to meeteach county’s specific demographics and needs.
• Stay focused. Keep all partners focused on the pro-gram’s mission and common goals.
CASE STUDY CONTACTS AND SOURCES
The following individuals were interviewed, either on-site or via telephone, and assisted in providing informationincluded as part of this case study:
Jim RedekerNJ TRANSITOne Penn Plaza [email protected]
Marianne StockNJ TRANSITOne Penn Plaza [email protected]
Jeremy Colangelo BryanNJ TRANSITOne Penn Plaza [email protected]
Alan TillotsonNJ TRANSITOne Penn Plaza [email protected]
146
Carol DuffyNJ TRANSITOne Penn Plaza [email protected]
The following documents were used in preparing thecase study:
NJ TRANSIT Fare Policy Proposal, December 12, 2001.“NJ TRANSIT’s Call to Action: An Investment for the Future,
Fiscal Years 2002 through 2006 and Beyond,” NJ TRAN-SIT, 2001.
Louis V. Capadonna, “WorkPass Works for Everyone,” Act’99/Hyperlink to Mobility (1999).
NJ Transit WorkPass Program: “The Program that Worksfor Everyone,” New Jersey Transit, June 2002.

147
CASE STUDY 9
ORANGE COUNTY TRANSPORTATION AUTHORITY
INTRODUCTION
Orange County Transportation Authority (OCTA) oper-ates transit service throughout Orange County, California.OCTA has a total peak fleet (FY 02) of 441 buses, and pro-vides over eighteen million miles of revenue service per year.
This case study focuses on a recent OCTA fare initiative:
• Elimination of free transfers, in conjunction with intro-duction of 1-day passes that are sold on buses.
The case study also discusses a second initiative that is inthe process of being implemented:
• Installation of GFIGenfare validating fareboxes withelectronic read-write capabilities (i.e., TRiM units), andthe replacement of calendar-month passes with 30-dayrolling passes (i.e., that are activated on first use).
DEVELOPMENT AND IMPLEMENTATION OFFARE INITIATIVES
Due to its largely grid-oriented route network, OCTA tradi-tionally experienced a considerable volume of transferring. A1994 fare study found that over 30 percent of local boardingswere transfers, and moreover, “ . . . on the order of 47 percentof people who pay cash fares or use coupons transfer to anothervehicle” (18). The agency had modified its transfer policy sev-eral times in the years preceding this study. Changes includedthe treatment of stopovers and round-tripping, the length oftime for which the transfer would be valid, and the transferprice; for instance, a $0.05 transfer charge had been imple-
mented in 1991. Since OCTA sought to determine the mostappropriate transfer policy, this study explored various strate-gies for improvement and for reducing the number of trans-fers in the system. Among the options considered were elim-inating free/low-priced transfers and selling 1-day passes onthe buses.
OCTA subsequently eliminated the nickel transfer chargeand made other changes to transfer validity parameters. How-ever, the agency later revisited possible transfer strategies,and, seeking to reduce the extent of transfer abuse and to elim-inate confrontations between operators and riders, decided toeliminate free transfers in conjunction with beginning to sella day pass onboard the buses in July 1999. The pass price wasinitially set at $2.50, but with a $0.50 discount for the first 6months. Given that the cash fare was (and continues to be) $1,a $2 pass translated into two paid boardings—or two paidboardings and two free transfers. The pass price was thenraised to its “full” price of $2.50 in January 2000.
The day passes were initially paper tick-ets packaged in pads of 20. Each morning,operators would take as many pads as theyfelt they needed that day; however, opera-tors did not have to sign for the pads, mean-ing there was a decided lack of control in terms of monitoring pass distribution.This inevitably resulted in (undocumented)abuse on the part of some operators, whowould hand passes to friends at no charge.The process was later changed in an effortto impose better controls: each operatorwas given a certain number of passes eachday, based on the general rate of demandon the particular route. Each operator’s allotment was thusgenerally tracked, although the actual sale of passes was notreconciled with the daily number distributed to and returnedby each operator.
The next change in the sale of day passes occurred on July1, 2001, with a shift to use of magnetic swipe day passes. Withthe installation of the new fareboxes, day passes had to beswiped on boarding, rather than just shown to the operator. Inorder to minimize maintenance requirements, OCTA decidednot to dispense day passes from a stack inside the TRiM unit.However, in selling a day pass, the operator now must feedeach pass through the TRiM unit in order to activate it. This
Fare Program/Initiatives
Elimination of free transfers, and introduction of 1-day pass (sold onboard)Installation of validating fareboxes/TRiM units, and plan to replace calendar-month passes with 30-day rolling passes

facilitates electronic tracking of the sale of passes, thus mak-ing it much harder for an operator to give away free passes.This shift to dispensing magnetic day passes has also elimi-nated the need to “bag and tag” passes (the previous distri-bution process). Beginning in July 2002, the agency also con-verted fare vouchers that are distributed by social serviceagencies to their clients to Prepaid Day Passes; these too areswiped on boarding.
With the installation of the new fareboxes in early 2002,OCTA had converted the monthly passes from flash passes tomagnetic swipe (i.e., read-only) passes. This was an interimstep, prior to the introduction in July 2002 of rolling 30-daypasses. A pass must be inserted into the TRiM unit on its firstuse in order to activate it. On subsequent boardings, however,the pass is swiped instead. Like the decision not to dispenseday passes directly from the TRiM unit, OCTA seeks to min-imize use of the TRiM unit, hoping to hold down maintenancecosts; the TRiM unit is relatively complex machine, and typ-ically requires considerable preventive maintenance repairwork. GFI’s Odyssey farebox has the capability to issue astored value card containing the rider’s change (e.g., if therider pays the fare with a bill of $5 or higher). OCTA, how-ever, decided not to use the change card feature, havingdecided not to use stored value as a payment option at all. Inaddition to the desire to minimize use of the TRiM unit, man-agement felt that issuing change cards would have a negativeimpact on boarding times. OCTA is, however, consideringthe possibility of adding 7-day rolling passes to its mix offare options at some point.
RESULTS AND IMPACTS OF FARE INITIATIVES
Ridership and Revenue Impacts and CustomerBenefits
The ridership and revenuetotals for 1999–2001 are sum-marized in Table CS9-1. Asindicated in the table, ridershipand revenue have both beengrowing during this period,with pass revenue represent-
ing the largest area of increase (more than a 50 percent risein 2000, and another 18 percent rise in 2001). Since the elim-ination of transfers and introduction of day pass occurred in1999, these actions were not likely a direct factor in anyincreases in ridership or revenue after 2000. However, theelimination of free transfers can be considered a key factorin the increased sale of passes in general. Moreover, the elim-ination of free transfers does not appear to have had any sig-nificant dampening effect on demand.
Table CS9-2 present the revenue trends, for (1) the periodbefore and after the introduction of the day pass and elimi-nation of transfers, and (2) the period before and after theincrease in the day pass price from $2 to $2.50. (The monthly
148
totals are also shown in Figure CS9-1.) The day pass wasoffered beginning on July 9, 1999, and the price was raisedexactly 6 months later, on January 9, 2000. As indicated inTable CS9-2, farebox revenue—which represents cash faresonly prior to July 1999 and both cash fares and purchase ofday passes beginning at that point (because OCTA has not,to this point, tracked onboard day pass sales separately fromcash fare payment)—increased significantly in the periodstarting in July; the 6-month average for July–December ismore than 13 percent higher than the previous 6-month aver-age. Meanwhile, monthly pass revenue rose even more, show-ing an increase of almost 19 percent. Overall fare revenuegrew by nearly 17 percent following the July 1999 fare struc-ture change.
The January 2000 day pass increase produced (or at leastcontributed to) a major shift to monthly passes: the 6-monthaverage for January–June 2000 is nearly a third higher thanthat for the previous 6 months. In contrast, the increase infarebox revenue following the day pass price change wasmuch smaller, at under 3 percent. As shown in the table, theoverall revenue average for January–June 2000 was over 6percent greater than that for July–December 1999. Withregard to day pass purchases, OCTA reports that the priceincrease resulted in a sharp decline—from an average ofroughly thirty-five thousand per day to around twenty thou-sand per day after the price change (i.e., a drop of more than40 percent). While most of the riders shifting from the daypass apparently began to use monthly passes, some clearlyshifted to paying cash (i.e., those making only two trips perday, some of whom doubtless purchased day passes at the $2price). The average use of a day pass following the priceincrease has been 4.6 boardings; this has increased from anaverage of about 4 per day at the original price.
Based on the feedback the agency has received to date, theelimination of transfers has apparently had minimal negativeimpact on customers. It had been anticipated that there couldbe complaints from riders making only one-way trips andthus unable to benefit from a day pass; however, OCTAreports that there were virtually no complaints following thechange. The agency’s marketing campaign surrounding thefare structure modification was apparently effective at explain-ing the change and the procedure for purchasing and usingday passes. Staff reports that, within a week of the change,riders had by and large adapted to the new structure; in fact,riders were apparently “helping each other out” in buying thenew passes. As explained below, the removal of transfersalso eliminated what had been the primary source of argu-ments with operators, and this has in turn contributed to amajor reduction in rider complaints in general.
Operational and Administrative Impacts andIssues
The major operational and administrative impacts associ-ated with the elimination of free transfers and introduction ofday passes change have been as follows:

149
TABLE CS9-1 Ridership and revenue totals
Category 1999 2000 2001Total Fare Revenue 32,443,586 36,907,066 38,135,963
4.6% 13.8% 3.3%Farebox Revenue* 27,759,446 29,670,923 29,726,019
NA** 6.9% 0.2%Monthly Pass Revenue 4,281,847 6,476,911 7,654,523
NA 51.3% 18.2%Voucher Revenue 402,294 759,231 755,421
NA 88.7% -0.5%Ridership (Unlinked) 54,904,000 55,417,000 60,851,000
4.7% 0.9% 9.8%Avg. Fare per Rider 0.59 0.67 0.63
-0.1% 12.7% -5.9%
Annual Total (dollars)/Percent Change from Previous Year)
SOURCES: OCTA Revenue reports, APTA Ridership Reports, National Transit Database.* This includes cash and day pass revenue.** Not applicable.
TABLE CS9-2 Fare revenue before and after day pass introduction and day passprice increase
Farebox Pass Voucher TotalMonth Revenue Revenue Revenue Revenue
Cash faresJan-99 $2,061,907 $301,895 $0 $2,363,803Feb $2,007,503 $328,841 $0 $2,336,344Mar $2,283,018 $337,782 $0 $2,620,800Apr $2,099,401 $332,153 $0 $2,431,554May $2,278,342 $335,650 $0 $2,613,992June $2,273,232 $320,766 $0 $2,593,9986-mo. average $2,167,234 $326,181 $0 $2,493,415
Cash fares and onboard
day-pass sales
$2 day passintroduced
July-99 $2,334,709 $375,296 $161,125 $2,871,130Aug $2,523,413 $378,296 $94,700 $2,996,409Sep $2,539,767 $383,749 $37,031 $2,960,547Oct $2,604,064 $402,217 $61,400 $3,067,681Nov $2,411,279 $408,990 $26,013 $2,846,282Dec $2,342,810 $375,814 $22,025 $2,740,6496-mo. average $2,459,340 $387,394 $67,049 $2,913,7831999 average $2,313,287 $356,787 $33,525 $2,703,599
Day pass priceraised to $2.50
Jan-00 $2,534,474 $412,318 $77,019 $3,023,811Feb $2,294,987 $491,611 $45,775 $2,832,373Mar $2,680,286 $520,279 $121,906 $3,322,471Apr $2,466,645 $532,157 $56,169 $3,054,971May $2,677,343 $566,243 $26,481 $3,270,067June $2,484,242 $547,545 $52,056 $3,083,8436-mo. average $2,522,996 $511,692 $63,234 $3,097,923Jul-00 $2,635,717 $539,864 $75,088 $3,250,669Aug $2,592,927 $553,909 $83,925 $3,230,761Sep $2,109,641 $559,162 $71,294 $2,740,097Oct $2,574,950 $589,767 $95,294 $3,260,011Nov $2,373,846 $604,710 $12,044 $2,990,600Dec $2,245,867 $559,346 $42,181 $2,847,3946-mo. average $2,422,158 $567,793 $63,304 $3,053,2552000 average $2,472,577 $539,743 $63,269 $3,075,589

• Elimination of operator-rider arguments regarding thevalidity of transfers.
• Need to retrain operators when the day pass was intro-duced.
• Elimination of abuse of transfer policy (i.e., riders usingexpired transfers, or requesting transfers and then giv-ing them to other people); however, there was appar-ently still some incidence of operators handing out daypasses to some riders for free—this had resulted fromthe lack of controls over the distribution/return of padsof paper day passes, and the agency subsequently insti-tuted greater controls (i.e., each operator was given acertain number of passes each day, based on the generalrate of demand on the particular route).
• Increased accounting and administrative costs (i.e., in“bagging and tagging” bundles of passes for particularoperators and routes).
As mentioned above, the later shift to dispensing mag-netic day passes has eliminated the need to bag and tagpasses, as the operator must now feed each pass through theTRiM unit in order to activate it. This will facilitate elec-tronic tracking of the sale of passes, thus making it muchharder for an operator to give away free passes. This willalso reduce the administrative cost associated with daypasses.
The installation of the new fareboxes and the shift to elec-tronic fare collection has also had the following impacts:
• Need to show riders how to properly use the fareboxes(e.g., how to insert day passes into the TRiM units andhow to insert bills and coins into the farebox); due to theneed to validate each bill, the new fareboxes do notreadily accept old (i.e., soft) or torn bills; toward this
150
end, the operators interviewed felt that better signage isneeded on the fareboxes (although OCTA providesvideo instructions on its website, many transit ridersmay lack access to the Internet). These operators alsofelt that difficulties in proper insertion of bills and coinshave slowed down boarding times somewhat.
• Need for operator training; in this regard, the operatorsinterviewed felt that they should have received moretraining than was provided—and that the training shouldhave been done closer to the actual installation of thenew fareboxes.
The issues associated with the new fareboxes should dimin-ish as operators and, particularly, riders become more used totheir operation. For instance, staff claim that many riders arealready getting used to the fact that they need to use crispbills on the bus (i.e., as they would have to use in a vendingmachine).
Finally, the use of rolling passes is expected to have cer-tain new impacts, including the following:
• Reduce the administrative requirements and costs associ-ated with selling and distributing calendar-month passes.Prior to introduction of rolling passes, thousands ofcalendar-month passes (considerably more than the num-ber actually sold) had to be printed and distributed toemployers and sales locations each month, and the sales/reconciliation effort was concentrated into a short periodfrom the last few days of a month through the first fewdays of the following month. The use of rolling passeswill allow bulk distribution (i.e., since passes are nolonger tied to a particular month) and will eliminate thewaste associated with printing extra monthly passeseach month.
$0
$1,000,000
$2,000,000
$3,000,000
$4,000,000
$5,000,000
$6,000,000
$7,000,000
Jan-
99
Feb
Mar
Apr
May Jun
Jul
Aug
Sep Oct
Nov
Dec
Jan-
00
Feb
Mar
Apr
May Jun
Jul
Aug
Sep Oct
Nov
Dec
Total RevenueVoucher RevenuePass RevenueFarebox Revenue
Day Pass introduced Price increased
Figure CS9-1. Fare revenue trend.

• Eliminate the need for operators to visually inspect passes.The interim strategy, using magnetic swipe monthlypasses, has already had this impact. The introductionof rolling passes has at least initially added somewhatto operators’ responsibilities; however, as riders arerequired to insert the card to activate it on the first useand then swipe it on subsequent uses, it seems likely thatsome riders will be unsure when to insert and when toswipe—and that the operators will have to spend timeexplaining the proper procedure. Depending on howwell this change is explained, there could well be a con-siderable incidence of disagreements and complaintswith this method of pass use.
Despite the transitional problems associated with the newfareboxes, OCTA’s fare initiatives have generally had a pos-itive impact on the agency and the operators—chiefly interms of reduction of operator-rider confrontations and reduc-tion of fare abuse associated with free transfers.
CONCLUSIONS AND LESSONS LEARNED
Customer Impacts and Benefits
The fare initiatives discussed in this case study have hadthe following customer-related impacts and benefits:
• Reduced the cost of travel for many riders (i.e., by offer-ing low-price 1-day passes).
• Provided more convenient fare options, in the form of1-day passes that can be purchased onboard buses androlling 30-day passes.
• Eliminated what had been the primary source of argu-ments with operators, the validity of transfers.
Moreover, the fact that ridership and revenue continued togrow following the elimination of transfers—coupled withthe virtual absence of complaints about the elimination oftransfers—suggests that riders have readily accepted thechanges.
Agency Impacts and Benefits
OCTA’s fare initiatives have also had a generally positiveimpact on the agency’s administrative and operational farecollection requirements; the impacts and benefits include thefollowing:
• Reduced operator requirements for administering farecollection, and eliminated rider-operator confrontationsregarding validity of transfers.
• Reduced the extent of transfer abuse.• Reduced fare collection costs associated with selling
and distributing fixed-calendar monthly passes; how-
151
ever, required training of operators (first, when day passintroduced, then when new fareboxes installed).
• Resulted in an overall increase in fare revenue (17 per-cent after elimination of transfers, then an additional 6percent rise following increase in day pass price); alsoincreased average fare per rider.
• Resulted in a large increase in the use of monthly passes(19 percent after elimination of transfers, 32 percenthigher after increase in day-pass price).
Liability to Agency
OCTA risked losing revenue through the introduction ofday passes because of the lack of controls over day pass distribution to operators. Indeed, the agency did experiencesome revenue loss through this procedure and had to institutemore stringent administrative controls. The shift to electroniccoding/distribution of the passes has introduced further con-trols, making it much more difficult for operators to give awaypasses.
OCTA also risked receiving equity-related complaints ineliminating transfers. However, as indicated above, there havebeen virtually no complaints over this issue. Riders needingto make frequent transfers instead began to buy day passes—or even monthly passes—rather than paying full single ridefares for each boarding.
Constraints and Barriers
The major constraint on the successful implementation ofOCTA’s fare initiatives was the aforementioned lack of con-trols over the distribution of day passes. It was not until theagency procured new equipment that proper controls couldbe implemented.
Required Equipment and Technology
OCTA originally implemented its major initiative, the saleof day passes and elimination of transfers, without acquiringany new technology; however, there were administrative lim-itations with the manual procedure, as discussed above. How-ever, with the subsequent procurement of new fareboxes, theagency was able to (1) shift the day pass from a paper instru-ment to a magnetic one and thus improve control and achievethe other types of benefits discussed above; and (2) shiftmonthly passes to a rolling, activate on first use basis.
Lessons Learned
Key lessons learned from the case study include the fol-lowing:

• The sale of day passes onboard vehicles can effectivelyoffset the loss of ridership—as well as complaints fromriders—that would normally be expected with the elim-ination of free (or low-cost) transfers.
• The elimination of free (or low-cost) transfers can greatlyreduce the incidence of rider-operator confrontations.
• Use of electronic fare technology can greatly improvean agency’s ability to control operator distribution ofday passes (i.e., to minimize abuse).
CASE STUDY CONTACTS
The following individuals were interviewed at OCTA head-quarters (Orange, CA) as part of this case study:
152
James Ortner, Manager Transit Technical ServicesOCTA 550 S. Main St.Orange, CA [email protected]
Dale Cole, Manager Accounting OperationsOCTA 550 S. Main St.Orange, CA [email protected]
Panel of six OCTA operators

153
CASE STUDY 10
TRANSITCENTER (NEW YORK CITY)
INTRODUCTION
TransitCenter is a public benefit corporation operating inthe New York City (NYC) region. It develops, markets, andoperates programs to increase transit ridership through build-ing fare media distribution relationships with employers.
TransitCenter distributes MetroCards®, for use with NewYork City Transit (NYCT) and affiliated transit operators thataccept MetroCards. TransitCenter also distributes its originalTransitChek® vouchers, accepted for fare media purchases bymost transit operators in the greater NYC region (includingoperators in New York, New Jersey, southwestern Connecti-cut, and northeastern Pennsylvania).
TransitCenter offers some additional programs, althoughthis case study focuses on the fare media distribution pro-grams. These related efforts include the TransitLink transitinformation program, general transit advocacy to employers,and advice to other transit agencies nationwide about initiat-ing similar programs.
TransitCenter has been instrumental in establishing prac-tical methods for employees and employers to make use ofthe available transit tax benefit, and has also played a role inthe success of the MetroCard program.
DEVELOPMENT AND IMPLEMENTATION OFFARE INITIATIVE
The origins of TransitCenter date to 1984, with initial part-nering efforts between transit agencies and employers. Thenature and range of its programs have evolved considerablysince then, but a driving force from the beginning has beenthe emergence and growth of the transit tax benefit. The evo-lution of the TransitCenter programs can be considered inthree distinct stages:
• Stage 1. Distribution ofTransitChek vouchers:The TransitCenter wasfounded essentially forproviding vouchers toemployers; these vouch-ers, then distributed toemployees, could be usedto purchase transit fare media from any transit agency inthe region.
• Stage 2. Distribution of MetroCards: With the emer-gence of the NYMTA’s MetroCard magnetic stripe fare-card program, TransitCenter expanded into distributingMetroCards through employers as well.
• Stage 3. Introduction of Premium TransitChek program:To promote its programs to larger employers, the recentlyadded Premium program allows employers to outsourceto TransitCenter the distribution of TransitChek products.
This section provides an overview of the TransitCenter pro-grams and how they have been developed and implemented.
Distribution of TransitChek Vouchers(1986–1996)
The initial impetus for the TransitChek vouchers programwas the 1984 passage of a $15 transit tax benefit provision inthe Federal Tax Code. Many employers were already provid-ing free parking as a tax-free benefit to employees, and thismeasure was intended to help balance an inherent incentivefor automobile commuting. Employers were now allowed toprovide up to $15 per month for transit use as a tax-free ben-efit to each employee. The benefit was also exempt frompayroll taxes for the employer. If the value of the benefitexceeded $15 per month, the entire amount of the benefitwould be considered taxable income.
Many employers expressed initial reluctance to providethe benefit. It was necessary to show that the employee wasusing the benefit for transit, so the options were:
• Reimburse employees for documented transit expenses.The employee would submit a receipt for purchasing a
Fare Program/Initiatives
Distribution of prepaid faremedia for multiple agenciesthrough employers:TransitChek® and Premium TransitChek®

transit pass or tokens, and the employer would reimburseup to $15. This represented an ongoing administrativeexpense for the employer and was cumbersome for theemployee as well.
• Sell the transit passes or tokens to the employees. If themonthly cost exceeded $15, the employer would cover$15 as a tax-free benefit and have the employee pay forthe remainder through a payroll deduction. While morestreamlined administratively, employers still had theburden of determining each month how many fare mediaof each type to purchase from each transit agency in theregion.
In 1984, the Port Authority of New York and New Jersey(PANYNJ) established the Employer Liaison Transportationoffice (ELTO) to work with employers on addressing suchissues as participating in the transit tax benefit program. Inaddition to operating a transit service (i.e., Port AuthorityTrans-Hudson—PATH—trains), PANYNJ, being a bi-stateagency, would represent NJ Transit (NJT) and the NY Met-ropolitan Transportation Authority (MTA)—which comprisesNYCT, Long Island Rail Road (LIRR), Metro-North Com-muter Railroad (MNCR), and Long Island Bus3—in dealingwith employers from both states.
Employers indicated the greatest interest in distributingvouchers, which employees could then use to purchase faremedia from any agency in the region. A voucher systemoperates as shown in Figure CS10-1. Employers purchase thevouchers, and the voucher provider sets the funds aside.Transit agencies accept a voucher as if it were a check fromthe voucher seller. Like a check, the voucher is then turnedin by the agency for reimbursement. A voucher scheme sim-plifies administration, since employers no longer need to dealwith multiple transit agencies to purchase and distribute mul-tiple fare media types. Since the use of vouchers was notexplicitly enabled under the original 1984 Federal Tax Codeprovisions, a clarification was added through 1986 Federallegislation.
In 1986, PANYNJ, MTA and NJT agreed to jointly cre-ate and fund a new organization—TransitCenter—to pro-mote transit to employers and operate a voucher scheme.
154
TransitCenter acquired additional seed funding from theFTA as a two-year demonstration program. TransitCenterwas established organizationally as an operating division ofthe PANYNJ. Various facilities and support services weretherefore provided by PANYNJ, which helped minimize ini-tial operating costs.
TransitCenter’s governing Board of Trustees had repre-sentatives from the three founding transit agencies, privatebus operators in NY and NJ, the NYC Department of Trans-portation, and the NY Chamber of Commerce and Industry.The last representation was particularly important, makingTransitCenter a joint operation between the transit agenciesand employers.
The transit voucher program was launched as TransitChekin 1987. PANYNJ hired contractors on behalf of Transit-Center to operate and market TransitChek. The initial Transit-Chek voucher was offered in a single $15 denomination.Later, increases in the maximum tax benefit led to introduc-ing additional TransitChek denominations:
• 1991. The benefit cap was increased to $21. Transit-Chek was offered in both $15 and $21 denominationsbeginning in 1992.
• 1993. The benefit cap was increased to $60. In addition,the tax benefit for parking was capped—for the firsttime—at $155. TransitCenter added a $30 denomina-tion and phased out the $21 denomination.
The program charged a fee to employers for voucher pur-chases from the outset. This fee structure evolved through theearly years of the program, but has always incorporated afixed shipping charge per order coupled with a variable pervoucher charge, as summarized in Table CS10-1. The 1989fee structure change involved switching to a “volume dis-count” strategy. The 1993 pricing change (which remains inplace today) coincided with the 1992 introduction of multi-ple voucher denominations.
Distribution of MetroCard (1997–2001)
By 1997, TransitCenter had achieved revenue self-sufficiency. Two important changes in the TransitChek pro-gram during this period helped support continuing growth:
• Further legislative enhancements to the transit tax ben-efit program.
• Direct distribution of fare media for the new NYCTMetroCard program.
Beginning in 1998, further federal legislation expanded thetransit tax benefit once again. The monthly cap increased to$65, and, for the first time, it was no longer mandatory thatthe employer fund the entire benefit. The employee could alsofund the benefit through monthly payroll deduction, with the
Employees Transit Agencies
Voucher-Selling Organization
Employers Vouchers
Vouchers
Vouchers Vouchers
$
$
Figure CS10-1. Original transit benefit vouchers scheme.

deducted amounted treated as pretax income. Alternatively,the funds could come from a combination of employee-funded payroll deduction and employer-funded fringe bene-fits. However the benefit was provided, the employee and theemployer were exempted from income and payroll taxes,respectively. In conjunction with this change, TransitCenterintroduced a $35 voucher denomination to complement the$15 and $30 denominations.
NYCT began implementing the MetroCard automatedfare collection system on a limited basis in 1994, and system-wide implementation for subway and bus was completed in1997. MetroCard is a magnetic stripe farecard. The cards canbe loaded with either stored value or a rolling pass (1, 7 or 30days). The rider swipes the card when entering the subwayor inserts the card on boarding a bus to have the fare deductedfrom the card balance or to indicate that the card carries avalid pass.
MetroCard was initially provided only in stored valuemode, but its usage began to grow significantly in the late1990s, once the card could be used systemwide and after sev-eral pricing innovations were introduced. These includedfree transfers between bus and subway, a 10 percent bonuson loads of at least $15, and the aforementioned unlimitedride passes.
MetroCards are distributed and revalued at subway stationsby token booth clerks and automated vending machines. Afactor limiting MetroCard market penetration is that manybus users are not subway users and thus do not find it conve-nient to revalue at subway stations. Third-party distributionof MetroCards is an important part of the NYCT strategy.One such distribution channel is the sale of pre-encodedMetroCards through retailers. NYCT typically pays such dis-tributors a commission of about 3 percent. TransitCenterarranged with NYCT in 1997 to offer an additional distribu-
tion channel, through employersthat participate in the TransitChekprogram.
TransitCenter distributes distinc-tive MetroCards, carrying both theMetroCard and TransitChek logos.TransitChek stored value Metro-Cards were originally offered in$15, $30 and $35 denominations,matching the denominations of
155
TransitChek vouchers. Later, whenNYCT introduced unlimited rideMetroCard passes, these were alsodistributed through TransitChek, in$17 (valid for 7 days from first use)and $63 (valid for 30 days fromfirst use) denominations. The Transit-Chek stored value MetroCards weremodified as well when NYCT introduced the 10 percentbonus (e.g., the $15 card carries $16.50 stored value), andwere then referred to as “bonus value cards.”
In January 2001, TransitCenter was spun off as an inde-pendent public-benefit corporation and is thus no longer anoperating division of PANYNJ.
Introduction of Premium TransitChek Program(2002)
Since the beginning of 2002, two major changes suggestthat the TransitCenter initiative is entering a third significantstage in its development:
• The maximum monthly value of the transit tax benefitincreased to $100. At this point, a $50 TransitChekvoucher denomination was added.
• The Premium TransitChek program was initiated, aim-ing to attract more large employers to TransitChek.
A pilot program was initiated with the NYC governmentin 2000 to distribute TransitChek to some of its unionizedemployees under a program known to the employees asTransitBenefit. After some expansion of the pilot program,it was made available in June 2002 to any interestedemployer. By the general launch, the Premium program hadenrolled about 30,000 NYC employees and a few thousandemployees from other employers.
From the employee perspective, the Premium TransitChekMetroCard is an unlimited rideMetroCard that is issued only onceper year. The Premium TransitChekMetroCard remains valid as long asthe corresponding $63 per monthpayroll deduction remains in place.
TABLE CS10-1 Evolution of the TransitChek fee structure
Period Fixed Shipping Charge Per Voucher Charge 1987-88 • 12-50 vouchers: $11
• 50+ vouchers: $20 • Unseparated in sheets of 3: $0 • Separated: $0.08
1989-92 • $10 • 12-35: $0.75 • 36-100: $0.60 • 101-750: $0.45 • 750+: $0.30
1993-present • $12 • 4 percent of value
The card has a serial number, and a lost or stolen card will bevoided and replaced.
From the employer perspective, the Premium programrelieves any responsibilities for purchase of TransitCheks ordistribution to employees. Once the payroll deduction is setup, TransitCenter takes care of issuing the card directly to theemployee annually. The cost to the employer increases to 5percent for the Premium program. Alternative arrangementsare available for employees who use transit agencies otherthan NYCT and are thus unable to use MetroCard:
• Employees with ticket-by-mail accounts receive theirpasses by mail each month from the transit agency, typi-cally paying by pre-authorized credit card. Under the Pre-mium program, these employees can have TransitCentercredit their payroll deductions to their ticket-by-mailaccounts each month. Transit agencies in the region offer-ing ticket-by-mail arrangements include LIRR, MNCR,NJT, and PATH.
• Employees without ticket-by-mail arrangements canhave TransitCenter periodically send them TransitChekvouchers in bulk by mail.
RESULTS AND IMPACTS OF FARE INITIATIVES
This section reviews TransitCenter’s growth over the yearsand the resulting impact on funding requirements. The mostsignificant change in the latter was the transition, over aten-year period, from predominantly outside funding to self-sufficiency through program revenues. Initially, funding wasalmost entirely based on grants from transit operators andgovernment agencies, as well as some private sector in-kindsupport; over time, however, the contribution of revenuefrom TransitCenter’s programs increased considerably.
According to a marketing study completed for Transit-Center in 1994, the TransitChek program showed a steadyannual growth rate in sales revenue between 1987 and 1992of about 25 percent to 35 percent. The substantial increase inthe maximum benefit in 1993—from $21 to $60 per month—accelerated these increases. In 1993, sales revenue increased200 percent over 1992. Comparing the 1986–87 inauguraloperating budget with that for 1993–94 shows an increasefrom about $2 million to about $6.3 million, with the sharegenerated by TransitCenter programs increasing from 0 per-cent to about 53 percent. As this growth trend continued,TransitCenter was able to achieve self-sufficiency—withno further funding required from government or transitagencies—by 1997.
In general, TransitCenter has found that program revenuegrowth occurs through (1) increases in the number of partic-ipating employers and (2) gradual increases in the number ofparticipating employees at a given employer over a 3–5 yearperiod (i.e., due to “word of mouth”). However, a 1997 AuditReport from the Office of the New York State Comptroller
156
(tracking the TransitChek program between 1992 and 1995)indicated that new enrollees actually dropped, from 1,579employers in 1993 to 1,089 employers in 1995. While theincrease in the maximum monthly benefit from $21 to $60 in1993 had made the TransitChek program much more attrac-tive to employees, the ability to attract new employers intothe program was limited by the fact that only the employercould fund the benefit. The additional flexibility incorporatedinto the transit tax benefit in 1998—allowing the employeeto contribute as well—helped address this issue.
The 1998 tax benefit change, coupled with the introduc-tion of MetroCard distribution in 1997, led to an accelerationof the growth of the TransitChek program. Over the firstdecade of the program, enrollment reached roughly 100,000employees. Since 1997, though, enrollment in TransitCenterprograms has grown to around 350,000 employees—representing over 14,000 employers. The current growth rateis about 25,000 employees—and about 2,000 employers—per year.
Much of the participation in the TransitChek programscomes from smaller employers, however, and TransitCenterhas been concerned for years with the reluctance of largeremployers to participate—despite substantial marketing effortstargeting these organizations. The marketing report completedfor TransitChek in 1994 revealed that 80 percent of the par-ticipating employers had 25 employees or fewer. This isdespite provisions of the 1990 Clean Air Act Amendments,which require employers with 100 or more employees todevelop a program to significantly reduce single vehicle occu-pancy commuting. TransitCenter had been marketing to largeremployers on this basis.
Discussions with larger employers have long revealed thatthe administrative time needed for purchasing TransitChekMetroCards and vouchers and then distributing them toemployees was considered an impediment. While a smallerfirm simply has one or more existing employees cover theseneeds informally as an adjunct to their normal workloads, theperception in larger firms has been that dedicated staff andchanges to administrative procedures would be needed. ThePremium TransitChek program has been developed largelyto respond to these issues. TransitCenter hopes that it willsignificantly improve TransitChek market penetration withlarger employers.
CONCLUSIONS AND LESSONS LEARNED
Customer Impacts and Benefits
The TransitChek program has two types of benefits fortransit customers in the NYC region:
• For NYCT riders, the availability of MetroCard transitfare media through employers has increased, which is

more convenient than purchasing MetroCards directlyfrom NYCT.
• For riders with all transit agencies in the region, Transit-Chek has provided practical mechanisms to increase thenumber of employers making the transit tax benefit avail-able. The resulting employee tax savings have offset tran-sit commuting costs.
To illustrate typical employee tax savings, Table CS10-2offers an example from the TransitCenter website (19), demon-strating how a typical NYC commuter’s take-home paymight effectively be increased by about four hundred dol-lars per year.
Agency Impacts and Benefits
TransitChek has two types of benefits for participating tran-sit agencies:
• Enhanced market penetration for fare media distributionthrough employers.
• Improved commuting modal share for transit.
157
The $400 annual income tax saving discussed above wasachieved by spending $1,200 per year on transit. Employ-ees who need to increase their annual transit expenditure totake full advantage of the transit tax benefit will likely seekto decrease nontransit travel expenses to compensate. Thisincreases transit ridership, in particular for those switchingto a monthly pass. Survey results from the 1994 marketingreport completed for TransitCenter indicated increases inreported annual transit trips as shown in Table CS10-3.
With regard to agency costs, TransitCenter would not revealthe specific terms of its MetroCard distribution arrangementwith NYCT but indicated that its commission is less than the3 percent commission NYCT pays to retail distributors. (Thecommission paid by NYCT supplements the regular feesTransitCenter receives from employers for these MetroCards.)NYCT also benefits from TransitCenter bearing the costs ofcard production and distribution.
The transit agencies made substantial financial investmentsin TransitCenter until it became financially self-sufficient in1997. Table CS10-4 shows the order of magnitude of thesecontributions for the inaugural 1986–87 budget and for the1993–94 budget.
TABLE CS10-2 Sample of annual employee tax savings
Without Pretax TransitChek
With Pretax TransitChek
Annual Salary
$48,000 $48,000
Pretax TransitChek Deduction $0 -$1,200 Salary Subject to Payroll Taxes $48,000 $46,800 Payroll Taxes (35 percent) -$16,800 -$16,380
Annual Transit Expense
-$1,200 $0
Take-home Pay $30,000 $30,420
TABLE CS10-3 Reported increases in transit trip making
Changes in Transit Usage Work Trips Nonwork Trips Use transit more often 11 percent 15 percent Average claimed additional annual trips 139.2 104.4
TABLE CS10-4 Contributions to sample TransitCenter budgets
Budget MTA, NJT, PATH Federal/State Government Total 1986-87 $354,800 $3,509,000 $3,863,800 1993-94 $1,500,000 $1,430,000 $2,930,000

Impacts and Benefits for Partner Entities
Before the TransitChek program, many employers werereluctant to distribute fare media to employees because of theadministrative impacts. Prepaid fare media differed for eachtransit agency and had to be issued every month. Employersthat did not canvass their employees each month on the faremedia needed would have to purchase a variety and thenreturn those not needed. Even when the employer knew theexact mix of fare media required, it was still often necessaryto purchase from multiple transit agencies. TransitChek hasaddressed these issues.
Employers have an incentive to participate based on thepayroll tax savings available. To illustrate typical employerpayroll tax savings, Table CS10-5 offers an example fromthe TransitCenter website (19), demonstrating how two hypo-thetical employers could see substantial net savings.
Liability to Agency
The transit agencies do not risk losing revenue through theTransitChek program, since TransitChek is used to purchaseeach agency’s own fare media.
Constraints and Barriers
The primary barrier faced by TransitCenter has been itslimited ability to attract participation from larger employers,as discussed earlier. TransitCenter seeks to address this issuethrough the introduction of the Premium TransitChek pro-gram, allowing employers to substantially outsource the pur-chase and distribution of transit fare media to employees.
With regard to funding, TransitCenter was fortunate inbeing supported for its first decade—i.e., until it reached a point at which it could sustain itself through its own revenues—through contributions from the three major transitagencies in the region, as well as from the federal and stategovernment.
Required Equipment and Technology
The TransitChek program requires no new equipment ortechnology on the part of the participating transit agencies.
158
Some agencies opted to purchase devices for their faremedia sales locations so their sales clerks could examineanti-counterfeit security features built into the vouchers.
The TransitChek program itself requires considerable equip-ment and technology for the fulfillment of the fare mediaorders. These requirements have increased with the intro-duction of Premium TransitChek. Individual cards must nowbe sent directly to customers in addition to the establishedneed to send bulk fare media orders to employers. From theoutset, TransitCenter has responded to this challenge by out-sourcing these technology-intensive aspects of its operationto private-sector fulfillment contractors that were alreadyequipped for this role.
Another technology development has been the introductionin recent years of electronic commerce for fare media ordersthrough the Internet. TransitCenter now has two InformationTechnology staff to support this aspect of its operations.
Lessons Learned
Key lessons learned from the development and evolutionof TransitCenter and its programs include the following:
• It was important that the program be separate from theday-to-day operations of any one transit agency, espe-cially in a case like TransitCenter, where there was aneed to represent multiple agencies to the employers.
• It was important to charge a processing fee to employersfrom the start. This provided a mechanism for movingtowards financial self-sufficiency within a reasonableperiod, and it also avoided the difficulty of introducing afee to employers later (i.e., after a no-fee precedent hadbeen established).
• A dedicated marketing/sales group and extensive use ofmarketing campaigns have been essential in understand-ing the needs of different employer categories and inmarketing to both employers and employees.
• A key to acceptance of TransitCenter’s initiatives by theagencies and employers was the development of the ini-tial TransitChek program as a partnership between thetransit agencies and organizations representing employ-ers in the region.
TABLE CS10-5 Samples of annual employer cost savings
Number of Employees
Annual Payroll
Annual TransitChek
Purchases
Annual TransitChek
Cost (based on 4 percent
commission)
Company Tax Savings
Net Savings
100 $2,200,000 $120,000 $4,800 $10,400 $5,600 100 $4,400,000 $120,000 $4,800 $9,700 $4,900

CASE STUDY CONTACTS AND SOURCES
The following individual was interviewed at TransitCenterheadquarters (NYC) as part of this case study:
Larry Filler, President and CEOTransitCenter, Inc.1065 Avenue of the Americas, 16th FloorNew York, NY 10018212-329-2032212-719-1822 (fax)[email protected]
159
The following documents were used in preparing thecase study:
Volpe National Transportation Systems Center, TransitChekin the New York City and Philadelphia Regions. Preparedfor the Federal Transit Administration, 1994.
Office of the New York State Comptroller, Report 96-S-8,Port Authority of New York and New Jersey: Administra-tion of the TransitChek Program. 1996.
Charles River Associates, The TransitChek Program, 1994:A Summary of the Results of Participating Employers andEmployees. Prepared for TransitCenter, January 1995.
160
CASE STUDY 11
TRI-COUNTY METROPOLITAN TRANSPORTATION DISTRICT
INTRODUCTION
The Tri-County Metropolitan Transportation District of Oregon (Tri-Met) is a municipal corporation that pro-vides public transportation for much of the three counties in the Portland, Oregon, metropolitan area. Tri-met oper-ates a 38-mile light rail line (MAX), 97 bus routes and ser-vices for seniors and persons with disabilities. It has alsoentered into partnerships to provide innovative services.Tri-Met operates a total of 701 buses serving 8,435 busstops, as well as 78 light rail vehicles serving 54 stations(FY 2001). An additional 186 buses provide door-to-doorparatransit service. Total system ridership (FY 2001) wasapproximately 84.3 million boardings, a 3.8 percentincrease over the prior year.
For general fare purposes, the Tri-Met district is dividedinto three concentric zones. Most fares and passes are sold asvalid either for any two zones or for all zones (e.g., a 1-month-two-zone pass for $45 or a 1-month-all-zone pass for $56).Day Tickets, the 6-hour QuikTiks, and special fare media(e.g., Event Fares and Convention Pass Fares) are only sold asvalid for all zones.
This case study reviews two distinct Tri-Met fare initia-tives:
• The PASSport annual employer pass program• The QuikTik short-term pass
The PASSport program is Tri-Met’s principal annual passprogram for employers and is part of a package of programsthat Tri-Met offers to employers. There is also a related col-lege PASSport program. The QuikTik is a special 6-hour, allzone pass.
DEVELOPMENT AND IMPLEMENTATION OFFARE INITIATIVES
PASSport Program
The PASSport program is the centerpiece of a set of pro-grams that Tri-Met has designed for employers. This pro-gram allows an employer to provide an all-zone annual passat a reduced rate per employee to all qualified employees.The pass itself consists of the employee’s photo identifica-tion card with a Tri-Met validation sticker.
In the early 1960s, employers generally had not been sup-portive of Tri-Met. This was due, in part, to the fact that Tri-Met is partially funded by a payroll tax on employers. Thus,they already saw themselves as paying for Tri-Met service,and it was difficult for Tri-Met staff to convince them to takefurther efforts to support transit. In 1996, the Oregon Depart-ment of Environmental Quality (DEQ) implemented theEmployee Commute Options (ECO) Rule in order to improveregional air quality. This rule asks Portland metropolitan areaemployers that employ over 50 people at any single worksite to reduce employee auto trips by 10 percent or more overthree years. Employers are to implement programs that encour-age employees to use alternatives to driving alone and mustconduct annual surveys to identify how employees com-mute to work.
Tri-Met perceived the ECO rule as an excellent opportu-nity to increase ridership, revenue, and public support by build-ing better relationships with employers and offering new passprograms. Tri-Met began by offering employers general assis-tance in complying with the ECO Rule, including assistancein understanding the requirements of the rule and developinga plan for reducing employee trips, as well as actually con-ducting and analyzing the employee surveys, all at no cost tothe employer. Tri-Met also developed new employer pass pro-grams, including PASSport, designed to simplify the processof providing transit incentives for employers.
In developing the PASSport program, Tri-Met began bylooking for similar programs around the country and identi-fied three: (1) Denver RTD’s EcoPass and university passesin (2) Eugene, Oregon (University of Oregon) and (3) Seat-tle, Washington (University of Washington). These programstook two basic approaches to pricing the pass: RTD divided
Fare Program/Initiatives
Annual employer pass programShort-term (6-hour) pass

161
the city into a set of zones and set a flat price in each zone,while the universities priced their passes based on actual tran-sit use. Tri-Met decided to implement two separate experi-mental projects, one using each pricing scheme. The flat rateexperiment was implemented in the Lloyd District, an areaeast of downtown that includes the Convention Center,Lloyd Center (a large shopping mall), and many hotels andoffices. To support the PASSport program, and transit gen-erally, the Lloyd District eliminated free on-street parkingwhen the PASSport program was introduced.
The other PASSport experimental program started by usingthe ECO Rule survey data to establish 14 zones within whichaverage mode splits were similar. Some of the zones includedtwo or more discrete areas within the region, with the resultthat the map of the PASSport fare zones divided the regioninto a total of 26 different areas. Within each zone, Tri-Metdefined a set of 7 ranges of transit mode splits and establisheda separate price for each range, creating a matrix of 98 pos-sible prices for a company. The price matrix is presented asTable CS11-1.
Tri-Met’s efforts to assist employers in complying with theECO Rule were successful in convincing many employers tosupport Tri-Met. The PASSport program itself also met withconsiderable support, especially once the Oregon DEQ ruledthat adopting a PASSport program is prima facie evidence ofcompliance with the ECO Rule. However, the PASSport pric-ing matrix proved unsatisfactory. Employers complained thatit was confusing and that the steps were inequitable since theymade some small changes in mode split significantly moreimportant, and expensive, than others. Equity concerns werealso raised regarding the boundaries of the fare zones, sincethe specific lines were generally arbitrary. Tri-Met also foundthat over time too many companies were ending up in step 7,with mode splits significantly above average. Such companieswere paying less, in some cases much less, per employeeactually using transit than companies in the lower steps, con-tributing further to the appearance of inequity and thus reduc-ing Tri-Met’s potential revenue.
To alleviate these concerns, Tri-Met has decided to con-vert the PASSport program to a price per employee basedsolely on the transit mode split at each company and the priceof the all-zone pass ($615, as of mid-2002). Despite concernsthat it is underpriced compared to the rest of the Tri-Met dis-trict, the Lloyd District will continue to have its separate flatrate program because of the additional efforts it has made toincrease transit use. The airport will also have a flat rate zoneto address its own transportation concerns.
One of the primary goals for Tri-Met’s PASSport programis to be revenue-neutral. At many agencies, being revenue-neutral implies that no revenue is lost on the program. Inother words, if the agency was collecting $200,000 in rev-enue from commuters before implementation of the program,it is not collecting less than $200,000 after implementation,even though each commuter is paying less for a transit pass.
The reason revenues may not decrease is that under the pro-gram, a pass is purchased for every employee at a company,even those who do not ride transit, whereas prior to the pro-gram only transit riders would have purchased passes.
However, Tri-Met’s definition of revenue neutrality differsin that it does not consider revenue prior to program imple-mentation as the initial comparison point. Rather, the agencyconsiders the program to be revenue neutral if it is collectingthe same amount of revenue from PASSport participants as itwould have been collecting had all of the current riders beenpurchasing regular monthly passes. In other words, the com-panies should be paying full price for all employees who areactually riding (since the price is based on actual ridership).This concept is what determines the different price levels.
Tri-Met allows employers to charge employees for passes,up to the price per pass paid by the employer. Tri-Met alsoassists employers that do not have photo ID badges to pro-duce such badges and affix the annual validation stickers.
It is interesting to note that both Tri-Met and King CountyMetro have similar programs in which employers purchasepasses for all employees, and that both agencies have recentlychanged their pricing mechanisms to simplify their programs.Metro moved from pricing companies based on their indi-vidual transit mode splits to pricing companies based on geo-graphic zones and a zone-wide average transit mode split.Tri-Met moved from using a combination of geographic zones,zone-wide average transit mode splits, and individual transitmode splits to just using the transit mode split of each indi-vidual company. A principal reason for this is the availabil-ity of data on the transit mode split of each company. Tri-Metuses a survey that companies with 50 or more employees arerequired by DEQ rule to conduct each year. In King County,only companies with more than 100 employees must do asurvey, and that survey is only required every other year.Metro therefore found it had to conduct its own surveys atleast every other year.
The results and impacts of the PASSport program are dis-cussed below.
QuikTik
QuikTik is a 6-hour ticket that is valid for all zones. It ispriced at $3, a significant discount from the $4 all zone DayTicket, and a slight discount from the $3.10 it would cost fora single all zone round trip paying the cash fare. Like the DayTicket, QuikTik is sold at the light rail TVMs and on boardbuses. Drivers use standard paper transfers to represent boththe QuikTik and the Day Ticket: the QuikTik is essentially a6-hour transfer (compared with the normal 1-hour free trans-fer), and the Day Ticket is punched as an all-day transfer.
QuikTik was implemented in September 2001 and wasdesigned to serve people who generally do not use transit butmight be willing to use it for going to an event, a show, or

162
TABLE CS11-1 PASSport pricing matrix
Pricing Cell PASSport Zone 1 2 3 4 5 6 7
Comp.* Mode Split
0-0.6 percent
0.7-1.1 percent
1.2-1.7 percent
1.8-2.3 percent
2.4-2.8 percent
2.9-3.4 percent
3.5-100 percent A
Price / Employee
$10 $10 $10 $13 $16 $19 $21
Comp. Mode Split
0-0.7 percent
0.8-1.5 percent
1.6-2.2 percent
2.3-2.9 percent
3.0-3.7 percent
3.8-4.4 percent
4.5-100 percent
B Price /
Employee $10 $10 $12 $17 $21 $25 $27
Comp. Mode Split
0-1.0 percent
1.1-2.0 percent
2.1-3.0 percent
3.1-3.9 percent
4.0-4.9 percent
5.0-6.2 percent
6.3-100 percent C
Price / Employee
$10 $10 $16 $22 $28 $34 $35
Comp. Mode Split
0-1.2 percent
1.3-2.5 percent
2.6-3.7 percent
3.8-4.9 percent
5.0-6.2 percent
6.3-7.4 percent
7.5-100 percent
D Price /
Employee $10 $13 $20 $28 $35 $42 $44
Comp. Mode Split
0-1.4 percent
1.5-2.7 percent
2.8-4.1 percent
4.2-5.4 percent
5.5-6.8 percent
6.9-8.2 percent
8.3-100 percent E
Price / Employee
$10 $14 $22 $30 $38 $46 $49
Comp. Mode Split
0-1.4 percent
1.5-2.9 percent
3.0-4.3 percent
4.4-5.8 percent
5.9-7.2 percent
7.3-8.7 percent
8.8-100 percent
F Price /
Employee $10 $15 $24 $32 $41 $49 $52
Comp. Mode Split
0-1.7 percent
1.8-3.3 percent
3.4-5.0 percent
5.1-6.6 percent
6.7-8.3 percent
8.4-10.3 percent
10.4-100 percent
G Price /
Employee $10 $17 $27 $37 $46 $56 $59
Comp. Mode Split
0-2.1 percent
2.2-4.1 percent
4.2-6.2 percent
6.3-8.3 percent
8.4-10.3 percent
10.4-12.4 percent
12.5-100 percent
H Price /
Employee $10 $22 $34 $46 $58 $70 $74
Comp. Mode Split
0-2.3 percent
2.4-4.6 percent
4.7-6.8 percent
6.9-9.1 percent
9.2-11.4 percent
11.5-13.7 percent
13.8-100percent
I Price /
Employee $10 $24 $37 $51 $64 $77 $81
J Comp. Mode Split
0-2.5 percent
2.6-5.0 percent
5.1-7.5 percent
7.6-9.9 percent
10.0-12.4 percent
12.5-14.9percent
15.0-100percent
Price / Employee
$11 $26 $41 $56 $70 $85 $89
Comp. Mode Split
0-3.1 percent
3.2-6.2 percent
6.3-9.3 percent
9.4-12.4 percent
12.5-15.5 percent
15.6-18.7 percent
18.8-100 percent
LRT Price /
Employee $14 $32 $51 $70 $87 $106 $111
Comp. Mode Split
0-6.7 percent
6.8-13.4 percent
13.5-20.1 percent
20.2-26.8 percent
26.9-33.5 percent
33.6-40.2 percent
40.3-100 percent
Marquam Hill
Price / Employee
$30 $69 $109 $149 $188 $228 $238
Comp. Mode Split
0-7.2 percent
7.3-14.3 percent
14.4-21.5 percent
21.6-28.6 percent
28.7-35.8 percent
35.9-42.9 percent
43.0-100 percent
Lloyd District
Price / Employee
$32 $74 $116 $160 $201 $243 $254
Comp. Mode Split
0-10.2 percent
10.3-20.4 percent
20.5-30.6 percent
30.7-40.8 percent
40.9-51.0 percent
51.1-61.2 percent
61.3-100 percent
CBD Price /
Employee $45 $106 $166 $228 $286 $346 $362
* Comp. – Comprehensive.

shopping. The intent was to make travel simpler for the rider,with only one transaction to pay fares and no need for therider to carry change (hence the “round figure” of $3). Tri-Met has been marketing the QuikTik quite heavily, focusingon riders traveling to social or recreational destinations, pri-marily during the off-peak. Tri-Met’s goal is to increase rider-ship among these infrequent riders, with a longer-term impactof increasing revenue.
RESULTS AND IMPACTS OF FARE INITIATIVES
PASSport Program
Ridership and Revenue Impacts and CustomerImpacts and Benefits
Currently (2002) there are 210 business participating inthe PASSport program, providing coverage for 58,929 employ-ees. PASSport passes account for 7.6 percent of all trips takenon Tri-Met. Transit commuting at each participating com-pany is estimated in its ECO rule survey; these have shownan increase in transit ridership at participating companies. Ananalysis of the program in 1999 indicated that there was a 57percent increase in transit commute trips at participating com-panies after the first year of the program; the increase sincethen has not yet been calculated.
Since revenue under the general PASSport program isbased on actual transit commute ridership at participatingcompanies and this has increased, the PASSport program hasresulted in increased revenue. However, no analysis has beenconducted to estimate this increased revenue as of yet. Tri-Met staff consider the Lloyd District pass to be underpriced,relative to the general PASSport program, and therefore feelthat it likely has a slight negative revenue impact on Tri-Met.As part of implementing the PASSport program, the LloydDistrict implemented significant measures—including theelimination of free, on-street parking—that encourage theuse of transit for travel to the District, even by those who donot have a PASSport. The overall revenue impact to Tri-Metof the Lloyd District PASSport in particular is thereforeunclear.
Riders who receive a PASSport pass experience a signifi-cant reduction in the cost of travel by transit, even if theemployer requires some type of payment by the employee.As indicated earlier, the per employee price for an annual all-zone pass reaches a maximum of $362, as compared to theregular Tri-Met annual all-zone pass price of $615. Theseriders also get the convenience of an annual pass.
Employers participating in the PASSport program auto-matically comply with the DEQ ECO Rule. Companies alsohave found these passes to be effective tools for employeerecruitment and retention. Finally, employers subsidizing thepass may be eligible for the Oregon Business Energy TaxCredit for up to 35 percent of its subsidy expense.
163
Administrative Impacts and Issues
Administration of the PASSport program is handled pri-marily by four Tri-Met sales representatives and an adminis-trative assistant. Part of one manager’s time is devoted todirectly overseeing the program, and a small portion of thetime of several other staff members is devoted to supportingor overseeing the program.
PASSport has had little impact on the day-to-day use ofcash on Tri-Met, as most of the riders either previously usedpasses or are new to Tri-Met. Staff does believe that PASSporthas led to a reduction in the use of cash and tickets on tripsto and from major events, facilitating faster boardings andbetter on-time performance at these times.
Tri-Met does not feel that there is significant fraud associ-ated with PASSport passes, although there is some abuse: onthe order of five or six individuals are caught each year mis-using a PASSport pass or with a forgery.
QuikTik
Ridership and Revenue Impacts and CustomerBenefits
QuikTik boardings are not recorded as a distinct fare cat-egory. Therefore, the only data on usage comes from a sin-gle onboard survey on fare use. This survey showed thatQuikTik accounts for approximately 0.4 percent of all tripstaken on Tri-Met. There has been little change in Day Ticketsales since the introduction of QuikTik, while all-zone cashand ticket fares have fallen from 10 percent to 9.6 percent ofall trips taken on Tri-Met. There is therefore no evidence todate that QuikTik has increased ridership. The QuikTik ispriced 3.2 percent less than the round trip cost using all-zonecash prices ($3.00 compared with $3.10) and the same amountgreater than the round trip cost using all-zone discountedadvance purchase tickets ($3.00 compared with $2.90). Con-sidering the small use currently made of QuikTik, it appearsto have resulted in no significant change in Tri-Met’s revenue.
Riders previously paying the all-zone cash fare (includingtickets purchased at TVMs) are saving a small amount usingthe QuikTik. In addition, there is an increase in conveniencein that they only need to make one fare transaction. This canbe a substantial benefit for trips to events where there can bea large number of individuals attempting to use TVMs imme-diately after the event ends.
Administrative Impacts and Issues
Since QuikTiks are represented by Tri-Met’s standardpaper transfers, they have not added any administration cost.

164
Drivers dislike QuikTiks, though, since the driver selling theQuikTik has to reposition the cutting bar on the transfers toissue the single QuikTik and then reposition it again to issueadditional transfers. Drivers complain that this can slow downthe boarding process.
CONCLUSIONS AND LESSONS LEARNED
Customer Impacts and Benefits
PASSport appears to have significantly benefited Tri-Met’sriders at the participating sites as follows:
• Provides more convenient fare payment, utilizingemployee IDs and stickers that are valid for a full year.
• Reduces the cost of travel for participating riders.
QuikTik offers convenience for riders making multipletrips during a period less than a full day, and has generallybeen well received.
Agency Impacts and Benefits
The PASSport has had a generally positive impact on Tri-Met, including the following:
• Increases in both ridership and revenue.• Reduced use of cash on trips to and from special events.• Improved service reliability on trips to and from special
events.
QuikTik has had little impact on Tri-Met to-date. There isno evidence that is has significantly impacted ridership orrevenue, as it represents a very small portion of Tri-Met’sridership. The program has resulted in some dissatisfactionamong operators, as it requires additional effort to issue.
Impacts and Benefits for Partner Entities
The PASSport program impacts and benefits for employ-ers were as follows:
• Helps them address Oregon DEQ’s ECO Rule require-ments.
• Facilitates distribution of commute benefits to employeesat a lower administrative cost than in a regular monthlypass program—because it is an annual program.
• Encourages employees to use commute alternatives asopposed to driving alone, and therefore may allowemployers to reduce the amount of parking required.
Liability to Agency
Employers are required to make quarterly payments to Tri-Met under the PASSport program, and Tri-Met has had somedifficulty collecting timely payments from some employers.The quarterly payments raise Tri-Met’s risk compared withtraditional monthly pass programs, since the amount of moneyin each payment is increased and Tri-Met’s leverage isdecreased; with monthly passes, Tri-Met can refuse to pro-vide the next month’s passes until the employer has paid forthe previous month’s passes.
Fraud with the PASSport passes was originally a concern,but use of employee photo IDs appears to have addressed thatconcern. No significant fraud has been detected regarding thePASSport program.
Finally, according to Tri-Met, a significant issue in estab-lishing the pricing scheme has been social equity; there hasbeen concern that commuters not pay less for transit passesthan other transit riders (such as low-income riders). This hasbeen an issue in the agency’s definition of revenue neutralityand one of the reasons the pricing has been set up so as toensure that companies are paying full price for transit riders.
The QuikTik does not present any special liability risks toTri-Met.
Constraints and Barriers
The establishment of the PASSport program has involveddevelopment of agreements between Tri-Met and employers.These agreements are standardized and utilize pricing basedon a survey required by the Oregon DEQ. Moreover, thePASSport program grew out of the Oregon DEQ’s ECORule. This allowed Tri-Met to move from being seen as almostan opponent by employers (since it is funded by a payroll tax)to being a partner in meeting the obligations imposed by theEco Rule.
Required Equipment and Technology
No special equipment or technology has been required foreither program. Tri-Met’s TVMs did need to be reprogrammedto issue the QuikTik. These TVMs are only able to issue alimited number of different fare media, and were only able tobe reprogrammed because Tri-Met had eliminated one of itsoriginal fare media several years ago.
Lessons Learned
Finally, key lessons learned from the case study includethe following:
• When a transit agency can assist employers in meetingcommute reduction rules imposed by other governmentagencies, it can dramatically change the relationshipbetween the employers and the agency. Providing assis-tance to employers in complying with the ECO Ruleopened the employers’ doors to PASSport and Tri-Met’sother transit offerings. A key factor has been that Tri-Methas minimized the employer’s administrative require-ments to implement these programs, making them assimple as possible for the employer.
• Including actual transit mode share as a key element inthe pricing of an annual pass can allow an agency toincrease revenue from the employers while also increas-ing ridership among the pass recipients.
• QuikTik has shown that there is a niche for multihour(but less than full-day) passes. It appears that thesemay provide a particular benefit to the agency whenthey are marketed for trips to special events, simplify-ing the sale of fare media and the loading of buses fol-lowing the event.
CASE STUDY CONTACTS AND SOURCES
The following individuals were interviewed at Tri-Metheadquarters (Portland) as part of this case study:
165
Kathryn CoffelDirector of Marketing InformationTri-County Metropolitan Transportation District of Oregon 4012 S.E. 17th AvenuePortland, OR [email protected]
Tom Strader, Senior Research AnalystTri-County Metropolitan Transportation District of Oregon 4012 S.E. 17th AvenuePortland, OR [email protected]
Rhonda Danielson, Advertising and Marketing ManagerTri-County Metropolitan Transportation District of Oregon 4012 S.E. 17th AvenuePortland, OR 97202503-238-7433
The following document (in addition to ridership and rev-enue summaries and other sales and operational data, contractsand pricing guidelines) was used in preparing the case study:
Tri-Met, Tri-Met Programs for Employers no date.

166
CASE STUDY 12
VENTURA COUNTY TRANSPORTATION COMMISSION
INTRODUCTION
The Ventura County Transportation Commission (VCTC)is responsible for the allocation of transportation resourcesin Ventura County, California, and also operates two tran-sit systems: Ventura Intercity Service Transit Authority(VISTA) and Fillmore Area Transportation Corporation(FATCO). Besides those two systems, the county is servedby six independent transit operators: South Coast AreaTransit (SCAT), Simi Valley Transit, Thousand OaksTransit, Camarillo Area Transit (CAT), Moorpark Transit,and Ojai Trolley Service. These eight systems operate atotal of 102 vehicles.
All these systems except Ojai Trolley Service—which hasa single vehicle—are currently participating in an integratedregional smart card program called Go Ventura. This followscompletion of an earlier regional smart card demonstration,the Smart Passport project. This case study reviews
• The development and impactsof the Smart Passport project.
• The development and imple-mentation of the Go Venturaproject.
• Related efforts to develop ajoint university/transit cardprogram and a joint access-to-jobs/transit card program.
DEVELOPMENT AND IMPLEMENTATION OFFARE INITIATIVES
Smart Passport Regional Payment IntegrationProject
The Smart Passport project was initiated in 1994 througha partnership among the FTA, the California Department ofTransportation (Caltrans), VCTC, and Echelon Industries(the system vendor and integrator). Echelon had developedthe Fare Transaction and Vehicle Monitoring System (knownas FARETRANS VMS) through the FTA’s Small BusinessInnovation Research (SBIR) program, also supported byfunding from Caltrans. The FARETRANS system includednot only fare collection using contactless smart cards but alsoautomatic passenger counters (APCs) and an automatic vehi-cle location (AVL) system. Echelon had actually begundeveloping the system in 1992, based on recommendationsfrom an SBIR feasibility study the firm had conducted (20),and had field-tested much of the system on three commuterbus routes in Los Angeles County in 1993.
Caltrans sought the participation of VCTC and theCounty’s transit operators in a demonstration project in 1994,and the FARETRANS system was subsequently imple-mented on most of the seven transit services’ vehicles in Jan-uary 1996; 76 vehicles were ultimately equipped with smartcard readers—and many of these with APC and AVL equip-ment as well—and eight smart card sales outlets were estab-lished. The system went live in March 1996, and the first datareports were produced in November of that year. The con-tactless Smart Passport was available as either an unlimited-ride monthly pass or as a stored-value card. The pass versionof the card could be used to ride on any of the participatingservices in the County. Regional payment integration hadactually been introduced in 1994 via the original Passport, acountywide flash pass.
The goals in implementing the smart card system includedthe following:
• Create a seamless universal fare medium that could beused on all transit services in the County.
• Improve data collection and reporting processes, andin particular to “use the advanced payment system to
Fare Program/Initiatives
Implementation of integratedregional farecard systemDevelopment of joint university/transit card programDevelopment of joint access-to-jobs/transit card program

167
encourage, accommodate, manage and assess travel pat-terns of passengers between transit systems” (21).
• Assess the feasibility—and the nature of the functionalrequirements—of implementing a multiagency paymentsystem.
• Determine the impact of the combination of the tech-nologies (smart card, APC and AVL) on operationalefficiency.
The official demonstration period ended in June 1997, butthe following month VCTC elected to contract directly withEchelon to continue the project. The FARETRANS systemremained in operation until October 1999. VCTC had nego-tiated with Echelon to continue the system. However, dueto rapid changes in the technologies being employed in thesystem—and the fact that Echelon was using only off-the-shelf equipment for which replacement parts were not alwaysavailable—the company was unable to address the County’srequirements (e.g., performance criteria related to systemreliability and data accuracy), and therefore withdrew fromthe project. VCTC therefore issued an RFP for a new systemand ultimately selected the Motorola/ERG team to providewhat is now the Go Ventura system.
Go Ventura Regional Payment IntegrationProject
The RFP for a new regional payment system was issued inFebruary 2000, and the Motorola/ERG team was selected inMay of that year. The contract was actually signed in Septem-ber 2000. Subsequent to the award of the contract, Motorolamade a corporate decision to get out of the smart card busi-ness. Therefore, ERG assumed sole responsibility for thecontract, although the cards being used are those developedby Motorola. Installation of equipment began in July 2001.The sale of the new Go Ventura smart cards was initiated inDecember of that year, and the system went live in January2002. Like the Smart Passport system, the new systemincludes contactless smart card readers, APCs, and an AVLsystem. However, the cards are “dual interface,” operating inboth a contactless and contact mode. At present, the contactinterface is used only in loading value to cards via sales officepoint-of-sale terminals. However, the current plan is also touse the contact interface to purchase proof-of-payment tick-ets from MetroLink ticket vending machines to ride the com-muter rail service. The dual interface will also provide futureflexibility in allowing for the addition of nontransit functionsat some future point.
The plan is for MetroLink TVMs to be equipped withCubic smart card readers (the “Tri-Reader”) as part of theLos Angeles MTA regional smart card program now beingdeveloped. However, at this point, it is the understanding ofVCTC that the Tri-Reader cannot process the type of con-tactless interface on the Go Ventura card; therefore, the
Ascom TVMs will be configured to read the contact portionof the Go Ventura card. Moreover, rather than provide theMetroLink fare inspectors with hand-held units capable ofreading the Go Ventura cards, the e-purse on the cards willbe used to buy a paper ticket that can be presented as proof-of-payment for Ventura County riders.
The same operators that took part in the Smart Passportproject are participating in the Go Ventura program, althoughthe total number of vehicles represented has grown from 76to 101. As with the earlier program, the smart cards can beloaded with a monthly pass, a stored value e-purse, or both.However, unlike most other U.S. electronic payment systems,the passes are for fixed calendar months rather than rollingperiods. Other key purchase and usage features and parame-ters include the following:
• Each agency’s fare structure is incorporated into everycard.
• A 10 percent discount is provided with use of the e-purse(e.g., $0.90 is deducted for a $1 fare). However, this canbe configured differently by an operator (e.g., an opera-tor could provide a 15 percent discount).
• Riders are warned (on thecard reader display) when acard’s balance falls below $5.
• A rider is allowed to have a$2 negative balance on acard (i.e., the ride is pro-vided even if there is insuf-ficient value remaining inthe rider’s e-purse; the pay-ment for the trip is thendeducted from the e-pursethe next time the rider addsvalue).
• Value—or a pass—can beloaded at a sales outlet or onboard any bus except SCATbuses, SCAT having chosen not to permit onboard load-ing in either the Smart Passport or Go Ventura projectson the assumption that such transactions would signifi-cantly slow down boarding times. A rider can pay foronboard loads remotely, either by calling VCTC and pro-viding a credit card number or by mailing in a check; thisinformation is then downloaded to the onbus card read-ers (this downloading is done twice a day). The e-pursevalue or pass is automatically loaded on the card thenext time it is presented to a reader. Internet access formaking these purchases is planned for later in 2002.(Remote loading had been planned for the Smart Pass-port program but was never implemented.)
• There is no fee for acquiring a card, but there is a $5 cardreplacement charge (i.e., if lost or stolen). Cards can beregistered, however, which guarantees replacement ofthe pass or e-purse balance if the card is lost or stolen.

168
• There is a 4-minute “lockout” period on the reuse of acard, preventing card “passbacks.”
With regard to clearinghouse functions, VCTC has hadinitial responsibility for all card revenue reconciliation andallocation to the operators, as well as report preparation. Set-tlement occurs quarterly. The computer system supportingthe program is designed to handle up to 10,000 transactionsper day; once the volume approaches this level, transactionprocessing will be turned over to ERG. VCTC has also ledmarketing efforts, which have included direct mail, newsletter,print ads, and radio ads. The details of the program are alsodescribed on the Go Ventura website (www.goventura.org).
As of this writing (July 2002), the Go Ventura system hadonly been in operation for 6 months. Thus, it is too early
to determine thelevel of successor to ascertainany real impactson the operators.However, basedon the lessonslearned throughthe Smart Pass-port project,VCTC and itsoperating part-ners have man-
aged to avoid most of the pitfalls encountered in imple-menting and operating that effort. The key steps followed inthis case to ensure a more successful project included the fol-lowing (22):
• VCTC served as the “champion” for the project.• VCTC dedicated a staff project manager and data man-
ager at the outset.• VCTC staff has held regular meetings with the policy-
makers, operators, sales outlet staff and mechanics.• VCTC required ERG to have a full-time local project
manager.• VCTC and the operators established a fare structure for
the new cards that makes them competitive with othertypes of fare payment; this includes the e-purse discount.
• VCTC required that ERG develop training manuals forthe drivers, sales outlet staff, and mechanics; a train-the-trainer program was also established for ongoing training.
• VCTC, in conjunction with the operators, establishedclear performance standards and data collection require-ments (both were spelled out in the RFP).
• VCTC, in conjunction with the operators, defined thereport schedule and formats that have been built into theproject software.
• VCTC, in conjunction with the operators, adopted busi-ness rules, including clear clearinghouse/settlement
responsibilities, and these were built into the projectsoftware.
• VCTC plans to include questions about the smart cardprogram in its annual rider surveys.
• VCTC developed a comprehensive on-going marketingcampaign.
Two specific components of the Go Ventura effort arereviewed below.
Joint University/Transit and Access-to-Jobs/Transit Card Programs
In implementing the Go Ventura program, VCTC has alsopursued partnership arrangements with nontransit entities inthe County. In particular, VCTC has been working with Cal-ifornia State University-Channel Islands (CSUCI) on devel-opment of a joint university/transit card program. CSUCI is a new campus—the first graduating class started in Fall 2002—and enrollment isexpected to eventually growto 20,000. The administrationwanted to develop a multi-application smart card andworked with VCTC and ERGon the concept. Consequently, a campus version of the GoVentura card, featuring a photo and university logo on thefront (see example shown here) and the county transit sys-tems’ logos on the back, was issued in Fall 2001. This cardserved as the campus ID card through the Spring 2002semester, and could be loaded with a transit pass, at no costto the student. The campus is primarily served by two routes,both of which are subsidized by the University. These routesare free. For other county routes, the card readers tracked stu-dent and faculty usage. The University maintained a transitaccount with VCTC, and the cost of student and faculty rideswere debited from this account.
A new administration has now assumed responsibility forrunning the campus. It prefers magnetic stripe technology tosmart cards for the primary campus card (i.e., for ID, use inthe bookstore and other functions). Thus, the aforementionedcards will be replaced with magnetic stripe cards, althoughVCTC and the University are discussing the possibility ofadding the University’s magnetic stripe to the back of a GoVentura card. Such a strategy would continue to facilitatetransit usage by students and other members of the campuscommunity. In this scenario, the smart card could also beused to supplement the applications included on the stripe(e.g., to maintain students’ medical records, to pay for park-ing, and perhaps other uses). These applications would uti-lize either the contactless or contact interface of the smartcard, depending on the particular requirements. VCTC hopesto be able to issue this joint card in Fall 2003.

The other nontransit partnership in place at present is withcounty social service agencies. Six access-to-jobs centers areequipped for the distribution and loading of Go Venturacards with subsidized passes or e-purse value for eligibleagency clients. As with the CSUCI rides, the card readerstrack usage of the access-to-jobs cards. This allows the sub-sidizing centers to pay for their clients’ rides, and also toensure that they are traveling to job sites as intended. VCTCprovides the (empty) smart cards to these centers at no cost.
RESULTS AND IMPACTS OF FARE INITIATIVES
Customer Benefits
Because of persistent data processing problems and result-ing inconsistency of reports, VCTC and the operators wereunable to compile reliable information on usage of the SmartPassport. Roughly four thousand cards were distributed,although many of these were never used.
With regard to customer acceptance, only minimal marketresearch was carried out. An informal onboard survey wasundertaken by VCTC on all routes of one of the services,VISTA, and rider interviews were done on a second service,FATCO. The comments received through both of these effortswere generally quite positive. The VISTA survey focused onsenior citizens, students and low-income riders, and the smartcard was found to be attractive to these groups. According tothe Volpe Center assessment, “Many of the users reportedthe card’s stored value feature was used as an effective bud-geting tool, enabling them to secure access to the transporta-tion services they needed. Senior citizens also found the smartcard’s contactless feature provided them with a greater senseof comfort and safety because they could carry less cash” (21).
The limited nature of the survey effort, coupled with thelack of data on usage of the smart card, suggested the needfor the following strategies in promoting and tracking cus-tomer acceptance/usage (21):
• Formal and systematic surveys and interviews with cus-tomers are needed to reliably assess customer satisfac-tion and to design strategies to improve satisfaction.
• Minimum requirements for data collection need to beestablished in the planning phase of the program.
• Reporting requirements that define report formats andthe reporting schedule must be established.
Other key findings related to promoting customer accep-tance included the following (21):
• Implementation of new technology requires a compre-hensive marketing strategy using broadcast and printmedia.
• A program is needed that offers customers incentivesand loyalties based on usage, such as free transfers, farediscounts, and automatic replenishment.
169
VCTC and its partners were able to use these lessons indeveloping and implementing the Go Ventura project. Asindicated earlier, the Go Ventura project has been operationalonly since the beginning of 2002. As of June 2002, 2,200 cardshad been distributed. VCTC had plans for a major advertisingpush during the summer of 2002. The agency also planned toinclude questions pertaining to smart card use on its forth-coming system survey.
Operational and Administrative Impacts andIssues
The Smart Passport project produced what must be consid-ered mixed results operationally. According to the Volpe Cen-ter assessment of the project, “The fare collection system wasplagued by numerous operational and data processing prob-lems, resulting in inconsistent data and infrequent reports.While the system performed well for some of the smaller tran-sit operators, the system was never fully operational for thelargest transit operator in the County, South Coast Area Tran-sit, due to system reliability problems” (21). On the other hand,the project was considered successful in terms of demonstrat-ing the basic potential of using contactless smart card technol-ogy in transit and laying the groundwork for full regional inte-gration. Despite the project’s shortcomings, VCTC and theoperators remained committed topursuing the regional fare integra-tion concept.
The specific operational andadministrative problems and chal-lenges encountered during the proj-ect include the following:
• Lack of “buy-in” by drivers and mechanics. It wasfelt that agency staff and operating personnel receivedinsufficient training in use of the equipment and sup-porting systems: “Consequently, drivers often failed toenter the onboard information needed to provide accu-rate data, as well as inform management when systemequipment was inoperative. Echelon reported that, insome cases, transit agency management limited theirability to properly train staff, such as restricting directcontact with staff and not allocating sufficient time fortraining” (21).
• Equipment problems. Equipment was not all deliveredor installed in a timely manner, and there were excessivedelays in replacing defective equipment. This led to sev-eral incidences of vandalism on the part of disgruntleddrivers, i.e., when equipment did not work properly (22).
• Persistent data processing problems. This resulted ininconsistent reports. It was felt that one reason for thiswas that the underlying database was not robust enoughfor the system. Incidences of incorrect driver log-on(see above) also contributed to the reporting problem.

170
These and related problems resulted in the followinglessons, subsequently used in the development of the GoVentura program (21):
• All staff need extensive and ongoing training.• The systems integrator needs to have a local presence.• System performance requirements need to be established
in conjunction with participating operators during theplanning phase of the program and then applied regu-larly to monitor performance.
• Regular and open communication is needed among allstakeholders.
• Clearinghouse and settlement responsibilities need to bedesignated in the planning phase of the program.
As indicated above, the Go Ventura program has beenoperational only since January 2002. Thus far, the agencieshave experienced far fewer problems than they did through-out the earlier program. There have been no significant hard-ware problems to date, and the agencies’ operational andmaintenance personnel have been much more accepting ofthe system than they had previously. There were some initialdelays in the production of reports, however, due partly toconsiderable turnover in the system integrator’s project team.The design of the regional clearinghouse system also under-went a couple of changes by the integrator, and still appearsto be somewhat in a state of transition. VCTC currently man-ages the clearinghouse functions in-house, but these func-tions will eventually be turned over to ERG, which plans tohandle them through the clearinghouse that has been estab-lished for the TransLink (San Francisco area) regional smartcard program.
With regard to the cost of the Go Ventura system, the orig-inal amount of the contract with Motorola/ERG was $1.67million; as of June 2002, several change orders had raised thetotal cost to approximately $1.8 million. The cards used inthe project, Motorola dual interface “Type B” cards, wereprovided at an initial price (for the order of 10,000 cards) of$8.50 apiece.
Overall conclusions and lessons learned are summarizedbelow.
CONCLUSIONS AND LESSONS LEARNED
Customer Impacts and Benefits
The introduction of smart cards discussed in this casestudy have had the following customer-related impacts andbenefits:
• Improved ease of transit usage, creating the opportunityfor seamless travel within the region.
• Improved customer convenience, through features suchas onboard card loading (on all but one of the operators),
allowance of a $2 negative balance (on the e-purse),warning when a rider’s card balance drops below $5,and registration of cards (this guarantees replacement ofthe pass or e-purse balance if the card is lost or stolen).
• Reduced the cost of travel for some riders, through pro-vision of a 10 percent discount with use of the e-purse.
• Generally positive reactions to the system on the part ofsmart card users, based on a limited survey effort under-taken during the pilot project.
Agency Impacts and Benefits
The agency-related impacts and benefits of these projectsinclude the following:
• Smart Passport project costs (including design andimplementation) were covered entirely by FTA and Cal-trans. Go Ventura’s costs are being covered by VCTCthrough capital grants from Caltrans and FTA.
• VCTC’s management costs increased for both projects,as a consultant was hired for the initial portion of theSmart Passport project and a new data manager has beenhired in conjunction with the Go Ventura project. Theoperating agencies’ revenue collection and managementcosts have not been significantly affected by either proj-ect to date.
• Usage of the Smart Passport cards was felt to be rela-tively low, although actual ridership (and revenue) fig-ures were not obtained due to equipment and data pro-cessing inconsistencies. However, the agencies did losesome revenue due to the equipment reliability problems:whenever a rider was unable to use his/her smart card dueto equipment malfunction, no fare was charged for thatride. Go Ventura has been in operation only a short time,and the program has not yet been actively marketed;usage has thus been understandably quite low to date.
• The limited use of smart cards suggests that these proj-ects have had minimal impact on the agencies’ use ofcash to date; however, as Go Ventura card penetrationexpands, the use of cash should decrease.
• The Smart Passport project had mixed success in termsof meeting its goals. It did “create a seamless universalfare medium,” and also “demonstrated the feasibility ofimplementing a multiagency payment system.” On theother hand, the project failed to “improve data collec-tion and reporting processes,” and was unable to “deter-mine the impact of the combination of technologies(smart card, APC and AVL) in operational efficiency.”(It is too early to determine whether Go Ventura has metits goals.)
• In both projects, the use of smart cards has providedgreater flexibility to the operators in terms of the abilityto offer additional fare options (e.g., e-purse).

• The limited level of usage suggests that neither projecthas had a significant impact on fare abuse and evasion,although the use of any type of electronic fare paymentoffers the potential to control abuse and evasion.
• In implementing the Smart Passport project, VCTC hireda consultant to provide assistance; however, the consul-tant was not kept on for the entire project. The projectdid not affect the operating agencies’ personnel require-ments. VCTC has assigned a project manager for imple-mentation of the Go Ventura program; however, thisindividual was an existing VCTC employee, and he hasretained his other duties during the implementation ofthe program. As mentioned above, the agency did hire anew data manager at the outset, though. The project hasnot resulted in any additional personnel for the operat-ing agencies.
• These projects have had no measurable impact on ser-vice reliability; while the use of contactless smart cardscan speed boardings, onboard loading tends to have theopposite effect; moreover, equipment reliability prob-lems in the Smart Passport project also had a negativeeffect in some cases.
While the Smart Passport pilot project presented a numberof operational challenges, it did demonstrate the general feasi-bility of developing an integrated regional payment system,while providing important lessons for designing, implement-ing and managing such a program. These lessons were care-fully followed in the development of the Go Ventura program.
Impacts and Benefits for Partner Entities
The Smart Passport project produced significant benefit toCaltrans and FTA in testing the feasibility of using contact-less smart cards as the basis for an integrated regional pay-ment system. The project attracted interest from transit agen-cies throughout California and across the United States, andprovided a series of important lessons in development andimplementation of regional systems.
Within the Go Ventura program, VCTC has establishedpartnerships with a local college (CSUCI) and county socialservice agencies. These partnerships should provide the fol-lowing types of benefits to these entities:
• A joint transit-university card will facilitate transit usageby students, faculty, and staff; the card may also be usedto provide certain applications (e.g., parking payments,storage of medical records) beyond those that would beprovided on a university-only card.
• The use of the smart cards will allow distribution andloading of subsidized passes or value to social serviceagency clients, as well as tracking of their rides (to allowpostpayment by agencies for access-to-jobs rides and toensure proper usage of the cards).
171
Liability to Agency
The major area of liability to VCTC associated with theoriginal Smart Passport program was the potential loss of inter-est in cooperating on future efforts on the part of the partici-pating transit agencies. Given the various problems encoun-tered with that program, such an outcome might well havebeen expected. However, the pilot project apparently demon-strated sufficient promise to the agencies that all agreed toparticipate in the subsequent Go Ventura effort.
Constraints and Barriers
A number of technical, institutional, and operational con-straints and challenges were encountered in the implementa-tion of the Smart Passport program. These included equipmentreliability and data processing and reporting inconsistencies,which in turn contributed to lack of acceptance on the part ofoperational and maintenance personnel. One key problemwas the lack of replacement parts for the largely off-the-shelfequipment used in the system. However, these challengeswere successfully addressed in developing and implement-ing the follow-up Go Ventura program.
Required Equipment and Technology
The initiatives described here are based on use of contact-less smart card technology. The initial program was essen-tially designed to test the applicability of this technology ina regional setting.
Lessons Learned
A number of key lessons were learned from the Smart Pass-port pilot project—and corroborated in the subsequent GoVentura project—regarding the development and implemen-tation of an integrated regional payment system (21):
• Regional farecard programs need a local champion.• Staff resources and leadership capabilities need to be
commensurate with the scope and complexity of the proj-ect and need to be in place at the beginning.
• Regular and open communication is needed among allthe stakeholders.
• The systems integrator needs to have a local presence.• The participants should establish a pricing structure for
the new fare media that makes them competitive withother fare media.
• All staff need extensive and ongoing training.• System performance requirements need to be estab-
lished in conjunction with participating operators dur-ing the planning phase of the program and applied reg-ularly to monitor performance.

• Minimum requirements for data collection need to beestablished in the planning phase of the program.
• Reporting requirements that define report formats andthe reporting schedule must be established.
• Clearinghouse and settlement responsibilities need tobe specifically designated in the planning phase of theprogram.
• Implementation of new technology requires a compre-hensive and effective marketing strategy using broad-cast and print media.
• A program is needed that offers customers incentivesand loyalties based on usage, such as free transfers, farediscounts, and automatic replenishment.
• Formal, systematic surveys of and interviews with cus-tomers are needed to reliably assess—and to designstrategies to improve—customer satisfaction.
CASE STUDY CONTACTS
The following individuals were interviewed as part of asite visit to VCTC (Ventura, CA):
172
Ginger Gherardi, Executive DirectorVCTC 950 County Square Drive, Suite 207Ventura, CA 93003805-642-1591, [email protected]
Steven DeGeorge, Project ManagerVCTC 950 County Square Drive, Suite 207Ventura, CA [email protected]
The following documents were used in preparing the casestudy:
Volpe National Transportation Systems Center. VenturaCounty Fare Integration: A Case Study, September 2001.
“Smart and Smarter,” presentation by Ginger Gherardi, VCTC,2002.
VCTC Go Ventura website: www.goventura.org

173
CASE STUDY 13
WASHINGTON METROPOLITAN AREA TRANSIT AUTHORITY
INTRODUCTION
The Washington Metropolitan Area Transit Authority(WMATA) operates the second largest rail system and thefifth largest bus network in the United States. Metrorail andMetrobus serve a population of 3.4 million within a 1,500square mile area. The transit zone consists of the District ofColumbia, two suburban Maryland counties, and three coun-ties and three cities in Northern Virginia.
About 40 percent of the region’s peak period trips to theurban core are on WMATA services. Average weekday tripsexceed 600,000 on Metrorail and 500,000 on Metrobus. Overthe past few years, Metrorail’s share of total trips has grownfrom 8 to 15 percent, while Metrobus’s share has increasedfrom 5 to 8 percent (23).
WMATA’s plans call for continued expansion of theMetrorail system. By the end of 2004, Metrorail will haveadded three miles of track, bringing the total system to morethan 106 miles. In addition, WMATA will also be imple-menting improvements on Metrobus. Future Metrobusimprovements include installing automatic vehicle location(AVL) equipment on all buses and expanding its fleet ofvehicles fueled with compressed natural gas (CNG). Intotal, WMATA plans to purchase 414 CNG buses, of which164 are either delivered or on order.
Among other improvements to its system, WMATA isconducting a number of fare initiatives on both Metrorail andMetrobus. All of these initiatives build from technologyalready in place at WMATA (i.e., smart cards). This casestudy focuses on three fare initiatives:
• SmarTrip®. The evolutionof WMATA’s smart cardfare collection program.(SmarTrip is a registeredtrademark of the Wash-ington Metropolitan AreaTransit Authority.)
• Metrochek and SmartBenefits. Distribution of transitbenefits using magnetic and smart card technology.
• Regional Smart Card Program. Fare integration thoughthe implementation of the SmarTrip technology through-out the Washington-Baltimore-Northern Virginia region.
The implementation issues and impacts of these fare ini-tiatives are further described below.
DEVELOPMENT AND IMPLEMENTATION OFFARE INITIATIVES
SmarTrip
In February 1995, WMATA introduced a demonstrationprogram of a contactless smart card system to test the feasi-bility of implementing a smart card application in a multi-modal transit system. The technology employed was a battery-powered cartridge, about the size of an audiocassette case,which had been developed by Cubic and was known as theGoCard® (GoCard® is a registered trademark of Cubic Trans-portation Systems, Inc.). The demonstration, funded by a Con-gressional earmark received through the FTA, involved 1,500people, 19 Metrorail stations, three Metrobus lines, and fiveparking lots. It concluded in February 1996, having accom-plished its objective. This set the stage for SmarTrip.
In May 1999, WMATA became the first major city in theUnited States to deploy a contactless smart card systemwide.WMATA’s plan was to link both rail and parking operationswith a single fare medium—the SmarTrip card. The Smar-Trip card is an ISO-size plastic card that uses low-level radiofrequencies to induce current in the electronics contained inthe card. The card’s thickness is approximately the same asa credit card.
Passengers desiring a SmarTrip card can purchase onefor $5 at a customer service counter, by mail, or over the
Fare Program/Initiatives
SmarTrip®: evolution of smartcard programMetrochek and Smart Benefits: distribution of benefits using magnetic and smart card technologyRegional Smart Card Program: expansion of SmarTrip® technologythroughout region

Internet. The SmarTrip card can be used at Metrorail fare-gates and to pay parking fees at Metro-operated parking lots.Passengers load value onto their SmarTrip cards at Metrorailticket vending machines (TVMs) in a manner similar to pur-chasing magnetic paper farecards. Value can be loaded usingcash or credit/debit cards. However, unlike a paper farecardthat has a limited useful life, the SmarTrip card can be usedover and over again, possibly for several years. Anotherimportant feature of the SmarTrip card is that it can be reg-istered to a specific user. The benefit of registering a Smar-Trip card is that if it is ever lost or stolen, it can be replacedfor a fee of $5. The patron then will be issued a new card withthe value that was on the previous card at the time it was lostor stolen.
In addition to its use on WMATA’s Metrorail system andat its parking lots, the SmarTrip card is beginning to demon-strate its usefulness in other applications as well. In order totest the concept of SmarTrip as a multipurpose medium,WMATA has recently partnered with two outside entities:First Union Bank and GSA.
First Union Pilot
WMATA has partneredwith the First Union Bank toprovide a multiapplicationcard for First Union cus-tomers. The pilot involvesapproximately one thousandcustomers who have been
issued a combined First Union/SmarTrip card. This singlecard can be used as a debit card at any ATM in the countryand also as a SmarTrip card on WMATA. The card is ahybrid card that uses both magnetic stripe technology (for thedebit card application) and contactless smart card technology(i.e., SmarTrip). The future of this project has been cast indoubt with the 2002 acquisition of First Union Bank byWachovia Bank. While the existing cards could continue tobe used (i.e., in 2003), Wachovia had not indicated toWMATA any intention of issuing new cards carrying theSmarTrip application.
GSA Pilot
WMATA has partnered with GSA to implement a multi-application card for GSA employees. The GSA/SmarTripcard is a contact/contactless dual interface card that includesthe following elements and functionality:
• Photo ID. This permits employees to gain access toGSA and other government buildings. Photo IDs arevisually inspected by building security.
• Contact Chip. The contact chip is used to store admin-istrative information for GSA.
174
• Bar Code. The card includes a bar code with theemployee’s ID number for use by GSA.
• Contactless Chip. This chip is used by the SmarTripapplication for holding Metrorail fare value.
The objective of this pilot program is to further test theflexibility and multifunctionality of the SmarTrip card.
Metrochek and SmartBenefits
In February 1993, WMATA introduced Metrochek to pro-vide employers with a mechanism to extend the qualifiedtransportation benefit to their employees. The qualified trans-portation benefit is a tax-free benefit that employers canextend to their employees to help pay fortransportation to and from work on pub-lic transit or to fund the costs of theirparking. For transit, the amount of thebenefit is limited to $100 per month andmust be provided in the form of vouch-ers or transit fare media. The parkingbenefit is limited to $175 per month.Generally, employers are not permittedto give their employees cash (i.e., inreimbursement for transportation costs).
In implementing the qualified transitbenefit, many metropolitan areas charged their MetropolitanPlanning Organizations (MPOs) with developing a systemto implement the benefit program. As such, many MPOs insti-tuted a system in which employers purchase vouchers thatcan be given directly to employees and redeemed for tran-sit fare media. Many MPOs contracted with third parties toprovide these vouchers. These third parties often charge acommission.
Rather than use a third party to provide special vouchers,WMATA decided to use its existing magnetic farecards asthe medium for the region’s transit benefit program. Thesecards are sold to employers at face value or paid for byemployees as a pretax payroll deduction. The cards come indenominations of $1, $5, $10, $15, $20, $21 and $30. Thevalue of the Metrochek is printed on the card and is alsoencoded in the card’s magnetic stripe.
Metrocheks can be redeemed at over 200 transit provid-ers in the Washington, DC, metropolitan area. Participatingproviders include bus, rail and vanpool operators. After accept-ing the Metrochek as payment for fare media, the participat-ing provider simply remits to WMATA the used Metrocheks.WMATA then writes a check to the provider or arranges forelectronic funds transfer through the automated clearinghousein exchange for the total value of Metrocheks remitted.
Since they are magnetically encoded, Metrocheks can alsobe used directly in Metrorail faregates. When used on Metro-rail, Metrocheks of $20 or more come with a 10 percent bonus.That is, a $20 Metrochek can be used for $22 worth of tran-sit on Metrorail. However, once a Metrochek has been used
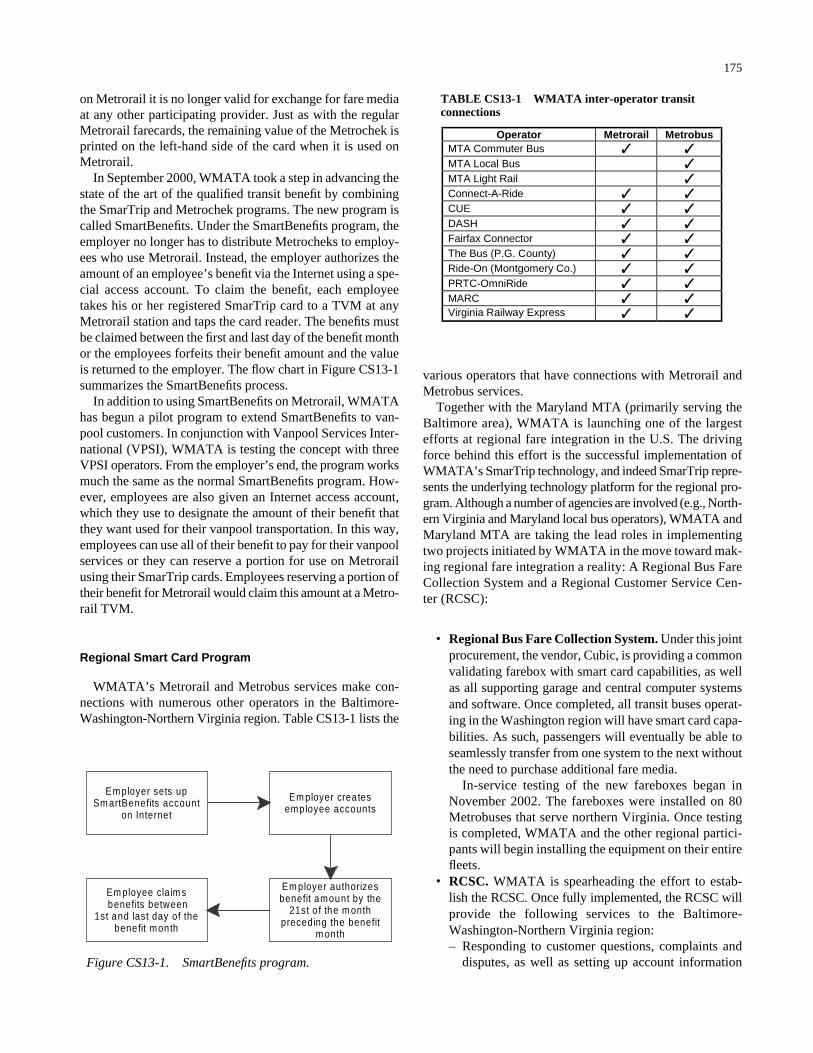
on Metrorail it is no longer valid for exchange for fare mediaat any other participating provider. Just as with the regularMetrorail farecards, the remaining value of the Metrochek isprinted on the left-hand side of the card when it is used onMetrorail.
In September 2000, WMATA took a step in advancing thestate of the art of the qualified transit benefit by combiningthe SmarTrip and Metrochek programs. The new program iscalled SmartBenefits. Under the SmartBenefits program, theemployer no longer has to distribute Metrocheks to employ-ees who use Metrorail. Instead, the employer authorizes theamount of an employee’s benefit via the Internet using a spe-cial access account. To claim the benefit, each employeetakes his or her registered SmarTrip card to a TVM at anyMetrorail station and taps the card reader. The benefits mustbe claimed between the first and last day of the benefit monthor the employees forfeits their benefit amount and the valueis returned to the employer. The flow chart in Figure CS13-1summarizes the SmartBenefits process.
In addition to using SmartBenefits on Metrorail, WMATAhas begun a pilot program to extend SmartBenefits to van-pool customers. In conjunction with Vanpool Services Inter-national (VPSI), WMATA is testing the concept with threeVPSI operators. From the employer’s end, the program worksmuch the same as the normal SmartBenefits program. How-ever, employees are also given an Internet access account,which they use to designate the amount of their benefit thatthey want used for their vanpool transportation. In this way,employees can use all of their benefit to pay for their vanpoolservices or they can reserve a portion for use on Metrorailusing their SmarTrip cards. Employees reserving a portion oftheir benefit for Metrorail would claim this amount at a Metro-rail TVM.
Regional Smart Card Program
WMATA’s Metrorail and Metrobus services make con-nections with numerous other operators in the Baltimore-Washington-Northern Virginia region. Table CS13-1 lists the
175
various operators that have connections with Metrorail andMetrobus services.
Together with the Maryland MTA (primarily serving theBaltimore area), WMATA is launching one of the largestefforts at regional fare integration in the U.S. The drivingforce behind this effort is the successful implementation ofWMATA’s SmarTrip technology, and indeed SmarTrip repre-sents the underlying technology platform for the regional pro-gram. Although a number of agencies are involved (e.g., North-ern Virginia and Maryland local bus operators), WMATA andMaryland MTA are taking the lead roles in implementingtwo projects initiated by WMATA in the move toward mak-ing regional fare integration a reality: A Regional Bus FareCollection System and a Regional Customer Service Cen-ter (RCSC):
• Regional Bus Fare Collection System. Under this jointprocurement, the vendor, Cubic, is providing a commonvalidating farebox with smart card capabilities, as wellas all supporting garage and central computer systemsand software. Once completed, all transit buses operat-ing in the Washington region will have smart card capa-bilities. As such, passengers will eventually be able toseamlessly transfer from one system to the next withoutthe need to purchase additional fare media.
In-service testing of the new fareboxes began inNovember 2002. The fareboxes were installed on 80Metrobuses that serve northern Virginia. Once testingis completed, WMATA and the other regional partici-pants will begin installing the equipment on their entirefleets.
• RCSC. WMATA is spearheading the effort to estab-lish the RCSC. Once fully implemented, the RCSC willprovide the following services to the Baltimore-Washington-Northern Virginia region:– Responding to customer questions, complaints and
disputes, as well as setting up account information
Em ployer sets up Sm artBenefits account
on Internet
Em ployer crea tes employee accounts
Em ployer authorizes benefit amount by the
21st o f the m onth preceding the benefit
m onth
Em ployee claim s benefits between
1st and last day of the benefit month
Figure CS13-1. SmartBenefits program.
TABLE CS13-1 WMATA inter-operator transitconnections
Operator Metrorail Metrobus MTA Commuter Bus ✓ ✓ MTA Local Bus ✓ MTA Light Rail ✓ Connect-A-Ride ✓ ✓ CUE ✓ ✓ DASH ✓ ✓ Fairfax Connector ✓ ✓ The Bus (P.G. County) ✓ ✓ Ride-On (Montgomery Co.) ✓ ✓ PRTC-OmniRide ✓ ✓ MARC ✓ ✓ Virginia Railway Express ✓ ✓

and processing smart card registrations and specialtransactions.
– Clearing, settlement, and financial management func-tions in order to process smart card transactions andmove funds to the appropriate participants in theregional smart card program.
– Establishing a point-of-sale network to distribute smartcards and provide locations where patrons can loadvalue.An RFP to operate the RCSC was issued in October
2001 and an amendment to the RFP was issued early in2002. In January 2003, WMATA selected the ERGGroup to install and operate the RCSC. ERG plans touse its existing central computer system, installed in theSan Francisco Bay Area to support the TransLink proj-ect, to perform the clearing, settlement, and financialmanagement functions for the Washington-Baltimoreregion. Local smart card management, distribution, andcustomer service will be performed by ERG’s subcon-tractor, Northrup-Grumman IT.
Once the bus farebox and the RCSC projects are complete,SmarTrip will become the de facto standard fare mediumamong all of the participating agencies in the region.
176
These projects are being carried out jointly with the agency’sregional partners. Although a number of agencies are involved(e.g., Northern Virginia and Maryland local bus operators),WMATA and the Maryland MTA are taking the lead roles inimplementing the projects.
RESULTS AND IMPACTS OF FARE INITIATIVES
SmarTrip
Customer Impacts and Benefits
Since its introduction, the SmarTrip program has experi-enced steady expansion; the growth in SmarTrip card sales isshown in Figure CS13-2. This steady rise in use and accep-tance is particularly noteworthy considering that (1) WMATAhas not promoted the card beyond its regular public fare infor-mation, and (2) the card costs the user $5 to acquire (i.e.,before any value is added). As shown in the figure, SmarTripmonthly sales have ranged from approximately 4,000 to morethan 10,000 new cards sold. During the period from May 1999through May 2002, nearly 250,000 SmarTrip cards were sold.
Overall, SmarTrip customers are very satisfied with thebenefits that they derive from using their cards. In user sur-
2,000
4,000
6,000
8,000
10,000
12,000
May
-99
Jul-9
9
Sep-9
9
Nov-9
9
Jan-
00
Mar
-00
May
-00
Jul-0
0
Sep-0
0
Nov-0
0
Jan-
01
Mar
-01
May
-01
Jul-0
1
Sep-0
1
Nov-0
1
Jan-
02
Mar
-02
May
-02
Mon
thly
Sal
es
50,000
100,000
150,000
200,000
250,000
300,000
Cum
ulat
ive
Sal
es
Monthly Sales Cumulative Sales
Figure CS13-2. SmarTrip sales, May 1999 to May 2002.

veys, customers rate convenience as the single highest factorfor using the card. Table CS13-2 summarizes customers’ rat-ings of a variety of reasons for using the SmarTrip card.
As suggested earlier, one of the major customer benefits ofSmarTrip is the ability to restore the card’s remaining valueif the card is lost or stolen. Although customers need to reg-ister their cards in order to take advantage of this benefit, thishas deterred very few card purchasers. Privacy concerns haveapparently not been an issue with customers; WMATA hasestablished a very strict privacy policy, promising its Smar-Trip customers that their personal information will never besold or released to a third party. As a result, more than 98 per-cent of all SmarTrip customers choose to register their cards.
In addition to the capability of replacing lost or stolen cards,SmarTrip provides other benefits to its customers. Amongthese are the following:
• Ease of use. The contactless technology allows for eas-ier and faster access to the system at fare gates, particu-larly for many passengers with disabilities.
• Multiple Payment Options. The technology has thecapability to accommodate multiple payment options(as well as multiple modes and operators, a feature thatwill become important as the Regional Smart Card Pro-gram is implemented).
• Autoload Functionality. This feature enables a smartcard user to have value automatically loaded on to thecard from virtually any fare collection system compo-nent (i.e., fareboxes, faregates, TVMs and point-of-saledevices). Although this feature is a mainstay of theSmartBenefits program (currently limited to Metrorail),it has yet to be demonstrated as a viable application ona bus farebox.
The smart card technology also offers the opportunity tointroduce innovative fare structure and payment options.WMATA is considering the following strategy:
• “Fair Fare” Strategy. This option would enable aSmarTrip user to enjoy the benefits of an unlimited ridepass without buying a pass. A counter on the card keepstrack of each card’s use within a certain time period, andthe fare system is programmed so that riders pay the
177
lowest possible fare, based on their usage. For instance,once a cardholder has taken a certain minimum numberof rides during a day, the card automatically becomestreated like an unlimited use day pass, and all subse-quent rides that day become free. Even at this point,however, rides continue to be tracked; thus, if the card-holder uses the card a sufficient number of times in a7-day period, the card becomes treated like a weeklypass (and subsequently a two-week pass) The flexibilityof the software further permits the Fair Fare to be imple-mented on either a calendar or a rolling period basis.Moreover, future policies and interagency agreementscould even extend the Fair Fare practices to includemultiple operators. Fair Fare could attract new riders, asit essentially guarantees that a rider will pay the lowestpossible fare for a particular trip.
Data on usage of the First Union and GSA pilot programsare not available at this time. These programs are not neces-sarily intended to be expanded but are merely designed todemonstrate the feasibility of multiapplication cards. Futureprograms may or may not duplicate all of the features avail-able in these two demonstrations.
Operational and Administrative Impacts andBenefits
One of the main benefits that WMATA has derived fromimplementing the SmarTrip program is the flexibility andopportunities that the technology has provided. Without thecapabilities of the smart card, most of the other fare initia-tives that WMATA is implementing (i.e., including thosediscussed in this case study: First Union Pilot, GSA Pilot,SmartBenefits, “Fair Fares” and the Regional Fare Integra-tion effort) would not be possible.
Operationally, SmarTrip allows faster access through thefaregates than the paper magnetic farecards. Reduced main-tenance costs—due to the machines having fewer movingparts since transports and thermal printers are not needed—are generally considered another key benefit of contactlesssmart card technology. However, WMATA has not studiedthe operating and maintenance cost impacts of SmarTrip asyet. Indeed, WMATA has not pursued the program as a meansof reducing costs, but rather as way to provide improved cus-tomer convenience, via a flexible state-of-the-art technology.
Because the current SmarTrip card is simply another pay-ment option in the already automated Metrorail fare system,SmarTrip has otherwise had minimal impact on WMATA’soperations to date. However, there may be negative revenueimpacts to consider. For instance, in converting customersfrom magnetic farecards to smart cards, the agency stands tolose some of the expired-value revenue it now accrues frommagnetic farecards with stored vale that has never been used.This is because many people use magnetic farecards once ortwice and then dispose of them, even if they still have some
TABLE CS13-2 Reasons for using SmarTrip card
Factor Percent
Rating Highest Convenience 63 Durability 12 No need to carry cash 10 Fast transactions 10 Higher stored value than paper fare cards 6 Security feature 5
SOURCE: WMATA Department of Finance & Program Development.NOTE: Total sums to more than 100% because respondents giving highest rating to more than one factor.

value. WMATA estimates that between $3 million and $5million in unused value is written off annually. In contrast,the purchase fee and registration process ensures that mostSmarTrip cards will be retained and reloaded time after time,effectively eliminating the possibility of expired value. Assuch, the SmarTrip program will result in reduction of thisunofficial source of revenue.
The Fair Fare strategy under consideration could well alsohave a negative impact on fare revenue—though it should alsoresult in some increase in ridership. The strategy essentiallyconverts rides that would otherwise have been paid for (i.e.,from stored value) to free rides, once the rider has exceededthe threshold usage level to turn the card into a pass. Theextent of revenue loss, if any, will depend on the exact struc-ture and pricing of the program (e.g., number of rides neededto reach certain pass levels, pass breakeven levels) and thenumber of riders using Fair Fare versus purchasing passesfrom the outset. WMATA has yet to conduct a completeanalysis of the impacts.
Metrochek and SmartBenefits
Customer Impacts and Benefits
The Metrochek program actually has two different cus-tomers—the employee and the employer. The Metrochek pro-gram’s immediate benefit to employees is the savings in travel
178
costs. Additionally, there is a tax savings in that employeetravel expenses are paid with pretax income, which providesthe employee with a real value that can exceed the value ofthe transportation provided. Table CS13-3 shows an exam-ple of the real value to employees in both the private sectorand the federal government in a case where an employer pro-vides the maximum benefit of $100 per month.
As shown in this table, a $1,200 annual transit benefit isworth about $1,700 in income to a private-sector employeeor federal employee under the Federal Employees RetirementSystem (FERS), and $1,625 to a federal employee under theCivil Service Retirement System (CSRS).
In terms of benefits to the employer, the Metrochek pro-gram allows the employer to provide its employees with a$1,200 benefit at a discount of up to 44 percent. The discountresults from the employer’ savings in payroll taxes. TableCS13-4 shows the savings to employers from the Metrochekprogram. Based on the ability to produce such savings, theprogram has grown to include over 2,500 private employersand 269 federal agencies in the Washington area.
SmartBenefits also provides significant benefits to pro-gram users. In addition to all of the benefits offered by theMetrochek program, employers taking part in the Smart-Benefits program enjoy the convenience of using the Internetto manage the program, while employees enjoy the conve-nience of being able to automatically download their benefitsthrough Metrorail TVMs.
TABLE CS13-3 Real value of Metrochek to employees
Value Private-Sector/ Federal (FERS)
Federal Government (CSRS)
Benefit Amount $1,200.00 $1,200.00
Federal Income Tax Savings $336.00 $336.00
Employee FICA Savings (7.65 percent)
$91.80 $17.40
Estimated State Tax Savings (6 percent)
$72.00 $72.00
Total Value $1,699.80 $1,625.40
SOURCE: WMATA Marketing Department.
TABLE CS13-4 Employer savings from Metrochek
Value Private-Sector Federal (FERS) Federal (CSRS)
Benefit Amount $1,200.00 $1,200.00 $1,200.00
Federal Income Tax Savings ($360.00) $0.00 $0.00
Employer FICA Savings (7.65 percent)
($91.80) ($91.80) ($17.40)
Unemployment Tax Savings ($72.00) ($72.00) ($72.00)
Net Cost $676.20 $1,036.20 $1,110.60
Percent Savings 43.7 percent 13.7 percent 7.5 percent
SOURCE: WMATA Marketing Department.

Operational and Administrative Impacts andBenefits
One of the main benefits to WMATA is that nearly 90 per-cent of all Metrochek value is used on Metrorail and Metrobus;Metrocheks used at other transit providers in the region repre-sent only a fraction of those used on WMATA. However, theportion of Metrochek benefits used outside WMATA hasbeen steadily rising. Between 2000 and 2002, the amount ofMetrocheks redeemed at other transit providers increased from$4.5 million to $16.1 million. At the same time, WMATA’sshare of Metrochek revenues has decreased from 91 percentto 88 percent.
Another benefit to WMATA is the revenue derived fromMetrochek sales. Between 1993 and 2002, Metrochek saleshave grown more than 1,500 percent. Figure CS13-3 showsthe increase in Metrochek sales since the program’s incep-tion from $8.3 million in 1993 to $133.8 million in 2002.
Where the SmartBenefits program is concerned, the bene-fits to WMATA are only just beginning to be realized. Onebenefit of the program is that it will almost certainly reduce theoperating costs of the Metrochek program. By using the Smar-Trip card, WMATA will be able to reduce the costs of print-ing and distributing Metrocheks to employers. Consideringthat nearly 90 percent of all Metrochek participants are usersof WMATA’s services, the potential costs savings are sub-stantial. (Data on the cost savings is not currently available).
Regional Smart Card Program
WMATA is in the early stages of its procurement of thebus farebox equipment. However, some potential impacts andbenefits are identified below.
Customer Impacts and Benefits
Besides the aforementioned benefits of using the SmarTripcard, the key benefit to customers of the regional program will
179
be the ability to travel throughout the region using a singlecard. Each card will be able to carry more than one type offare product. For example, a patron with a smart card monthlypass for the Maryland commuter rail system, MARC, maywish to add a WMATA stored value application to the card.When the card is used on a particular system, that system’sfare collection equipment will identify the appropriate fareproduct loaded on the card.
With regard to impacts on customers, a key issue relates tothe plan to continue charging a purchase fee for the smartcard. Although there has been no significant complaint amongMetrorail users about the $5 price tag for the SmarTripcard, this could become more of an issue among bus riders.First of all, bus riders are often lower income than most railriders, and thus may be generally more resistant to paying asurcharge for a farecard. In considering this issue, WMATAhas found that the rate of SmarTrip card purchase has beenstrong even in the poorest neighborhoods. However, a keydifference between the current situation and that planned forthe bus system is that, on rail, the rider has a choice betweenpaying for a smart card and using the magnetic farecard—which offers the same benefits of prepayment (including the10 percent bonus on stored value) but without the initial fee.Although WMATA has decided to forego a magnetic optionfor the new bus fare equipment, flash passes will still beavailable in the short term. However, in order to take advan-tage of the stored value bonus, the convenience of seamlesstransfers to other systems, and other new fare options (e.g.,Fair Fares), a bus rider will have to purchase a SmarTripcard; the alternative will be to pay for each ride in cash or touse a flash pass. This could well raise equity-related com-plaints from riders or from community organizations repre-senting riders.
WMATA plans to provide cards at no (or minimal) chargeto social service agencies, for free distribution to very low-income riders; whether this forestalls equity complaintsremains to be seen. It will also be necessary to conduct aneffective marketing campaign, educating riders as to the natureof the benefits of buying the card.
$-0
$20.0
$40.0
$60.0
$80.0
$100.0
$120.0
$140.0
$160.0
1993 1994 1995 1996 1997 1998 1999 2000 2001 2002
Fiscal Year
Dol
lars
(in
mill
ions
)
SOURCE: WMATA Marketing Department.
Figure CS13-3. Metrochek sales growth.

Operational and Administrative Impacts andBenefits
The implementation of the regional payment system willlikely have a range of impacts on WMATA’s operations andadministration. The development of partnership agreementsamong the participants, particularly regarding establishing theRegional Customer Service Center, has been challenging. Ithas been necessary to resolve a range of issues in developingthe structure of the proposed RCSC, including overall policyand business rules, technical requirements, and administrativeand customer support functions. Moreover, even if the RCSChandles the bulk of the responsibilities for managing and sup-porting the regional program, WMATA and the other agen-cies in the program may have increased internal fare collec-tion and data reporting responsibilities as well.
With regard to cost impacts, the most immediate impacton WMATA will be the capital cost associated with expand-ing SmarTrip acceptance to bus. The bus farebox project isestimated to cost $20 million for all of the equipment: fare-boxes, computer systems, receiver vaults, smart card readers,spare parts, and warranty. Of course, since WMATA needednew fareboxes regardless of SmarTrip, the entire cost shouldnot be attributed to the expansion of SmarTrip. Finally, therewill also be costs associated with WMATA’s use of the RCSC,as well as ongoing costs associated with maintaining the equip-ment and with any agency personnel needs in participating inthe program (including adding staff where necessary and train-ing operators and other support staff). At the present, infor-mation related to these costs is not available.
CONCLUSIONS AND LESSONS LEARNED
Customer Impacts and Benefits
SmarTrip has the following benefits and impacts forWMATA customers:
• Improved ease of use via contactless interface.• Improved flexibility of fare payment through (1) accom-
modating multiple uses (i.e., transit, debit card, ID cardand benefits card), and (2) potential for innovative farestructure and payment options (e.g., Fair Fare strategy,which is essentially a guaranteed lowest fare program).
• Improved convenience through (1) ability to registerand restore value if card lost or stolen, (2) ability toaccommodate multiple payment options, (3) autoloadcapability.
• Slightly higher cost to customers, given requirement topay $5 to purchase the SmarTrip card.
There are essentially two different customer groups for theMetrochek program, employees and employers; benefits foreach group include the following:
180
• Employees receive a transit expense bonus when usingMetrochek, as a result of the tax savings. The amount ofthe bonus can vary from 35 to 40 percent, depending onthe amount of the employee’s benefit and whether theemployee works in the government or private sector.
• Employers benefit from a savings in their payroll taxes.Employers can save anywhere from 7 to 44 percent ontheir payroll taxes by providing their employees withMetrocheks rather than a transportation allowance intheir paychecks.
The SmartBenefits program has further benefits for employ-ees and employers:
• Employees will have the convenience of claiming theirbenefits simply by tapping their cards at a MetrorailTVM. Once the new fareboxes are installed on Metro-buses, the reach of the SmartBenefits program will befurther increased.
• Employers will be able to better manage their transitbenefit programs via the Internet.
The Regional Smart Card Program is expected to have thefollowing types of customer benefits and impacts:
• Ability to travel seamlessly using public transit through-out the Baltimore-Washington-Northern Virginia regionregardless of mode or operator.
• Improved flexibility through ability to carry more thanone agency’s fare medium on the card.
• Higher cost, due to initial charge for card; passengeracceptance of this charge remains to be determined,although the charge has been readily accepted by Metro-rail customers.
Agency Impacts and Benefits
The agency-related impacts and benefits experienced to dateor anticipated for the SmarTrip program include the following:
• WMATA has not yet conducted an in-depth analysis ofthe costs versus benefits of the existing SmarTrip pro-gram or of its expansion throughout the region. How-ever, WMATA has not viewed the program as a meansof reducing costs; rather, the focus in implementingSmarTrip has been on improving the customer’s conve-nience and providing customers with a flexible state-of-the-art fare payment medium.
• The SmarTrip program has proven very popular withMetrorail riders. Sales of the cards have increased steadilydespite (1) the lack of any formal marketing of the pro-gram by WMATA, (2) the $5 initial purchase price, and(3) the limited sales locations.
• The SmarTrip program has improved WMATA’s flexi-bility in terms of the ability to add new fare structure andpayment options (e.g., Fair Fare strategy).

• The successful introduction of the Metrorail SmarTripprogram has enabled WMATA to implement a numberof other programs (e.g., First Union Pilot, GSA Pilot,SmartBenefits and Regional Fare Integration) that willfurther increase customer convenience and, thus, shouldincrease ridership; these programs could ultimately leadto some improvements in the efficiency of WMATA’soperation (e.g., through greater fare equipment reliability).
• The SmarTrip program may have a negative impact onsystem revenue, due to the loss of expired-value rev-enue associated with unused magnetic farecards (i.e., asincreasing numbers of customers switch to SmarTripcards, which are intended to be retained and reloaded forlong periods of time). There may also be some revenueloss if the Fair Fare strategy is implemented; this strat-egy converts rides that would otherwise have been paidfor from stored value to free rides once the rider hasexceeded the threshold usage level to turn the card intoa pass. The extent of revenue loss will depend on thepricing of the program and the number of riders usingFair Fare versus purchasing passes from the outset.
Agency benefits and impacts of the Metrochek and SmartBenefits initiatives include the following:
• Metrochek sales have increased exponentially since theprogram’s inception in 1993. In 1993, Metrochek saleswere $8.3 million. Today, Metrochek sales are $133.8million. While Metrocheks can be used to buy fare mediaat more than 225 transportation providers throughoutthe Washington area, approximately 90 percent are usedon WMATA’s Metrorail and Metrobus.
• The SmartBenefits program has been successful so far.The true benefits to WMATA will not be fully achieveduntil the new smart card-capable fareboxes have beeninstalled on Metrobus. At that time, WMATA should beable to convert most Metrochek users to SmartBenefits,which will eliminate the need for WMATA to print,process, and distribute large numbers of Metrocheks.
The expected agency benefits and impacts of the RegionalSmart Card Program Fare include the following:
• Increased ridership and greater efficiency in fare col-lection.
• Increased fare collection and data reporting responsibil-ities for WMATA, despite the RCSC’s overall responsi-bility for managing and supporting the regional program.
• Various costs, including (1) the capital cost associatedwith expanding SmarTrip acceptance to bus (an esti-mated $20 million for all of the new bus equipment);(2) fees associated with the agency’s use of the RCSC;and (3) ongoing operating and maintenance costs, includ-ing training of personnel, hiring new personnel, and main-taining the equipment.
181
Clearly, the Regional Smart Card Program is a complexundertaking, entailing a range of institutional, operationaland financial challenges. WMATA and the other agencieshave addressed one of the major challenges in developing acommon technology procurement strategy; in order for fullregional integration to occur, it is now necessary to completethe process of establishing the clearinghouse.
Impacts and Benefits for Partner Entities
WMATA has entered into several types of partnerships inimplementing these fare initiatives. While the First Unionand GSA pilots have been quite limited in scope, they havedemonstrated the feasibility of establishing multiapplicationcard arrangements; such arrangements offer the potential tosignificantly improve market penetration, for both transit rid-ers and users of the partner applications.
The employer-based partnerships programs, Metrochek andSmartBenefits, benefit employers in several ways, as describedabove, under Customer Impacts and Benefits. These programsprovide payroll tax benefits and also provide employers with aconvenient means of distributing transit commuter benefits toemployees. SmartBenefits in particular allows employers witha to manage their benefit programs easily by using the Internet.
Liability to Agency
The SmarTrip program carries some economic liability interms of the potential loss of revenue: (1) the loss of expiredvalue associated with reduced use of disposable farecards,and (2) the potential loss of fare revenue associated with theFair Fare strategy. While neither source is expected to turnout to represent a substantial percentage of the overall sys-tem revenue, the impacts should be kept in consideration asthe program expands.
Due in part to the tremendous growth of the Metrochekprogram, certain economic liabilities have resulted. Firstly,due to outstanding Metrocheks that have not yet been used,WMATA must carry a contingent liability of more than $10million on its books (Note: the SmartBenefits programintends to solve this problem by allowing employers, throughthe Internet software, to remove employees’ unclaimedbenefits from the system). In addition, the fraud potentialfor Metrocheks is slightly higher than for other fare media.Since many employees receive Metrocheks in excess oftheir true transportation needs, an underground market ofMetrochek sales has been created. For example, WMATAhas discovered many Metrocheks being sold through on-lineauction sites. No liabilities have yet been identified for theSmartBenefits program.
The Regional Smart Card Program carries the same typesof economic liability as the existing SmarTrip program. Inaddition, there may be some political liability for the agencyassociated with the plan to continue charging an initial fee forobtaining the SmarTrip card. While this has not been an issue

for Metrorail riders, the situation could change when the pro-gram expands to buses where, unlike on rail, riders will nothave the option to use magnetic farecards (at no initial cost)to obtain the discounts or bonuses attached to use of elec-tronic fare media. This situation, coupled with the fact thatthe bus market tends to be lower income than the rail market,could conceivably generate equity-related complaints fromriders or from community organizations representing riders.Hopefully, WMATA will be able to avoid such complaintsby providing free or very low-cost cards to low-income rid-ers and by educating these riders as to the benefits to bereceived by buying the card (e.g., registration and replace-ment of value).
Constraints and Barriers
A major technical constraint often facing agencies seekingto add smart card capability to an existing fare collection sys-tem is insuring compatibility with the existing system. In aneffort to facilitate installation of the SmarTrip readers intothe Metrorail faregates, WMATA opted to sole source theimplementation to the existing rail fare collection vendor,Cubic Transportation Systems. While this expedited theimplementation process, it also resulted in a constraint relatedto the price of the smart cards to be used in the system.Because Cubic at the time used only its own proprietary cardtechnology (the GoCard), WMATA was limited to that sin-gle source of cards; this resulted in a relatively high per cardprice (around $10 apiece, initially). This price has subse-quently dropped considerably (to roughly $5 apiece), and isexpected to drop further; nevertheless, other types of smartcards produced by multiple vendors (e.g., ISO Type A or Bcards) tend to be somewhat less expensive than proprietarycards. In the expanded regional system, Cubic will be pro-viding its Tri-Reader technology, which is capable of beingprogrammed to read Type A, Type B, or GoCard contactlesscards. This provides an option to use a nonproprietary tech-nology at some point, but since the Metrorail system cur-rently can only read Cubic’s proprietary cards, Type A andType B cards could not be implemented until the Metrorailsystem has been retrofitted with Tri-Readers and the sup-porting software.
Initially, the Metrochek program met with some resistancefrom employees because the distribution cycle is quarterly. Assuch, employees needed to manage their transportation costsmore carefully than if it were done monthly. Another con-straint of the program is the result of WMATA’s operating inthe Washington area. Since three-quarters of the Metrocheksissued are distributed to federal employees, the Transporta-tion Administrative Services Center (TASC) is involved inactively managing the program on behalf of most federalagencies. Due to the magnitude of the program, the lead timein the sales cycle for federal employers is much longer thanfor private-sector employers.
182
Currently, the only identifiable constraint of the Smart-Benefits program is that it is limited to Metrorail users. How-ever, the regional initiative will result in WMATA’s extend-ing the program to Metrobus and to other operators in theregion.
Given the number of parties involved and the complexityof the necessary agreements, there are many potential con-straints and barriers related to implementation and operationof the Regional Smart Card Program. In order for the programto reach fruition, the participating entities will need to developand agree on a broad range of processes that will enable allparticipants to interface with each other in a seamless manner.The participants will need to make substantial changes insome of their current business practices in order to make theprogram work. Among the issues that need to be resolved arethose related to governance (e.g., how will the regional pro-gram be controlled and managed), cost allocation details (e.g.,the nature of the participant fee structure), revenue allocationand settlement procedures, operator reporting requirements,and operator customer service responsibilities.
Required Equipment and Technology
All of these fare initiatives are based on some form ofadvanced fare payment technology. SmarTrip uses smartcard technology, Metrochek uses magnetic stripe technol-ogy, and SmartBenefits uses both smart card technology andweb-based data management software.
The Regional Smart Card Program will rely on a regionalstandard for fare collection equipment and smart cards basedon the SmarTrip format. The joint farebox procurementdescribed above will ensure that all bus operators in theregion will have a common farebox that is compatible withWMATA’s rail equipment. Additionally, one of the require-ments of the RCSC procurement is to ensure that the systemsassociated with the customer service, clearing and settlementfunctions, and point-of-sale network are fully compatible withthe fare collection equipment deployed throughout the region.
Lessons Learned
A number of key lessons have been learned from the devel-opment of these fare initiatives; these include the following:
• Smart cards can prove quite popular with transit riders,even without extensive marketing by the agency, despitethe existence of an initial purchase charge. Key sellingpoints of the SmarTrip card have included (1) the abil-ity to guarantee replacement of value if the card is lost,(2) automated loading methods; and (3) the contactlessconvenience of using the card.
• Using the SmarTrip technology as a platform, WMATAhas been able to develop partnerships with the other tran-

sit operators in the region, and with nontransit entities(i.e., First Union Bank and the GSA). The completionof the regional program will likely create further oppor-tunities to incorporate other applications (e.g., retail,hospitality and entertainment, university, security, andothers) as well.
• Programs such as Metrochek and SmartBenefits programscan be quite beneficial—and thus attractive—to bothemployers and employees by streamlining the process ofdistribution of transit benefits.
CASE STUDY CONTACTS AND SOURCES
The following individuals assisted in providing informa-tion included as part of this case study:
Peter BenjaminWMATA600 Fifth Street, NWWashington, DC [email protected]
Gregory GarbackWMATA600 Fifth Street, NWWashington, DC [email protected]
183
Craig MaxeyWMATA600 Fifth Street, NWWashington, DC [email protected]
Lorraine TaylorWMATA600 Fifth Street, NWWashington, DC [email protected]
Donna MurrayWMATA600 Fifth Street, NWWashington, DC [email protected]
The following documents (in addition to ridership and rev-enue summaries and other data) were used in preparing thecase study:
QS&A Research & Strategy. 2001 Public Perceptions ofTransit Tracking Study.
SmarTrip: Making the Move from ‘Paper to Plastic’, Wash-ington Metropolitan Area Transit Authority, Office ofAccounting Quarterly Meeting: Celebration of Change;May 30, 2002.

184
REFERENCES: PART II
1. Foote, P., and D. Stuart. Impacts of Transit Fare Policy Initia-tives Under an Automated Fare System. Transportation Quar-terly, Volume 54, Number 3, Summer 2000.
2. Foote, P., R. Patronsky, and D. Stuart. Customer Impacts ofCTA’s Automated Fare Collection System. Paper presented atTRB Annual Meeting, January 1999.
3. Foote, P., R. Patronsky, and D. Stuart. Transit Customer Accep-tance of Automated Fare Collection Systems. Journal of PublicTransportation, Volume 2, No. 3, 1999.
4. Stuart, D. University and College Student Ridership Growth inChicago U-PASS Program. Paper presented at APTA RapidTransit Conference, Boston, June 2001.
5. CTA Market Research Department. 2000–01 U-PASS StudentRidership. Technical Report MR/DSD01-22, August 2001.
6. CTA Market Research Strategic Planning Department. CTASmart Card Pilot Program: Customer Satisfaction Survey, Tech-nical Report MR01-03, February 2001.
7. Foote, P., and D. Stuart. Testing Customer Acceptance of SmartCards at the Chicago Transit Authority. Paper presented atTRB Annual Meeting, January 2002.
8. CTA Smart Card Pilot Program. A Presentation by Technol-ogy Management and Finance Division, CTA, February 2001.
9. Lee, D.A. Introducing Fare Simplification and New Conve-nience Fares at Connecticut Transit. Transportation ResearchRecord 1669 (1999), pp. 109–112.
10. Ilium Associates. CT TRANSIT Marketing Project: Recom-mendations. Prepared for CT TRANSIT, June 1996.
11. Taylor, S., and D. Carter. Maryland Mass Transit AdministrationFare Simplification: Effects on Ridership and Revenue, Trans-portation Research Record 1618 (1998), pp. 125–130.
12. Getting On Board: The Maryland Comprehensive Transit Plan,Volume I Executive Report, Maryland Mass Transit Adminis-tration, December 2000.
13. Benton International, TransLink Program Plan for the MTC,December 1995.
14. From presentation by Russell Driver, MTC, November 2000.15. Charles River Associates, Evaluation of the TransLink Demon-
stration (Final Report), for MTC, September 2002, p. xii. 16. “NJ TRANSIT’s Call to Action: An Investment for the Future,
Fiscal Years 2002 through 2006 and Beyond,” NJ TRANSIT,September 2001.
17. Capadonna, L.V. WorkPass Works for Everyone. Act ’99/Hyperlink to Mobility (1999).
18. Multisystems, Lewis Polin & Associates, and Mundle & Asso-ciates. OCTA Fare Structure Study—Final Report, March 1994.
19. www.transitcenter.org/benefits/tc_ee/savings.htm20. Echelon Industries. Advanced Fare Payment Media Study for
USDOT/SBIR. 1992.21. Volpe National Transportation Systems Center. Ventura County
Fare Integration: A Case Study, September 2001.22. Presentation on the project made by Ginger Gherardi, Execu-
tive Director of VCTC.23. QS&A Research & Strategy. 2001 Public Perceptions of Tran-
sit Tracking Study.

A-1
APPENDIX A
BIBLIOGRAPHY
Allen, George; Lipton, S. Gregory; and Brooke, Brian. “UniqueVoucher Program Increases Alternative Commuting,” submittedto TRB (July 1998).
Allen, John. “Fare Coordination Between Commuter Rail and OtherTransit Services” (July 2001).
Ambrosino, G.; Boero, M.; Sassoli, P.; Iacometti, A.; and Biagiotti,S. “Integration of Public Transport Systems and Services in theCity of Florence: Demand Responsive Bus Services in LowDemand Areas.”
APTA. 2000 Transit Fare Summary (2001).Barr, Joseph. “Fare Integration Between Public and Private Opera-
tors: Existing Obstacles and the Potential for Smart Cards.”Blythe, P.T. “Implementing Smart Card Technology to Transform
Transport Payment and Customer Information.”Booz-Allen & Hamilton, Inc. Developing a Regional Approach to
Fare Collection, prepared for Greater Washington Region Tran-sit Operators (February 2000).
Brown, Jeffrey; Hess, Daniel; and Shoup, Donald. “UnlimitedAccess,” presented at the TRB 40th Annual Meeting, Washing-ton, DC (November 1999).
Bullard, Robert. “Race and Public Transportation in Metro Atlanta:A Look at MARTA,” Transportation Equity Volume 2, Number1 (Summer 2000).
Chandrasekhar, B.N. “Demand Elasticities in Public TransportCase Study—Bombay.”
Chang, Foun-Shea; Hou, Richard Chih-Jung; and Shen, Kirk. “APilot Study on Integrated Public Transportation Ticketing Usinga Contactless Smart Card in Taipei Metropolitan Area.”
Charles River Associates. Evaluation of the TransLink Demonstra-tion (Final Report), for Metropolitan Transportation Commis-sion, September 2002.
Chira-Chavala, T. and Coifman, B. “Impacts of Smart Cards onTransit Operators,” presented at TRB 75th Annual Meeting,Washington, DC (Jan. 1996).
Choi, Soon-Yong and Whinston, Andrew. Smart Cards, EnablingSmart Commerce in the Digital Age, Draft (May 1998).
Chung, Frances. “Experience of the Tripperpas in the Dutch Munic-ipality of Groningen,” submitted for TRB Annual Meeting (Jan.2002).
Chung, Frances. “Technology and the Evolution of Fare and ServiceIntegration in GO Transit,” UITP Congress Report, Toronto 1999.
“Cleveland to Provide Pass Program for University Students,” Pas-senger Transport (August 6, 2001).
Collura, John and Plotnikov, Valeri. “The Usefulness of an EPSBusiness Case in Public Transit,” prepared for 10th ITS AmericaAnnual Mtg., Boston, MA (2000).
Community Transportation Association of America. “MissouriBootheel Transportation Outreach Program.”
Comps, Peter. “Integrating Proof-of-Payment Fare Systems withModern Fare Systems,” presented at 8th Joint Conference onLight Rail Transit, Dallas, TX (November 2000).
“Congress Considers Bills Boosting Transit Fringe Benefits,” Pas-senger Transport (April 30, 2001).
Conklin, J.; Halvorsen, R.; Fleishman, D.; and Oram, R. “Employer-Based Annual Transit Pass Programs: A Survey of Current Prac-tice in the Public Transit Industry.” Presented at TRB AnnualMeeting, Washington, DC (January 2002).
Crenshaw, Albert. “Commuting Accounts Gain Speed: IRS Pro-poses Rules to Help Firms Set Up Benefits Program,” Washing-ton Post, Sunday, February 6, Page H2.
“CTA, Riders Find a Win-Win Situation in Transit Benefits,” Pas-senger Transport (June 18, 2001).
Eidel, Chantal. “A New Transit Fare Policy for Young People Pow-ered by Direct Marketing,” UITP Workshop, Paris 2000.
E-Squared Engineering. Introduction to Electronic Payment Sys-tems and Transportation, prepared for ITS America ElectronicPayment Systems Task Force (April 2001).
FHWA. The Challenge of Job Access: Moving Toward a Solution(1998).
Fleishman, D.; Shaw, N.; Joshi, A.; Freeze, R.; and Oram, R. FarePolicies, Structures, and Technologies, TCRP Report 10 (1996).
Fleishman, D.; Schweiger, C.; Lott, D.; and Pierlott, G. Multi-purpose Transit Payment Media, TCRP Report 32 (1998).
Hillberry, Russell. “Some Fare Policy Implications of Smart Cards,”prepared for the FTA Office of Research, Demonstration andInnovation (April 1998).
Integrated Transport Smartcard Organization (ITSO). The ITSOSpecification for Interoperable Public Transport Ticketing UsingContactless Smartcards, Overview and Business Model (Novem-ber 2000).
Intelligent Transportation Society of America. ITS ElectronicPayment Systems, Workshop Proceedings, Reston, VA (Febru-ary 1999).
Internal Revenue Service. Qualified Transportation Fringe Bene-fits, Federal Register, Vol. 66, No. 8 (January 11, 2001).
King, J. and Hensher, D.A. “Establishing Fare Elasticity Regimesfor Urban Passenger Transport: Time-Based Fares for Conces-sion and Non-Concession Markets Segmented by Trip Length,”Journal of Transportation and Statistics, 1998—no. 1.
Kuester, Carol. “Implementing Smart Card Payment Systems forTransit with Multiple Partners: Examples from Germany andthe United States,” European Transport Conference—1999—no. P433.
Lee, David. “Introducing Fare Simplification and New ConvenienceFares at CTTRANSIT.” Submitted to TRB Annual Meeting.
Lobron Consultancy, Ltd. Develop a Recommended Standard forAutomated Fare Collection for Transit—Scoping Study FinalReport, TCRP J-6 Task 42, November 2002.
Louviau, Phillipe and Allouche, Jean-Francois. “First Field Test ofthe Contactless Ticketing System in Paris and Its Region.”
Mudgal, V.S. “Comparative Analysis of Fare Structures in Metro-politan Cities in India,” Indian Journal of Transport Manage-ment, 2000—no. 11.
Multisystems, Inc. Analysis of the Fare Structure and Policies(Final Report), prepared for the Capital Area TransportationAuthority (June 2001).

Multisystems, Inc. “Coordinated Intermodal Transportation Pricingand Funding Strategies,” TCRP Research Results Digest 14, Octo-ber 1997.
Multisystems, Inc. Fare Policy Study (Final Report), prepared forSoutheastern Pennsylvania Transportation Authority (January2001).
Multisystems, Inc. Fare Structure Pricing Research and Update ofRidership/Revenue Fares Model (Final Report), prepared forChicago Transit Authority (September 2000).
Multisystems, Inc., Mundle & Associates, and Parsons Transporta-tion Group. A Toolkit for Self-Service, Barrier-Free Fare Col-lection, TCRP Report 80 (2002).
Multisystems, Inc. Transit Fare Collection Decision Models forFare Policy and Cost Analysis (Final Project Summary Report),prepared for U.S.DOT/SBIR Program (November 1998).
Oorni, Seppo. “Smart Card Based Systems in Finland” (no date).Pekkarinen, S. and Dargay, J. “Public Transport Pricing Policy:
Empirical Evidence of Regional Bus Card Systems in Finland,”Transportation Research Record 1604 (1997).
Petitte, Ryan. “Fare Variable Construction and Rail Transit Rider-ship Elasticities: A Case Study of the Washington, DC MetroRail System” (July 2000).
Ponnuswamy, S. and Nesamani, K.S. “Improving the Patronage ofMRTS. Through Integration and Fare Structure Co-ordination,”Indian Journal of Transport Management, 2000—no. 10.
Ratton Neto, H.X. “Transport Subscription: An Efficient Meansto Better Performances in Urban Public Transport Networks,”(no date).
San Luis Obispo County Council of Governments (SLOCOG).Draft Welfare Reform Mobility Study (no date).
Schelin, Eva and Gustafsson, Inger. “Integrated Payment and Infor-mation in Transport Test Site Gothenburg of ADEPT II,” (no date).
Smart Card Forum Proceedings, Schaumburg, IL. Cards on the Move(June 2000).
Stern, R. Bus Transit Fare Collection Practices, TCRP Synthesis26 (1997).
Stern, R. Passenger Transfer System Review, TCRP Synthesis 19(1996).
Stitcher, Joseph. “Partners with UCLA on Farecard Demonstra-tion,” Passenger Transport (August 20, 2001).
Strategies for Increasing the Effectiveness of Commuter ChoicePrograms, TCRP Project H-25 (2003).
Stuart, Darwin and Foote, Peter. “Impacts of Transit Fare PolicyInitiatives Under An Automated Fare System,” TransportationQuarterly, Vol. 54, No. 3 (2000).
A-2
Stuart, Darwin; Foote, Peter; and Patronsky, Ross. “Transit Cus-tomer Acceptance of Automated Fare Collection Systems,” Jour-nal of Public Transportation, 1999—no. 3.
Thomas, Robert; Boyle, Daniel; and Harris, Annie. “MetropolitanAtlanta Rapid Transit Authority Fare Elasticity Model,” Trans-portation Research Record 1669 (1999).
Transportation Research Board. Workshop on Transit Fare Policyand Management: Research Needs and Priorities, Transporta-tion Research Circular 421 (April 1994).
U.S.DOT/Volpe National Transportation Systems Center. AdvancedPublic Transportation Systems: The State of the Art, Update ’98(January 1998).
Vargas, Jessica. “Unlimited Access” for San Juan’s UniversityPopulation: A Market Study of Student Attitudes Toward Transit(June 2001).
Vivier, Jean. “Urban Transport Pricing,” Public Transport Interna-tional—5/99.
Volpe National Transportation Systems Center and Battelle Labs.National Transit Smart Card Guidelines, Transit-UniversityModule (Draft) (1999).
Volpe National Transportation Systems Center and Booz-Allen &Hamilton. National Transit Smart Card Guidelines, RegionalFare Program Integration Module (Draft) and Transit-FinancialModule (Draft) (1999).
Volpe National Transportation Systems Center and IBI. NationalTransit Smart Card Guidelines, Employer Programs Module(Draft) (1999).
Volpe National Transportation Systems Center. National Guide-lines and Technical Specifications Initiative for Electronic Pay-ment Systems, Transit Requirements Document (Draft, Version2), Cambridge, MA (November 1998).
Watry, Duncan and Straus, Peter. “MUNI Metro Goes POP: Imple-menting Proof of Payment Fare Collection on MUNI Metro,”presented at the 8th Joint Conference on Light Rail Transit, Dal-las, TX (November 2000).
Weinstein, A.; Lockhart, R.; and Rolandson, B. “Transit Prepay-ment Challenges—Factors Influencing Customers’ Willingnessto Purchase High Value Tickets.”
White, Chris. Effects of the go! Pass on Transit Ridership andDowntown Commuting (First Report) (September 2000).
Williamson, Jennifer and Hurwitz, Elliot. “The Marketing and FareNexus Applied to San Diego,” Transportation Research Record1669 (1999).
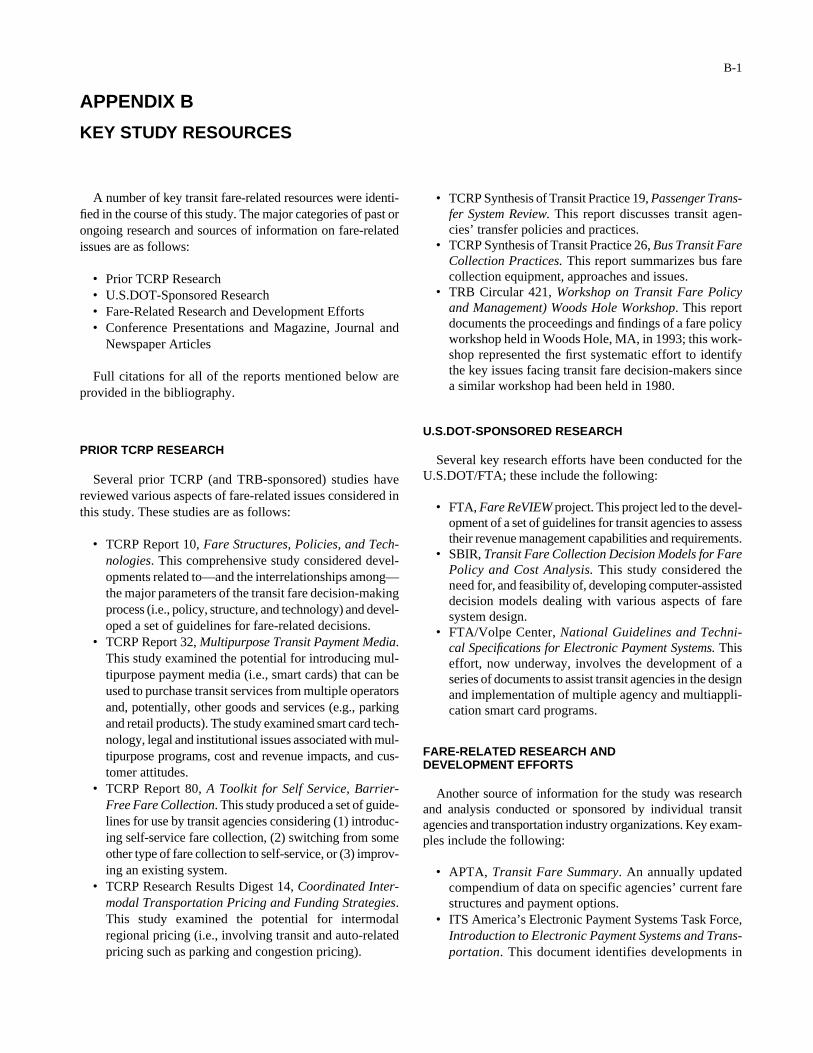
B-1
APPENDIX B
KEY STUDY RESOURCES
A number of key transit fare-related resources were identi-fied in the course of this study. The major categories of past orongoing research and sources of information on fare-relatedissues are as follows:
• Prior TCRP Research• U.S.DOT-Sponsored Research• Fare-Related Research and Development Efforts• Conference Presentations and Magazine, Journal and
Newspaper Articles
Full citations for all of the reports mentioned below areprovided in the bibliography.
PRIOR TCRP RESEARCH
Several prior TCRP (and TRB-sponsored) studies havereviewed various aspects of fare-related issues considered inthis study. These studies are as follows:
• TCRP Report 10, Fare Structures, Policies, and Tech-nologies. This comprehensive study considered devel-opments related to—and the interrelationships among—the major parameters of the transit fare decision-makingprocess (i.e., policy, structure, and technology) and devel-oped a set of guidelines for fare-related decisions.
• TCRP Report 32, Multipurpose Transit Payment Media.This study examined the potential for introducing mul-tipurpose payment media (i.e., smart cards) that can beused to purchase transit services from multiple operatorsand, potentially, other goods and services (e.g., parkingand retail products). The study examined smart card tech-nology, legal and institutional issues associated with mul-tipurpose programs, cost and revenue impacts, and cus-tomer attitudes.
• TCRP Report 80, A Toolkit for Self Service, Barrier-Free Fare Collection. This study produced a set of guide-lines for use by transit agencies considering (1) introduc-ing self-service fare collection, (2) switching from someother type of fare collection to self-service, or (3) improv-ing an existing system.
• TCRP Research Results Digest 14, Coordinated Inter-modal Transportation Pricing and Funding Strategies.This study examined the potential for intermodalregional pricing (i.e., involving transit and auto-relatedpricing such as parking and congestion pricing).
• TCRP Synthesis of Transit Practice 19, Passenger Trans-fer System Review. This report discusses transit agen-cies’ transfer policies and practices.
• TCRP Synthesis of Transit Practice 26, Bus Transit FareCollection Practices. This report summarizes bus farecollection equipment, approaches and issues.
• TRB Circular 421, Workshop on Transit Fare Policyand Management) Woods Hole Workshop. This reportdocuments the proceedings and findings of a fare policyworkshop held in Woods Hole, MA, in 1993; this work-shop represented the first systematic effort to identifythe key issues facing transit fare decision-makers sincea similar workshop had been held in 1980.
U.S.DOT-SPONSORED RESEARCH
Several key research efforts have been conducted for theU.S.DOT/FTA; these include the following:
• FTA, Fare ReVIEW project. This project led to the devel-opment of a set of guidelines for transit agencies to assesstheir revenue management capabilities and requirements.
• SBIR, Transit Fare Collection Decision Models for FarePolicy and Cost Analysis. This study considered theneed for, and feasibility of, developing computer-assisteddecision models dealing with various aspects of faresystem design.
• FTA/Volpe Center, National Guidelines and Techni-cal Specifications for Electronic Payment Systems. Thiseffort, now underway, involves the development of aseries of documents to assist transit agencies in the designand implementation of multiple agency and multiappli-cation smart card programs.
FARE-RELATED RESEARCH ANDDEVELOPMENT EFFORTS
Another source of information for the study was researchand analysis conducted or sponsored by individual transitagencies and transportation industry organizations. Key exam-ples include the following:
• APTA, Transit Fare Summary. An annually updatedcompendium of data on specific agencies’ current farestructures and payment options.
• ITS America’s Electronic Payment Systems Task Force,Introduction to Electronic Payment Systems and Trans-portation. This document identifies developments in

electronic payment in transit and the broader transporta-tion environment.
• A number of transit and regional planning agencies havesponsored fare-related research and planning studies inrecent years. These studies have generally sought to iden-tify possible fare policy and structure—or technology—options for improving or updating the agencies’ fare sys-tems; just in the past few years, studies have beenconducted in San Francisco, Philadelphia, Chicago, LosAngeles, Boston, Washington, DC, Atlanta, Denver, Dal-las, Pittsburgh, St. Louis, San Diego, Miami, Baltimore,and San Juan, PR, as well as in smaller cities such asLansing, MI, Norfolk, VA, Reno, NV, and Rochester,NY. In some cases, studies have focused on the feasibil-ity of regional fare integration, using advanced technolo-gies such as smart cards; examples include extensiveresearch and development efforts in the metropolitanareas of San Francisco Bay, the Washington, DC, NewYork City/Northern New Jersey, Los Angeles, Seattle/Central Puget Sound, San Diego, Miami, and southwest-ern Connecticut.
B-2
CONFERENCE PRESENTATIONS ANDMAGAZINE, JOURNAL, AND NEWSPAPERARTICLES
In addition to full reports, various magazine, journal, andnewspaper articles and unpublished conference presentationshave addressed issues relevant to this study. Through Internet-based searches of key databases, we have identified relevantpapers and presentations pertaining to fare-related issues.Key sources and databases included the following:
• Transportation Research Board, for published ResearchRecord papers and other papers presented.
• APTA/Passenger Transport, for fare-related articles.• International Union of Public Transport (UITP), for
international papers and presentations.• Other sources included local newspaper articles on fare
issues (via the Internet) and conference presentationsand papers (e.g., from the annual APTA Fare CollectionWorkshop, Transportation Research Board Annual Meet-ing, and other meetings).
C-1
APPENDIX C
ESTIMATION OF FARE SYSTEM COSTS
This appendix discusses the costs of procuring and imple-menting a new or upgraded fare system featuring some formof electronic payment based on magnetic stripe or smart cardtechnology. The two introductory sections, on factors affect-ing capital and equipment costs, are largely taken from TCRPReport 10. The detailed discussions of costs for a small, busonly, transit system and a midsize, bus and LRT transit sys-tem were developed for this report.
FACTORS AFFECTING CAPITAL COSTS
Fare collection equipment tends to be a customized product.There is no typical cost; rather, a range of costs can be esti-mated, keeping in mind that many conditions and assumptionsmay be involved in the estimate. Unit costs are generallydeveloped for each type of equipment based on the supplierquotations, equipment characteristics, experience with recentpurchases, and appropriate multipliers to allow for economiesof scale and escalation for the time value of money. In addi-tion, costs for engineering and support services depend on thepurchasing experience of the agency, the local contractingenvironment, and the skills available within the agency’spersonnel—and also whether the agency is purchasing this typeof equipment for the first time or it is a new generation replac-ing “old” equipment. It should also be kept in mind that muchfare collection equipment is largely built in response to indi-vidual orders. Each agency’s requirements invariably imposedifferent performance features, even if major modules or sub-assemblies are the same among several orders. Final configu-rations of even very similar equipment for different agenciesare rarely alike.
The price for any type of equipment is therefore sensitiveto such factors as the following:
• The equipment specifications for the individual agency,including performance requirements and features; thisaffects the amount of customization required for a prod-uct, and this customization can represent a substantialportion of the overall price.
• The quantities of the particular equipment being ordered.• The extent to which the new equipment will have to
interface with existing equipment (i.e., that is not beingreplaced).
• The nature of the vendor selection and negotiation process(e.g., type of contract: low bid, two step or negotiated).
• The timing of the procurement (relative to the procure-ment of similar equipment by other agencies—and there-fore the extent of refinement of the technology).
• Growth potential (e.g., opportunities for new/extendedlines).
• Warranty terms: warranties are generally for 1 year, butthis period can be extended based on other clauses asso-ciated with equipment performance.
• Documentation requirements (i.e., striking a balancebetween what is offered as manufacturer’s “standard”and degree of customization for the agency).
• Software requirements: some software customization isexpected, but requests for additional functions, featuresand reports will be considered extra and will increasethe cost.
• Vehicle/station/facility modifications: the cost of modifi-cations to vehicles, stations, bus garages, or other facili-ties also needs to be considered.
• Americans with Disabilities Act (ADA) requirements:fare collection equipment must address ADA require-ments; these include accommodation of wheelchairs inturnstiles, provision of sufficient room on buses to passthe farebox in a wheelchair, compliance with heightrequirements for buttons on automated vending machines,and accommodation of needs of blind riders in purchas-ing and using fare media.
Thus, there are many factors that must be considered indeveloping the capital costs for a new fare collection system.Obviously, the more extensive and complex the procurement,the greater the number of factors. Cost information for differ-ent types of equipment and fare media is presented below.
EQUIPMENT COST INFORMATION
Cost issues are critical in selecting a fare collection technol-ogy. The choice of specific media and equipment options hasmajor cost implications, both in terms of initial capital expen-ditures and on-going operating and maintenance expenses.Within both cost categories, the actual cost levels are highlydependent on the specific requirements and specifications ofthe individual transit agencies—as well as a variety of otherfactors as discussed above. With these factors in mind, it isstill useful to develop order-of-magnitude cost estimates forvarious types of equipment and media. This enables a transitagency to conduct a preliminary evaluation of the relativecosts of the different technologies or equipment options.
Table C-1 presents a range of estimated bus- and rail-relatedcosts such as might be incurred by a system introducing mag-netic farecard or smart card capabilities; variable system and

C-2
TABLE C-1 Unit cost estimates—electronic payment systems
Cost (dollars)* Nature of Cost Cost Element Low High One-
Time Ongoing
Bus-Related Costs per Unit
Mechanical farebox 2,000 3,000 X
Electronic registering farebox 4,000 5,000 X
Electronic registering farebox (with smart card reader) 5,000 8,000 X
Validating farebox (with magnetic card processing unit) 10,000 12,000 X
Validating farebox (with smart card reader) 12,000 14,000 X
Validating farebox (with magnetic & smart card reader) 13,000 17,500 X
Stand-alone smart card processing unit 1,000 7,000 X
Magnetic farecard processing unit (upgrade) 4,000 6,000 X
Onboard probe equipment** 500 1,500 X
Garage probe equipment** 2,500 3,500 X
Application software (smart card units) 0 100,000 X
Garage hardware/software 10,000 20,000 X
Central hardware/software 25,000 75,000 X
Rail-Related Costs per Unit
Ticket vending machine (TVM) 30,000 60,000 X
TVM upgrade—smart card processing 3,000 7,000 X
TVM upgrade—magnetic farecard processing 3,000 5,000 X
Add-Fare machine (cash only) 5,000 25,000 X
Fare Gate (magnetic/contactless card) 20,000 35,000 X
Stand-Alone smart card validator 5,000 8,000 X
Stand-Alone magnetic farecard validator 8,000 11,000 X
Portable (hand-held) smart card validator 2,000 4,000 X
Attended smart card revaluing device 2,500 6,000 X
Attended magnetic farecard issuing device 5,000 10,000 X
Station hardware/software (heavy rail) 50,000 100,000 X
Station hardware/software (light rail) 7,000 10,000 X
Central hardware/software 100,000 200,000 X
Variable System Costs
Spare Parts (% of equipment cost) 10 15 X
Support services include training, documentation, revenue testing, and warranties (% of equipment cost)
10 15 X
Installation (% of equipment cost) 3 10 X
Nonrecurring engineering & software costs (% of equipment cost)
0 30 X
Contingency (% of equipment/operating cost) 10 15 X X
Equipment maintenance costs (% of equipment cost) 5 7 X
Software licenses/system support (% of systems/software cost) 15 20 X
Revenue handling costs (% of annual cash revenue) 5 10 X
Clearinghouse (e.g., card distribution, revenue allocation) ++ (%of annual Automatic Fare Collection revenue) (% of annual AFC revenue)
3 6 X
Fare Media Costs per Unit
Magnetic or capacitive cards 0.01 0.30 X
Contactless cards (plastic) 2.00 5.00 X
Contactless cards (paper) 0.30 1.00 X
Contact cards 1.50 4.00 X
Dual interface cards 5.00 10.00 X
* 2002 $; the actual cost depends on functionality/specifications, quantity purchased and specific manufacturer.** In an integrated regional system, there is no additional cost for probe equipment.++ This depends on the nature of the regional program, if any.
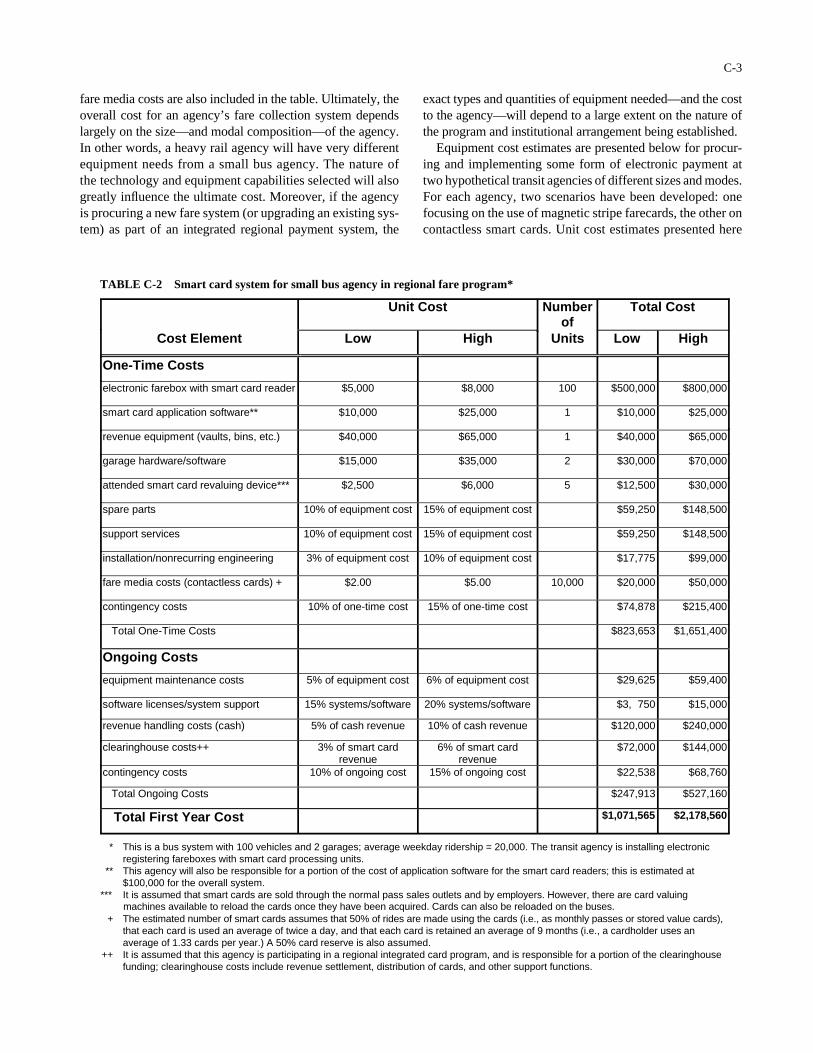
fare media costs are also included in the table. Ultimately, theoverall cost for an agency’s fare collection system dependslargely on the size—and modal composition—of the agency.In other words, a heavy rail agency will have very differentequipment needs from a small bus agency. The nature ofthe technology and equipment capabilities selected will alsogreatly influence the ultimate cost. Moreover, if the agencyis procuring a new fare system (or upgrading an existing sys-tem) as part of an integrated regional payment system, the
C-3
exact types and quantities of equipment needed—and the costto the agency—will depend to a large extent on the nature ofthe program and institutional arrangement being established.
Equipment cost estimates are presented below for procur-ing and implementing some form of electronic payment attwo hypothetical transit agencies of different sizes and modes.For each agency, two scenarios have been developed: onefocusing on the use of magnetic stripe farecards, the other oncontactless smart cards. Unit cost estimates presented here
TABLE C-2 Smart card system for small bus agency in regional fare program*
Unit Cost Total Cost Number of
Cost Element Low High Units Low High
One-Time Costs
electronic farebox with smart card reader $5,000 $8,000 100 $500,000 $800,000
smart card application software** $10,000 $25,000 1 $10,000 $25,000
revenue equipment (vaults, bins, etc.) $40,000 $65,000 1 $40,000 $65,000
garage hardware/software $15,000 $35,000 2 $30,000 $70,000
attended smart card revaluing device*** $2,500 $6,000 5 $12,500 $30,000
spare parts 10% of equipment cost 15% of equipment cost $59,250 $148,500
support services 10% of equipment cost 15% of equipment cost $59,250 $148,500
installation/nonrecurring engineering 3% of equipment cost 10% of equipment cost $17,775 $99,000
fare media costs (contactless cards) + $2.00 $5.00 10,000 $20,000 $50,000
contingency costs 10% of one-time cost 15% of one-time cost $74,878 $215,400
Total One-Time Costs $823,653 $1,651,400
Ongoing Costs
equipment maintenance costs 5% of equipment cost 6% of equipment cost $29,625 $59,400
software licenses/system support 15% systems/software 20% systems/software $3, 750 $15,000
revenue handling costs (cash) 5% of cash revenue 10% of cash revenue $120,000 $240,000
clearinghouse costs++ 3% of smart card revenue
6% of smart card revenue
$72,000 $144,000
contingency costs 10% of ongoing cost 15% of ongoing cost $22,538 $68,760
Total Ongoing Costs $247,913 $527,160
Total First Year Cost $1,071,565 $2,178,560
* This is a bus system with 100 vehicles and 2 garages; average weekday ridership = 20,000. The transit agency is installing electronic registering fareboxes with smart card processing units. ** This agency will also be responsible for a portion of the cost of application software for the smart card readers; this is estimated at $100,000 for the overall system. *** It is assumed that smart cards are sold through the normal pass sales outlets and by employers. However, there are card valuing
+ The estimated number of smart cards assumes that 50% of rides are made using the cards (i.e., as monthly passes or stored value cards), that each card is used an average of twice a day, and that each card is retained an average of 9 months (i.e., a cardholder uses an average of 1.33 cards per year.) A 50% card reserve is also assumed. ++ It is assumed that this agency is participating in a regional integrated card program, and is responsible for a portion of the clearinghouse funding; clearinghouse costs include revenue settlement, distribution of cards, and other support functions.
machines available to reload the cards once they have been acquired. Cards can also be reloaded on the buses.

are based on discussions with agencies, consultants and ven-dors over the past few years regarding the range of costs forcomparable equipment available in the U.S. marketplace asof late 2002.
Small Transit System (Bus Only)
Two sets of cost estimates were developed for a small tran-sit system that operates buses only:
(1) Costs for such a hypothetical small bus agency that isintegrated into a regional program to add smart card(Table C-2).
C-4
(2) Costs for a stand-alone small bus agency to add a mag-netic system (Table C-3).
The smart card alternative is estimated to have somewhatlower costs at both the low and high end of the cost range.The major source of the cost differential is the higher cost ofan electronic registering farebox equipped to process mag-netic (read-write) farecards. The cost of fare media is greaterfor the smart card scenario, but the relatively low number ofcards needed results in a relatively low cost differential. Notethat there is also expected to be a somewhat lower mainte-nance cost for the contactless smart card processing units thanfor the magnetic units—due to the fact that the smart cardequipment has no moving parts and is fully enclosed, that is,it has no slots into which foreign objects can be inserted.
TABLE C-3 Magnetic farecard system for small bus agency*
Unit Cost Number of
Total Cost
Cost Element Low High Units Low High
One-Time Costs
elect. farebox with card processing unit
$8,000 $10,000 100 $800,000 $1,000,000
revenue equipment (vaults, bins, etc.) $40,000 $65,000 1 $40,000 $65,000
garage hardware/software $15,000 $35,000 2 $30,000 $70,000
attended farecard issuing device** $5,000 $10,000 5 $25,000 $50,000
spare parts 10% of equipment cost 15% of equipment cost $89,500 $177,750
support services 10% of equipment cost 15% of equipment cost $89,500 $177,750
installation/nonrecurring engineering 3% of equipment cost 10% of equipment cost $26,850 $118,500
fare media costs (magnetic cards) + $0.15 $0.30 30,000 $4,500 $9,000
contingency costs 10% of one-time cost 15% of one-time cost $110,535 $250,200
Total One-Time Costs $1,215,885 $1,918,200
Ongoing Costs
equipment maintenance costs 6% of equipment cost 7% of equipment cost $53,700 $82,950
software licenses/system support 15% systems/software 20% systems/software $3,750 $15,000
revenue handling costs (cash) 6% of cash revenue 10% of cash revenue $144,000 $240,000
revenue handling costs (farecards) 3% of farecard revenue 6% of farecard revenue
$72,000 $144,000
contingency costs 10% of ongoing cost 15% of ongoing cost $20,145 $50,693
Total Ongoing Costs $293,595 $532,643
Total First Year Cost $1,509,480 $2,450,843
* This is a bus system with 100 vehicles and 2 garages; average weekday ridership = 20,000. The transit agency is installing electronic registering fareboxes with magnetic farecard processing units. ** It is assumed that farecards are sold—and can be revalued—at attended point of sale devices. Cards can also be reloaded on the buses. + The estimated number of smart cards assumes that 50% of rides are made using the cards (i.e., as monthly passes or stored value cards), that each card is used an average of twice a day, and that each card is retained an average of 3 months (i.e., each cardholder uses an average of 4 cards per year). A 50% card reserve is also assumed.
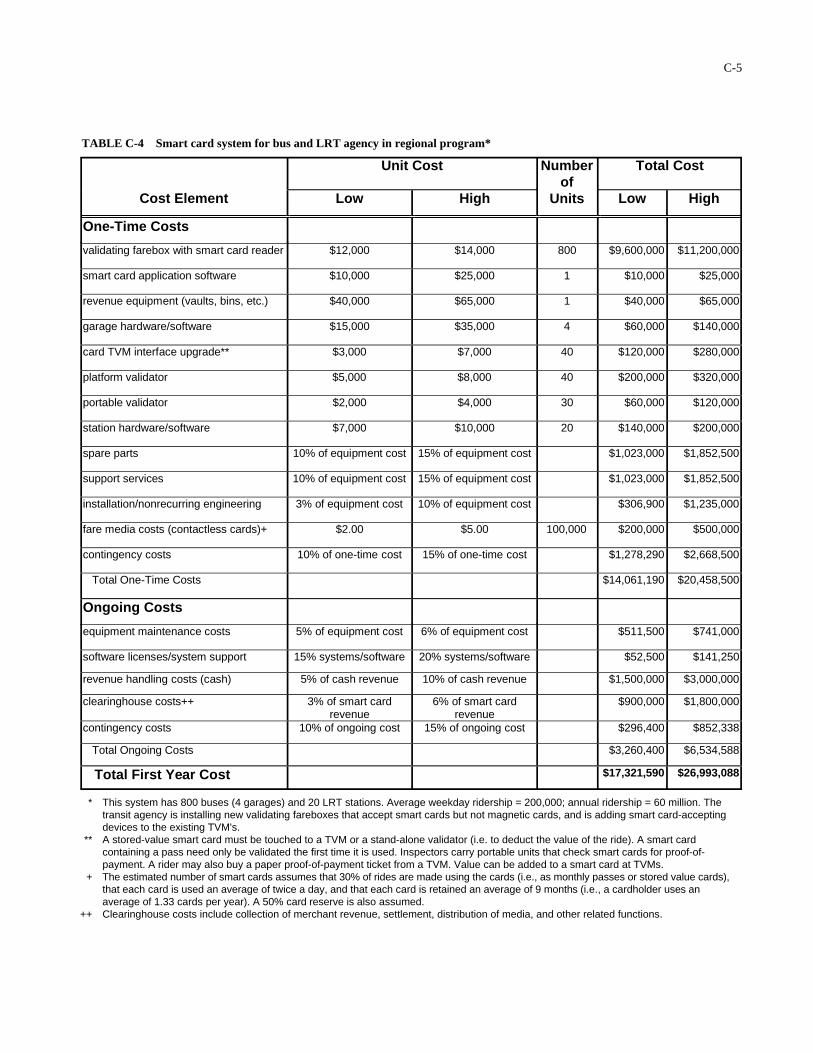
C-5
TABLE C-4 Smart card system for bus and LRT agency in regional program*
Unit Cost Numberof
Units
Total Cost
Cost Element Low High Low High
One-Time Costs
validating farebox with smart card reader $12,000 $14,000 800 $9,600,000 $11,200,000
smart card application software $10,000 $25,000 1 $10,000 $25,000
revenue equipment (vaults, bins, etc.) $40,000 $65,000 1 $40,000 $65,000
garage hardware/software $15,000 $35,000 4 $60,000 $140,000
card TVM interface upgrade** $3,000 $7,000 40 $120,000 $280,000
platform validator $5,000 $8,000 40 $200,000 $320,000
portable validator $2,000 $4,000 30 $60,000 $120,000
station hardware/software $7,000 $10,000 20 $140,000 $200,000
spare parts 10% of equipment cost 15% of equipment cost $1,023,000 $1,852,500
support services 10% of equipment cost 15% of equipment cost $1,023,000 $1,852,500
installation/nonrecurring engineering 3% of equipment cost 10% of equipment cost $306,900 $1,235,000
fare media costs (contactless cards)+ $2.00 $5.00 100,000 $200,000 $500,000
contingency costs 10% of one-time cost 15% of one-time cost $1,278,290 $2,668,500
Total One-Time Costs $14,061,190 $20,458,500
Ongoing Costs
equipment maintenance costs 5% of equipment cost 6% of equipment cost $511,500 $741,000
software licenses/system support 15% systems/software 20% systems/software $52,500 $141,250
revenue handling costs (cash) 5% of cash revenue 10% of cash revenue $1,500,000 $3,000,000
clearinghouse costs++ 3% of smart card revenue
6% of smart card revenue
$900,000 $1,800,000
contingency costs 10% of ongoing cost 15% of ongoing cost $296,400 $852,338
Total Ongoing Costs $3,260,400 $6,534,588
Total First Year Cost $17,321,590 $26,993,088
* This system has 800 buses (4 garages) and 20 LRT stations. Average weekday ridership = 200,000; annual ridership = 60 million. The transit agency is installing new validating fareboxes that accept smart cards but not magnetic cards, and is adding smart card-accepting devices to the existing TVM's. ** A stored-value smart card must be touched to a TVM or a stand-alone validator (i.e. to deduct the value of the ride). A smart card containing a pass need only be validated the first time it is used. Inspectors carry portable units that check smart cards for proof-of- payment. A rider may also buy a paper proof-of-payment ticket from a TVM. Value can be added to a smart card at TVMs. + The estimated number of smart cards assumes that 30% of rides are made using the cards (i.e., as monthly passes or stored value cards), that each card is used an average of twice a day, and that each card is retained an average of 9 months (i.e., a cardholder uses an average of 1.33 cards per year). A 50% card reserve is also assumed. ++ Clearinghouse costs include collection of merchant revenue, settlement, distribution of media, and other related functions.

Mid-Size Transit System (Bus and Light Rail)
Tables C-4 and C-5 present cost estimates for a largerhypothetical transit system adding smart card or magneticcapabilities, respectively. This agency is assumed to operateboth bus and light rail service. In contrast to the small busexample, the smart card scenario is expected to be somewhatmore costly than the magnetic scenario, primarily becausethe validating fareboxes assumed here have a higher upper-range cost when equipped to process smart cards than theydo to process magnetic cards. Note, however, that the over-
C-6
all ongoing costs for the smart card scenario are slightlylower than those for the magnetic scenario due to the lowermaintenance requirements for the smart card equipment, asexplained above.
In addition to the fareboxes, there are several other keycost differences in these two scenarios. In the magneticalternative, replacement of half of the TVMs is assumed.This is necessary to provide for in-station farecard vendingcapabilities; the other half of the TVMs are merely beingupgraded to allow a farecard to be used to buy a paper proof-of-payment ticket. In the smart card scenario, in contrast, all
TABLE C-5 Magnetic farecard system for bus and LRT agency*
Unit Cost Numberof
Units
Total Cost
Cost Element Low High Low High
One-Time Costs
validating farebox with card processing unit
$10,000 $12,000 800 $8,000,000 $9,600,000
revenue equipment (vaults, bins, etc.) $40,000 $65,000 1 $40,000 $65,000
garage hardware/software $15,000 $35,000 4 $60,000 $140,000
farecard vending machine ** $35,000 $60,000 40 $1,400,000 $2,400,000
card TVM interface upgrade $3,000 $5,000 40 $120,000 $200,000
station hardware/software $7,000 $10,000 20 $140,000 $200,000
spare parts 10% of equipment cost 15% of equipment cost $976,000 $1,260,500
support services 10% of equipment cost 15% of equipment cost $976,000 $1,260,500
installation/nonrecurring engineering 3% of equipment cost 10% of equipment cost $292,800 $378,150
fare media costs (magnetic farecards) + $0.05 $0.25 180,000 $9,000 $45,000
contingency costs 10% of one-time cost 15% of one-time cost $1,201,380 $2,332,373
Total One-Time Costs $13,215,180 $17,881,523
Ongoing Costs
equipment maintenance costs 6% of equipment cost 7% of equipment cost $585,600 $882,350
software licenses/system support 15% systems/software 20% systems/software $51,000 $135,000
revenue handling costs (cash) 5% of cash revenue 10% of cash revenue $1,500,000 $3,000,000
revenue handling costs (farecards) 3% of farecard revenue 6% of farecard revenue $900,000 $1,800,000
contingency costs 10% of ongoing cost 15% of ongoing cost $303,660 $872,603
Total Ongoing Costs $3,340,260 $6,689,953
Total First Year Cost $16,555,440 $24,571,475
* This system has 800 buses (4 garages) and 20 LRT stations. Average weekday ridership = 200,000; annual ridership = 60 million. The transit agency is installing new validating fareboxes and is adding magnetic farecard accepting devices to the existing TVM's. ** It is assumed that one TVM per station can vend (and reload) farecards; the other TVM's in the stations continue to vend/validate paper tickets. However, farecards can be used to buy proof of payment paper tickets. + The estimated number of farecards assumes that 30% of rides are made using the cards (for monthly passes or stored value cards), that each card is used an average of twice a day, and that each card is retained an average of 3 months (i.e., a cardholder uses an average of 4 cards per year). A 50% card reserve is also assumed.
of the existing TVMs are being upgraded to allow validationof the cards (i.e., to deduct the value of a trip from the card’sstored value) and also to allow adding value to a card; nonew TVMs are required, however, as smart cards must beacquired elsewhere and registered with the agency. Fareinspectors in the smart card scenario will have to carryportable card readers to ensure that each card has either beenvalidated or contains an unlimited-ride pass. In the magneticscenario, inspectors will simply check each rider for a paperproof-of-payment ticket. As can be seen in comparing the
C-7
two alternatives, the greater number of cards needed for thissystem also greatly increases the fare media cost differentialbetween the two.
In conclusion, it is difficult to generalize about the costsassociated with procuring and implementing a new fare sys-tem. Hence, the estimates presented here should be consid-ered order-of-magnitude guidelines only; an agency will haveto solicit bids from vendors to determine the true cost ofimplementing a fare system with the types of capabilitiesdescribed here.

D-1
APPENDIX D
STUDY FRAMEWORK AND METHODOLOGY
INTRODUCTION
In considering the various types of fare policy, structure,and technology programs and initiatives identified in thestudy, it is useful to understand the nature of the impacts eachapproach can be expected to have on a transit agency’s cus-tomers and operations. In order to facilitate the analysis andevaluation of these programs and initiatives, the study teamdeveloped an evaluation framework and methodology. Thisframework and methodology, as well as a summary assess-ment of each of the programs and initiatives, is presented inthis appendix. The basic framework and methodology werealso used in the more detailed case study evaluation of spe-cific applications of the various fare-related strategies; thecase study reports are presented in Part II.
Types of Programs and Initiatives
The types of fare-related initiatives and programs to beevaluated were identified through the research conducted inthis study and represent the key fare policy, structure, andtechnology developments identified in the body of thisreport. The initiatives and programs were grouped into thefollowing categories:
1. Fare policy and strategy initiatives2. New payment options with electronic fare media3. New fare collection and payment strategies4. University programs5. Employer benefits programs6. Access-to-jobs programs7. Multiapplication programs
Within each category, three different types of programsimplemented or planned by one to four different transit agen-cies were studied, for a total of 21 types of programs. The fulllist of initiatives and programs, along with examples of each,is presented in Table D-1. The evaluation methodology andresults are discussed below.
EVALUATION FRAMEWORK ANDMETHODOLOGY
Evaluation Criteria and Measures
The initial step in developing an evaluation frameworkand methodology was to define the evaluation criteria, i.e.,the key parameters and attributes of the fare programs and
initiatives. The attributes included in this framework are asfollows:
• Goals and objectives of the program. The goals andobjectives of the specific type of program (e.g., increaseridership, increase revenue, promote seamless travel,increase market penetration of key groups, reduce oper-ational costs, address equity concerns, facilitate govern-mental mandate, or others).
• Customer impacts and benefits. The customer impactsand benefits the program is likely to have. This includes,for example, the extent of use of—and customer satis-faction with—the program in question, the effect (orlikely effect) on customer attitudes toward the agency,the impact on ease of travel and convenience of farepayment, and the impact on the cost of travel.
• Agency impacts and benefits. The types of operationaland administrative impacts associated with the program.Depending on the nature of the program being evalu-ated, these may include such items as the impact on per-sonnel requirements, maintenance requirements, ser-vice reliability, fare abuse and evasion, and flexibility offare policy/options. Also included here are the impacton costs and revenues: The agency’s costs for each ele-ment of implementing and administering the program—e.g., design and development of program, purchase andinstallation of necessary equipment, collection of faresand payments from customers, providing fare instru-ments to partner entities for distribution to customers,processing fares collected, collection of payments fromand reconciliation of revenues with partners and otherfunding entities, and the expected revenue impacts.
• Impact on, and benefits to, partner entities. In a farepayment-related partnership (e.g., with an employer,university, social service agency, or other entity), thelikely impacts on, or benefits to, the partner entity, suchas improved market penetration of payment option;improved ability to distribute and track benefits toemployees, students, or clients; or reduced parkingrequirements.
• Potential liability to the transit agency. The potentialnegative economic, legal, or political implications of theprogram. In other words, the types of risks the agencyfaces in implementing the program in terms of potentialrevenue loss, legal challenges, political opposition, lossof public support, or loss of ridership (e.g., from keymarket segments other than those targeted by the pro-gram in question).

D-2
• Constraints and barriers to implementation. Thetypes of constraints or implementation barriers theagency faces in developing and introducing the pro-gram. These may be related to technical issues (e.g.,requirements for a particular type of technology), insti-tutional factors (e.g., the need to establish workableagreements with would-be partners), or funding issues(e.g., the existence of earmarked funding associatedwith the program, and the issues associated with thefunding).
• Key external influences. Specific external factors (e.g.,political pressure, environmental justice claims) influ-encing the program.
• Technology and equipment requirements. The spe-cific technology and equipment requirements of the pro-gram, for instance, the introduction of AFC or smartcard equipment.
The study team identified a set of criteria associated withthe above categories. For example, “ease of travel” is a cri-terion under Customer Impacts and Benefits. These criteriaare presented in Table D-2. As indicated in the table, most ofthe criteria can be used to evaluate the type of program (e.g.,introduction of “rolling” passes, or an annual employer passprogram); however, a few criteria (e.g., “satisfactionwith/use of program”) can be applied only to a specificagency’s actual use of a program or initiative. The latter cri-teria were used for the case studies but were excluded fromthe general evaluation presented in this appendix.
While a number of these criteria, notably those related tocosts and revenues, may be quantifiable in specific cases, thisgeneral evaluation was restricted to a qualitative assessmentconsisting of a relative rating of the type/level of impact foreach criterion—indicating, for example, if the program hada positive or negative effect on a specific criterion. (The casestudies include quantitative impacts wherever available forappropriate criteria.) The rating measures that were appliedto the types of fare programs are shown in Table D-3.
Evaluation Matrices
Using the criteria and measures described above, the proj-ect team developed a set of matrices, each matrix addressingone of the specific initiatives or programs listed in Table D-1. For each matrix, the type of program was assessed interms of all of the aforementioned criteria.
Tables D-4.1 to D-4.7 summarize the evaluation for eachcriterion and each of the three types of programs within the
seven categories of programs or initiatives: fare policy andstrategy initiatives (Table D-4.1), new payment options withelectronic fare media (Table D-4.2), new fare collection andpayment strategies (Table D-4.3), access-to-jobs programs(Table D-4.4), multiapplication programs (Table D-4.5),university programs (Table D-4.6), and employer programs(Table D-4.7). Following each summary table are threetables, one for each of the three types of programs studiedwith regard to that particular category of program or initia-tive. These are numbered with additional digits based on thesummary table. For example, Table D-4.1, concerning farepolicy, is followed by Table D-4.1.1 on the elimination oftransfers, Table D-4.1.2 on fare simplification, and so forth.These detailed tables give not only the rating but also a briefrationale for the rating for each criterion in relation to thatprogram or initiative.
In conducting this evaluation, the study team utilized thefindings of this research, coupled with team members’ priorexperience in the design and assessment of fare programs fora range of types/sizes of agencies. A brief explanation is pro-vided for each rating measure. Clearly, a considerableamount of professional judgement had to be applied, for sev-eral reasons:
• In some cases, different agencies may have experiencedsomewhat different types of impacts with comparabletypes of programs. This assessment of the type of pro-gram has therefore focussed on the general nature of theimpacts an agency might reasonably expect in pursuingsuch a strategy. Specific agencies’ experiences wereevaluated through the case studies.
• Some of the initiatives (e.g., guaranteed last ride, auto-mated benefits distribution) have been tried by only oneor two agencies to-date, and are still in the early stagesof implementation.
• Some of the initiatives (e.g., frequency-based discount/guaranteed lowest fare, and certain types of multiappli-cation programs) are conceptual at this point, and havenot actually been tested in any operational settings.
Thus, the general nature of these assessments should bekept in mind. Specific agencies’ applications of most of theseinitiatives and programs were evaluated through the casestudies. However, as can be seen in the case studies—anddiscussed in the body of the report—individual agency expe-riences do vary somewhat for comparable types of programs.Thus, it is felt that these overall evaluation findings—in con-junction with the case study findings—provide useful gen-eral guidance for agencies considering the various strategies.

TABLE D-1 Types and examples of fare initiatives and programs
Type of Fare Initiative and Program United States Examples
Evaluation Matrix for Initiative and Program
Fare policy and strategy initiatives Table D-4.1
Elimination of transfers/onboard sale of day pass Baltimore, Orange Co. (CA), San
Jose, Delaware
Table D-4.1.1
Fare simplification (e.g., reduction/elimination of
zones)
Baltimore, Norfolk, Delaware,
Connecticut
Table D-4.1.2
Introduction of partial day pass (e.g., 4 hrs, or
after 9:30am)
Portland (OR), Washington (DC) Table D-4.1.3
New payment options with electronic fare media
Table D-4.2
Rolling (activate on first-use) passes NY, Chicago, Houston, Conn.,
Rochester (NY)
Table D-4.2.1
Frequency-based discount/guaranteed lowest
fare
Washington* Table D-4.2.2
Guaranteed last ride (i.e., negative balance) Chicago Table D-4.2.3
New fare collection and payment strategies
Table D-4.3
Regional payment integration SF,* LA,* Ventura Co. (CA), SD,*
Washington*
Table D-4.3.1
Postpayment/billing for number of rides taken Phoenix Table D-4.3.2
Conversion to POP from pay-on-entry or use of
conductors
Newark, Northern California
(Caltrain)*
Table D-4.3.3
University programs Table D-4.4
Pass/unlimited-access programs Chicago, Seattle, Boulder (CO),
Connecticut
Table D-4.4.1
Reduced-fare programs Lansing (MI), Akron (OH),
Chapel Hill (NC)
Table D-4.4.2
Joint transit-university card programs Santa Monica (CA), Ventura
Co.*
Table D-4.4.3
Employer benefits programs Table D-4.5
Annual pass programs Denver, Minn./St. Paul, Salt Table D-4.5.1
Lake City, Seattle
Voucher programs NY, Washington, SF, Boston Table D-4.5.2
Automated benefits distribution Washington, SF, NY Table D-4.5.3
Access-to-jobs programs Table D-4.6
Special payment arrangements New Jersey, Delaware, Akron
(OH), Albany (NY)
Table D-4.6.1
Use of electronic payment media Rochester (NY), Lubbock (TX) Table D-4.6.2
Link transit benefits with electronic benefits
transfer (EBT)
Albuquerque,* Cincinnati,* Table D-4.6.3
Multiapplication programs Table D-4.7
Electronic toll/parking Washington, Orlando* Table D-4.7.1
Financial services/other payment and loyalty
programs
Washington, Honolulu,* Atlanta** Table D-4.7.2
Identification/access/security Washington Table D-4.7.3
* initiative is planned or under consideration. ** no longer in place.

D-4
TABLE D-2 Evaluation criteria
Evaluation Criteria
Applies to type
of program
Applies only to specific case*
Definition
Goals and Objectives of Program ✓ Increase ridership, increase revenue, promote seamless travel, reduce costs, etc.
Customer Impacts and Benefits
Ease of travel ✓ Improves ease of use of transit system (e.g., facilitates “seamless” travel in region)?
Flexibility of fare payment ✓ Increases number of payment options?
Convenience of fare payment ✓ Increases ease of payment or purchase of fare media?
Cost of travel ✓ Reduces fare to participants?
Satisfaction with/use of program ✓ Are people using—and satisfied with—the program?
Overall attitude toward agency ✓ Improves the public’s opinion of the transit agency?
Agency Impacts and Benefits
Design/implementation costs ✓ Are there design and/or implementation costs related to program?
Equipment maintenance costs ✓ Impact on equipment maintenance costs?
Revenue collection/management costs ✓ Increases revenue management (e.g., media distribution and reconciliation) costs?
Capital costs ✓ Are there fare equipment procurement costs?
Use of cash ✓ Reduces use of cash for fare payment?
Ridership ✓ Increases ridership?
Revenue ✓ Increases fare revenue?
Success at achieving goals/objectives ✓ Have goals/objectives been achieved?
Fare abuse/evasion ✓ Impact on fare abuse or evasion (e.g., underpaying fare or using someone else’s ID to get lower fare)?
Fare structure flexibility ✓ Increases ability to add fare strategies?
Personnel requirements ✓ Impact on number of staff needed for revenue management?
Service reliability ✓ Improves ability to keep to schedules (e.g., faster boarding)
Impact on/Benefits to Partner Entity
Market penetration ✓ Increases number of people using partner’s card or services?
Ease of distribution of benefits ✓ Improves ability to distribute benefits to employee/student/client?
Other (e.g., need for parking) ✓ Reduces parking spaces needed (or other benefit)?
Liability to agency
Economic liability ✓ Does agency risk losing revenue though the program?
Political/legal liability ✓ Is there potential for legal/political challenges (e.g., regarding equity)?
Constraints and Barriers
Technical ✓ Are there technology issues (e.g., need for new technology or compatibility with existing equipment)?
Institutional ✓ Are there issues related to agreements with partner entities?
Funding Issues and Sources ✓ Is there a funding source for the program or initiative?
Required Equipment and Technology ✓ Type of equipment needed for program
Key External Influences ✓ External factors that have affected the program
*Items that apply only to specific cases were not included in the subsequent program evaluation matrices; they are addressed in the case study assessments.
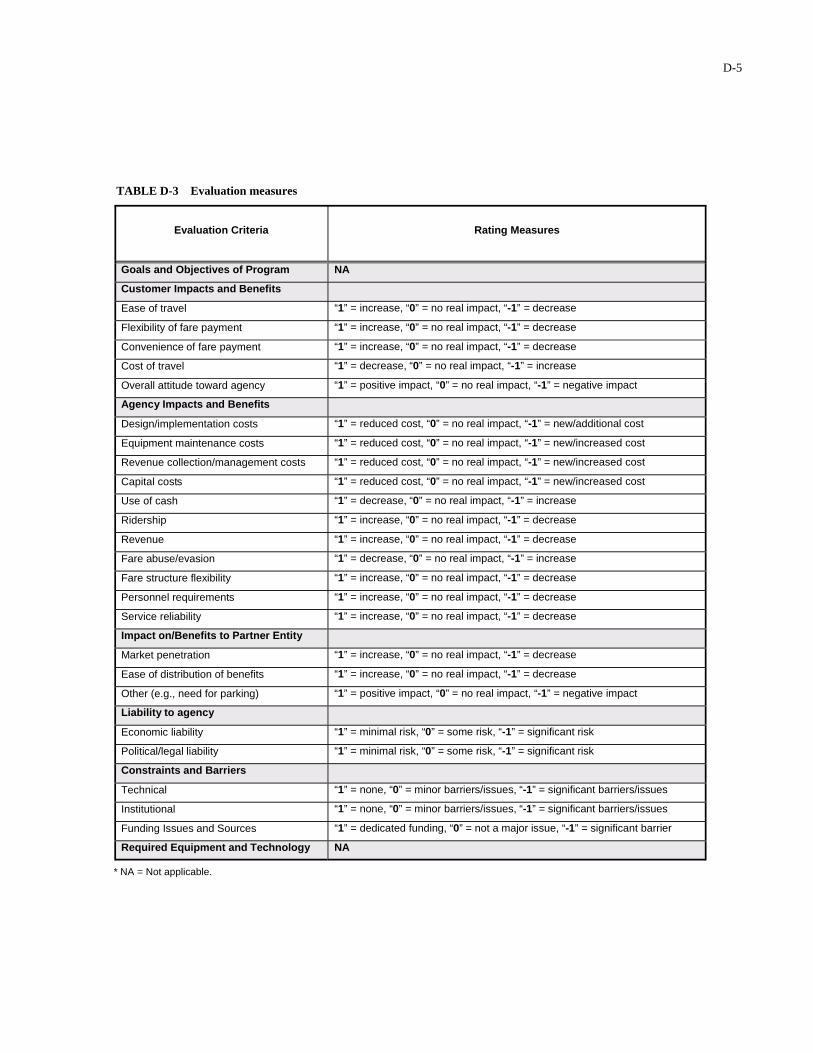
D-5
TABLE D-3 Evaluation measures
Evaluation Criteria
Rating Measures
Goals and Objectives of Program NA
Customer Impacts and Benefits
Ease of travel “1” = increase, “0” = no real impact, “-1” = decrease
Flexibility of fare payment “1” = increase, “0” = no real impact, “-1” = decrease
Convenience of fare payment “1” = increase, “0” = no real impact, “-1” = decrease
Cost of travel “1” = decrease, “0” = no real impact, “-1” = increase
Overall attitude toward agency “1” = positive impact, “0” = no real impact, “-1” = negative impact
Agency Impacts and Benefits
Design/implementation costs “1” = reduced cost, “0” = no real impact, “-1” = new/additional cost
Equipment maintenance costs “1” = reduced cost, “0” = no real impact, “-1” = new/increased cost
Revenue collection/management costs “1” = reduced cost, “0” = no real impact, “-1” = new/increased cost
Capital costs “1” = reduced cost, “0” = no real impact, “-1” = new/increased cost
Use of cash “1” = decrease, “0” = no real impact, “-1” = increase
Ridership “1” = increase, “0” = no real impact, “-1” = decrease
Revenue “1” = increase, “0” = no real impact, “-1” = decrease
Fare abuse/evasion “1” = decrease, “0” = no real impact, “-1” = increase
Fare structure flexibility “1” = increase, “0” = no real impact, “-1” = decrease
Personnel requirements “1” = increase, “0” = no real impact, “-1” = decrease
Service reliability “1” = increase, “0” = no real impact, “-1” = decrease
Impact on/Benefits to Partner Entity
Market penetration “1” = increase, “0” = no real impact, “-1” = decrease
Ease of distribution of benefits “1” = increase, “0” = no real impact, “-1” = decrease
Other (e.g., need for parking) “1” = positive impact, “0” = no real impact, “-1” = negative impact
Liability to agency
Economic liability “1” = minimal risk, “0” = some risk, “-1” = significant risk
Political/legal liability “1” = minimal risk, “0” = some risk, “-1” = significant risk
Constraints and Barriers
Technical “1” = none, “0” = minor barriers/issues, “-1” = significant barriers/issues
Institutional “1” = none, “0” = minor barriers/issues, “-1” = significant barriers/issues
Funding Issues and Sources “1” = dedicated funding, “0” = not a major issue, “-1” = significant barrier
Required Equipment and Technology NA
* NA = Not applicable.

D-6
TABLE D-4.1 Summary evaluation matrix: fare policy/strategy initiatives
Type of Program/Initiative
Elimination of Transfers/On-Board Sale of
Day Pass
Fare Simplification Introduction of Partial Day Pass
Examples
Baltimore – MTA Orange Co. (CA) – OCTA
San Jose – SCVTA Delaware – First State Transit
Baltimore – MTA Norfolk (VA) – HRT
Connecticut – CT TRANSIT Delaware – First State
Transit
Portland (OR) – Tri-Met Washington, DC – WMATA
Description of Approach
Free/low-cost transfers eliminated (i.e., full fare per
boarding); day passes sold on-board
Zones reduced or removed, or peak/off-peak differential
removed
Passes offered for periods of less than a full day
(e.g., 4-hrs or valid after certain time)
Goals/Objectives of Program To reduce conflicts between riders and drivers and reduce
abuse of transfers
To improve ease of use of transit system, especially by
new or occasional riders
To provide convenient fare option for tourists/out-
of-town visitors
Criterion Rating Rating Rating Customer Impacts/Benefits Ease of travel (e.g., seamless) 0 1 1 Flexibility of fare payment 0 -1 1 Convenience of fare payment 0 1 1 Cost of travel 0 0 1 Overall attitude toward agency 0 0 1 Agency Impacts/Benefits Design/implementation costs 0 -1 0 Equipment maintenance costs -1 0 -1 Revenue collection/management costs 0 1 0 Capital costs -1 0 -1 Use of cash 1 0 1 Ridership 0 1 1 Revenue 1 -1 1 Fare abuse/evasion 1 1 0 Fare structure flexibility 0 -1 1 Personnel requirements 0 0 0 Service reliability 0 1 1 Impact on/Benefits to Partner Entities Market penetration NA NA 1 Ease of distribution of benefits NA NA NA Other (e.g., need for parking) NA NA NA Liability to agency Economic liability 1 -1 1 Political/legal liability -1 -1 1 Constraints/Barriers Technical -1 0 -1 Institutional 0 0 0 Funding Issues and Sources 0 0 0 Required Equipment/Technology Day pass machine None Day pass machine

D-7
TABLE D-4.1.1 Evaluation matrix: fare policy/strategy initiativesElimination of transfers/onboard sale of day pass
Type of Program/Initiative Elimination of transfers/onboard sale of day pass
Examples Baltimore – MTA
Orange Co. (CA) – OCTA
San Jose – SCVTA
Delaware – First State Transit
Description of Approach Free/low-cost transfers eliminated in favor of a full fare per boarding;
however, day passes are sold on-board buses and at other locations
Goals/Objectives of Program To reduce conflicts between riders and drivers and reduce abuse of transfers
Criterion Rating and Explanation
Customer Impacts/Benefits
Ease of travel 0 less seamless without transfers, but day pass improves situation
Flexibility of fare payment 0 less flexible without transfers, but day pass improves situation
Convenience of fare payment 0 less convenient without transfers, but day pass improves situation
Cost of travel 0 depends on rider’s trip pattern
Overall attitude toward agency 0 depends on rider’s trip pattern (i.e., whether cost rises)
Agency Impacts/Benefits
Design/implementation costs 0 should not significantly affect these costs
Equipment maintenance costs -1 maintenance for day pass issuing unit
Revenue collection/management costs 0 should not significantly affect these costs
Capital costs -1 requires day pass issuing unit
Use of cash 1 day pass should reduce cash
Ridership 0 elimination of transfers will reduce, but day pass should increase
Revenue 1 should increase revenue
Fare abuse/evasion 1 should reduce abuse
Fare structure flexibility 0 less flexible without transfers, but day pass improves situation
Personnel requirements 0 should not affect this
Service reliability 0 should not affect this
Impact on/Benefits to Partner Entity
Market penetration NA (no partnership involved)
Ease of distribution of benefits NA (no partnership involved)
Other (e.g., need for parking) NA (no partnership involved)
Liability to agency
Economic liability 1 should generate additional revenue
Political/legal liability -1 could generate considerable opposition from those who transfer
Constraints/Barriers
Technical -1 requires day pass issuing unit
Institutional 0 not a major issue
Funding Issues and Sources 0 not a major issue
Required Equipment and Technology
In-bus (and possibly in-station) day pass issuing machine

D-8
TABLE D-4.1.2 Evaluation matrix: fare policy/strategy initiativesFare simplification
Type of Program/Initiative Fare Simplification
Examples Baltimore – MTA eliminated zones on its bus system
Norfolk (VA) – HRT eliminated zones on its bus system
Connecticut – CT TRANSIT eliminated zones on its bus systems
Delaware – First State Transit reduced zones on statewide system
Description of Approach The number of fare zones is reduced or zones are removed altogether,
or a peak/off-peak differential removed
Goals/Objectives of Program To improve ease of use of transit system, especially by new or
occasional riders
Criterion Rating and Explanation
Customer Impacts/Benefits
Ease of travel 1 easier to use system, especially for new/occasional riders
Flexibility of fare payment -1 somewhat reduces flexibility
Convenience of fare payment 1 easier to understand fares and buy fare media
Cost of travel 0 depends on rider’s trip pattern
Overall attitude toward agency 0 depends on rider’s new fare
Agency Impacts/Benefits
Design/implementation costs -1 requires modification of fare structure
Equipment maintenance costs 0 should not affect these costs
Revenue collection/management costs 1 could somewhat reduce these costs
Capital costs 0 should not affect these costs
Use of cash 0 should not affect this
Ridership 1 depends on revised pricing, but could increase ridership
Revenue -1 depends on revised pricing, but could lose revenue
Fare abuse/evasion 1 should reduce abuse/evasion
Fare structure flexibility -1 somewhat reduces flexibility
Personnel requirements 0 should not affect this
Service reliability 1 should reduce dwell time
Impact on/Benefits to Partner Entity
Market penetration NA (no partnership involved)
Ease of distribution of benefits NA (no partnership involved)
Other (e.g., need for parking) NA (no partnership involved)
Liability to agency
Economic liability -1 could lose revenue
Political/legal liability -1 could generate opposition from those whose fares increase
Constraints/Barriers
Technical 0 not a major issue
Institutional 0 not a major issue
Funding Issues and Sources 0 not a major issue
Required Equipment and Technology
None

D-9
TABLE D-4.1.3 Evaluation matrix: fare policy/strategy initiatives Introduction of partial day passes
Type of Program/Initiative Introduction of Partial Day Passes Examples Portland (OR) – Tri-Met “Quik Tik” good for 6-hours ($3); full day pass is $4
Washington, DC – WMATA’s day pass is valid beginning at 9:30AM
Description of Approach Passes offered for periods of less than a full day (e.g., 4-hrs or valid after certain time)
Goals/Objectives of Program To provide convenient fare option for tourists/out-of-town visitors
Criterion Rating and Explanation
Customer Impacts/Benefits
Ease of travel 1 easier to use system, especially for new/occasional riders
Flexibility of fare payment 1 new fare option
Convenience of fare payment 1 more convenient, especially for new/occasional riders
Cost of travel 1 reduces cost if several trips made during valid period
Overall attitude toward agency 1 should improve general opinion of agency
Agency Impacts/Benefits
Design/implementation costs 0 should not significantly affect these costs
Equipment maintenance costs -1 maintenance for day pass issuing unit
Revenue collection/management costs 0 should not significantly affect these costs
Capital costs -1 may require day pass issuing unit
Use of cash 1 will reduce cash somewhat
Ridership 1 should increase ridership somewhat
Revenue 1 could increase revenue somewhat – if attracts new riders
Fare abuse/evasion 0 should not affect this
Fare structure flexibility 1 new fare option
Personnel requirements 0 should not affect this
Service reliability 1 should reduce dwell time
Impact on/Benefits to Partner Entity
Market penetration 1 should be popular with tourists/out of town visitors
Ease of distribution of benefits NA (no partnership involved)
Other (e.g., need for parking) NA (no partnership involved)
Liability to agency
Economic liability 1 could generate additional revenue
Political/legal liability 1 opposition unlikely
Constraints/Barriers
Technical -1 may require day pass issuing unit
Institutional 0 not a major issue
Funding Issues and Sources 0 not a major issue
Required Equipment and Technology
May require in-bus (and possibly in-station) day pass issuing machine

D-10
TABLE D-4.2 Summary evaluation matrix: electronic payment options
Type of Program/Initiative Rolling (Activate on First Use) Passes
Frequency-Based Discount/Guaranteed
Lowest Fare
Guaranteed Last Ride (i.e., Negative Balance)
Examples
New York City – NYMTA Chicago – CTA
Houston – Metro Connecticut – CT TRANSIT
Washington, DC – WMATA is considering a guaranteed
lowest fare strategy
Chicago – CTA testing with smart card pilot
Description of Approach
Passes good for specified number of days (e.g., 1-, 7-, 14-, or 30-Days); pass is activated on its first use
Reduced fare for each ride above certain minimum number; variation is to guarantee lowest fare
Ride is guaranteed, regardless of amount
remaining on card; “neg. balance” deducted next time
rider adds value to card Goals/Objectives of Program Encourage use of passes and
reduce admin. requirements assoc. with selling passes
Provide incentive to buy and use farecard – and to retain
same card for long time
To provide an incentive to purchase and use a farecard
Criterion Rating Rating Rating Customer Impacts/Benefits Ease of travel (e.g., seamless) 1 1 1 Flexibility of fare payment 1 1 1 Convenience of fare payment 1 1 1 Cost of travel 0 1 0 Overall attitude toward agency 1 1 1 Agency Impacts/Benefits Design/implementation costs 0 -1 -1 Equipment maintenance costs 0 0 1 Revenue collection/management costs 1 0 0 Capital costs -1 -1 -1 Use of cash 1 1 1 Ridership 1 1 1 Revenue -1 -1 0 Fare abuse/evasion 1 1 0 Fare structure flexibility 1 1 0 Personnel requirements 1 0 0 Service reliability 1 1 1 Impact on/Benefits to Partner Entities
Market penetration NA NA NA Ease of distribution of benefits NA NA NA Other (e.g., need for parking) NA NA NA Liability to agency Economic liability 0 -1 0 Political/legal liability 1 1 1 Constraints/Barriers Technical -1 -1 -1 Institutional 0 0 0 Funding Issues and Sources -1 -1 -1 Required Equipment/Technology Electronic payment system
(magnetic or smart card) Electronic payment system; smart card for guaranteed
lowest fare
Smart card system

D-11
TABLE D-4.2.1 Evaluation matrix: electronic payment options Rolling (activate on first use) passes
Type of Program/Initiative Rolling (Activate on First Use) Passes
Examples New York City – NYMTA
Chicago – CTA
Houston – Metro
Connecticut – CT TRANSIT
Description of Approach Passes good for specified number of days (e.g., 1-, 7-, 14-, or 30-Days); pass is
activated the first time it is swiped through or inserted into reader.
Goals/Objectives of Program To encourage use of passes and to reduce the administrative requirements associated
with selling passes (i.e., since pass sales are spread out throughout the month)
Criterion Rating and Explanation
Customer Impacts/Benefits
Ease of travel 1 makes system easier to use
Flexibility of fare payment 1 more flexible than fixed calendar period passes
Convenience of fare payment 1 more convenient, since can buy pass at any time; can buy 7-day passes in advance
Cost of travel 0 same cost as flash passes
Overall attitude toward agency 1 should improve general opinion of agency
Agency Impacts/Benefits
Design/implementation costs 0 should not significantly affect these costs
Equipment maintenance costs 0 maintenance for new fare equipment – will decrease if contactless smart card
Revenue collection/management costs 1 should reduce these costs
Capital costs -1 requires electronic fare system
Use of cash 1 should reduce cash
Ridership 1 should increase ridership somewhat
Revenue -1 could reduce revenue – if riders not now using passes switch to passes
Fare abuse/evasion 1 should reduce abuse/evasion
Fare structure flexibility 1 offers considerable flexibility
Personnel requirements 1 could reduce need for pass sales/administration staff
Service reliability 1 should reduce dwell time
Impact on/Benefits to Partner Entity
Market penetration NA (no partnership involved)
Ease of distribution of benefits NA (no partnership involved)
Other (e.g., need for parking) NA (no partnership involved)
Liability to agency
Economic liability 0 could result in some loss of revenue – if it attracts significant no. of new pass users
Political/legal liability 1 opposition unlikely
Constraints/Barriers
Technical -1 requires some type of electronic payment system
Institutional 0 not a major issue
Funding Issues and Sources -1 requires funding to procure new system
Required Equipment and Technology
Requires an electronic payment system (magnetic or smart card)

D-12
TABLE D-4.2.2 Evaluation matrix: electronic payment options Frequency-based discount/guaranteed lowest fare
Type of Program/Initiative Frequency-Based Discount/Guaranteed Lowest Fare Examples Washington, DC – WMATA is considering a guaranteed lowest fare strategy
Description of Approach A reduced fare is charged for each ride above a certain minimum number of rides
taken with a particular farecard; a variation is to guarantee riders the lowest fare for
which they are eligible (based on the extent of usage of their farecards)
Goals/Objectives of Program To provide an incentive to purchase and use a farecard – and also to retain the same
card for a long period of time
Criterion Rating and Explanation
Customer Impacts/Benefits
Ease of travel 1 makes system easier to use
Flexibility of fare payment 1 increases flexibility
Convenience of fare payment 1 convenient, since rider does not have to worry about best option
Cost of travel 1 will reduce cost if used enough
Overall attitude toward agency 1 should improve general opinion of agency; excellent marketing angle
Agency Impacts/Benefits
Design/implementation costs -1 has significant system design costs, especially guaranteed lowest fare
Equipment maintenance costs 0 maintenance for new fare equipment – will decrease if contactless smart card
Revenue collection/management costs 0 should not affect these costs
Capital costs -1 requires electronic fare system
Use of cash 1 should reduce cash
Ridership 1 should increase ridership somewhat
Revenue -1 will reduce revenue; guaranteed lowest fare could lose significant revenue
Fare abuse/evasion 1 should reduce abuse/evasion
Fare structure flexibility 1 offers considerable flexibility
Personnel requirements 0 should not affect this
Service reliability 1 should reduce dwell time, especially if contactless card used
Impact on/Benefits to Partner Entity
Market penetration NA (no partnership involved)
Ease of distribution of benefits NA (no partnership involved)
Other (e.g., need for parking) NA (no partnership involved)
Liability to agency
Economic liability -1 guaranteed lowest fare has potential for significant revenue loss
Political/legal liability 1 opposition unlikely
Constraints/Barriers
Technical -1 requires some type of electronic payment system
Institutional 0 not a major issue
Funding Issues and Sources -1 requires funding to procure new system
Required Equipment and Technology
Requires an electronic payment system; smart card needed for guaranteed lowest fare

D-13
TABLE D-4.2.3 Evaluation matrix: electronic payment options Guaranteed last ride
Type of Program/Initiative Guaranteed Last Ride (i.e., Negative Balance) Examples Chicago – CTA is testing with its smart card pilot
Description of Approach A ride is guaranteed, regardless of amount remaining on farecard; the “negative
balance” is then deducted the next time the rider adds value to card
Goals/Objectives of Program To provide an incentive to purchase and use a farecard
Criterion Rating and Explanation
Customer Impacts/Benefits
Ease of travel 1 makes system easier to use
Flexibility of fare payment 1 increases flexibility
Convenience of fare payment 1 convenient, since rider does not have to worry about running out of value
Cost of travel 0 depends on pricing
Overall attitude toward agency 1 should improve general opinion of agency; excellent marketing angle
Agency Impacts/Benefits
Design/implementation costs -1 could have significant system design costs
Equipment maintenance costs 1 maintenance will decrease if contactless smart card used
Revenue collection/management costs 0 should not affect these costs
Capital costs -1 requires smart card system
Use of cash 1 should reduce cash
Ridership 1 should increase ridership somewhat
Revenue 0 will not affect revenue if strong incentive to reload same card
Fare abuse/evasion 0 requires strong incentive to reload same card
Fare structure flexibility 0 does not really affect this
Personnel requirements 0 should not affect this
Service reliability 1 should reduce dwell time, especially if contactless card used
Impact on/Benefits to Partner Entity
Market penetration NA (no partnership involved)
Ease of distribution of benefits NA (no partnership involved)
Other (e.g., need for parking) NA (no partnership involved)
Liability to agency
Economic liability 0 has potential for significant revenue loss if no strong incentive to reload cards
Political/legal liability 1 opposition unlikely
Constraints/Barriers
Technical -1 requires smart card system
Institutional 0 not a major issue
Funding Issues and Sources -1 requires funding to procure new system
Required Equipment and Technology
Requires smart card system

D-14
TABLE D-4.3 Summary evaluation matrix: fare collection/payment strategies
Type of Program/Initiative Regional Payment Integration
Post Payment/Billing for Number of Rides Taken
Conversion to POP from Another Strategy
Examples
Ventura Co. (CA) – VCTC San Francisco – TransLink
Washington/Baltimore – SmarTrip to be expanded Los Angeles – LACMTA
Phoenix – Valley Metro BusCard Plus program; also
accept credit cards
Newark, NJ – NJT converted Newark City Subway to POP
Northern California – Caltrain planning to convert
to POP Description of Approach
Common farecard provided for use on all of region’s services
Rider (or employer or funding agency) billed for no. rides
taken; system tracks usage of each farecard
Some agencies converting from pay-on-entry or use
of conductors to POP
Goals/Objectives of Program
To facilitate seamless travel throughout region
Provide convenience of passes, but without allowing
unlimited rides; also to document actual transit usage
To reduce fare collection costs and/or to reduce dwell
times – and thus improve service reliability
Criterion Rating Rating Rating Customer Impacts/Benefits Ease of travel (e.g., seamless) 1 0 0 Flexibility of fare payment 1 1 -1 Convenience of fare payment 1 1 -1 Cost of travel 0 0 0 Overall attitude toward agency 1 1 0 Agency Impacts/Benefits Design/implementation costs -1 -1 -1 Equipment maintenance costs 1 0 -1 Revenue collection/management costs -1 -1 0 Capital costs -1 -1 -1 Use of cash 1 1 0 Ridership 1 0 0 Revenue 0 -1 -1 Fare abuse/evasion 1 0 -1 Fare structure flexibility 1 1 -1 Personnel requirements -1 0 0 Service reliability 1 1 1 Impact on/Benefits to Partner Entities
Market penetration 1 1 NA Ease of distribution of benefits NA 1 NA Other (e.g., need for parking) NA 1 NA Liability to agency Economic liability -1 -1 -1 Political/legal liability 1 1 1 Constraints/Barriers Technical -1 0 -1 Institutional -1 -1 NA Funding Issues and Sources -1 0 0 Required Equipment/Technology Smart card system & regional
clearinghouse Requires that equipment
include transactional database TVM’s, validators, possibly
hand-held readers and ticket office machines

D-15
TABLE D-4.3.1 Evaluation matrix: fare collection/payment strategiesRegional payment integration
Type of Program/Initiative Regional Payment Integration
Examples Ventura Co. (CA) – VCTC implementing regional smart card
San Francisco – TransLink smart card pilot underway; full system will cover 26 agencies
Washington/Baltimore – SmarTrip to be expanded to buses in region and to Baltimore
Los Angeles – LACMTA developing UFS (regional smart card program)
Description of Approach Common farecard provided for use on all of region’s services
Goals/Objectives of Program To facilitate seamless travel throughout region
Criterion Rating and Explanation
Customer Impacts/Benefits
Ease of travel 1 facilitates seamless travel
Flexibility of fare payment 1 electronic payment creates greater flexibility
Convenience of fare payment 1 contactless smart card convenient
Cost of travel 0 does not affect this – depends on transfer cost and/or discount/bonus offered
Overall attitude toward agency 1 should improve general opinion of agencies involved
Agency Impacts/Benefits
Design/implementation costs -1 will likely have significant system design costs
Equipment maintenance costs 1 maintenance will decrease if contactless smart card
Revenue collection/management costs -1 requires clearinghouse to allocate revenues and support system
Capital costs -1 requires smart card system
Use of cash 1 should reduce cash
Ridership 1 should increase ridership somewhat
Revenue 0 will not directly affect revenue; revenue will increase if new riders attracted
Fare abuse/evasion 1 electronic payment will reduce abuse/evasion
Fare structure flexibility 1 electronic payment creates greater flexibility
Personnel requirements -1 will require staff participation in developing regional system
Service reliability 1 should reduce dwell time, especially if contactless card used
Impact on/Benefits to Partner Entity
Market penetration 1 should increase usage of farecards
Ease of distribution of benefits NA
Other (e.g., need for parking) NA
Liability to agency
Economic liability -1 could be significant costs to agencies, depending on usage and clearinghouse fee structure
Political/legal liability 1 opposition unlikely
Constraints/Barriers
Technical -1 requires common smart card technology for all participants
Institutional -1 significant requirements: financing/procurement agreements, governance framework
Funding Issues and Sources -1 requires substantial funding (for each agency) to implement new system & clearinghouse
Required Equipment and Technology
Requires that all participants have common smart card system, and requires regional
clearinghouse system

D-16
TABLE D-4.3.2 Evaluation matrix: fare collection/payment strategiesPost payment
Type of Program/Initiative Post Payment/Billing for Number of Rides Taken Examples Phoenix – Valley Metro BusCard Plus program: employers invoiced for employees’ rides; system
also accepts credit cards for fare payment
Description of Approach Rider (or employer or funding agency) is billed for number of rides a cardholder actually takes;
system tracks usage of each farecard
Goals/Objectives of Program To provide convenience of monthly passes, but without allowing unlimited rides; also possibly to
track/document actual transit usage
Criterion Rating and Explanation
Customer Impacts/Benefits
Ease of travel 0 depends on nature of regional payment integration, if any
Flexibility of fare payment 1 new payment option
Convenience of fare payment 1 does not require prepayment
Cost of travel 0 does not affect this – depends on pricing
Overall attitude toward agency 1 should improve general opinion of agency
Agency Impacts/Benefits
Design/implementation costs -1 will have some design/implementation costs
Equipment maintenance costs 0 maintenance could increase if magnetic, decrease if contactless smart card
Revenue collection/management costs -1 will increase costs somewhat
Capital costs -1 requires fare equipment with transactional database
Use of cash 1 should reduce cash usage
Ridership 0 may increase ridership somewhat if attracts new riders
Revenue -1 will not directly affect fare revenue, but agency loses float from prepayment
Fare abuse/evasion 0 electronic farecard should reduce abuse; accepting credit cards could allow abuse
Fare structure flexibility 1 new payment option
Personnel requirements 0 will require some staff time, but probably not additional people
Service reliability 1 should reduce dwell time, since driver does not have to check validity of pass/farecard
Impact on/Benefits to Partner Entity
Market penetration 1 could be popular option
Ease of distribution of benefits 1 could be used in distribution of employment or social service benefits
Other (e.g., need for parking) 1 allows employers/social service agencies to track actual transit usage of employees/clients
Liability to agency
Economic liability -1 results in loss of float; accepting credit cards (without verification) allows possible fraud
Political/legal liability 1 opposition unlikely
Constraints/Barriers
Technical 0 requires that equipment include transactional database (most new equipment does)
Institutional -1 requires agreements with employers, social service agencies, possibly with banks
Funding Issues and Sources 0 should not be a significant issue
Required Equipment and Technology
Requires that equipment include transactional database
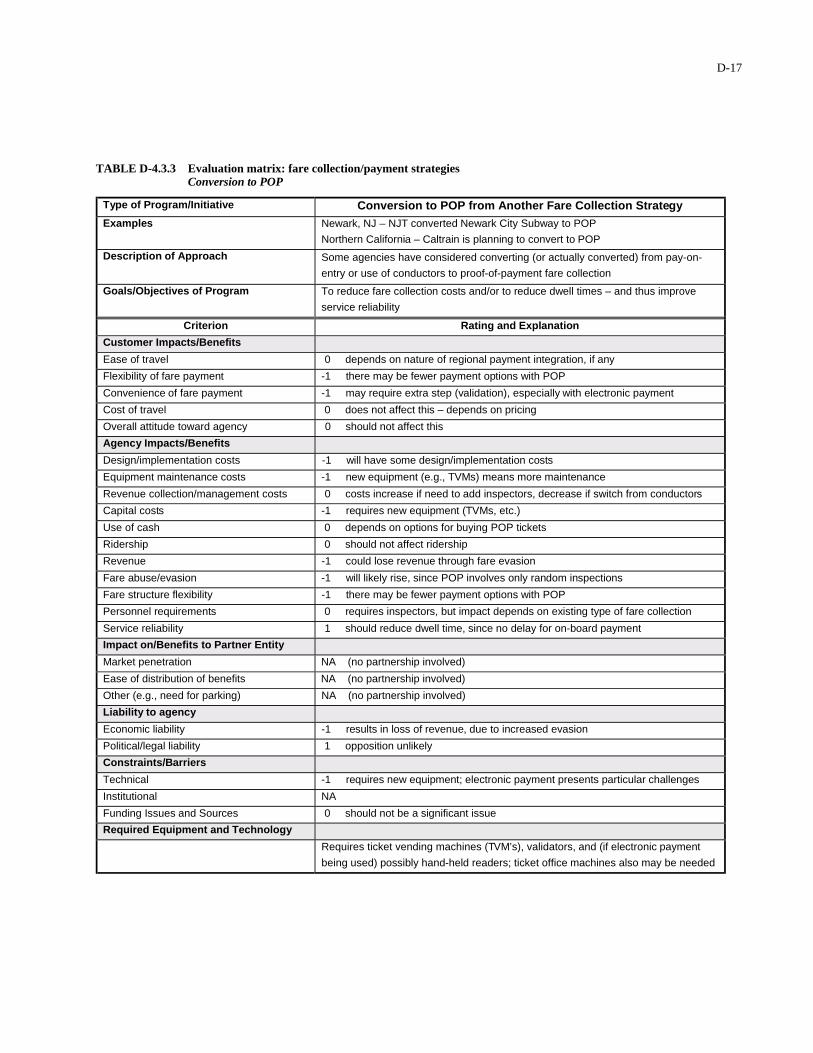
D-17
TABLE D-4.3.3 Evaluation matrix: fare collection/payment strategiesConversion to POP
Type of Program/Initiative Conversion to POP from Another Fare Collection Strategy Examples Newark, NJ – NJT converted Newark City Subway to POP
Northern California – Caltrain is planning to convert to POP
Description of Approach Some agencies have considered converting (or actually converted) from pay-on-
entry or use of conductors to proof-of-payment fare collection
Goals/Objectives of Program To reduce fare collection costs and/or to reduce dwell times – and thus improve
service reliability
Criterion Rating and Explanation
Customer Impacts/Benefits
Ease of travel 0 depends on nature of regional payment integration, if any
Flexibility of fare payment -1 there may be fewer payment options with POP
Convenience of fare payment -1 may require extra step (validation), especially with electronic payment
Cost of travel 0 does not affect this – depends on pricing
Overall attitude toward agency 0 should not affect this
Agency Impacts/Benefits
Design/implementation costs -1 will have some design/implementation costs
Equipment maintenance costs -1 new equipment (e.g., TVMs) means more maintenance
Revenue collection/management costs 0 costs increase if need to add inspectors, decrease if switch from conductors
Capital costs -1 requires new equipment (TVMs, etc.)
Use of cash 0 depends on options for buying POP tickets
Ridership 0 should not affect ridership
Revenue -1 could lose revenue through fare evasion
Fare abuse/evasion -1 will likely rise, since POP involves only random inspections
Fare structure flexibility -1 there may be fewer payment options with POP
Personnel requirements 0 requires inspectors, but impact depends on existing type of fare collection
Service reliability 1 should reduce dwell time, since no delay for on-board payment
Impact on/Benefits to Partner Entity
Market penetration NA (no partnership involved)
Ease of distribution of benefits NA (no partnership involved)
Other (e.g., need for parking) NA (no partnership involved)
Liability to agency
Economic liability -1 results in loss of revenue, due to increased evasion
Political/legal liability 1 opposition unlikely
Constraints/Barriers
Technical -1 requires new equipment; electronic payment presents particular challenges
Institutional NA
Funding Issues and Sources 0 should not be a significant issue
Required Equipment and Technology
Requires ticket vending machines (TVM’s), validators, and (if electronic payment
being used) possibly hand-held readers; ticket office machines also may be needed
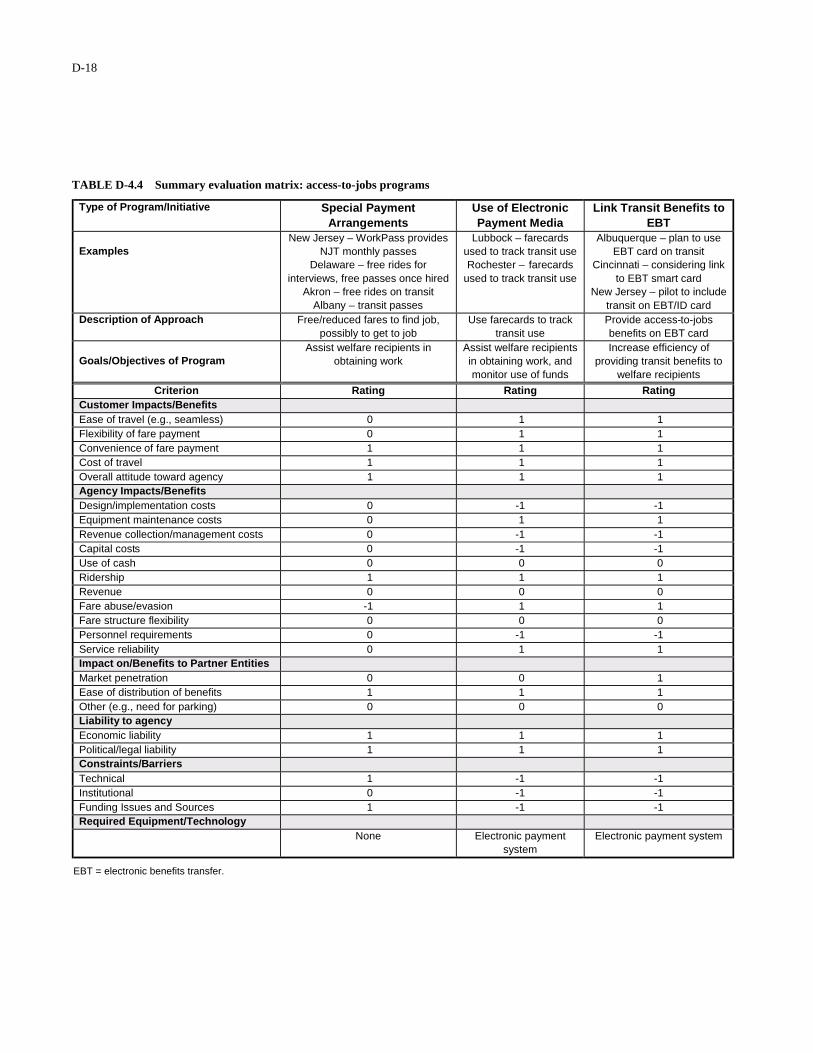
D-18
TABLE D-4.4 Summary evaluation matrix: access-to-jobs programs
Type of Program/Initiative Special Payment Arrangements
Use of Electronic Payment Media
Link Transit Benefits to EBT
Examples
New Jersey – WorkPass provides NJT monthly passes
Delaware – free rides for interviews, free passes once hired
Akron – free rides on transit Albany – transit passes
Lubbock – farecards used to track transit use Rochester – farecards
used to track transit use
Albuquerque – plan to use EBT card on transit
Cincinnati – considering link to EBT smart card
New Jersey – pilot to include transit on EBT/ID card
Description of Approach Free/reduced fares to find job, possibly to get to job
Use farecards to track transit use
Provide access-to-jobs benefits on EBT card
Goals/Objectives of Program
Assist welfare recipients in obtaining work
Assist welfare recipients in obtaining work, and monitor use of funds
Increase efficiency of providing transit benefits to
welfare recipients
Criterion Rating Rating Rating Customer Impacts/Benefits Ease of travel (e.g., seamless) 0 1 1 Flexibility of fare payment 0 1 1 Convenience of fare payment 1 1 1 Cost of travel 1 1 1 Overall attitude toward agency 1 1 1 Agency Impacts/Benefits Design/implementation costs 0 -1 -1 Equipment maintenance costs 0 1 1 Revenue collection/management costs 0 -1 -1 Capital costs 0 -1 -1 Use of cash 0 0 0 Ridership 1 1 1 Revenue 0 0 0 Fare abuse/evasion -1 1 1 Fare structure flexibility 0 0 0 Personnel requirements 0 -1 -1 Service reliability 0 1 1 Impact on/Benefits to Partner Entities Market penetration 0 0 1 Ease of distribution of benefits 1 1 1 Other (e.g., need for parking) 0 0 0 Liability to agency Economic liability 1 1 1 Political/legal liability 1 1 1 Constraints/Barriers Technical 1 -1 -1 Institutional 0 -1 -1 Funding Issues and Sources 1 -1 -1 Required Equipment/Technology None Electronic payment
system Electronic payment system
EBT = electronic benefits transfer.

D-19
TABLE D-4.4.1 Evaluation matrix: access-to-jobs programsSpecial payment arrangements
Type of Program/Initiative Special Payment Arrangements
Examples
New Jersey – WorkPass provides NJT monthly passes
Delaware – free rides for interviews, free passes (up to 3 weeks) once hired
Akron, OH – TANF clients ride fixed-route transit for free
Albany, NY – CDTA provides transit passes
Description of Approach Free or reduced fares for welfare recipients to find job, possibly to get to job
Goals/Objectives of Program Assist welfare recipients in obtaining work
Criterion Rating and Explanation
Customer Impacts/Benefits
Ease of travel 0 depends on nature of regional payment integration, if any
Flexibility of fare payment 0 does not affect flexibility
Convenience of fare payment 1 convenient, since person receives pass (or can otherwise ride for free)
Cost of travel 1 can make transit free or very inexpensive
Overall attitude toward agency 1 should improve general opinion of agency
Agency Impacts/Benefits
Design/implementation costs 0 should not significantly affect these costs
Equipment maintenance costs 0 should not affect these costs
Revenue collection/management costs 0 should not significantly affect these costs
Capital costs 0 should not require new fare collection equipment
Use of cash 0 should not significantly affect the use of cash
Ridership 1 should increase somewhat
Revenue 0 should not result in loss of revenue, since programs are subsidized
Fare abuse/evasion -1 opportunity for abuse (e.g., sharing pass with non-client)
Fare structure flexibility 0 does not really affect this
Personnel requirements 0 should not really affect this
Service reliability 0 should not really affect this
Impact on/Benefits to Partner Entity
Market penetration 0 not really an issue
Ease of distribution of benefits 1 easy way for social service agencies to distribute benefits to clients
Other (e.g., need for parking) 0 not really an issue
Liability to agency
Economic liability 1 no particular liability
Political/legal liability 1 no particular liability
Constraints/Barriers
Technical 1 should not have any technical barriers
Institutional 0 should not be a significant issue
Funding Issues and Sources 1 social service funding exists
Required Equipment and Technology
No particular equipment or technology required
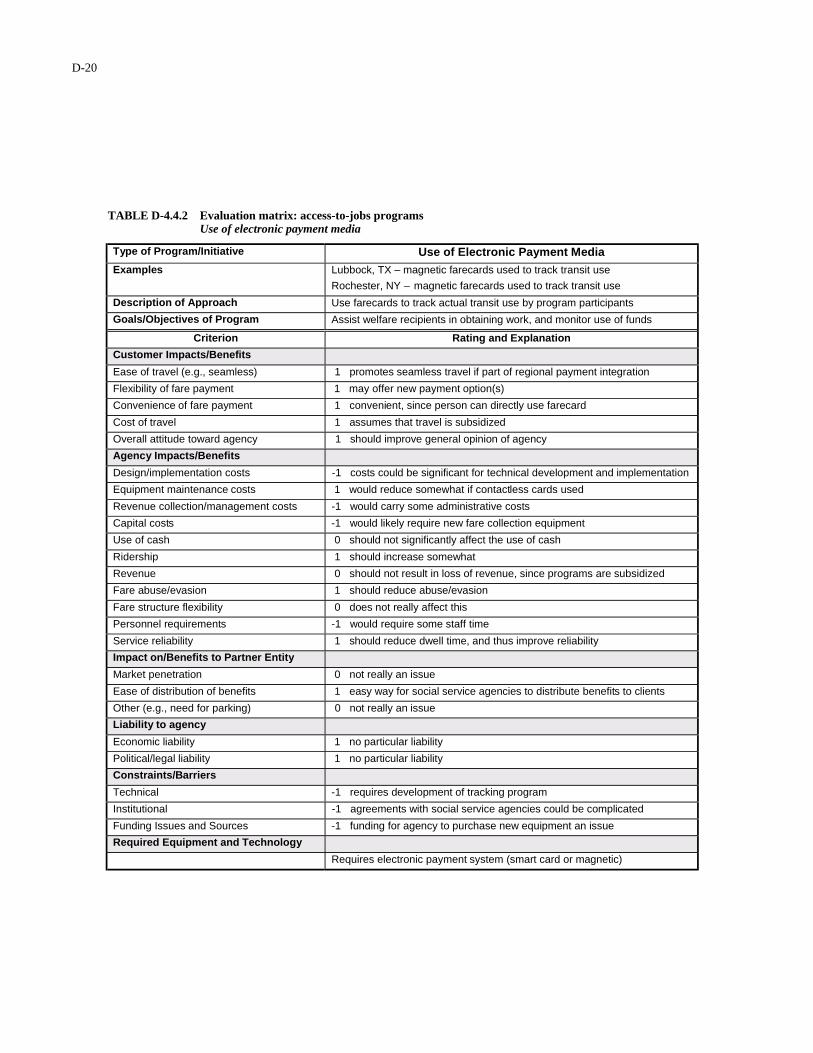
D-20
TABLE D-4.4.2 Evaluation matrix: access-to-jobs programsUse of electronic payment media
Type of Program/Initiative Use of Electronic Payment Media Examples Lubbock, TX – magnetic farecards used to track transit use
Rochester, NY – magnetic farecards used to track transit use
Description of Approach Use farecards to track actual transit use by program participants
Goals/Objectives of Program Assist welfare recipients in obtaining work, and monitor use of funds
Criterion Rating and Explanation
Customer Impacts/Benefits
Ease of travel (e.g., seamless) 1 promotes seamless travel if part of regional payment integration
Flexibility of fare payment 1 may offer new payment option(s)
Convenience of fare payment 1 convenient, since person can directly use farecard
Cost of travel 1 assumes that travel is subsidized
Overall attitude toward agency 1 should improve general opinion of agency
Agency Impacts/Benefits
Design/implementation costs -1 costs could be significant for technical development and implementation
Equipment maintenance costs 1 would reduce somewhat if contactless cards used
Revenue collection/management costs -1 would carry some administrative costs
Capital costs -1 would likely require new fare collection equipment
Use of cash 0 should not significantly affect the use of cash
Ridership 1 should increase somewhat
Revenue 0 should not result in loss of revenue, since programs are subsidized
Fare abuse/evasion 1 should reduce abuse/evasion
Fare structure flexibility 0 does not really affect this
Personnel requirements -1 would require some staff time
Service reliability 1 should reduce dwell time, and thus improve reliability
Impact on/Benefits to Partner Entity
Market penetration 0 not really an issue
Ease of distribution of benefits 1 easy way for social service agencies to distribute benefits to clients
Other (e.g., need for parking) 0 not really an issue
Liability to agency
Economic liability 1 no particular liability
Political/legal liability 1 no particular liability
Constraints/Barriers
Technical -1 requires development of tracking program
Institutional -1 agreements with social service agencies could be complicated
Funding Issues and Sources -1 funding for agency to purchase new equipment an issue
Required Equipment and Technology
Requires electronic payment system (smart card or magnetic)

D-21
TABLE D-4.4.3 Evaluation matrix: access-to-jobs programsLink transit benefits to EBT
Type of Program/Initiative Link Transit Benefits to EBT
Examples Albuquerque, NM – developing system to use EBT card on transit
Cincinnati – considering linking to Ohio EBT smart card
New Jersey – has proposed pilot to include transit on state EBT/ID card
Description of Approach Provide access-to-jobs benefits on electronic benefits transfer card
Goals/Objectives of Program Increase efficiency of providing transit benefits to welfare recipients
Criterion Rating and Explanation
Customer Impacts/Benefits
Ease of travel (e.g., seamless) 1 promotes seamless travel if part of regional payment integration
Flexibility of fare payment 1 may offer new payment option(s)
Convenience of fare payment 1 convenient, since person can directly use farecard
Cost of travel 1 assumes that travel is subsidized
Overall attitude toward agency 1 should improve general opinion of agency
Agency Impacts/Benefits
Design/implementation costs -1 costs could be significant for technical development and implementation
Equipment maintenance costs 1 would reduce somewhat if contactless cards used
Revenue collection/management costs -1 would carry some administrative costs
Capital costs -1 would likely require new fare collection equipment
Use of cash 0 should not significantly affect the use of cash
Ridership 1 should increase somewhat
Revenue 0 should not result in loss of revenue, since programs are subsidized
Fare abuse/evasion 1 should reduce abuse/evasion
Fare structure flexibility 0 does not really affect this
Personnel requirements -1 would require some staff time
Service reliability 1 should reduce dwell time, and thus improve reliability
Impact on/Benefits to Partner Entity
Market penetration 1 would increase number of people with direct access to transit payment
Ease of distribution of benefits 1 easy way for social service agencies to distribute benefits to clients
Other (e.g., need for parking) 0 not really an issue
Liability to agency
Economic liability 1 no particular liability
Political/legal liability 1 no particular liability
Constraints/Barriers
Technical -1 requires transit and social service agencies to agree on specific card technology
Institutional -1 agreements with social service agencies could be complicated
Funding Issues and Sources -1 funding for agency to purchase new equipment an issue
Required Equipment and Technology
Requires electronic payment system (smart card or magnetic)
EBT = electronic benefits transfer.

D-22
TABLE D-4.5 Summary evaluation matrix: multiple application programs
Type of Program/Initiative Electronic Toll/Parking
Financial Services, Other Payment or Loyalty Programs
Identification, Access, Security
Examples
Washington, DC – WMATA’s SmarTrip card can be used in WMATA
rail stations Orlando – test of multi-modal payment system
(transit, toll, parking)
Washington, DC – pilot linking SmarTrip with bank ATM card Honolulu – plan for system to
combine transit and local attractions Atlanta – pilot (completed) to accept bank stored-value cards for transit
payment
Washington, DC – plan to use SmarTrip for ID/access
in car-sharing program; also, SmarTrip application
included in GSA ID cards, and bldg. access included
in SmarTrip cards Description of Approach Integrate transit and other
modes Integrate transit and other payment
programs Integrate transit and ID,
access, security
Goals/Objectives of Program
Improve convenience of multi-modal travel
payments
Increase market penetration of potential transit users
Increase market penetration of potential
transit users
Criterion Rating Rating Rating Customer Impacts/Benefits Ease of travel (e.g., seamless) 1 1 1 Flexibility of fare payment 1 1 1 Convenience of fare payment 1 1 1 Cost of travel 0 0 0 Overall attitude toward agency 1 1 1 Agency Impacts/Benefits Design/implementation costs -1 -1 -1 Equipment maintenance costs 1 1 1 Revenue collection/management costs -1 -1 -1 Capital costs -1 -1 -1 Use of cash 1 1 1 Ridership 1 1 1 Revenue 0 0 0 Fare abuse/evasion 1 1 1 Fare structure flexibility 1 1 1 Personnel requirements 0 0 0 Service reliability 1 1 1 Impact on/Benefits to Partner Entities Market penetration 1 1 1 Ease of distribution of benefits 0 0 0 Other (e.g., need for parking) 0 0 0 Liability to agency Economic liability 1 1 1 Political/legal liability 1 1 1 Constraints/Barriers Technical -1 -1 -1 Institutional -1 -1 -1 Funding Issues and Sources -1 -1 -1 Required Equipment/Technology Smart card system Smart card system Smart card system
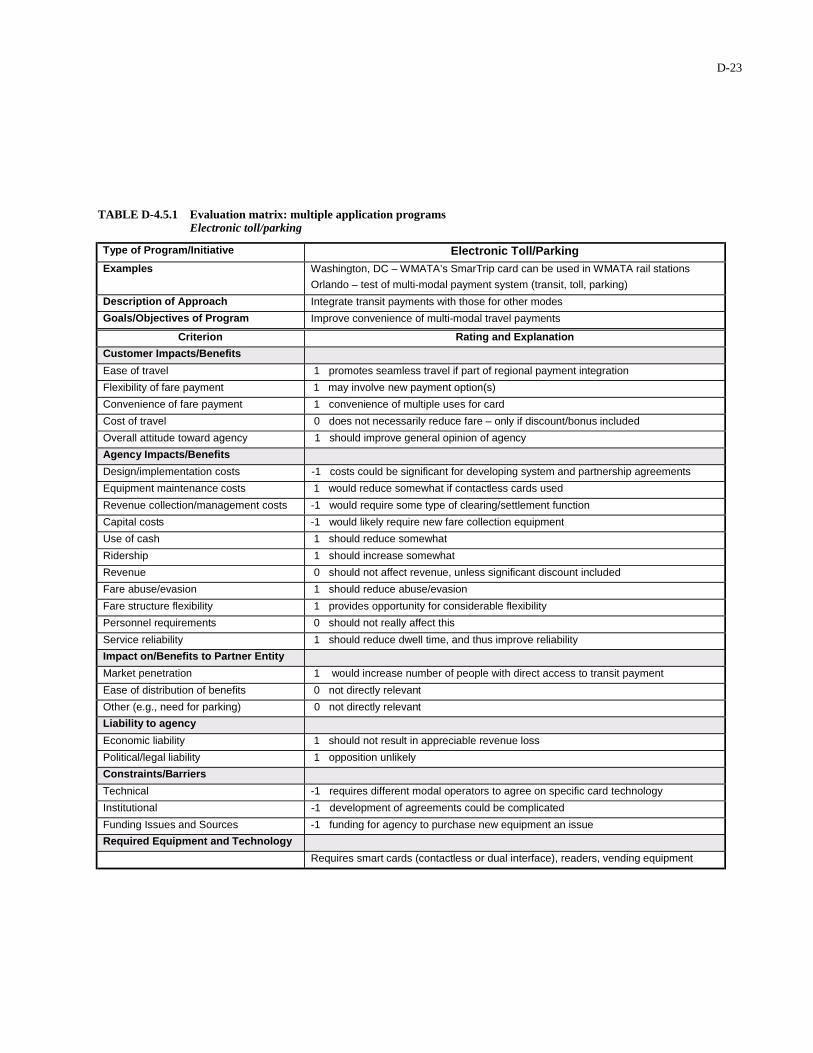
D-23
TABLE D-4.5.1 Evaluation matrix: multiple application programsElectronic toll/parking
Type of Program/Initiative Electronic Toll/Parking Examples Washington, DC – WMATA’s SmarTrip card can be used in WMATA rail stations
Orlando – test of multi-modal payment system (transit, toll, parking)
Description of Approach Integrate transit payments with those for other modes
Goals/Objectives of Program Improve convenience of multi-modal travel payments
Criterion Rating and Explanation
Customer Impacts/Benefits
Ease of travel 1 promotes seamless travel if part of regional payment integration
Flexibility of fare payment 1 may involve new payment option(s)
Convenience of fare payment 1 convenience of multiple uses for card
Cost of travel 0 does not necessarily reduce fare – only if discount/bonus included
Overall attitude toward agency 1 should improve general opinion of agency
Agency Impacts/Benefits
Design/implementation costs -1 costs could be significant for developing system and partnership agreements
Equipment maintenance costs 1 would reduce somewhat if contactless cards used
Revenue collection/management costs -1 would require some type of clearing/settlement function
Capital costs -1 would likely require new fare collection equipment
Use of cash 1 should reduce somewhat
Ridership 1 should increase somewhat
Revenue 0 should not affect revenue, unless significant discount included
Fare abuse/evasion 1 should reduce abuse/evasion
Fare structure flexibility 1 provides opportunity for considerable flexibility
Personnel requirements 0 should not really affect this
Service reliability 1 should reduce dwell time, and thus improve reliability
Impact on/Benefits to Partner Entity
Market penetration 1 would increase number of people with direct access to transit payment
Ease of distribution of benefits 0 not directly relevant
Other (e.g., need for parking) 0 not directly relevant
Liability to agency
Economic liability 1 should not result in appreciable revenue loss
Political/legal liability 1 opposition unlikely
Constraints/Barriers
Technical -1 requires different modal operators to agree on specific card technology
Institutional -1 development of agreements could be complicated
Funding Issues and Sources -1 funding for agency to purchase new equipment an issue
Required Equipment and Technology
Requires smart cards (contactless or dual interface), readers, vending equipment

D-24
TABLE D-4.5.2 Evaluation matrix: multiple application programsFinancial services, other payment or loyalty programs
Type of Program/Initiative Financial Services, Other Payment or Loyalty Programs Examples Washington, DC – pilot linking SmarTrip fare payment with bank ATM card
Honolulu – plan for system to combine transit and local attractions (e.g., zoo)
Atlanta – pilot (completed) to accept bank stored-value cards for transit payment
Description of Approach Integrate transit and other payments/loyalty programs on same card (e.g., accept
bank or other e-purse for transit use)
Goals/Objectives of Program Increase market penetration of potential transit users
Criterion Rating and Explanation
Customer Impacts/Benefits
Ease of travel 1 promotes seamless travel if part of regional payment integration
Flexibility of fare payment 1 may involve new payment option(s)
Convenience of fare payment 1 convenience of multiple uses for card
Cost of travel 0 does not necessarily reduce fare – only if discount/bonus included
Overall attitude toward agency 1 should improve general opinion of agency
Agency Impacts/Benefits
Design/implementation costs -1 costs could be significant for developing system and partnership agreements
Equipment maintenance costs 1 would reduce somewhat if contactless cards used
Revenue collection/management costs -1 would require some type of clearing/settlement function
Capital costs -1 would likely require new fare collection equipment
Use of cash 1 should reduce somewhat
Ridership 1 should increase somewhat
Revenue 0 should not affect revenue, unless significant discount included
Fare abuse/evasion 1 should reduce abuse/evasion
Fare structure flexibility 1 provides opportunity for considerable flexibility
Personnel requirements 0 should not really affect this
Service reliability 1 should reduce dwell time, and thus improve reliability
Impact on/Benefits to Partner Entity
Market penetration 1 would increase number of people with direct access to transit payment
Ease of distribution of benefits 0 not directly relevant
Other (e.g., need for parking) 0 not directly relevant
Liability to agency
Economic liability 1 should not result in appreciable revenue loss
Political/legal liability 1 opposition unlikely
Constraints/Barriers
Technical -1 requires different entities to agree on specific card technology
Institutional -1 development of agreements could be complicated
Funding Issues and Sources -1 funding for agency to purchase new equipment an issue
Required Equipment and Technology
Requires smart cards (contactless or dual interface), readers, vending equipment

D-25
TABLE D-4.5.3 Evaluation matrix: multiple application programsIdentification, access, security
Type of Program/Initiative Identification, Access, Security Examples Washington, DC – plan to allow SmarTrip card to be used for ID/access in car-
sharing program; also, SmarTrip application included in GSA ID cards, and
building access included in SmarTrip cards (pilot for some employees)
Description of Approach Integrate transit and ID/access/security applications on same card
Goals/Objectives of Program Increase market penetration of potential transit users
Criterion Rating and Explanation
Customer Impacts/Benefits
Ease of travel 1 promotes seamless travel if part of regional payment integration
Flexibility of fare payment 1 may involve new payment option(s)
Convenience of fare payment 1 convenience of multiple uses for card
Cost of travel 0 does not necessarily reduce fare – only if discount/bonus included
Overall attitude toward agency 1 should improve general opinion of agency
Agency Impacts/Benefits
Design/implementation costs -1 costs could be significant for developing system and partnership agreements
Equipment maintenance costs 1 would reduce somewhat if contactless cards used
Revenue collection/management costs -1 would require some type of clearing/settlement function
Capital costs -1 would likely require new fare collection equipment
Use of cash 1 should reduce somewhat
Ridership 1 should increase somewhat
Revenue 0 should not affect revenue, unless significant discount included
Fare abuse/evasion 1 should reduce abuse/evasion
Fare structure flexibility 1 provides opportunity for considerable flexibility
Personnel requirements 0 should not really affect this
Service reliability 1 should reduce dwell time, and thus improve reliability
Impact on/Benefits to Partner Entity
Market penetration 1 would increase number of people with direct access to transit payment
Ease of distribution of benefits 0 not directly relevant
Other (e.g., need for parking) 0 not directly relevant
Liability to agency
Economic liability 1 should not result in appreciable revenue loss
Political/legal liability 1 opposition unlikely
Constraints/Barriers
Technical -1 requires different entities to agree on specific card technology
Institutional -1 development of agreements could be complicated
Funding Issues and Sources -1 funding for agency to purchase new equipment an issue
Required Equipment and Technology
Requires smart cards (contactless or dual interface), readers, vending equipment

D-26
TABLE D-4.6 Summary evaluation matrix: university programs
Type of Program/Initiative Pass/Unlimited Access Programs
Special Reduced Fare Programs
Joint Transit-Univ. Card Programs
Examples
Chicago – U-Pass Seattle – U-Pass
Hartford (CT) – UpassBoulder (CO)
Lansing – 25% of full fare Akron, OH – free fare
Chapel Hill, NC – free fare
Ventura Co./U. Cal. Santa Monica/UCLA
Description of Approach
Special pass pricing for students; may require
purchase for all students
Low single ride fares for students; may also involve
low pass prices
Partnership to allow use of university cards directly on
transit services Goals/Objectives of Program Increase transit ridership,
improve access to campus Increase transit ridership,
improve access to campus Increase transit ridership,
improve access to campus
Criterion Rating Rating Rating Customer Impacts/Benefits Ease of travel (e.g., seamless) 0 0 1 Flexibility of fare payment 1 1 1 Convenience of fare payment 1 1 1 Cost of travel 1 1 0 Overall attitude toward agency 1 1 1 Agency Impacts/Benefits Design/implementation costs -1 0 -1 Equipment maintenance costs 0 1 1 Revenue collection/management costs -1 1 -1 Capital costs 0 0 -1 Use of cash 1 1 1 Ridership 1 1 1 Revenue -1 -1 0 Fare abuse/evasion -1 -1 1 Fare structure flexibility 0 0 1 Personnel requirements 0 0 0 Service reliability 0 0 1 Impact on/Benefits to Partner Entities Market penetration 1 1 1 Ease of distribution of benefits 1 1 1 Other (e.g., need for parking) 1 1 1 Liability to agency Economic liability -1 -1 1 Political/legal liability 0 -1 1 Constraints/Barriers Technical 1 1 -1 Institutional -1 -1 -1 Funding Issues and Sources 0 0 -1 Required Equipment/Technology None None Smart card (contactless or
dual interface) system

D-27
TABLE D-4.6.1 Evaluation matrix: university programsSpecial pass/unlimited access programs
Type of Program/Initiative Special Pass/Unlimited Access Programs
Examples Seattle – KC Metro/U. Washington (U-Pass)
Chicago – CTA/any interested university (U-Pass)
Hartford (CT) – CT TRANSIT/Trinity College, Capital Community College
Boulder (CO) – RTD/U. Colorado
Description of Approach Special pass pricing for students; may require purchase for all students
Goals/Objectives of Program Agency’s goal is to increase ridership, university’s goals are to improve
access to and around campus – and possibly to reduce parking demand
Criterion Rating and Explanation
Customer Impacts/Benefits
Ease of travel 0 depends on nature of regional payment integration, if any
Flexibility of fare payment 1 new payment option for students
Convenience of fare payment 1 convenient, since students use ID or get semester/annual pass
Cost of travel 1 can make transit free or very inexpensive
Overall attitude toward agency 1 should improve general opinion of agency
Agency Impacts/Benefits
Design/implementation costs -1 development of agreements could be time-consuming
Equipment maintenance costs 0 should not affect fare collection equipment
Revenue collection/management costs -1 dealing with university will incur some costs
Capital costs 0 should not require new fare collection equipment
Use of cash 1 should reduce considerably
Ridership 1 should increase significantly
Revenue -1 may result in some loss of revenue (depends on program pricing)
Fare abuse/evasion -1 opportunity for abuse (e.g., sharing pass with non-student)
Fare structure flexibility 0 does not really affect this
Personnel requirements 0 does not really affect this
Service reliability 0 drivers have to visually inspect ID or pass
Impact on/Benefits to Partner Entity
Market penetration 1 should be popular with students
Ease of distribution of benefits 1 easy way for university to distribute benefits to students
Other (e.g., need for parking) 1 could reduce demand for parking on/near campus
Liability to agency
Economic liability -1 potential for revenue loss
Political/legal liability 0 could be opposed by non-student riders
Constraints/Barriers
Technical 1 should not have any technical barriers
Institutional -1 development of agreement with university could be complicated
Funding Issues and Sources 0 university would pay for program
Required Equipment and Technology
No particular equipment or technology required

D-28
TABLE D-4.6.2 Evaluation matrix: university programsReduced fare programs for students
Type of Program/Initiative Reduced Fare Programs for Students
Examples Lansing, MI – CATA/Michigan State, others: 25% of full fare for students
Akron, OH – Metro RTA: free for students
Chapel Hill, NC – Chapel Hill Transit: eliminated the fare
Description of Approach Low single ride fares for students; may also involve low pass prices
Goals/Objectives of Program Agency’s goal is to increase ridership, university’s goals are to improve
access to and around campus – and possibly to reduce parking demand
Criterion Rating and Explanation
Customer Impacts/Benefits
Ease of travel 0 depends on nature of regional payment integration, if any
Flexibility of fare payment 1 may involve new payment option(s) for students
Convenience of fare payment 1 convenient if free fare, no more convenient if have to pay cash
Cost of travel 1 can make transit free or very inexpensive
Overall attitude toward agency 1 should improve general opinion of agency
Agency Impacts/Benefits
Design/implementation costs 0 should not significantly affect these costs
Equipment maintenance costs 1 would reduce somewhat if free fare; otherwise, should not affect
Revenue collection/management costs 1 would reduce somewhat if free fare; otherwise, should not affect
Capital costs 0 should not require new fare collection equipment
Use of cash 1 would reduce considerably if free fare; otherwise, could increase
Ridership 1 should increase significantly
Revenue -1 would result in loss of revenue compared to charging full fare
Fare abuse/evasion -1 opportunity for abuse (e.g., non-students using student IDs)
Fare structure flexibility 0 does not really affect this
Personnel requirements 0 does not really affect this
Service reliability 0 drivers have to visually inspect ID
Impact on/Benefits to Partner Entity
Market penetration 1 should be popular with students
Ease of distribution of benefits 1 easy way for university to distribute benefits to students
Other (e.g., need for parking) 1 could reduce demand for parking on/near campus
Liability to agency
Economic liability -1 potential for significant revenue loss
Political/legal liability -1 could be strongly opposed by non-student riders
Constraints/Barriers
Technical 1 should not have any technical barriers
Institutional -1 development of agreement with university could be complicated
Funding Issues and Sources 0 university would pay for program
Required Equipment and Technology
No particular equipment or technology required

D-29
TABLE D-4.6.3 Evaluation matrix: university programsJoint transit-university card programs
Type of Program/Initiative Joint Transit-University Card Programs Examples Ventura Co. (CA) – VCTC/U. Cal. Channel Islands: joint smart card
Los Angeles – Santa Monica Blue Bus/UCLA (BruinGO): UCLA billed for no. rides
Description of Approach Partnership to allow use of university cards directly on transit services (or vice versa)
Goals/Objectives of Program Agency’s goal is to increase ridership, university’s goals are to improve access to and
around campus – and possibly to reduce parking demand
Criterion Rating and Explanation
Customer Impacts/Benefits
Ease of travel 1 promotes seamless travel if part of regional payment integration
Flexibility of fare payment 1 new payment option(s) for students
Convenience of fare payment 1 convenient, since student can directly use campus card on transit
Cost of travel 0 does not necessarily reduce fare – only if discount/bonus included
Overall attitude toward agency 1 should improve general opinion of agency
Agency Impacts/Benefits
Design/implementation costs -1 costs could be significant for developing partnership agreements
Equipment maintenance costs 1 would reduce somewhat if contactless cards used; could increase if contact cards
Revenue collection/management costs -1 would require some type of clearing/settlement function
Capital costs -1 would likely require new fare collection equipment
Use of cash 1 should reduce somewhat
Ridership 1 should increase somewhat
Revenue 0 should not affect revenue, unless significant discount included
Fare abuse/evasion 1 should reduce abuse/evasion
Fare structure flexibility 1 provides opportunity for considerable flexibility
Personnel requirements 0 should not really affect this
Service reliability 1 should reduce dwell time, and thus improve reliability
Impact on/Benefits to Partner Entity
Market penetration 1 should be popular with students
Ease of distribution of benefits 1 easy way for university to distribute benefits to students
Other (e.g., need for parking) 1 could reduce demand for parking on/near campus
Liability to agency
Economic liability 1 should not result in appreciable revenue loss
Political/legal liability 1 should not be opposed by non-student riders
Constraints/Barriers
Technical -1 requires agency and university to agree on specific card technology
Institutional -1 development of agreement with university could be complicated
Funding Issues and Sources -1 funding for agency to purchase new equipment an issue
Required Equipment and Technology
Requires smart cards (contactless or dual interface), readers, vending equipment

D-30
TABLE D-4.7 Summary evaluation matrix: employer programs
Type of Program/Initiative Annual Employer Pass Programs
Transit Voucher Programs
Automated Benefits Distribution Programs
Examples
Minn./St. Paul – Metropass: price based on mode share Portland – Passport: price
based on mode share San Jose – Eco Pass: price
based on formula Seattle – FlexPass: price based
on formula, no minimum
Washington, DC – SmartBenefits
New York City – Premium TransitCheck
Description of Approach
Employers buy annual passes for all employees; price much
lower than normal pass
Employers distribute vouchers to employees, who use the vouchers to buy fare
media (or use directly, if farecard)
Employer automatically provides benefits via electronic fare media
Goals/Objectives of Program Increase transit ridership, improve access to work
Increase transit ridership, improve access to work
Increase ridership, reduce administrative requirements
of benefits program
Criterion Rating Rating Rating Customer Impacts/Benefits Ease of travel (e.g., seamless) 0 0 1 Flexibility of fare payment 0 1 1 Convenience of fare payment 1 -1 1 Cost of travel 1 1 1 Overall attitude toward agency 1 1 1 Agency Impacts/Benefits Design/implementation costs -1 0 -1 Equipment maintenance costs 0 0 1 Revenue collection/management costs -1 -1 1 Capital costs 0 0 -1 Use of cash 1 1 1 Ridership 1 1 1 Revenue -1 0 0 Fare abuse/evasion 0 -1 1 Fare structure flexibility 0 0 1 Personnel requirements -1 0 -1 Service reliability 0 0 1 Impact on/Benefits to Partner Entities Market penetration 1 1 1 Ease of distribution of benefits 1 1 1 Other (e.g., need for parking) 1 1 1 Liability to agency Economic liability -1 1 1 Political/legal liability -1 1 1 Constraints/Barriers Technical 1 1 -1 Institutional -1 0 -1 Funding Issues and Sources 0 0 -1 Required Equipment/Technology None None Smart card system, Internet
access
New York – TransitCheck: can be MetroCard
Washington, DC – Metrochek: farecard, use for payment or
redeem for other San Francisco –
CommuterCheck: redeem for any operator
Boston – CommuterCheck: redeem for MBTA

D-31
TABLE D-4.7.1 Evaluation matrix: employer benefits programsAnnual employer pass programs
Type of Program/Initiative Annual Employer Pass Programs
Examples Minn./St. Paul – Metropass: price based on company’s transit mode share, no minimum
Portland – Passport: price based on company’s transit mode share, min. differs by zone
San Jose – Eco Pass: price based on formula, no min.; also has “neighborhood” pass
Seattle – FlexPass: price based on formula, no minimum
Description of Approach Employers buy annual passes for all employees; price much lower than normal pass;
price based on formula (e.g., co. size, location, level of transit service)
Goals/Objectives of Program Agency’s goal is to increase ridership, employer’s goals are to improve access to work
– and possibly to reduce parking demand
Criterion Rating and Explanation
Customer Impacts/Benefits
Ease of travel 0 depends on nature of regional payment integration, if any
Flexibility of fare payment 0 does not really affect flexibility
Convenience of fare payment 1 annual pass very convenient
Cost of travel 1 can make transit free or very inexpensive
Overall attitude toward agency 1 should improve general opinion of agency
Agency Impacts/Benefits
Design/implementation costs -1 development of formula and agreements with employers can be time-consuming
Equipment maintenance costs 0 should not affect fare collection equipment
Revenue collection/management costs -1 can be significant administrative expense (e.g., surveys of employees)
Capital costs 0 should not require new fare collection equipment
Use of cash 1 should reduce considerably
Ridership 1 should increase significantly
Revenue -1 may result in some loss of revenue (depends on pass pricing)
Fare abuse/evasion 0 minimal opportunity for abuse, since all employees receive pass
Fare structure flexibility 0 does not really affect this
Personnel requirements -1 may require staff to administer program
Service reliability 0 should not affect reliability
Impact on/Benefits to Partner Entity
Market penetration 1 should be popular with employees
Ease of distribution of benefits 1 easy way for employer to distribute transit benefits to employees
Other (e.g., need for parking) 1 could reduce demand for parking at employment site
Liability to agency
Economic liability -1 potential for revenue loss if formula not carefully designed – and updated
Political/legal liability -1 could be opposed by riders who do not have opportunity to partcipate
Constraints/Barriers
Technical 1 should not have any technical barriers
Institutional -1 development of agreements with employers could be complicated
Funding Issues and Sources 0 should not be a significant issue
Required Equipment and Technology
No particular equipment or technology required
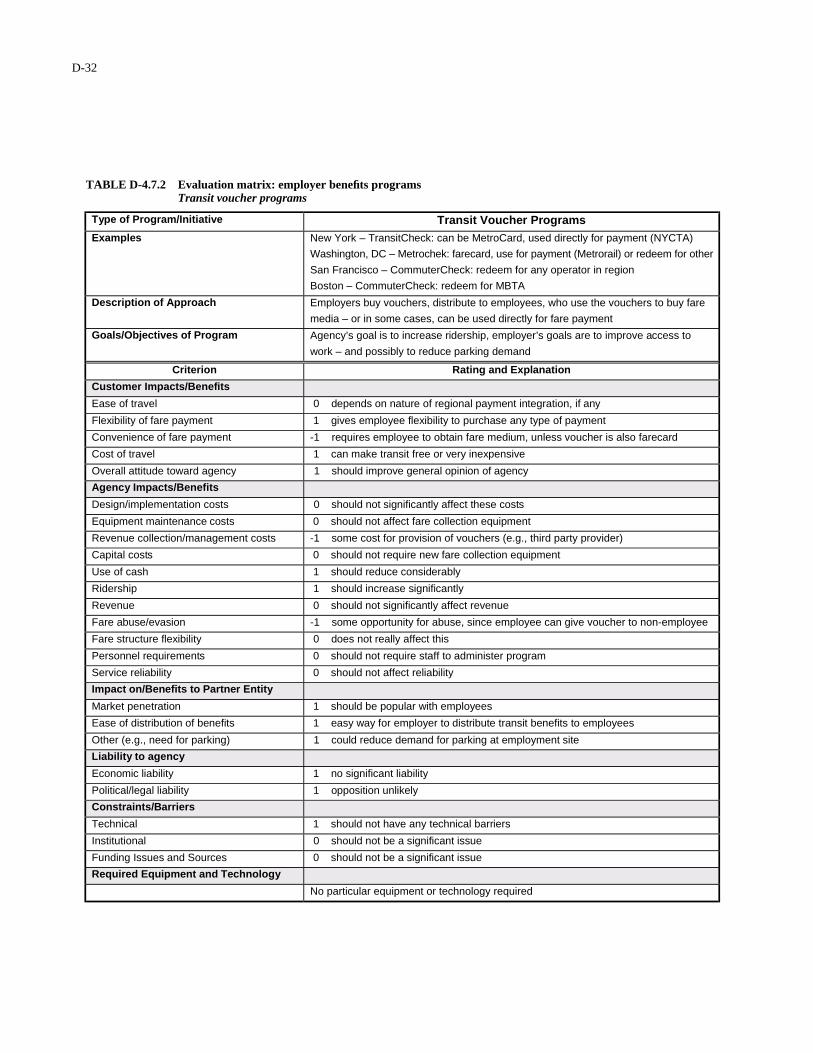
D-32
TABLE D-4.7.2 Evaluation matrix: employer benefits programsTransit voucher programs
Type of Program/Initiative Transit Voucher Programs Examples New York – TransitCheck: can be MetroCard, used directly for payment (NYCTA)
Washington, DC – Metrochek: farecard, use for payment (Metrorail) or redeem for other
San Francisco – CommuterCheck: redeem for any operator in region
Boston – CommuterCheck: redeem for MBTA
Description of Approach Employers buy vouchers, distribute to employees, who use the vouchers to buy fare
media – or in some cases, can be used directly for fare payment
Goals/Objectives of Program Agency’s goal is to increase ridership, employer’s goals are to improve access to
work – and possibly to reduce parking demand
Criterion Rating and Explanation
Customer Impacts/Benefits
Ease of travel 0 depends on nature of regional payment integration, if any
Flexibility of fare payment 1 gives employee flexibility to purchase any type of payment
Convenience of fare payment -1 requires employee to obtain fare medium, unless voucher is also farecard
Cost of travel 1 can make transit free or very inexpensive
Overall attitude toward agency 1 should improve general opinion of agency
Agency Impacts/Benefits
Design/implementation costs 0 should not significantly affect these costs
Equipment maintenance costs 0 should not affect fare collection equipment
Revenue collection/management costs -1 some cost for provision of vouchers (e.g., third party provider)
Capital costs 0 should not require new fare collection equipment
Use of cash 1 should reduce considerably
Ridership 1 should increase significantly
Revenue 0 should not significantly affect revenue
Fare abuse/evasion -1 some opportunity for abuse, since employee can give voucher to non-employee
Fare structure flexibility 0 does not really affect this
Personnel requirements 0 should not require staff to administer program
Service reliability 0 should not affect reliability
Impact on/Benefits to Partner Entity
Market penetration 1 should be popular with employees
Ease of distribution of benefits 1 easy way for employer to distribute transit benefits to employees
Other (e.g., need for parking) 1 could reduce demand for parking at employment site
Liability to agency
Economic liability 1 no significant liability
Political/legal liability 1 opposition unlikely
Constraints/Barriers
Technical 1 should not have any technical barriers
Institutional 0 should not be a significant issue
Funding Issues and Sources 0 should not be a significant issue
Required Equipment and Technology
No particular equipment or technology required
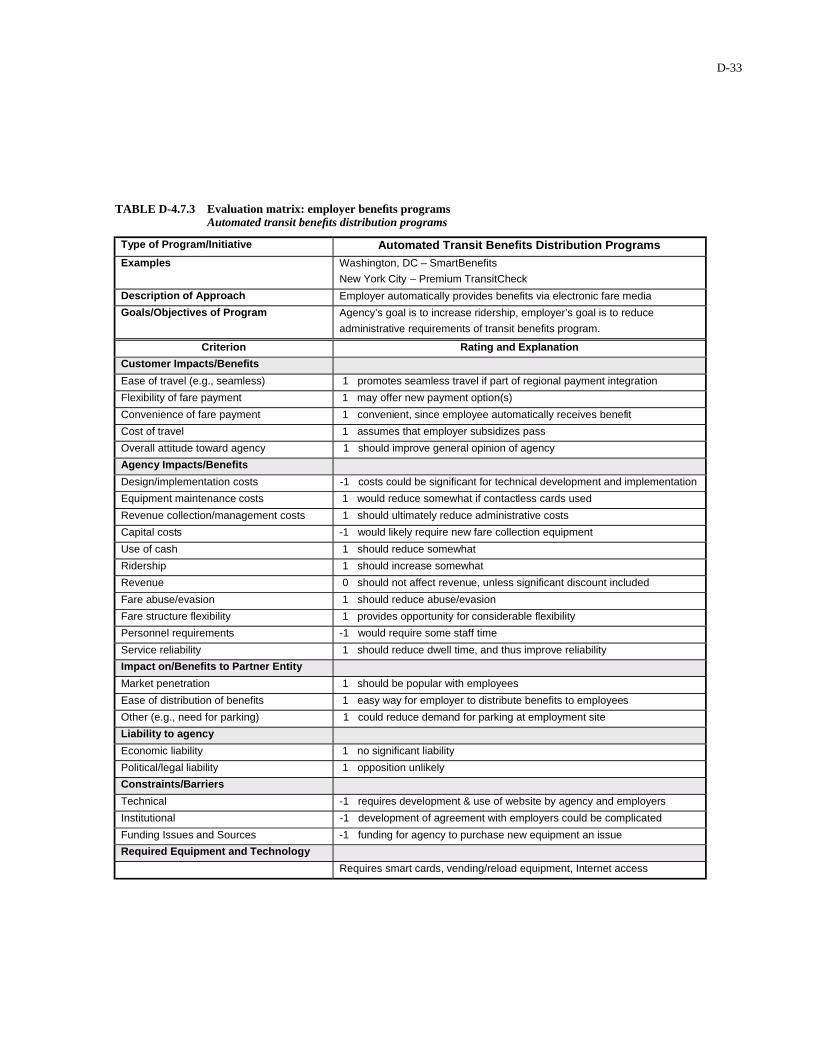
D-33
TABLE D-4.7.3 Evaluation matrix: employer benefits programsAutomated transit benefits distribution programs
Type of Program/Initiative Automated Transit Benefits Distribution Programs Examples Washington, DC – SmartBenefits
New York City – Premium TransitCheck
Description of Approach Employer automatically provides benefits via electronic fare media
Goals/Objectives of Program Agency’s goal is to increase ridership, employer’s goal is to reduce
administrative requirements of transit benefits program.
Criterion Rating and Explanation
Customer Impacts/Benefits
Ease of travel (e.g., seamless) 1 promotes seamless travel if part of regional payment integration
Flexibility of fare payment 1 may offer new payment option(s)
Convenience of fare payment 1 convenient, since employee automatically receives benefit
Cost of travel 1 assumes that employer subsidizes pass
Overall attitude toward agency 1 should improve general opinion of agency
Agency Impacts/Benefits
Design/implementation costs -1 costs could be significant for technical development and implementation
Equipment maintenance costs 1 would reduce somewhat if contactless cards used
Revenue collection/management costs 1 should ultimately reduce administrative costs
Capital costs -1 would likely require new fare collection equipment
Use of cash 1 should reduce somewhat
Ridership 1 should increase somewhat
Revenue 0 should not affect revenue, unless significant discount included
Fare abuse/evasion 1 should reduce abuse/evasion
Fare structure flexibility 1 provides opportunity for considerable flexibility
Personnel requirements -1 would require some staff time
Service reliability 1 should reduce dwell time, and thus improve reliability
Impact on/Benefits to Partner Entity
Market penetration 1 should be popular with employees
Ease of distribution of benefits 1 easy way for employer to distribute benefits to employees
Other (e.g., need for parking) 1 could reduce demand for parking at employment site
Liability to agency
Economic liability 1 no significant liability
Political/legal liability 1 opposition unlikely
Constraints/Barriers
Technical -1 requires development & use of website by agency and employers
Institutional -1 development of agreement with employers could be complicated
Funding Issues and Sources -1 funding for agency to purchase new equipment an issue
Required Equipment and Technology
Requires smart cards, vending/reload equipment, Internet access

Abbreviations used without definitions in TRB publications:
AASHO American Association of State Highway OfficialsAASHTO American Association of State Highway and Transportation OfficialsAPTA American Public Transportation AssociationASCE American Society of Civil EngineersASME American Society of Mechanical EngineersASTM American Society for Testing and MaterialsATA American Trucking AssociationsCTAA Community Transportation Association of AmericaCTBSSP Commercial Truck and Bus Safety Synthesis ProgramFAA Federal Aviation AdministrationFHWA Federal Highway AdministrationFMCSA Federal Motor Carrier Safety AdministrationFRA Federal Railroad AdministrationFTA Federal Transit AdministrationIEEE Institute of Electrical and Electronics EngineersITE Institute of Transportation EngineersNCHRP National Cooperative Highway Research ProgramNCTRP National Cooperative Transit Research and Development ProgramNHTSA National Highway Traffic Safety AdministrationNTSB National Transportation Safety BoardSAE Society of Automotive EngineersTCRP Transit Cooperative Research ProgramTRB Transportation Research BoardU.S.DOT United States Department of Transportation