Embed Size (px)
Citation preview
BI and Analytics in the Age of AI and Big Data
BEST PRACTICES REPORT
By David Stodder
Q4 2018

Research Sponsors
Research Sponsors
Arcadia Data
Hitachi Vantara
OpenText
Oracle
ThoughtSpot

tdwi.org 1
© 2018 by TDWI, a division of 1105 Media, Inc. All rights reserved. Reproductions in whole or in part are prohibited except by written permission. Email requests or feedback to [email protected].
Product and company names mentioned herein may be trademarks and/or registered trademarks of their respective companies. Inclusion of a vendor, product, or service in TDWI research does not constitute an endorsement by TDWI or its management. Sponsorship of a publication should not be construed as an endorsement of the sponsor organization or validation of its claims.
This report is based on independent research and represents TDWI’s findings; reader experience may differ. The information contained in this report was obtained from sources believed to be reliable at the time of publication. Features and specifications can and do change frequently; readers are encouraged to visit vendor websites for updated information. TDWI shall not be liable for any omissions or errors in the information in this report.
By David Stodder
Table of ContentsResearch Methodology and Demographics 3
Executive Summary 4
BI and Analytics: A New Age Unfolds 5
The User Experience . . . . . . . . . . . . . . . . . . . . . . . . . 5
The Analytics Experience . . . . . . . . . . . . . . . . . . . . . . 6
The Data Experience . . . . . . . . . . . . . . . . . . . . . . . . . 7
Business Drivers and Barriers 9
Investment Priorities for New Technologies and Services . . . . . 10
Barriers to Improvement . . . . . . . . . . . . . . . . . . . . . . 12
Technology Choices and Satisfaction 14
Initiatives for Improving User Satisfaction . . . . . . . . . . . . . 16
Levels of Success Achieving User Satisfaction. . . . . . . . . . . 17
Strategies for Augmentation and Replacement 19
Open Source Options for BI, Analytics, and Data Management . . 21
Strategies for Faster and Fresher Data. . . . . . . . . . . . . . . 23
Plans for Using AI and Machine Learning 25
Data Preparation, Data Catalogs, and Governance 27
Data Catalogs: Room for Improvement. . . . . . . . . . . . . . . 28
Improving Confidence in Data Governance . . . . . . . . . . . . . 29
Vendor Products 32
Recommendations 34
BI and Analytics in the Age of AI and Big Data
BEST PRACTICES REPORT
Q4 2018

2
BI and Analytics in the Age of AI and Big Data
About the AuthorDAVID STODDER is senior director of TDWI Research for business intelligence. He focuses on providing research-based insight and best practices for organizations implementing BI, analytics, performance management, data discovery, data visualization, and related technologies and methods. He is the author of TDWI Best Practices Reports and Checklist Reports on AI for BI, cloud analytics, data visualization, customer analytics, big data analytics, design thinking, and data governance. He has chaired TDWI conferences on visual BI and analytics, business agility, and analytics. Stodder has provided thought leadership on BI, information management, and IT management for over two decades. He is an industry analyst, having served as vice president and research director with Ventana Research, and he was the founding chief editor of Intelligent Enterprise and Database Programming & Design. You can reach him at [email protected], @dbstodder on Twitter, and on LinkedIn at linkedin.com/in/davidstodder.
About TDWI ResearchTDWI Research provides research and advice for data professionals worldwide. TDWI Research focuses exclusively on data management and analytics issues and teams up with industry thought leaders and practitioners to deliver both broad and deep understanding of the business and technical challenges surrounding the deployment and use of data management and analytics solutions. TDWI Research offers in-depth research reports, commentary, inquiry services, and topical conferences as well as strategic planning services to user and vendor organizations.
About the TDWI Best Practices Reports SeriesThis series is designed to educate technical and business professionals about new business intelligence, analytics, AI, and data management technologies, concepts, or approaches that address a significant problem or issue. Research is conducted via interviews with industry experts and leading-edge user companies and is supplemented by surveys of business and IT professionals. To support the program, TDWI seeks vendors that collectively wish to evangelize a new approach to solving problems or an emerging business and technology discipline. By banding together, sponsors can validate a new market niche and educate organizations about alternative solutions to critical problems or issues. To suggest a topic that meets these requirements, please contact TDWI senior research directors Fern Halper ([email protected]), Philip Russom ([email protected]), and David Stodder ([email protected]).
AcknowledgmentsTDWI would like to thank many people who contributed to this report. First, we appreciate the many professionals who responded to our survey, especially those who agreed to our requests for phone interviews. Second, our report sponsors, who diligently reviewed outlines, survey questions, and report drafts. Finally, we would like to recognize TDWI’s production team: James Powell, Peter Considine, Lindsay Stares, and Michael Boyda.
SponsorsArcadia Data, Hitachi Vantara, OpenText, Oracle, and ThoughtSpot sponsored the research and writing of this report.

tdwi.org 3
Research Methodology and Demographics
Research Methodology and Demographics Report Purpose. Artificial intelligence (AI) and big data technologies and platforms are creating new opportunities as well as challenges. Opportunities include improvements to the user experience through smart recommendations and faster capabilities for finding, accessing, and analyzing different types of data. Challenges include whether organizations have the right skill sets, governance, and data management. Cloud-based solutions are helping organizations become more dynamic, but challenges remain. This report examines current use of technologies, plans for the future, and best practices for success.
Survey Methodology. In September 2018, TDWI sent an invitation via email to business and IT professionals in our database, asking them to complete an Internet-based survey. The invitation was also posted online and in publications from TDWI and other firms. The survey collected responses from 295 respondents. A total of 197 completed all questions. All responses are valuable and so are included in this report’s sample. This explains why the number of respondents varies per question.
Research Methods. In addition to the survey, TDWI conducted telephone interviews with technical users, business sponsors, and BI, analytics, AI, and data management experts. TDWI also received briefings from vendors that offer products related to the topics addressed in this report.
Survey Demographics. About one-fifth of survey respondents are business or IT executives (19%). The largest percentage are business or data analysts and data scientists (26%), followed closely by developers and data, application, or enterprise architects (24%). The rest include 11% line of business (LOB) managers and other business sponsors, 13% in other IT capacities, and 7% of a variety of titles grouped into “other.”
The financial services and consulting industries (15% each) are the largest industry groups in the respondent population, followed by education (9%), healthcare (7%), software and SaaS (7%), government (5%), insurance (5%), and other industries. Over half of survey respondents reside in the U.S. (54%), with Europe (15%) and other regions following. Respondents come from enterprises of all sizes.
PositionBusiness or data analyst/scientist 26%
Developers/architects 24%
Business/IT exec/VP 19%
LOB managers/sponsors 11%
IT-other 13%
Other 7%
IndustryFinancial services 15%
Consulting/professional services 15%
Education 9%
Healthcare 7%
Software/SaaS 7%
Government 5%
Insurance 5%
Transportation/logistics 5%
Other 32%
(“Other” consists of multiple industries, each represented by 3% of respondents or less.)
GeographyUnited States 54%
Europe 15%
Canada 8%
Asia/Pacific Islands 6%
Central or South America 6%
South Asia (India and Pakistan) 4%
Middle East 3%
Africa 2%
Australia/New Zealand 2%
Number of Employees100,000 or more 9%
10,000 to 99,999 18%
1,000 to 9,999 35%
100 to 999 22%
Fewer than 100 13%
Don’t know 3%
Company Size by Revenue$10 billion or more 17%
$1–9.99 billion 17%
$500–999 million 10%
$100–499 million 10%
$20–99 million 11%
Less than $19 million 15%
Don’t know or unable to disclose
20%
Demographics based on 282 respondents.

4
BI and Analytics in the Age of AI and Big Data
Executive SummaryTo drive higher value from data and analytics, organizations are anxious to capitalize on advances in artificial intelligence (AI), big data, and cloud-based services—trends that will reshape how organizations set their BI, analytics, and data architecture strategies. In this Best Practices Report, TDWI research shows strong interest in using these technologies but also concerns about data governance, data quality, user satisfaction, and having the right skill sets to move forward.
The key areas of investment focus are not unexpected. About three-quarters (74%) of organizations want to invest in new technologies to improve operational efficiency and effectiveness, which have long been leading objectives for using BI and analytics. However, rather than stay with existing technologies and platforms for business intelligence (BI) reporting, analytics, and other use cases, the majority of organizations want to either augment or replace them. Organizations want to accelerate their pursuit of operational excellence through use of new technologies and cloud-based solutions.
Organizations also want to focus technology and services investment on increasing self-service BI and analytics capabilities. As organizations determine how to adopt AI and big data technologies, they will be interested in how these new technologies and practices can contribute to empowering a burgeoning community of users to move beyond simple data consumption and do more reporting, data exploration, data preparation, and analytics on their own with less IT involvement.
One of the most difficult aspects of BI and analytics democratization is how to govern and manage it. Many organizations fear a “Wild West” if they let self-service technologies spread too far and fast. Beyond obligations to comply with regulations demanding protection from unauthorized use and exposure of sensitive data, concern about how to properly govern and manage the expansion of self-service technologies is another driver behind strong interest in data governance. TDWI research finds that governance and data quality challenges are barriers to adoption of new technologies such as AI as well as to greater user independence from IT.
Another barrier is the deficiency in skilled personnel. This is always an issue regarding adoption of new technologies. However, innovations made possible by AI and other means of increasing automation will themselves help organizations address skill gaps by providing “augmented intelligence” capabilities that automatically guide and recommend data sets, visualizations, analytics models, and follow-up questions to ask of the data. AI will improve the speed and efficiency of search and natural language-based exploration of big data. Still, technology alone won’t be enough. Organizations need to assess requirements for building skills internally or hiring and contracting personnel who can help them achieve the next generation of BI and analytics objectives.
This TDWI Best Practices Report shows strong
interest in AI, big data, cloud, and other
new technologies but also caution due
to governance and quality concerns

tdwi.org 5
BI and Analytics: A New Age Unfolds
BI and Analytics: A New Age Unfolds With data-driven goals paramount, BI and analytics tools, applications, and practices—as well as the data management and integration systems that support them—are in the spotlight. This “stack” of layered technologies, cloud-based services, and practices is critical to providing an increasingly varied spectrum of decision makers with a steady stream of trusted, quality data and analytics insights. However, although attributes such as “trusted” and “steady” are valuable, the stack must also enable agility, flexibility, and change. Users want new ways of visualizing, interacting with, and analyzing different types of data. As new interests and requirements crop up, users will not remain satisfied with the status quo.
Change is a constant in technology, and the worlds of BI, analytics, data management, and data integration are no exception. Just when it appears that technologies in these areas have become static, innovations from both within these areas and without—from areas such as computer processing and networking—disrupt the stasis. In recent years, big data, faster networks, cloud computing, mobility, and easier-to-use graphical user interfaces and visualizations have rendered conventional wisdom about how to develop and deploy the elements of this stack outdated. Today, the Internet of Things (IoT) and AI, including machine learning (ML) and natural language processing (NLP), are pushing BI, analytics, data management, and data integration to evolve yet again.
This TDWI Best Practices Report focuses on the emerging world of BI and analytics in the age of AI and big data. The research explores organizations’ satisfaction with current technologies and the issues driving interest in newer solutions that enable organizations to exploit advances in AI and big data, that is, large volumes of raw, detailed, and varied data (including streaming data) that do not fit easily into conventional data warehouses and BI systems. Our research finds that organizations are interested in both augmenting existing systems and replacing older technologies and data platforms with new ones.
Before looking at the research in depth, let’s consider some of the key areas in which BI, analytics, data management, and data integration have been evolving and how advances brought about by AI and big data are changing the course of this evolution.
The User ExperienceBI tools and applications have traveled far from their early days as query and reporting tools that required considerable expertise in both SQL programming and the data itself. The advent of graphical user interfaces has enabled intuitive and visual experiences with dashboards and portals. This has introduced more creativity in how power users and less-technical business users interact with data, including through gamification and virtual reality.
It has also put pressure on IT to respond with higher concurrency, availability, and performance with data warehouse and analytics platforms to support larger numbers of users. As BI solutions have evolved, many have incorporated online analytical processing (OLAP) capabilities for drill-down and slice-and-dice multidimensional analysis, but with easier-to-use, visual interfaces to make it simpler for users to explore the data.
Today, standard BI and business user analytics tools bring together functionality for data access, querying, analysis, reporting, and presentation and make this functionality available in varying degrees on desktops, over the Web, on mobile devices, and on public and private cloud platforms. At least from a technical perspective, easier-to-use functionality continues to make it possible for users to do more on their own in a self-service fashion without close IT guidance.
Organizations have to balance stability and trust in the data with user needs for flexibility and agility; new technologies and practices can help
The advent of graphical user interfaces has enabled intuitive and visual experiences with dashboards and portals

6
BI and Analytics in the Age of AI and Big Data
We are seeing the user experience evolving in many ways, particularly the following:
• Data visualization. Visualization can reduce the time and effort needed to uncover and share data insights. Data visualization capabilities foster innovations not only from technology but from the study of human cognition and perception. Visual methods of exploring and representing information tap powerful human capabilities for perceiving meaningful patterns, relationships, structures, and outliers. Implementation of chart engines and the growth in the number and variety of visualizations available in both commercial and open source tools and application programming interfaces (APIs) are supporting increased sophistication. Users can choose from a variety of bar, pie, scatterplot, and other charts, but they can also tap numerous other ways of expressing advanced insights about quantitative information, including animation and storytelling.
• Immersive, “speed of thought” experiences. Leading solution providers are taking a cue from the online consumer experience and are seeking to give users similarly personalized and “immersive” experiences. The latest capabilities enable users to follow their analysis path without having to stop, switch tools, go to a command-line query interface, or do anything else that impedes their train of thought. Solutions are employing responsive and adaptive Web design approaches, which can give users rich experiences, particularly on mobile devices. Search capabilities integrated with BI functionality enable users to express themselves in natural language to find, explore, and analyze different types of data and content. Increasingly, users can choose visual objects, move from one to another to view relationships between data sets differently, and search and filter views and data feeds. Solutions enable users to embed visualizations and procedures in other applications so that insights can be shared beyond the confines of the BI and analytics solutions themselves.
• Virtual reality and voice-enabled interaction. Some solution providers are taking the first steps into virtual and augmented reality by enabling their systems to work with Amazon’s Alexa, Apple’s Siri, or Microsoft’s Cortana intelligent personal assistant (or “digital agent”) applications. In addition to interaction with these voice apps, some solutions provide voice-enabled interaction with BI applications themselves via desktop or mobile devices. For example, these capabilities enable business managers in a retail store or restaurant to ask simple queries or search for answers, which are then spoken back to them about inventory levels, sales, and profitability. In the future, voice-enabled applications will employ AI techniques such as NLP and machine learning to understand how to help users by anticipating follow-up questions and finding answers to more complex queries.
The Analytics ExperienceAnalytics in solutions today must simultaneously address depth and breadth. Techniques and technologies are enabling a greater range of users—from data scientists to data and business analysts to business users—to interact with bigger volumes of more varied data. “Citizen data scientists,” who may be business analysts, data analysts, or tech-savvy business users, are tapping expanded BI and analytics tools for predictive analytics, NLP and text mining, prescriptive analytics, and geospatial analytics.
AI, in particular machine learning, will have an increasing impact on the analytics experience. ML is about building systems that can learn from data to identify patterns and predict results with minimal human intervention. The computer learns from examples using either supervised or unsupervised approaches.
AI and natural language processing are
changing how users interact with data

tdwi.org 7
BI and Analytics: A New Age Unfolds
Three key trends at the intersection of AI and analytics are:
• Augmentation by AI. This report discusses augmentation using AI methods and technologies to modernize and automate the BI and analytics stack. AI is changing how users interact with data and their workflow for discovering insights. For example, AI can provide recommendations about which data sets to use in analytics; through ML, AI can automate exploration for patterns and then deliver predictive insights to users, who can then search and/or query to answer additional questions. AI can also automatically uncover insights to questions users may not have thought to ask, and this can lead them to ask more questions to find deeper insights. AI becomes most valuable when users are trying to scale up to discover insights from big data. Ultimately, the augmentation trend is about enabling users to be more productive even as analytics grows increasingly complex and data-rich. Processes will be faster and the results will show less bias because they are generated with less human intervention. Users will gain accurate data insights faster.
• NLP and search. These technologies and methods will have a growing presence in analytics among citizen data scientists and nontechnical users. NLP, usually considered part of AI, involves analyzing, understanding, and generating languages; the goal is interfacing with systems using human rather than computer languages. With ML and other AI techniques inside search, BI, and analytics solutions, systems can learn from user behavior and data characteristics to provide users with relevant, accurate answers to data questions. It will be easier for diverse users to analyze data and content without programming or modeling within the context of their subject matter expertise. The more natural interaction will allow analytics to play a bigger role in how users investigate topics, make decisions, and collaborate.
• Integration of diverse analytics techniques. As analytics becomes embedded in daily decision making, it will be important to support and integrate multiple techniques rather than limit the range to only one or a small number. Use cases will demand it. Executives and managers will seek to use AI to gain predictive insight into performance management, risk evaluation, the value of customer loyalty, and whether their organizations should market through different channels to reach new customer segments. A sales representative might want to combine geolocation data with predictive analytics to gain recommendations about which customers to visit in their sales territory. A healthcare provider might use a similar combination of geospatial, predictive, and real-time analytics to pinpoint disease epicenters and where they need to allocate personnel and medical resources to stem an outbreak.
The Data ExperienceThe big-data tsunami shows no signs of slowing as organizations continue to instrument their environments and draw data from many varied applications, Web services, mobile devices, IoT sensors, machine data, geolocation data, and multichannel human behavior. Massive data lakes collect data from multiple sources into clusters running Apache Hadoop or Spark and also increasingly into cloud storage. In addition, many organizations are using operational data stores (ODS) built on either traditional data platforms or Hadoop and Spark; these typically focus on gathering timely data from business applications and online transaction processing (OLTP) systems rather than from exotic sources of unstructured and semistructured data and content. Streaming data systems are growing to either supplement ODS or provide a solution better geared to real-time data processing and analytics needs.

8
BI and Analytics in the Age of AI and Big Data
Data lakes typically persist big data in its original raw, detailed state so it can be analyzed in that state or refined for specific purposes. A data warehouse sometimes complements a data lake by providing users with refined, modeled, and consistent data drawn from the lake, usually for a preselected, well-defined range of BI and analytics use cases. However, the relationship between data lakes and data warehouses varies. Rather than have a standalone data warehouse, some organizations devote an area of the data lake for aggregated, transformed, and remodeled data; they can use this area to support high user concurrency BI workloads directly on the data lake. A newer approach is to set up dynamic, on-the-fly data warehouses and data marts, often in the cloud, to formalize data from the data lake for BI and analytics. Organizations also use virtualization layers, data catalogs, and other shared data management technologies to locate and access data and prepare it for specific use cases.
The cloud has become a critical change agent because it enables organizations to collect and store data in public or private online services without having to build their own systems on premises. Data lakes and data warehouses, not to mention smaller sandboxes and data marts, are growing in the cloud. Here are three current areas of technology focus for organizations working with big data:
• Handling democratization of access. Data lakes largely grew up under the eyes of pioneering data scientists and IT personnel who took on the challenges of working with big volumes and varieties of data, including how to access and prepare them. Now, as more users seek to work with what is in data lakes for reporting and analysis, organizations need to address performance, concurrency, availability, and related issues to make sure possibly hundreds or thousands of users have a steady flow of data. Organizations need to integrate data lakes into multiplatform architectures so that workloads are executed on the appropriate platforms.
• Offering smarter choices for preparation, pre-aggregation, or no pre-aggregation. Unfettered access to raw big data is useful to some, but for an expanding range of users, some level of preparation and pre-aggregation is important. Many use cases need portions of data from the lake prepared for frequent (if not continuous) access; however, adding preparation steps can increase latency. Solutions in the marketplace are enabling users to work with data at scale and speed without pre-aggregation; other solutions are employing AI technologies to improve, automate, and accelerate preparation, preprocessing, and pre-aggregation of data. Modern solutions, however, are aimed at moving past the static, set-in-stone nature of traditional data warehouse and OLAP systems to enable organizations to be more dynamic with data preparation to fit changing business needs.
• Provisioning users with trusted, governed data. As organizations use a greater variety of data, they need to know more about its quality, consistency, and completeness—all elements that add up to whether users can trust the data. Organizations also need to ensure good governance and security of the data, including making sure that as they build BI, analytics, AI/ML, and data preparation layers on top of the data lake, the permissions, authentication, and other security for data access are aligned and observed. Data catalogs, business glossaries, metadata repositories, and master data management are critical to improving governance and management of the data. These systems are also undergoing an AI infusion to improve accuracy and relevance.
With these trends in mind, we can begin examining this report’s research into organizations’ experiences and plans with BI and analytics in the age of AI and big data. The report concludes with best practices recommendations.
Data lakes and data warehouses, not
to mention smaller sandboxes and data marts, are growing
in the cloud
tdwi.org 9
Business Drivers and Barriers
Business Drivers and Barriers Investment in new BI, analytics, and data management technologies usually flows from business need: an organization recognizes that it does not have the right information and analytics insights to accomplish a particular objective or the tools and data platforms to get it. For this report, we asked research participants what major business drivers are behind their organizations’ investment in new technologies and/or cloud-based services to improve BI, analytics, and supporting data integration and management. All of the possible drivers we offered in our question drew significant interest, but the majority of respondents highlighted three of them.
The biggest percentage indicated that the main driver is to improve operational efficiency and effectiveness (74%, no figure shown for this survey question). This perennial BI and analytics demand driver demonstrates the continuing importance of supplying managers with better information and insights so they can spot unnecessary spending, fix mistakes, and innovate with business processes, equipment use, staffing, and allocation of personnel. In line with this focus on improving operations, we find that about half (49%) of research participants cite reducing costs and improving profitability as objectives of new technology investment.
Performance management methodologies and the use of key performance indicators (KPIs) and other metrics have long played a major role in how organizations define and communicate business objectives and help operational managers judge how well objectives are being met. Half (50%) of research participants said KPIs and metrics are a major driver of new investment in BI, analytics, and data management. This indicates that organizations want to use data insights to improve their implementation of KPIs and metrics so managers and frontline personnel can gain greater value from them. In our interviews, this often means refreshing data for KPIs and metrics more frequently—at least more than once a day and often more than once an hour.
Many organizations are aware that dashboard and scorecard users are frustrated with the static, shallow nature of visualizations and would like the ability to dig deeper into the data from them; users would like to engage in ad hoc querying to answer unanticipated questions and analyze the data from different perspectives. To gain better contextual understanding, many are also seeking to access and blend new types of data.
Beyond the three most-selected drivers noted above, 38% said that enabling more automation of decisions and actions is a driver of new investment. In particular, we find that many organizations are looking to identify repeatable decisions that do not add value and can be programmed into algorithms, often with the objective of achieving cost savings and better efficiency. Thus, they need the ability to identify which decisions to automate, the skills and tools to develop business rules and algorithms, and the ability to manage automated decisions over time to ensure the right (or expected) outcomes.
Time-sensitive use cases such as improving fraud and abuse detection are often behind decision automation; 19% said this objective was a driver behind new investment. The broader goal of enabling data-driven risk analysis and management was selected by 28% of research participants. Organizations with this objective need data and analytics technologies that enable testing and validating of risk indicators, often in near real time. Risk analysis and management frequently play a role in regulatory compliance, which was also identified by 28% as a driver of new investment. Regulatory compliance typically requires new types of reports and dashboards, new priorities for secure data management and storage, and new analytics to assess risks.
Organizations put an investment priority on technologies and services that can help them improve operational efficiency and effectiveness
Many organizations are looking to identify repeatable decisions that can be automated, often with the objective of achieving cost savings and better efficiency

10
BI and Analytics in the Age of AI and Big Data
A little over one-quarter (27%) said marketing and customer engagement are driving new investment, and 22% said sales enablement and customer support each are drivers. TDWI frequently finds that these functions spearhead investment in big data analytics to enable organizations to discover patterns and trends in customer behavior to improve engagement and optimize sales strategies. Here, we can see that organizations are perhaps more interested in aiming new investment in BI, analytics, and data management technologies to advance broader goals of improving operational efficiency and effectiveness, reducing costs, improving profitability, and making performance management more effective. Marketing, sales, and customer support operations are, of course, critical operations to which organizations will be applying some of these new investments.
USER STORY NEUSTAR DEMOCRATIZES MARKETING ANALYTICS ON BIG DATA
Neustar MarketShare provides decision analytics and prescriptive data-driven recommendations to help clients optimize marketing spending. A key focus is marketing attribution, which is about using analytics to determine which campaigns most influence customer behavior and how marketing expenses compare to revenue. Marketing managers need such insights to decide where to allocate marketing resources to gain the highest level of success, as well as how to more accurately assign the percentage of credit due to specific marketing and advertising processes.
Neustar MarketShare makes good use of big data platforms to run the complex analytics on multiple data types required for marketing attribution and development of other insights for clients. However, to provide the most benefit in an increasingly democratized world of nontechnical yet data-driven marketing decision makers, Neustar needed to embed easy-to-use self-service reporting and visualization. Initial efforts to develop these capabilities proved too slow and involved significant manual effort to extract and move the data. Neustar advanced its approach by implementing Arcadia Data’s visual applications, which can run on the big data platforms that Neustar MarketShare uses to supply users with ad hoc querying and visualization against volumes of data.
According to Satya Ramachandran, VP of engineering at Neustar, the company has been able to shorten the time it takes to create template reports, which match data sets and dimensions to what users need for visual reporting. It is also faster to change the templates when necessary to meet dynamic needs. Without requiring expertise, Neustar’s client users can drill down into raw data stored on the big data platforms for more granular exploration of marketing attribution and further investigate other ROI questions about campaigns and spending.
Investment Priorities for New Technologies and ServicesGiven the business drivers that our research has identified, it is not surprising that we find that centrally managed enterprise BI and business analytics form the highest shared investment priority for acquiring or subscribing to new technologies and/or cloud-based services, with 82% indicating that this is a “very” or “somewhat” high priority (see Figure 1).
Other technologies and services might garner more attention, but clearly most organizations we surveyed do not plan to take their eyes off the ball regarding enterprise BI and business analytics for supporting performance management and operational BI reporting and analytics. The attractions of this typically IT-led, centrally managed approach are the ability to provide users with carefully provisioned, trusted, and governed data and to put experienced developers in charge of building out users’ desired functionality. Centrally managed approaches are also how organizations have traditionally handled performance and concurrency challenges as they deploy to hundreds or thousands of users or to manage hundreds, if not thousands, of KPIs and metrics.
Organizations do not want to take their eyes off the ball regarding enterprise
BI and business analytics

tdwi.org 11
Business Drivers and Barriers
Within your organization, what is the investment priority for acquiring or subscribing to new technologies and/or cloud-based services to improve the following BI and analytics activities?
Enterprise BI/business analytics (centrally managed) 41% 41% 13% 2 3
Advanced analytics (statistical, mathematical, predictive) 32% 46% 14% 3 5%
Data preparation (e g , cleansing, validation, transformation) 28% 48% 16% 5% 3
Self-service BI/business analytics (departmentally managed) 34% 41% 16% 5% 4%
Data warehouse 36% 36% 19% 5% 4%
Data integration, messaging, and streaming 27% 42% 18% 9% 4%
Data catalog, metadata, or master data management 22% 45% 18% 9% 5%
Real-time analytics and/or event monitoring 21% 40% 23% 10% 6%
Data lake (e g , Hadoop or Spark cluster) 27% 28% 20% 16% 9%
Artificial intelligence (including machine learning and NLP) 20% 34% 25% 14% 7%
Mobile BI and analytics 12% 27% 37% 19% 5%
Embedded BI/analytics in CRM, SFA, etc 12% 26% 34% 18% 10%
Figure 1. Based on answers from 250 respondents. Ordered by highest combined "very high" and "somewhat high" priority responses. Totals may not equal 100% due to rounding.
However, to maintain the value of centrally managed enterprise BI and business analytics, organizations need to ensure that data selection and timeliness, features and functionality, and a degree of user freedom and personalization are up to date with the user requirements. Our research finds that investing in departmentally managed self-service BI and business analytics is nearly as high a priority; 75% said this was a very or somewhat high priority while only 21% said it was a low priority (4% didn’t know or regarded this as not applicable).
Historically, self-service BI and business analytics technologies have originated in organizations at the departmental and line of business (LOB) level and expanded from there, challenging the dominance of IT-driven enterprise BI (if it existed). Rather than wait for IT development and deployment, LOB and departmental executives and managers have selected tools that provide easier data access, visualization, and analysis, increasing their independence from IT. Thus, the high level of interest in self-service functionality indicates the strength of non-IT, business-side champions in steering investment.
Advanced analytics and AI are strong priorities. Nearly one-third (32%) of research participants indicated that advanced analytics was a very high priority, with an additional 46% saying it was a somewhat high priority. Also, more than half of respondents said AI, including ML and NLP, was a priority, with 20% calling AI a very high priority. Strong interest in statistical, mathematical, data mining, and other data analysis techniques and technologies for delivering predictive, prescriptive, and other advanced analytics is not surprising given the strategic importance of innovating with data.
Very high
Somewhat high
Somewhat low
Very low
Don't know or N/A

12
BI and Analytics in the Age of AI and Big Data
Many organizations are seeking to rapidly bring these capabilities into how they make decisions and take action. We found in our research that the level of prioritization is fairly consistent across organizations of all sizes and industries. We will have more to say about them as we discuss other research findings in this report.
Data preparation, cataloging, metadata, and MDM are priorities. Research participants indicated that it is important to invest in new technologies and/or cloud-based services to improve data preparation and the development of shared resources of knowledge about the data. Data preparation covers a range of processes that begin during an organization’s initial ingestion of raw structured and unstructured data from one or multiple sources. Data preparation processes focus on determining what the data is and improving its quality and completeness, standardizing how it is defined and structured, collecting and consolidating it, and taking transformation steps to make it useful, particularly for reporting and analysis.
In many cases, data preparation processes are still heavily manual and a major source of delay in enabling users and data scientists to analyze data. The processes are often inconsistent from one project to the next, which can damage trust in the data. Thus, it is not surprising that three-quarters (76%) of research participants said new investment in data preparation was a priority, with 28% calling it a very high priority.
Almost as many participants regard investment in a data catalog, metadata, or master data management (MDM) resource a priority; 22% said this area constituted a very high priority and an additional 45% said it was a somewhat high priority. A data catalog is a central repository that typically contains metadata—that is, descriptive information about the data sets, how they are defined, and where to find them. Some data catalogs (or metadata repositories) include information about who produced the data set, its quality, and other important characteristics.
Having this resource can make it easier for users and data scientists to find data and move faster to integrate and analyze it. Developing an MDM resource can also be part of this effort by establishing a shared, unified reference copy of or an ability to locate all distributed, usually nontransactional data about a topic of interest, such as customers.
More than half said investing in a data lake is a priority. Our research shows that data lakes are a fairly strong focus of investment, with 55% overall indicating that it is a priority; 27% said it is a very high priority. When we filter to see only those research participants who said that AI is a priority, the percentage indicating that a data lake is a priority jumps to 70%, which shows a correlation between investments in these two areas. Additionally, when we filter survey results to look at only the 45 respondents who said that data volumes for typical analytics projects in their organization include more than a billion rows of data, it’s not surprising that the percentage of participants who said their organization is investing in a data lake rises to 75%.
Barriers to ImprovementOrganizations confront various obstacles to improving BI, analytics, and supporting data integration and management. We asked research participants which ones they regard as the biggest barriers (no figure shown for this survey question). Nearly half (47%) said the shortage of expert personnel such as data scientists was a problem. Clearly, organizations have difficulty progressing unless they have the right personnel in the right places to develop applications and visualizations, analyze data, and manage data resources. Given the shortage of data scientists and other types of experts, organizations need to devote resources to helping their current personnel develop skills through training and education. Over one-third (36%) indicated that business users’ lack of training is a barrier.
Nearly three-quarters (74%) of research participants said
investment in data preparation was a
priority, with 28% calling it a very high priority
A shortage of skilled personnel continues to be a barrier to improvement
in BI and analytics
tdwi.org 13
Business Drivers and Barriers
A sizeable percentage (46%) said not having adequate budget or resources is a barrier. Although this is always an issue, organizations need to ensure that budget and resources are aligned with their chief business drivers and stated targets for investment, such as advanced analytics and AI. To gain support for budget and resources, there needs to be a strong business case; 31% of participants said that the absence of one is a barrier to improvement. An even larger percentage (42%) cited poorly defined or prioritized project objectives as a barrier to improvement. Project planning is critical especially as the scope broadens and the number of users, data sources, and types of analytics expand. Teams are typically asked to do more with less; this means that good planning and project leadership are critical.
Data governance and security concerns are a barrier. The third-highest number of research participants identified this area as an impediment to improvement (44%). Organizations need effective governance to safeguard sensitive data and meet regulatory requirements. Lack of attention to governance even in the early stages of project development can make the issue an obstacle when it becomes clear that sensitive data could be involved and regulatory infractions could occur. Organizations can also be reluctant to endorse expansion in self-service BI and analytics with less IT oversight because it could trigger governance and security problems. Thus, organizations need to consider governance early and often as they launch cutting-edge BI, analytics, AI, and big data projects.
Problems with distributed data can hinder improvement. In our research, 40% of participants cited data diversity and distribution into silos as a barrier. Indeed, this is a dominant reason why many organizations will try to integrate some or all of their siloed data into a central hub, data lake, data warehouse, or cloud storage system. Then, organizations can query, analyze, and run AI algorithms on larger and potentially more complete volumes of data. Other common motivations for centralizing data include security, governance, quality, and performance. However, data ownership and trust in the centralized data source can become sources of tension that need to be resolved when organizations try to centralize data.
USER STORY DELOITTE DRIVES VALUE THROUGH A STEPWISE APPROACH
The urgency to apply advanced analytics can lead to disappointment if organizations are not prepared. “You can’t go from collecting data to predictive analytics overnight,” said Richard Solari, managing director and the Oracle practice lead for analytics and cognitive computing at Deloitte. He noted that many of Deloitte’s clients want to accelerate their transition from a traditional focus on operational reporting connected to back-office ERP, CRM, and other corporate applications to enterprise analytics involving different types of data and information from many sources. However, “they have a difficult time figuring out how to create that journey.”
Solari recommends a stepwise approach that builds from an integrated data architecture that can handle multiple kinds of workloads rather than from separate, siloed systems. Using solutions such as Oracle’s Advanced Analytics and Oracle Analytics Cloud platforms, Solari has been able to guide companies to turn on different capabilities when they are prepared to use them, including practices for new techniques involving data visualization, predictive analytics, and AI. Then, organizations can add value through enterprise analytics incrementally, with fewer integration issues and in better alignment with business objectives.
Operationalizing projects should be the driving focus, according to Solari. “Isolated data science is not able to do that,” he said. Working off of an integrated platform, either in the cloud or on premises, is key to driving the potential value of advanced analytics and AI across the enterprise, especially to decision makers in operations. Solari advised that an enterprise strategy can help organizations avoid

14
BI and Analytics in the Age of AI and Big Data
redundancy and rework as they build out advanced analytics and AI for additional operations and business functions.
Technology Choices and Satisfaction To gain a baseline understanding of organizations’ technology choices for BI and analytics, we asked research participants which types of technologies they are currently using for BI and analytics and which ones they plan to use in the future (see Figure 2). Spreadsheets are, of course, ubiquitous; 85% are currently using them. To perform calculations, analyze data, and create graphs, spreadsheet users will import data from numerous data sources including other spreadsheets, Internet sources, internal applications, various file systems and databases, and extracts from data warehouses. However, well-documented problems can arise due to the manual and haphazard fashion in which the data is prepared, cleansed, and transformed for personal use. Spreadsheet data chaos is a significant pain point for many organizations.
Which types of technologies are currently in use at your organization to support BI and analytics, and which ones does your organization plan to use?
Spreadsheets 85% 7% 7%
BI platform on premises 82% 8% 6% 4%
Data integration/ETL system 76% 16% 4%4%
Data warehouse or mart on premises 75% 9% 10% 6%
Desktop database 56% 3 28% 13%
Operational data store 54% 20% 12% 14%
OLAP on premises 50% 9% 23% 18%
Cloud data storage (object, file, or block) 30% 32% 21% 17%
BI platform in the cloud 30% 38% 24% 8%
Data virtualization or federation 28% 32% 21% 19%
In-memory database 27% 30% 23% 20%
Data lake on premises (e g , Hadoop or Spark cluster) 25% 23% 36% 16%
Hadoop- or Spark-native BI platform 24% 28% 35% 13%
Search 24% 30% 22% 24%
NoSQL database (e g , key value or graph) 22% 27% 31% 20%
Data warehouse or mart in the cloud 22% 41% 27% 10%
OLAP in the cloud 14% 28% 35% 23%
Data lake in the cloud 13% 39% 30% 18%
Hadoop- or Spark-native OLAP 12% 26% 41% 21%
Figure 2. Based on answers from 238 respondents. Ordered by highest percentage currently using.
Spreadsheets are ubiquitous, but nearly
as many are using a BI platform on
premises; 30% are using one in the cloud
Currently using
Planning to use
Not using and no plans to use
Don't know or N/A

tdwi.org 15
Technology Choices and Satisfaction
Nearly the same percentage of research participants said a BI platform on premises is currently in use in their organizations (82%). This shows a significant level of BI penetration beyond what TDWI research has found in past years. Looking at other BI platform options, nearly a third (30%) said that a BI platform in the cloud is currently in use and 38% indicate plans to use this option in the future (24% are not using it and have no plans to do so). With applications moving to cloud-based platforms and more data generated and stored in the cloud, it makes sense that BI would migrate there as well.
Figure 2 shows that 30% are currently using cloud data storage (either object, file, or block) for BI and analytics and 32% plan to use it in the future. Previous TDWI research has found that the biggest attractions of using the cloud for BI and analytics are scalability, flexibility, cost reduction, and speed of deployment.
Online analytical processing (OLAP) today is often integrated with BI solutions to provide multidimensional analysis capabilities that would be difficult or impossible with standard SQL using tabular structures. Half (50%) of research participants are using OLAP solutions on premises; just 14% said they are using OLAP in the cloud, although double that percentage (28%) said they are planning to use it. Our research could suggest that some organizations are reticent about moving OLAP to the cloud due to performance concerns having to do with aggregating large amounts of data over networks for use in cloud-based OLAP cubes and with query processing.
Search is currently used by 24% of research participants for BI and analytics, and 30% plan to use it. Search is an important means for particularly nontechnical users to explore and interact with data and content more easily without having to write queries or programs. Search and supporting taxonomies also help users integrate related contextual information into their analysis of the numbers. In this way, users can gain a broader understanding of factors contributing to why, for example, sales results are lower or higher than expected. They can combine search and other types of analysis to uncover patterns, trends, and correlations.
With the development of open source OLAP projects such as Apache Kylin and commercial solutions built using this and proprietary technologies, OLAP methods and capabilities can now work on Hadoop and Spark clusters. Our research shows that current use of Hadoop- or Spark-native OLAP is low—just 12%, with 41% indicating no plans for it. However, about one-quarter (26%) of research participants said they do plan to use Hadoop- or Spark-native OLAP in the future. Somewhat similar percentages currently use and plan to use more established NoSQL databases such as key value or graph; 22% currently use them and 27% plan to do so.
Many plan to use a data warehouse or data lake in the cloud. TDWI research finds that future growth in cloud-based data warehouses and data marts should be strong. While Figure 2 shows that just 22% are using this mode today (compared with 75% using a data warehouse or mart on premises), 41% plan to use the cloud for data warehousing or data marts in the future. These percentages are about the same across organizations of all sizes. As noted earlier, flexibility, cost reduction, and speed are key drivers behind the move to the cloud. Cloud data warehouse platform providers continue to add automation to make it even faster and easier to set up and administer systems in the cloud to meet dynamic business needs.
Our research finds that almost the same percentage (39%) are planning to use a data lake in the cloud; 13% are using one right now, compared with 25% currently using a data lake on premises and 23% planning to use one. Data lakes are collections of many types of data, including relational data but also often large volumes of nonrelational, unstructured data.
Search can help users find data and integrate contextual information
Forty-one percent of respondents plan to use the cloud for data warehousing or data marts in the future

16
BI and Analytics in the Age of AI and Big Data
Organizations need not one but various methods to explore, catalog, query, visualize, and analyze what is in their data lake, which has generated competition among software vendors to provide solutions. Many of these are now available for both on-premises as well as cloud-based data lakes and data warehouses, although some solutions are considered “cloud-native” because they were created exclusively for use in the cloud and apply cloud-based technologies and methods such as serverless, containerized, microservices-oriented development and deployment.
Initiatives for Improving User SatisfactionJust as technology solutions continue to evolve, so do user requirements. At first, basic user needs for data access and a decent selection of visualizations can be satisfied by simple dashboards. Then, users begin to demand access to additional data sources and deeper exploration capabilities. To achieve richer and timelier insights, users want faster data refresh, a bigger library of visualizations, mobile access, and fuller capabilities for search and NLP.
We asked research participants what steps their organizations are taking to increase user satisfaction with BI and analytics tools and applications (no figure shown for this survey question). The top choice is to increase overall self-service functionality (71%). However, when we look at specific types of self-service functionality, the percentages are somewhat lower. Just under half of research participants (46%) said their organizations broaden data visualization options. The trend in leading solutions is to offer larger and more extensible visualization libraries, but it appears that not all organizations are taking advantage of them.
In addition, only 36% of participants said their organizations enable users to add or blend data they choose, which suggests that data preparation and integration aspects of self-service functionality are lagging. Previous TDWI research found that although self-service data preparation is a rising trend, IT still plays a dominant role in preparing and integrating data for users. However, this can mean that users must wait for IT personnel to help them add or blend new data, which slows users’ path to insights.
Automated insight discovery and user recommendations are popular. Organizations generally want to make it easier and faster for less-technical business users and analysts to gain value from data. AI is emerging as the core technology behind providing such capabilities. BI and analytics solutions can employ machine learning to explore big data automatically and spot trends and patterns that users working with standard querying and reporting capabilities would not have seen. With AI, BI and analytics solutions can learn what types of insights are important to users’ roles in business operations and processes and make recommendations for appropriate data sets, visualizations, and analytics models.
Our research finds that 42% of organizations are seeking to improve user experiences by automating discovery of data insights and 26% are using AI to provide user recommendations. Enabling users to ask questions of the data in their natural language can also make it easier and faster to get answers; however, our research finds that just 17% of research participants identified this as a step their organizations are currently taking to increase user satisfaction.
Trusted, governed, and refreshed data can boost user satisfaction. BI and analytics often succeed or fail with the quality and timeliness of the data. About half of organizations surveyed (49%) see giving users trusted and governed data as vital to their satisfaction. This result highlights the importance of data quality, completion, and other preparation processes to making BI and analytics successful. Governance, along with ensuring regulatory adherence, is also vital to setting and maintaining standards for data quality so that decision makers can trust the data.
About four in ten firms surveyed are seeking to
improve user experiences by automating discovery
of data insights
tdwi.org 17
Technology Choices and Satisfaction
Our research finds that in a significant percentage of organizations, users also want timelier data; 40% of research participants said that refreshing data more frequently is important to user satisfaction. Often driving the need for fresher data is the expansion of BI and analytics into operational scenarios where managers need to view and analyze near-real-time data to respond to events or make adjustments based on changes in supply and demand.
Exploration and analytics of big data sources is important. Although traditional BI and data warehousing platforms continue to be the most prevalent, TDWI finds that interest is growing in data interaction with the contents of Hadoop or Spark clusters and cloud-based storage. One-quarter (25%) of research participants said their organizations are increasing user satisfaction by enabling users to explore and analyze Hadoop or Spark data. Nearly as many (22%) said enabling users to do so with cloud-based data is a step their organizations are taking to increase user satisfaction.
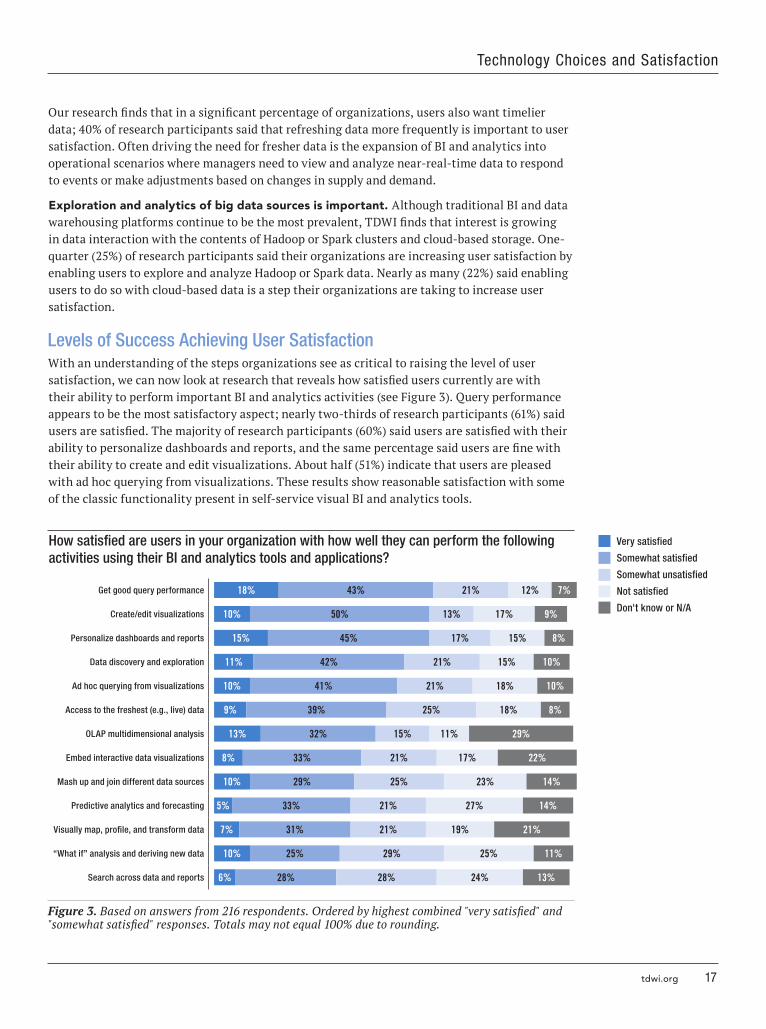
Levels of Success Achieving User SatisfactionWith an understanding of the steps organizations see as critical to raising the level of user satisfaction, we can now look at research that reveals how satisfied users currently are with their ability to perform important BI and analytics activities (see Figure 3). Query performance appears to be the most satisfactory aspect; nearly two-thirds of research participants (61%) said users are satisfied. The majority of research participants (60%) said users are satisfied with their ability to personalize dashboards and reports, and the same percentage said users are fine with their ability to create and edit visualizations. About half (51%) indicate that users are pleased with ad hoc querying from visualizations. These results show reasonable satisfaction with some of the classic functionality present in self-service visual BI and analytics tools.
How satisfied are users in your organization with how well they can perform the following activities using their BI and analytics tools and applications?
Get good query performance 18% 43% 21% 12% 7%
Create/edit visualizations 10% 50% 13% 17% 9%
Personalize dashboards and reports 15% 45% 17% 15% 8%
Data discovery and exploration 11% 42% 21% 15% 10%
Ad hoc querying from visualizations 10% 41% 21% 18% 10%
Access to the freshest (e g , live) data 9% 39% 25% 18% 8%
OLAP multidimensional analysis 13% 32% 15% 11% 29%
Embed interactive data visualizations 8% 33% 21% 17% 22%
Mash up and join different data sources 10% 29% 25% 23% 14%
Predictive analytics and forecasting 5% 33% 21% 27% 14%
Visually map, profile, and transform data 7% 31% 21% 19% 21%
“What if” analysis and deriving new data 10% 25% 29% 25% 11%
Search across data and reports 6% 28% 28% 24% 13%
Figure 3. Based on answers from 216 respondents. Ordered by highest combined "very satisfied" and "somewhat satisfied" responses. Totals may not equal 100% due to rounding.
Very satisfied
Somewhat satisfied
Somewhat unsatisfied
Not satisfied
Don't know or N/A

18
BI and Analytics in the Age of AI and Big Data
Research participants indicate lower user satisfaction with advanced analytics processes. Almost half (48%) are unsatisfied with predictive analytics and forecasting; 38% are satisfied (just 5% are very satisfied). More than half (54%) indicated user dissatisfaction with how well they can do “what if” analysis and derive new data; 35% are satisfied. The ability to search across data and reports is also not a strength for most surveyed organizations’ users; 52% are unsatisfied while 34% are satisfied (just 6% are very satisfied).
Part of the reason for the lack of satisfaction could be the middling results we see for data pipeline and preparation procedures needed for analytics. Nearly half (48%) of research participants indicate that users in their organizations are unsatisfied with capabilities for doing mashups and joining different data sources. Users who want flexibility in how they compose data sets for analytics are demanding these capabilities.
Just over a third (38%) said their users are able to visually map, profile, and transform data—important data preparation capabilities that are integrated with some self-service BI and analytics solutions—but about the same percentage (40%) said users are not satisfied with their ability to take these steps.
Nearly half (48%) of respondents said their users are satisfied with their access to the freshest (e.g., live) data, but 43% said users are unsatisfied. These results suggest there is room for improvement in data preparation and integration especially where fresher data is critical.
USER STORY TRAVEL AGENCY ALIGNS DATA SOLUTIONS WITH CUSTOMER BENEFITS
“If you’re not working on something cutting edge, you can’t keep or attract talent,” said the director of the global data platform at a major business travel agency. “However, if there’s no business value, no one has time to just play around with ‘resume-driven designs.’ There has to be a business need.”
The agency, which could not be named, supports corporate customers through a business travel management platform. The platform offers reporting dashboards and visualizations for customers, which puts pressure on the company to have outstanding data quality. “If there’s bad data, it shows up fast,” said the director.
The group has to reconcile many types of data from different sources. Although the company may not have big data as it’s defined in the industry, it has embraced the data lake concept as an operational data store in its architecture to provide fast access to raw, primarily transactional data. The global data platform needs to support programs such as traveler risk management, which relies on highly timely data. The company also uses the platform to support data science teams working on AI. An important business focus for its data scientists is providing customers with recommendations and services such as preloaded information about preferred hotels based on a client’s preferences. With a strong focus on tangible benefits, the company is bringing cutting-edge data science and data management together to increase customer satisfaction.
Almost half of firms surveyed indicate
dissatisfaction with advanced analytics
processes; problems with data preparation
could be to blame
tdwi.org 19
Strategies for Augmentation and Replacement
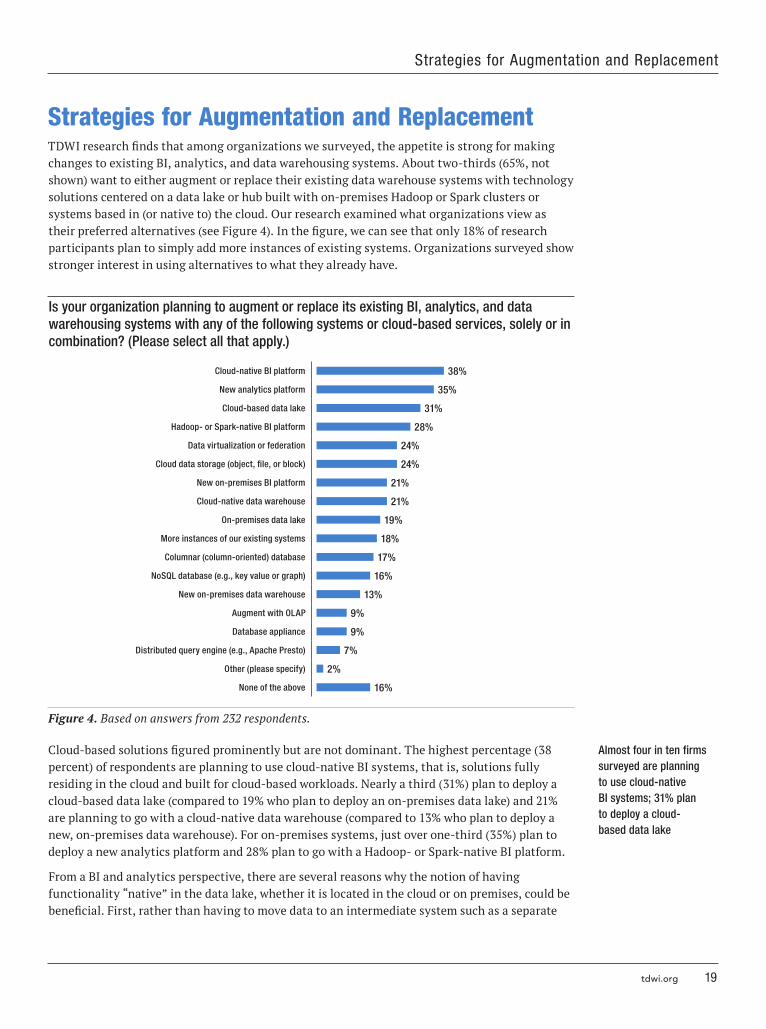
Strategies for Augmentation and Replacement TDWI research finds that among organizations we surveyed, the appetite is strong for making changes to existing BI, analytics, and data warehousing systems. About two-thirds (65%, not shown) want to either augment or replace their existing data warehouse systems with technology solutions centered on a data lake or hub built with on-premises Hadoop or Spark clusters or systems based in (or native to) the cloud. Our research examined what organizations view as their preferred alternatives (see Figure 4). In the figure, we can see that only 18% of research participants plan to simply add more instances of existing systems. Organizations surveyed show stronger interest in using alternatives to what they already have.
Is your organization planning to augment or replace its existing BI, analytics, and data warehousing systems with any of the following systems or cloud-based services, solely or in combination? (Please select all that apply )
Cloud-native BI platform 38%
New analytics platform 35%
Cloud-based data lake 31%
Hadoop- or Spark-native BI platform 28%
Data virtualization or federation 24%
Cloud data storage (object, file, or block) 24%
New on-premises BI platform 21%
Cloud-native data warehouse 21%
On-premises data lake 19%
More instances of our existing systems 18%
Columnar (column-oriented) database 17%
NoSQL database (e g , key value or graph) 16%
New on-premises data warehouse 13%
Augment with OLAP 9%
Database appliance 9%
Distributed query engine (e g , Apache Presto) 7%
Other (please specify) 2%
None of the above 16%
Figure 4. Based on answers from 232 respondents.
Cloud-based solutions figured prominently but are not dominant. The highest percentage (38 percent) of respondents are planning to use cloud-native BI systems, that is, solutions fully residing in the cloud and built for cloud-based workloads. Nearly a third (31%) plan to deploy a cloud-based data lake (compared to 19% who plan to deploy an on-premises data lake) and 21% are planning to go with a cloud-native data warehouse (compared to 13% who plan to deploy a new, on-premises data warehouse). For on-premises systems, just over one-third (35%) plan to deploy a new analytics platform and 28% plan to go with a Hadoop- or Spark-native BI platform.
From a BI and analytics perspective, there are several reasons why the notion of having functionality “native” in the data lake, whether it is located in the cloud or on premises, could be beneficial. First, rather than having to move data to an intermediate system such as a separate
Almost four in ten firms surveyed are planning to use cloud-native BI systems; 31% plan to deploy a cloud-based data lake

20
BI and Analytics in the Age of AI and Big Data
data warehouse, ETL, BI, or OLAP system before users can view and analyze the data, users can instead access the data where it resides, significantly reducing latency and IT overhead and costs.
Second, with traditional systems, to cut down on data movement and for performance reasons usually only a sample or extract of the data is made available to users in an intermediate cube, data mart, or similar system. If the BI and analytics capabilities reside natively within the data lake system, users can potentially access all the relevant data for which they have permission. This can make it easier for users and data scientists to gain combined views of different types of data, such as marketing and sales data, rather than having to look at them in separate silos. Finally, Hadoop or Spark clusters run on massively parallel processing (MPP) systems, which means that by running BI and analytics applications natively, they can take greater advantage of the clusters’ scalable computing power.
Direct access to big data via SQL-on-Hadoop engines or native BI systems has been maturing in recent years with solutions enabling an increasing number of business users to create visualizations and perform analysis of big data with SQL. In Figure 5, we can see that in 21% of organizations surveyed, users can currently access and query data on Hadoop and Spark clusters directly rather than only by moving the data from those systems to a separate data warehouse or other intermediate system. The same percentage of organizations (21%) plan to enable users to do this using SQL-on-Hadoop/Spark, Hadoop/Spark-native BI, or similar technology that enables direct SQL interaction with big data rather than having to use MapReduce, Java, Python, or other programs.
Another 14% expressed that users are interested in SQL-based access to Hadoop and Spark systems (or BI capabilities natively on those platforms), but their organizations have no current plans to employ these technologies. Just under one-quarter (22%) indicate no plans or interest whatsoever.
Are users in your organization currently able to access and query data on Hadoop or Spark clusters directly using SQL-on-Hadoop/Spark, Hadoop/Spark-native BI, or other technology? Does your organization plan to enable this in the near future?
Yes, users can currently do this 21%
Not yet, but we plan to enable this 21%
No current plans, but users are interested 14%
Users access only pre-aggregated and pre-calculated data 10%
No plans or interest in enabling this capability 22%
Don’t know/NA 12%
Figure 5. Based on answers from 228 respondents.
The majority do not plan to use alternative database systems. The big data era brought in a wave of NoSQL alternatives to standard relational database systems. Key-value store (or database) systems, for example, enable organizations to avoid having to conform highly varied big data to predefined relational schemas and data structures. Graph databases enable organizations to more easily store not just data but also data relationships. Using graph theory concepts of data nodes (entities), edges (the relationships), and properties of the nodes, graph databases can speed understanding of data linkages. Complex data sets, for which it is essential to store and analyze hierarchical and many-to-many relationships, are often candidates for
Only 16% are planning to use NoSQL databases,
which can be important for use cases not well
served by traditional relational systems

tdwi.org 21
Strategies for Augmentation and Replacement
graph database implementations. Graph databases generally require specialized languages or SQL extensions to retrieve the data.
Referring back to Figure 4, our research finds that just 16% of organizations surveyed plan to use NoSQL databases. Of course, showing a smaller percentage than alternatives does not negate the importance of NoSQL database technologies. The results merely indicate that their use is more specialized than that of broadly applicable solutions. A similar percentage plans to use columnar (or column-oriented) databases (17%), which store data in columns rather than rows. Again, although evidently not the choice for the majority of scenarios, columnar databases, a variation on standard relational database systems, have been in use for many years to improve the performance efficiency of data retrieval for BI and analytics.
Open Source Options for BI, Analytics, and Data ManagementOpen source projects continue to spawn key innovations in all areas of software and systems, including for BI, analytics, and data management. The Hadoop and Spark ecosystems, which developed out of a series of Apache Software Foundation projects, now include technologies and frameworks that can either augment or supplant traditional BI and data warehousing technologies.
In many cases, an initial attraction was as low-cost, do-it-yourself alternatives to solutions perceived as too expensive or complicated. However, the other powerful attraction was the innovation they brought, enabling organizations to do what they could not do with traditional technologies—as long as they had the necessary skilled personnel available.
TDWI asked research participants which open source technologies and frameworks, if any, are currently in use by their organizations for BI, analytics, and supporting data management and data integration (see Figure 6). The largest percentage said “none of the above” (37%)—a reminder that despite the hype, not all organizations are using open source technologies for these types of systems.
Nearly one-third (31%) said their organizations are implementing MySQL, an open source RDBMS under the terms of the GNU General Public License. Oracle now owns MySQL AB, the Swedish company that created MySQL, the first version of which was introduced over two decades ago. Oracle supports the open source MySQL Community Server and offers a proprietary Enterprise Server. PostgreSQL, another established open source RDBMS that is often embedded in larger systems, is used by 17% of research participants.
The initial attraction of open source was as a low-cost, do-it-yourself alternative solution

22
BI and Analytics in the Age of AI and Big Data
Which open source technologies and frameworks, if any, are currently in use in your organization for BI, analytics, and supporting data management and integration?
MySQL 31%
Apache Hive 29%
Apache Spark 28%
Apache Hadoop/HDFS 26%
Apache Kafka 20%
PostgreSQL 17%
Apache Sqoop 15%
Apache HBase 14%
Apache Impala 14%
Apache MapReduce 14%
Apache Cassandra 9%
Apache Pig 6%
Apache Solr 5%
Apache Presto 5%
Apache Drill 5%
Other (please specify) 4%
Apache Hawq 2%
Apache Kylin 1%
None of the above 37%
Figure 6. Based on answers from 222 respondents, who could select all that applied.
Nearly as many research participants (29%) said their organization uses Apache Hive, a data warehouse infrastructure built on top of Hadoop that includes HiveQL, a SQL dialect. Hive’s development embodied the big data, schema-on-read model. This model has been a key differentiator of the Hadoop platform versus traditional relational data warehouses that use a schema-on-write model, which ensures data consistency but makes it difficult to incorporate new data about which too little is known to apply an existing schema or plan. Schema-on-read allows organizations to ingest data and then determine its structure and organization later to fit the analytics purpose. HBase, an open source, column-oriented, key-value data store that runs on top of the Hadoop Distributed File System (HDFS), is used by 14% of organizations surveyed.
We find it interesting that the percentage using Spark, a unified, in-memory analytics engine for large-scale data processing, is slightly higher than the percentage using the older and more established Hadoop/HDFS (28% to 26%, respectively). However, a head-to-head comparison is not fair; Spark can also run on HDFS and YARN.
Perhaps a more accurate comparison is with the increasingly legacy technology MapReduce, which only 14% of organizations surveyed are using. Spark offers real-time (or “fast batch”), in-memory data processing that is much faster than Hadoop/MapReduce, making it attractive for interactive BI and analytics querying (with SparkSQL, but also supportive of other SQL engines), AI/machine learning algorithms, and streaming workloads. Spark’s architecture consists of a core engine and set of libraries to support different workloads. However, comparisons are still not one-to-one; Spark is not a drop-in replacement for MapReduce and unlike Hadoop/MapReduce can only provide access to some of the data some of the time in a typically massive data lake.

tdwi.org 23
Other open source technologies in Figure 6 are in use by smaller percentages of organizations surveyed. As we noted earlier with NoSQL databases, just because they are not being used by large percentages of organizations surveyed does not mean they are unimportant. It may reflect where they are in the maturity process compared to more established technologies for BI, analytics, data management, and data integration.
Strategies for Faster and Fresher DataSpeed is a business advantage. Organizations are pursuing a range of technologies to provide BI and analytics users, machine learning algorithms, and automated decision management systems with fresher data and more frequent updates. These steps include access to live data and real-time data streams from the Internet of Things (IoT), mobile devices, and other machine data sources. Traditionally, BI and data warehousing have focused on historical data only, giving organizations a view of what happened in the past. However, demand is rising for systems that can provide views, analytics, and prescriptive recommendations based on data generated by events happening now and predictive insights into what could happen in the future.
TDWI examined what technologies organizations are using to make data (including data streams) available sooner for BI, analytics, and AI/machine learning (see Figure 7). The largest percentage are using a data warehouse and/or data mart (63%), which for many of these organizations could be another way of saying that most organizations are using their existing platform and various complementary technologies to provide fresher data. These include an operational data store (ODS), which 36% of organizations surveyed are using. An ODS typically collects, integrates, and prepares transaction data from one or more OLTP or other production business application systems. It can be a staging area for the data warehouse and also provide immediate data access for operational reporting when users require near-real-time data.
Which technologies are in use by your organization to make data (including data streams) available sooner for BI, analytics, and AI/machine learning?
Data warehouse and/or data mart 63%
BI/analytics access to live data 42%
Operational data store 36%
Data lake 30%
Change data capture 25%
Apache Kafka 23%
In-memory analytics 21%
Data virtualization or federation 18%
In-memory database 17%
Apache Spark Streaming 16%
Complex event processing 10%
Other Apache open source (e g , Apex, Flume, or Storm) 8%
Commercial message-oriented middleware 8%
Other (please specify) 3%
Figure 7. Based on answers from 220 respondents, who could select all that applied.
The majority of organizations surveyed are relying on their data warehouse or data mart to make data available sooner
Strategies for Augmentation and Replacement

24
BI and Analytics in the Age of AI and Big Data
Change data capture (CDC) is also an important technology for identifying and capturing changes to data and data structures in production databases as they occur during a given time period, which could be seconds. Then, replication software copies the changes to a data repository such as a data warehouse. CDC systems can use triggers and stored procedures, redo log readers, or publish/subscribe models to make the change data available to BI systems and applications. CDC can help organizations be more efficient in query processing and avoid slowing down production workloads to field complex analytics queries. One-quarter (25%) of organizations surveyed are using CDC.
Significant percentages are using data lakes, in-memory analytics, and data virtualization. Many organizations are using newer or specialized technologies, such as data lakes (30%), in-memory analytics (21%), and data virtualization or federation (18%). The key role of the data lake is to collect raw, natively formatted data in a central repository, which is a step toward reducing the time it would otherwise take to access the data from each source, one at a time. Some organizations will spend more resources preparing the data and will use the data lake (or a portion of it) as an ODS for repeatable analytics and reporting.
In-memory computing and analytics can significantly reduce the need to read data stored on disk for most queries, enabling users to access data faster. Analytics and machine learning processes, which tend to be highly iterative, can perform faster when they only have to access data in memory. Of course, a challenge with in-memory systems is refreshing the data held in memory.
Data virtualization alternatives offer a variety of advantages. They can provide a layer that improves consistency and simplifies access security for multiple underlying sources. Users can access sources without having to know the intricacies of manipulating data in each underlying data source. Data virtualization can reduce the user’s query preparation time by delivering a single point of access to multiple sources. However, as we can see with the somewhat low percentage using data virtualization (18%), most organizations either use it for specialized scenarios or have not yet introduced it into their data architecture.
Streaming real-time data offers value for BI and analytics. Many firms want to tap real-time data streams generated by such sources as e-commerce, social media, mobile devices, and IoT sources. In many cases, the requirement is to stream data as it is generated straight into a data lake, which will be analyzed once at rest. However, other firms want to apply real-time “stream” analytics to data in motion before—or instead of—landing it in a repository so they can analyze and act on it automatically in real time.
Stream analytics is about applying statistical models, algorithms, or other analytics practices to data that arrives continuously, often as an unbounded sequence of instances. By running predictive models on these flows, organizations can monitor events and processes and become more situationally aware. Organizations can be proactive in spotting trends, patterns, correlations, and anomalous events and respond as they are happening. They can filter data for relevance and enrich the quality of data flowing in real time with information from their other sources.
Most streaming platforms operate similarly to publish-and-subscribe message queues (only 8% of research participants said their organization is using commercial message-oriented middleware). Streaming platforms can also store, manage, and process streams of records. Open source projects such as Apache Kafka, used by 23% or organizations surveyed, and the Apache Spark Streaming library, used by 16%, are playing a critical role in advancing stream analytics and reporting.
Data lakes are in use by 30% of
organizations surveyed, and 21% are using
in-memory analytics
Streaming analytics focuses on gaining
value from data arriving continuously; 23% are
using Apache Kafka and 16% are using Apache
Spark Streaming

tdwi.org 25
Kafka began as a messaging queue but has evolved into a fuller distributed streaming platform capable of handling very large numbers of events. Organizations are using Kafka to build streaming data pipelines that can support applications that must react in real time or provide real-time insights to decision makers. Kafka can be a source for Spark Streaming; this module allows organizations to integrate different workloads, including streaming, on the same Spark processing platform, significantly reducing programming and modeling complexity.
Plans for Using AI and Machine Learning AI, machine learning (ML), and natural language processing (NLP) techniques and technologies are rapidly finding their way into BI and analytics solutions as well as data management and data integration systems. Most business users are unlikely to work directly with AI technologies, but AI will be embedded inside solutions to augment how they explore, select, and blend data sets, pose queries and natural language questions, build visualizations, and even draw conclusions to aid decision making. With ML inside solutions, business users will be able to explore much larger and more detailed data sets to uncover patterns and trends sooner; some solutions will save users the trouble of exploring data and develop insights automatically, offering users recommendations for action or further inquiry.
Organizations are likely to find that users who do not have AI capabilities will feel at a disadvantage and want them; this means that organizations need to plan for growth. The use of AI will alter how users interact with data in analytics to support decisions. Finally, as organizations grow their teams of data scientists, who will be working directly with AI techniques and technologies to build models and algorithms, they need to prepare for new demands on data preparation, processing, and management. Organizations will need to address bottlenecks in workflows for moving AI and ML models from testing into production.
TDWI asked research participants if their organizations have an overall strategy for how they will adopt AI technologies and practices such as machine learning to augment BI, analytics, data management, and data integration. About one-quarter (24%, no figure shown for this survey question) said they do have an overall strategy and are following it. Slightly more participants (26%) said their organizations do not have an overall strategy but that individual departments are adopting and building AI/ML. Although this posture does free departments and functions to experiment and apply AI/ML as they see fit, it can expose the organization as a whole to governance, data security, and system performance problems. Decentralized AI/ML may also make it more difficult to reduce inefficiencies in moving models and algorithms from test into production.
About one-quarter (24%) of research participants said they do not have an overall strategy for adoption, but if solutions embed AI/ML functionality, they will make use of it. Only a minority (14%) said they did not plan to adopt AI/ML and therefore had no need for a strategy (12% did not know).
Most organizations plan to both build and buy AI/ML solutions. Our research finds that the majority of organizations surveyed (43%) currently or plan to both build and buy AI/ML (see Figure 8). This suggests that most organizations will not be reticent about evaluating commercial, off-the-shelf solutions and those produced by open source or consulting data scientists and developers even as they develop their own specialized ML algorithms and other AI programs to meet business requirements. Nearly one-fifth (17%) do not plan to build or buy AI/ML tools and algorithms; 13% said they will exclusively build their own.
The use of AI will alter how users interact with data in analytics to support decisions
The majority of firms (43%) now or plan to both build and buy AI and machine learning solutions; just 13% plan to exclusively build their own
Plans for Using AI and Machine Learning

26
BI and Analytics in the Age of AI and Big Data
Does your organization currently or plan to build its own AI/machine learning tools and algorithms, buy AI/ML solutions (or applications/services that have AI/ML embedded in them), or both? (Please select the most appropriate answer )
Build our own
Both build and buy43%
Don’t know or N/A
Neither build nor buy
Only buy
17%
7%
20% 13%
Figure 8. Based on answers from 211 respondents.
TDWI also sought to learn how organizations are currently using or plan to use AI/ML to augment BI, analytics, and supporting data integration and management (see Figure 9). More than half of organizations surveyed (54%) said they would use AI/ML to automate discovery of actionable data insights. One of the chief drivers behind AI is to use algorithmic capabilities to mine potentially very large volumes of data and deliver insights to business users without their having to perform manual discovery on their own. In many cases, the goal is to generate recommendations: for actions to take, for other data to examine, or for additional analysis. About four in 10 respondents (42%) are currently using or plan to use AI/ML to augment user decision making by giving recommendations.
Nearly half (47%) of survey participants indicated that their organizations seek to use AI/ML to improve the accuracy and quality of information. This means using smart automation to learn how the data may be inconsistent, incomplete, or in need of enrichment to improve accuracy. This could speed data preparation and quality processes by replacing manual work, which becomes a bottleneck as data volumes and complexity rise. Our research finds that 34% of organizations surveyed are currently using or plan to use AI/ML to improve or automate data preparation, pipelines, and enrichment.
What are the most important ways in which your organization is currently or plans to use AI technologies and techniques such as machine learning to augment BI, analytics, and supporting data integration and management?
Automate discovery of actionable data insights 54%
Improve accuracy and quality of information 47%
Augment user decision making by giving recommendations 42%
Help users find, select, and use data for analysis 38%
Automate data classification for governance and security 35%
Improve/automate data preparation and enrichment 34%
Develop and update data catalog or metadata repository 27%
Automate taxonomy construction 16%
None of the above 21%
Figure 9. Based on answers from 206 respondents, who could select all that applied.
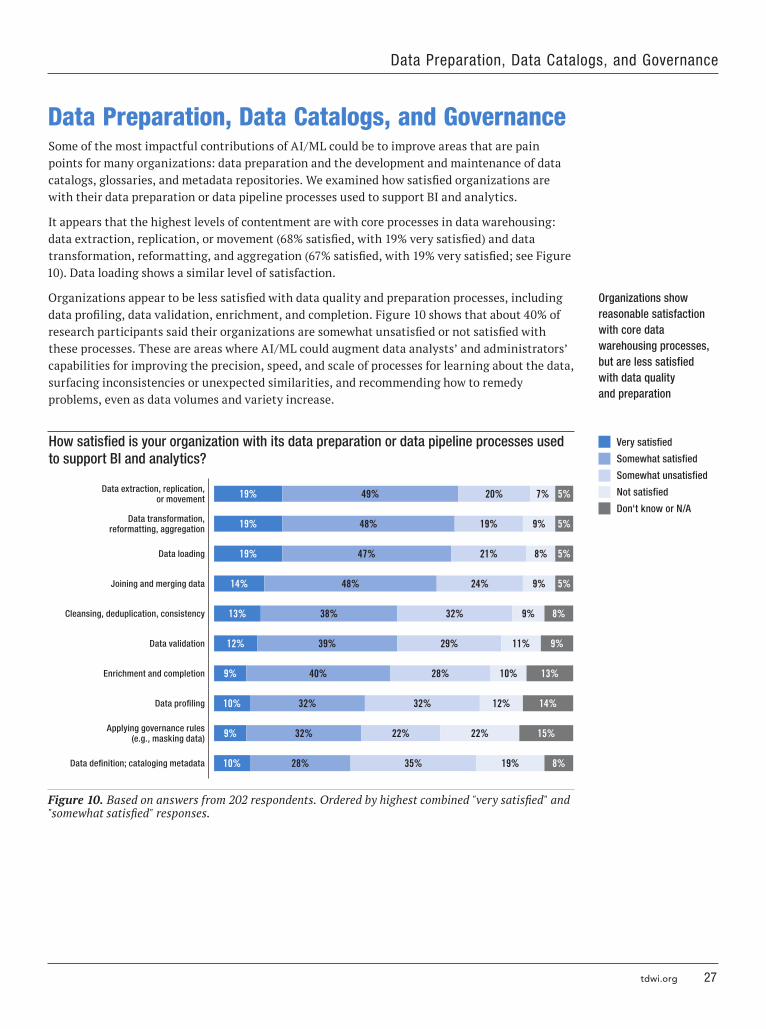
tdwi.org 27
Data Preparation, Data Catalogs, and GovernanceSome of the most impactful contributions of AI/ML could be to improve areas that are pain points for many organizations: data preparation and the development and maintenance of data catalogs, glossaries, and metadata repositories. We examined how satisfied organizations are with their data preparation or data pipeline processes used to support BI and analytics.
It appears that the highest levels of contentment are with core processes in data warehousing: data extraction, replication, or movement (68% satisfied, with 19% very satisfied) and data transformation, reformatting, and aggregation (67% satisfied, with 19% very satisfied; see Figure 10). Data loading shows a similar level of satisfaction.
Organizations appear to be less satisfied with data quality and preparation processes, including data profiling, data validation, enrichment, and completion. Figure 10 shows that about 40% of research participants said their organizations are somewhat unsatisfied or not satisfied with these processes. These are areas where AI/ML could augment data analysts’ and administrators’ capabilities for improving the precision, speed, and scale of processes for learning about the data, surfacing inconsistencies or unexpected similarities, and recommending how to remedy problems, even as data volumes and variety increase.
How satisfied is your organization with its data preparation or data pipeline processes used to support BI and analytics?
Data extraction, replication, or movement 19% 49% 20% 7% 5%
Data transformation, reformatting, aggregation 19% 48% 19% 9% 5%
Data loading 19% 47% 21% 8% 5%
Joining and merging data 14% 48% 24% 9% 5%
Cleansing, deduplication, consistency 13% 38% 32% 9% 8%
Data validation 12% 39% 29% 11% 9%
Enrichment and completion 9% 40% 28% 10% 13%
Data profiling 10% 32% 32% 12% 14%
Applying governance rules (e g , masking data) 9% 32% 22% 22% 15%
Data definition; cataloging metadata 10% 28% 35% 19% 8%
Figure 10. Based on answers from 202 respondents. Ordered by highest combined "very satisfied" and "somewhat satisfied" responses.
Organizations show reasonable satisfaction with core data warehousing processes, but are less satisfied with data quality and preparation
Very satisfied
Somewhat satisfied
Somewhat unsatisfied
Not satisfied
Don't know or N/A
Data Preparation, Data Catalogs, and Governance

28
BI and Analytics in the Age of AI and Big Data
Data Catalogs: Room for ImprovementAs organizations amass volumes of data on premises and in the cloud, it becomes even more difficult to locate what data or information is valuable, sensitive, or relevant to the questions they need to answer. One solution is a data catalog (or similar resource, such as a metadata repository or business glossary). The increasing volume and variety of data is making data catalogs one of the hottest trends in IT. In Figure 10, the research reveals that more than half of organizations surveyed see room for improvement in how they define data and catalog metadata (54% combined “somewhat unsatisfied” and “not satisfied” responses).
A data catalog can be a kind of Rosetta stone that enables users, developers, and administrators to find and learn about data—and for information professionals to properly organize, integrate, and curate data for users. An up-to-date, comprehensive data catalog can make it easier for users to collaborate on data because it offers agreed-upon data definitions they can use to organize related data and build analytics models.
About one-quarter of organizations we surveyed (24%, not shown) do not have a centralized data catalog, glossary, or metadata repository but said some individual BI systems have them. In interviews, TDWI frequently hears that the problem often is not that organizations lack a data catalog—it’s that they have several of them and cannot coordinate definitions and metadata across them. One-fifth (20%, not shown) of research participants, however, said none of their systems has one.
The development of an enterprise BI and data warehouse architecture is frequently how organizations first establish a shared data catalog or metadata repository; nearly a quarter (24%, not shown) of organizations surveyed said they have one but that it covers only their BI and data warehouse architecture. Although not in the majority, a significant percentage of research participants (18%, not shown) did say that their data catalog, glossary, or metadata repository is for use across multiple data sources.
Not all centralized repositories of knowledge about the data are the same or need to be. TDWI explored what capabilities are most important for organizations to have in a centralized data catalog, glossary, or metadata repository (see Figure 11). The largest percentage of research participants (83%) said that simply making it easier for BI and analytics application users to search for and find data is most important.
More recent solutions in the market are able to employ AI/ML and advanced search to improve the speed and comprehensiveness of efforts to locate data. More than half of participants would like to be able to coordinate data meaning across sources. This capability is critical not only to finding data but also to uncovering and documenting data relationships, often under higher-level master data or objects of interest such as customers or sales.
Making it easier for users to search for and find
data is the top priority for deploying a data catalog, glossary, or metadata repository

tdwi.org 29
For your organization, which of the following capabilities are most important to have in a centralized data catalog, glossary, or metadata repository?
Make it easier for users to search for and find data 83%
Improve data governance, security, and regulatory adherence 61%
Coordinate data meaning across sources 57%
Ability to centrally monitor data usage and lineage 51%
Ability to inventory data assets 50%
Improve data preparation and data pipelines 47%
Support development of AI/machine learning 31%
Consolidate multiple, smaller data catalogs and glossaries 30%
Other (please specify) 1%
Figure 11. Based on answers from 206 respondents, who could select all that applied.
Data catalogs can be beneficial to data preparation. Almost half of research participants (47%) said it was important for this centralized resource to improve data preparation and data pipelines. A resource that provides complete and up-to-date knowledge about data and how to find it is invaluable to these processes. Data pipelines, especially when developed to support streaming analytics and real-time BI reporting, need access to data catalogs and metadata repositories to eliminate confusion about data definitions, which can introduce latency and lead to a lack of trust in reports and analytical insights.
The results shown in Figure 11 reveal the importance of the data catalog, glossary, or metadata repository to data governance. Almost two-thirds of organizations surveyed (61%) note that they would like to see this resource used to improve data governance, security, and regulatory adherence. Data preparation and cataloging tools can help organizations’ governance by providing capabilities such as automated tagging and the ability to track data lineage—that is, how the data has been used and transformed and by whom.
Half (50%) of research participants also noted that it is important for data catalogs to help them inventory their data assets, which is critical to governance and regulatory adherence. To comply with data privacy regulations such as the European Union’s General Data Protection Regulation (GDPR), organizations need to undertake a thorough inventory of their data across all platforms.
Improving Confidence in Data GovernanceGovernance rules and policies spell out how an organization protects sensitive data assets and meets regulatory requirements. Many organizations join governance with data stewardship, which focuses on improving data quality and guiding users to work with trusted and relevant data in their analytics and visualizations (such as dashboards).
As BI, analytics, and data systems become more diverse and distributed, governance becomes an ever-greater challenge. Some organizations seek to centralize at least their most sensitive data, such as customer data, in a secure data warehouse or data lake to make it easier to govern. However, the reality is that most organizations will have multiple systems and platforms and must ensure that governance and stewardship address this reality.
To improve governance, some organizations seek to centralize at least their most sensitive data
Data Preparation, Data Catalogs, and Governance

30
BI and Analytics in the Age of AI and Big Data
We asked research participants how confident their organizations are in their ability to apply governance rules and policies to a range of BI, analytics, and data management and data integration systems (see Figure 12). The highest confidence level is with the data warehouse on premises; 67% are either very confident or somewhat confident in their governance of this resource. It is more straightforward to monitor the data and its access and create a security perimeter around a centralized resource such as a data warehouse.
How confident is your organization in its ability to apply governance rules and policies to the following BI, analytics, and data management and integration systems?
Data warehouse on premises 31% 36% 12% 4% 17%
BI or OLAP on premises 23% 37% 14% 5% 21%
Data marts on premises 28% 31% 14% 7% 20%
Spreadsheets 20% 26% 20% 20% 14%
Cloud data storage (object, file, or block) 13% 30% 13% 10% 34%
AI/machine learning processes 10% 29% 15% 12% 34%
Data warehouse in the cloud 8% 31% 16% 10% 35%
Data lake on premises 14% 24% 15% 7% 40%
Data marts in the cloud 8% 29% 15% 11% 37%
BI or OLAP in the cloud 8% 29% 14% 10% 39%
Streaming data (e g , IoT) 10% 23% 16% 9% 42%
Data lake in the cloud 8% 20% 16% 12% 44%
Figure 12. Based on answers from 198 respondents. Ordered by highest combined "very confident" and "somewhat confident" responses.
A data lake can also be a centralized resource, but organizations surveyed are considerably less confident in governing their on-premises data lake; 38% are either very confident or somewhat confident (40%, however, either don’t know or find the question about this category not applicable, which suggests that they do not have a data lake). This could be because tools and practices for governing and securing a data lake are less mature.
Figure 12 shows that confidence in governance for systems in the cloud generally is below that of on-premises systems. Under half (43%) are confident in their ability to apply governance to cloud data storage, with only 13% very confident; just 8% are very confident in their governance of a data warehouse in the cloud and 31% are somewhat confident (noting that 35% don’t know or find this not applicable). Clearly, as organizations turn to the cloud for both front-end BI and analytics and back-end data platforms, they need to prioritize governance concerns.
Organizations need better governance of BI, OLAP, data marts, and AI/ML. On-premises BI or OLAP and data marts show fairly good percentages of research participants confident in data governance, with 60% and 59%, respectively, but these numbers should be better. The confidence level dips down for these systems in the cloud (to 37% for both), although about the same percentages either don’t know or find this category not applicable.
Very confident
Somewhat confident
Not too confident
Not at all confident
Don't know or N/A
Less than half of organizations surveyed
are confident in their governance of AI/ML
processes

tdwi.org 31
Organizations need to focus on improving their governance of BI, OLAP, and data marts, particularly those based in the cloud. Interestingly—but perhaps not surprisingly—less than half of research participants (46%) are confident in their governance of the ubiquitous spreadsheets, which are notoriously difficult to govern both on users’ personal desktop computers and when they are shared.
Less than half of organizations surveyed (39%) are confident in their governance of AI/ML processes. As organizations expand their use of AI/ML, they will need to develop governance policies and rules that address privacy concerns with use of personally identifiable information (PII) about customers, patients, and other human engagement.
At the same time, however, organizations can use AI/ML to improve governance; recall that in Figure 9, TDWI found that 35% of research participants are either currently using or plan to use AI/ML to automate data classification for governance and security. Some organizations (16%) are also using or plan to use AI/ML to automate taxonomy construction, which would be valuable to improve content discovery, search, and NLP implementations for all use cases, including governance of content.
USER STORY INVESTMENTS FIRM BRINGS COHERENCE TO ETL AND DATA INTEGRATION
As interactive reporting and analytics increase in organizations, extract, transform, and load (ETL) processes can become major pain points. Everyone wants data the way they need it, which can mean that siloed ETL processes proliferate. Established organizations typically have legacy processes and systems, so new applications and processes often have to fight for computing time with the older ones. New APIs for integrating data flows can themselves become part of the problem if it’s difficult to find them and few really know what they do. Thus, unless attention is paid to improving management of ETL, data integration, and extract, load, and transform (ELT) processes for data lake development, costs and inefficiencies will rise. Organizations can become mired in data quality and performance problems.
One major global investments company is addressing ETL and data integration challenges by providing an internal cloud-based service that improves standardization and centralization. Using Pentaho Data Integration from Hitachi Vantara, the company is pursuing an alternative to disparate teams of developers creating single-purpose ETL and ELT routines. Through attention to establishing more standard processes and using RESTful APIs, the company is addressing the problem of users and data scientists spending too much of their time on data preparation and data cleansing rather than on analytics and machine learning development. The company has been able to both improve management and make data more open and accessible.
Financial services and investment companies are under pressure as well to meet regulatory reporting needs. Being able to understand and track data lineage is especially critical to meeting regulations, as is having a standard model for how concepts such as accounts and assets are defined so that it’s easier to find and relate data. By using solutions for improving ETL, metadata injection into transformations, and integration through standard APIs, the firm has been able to reduce costs and improve efficiency as it ramps up workloads and meets regulatory obligations.
AI and machine learning will play a significant role in automating data classification for governance and security; 35% plan to use AI/ML
Data Preparation, Data Catalogs, and Governance

32
BI and Analytics in the Age of AI and Big Data
Vendor ProductsThe firms that sponsored this report are among the leaders and innovators in BI, analytics, and data management. To get a sense of where the industry as a whole is headed, this section takes a look at the portfolios of these vendors. (Note: The vendors and products mentioned here are representative, and the list is not intended to be comprehensive.)
Arcadia DataArcadia Data offers a distributed, massively parallel analytics platform plus front-end visualization, BI, natural language search, and analytics that can run natively inside Apache Hadoop data lakes and cloud environments with real-time access to streaming data in Apache Kafka. Arcadia Data simplifies the analytics life cycle to minimize IT intervention. Natural language search lets nontechnical users ask questions and get visual answers while allowing development of dashboards by analysts who are not experts in the data. The architecture lets users have access to all data; Arcadia Data does not require organizations to move data extracts out of native environments to prepare it for BI and analytics. Arcadia Data can read various types of data, including complex data in native formats to avoid extra ETL. It provides a single, semantic layer interface for adding business meaning to data tables and fields. Because Arcadia Data technologies run where the data is stored, it enables organizations to close holes in data security that open when extracts are moved into separate data silos. The company’s platform can support high concurrency workloads on data lakes or on cloud data platforms. Employing machine learning, Arcadia Data provides a recommendation engine for creating query accelerators tailored to users’ desired analytical views, eliminating the need for extensive data modeling.
Hitachi VantaraFormed through the integration of Hitachi Data Services, Hitachi Insight Group, and Pentaho, Hitachi Vantara provides a range of analytics, informational, and operational technologies and solutions. Pentaho Business Analytics provides capabilities for self-service analysis across dimensions through reports, dashboards, and other visualizations. Pentaho Data Integration enables organizations to work with a broad range of data storage, management, and processing systems to orchestrate, blend, and prepare large volumes and a variety of data. Hitachi Vantara’s Lumada Platform Services focuses on operational intelligence and process improvement by deriving value from IoT data. Organizations can use Lumada to develop predictive and prescriptive algorithms to know when machinery is likely to break down, for example, and prepare maintenance and repair accordingly. Through Hitachi Smart Spaces and Video Intelligence, organizations can gather data from end points such as cameras in stores or other locations, blend this data with other data, and then develop analytics. The Hitachi Content Platform and Solutions use object storage to contain the cost of amassing huge volumes of data and apply the latest technologies for increasing storage density and improving data management.
OpenTextOpenText offers enterprise information management (EIM) products and solutions for AI and analytics, customer experience management, digital process automation, business network, enterprise content management, discovery, and security. OpenText Analytics Suite provides users with a set of capabilities for deriving value out of their data at enterprise scale, including interactive visualization, reporting, and data discovery features that are customizable by business users, knowledge workers, developers, or IT to meet enterprise needs—from use as an
tdwi.org 33
internal portal, external Web page, massively scaled email report, or embedded in a company’s own technology product. The OpenText Magellan platform and its solutions enable organizations to augment these analytics capabilities with AI from machine learning and very large scale data processing technology built to unlock insights from both big data and big content. Providing a prebuilt platform that can be deployed in the cloud, on premises, or in a hybrid architecture, OpenText Magellan components enable organizations to engage in machine-assisted decision making, automation, and business optimization. Magellan also offers NLP and unstructured text analytics so that organizations can operationalize holistic BI by combining knowledge from data stored in emails, documents, Internet sites, and other text-based systems. The platform collects, aggregates, and analyzes from these disparate sources alongside other big data sources such as IoT and internal application data for business solutions.
OracleOracle offers a range of technologies and solutions centered on the Oracle Gen 2 Cloud platform suite of IT infrastructure and data management services. Oracle Autonomous Database, the core platform for Oracle Gen 2 Cloud, applies AI capabilities such as machine learning to eliminate time-consuming and tedious aspects of the database administrator’s workload. Oracle Analytics Cloud offers users working on desktops, mobile devices, and/or Web interfaces a unified platform for BI, visualization, analytics, data discovery, and data preparation. The Oracle Autonomous Data Warehouse Cloud with Oracle Analytics Cloud can provide a single view of data from any source and any application. An important part of this offering is Oracle Autonomous Data Warehouse Cloud, which uses machine learning and database optimization to significantly reduce the complexity of building data warehouses, as well as the human error that can come with manual management. This allows organizations to create data warehouses on the fly so users can access data and analytics. In addition, new machine learning, voice enablement, and NLP functionality in the mobile applications within Oracle Analytics Cloud makes it easier for personnel to get information and initiate business processes from their mobile devices.
ThoughtSpotThoughtSpot provides a search and AI-driven analytics solution designed for a range of users, not just data experts. The company's relational search capability leverages an in-memory calculation engine to enable users to explore and analyze billions of rows of company data and bring back accurate answers, while applying granular security rules and offering relevant suggestions for further inquiry. Its SpotIQ solution combines relational search with AI/ML to automatically uncover insights that users may not have thought to ask. It uses machine learning to learn what users like (through usage-based ranking), what questions they ask, and other usage characteristics. This way, SpotIQ learns from users as well as the data to provide more relevant and actionable insights. The company recently introduced SearchIQ, which expands the ways in which users can search data, including through voice. ThoughtSpot can be integrated with other technologies such as R and Google Cloud Machine Learning Engine so that organizations can leverage, test, and deploy algorithms from this engine into their data models.
Vendor Products

34
BI and Analytics in the Age of AI and Big Data
RecommendationsEnhance self-service user experiences. Expanding and improving what nontechnical users are able to do on their own, without IT, remains a top priority. However, users grow frustrated if their self-service experiences are limited. Through embedded AI functionality, solutions in the market are making it possible for users to access and analyze more types of data, including data in Hadoop or Spark clusters and cloud storage. AI is enabling users to do more with search, NLP, and development of automated insights. Organizations should evaluate technology solutions that can provide AI-based recommendations for access, analysis, and visualization selection.
Focus on operational efficiency and effectiveness. TDWI research finds that the top goal for investment in new BI, analytics, and data management and data integration solutions is to improve operations. This result indicates that organizations want to unearth data insights that will help them reduce bottlenecks and latencies in business processes, drive down costs, and allocate resources more intelligently. Organizations should champion data science and advanced analytics projects that can achieve improvements in operations, especially the incremental gains that are sometimes overlooked in pursuit of bigger goals. Organizations should also explore how to supply KPIs and other metrics with analytical insights to deepen understanding of the causes and contexts for what is shown in dashboards and scorecards.
Prepare for expansion in data-intensive applications. Organizations need to plan for the future of applications and services, which will be increasingly driven by data and analytics. Once in production, organizations cannot let data and analytics be sources of delays and mistakes. Improving centralization of data for such applications and services into a data warehouse or data lake either on premises or in the cloud can reduce the data integration complexity and improve data management. If organizations cannot centralize the data, they should consider developing an integrated, multiplatform architecture that uses data pipelines effectively.
Reduce delays in data preparation and transformation. Across several TDWI research reports, we find that data scientists, analysts, and users are spending the majority of their time preparing and transforming data, often manually in spreadsheets. Organizations should examine current data preparation and transformation procedures to eliminate unnecessary routines, especially those developed for reports or other requirements that are no longer relevant. Organizations should evaluate solutions that increase self-service capabilities so users can align routines more closely with current requirements. They should also look at how newer solutions apply AI capabilities that can learn and anticipate users’ needs for preprocessing and predefined queries and thereby shorten the path to relevant data and insights.
Develop shared data catalogs, glossaries, and metadata repositories. Shared resources such as these are essential to improving knowledge of the data and applying this knowledge to BI, analytics, and data preparation and transformation processes. Solutions in the marketplace apply AI, including ML and NLP, to automate and improve location of related data and metadata, including in data lakes and other big data repositories. Organizations should evaluate solutions that can streamline development and maintenance so that users can find related data faster.
Increase the value of data lakes through improved accessibility and management. For many organizations, the initial purpose of their data lake was simply to create a centralized storage place for large quantities of various data. However, as data lakes grow, organizations often struggle with providing easier access to this data for exploration, enabling productive analytical interaction with it, and managing it from governance and performance perspectives. Organizations should develop a data architecture strategy that better defines the purpose of their
Organizations should evaluate solutions
that can provide recommendations,
often through AI, that make it easier for self-
service users to find and analyze data
To avoid turning data lakes into data swamps,
organizations should define their purpose and
determine which kinds of workloads are most
appropriate for them

tdwi.org 35
data lake and what kinds of workloads are most appropriate for it. They should also evaluate SQL-on-Hadoop/Spark and BI and analytics technologies that can function inside data lakes and can take advantage of the scalable processing power these platforms offer.
Provision users and applications with fresher data. Demand continues to rise for near or true real-time views and analytics. Executives and managers responsible for operations in particular need to know what has changed; they value up-to-date views and analytics. With the growth in streaming data generated by IoT, mobile devices, and Internet activity, organizations need to invest in solutions that can analyze data in motion as well as at rest in a data lake, warehouse, or cloud storage. To target investment, organizations should look specifically at how well users, analytics processes, and applications are served by current levels of data latency and whether solutions that could reduce it will help realize greater value.
Exploit advantages of the cloud to meet data and analytics requirements. With the popularity of the cloud, organizations hardly need to be nudged to consider adopting cloud-based services and cloud-native BI, analytics, and data services and platforms. Organizations should look beyond obvious cost reduction reasons to examine whether cloud-based alternatives can provide a better fit for business purposes and a faster path for adoption of new technologies. At the same time, they should evaluate which use cases are better served by traditional, on-premises systems. Organizations should also make portability a key objective in their cloud strategy to ensure flexibility and avoid vendor lock-in.
Modernize data governance and stewardship. Organizations that have set their governance rules and policies to fit traditional BI and data warehousing need to update them to fit greater use of data lakes and cloud-based storage and data platforms. Organizations should seek smart, balanced, and less-obtrusive implementation of governance rather than take an overly cautious broad brush to all analytics that may not be necessary.
Address shortages in personnel and deficiencies in skill sets. Shortages in the right personnel and inadequate skill sets are the leading barriers to organizations’ advancement with new technologies for BI, analytics, and data management and data integration. Fortunately, tools and platforms are becoming easier to use, and through AI-based recommendation capabilities, they will become smarter in how they guide users in the course of their workflows. However, in large part, these technologies excel at augmenting, not replacing, personnel. This means that business users, data and business analysts, and data scientists need training. Organizations should step up training and education to realize the most value from technology investments.
Recommendations

Research Sponsors
ArcadiaData.com
Arcadia Data provides the first visual analytics and BI platform native to big data that delivers the scale, performance, and agility business users need to discover and productionize real-time insights. Its flagship product, Arcadia Enterprise, was built from inception to run natively within big data platforms, in the cloud, and/or on premises, for data in Apache Hadoop, Apache Spark, Apache Kafka, and Apache Solr. Using artificial intelligence and machine learning, Arcadia Enterprise streamlines the self-service analytics process with search-based BI and visualization recommendations directly on big data. It enables real-time, high-definition insights in use cases such as data lakes, cybersecurity, connected IoT devices, and customer intelligence.
Arcadia Enterprise is deployed by some of the world’s leading brands, including Procter & Gamble, Nokia, Royal Bank of Canada, Kaiser Permanente, HPE, and Neustar. To learn more, follow @ArcadiaData or visit arcadiadata.com.
hitachivantara.com/en-us/home.html
Data is your greatest asset, if you know how to use it. It reveals your path to innovation and new ways for you and the world to work. Hitachi Vantara elevates your innovation advantage with 100 years of OT and 60 years of IT experience that connects business, human, and machine data to create solutions that drive benefits for your business and society. Our unique Stairway to Value model uses machine learning and artificial intelligence to deliver tangible benefits driven by your data. We’re a catalyst for intelligent innovation and we accelerate insights. Let’s talk about your new vantage point.
opentext.com/magellan
OpenText, The Information Company, enables organizations to gain insight through market-leading information management solutions, on premises or in the cloud.
The Magellan platform shows how OpenText, through innovation, continues to lead in Enterprise Information Management—helping organizations from all industries discover how they can easily and affordably leverage massive amounts of structured and unstructured data to enable machine-assisted decision making, automation, and business optimization.
Oracle.com
The Oracle Cloud offers complete SaaS application suites for ERP, HCM, and CX, best-in-class database platform-as-a-service (PaaS), and infrastructure-as-a-service (IaaS) from data centers throughout the Americas, Europe, and Asia.
thoughtspot.com
ThoughtSpot, a leader in search and AI-driven analytics for the enterprise, is helping the largest companies in the world succeed in the digital era by putting the power of a thousand analysts in every businessperson's hands. With ThoughtSpot’s next-generation analytics platform, businesspeople can use Google-like search to easily analyze complex, large-scale enterprise data and get trusted insights to questions they didn’t know to ask, automatically—all with a single click. ThoughtSpot connects with any on-premises, cloud, big data, or desktop data source, deploying 85 percent faster than legacy technologies. Customers such as Amway, Bed Bath and Beyond, BT, Celebrity Cruises, Chevron Federal Credit Union, De Beers, PetCo, and Scotiabank have put ThoughtSpot at the core of their business processes. With ThoughtSpot, business leaders and frontline workers alike have made more than three million data-informed decisions per year.

555 S. Renton Village Place, Ste. 700
Renton, WA 98057-3295
T 425.277.9126
F 425.687.2842
E [email protected] tdwi.org
TDWI Research provides research and advice for data professionals worldwide. TDWI Research focuses exclusively on data management and analytics issues and teams up with industry thought leaders and practitioners to deliver both broad and deep understanding of the business and technical challenges surrounding the deployment and use of data management and analytics solutions. TDWI Research offers in-depth research reports, commentary, inquiry services, and topical conferences as well as strategic planning services to user and vendor organizations.