Embed Size (px)
Citation preview

Loyola University Chicago Loyola University Chicago
Loyola eCommons Loyola eCommons
School of Business: Faculty Publications and Other Works
Faculty Publications and Other Works by Department
11-1991
Teacher Absenteeism in Secondary Education Teacher Absenteeism in Secondary Education
Dow Scott Loyola University Chicago, [email protected]
James C. Wimbush
Follow this and additional works at: https://ecommons.luc.edu/business_facpubs
Part of the Business Commons
Recommended Citation Recommended Citation Scott, Dow and Wimbush, James C.. Teacher Absenteeism in Secondary Education. Educational Administration Quarterly, 27, 4: 506-529, 1991. Retrieved from Loyola eCommons, School of Business: Faculty Publications and Other Works, http://dx.doi.org/10.1177/0013161X91027004004
This Article is brought to you for free and open access by the Faculty Publications and Other Works by Department at Loyola eCommons. It has been accepted for inclusion in School of Business: Faculty Publications and Other Works by an authorized administrator of Loyola eCommons. For more information, please contact [email protected].
This work is licensed under a Creative Commons Attribution-Noncommercial-No Derivative Works 3.0 License. © The University Council for Educational Administration, 1991.

from the SAGE Social Science Collections. All Rights Reserved. at LOYOLA UNIV OF CHICAGO on April 11, 2016eaq.sagepub.comDownloaded from
Educational Administration Quarterly Vol. 27, Number4(November1991) 506-529
Teacher Absenteeism in Secondary Education
K. Dow Scott James C. Wimbush
Teacher absenteeism is a serious problem for school systems. Using an existing model of attendance behavior as a guide, attitudina~ demographic, and absenteeism data from 265 secondary teachers were examined. Canonica/ correlation analysis revealed that absenteeism among teachers was significantly related to distance to work, gender, job involvement, and overall job satisfaction.
Absenteeism represents a costly problem for all organizations, but none more so than for elementary and secondary school systems. Lewis (1982) estimated that over 200,000 teachers were absent from work on any given day, and according to Hill (1982), this translated into over $2 billion annually. A study of three school systems (Detroit, Philadelphia, and New York) revealed that their combined absenteeism costs were approximately $500 million per year (Lewis, 1982). These costs included wages for the absent teacher, wages for the substitute teacher, and time taken from the administrator who must contact, instruct, and evaluate substitute teachers. In addition, Skidmore (1984) found that interruptions in the continuity of the students' regular instruction contributed to lower achievement scores and increased the remedial costs of education. Concomitant problems of absenteeism result in teacher resistance to change or input, negativity, and low motivation (Ferkich & Grassi, 1987).
Many researchers have attempted to identify factors related to absenteeism so that appropriate solutions for this problem can be developed. Much
Authors' Note: An earlier version of this article was presented at the 1988 Southern Management Association Meeting in Atlanta. The authors would like to thank Elizabeth McClellan for her efforts in collecting and coding the data and Anthony Townsend for his assistance in analyzing the data.
© 1991 The University Council for Educational Administration
506

at LOYOLA UNIV OF CHICAGO on April 11, 2016eaq.sagepub.comDownloaded from
Scott, Wimbush I SECONDARY TEACHERS' ABSENTEEISM 507
of the research, however, has been conducted in private sector organizations, even though absenteeism is often more costly in the public sector (Winkler, 1980). The purpose of this study was to systematically examine teacher absenteeism in secondary education to determine what factors are related to the absenteeism. If researchers and practitioners know which factors are related to the absenteeism of teachers, then programs can be designed to encourage better attendance.
REVIEW OF THE LITERATURE
Even though research on absenteeism has been conducted for over 50 years and hundreds of articles have been written on the topic, theory development has been fragmented among a number of disciplines. Absenteeism is often explained by psychologists as a pain-avoidance mechanism (Brayfield & Crockett, 1955; Steers & Rhodes, 1978), by sociologists as a consequence of organizational socialization and prevailing absence culture (ChadwickJones, Nicholson, & Brown, 1982; Hill & Trist, 1953), and by economists as a way for employees to restore the balance of effort-reward ratios or as a way for workers to make trade-offs between labor and leisure (Allen, 1981; Gowler, 1969). Even with these theories, both Nicholson (1977) and Steers and Rhodes (1978) concluded that much of the research on absenteeism has only led to speculation and propositions applied ex post facto to case studies and vague conceptual frameworks. It seems that in many instances, empirical studies were formulated not to test a given theory but to search for absenteeism correlates among variables for which measures were available.
Unfortunately, the problems associated with absenteeism research in general are also true for absenteeism research in the field of education. Although a review of the education literature uncovered a number of studies of teacher absenteeism (e.g., Bridges, 1980; Bridges & Hallinan, 1978; Jacobson, 1989), these studies were not used to test a general theory or model of teacher absenteeism. In fact, in a recent article, Foldesy and Foster (1989) simply reported the correlative relationships among a number of variables that researchers had thought were related to the absenteeism of teachers (i.e., age, gender, race, marital status, family size, education level, job level, tenure, years of experience, stress, and organizational influences). They did not attempt to develop a theory or model of absenteeism that might explain the findings from these studies.
In an attempt to at least systematically organize the empirical determinants of absenteeism, Steers and Rhodes (1978) reviewed 104 empirical studies of absenteeism. Based on this review, they proposed a model of employee

at LOYOLA UNIV OF CHICAGO on April 11, 2016eaq.sagepub.comDownloaded from
508 Educational Administration Quarterly
attendance. Although the model has recently been revised to account for subsequent research (Rhodes & Steers, 1990), the major components of the model remain intact (see Figure 1). "Attendance motivation" and "perceived ability to attend" are still conceptualized as the variables most directly related to employee attendance and thus defined the domain for the present research effort.
Motivation to Attend
Attendance motivation, according to the Rhodes and Steers model, is influenced by organizational practices, absence culture, and employee attitudes, values, and goals. In a single organization, such as a school district, similar organizational practices would be expected across employees or schools because of the district's centralization of employment policies and procedures. These policies and procedures would provide the basis for the shared perceptions which constitute the culture of the school district (Schneider, 1975). Yet because organizational culture is influenced by many additional variables, some of which are unique to organizational units (e.g., schools), the culture may possibly vary between schools in a district. However, employee attitudes, values, and goals probably would differ among employees within a single organization because these are influenced by variables external to the focal organization such as individual characteristics, distance from work, economic situation, and so on. It is these individual employee differences which represent an important category of variables that can be examined within the context of this study.
In the original Steers and Rhodes model, job satisfaction was specifically identified as being the single most important factor that affects attendance motivation. Although Rhodes and Steers (1990) now group job satisfaction with other "employee attitudes, values and goals," it is still considered to have a major influence within this category of antecedents of attendance motivation. This is not surprising because job satisfaction represents a complex construct with a number of dimensions (e.g., satisfaction with peers, promotional opportunity, supervisor, job, and pay). Other employee attitudes that are predicted to be related to attendance motivation are job involvement, organizational commitment, loyalty to co-workers, and so on. A number of studies have provided support for the relationship between the attitudinal factors affecting attendance motivation and observed absenteeism since the original Steers and Rhodes model was formulated. These factors include job involvement and organization commitment (Blau & Boal, 1987; Breaugh, 1981), the social context (Chadwick-Jones et al., 1982), and job satisfaction (Cheloha & Farr, 1980; Clegg, 1983; Hackett, 1989; Scott & Taylor, 1985).

at LOYOLA UNIV OF CHICAGO on April 11, 2016eaq.sagepub.comDownloaded from
Scott, Wimbush I SECONDARY TEACHERS' ABSENTEEISM 509
Attendance Barriers: Illness and Accidents Family Responsibilities Transportation Problems
l .....
Organizational Perceived Ability Practices to Attend -
I l f-+ Absence Attendance Attendance Culture Motivation
I f--+ Employee -----
Attitudes, Values, and
Goals
Figure I: A Diagnostic Model of Employee Attendance SOURCE: Susan R. Rhodes and Richard M. Streers, Managing Employee Absenteeism, © 1990 by Addison-Wesley Publishing Company, Inc. Reprinted with permission of the publisher.
Perceived Ability to Attend
As indicated by the model (Figure 1 ), the relationship between attendance motivation and actual employee attendance is constrained by an employee's perceived ability to attend work. This perception is influenced both by organizational practices and by attendance barriers. Attendance barriers include illness, family responsibilities, and transportation problems. Traditionally, absenteeism for these reasons is often categorized as involuntary absenteeism by organizations because the employee may not be able to come to work even though she or he is motivated to attend (Herman, 1973). Since the employee does not have behavioral discretion or choice in the decision to attend, reasons given for these types of absences may be considered legitimate as long as employees are not excessively absent.
Rather than measure an employee's perceived ability to attend work, researchers often attempt to identify the attendance barrier faced by the

at LOYOLA UNIV OF CHICAGO on April 11, 2016eaq.sagepub.comDownloaded from
510 Educational Administration Quarterly
individual and relate those barriers to attendance (i.e., gender, age, number of dependents, and so on). For instance, older workers are expected to be absent more often because they are more likely to have physical ailments than do younger employees (Taylor, 1981). Women are predicted to have more absences than men because they traditionally are more likely to stay home with sick children (Leigh, 1983; Markham, Dansereau, & Alulton, 1982; Scott & Mabes, 1984).
Steers and Rhodes (1978) proposed that their model should be "treated as a series of propositions suitable for testing" (p. 392). However, as many researchers have found (e.g., Brooke, 1986; Chadwick-Jones et al., 1982; Steers & Rhodes, 1984), the model is difficult if not impossible to test comprehensively. A complete test of the model has not been reported to date (Rhodes & Steers, 1990). Moreover, partial tests have provided only mixed support for the model (e.g., Hammer, Landau, & Stem, 1981; Watson, 1981). This suggests that factors affecting absenteeism vary depending on the work situation, attendance policies, and worker characteristics in the organization. A more detailed explanation of the development of the model and variables included can be found in Steers and Rhodes (1978) and Rhodes and Steers (1990).
It should be noted that researchers who have specifically examined the absenteeism of teachers do not necessarily subscribe to the relationships predicted by Rhodes and Steers (1990). Bridges (1980) found what he described as a tenuous relationship between job satisfaction and absenteeism. In their review, Foldesy and Foster (1989) reported that the results of studies they examined showed the following:
1. Age was not positively related to absenteeism (Bridges & Hallinan, 1978; Bundren, 1974; Redmond, 1978).
2. Women teachers did not have higher rates of absenteeism than men {Bridges, 1980; Douglas, 1976; Marchant, 1976).
3. There were not higher rates of absenteeism among female teachers who had children compared to those who did not (Manganiello, 1972).
Although these findings may indicate that characteristics of teachers and the jobs they hold mitigate the relevance of the Rhodes and Steers model, the reason why these relationships were not found could very well have occurred because sample sizes were too small or for other statistical reasons (Scott & Taylor, 1985). Statistical nonsignificance cannot be used to prove that a relationship does not exist. However, since the reasoning offered by Rhodes and Steers provides a substantial rationalization for the proposed relation-

at LOYOLA UNIV OF CHICAGO on April 11, 2016eaq.sagepub.comDownloaded from
Scott, Wimbush I SECONDARY TEACHERS' ABSENTEEISM 511
ships and since a number of studies support these relationships, the relationships indicated by the model are hypothesized for this study.
In this study, the model was used to identify factors that might be related to absenteeism in a secondary school environment. Variables were selected that might be categorized as either influencing attendance motivation or perceived ability to attend. Attendance motivation was expected to be higher for employees who perceived work to be more central to their life than other activities and for those who reported higher job involvement and higher satisfaction with their work, whereas attendance barriers were more formidable for employees who lived greater distances from work, perceived more role conflict, had more dependents, were older, and were female compared to other employees who did not have these characteristics. It was hypothesized that the variables selected would be significantly related to, and contribute substantially to, explaining differences in the absenteeism rates as specified by Rhodes and Steers (1990). As such, absenteeism was expected to be positively related to the number of dependents, distance to work, age, and role conflict; negatively related to job satisfaction, job involvement, and centrality of work to life; and finally, women were expected to be absent more frequently than men.
METHODOLOGY
Data Collection
This study was conducted at all junior and senior high schools located in one county in the mid-Atlantic region of the United States. (Longitudinal studies have shown that there is no relationship between grade level taught and absenteeism; see Redmond, 1978.) The county school system had a central administration and uniform personnel policies across all of its 10 schools. Data were collected from teachers in five high schools and five junior high schools. The number of teachers employed at each school ranged from 24 to 88 for a total of 502 throughout the 10-school county system. The average teacher was 40 years old and had 13 years' tenure in the school system. There were 147 male (29.3%) and 355 female (70.7%) teachers.
Absenteeism data and information about employee characteristics were taken from personnel records. A questionnaire designed to measure the teachers' attitudes was administered over a 1-week period during faculty/staff meetings. Administration of the questionnaire was conducted by the research team who were available to answer questions about the study. For those

at LOYOLA UNIV OF CHICAGO on April 11, 2016eaq.sagepub.comDownloaded from
512 Educational Administration Quarterly
teachers who were absent or not available, questionnaires and stamped, self-addressed envelopes were left to be completed and returned by mail. These attitudinal data were collected during early May, approximately 5 weeks before the end of the school year.
Although clearly marked as optional, each respondent was asked to write his or her social security number on the instrument to allow questionnaire data to be matched with corresponding personnel records. The confidentiality of individual responses was stressed. Of the 502 questionnaires administered to teachers, 444 were completed and returned during the administration of the questionnaire, with another 21 completed and mailed to the researchers later, resulting in a 93% return rate. However, only 265 (53%) of the questionnaires could be matched (by social security number) with corresponding personnel records.
Variable Measures
The demographic information from the employee questionnaire included gender, number and presence of dependents in the household other than spouse, and distance from home to work.
Two absenteeism measures were collected for this study- absence frequency (occurrences) and total days absent-which are the most commonly reported measures of absenteeism (Breaugh, 1981; Garrison & Muchinsky, 1977; Metzner & Mann, 1953). Frequency is measured by a count of the number of occurrences of absenteeism regardless of the number of days a person is absent and tends to place greater weight on short-term absences. It is believed that most single-day or short-term absences are voluntary, or related to discretionary reasons for absence (Chadwick-Jones, Brown, Nicholson, & Sheppard, 1971). On the other hand, total days absent, which is measured by the number of days a person is absent over the course of the measurement period, more heavily emphasizes long-term absences, or those believed to be more likely caused by serious illnesses or injury. Both Breaugh (1981) and Hammer and Landau (1981) found absence frequency to be a more stable measure of absenteeism over time than total days absent because it suffers from fewer psychometric deficiencies. Hammer and Landau (1981) also found that absence frequency is less influenced by skewness and leptokurtosis and therefore concluded that frequency indices appear to be preferable measures of both voluntary and involuntary absence. This is consistent with the findings of Chadwick-Jones et al. (1971), who found total days absent (duration) to be an insensitive indicator of voluntary absence.
Although absence frequency is probably conceptually and empirically the best measure, total days absent was also collected and examined. Tradition-

at LOYOLA UNIV OF CHICAGO on April 11, 2016eaq.sagepub.comDownloaded from
Scott, Wimbush I SECONDARY TEACHERS' ABSENTEEISM 513
ally, total days absent has been collected because managers are interested in the costs associated with absenteeism. In addition, several researchers (e.g., Breaugh, 1981; Cheloha & Farr, 1980; Muchinsky, 1977; Steers & Rhodes, 1984) have suggested the use of multiple measures. Cheloha and Farr (1980) postulated that studies of attitude-absence relationships should incorporate multiple measures in order to reveal possible complexities in these relationships. They further stated that "the use of multiple measures make more explicit the less than desirable state of our measurement techniques and prevents one from over-generalizing findings that are only found with a single measurement instrument" (p. 472).
The Cornell Job Description Index (JDI) was used to measure job satisfaction. The JDI was selected because it had previously been shown to be more consistently related to both total days absent and frequency measures of absenteeism than other measures of job satisfaction (Scott & Taylor, 1985). The JDI is composed of six separate scales which measure satisfaction toward the job in general, the work itself, the supervisor, work mates, pay, and promotional opportunities. Each of these scales consists of either 9 or 18 adjectives. For example, one adjective in the scale regarding pay attitudes was "underpaid." The respondent was to reply Y (for yes) when the adjective or phrase described his or her job, N (for no) when the item did not describe his or her job, or? (question mark) ifhe or she could not decide. Researchers have reported subscale reliability coefficients for the JDI ranging from .69 to .93 as well as correlations with other measures of overall job satisfaction ranging from .18 to .74 (Cook, Hepworth, Wall, & Warr, 1981). The properties of the JDI have been discussed in substantial detail by Smith and Sandman (1981).
Centrality of life interest was a set of items in the questionnaire designed to determine whether work was the principle motivation or interest in life, as compared to nonwork activities, such as family or community. A scale developed by Dubin (1973) consists of 32 items designed to force a respondent to select one of three alternatives for a particular situation (i.e., preference for a work setting, a home/church/community setting, or indifference to the setting). Scoring was designed simply to classify an individual as being "work-centered," "non-work-centered," or "noncentered," not to produce continuous scores. The items were scored using a threefold descriptive system, where the respondent was considered work-centered if at least half of the work-centered responses were chosen and non-work-centered if two thirds of non-work-centered responses and noncentered alternatives were selected. Respondents choosing at least 40% noncentered responses and not falling into either of the aforementioned categories were classified as noncentered. Although reliability data have not been consistently reported con-

at LOYOLA UNIV OF CHICAGO on April 11, 2016eaq.sagepub.comDownloaded from
514 Educational Administration Quarterly
ceming this scale, test-retest reliability in one study was shown to be .92 for the gamma coefficient of association (Cook et al., 1981).
In order to use the Centrality of Life Scale within the constraints of the questionnaire, the number of items in the scale had to be reduced. Based on the pilot questionnaire, items were dropped which had prompted criticism or were considered ambiguous. The scale reported here had 20 items.
To measure job involvement, a portion of the Michigan Organizational Assessment Questionnaire (Lodahl & Kejner, 1965) was included. Coefficient alpha has been shown to be .62, while correlations of .35 with Overall Job Satisfaction and -.27 with Intention to Stay have been reported (Cook et al., 1981). Three items were used to measure the degree to which an individual identified with his or her job. For example, to the statement "I live, eat, and breathe my job," respondents were asked to choose which of the following described their feelings on a 6-point continuum from strongly disagree to strongly agree. A "not applicable" response was also offered.
The Role Conflict Scale assessed the degree of conflict an individual feels exists between work, spouse, children, or community. This scale was developed specifically for this study, since a review of the literature did not reveal a suitable short scale that was oriented toward absenteeism research. This three-item scale had a coefficient alpha of .64. For example, one item from this scale was "Conflicts often occur between my job and my responsibilities to my children." Respondents were again asked to choose on a 6-point continuum or "not applicable" response.
Data Analysis
Mean comparisons were used to determine whether the employees who did provide social security numbers (hence allowing the matching of demographic and absenteeism data with the questionnaires and inclusion in the study) were similar to employees who did not provide their social security numbers (and were excluded from analysis). Comparisons were made on age, tenure, absence frequency, and the number of days absent. The results of t tests for unequal sample size indicated nonsignificant differences between the two groups for age (39.3 vs. 40 years,p = .337) and tenure (13 vs. 12.8 years, p = . 799). Significant differences did appear for absence frequency (2.63 vs. 3.16 occurrences,p = .003) and number of days absent (4.6 and 6.4 days, respectively,p = .024).
Regarding the use of absence data, Hammer and Landau (1981) stressed the importance of examining the data for the violation of assumptions of normality. Using a skewness moment of less than 2.0 and a kurtosis moment ofless than 5.0 as a guideline (Kendall & Stuart, 1958), the absence frequency

at LOYOLA UNIV OF CHICAGO on April 11, 2016eaq.sagepub.comDownloaded from
Scott, Wimbush I SECONDARY TEACHERS' ABSENTEEISM 515
measure had skewness and kurtosis moments within the established guidelines (0.538 and 0.197, respectively). The number of days absent measure, however, revealed skewness and kurtosis moments (4.289 and 22.565, respectively), suggesting a nonnormal distribution. Because of the nonnormality, a square root transformation was performed on the data to correct for skewness.
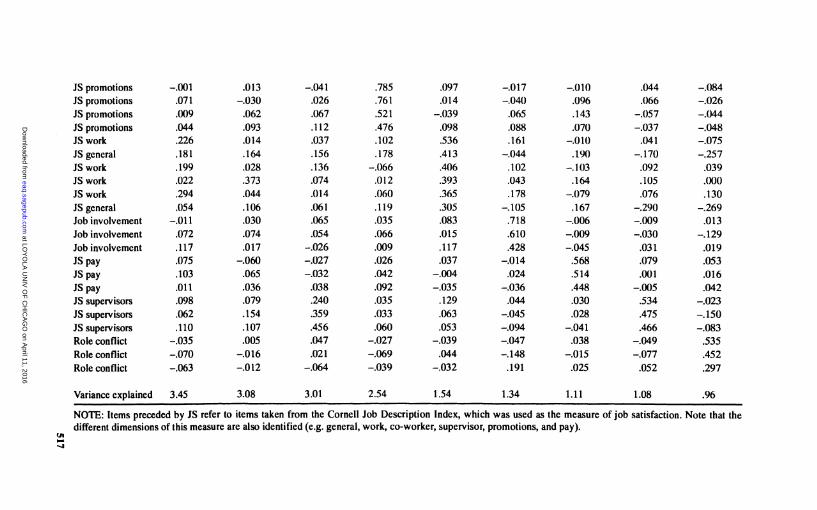
Factor analysis is useful for helping to identify or verify one or more observable variables which tend to measure or explain common variance of an unobservable, or hypothetical, variable (SAS Institute, Inc., 1982). Although previous research has consistently shown that Job Satisfaction and Job Involvement scales all load onto discrete factors, factor analysis was used to verify the presence of these factors. It was also necessary to perform the factor analysis to be certain that the Role Conflict Scale, which was specifically developed for this project, loaded onto a discrete factor. The results of the factor analysis are shown in Table 1.
Because central life interest was measured categorically, factor analysis was not appropriate for this type of measure and thus was not included in this analysis. The items were found to be consistent with the corresponding scales for which they were written and were scored appropriately for these analyses.
Canonical correlation analysis was used for exploring the relationships among the multiple dependent variables (i.e., absenteeism measures) and the multiple independent variables (i.e., demographic, motivation to attend, and ability to attend). This methodology was chosen because the interest in this study concerned the strength of the interrelationships between the sets of multiple dependent and independent variables. Recognizing that this study constitutes only a partial test of the Rhodes and Steers model, a comprehensive test of the model would dictate the use of a causal technique; however, the concern in this investigation was only for the interrelationships between some of the variables associated with absenteeism. Thus a multivariate technique is appropriate and is consistent with other partial tests of the model by Terborg (1980), Hammer et al. (1981), and Frechette (1981).
FINDINGS
In Table 2, the means, standard deviations, and ranges for the dependent, ability-to-attend, and motivation-to-attend variables are shown for the 265 teachers in the sample. Pearson product-moment correlation coefficients for the variables used in the study are shown in Table 3.
A positive significant correlation of .578 (p < .001) was found to exist between absence frequency and total days absence. Distance from work was

at LOY
OLA
UN
IV O
F C
HIC
AG
O on A
pril 11, 2016eaq.sagepub.com
Dow
nloaded from
~ TABLE I ~
Factor Analysis Results of Scalar Measures (varimax mtation)
Item Factor I Factor2 Factor] Factor4 Factor5 Factor6 Factor 7 Factor8 Factor9
JS general .728 .190 .091 .004 .058 .042 .063 .047 -.035 JS general .701 .112 .129 .021 .113 .031 .117 -.004 -.080 JS general .659 .074 .124 .029 .283 .028 .141 .058 -.132 JS work .602 .090 .109 -.023 .143 .062 -.051 .037 -.017 JS general .558 .119 .(J90 .064 .059 .023 .015 .025 .042 JS work .549 .125 .113 .008 .191 -.089 .019 -.080 -.181 JS work .509 -.051 .030 -.016 .Oll .055 -.077 .006 .012 JS general .417 .112 .076 .09.5 -.071 .037 .087 .068 -.038 JS co-workers .258 .686 .146 -.021 -.108 .076 -.058 -.033 .062 JS co-workers .100 .679 .062 .031 -.011 .057 .028 .088 .000 JS co-workers .165 .648 .120 .060 .010 -.030 .032 .006 -.022 JS co-workers .125 .636 .047 -.019 -.084 .008 .020 .030 -.091 JS co-workers .030 .607 .104 .017 .112 -.025 -.082 -.038 -.057 JS co-workers .070 .522 .004 .144 .295 .080 .002 .088 .105 JS co-workers -.019 .513 .089 .022 .312 .oJO .073 .o71 -.012 JS supervisors .171 .069 .717 .076 -.024 .oJO .033 .008 .101 JS supervisors .154 .097 .681 .079 .036 .009 .062 .048 .108 JS supervisors .068 .035 .635 -.049 .o75 -.045 -.007 .099 -.037 JS supervisors -.011 .044 .622 .005 .097 .001 -.007 .061 -.113 JS supervisors .151 .128 .580 .050 .092 .111 .051 -.032 .020 JS supervisors .151 .155 .523 .104 -.012 .028 -.012 .220 -.026 JS promotions .025 .002 .036 .809 .015 .003 -.022 .035 -.000
at LOY
OLA
UN
IV O
F C
HIC
AG
O on A
pril 11, 2016eaq.sagepub.com
Dow
nloaded from
JS promotions -.001 .013 -.041 .785 .097 -.017 -.010 .044 -.084 JS promotions .071 -.QJO .026 .761 .014 -.040 .096 .066 -.026 JS promotions .009 .062 .067 .521 -.039 .065 .143 -.057 -.044 JS promotions .044 .093 .112 .476 .098 .088 .070 -.037 -.048 JS work .226 .014 .037 .102 .536 .161 -.010 .041 -.075 JS general .181 .164 .156 .178 .413 -.044 .190 -.170 -.257 JS work .199 .028 .136 -.066 .406 .102 -.103 .092 .039 JS work .022 .373 .074 .012 .393 .043 .164 .105 .000 JS work .294 .044 .014 .060 .365 .178 -.079 .076 .130 JS general .054 .106 .061 .119 .305 -.105 .167 -.290 -.269 Job involvement -.011 .030 .065 .035 .083 .718 -.006 -.009 .013 Job involvement .072 .074 .054 .066 .015 .610 -.009 -.030 -.129 Job involvement .117 .017 -.026 .009 .117 .428 -.045 .031 .019 JS pay .075 -.060 -.027 .026 .037 -.014 .568 .079 .053 JS pay .103 .065 -.032 .042 -.004 .024 .514 .001 .016 JS pay .011 .036 .038 .092 -.035 -.036 .448 -.005 .042 JS supervisors .098 .079 .240 .035 .129 .044 .030 .534 -.023 JS supervisors .062 .154 .359 .033 .063 -.045 .028 .475 -.150 JS supervisors .110 .107 .456 .060 .053 -.094 -.041 .466 -.083 Role conflict -.035 .005 .047 -.027 -.039 -.047 .038 -.049 .535 Role conflict -.070 -.016 .021 -.069 .044 -.148 -.015 -.077 .452 Role conflict -.063 -.012 -.064 -.039 -.032 .191 .025 .052 .297
Variance explained 3.45 3.08 3.01 2.54 1.54 1.34 1.11 1.08 .96
NOTE: Items preceded by JS refer to items taken from the Cornell Job Description Index, which was used as the measure of job satisfaction. Note that the different dimensions of this measure are also identified (e.g. general, work, co-worker, supervisor, promotions, and pay).
"' ... .....

at LOYOLA UNIV OF CHICAGO on April 11, 2016eaq.sagepub.comDownloaded from
518 Educational Administration Quarterly
TABLE2 Descriptive Statistics (N = 265)
Range
Variable Mean SD Minimum Maximum
Absenteeism variables Total days absent 4.61 6.72 0.00 53.00 Absence frequency 2.63 1.80 0.00 8.00
Ability-to-attend variables Distance from work 9.16 8.67 0.00 55.00 Number of dependents 1.07 1.15 0.00 6.00 Employee age 39.32 8.24 23.00 64.00 Organization tenure 12.98 7.29 0.00 37.00 Role conflict 4.02 1.59 1.00 7.00
Motivation-to-attend variables Job involvement 4.40 1.17 1.67 7.00 Job satisfaction (work) 1.78 0.44 0.50 2.83 Job satisfaction (peers) 2.48 0.55 0.19 3.00 Job satisfaction (promotions) 0.61 0.69 0.00 3.00 Job satisfaction (supervisor) 2.46 0.63 0.16 3.00 Job satisfaction (pay) 0.91 0.77 0.00 3.00 Job satisfaction (general) 2.48 0.52 0.00 3.00
NOTE: Centrality of work and gender were not included in this table because they were categorical variables and these type of descriptive statistics are not appropriate.
positively correlated (r = .145,p < .01) with absence frequency, and satisfaction with pay was positively correlated (r = .164, p < .01) with total days absent. Negative correlations were found for absence frequency and job involvement (r = -.158,p < .01) and general job satisfaction (r = -.114,p < .06).
As an aside to examination of absenteeism data, several expected relationships were found between the independent variables. The measures of job satisfaction were significantly correlated with each other, and the general measure of job satisfaction was positively correlated with job involvement (r = .130,p < .05). The number of dependents a teacher had was negatively correlated with job involvement (r = -.129, p < .05) and role conflict (r = -.234, p < .001 ). In other words, teachers with fewer dependents indicated more job involvement but higher role conflict. Finally, role conflict was negatively correlated with organization tenure (r = -.190,p < .01) and age (r = -.274, p < .001 ).
Because gender and centrality of life were categorical variables, a oneway analysis of variance (ANOVA) was used to examine whether mean differences were significant. Women were found to be absent more frequently

at LOY
OLA
UN
IV O
F C
HIC
AG
O on A
pril 11, 2016eaq.sagepub.com
Dow
nloaded from
TABLE3 Pearson's Correlation Coefficients (N = 265)
Variable 1 2 3 4 5 6 7 8 9 JO 11 12 13
Absenteeism variables I. Total days absent 2. Absence frequency .578***
Ability-to-attend variables 3. Distance from work .066 .145** 4. Number of dependents .082 -.040 -.002 5. Employee age .003 .045 -.()97 .132 6. Organizational tenure -.014 .010 -.094 .068 .soo• 7. Role conflict .005 .054 -.009 -.234*** -.274*** -.190**
Motivation-to-attend variables 8. Job involvement -.073 -.158** -.073 -.129* .073 .088 .173** 9. Job satisfaction (work) -.017 -.084 .093 -.020 .014 .011 .082 -.134*
10. Job satisfaction (peers) .019 .010 .002 -.016 -.001 .080 .063 -.048 .238*** 11. Job satisfaction (promotions) -.026 -.004 .078 -.026 -.006 .006 .060 -.030 .320*** .233*** 12. Job satisfaction (supervisor) -.033 -.053 .058 -.035 -.018 -.021 .o30 -.052 .238*** .263*** .169** 13. Job satisfaction (pay) .164** .o75 -.044 -.133* -.030 .024 -.065 .007 .142* .165** .184** .125* 14. Job satisfaction (general) .021 -.114 .065 -.104 -.005 .023 .130* -.159** .510*** .358*** .216*** .339*** .235***
*p < .05; **p < .01; ***p < .001.
"' ... IC

at LOYOLA UNIV OF CHICAGO on April 11, 2016eaq.sagepub.comDownloaded from
520 Educational Administration Quarterly
TABLE4 Canonical Correlation Analysis (N = 265)
Canonical Approximate Canonical Function Co"elation SE R2 F
2 .3695 .3316
.0622
.0641 .1365 .1099
1.789 1.701
Probability > F Proportion
.0094
.0641 .5614 .4386
than men (X = 2.84 and X = 1_.22, p < .008...1.-respectively), and women were absent more days than men (X = 5.32 and X = 3.21,p < .008, respectively). Male teacher~ indicated t~t they had more dependents than did female respondents (X = 1.29 and X = .96,p < .04, respectively). !:!owever, fem~es expressed a higher level of job involvement tha.!!_ males (X = _±:52 and X = 4.18, p < .05, respectively), more role conflict (~ = 4.30 and ~ = 3.46, p < .02, respectively), more satisfaction with peers (X = 2.53 and X = b38,p < .03, ~spectively), and higher general satisfaction with their jobs (X = 2.53 and X = 2.39, p < .03, respectively). The results of ANOVA indicated that centrality of life was significantly related (p < .004) to the number of dependents. Employees who are more job oriented had fewer dependents and were more involved in their jobs.
Canonical correlation analysis was used to further explore the relationship among absence frequency/total days absent and the independent variables. This methodology was appropriate because the prime interest of the study was to examine the strength of the relationship between the sets of dependent and independent variables. In determining which canonical functions to interpret, the magnitude and significance of the canonical correlation and the redundancy index must be calculated. The canonical correlation measures the strength of the overall relationships between the linear composites of the independent and dependent sets of variables. As shown in Table 4, the canonical correlation of .370 for the first function, when squared, provides an estimate that there is 14% of the shared variance between the canonical variants. This canonical relationship is statistically significant at p < .01. In the second function, there is 11 % of the shared variance between the canonical variants. This function is nonsignificant.
The redundancy index determines the amount of shared variance that can be explained by each canonical function. The redundancy index indicates that in the first function, 56% of the variance in the dependent variables has been explained by the canonical variate for the independent variable set. In the second function, 44% of the shared variance can be explained by the canonical function.

at LOYOLA UNIV OF CHICAGO on April 11, 2016eaq.sagepub.comDownloaded from
Scott, Wimbush I SECONDARY TEACHERS' ABSENTEEISM 521
TABLES Canonical Structure
Variable Function 1* Function2
Absenteeism variables Total days absent .6786 .7345 Absence frequency .9866 -.1629
Ability-to-attend variables Distance from work .3207 -.1032 Number of dependents .0755 .5317 Employee age .1780 -.2356 Organization tenure .1593 -.1983 Role conflict .0745 -.0944 Gender .4641 .1086
Motivation-to-attend variables Job involvement -.5077 .1347 Job satisfaction (work) -.1899 .2018 Job satisfaction (co-workers) -.1982 -.0355 Job satisfaction (promotions) -.1085 .0119 Job satisfaction (supervisors) -.2248 .0271 Job satisfaction (pay) .2386 .5203 Job satisfaction (general) -.3339 .4005 Centrality of work .3049 .2132
•p < .01.
The canonical functions, as shown in Table 5, reflect the variance that the observed variable shared with the canonical variate. In the first canonical function, absence frequency showed a high correlation with the independent canonical variate of .987, while total days absent had a lesser correlation of .679. In the second canonical function, total days absent had a high correlation with the independent canonical variate of .735, and absence frequency had a lesser correlation of -.163. By squaring these terms, the percentage of the variance for each of the dependent variables explained by each canonical function was determined. In the first canonical function, 97% of the variance for absence frequency was explained by the function, whereas 54% of the variance for total days absent was explained by the second canonical function. The canonical loadings in Table 5 are given for the ability-to-attend and motivation-to-attend independent variables. While specific guidelines for acceptable sizes of canonical correlations do not exist, generally, the decision rules used for significant factor loadings are recommended (see Hair, Anderson, & Tatham, 1987). For this reason, the decision rule adapted for this study was to accept the correlate if the variance explained by the item

at LOYOLA UNIV OF CHICAGO on April 11, 2016eaq.sagepub.comDownloaded from
522 Educational Administration Quarterly
was greater than or equal to .30. The canonical loadings indicated that in the first canonical function, distance from home to work (.321) and gender (.464) were both positively related to absence frequency, while job involvement (-.508) and general job satisfaction (-.334) were both negatively related. By squaring the canonical loadings, the amount of variance in the independent variables explained by absence frequency and total days absent was obtained. Thus 10% (distance from home to work), 22% (gender), 26% Gob involvement), and 11 % (general job satisfaction) of the variance in these independent variables were explained by absence frequency and total days absent. In the second function, the number of dependents (.532), satisfaction with pay (.520), and general job satisfaction (.401) were positively related to the dependent variables. These loadings indicated that 28%, 27%, and 16%, respectively, of the variance in these independent variables was explained by absence frequency and total days absent.
A large amount (64%) of the shared variance in absence frequency and total days absent measures of teachers was determined by a teacher's distance from home to work, gender, job involvement, and job satisfaction in general. While 36% of a teacher's absenteeism was due to the number of dependents, gender, job satisfaction with pay, and general job satisfaction, this function was nonsignificant and therefore will not be considered further. Although a large amount of the shared variance in absenteeism was explained by attendance motivation variables and perceived ability-to-attend variables in the first function, these results were tempered by two important facts. First, the strength of the overall relationships between the linear composites of absenteeism and independent variables was small, with only 14% of the shared variance between the canonical variates. The other concern was that canonical loadings may be subject to considerable variability due to change or the result of extraneous factors (Hair et al., 1987). To minimize these effects, canonical cross-loadings have been suggested as an alternative method (Hair et al., 1987). Canonical cross-loadings were computed and are shown in Table 6.
These data (canonical cross-loading) show that absenteeism variables have low correlations with the independent canonical variate: .364 for absence frequency and .251 for absence duration. Squaring these correlations indicates that 13% and 6%, respectively, of the variance for each dependent variable was explained by the first function. The magnitude of the cross-loadings was also much less than those for the canonical loadings reported earlier.
Different absenteeism rates, demographics, and employee attitudes were subsequently analyzed between schools. Absence frequency (F = 3. 74, p < .001), job satisfaction with work (F = 2.33, p < .01), job satisfaction with supervisor (principal) (F = 7.25, p < .001), job satisfaction with pay (F =

at LOYOLA UNIV OF CHICAGO on April 11, 2016eaq.sagepub.comDownloaded from
Scott, Wimbush I SECONDARY TEACHERS' ABSENTEEISM 523
TABLE6 Canonical Cross-Loadings
Variable Function 1* Function 2
Absenteeism variables Total days absent .2507 .2435 Absence frequency .3645 -.0540
Ability-to-attend variables Distance from work .1185 -.0342 Number of dependents .0279 .1763 Employee age .0658 -.0781 Organization tenure .0588 -.0657 Role conflict .0275 -.0313 Gender .1715 .0360
Motivation-to-attend variables Job involvement -.1876 .0446 Job satisfaction (work) -.0702 .0669 Job satisfaction (co-workers) -.0732 -.0118 Job satisfaction (promotions) -.0401 .0039 Job satisfaction (supervisors) -.0830 .0090 Job satisfaction (pay) .0882 .1725 Job satisfaction (general) -.1233 .1328 Centrality of work -.1127 .0707
*p < .01.
2.51, p < .01), and general job satisfaction (F = 2.07, p < .05) were significantly different between schools. However, the number of schools examined within the county system was not large enough to determine the nature of these relationships.
DISCUSSION
The purpose of this study was to examine a set of variables which were related to teacher absenteeism. From the Steers and Rhodes (1978, 1990) models, variables associated with perceived ability to attend and motivation to attend were hypothesized to be related to attendance behavior. The variables assoc:iated with perceived ability to attend included number of dependents, age, tenure, distance from home to work, and role conflict. Attendance motivation variables included satisfaction with pay, with promotions, with peers, with supervisors, and with the work itself, job satisfaction in general, central life interest, and job involvement. The canonical correla-

at LOYOLA UNIV OF CHICAGO on April 11, 2016eaq.sagepub.comDownloaded from
524 Educational Administration Quarterly
tion analysis suggested that only some of the Rhodes and Steers motivationto-attend variables (i.e., job involvement and job satisfaction) and ability-toattend variables (i.e., gender and distance from home to work) had an impact on the absenteeism of teachers and that these variables accounted for 13% of the variance in absenteeism.
Ability to Attend
School administrators have very little control over most of the ability-toattend variables. The diversity in age, tenure, and number of dependents among teachers in a school system, for example, is a function of organizational life. Some absenteeism due to these variables is not only likely but expected over time. However, contrary to the Rhodes and Steers model, none of these variables were found to be significant. The only ability-to-attend variables which did have an acceptable canonical loading were distance from home to work and gender. Coincidentally, school administrators may have some tools at their disposal to reduce the absenteeism that is related to those two variables. Although school administrators cannot dictate where teachers live, they may be able to reduce absenteeism that is related to travel. For example, school administrations could help employees find reliable methods of transportation by arranging networks for car pools or by identifying alternative transportation methods (i.e., public transportation). A program of this nature would have the additional benefit of reducing participants' personal transportation costs as well as the number of automobiles on highways and streets.
Gender, another variable which had an acceptable canonical loading, may be related to an ability-to-attend issue in regards to child care. Traditionally, absenteeism associated with women has been attributed to child-care responsibilities. Women in this study did indicate more role conflict than men did. It could possibly be that as primary caregivers, women must stay away from work to attend to the needs of a child who might be sick or in need of adult assistance. School administrators could play an important role in reducing this type of absenteeism. Programs such as child-care referral services or even a child-care service for the children of secondary school teachers could prove to be viable mechanisms for dealing with absenteeism associated with child-care problems. In the private sector, there is evidence that such facilities not only reduce absenteeism substantially but improve recruitment and employee morale (Croft & Dilks, 1986). Furthermore, school administrators may try to reshape attitudes about child-care responsibilities. By emphasizing the importance of the teacher's job, women teachers could be encouraged to share more of the child-care responsibility with their spouses.

at LOYOLA UNIV OF CHICAGO on April 11, 2016eaq.sagepub.comDownloaded from
Scott, Wimbush I SECONDARY TEACHERS' ABSENTEEISM 525
The negative relationship between role conflict and number of dependents seems counterintuitive. These findings suggest that teachers with fewer children are involved in many more outside activities, thus experiencing more conflict in choosing which activities to focus their attention on. However, this significant relationship may be a statistical artifact. The fact that women indicate higher levels of role conflict than men and that they also have fewer dependents could very well result in a negative correlation. Furthermore, since teachers with dependents are older, role conflict may be an age-specific problem resulting from being young and inexperienced in juggling multiple demands.
Motivation to Attend
Whereas the ability-to-attend variables offer few yet promising ways for reducing absenteeism, variables associated with teachers' motivation to attend offer more actions that school administrators can take. Job satisfaction, job involvement, and involvement in activities outside of work were found to be related to absenteeism. The attraction of nonwork activities may have presented a source of conflict between work and outside activities. The data provided some support for this as there was a significant positive correlation between role conflict and job involvement (r = .17, p < .01).
Implications also arose from the finding that employees who were generally more satisfied with their jobs had less absenteeism. This finding is consistent with previous research (Martin & Miller, 1986; Scott & Taylor, 1985). Thus it becomes important to consider factors that encourage higher levels of satisfaction for teachers. One factor that has been found to have an impact on teacher satisfaction is teacher-administration relations (Chapman, 1983; Chapman & Lowther, 1982). Pellicer (1984) pointed out some concerns of teachers that if acted on may improve teacher-administration relations and remove some possible sources of job dissatisfaction. These include reducing excessive clerical work required of teachers, better handling of students' behavioral problems, and consistency in dealing with student discipline problems. These recommendations may also help to reduce the negative effects of stress (i.e., teacher burnout).
Limitations
As for most studies, there are some limitations which need to be addressed. It is obvious that the variables identified as important in the teaching environment did not explain a large portion of the variance of absence behavior (similar results have also been found with studies conducted in

at LOYOLA UNIV OF CHICAGO on April 11, 2016eaq.sagepub.comDownloaded from
526 Educational Administration Quarterly
private sector organizations). This could have been the result of inadequacies in the measures or because more important correlates were not identified. It is even plausible that because survey data were examined on only one occasion during the year, attitudes could have varied greatly throughout the year and the attitudinal data collected may not have been representative of the whole year during which absenteeism data were collected. Yet the strength of the relationships between the variables may have been greater than what was shown. This is a possibility because the teachers who provided their social security numbers on the questionnaires had significantly lower levels of absenteeism than those who did not. Had all teachers been included in the analyses, stronger relationships may have been found. At the very least, it is appropriate to suggest that the effect of these variables on absenteeism was actually stronger than was demonstrated by the current data.
Another limitation to the study was that the impact, by school, was not examined in depth. Recognizing that this variable could provide more insight into possible reasons for the low amount of explained variance, ANOVA was used to determine if there were differences in levels of absenteeism and attitudinal variables based on group membership (i.e., schools) rather than an individual analysis of all teachers in the school district. This subsequent analysis was conducted because recent research on absence climate (McKee & Markham, 1990) found some support for the presence of different climates for absenteeism in a private sector organization. McKee and Markham (1990) suggested that these climates are formed based on the shared perceptions of what is expected and rewarded in the organization, and that they affect attendance behavior. The results of the ANOVArevealed differences in levels of absenteeism and job satisfaction (i.e., work, supervisor, pay, and general satisfaction) between schools. Unfortunately, sample sizes were too small to examine the relationships between the variables within the individual schools to perform a meaningful analysis. An implication of this finding is that researchers should consider examining schools as the unit of analysis rather than follow the traditional individual-level analysis used in this study.
CONCLUSION
Absenteeism among teachers remains both a costly problem and a problem which potentially jeopardizes the quality of education that children in our society receive. Even though this study did not fully support the relationships proposed by the Rhodes and Steers model of absenteeism with a sample of teachers, addressing the implications arising from the variables that were

at LOYOLA UNIV OF CHICAGO on April 11, 2016eaq.sagepub.comDownloaded from
Scott, Wimbush I SECONDARY TEACHERS' ABSENTEEISM 527
found to be significant could be useful in reducing absenteeism. Furthermore, the Rhodes and Steers model provides a common basis on which to examine the unique aspects of the teacher's work environment and individual characteristics that may foster absenteeism. An examination of the differences between attendance culture by occupations (teacher, administrators, janitors, cafeteria workers, and so on), school districts, schools, and grade level taught could provide considerable insight into what contributes to this problem. What is clear from this and other research is that absenteeism is a complex phenomenon that needs further exploration.
REFERENCES
Allen, S. G. (1981 ). An empirical model of work attendance. Review of Economics and Statistics, 63, 77-87.
Blau, G., & Boal, K. (1987). Conceptualizing how job involvement and organizational commitment affect turnover and absenteeism.Academy of Management Review, 12, 288-300.
Brayfield, A., & Crockett, W. (1955). Employee attitudes and employee performance.Journal of Applied Psychology, 66, 555-560.
Breaugh, J. A. (1981). Predicting absenteeism from prior absenteeism and work attitudes. Journal of Applied Psychology, 66, 555-560.
Bridges, E. M. (1980). Job satisfaction and teacher absenteeism. Educational Administration Quarterly, 16(2), 41-56.
Bridges, E. M., & Hallinan, M. T. (1978). Subunit siz.e, work system interdependence, and employee absenteeism. Educational Administration Quarterly, 14(2), 24-42.
Brooke, P., Jr. (1986). Beyond the Steers and Rhodes model of employee attendance. Academy of Management Review, 11, 345-356.
Bundren, D. L. (1974). The influence of situational and demographic factors on the absence patterns of teachers. Dissertation Abstracts Internationa~ 35, 1895A.
Chadwick-Jones, J. K., Brown, C. A., Nicholson, N., & Sheppard, C. (1971). Absence measures: Their reliability and stability in an industrial setting. PersoMel Psychology, 24, 463-470.
Chadwick-Jones, J. K., Nicholson, N., & Brown, C. (1982). Social psychology of absenteeism. New York: Praeger.
Chapman, D. W. (1983). Career satisfaction of teachers. Educational Research Quarterly, 7(3),
40-50. Chapman, D. W., & Lowther, M.A. (1982). Teachers' satisfaction with teaching. Journal of
Educational Research, 75, 241-247. Cheloha, R. S., & Farr, J. L. (1980). Absenteeism, job involvement, and job satisfaction in an
organizational setting. Journal of Applied Psychology, 65, 467-473. Clegg, C. W. (1983). Psychology of employee lateness, absence, and turnover: A methodological
critique and an empirical study. Journal of Applied Psychology, 68, 88-101. Cook, J. D., Hepworth, S. J., Wall, T. D., & Warr, P. B. (1981). The experience of work. New
York: Academic Press. Croft, N. L., & Dilks, C. (1986). Child care: Your baby. Nation's Business, 74(12), 17. Douglas, S. A. (1976). Social-psychological correlates of teacher absenteeism in a multivariate
study. Dissertation Abstracts Tnternationa~ 37, 7033A-7034a.

at LOYOLA UNIV OF CHICAGO on April 11, 2016eaq.sagepub.comDownloaded from
528 Educational Administration Quarterly
Dubin, R. (1973). Human relations in administration (4th ed.). Englewood Cliffs, NJ: PrenticeHall.
Ferkich, E., & Grassi, F. (1987). Teacher morale project. Thrust, 17(1), 26-28. Foldesy, G., & Foster, L. (1989). The impact, causes, and prevention of excessive teacher
absenteeism. Clearing House, 63, 82-86. Frechette, H. M. (1981, August). An investigation of the utility of Steers and Rhodes' process
model of attendance behavior. Paper presented at the 41st Annual Meeting of the Academy of Management, San Diego.
Garrison, K. R., & Muchinsky, P. M. (1977). Attitudinal and biographical predictors of incidental absenteeism. Journal of Vocational Behavior, 10, 221-230.
Gowler, D. (1969). Determinants of the supply of labour to the firm. Journal of Management Studies, 6, 73-95.
Hackett, R. D. (1989). Work attitudes and employee absenteeism: A synthesis of the literature. Journal of Occupational Psychology, 62, 235-248.
Hair, J. F., Anderson, R. E., & Tatham, R. L. (1987). Multivariate data analysis. New York: Macmillan.
Hammer, T. H., & Landau, J.C. (1981). Methodological issues in the use of absence data.Journal of Applied Psychology, 66, 574-581.
Hammer, T. H., Landau, L. C., & Stem, R. N. (1981 ). Absenteeism when workers have a voice: The case of employee ownership. Journal of Applied Psychology, 61, 561-573.
Herman, J. B. (1973). Are situational contingencies limiting job attitude job performance relationships? Organizational Behavior and Human Performance, 10, 208-224.
Hill, J.M.M., & Trist, E. L. (1953). A consideration of industrial accidents as. a means of withdrawal from the work situation. Human Relations, 6, 357-380.
Hill, S. T. (1982). You can't afford for teachers to be out, so take these steps now to stop absenteeism. Updating Schaol Board Policies, 13(3), 1-4.
Jacobson, S. L. (1989). Pay incentives and teacher absence: One district's experience. Urban Education, 23, 377-391.
Kendall, M. G., & Stuart, A. (1958). The advanced theory of statistics. New York: Hafner. Leigh, J.P. (1983). Sex differences in absenteeism. Industrial Relations, 22, 349-361. Lewis, J., Jr. (1982). Using a computer to monitor teacher absenteeism can save schools money
and increase the time teachers spend in class. American School Board Journal, 169(9), 30-32. Lodahl, T. M., & Kejner, M. (1965). The definition and measurement of job involvement.
Journal of Applied Psychology, 49, 24-33. Manganiello, L. P. (1972). A study to determine the relationship of teacher self-acceptance and
other selected variables to teacher absence behavior (Doctoral dissertation, University of Miami). Dissertation Abstracts lnternationa~ 34, 95A-96A.
Marchant, R. E. (1976). The effects of selected variables on teacher absence behavior (Doctoral dissertation, University of Virginia). Dissertation Abstracts Internationa~ 37, 6187 A.
Markham, S. E., Dansereau, F., & Alulton, J. A. (1982). Female vs. male absence rates: A temporal analysis. Personnel Psychology, 35, 371-382.
Martin, J. K., & Miller, G. A. (1986). Job satisfaction and absenteeism: Organizational, individual, and job-related correlates. Work and Occupations, 13, 33-46.
McKee, G. H., & Markham, S. E. (1990). A multiple-level analysis of attendance climate: Individuals, supervisory groups and plants. In L. R. Jauch & J. L. Wall (Eds.), Academy of Management best papers proceedings (pp. 284-288). Mississippi State, MS: Academy of Management.
Metzner, H., & Mann, F. (1953). Employee attitudes and absences. Personnel Psychology, 6, 467-486.

at LOYOLA UNIV OF CHICAGO on April 11, 2016eaq.sagepub.comDownloaded from
Scott, Wimbush I SECONDARY TEACHERS' ABSENTEEISM 529
Muchinsky, P. M. (1977). Employee absenteeism: A review of the literature. Journal of Vocational Behavior, 10, 316-340.
Nicholson, N. (1977). Absence behavior and attendance motivation: A conceptual synthesis. Journal of Management Studies, 14, 231-252.
Pellicer, L. 0. (1984). Job satisfaction-Its impact upon teacher attendance. Journal of the National Association of Secondary School Principals, 68(475), 44-47.
Redmond, M. E. (1978). The relationships of selected factors to illness absences in the Fort Madison community school district-A case study (Doctoral dissertation, University of Iowa). Dissertation Abstracts lnternationa~ 39, 3291A-3292A.
Rhodes, S. R., & Steers, R. M. (1990). Managing employee absenteeism. Reading, MA: Addison-Wesley.
SAS Institute, Inc. (1982). SAS user's guide. Cary, NC: Author. Scott, K. D., & Mabes, D. (1984). Job satisfaction/absenteeism relationship: Gender as a
moderating variable. Akron Business and Economic Review, 15(3), 43-47. Scott, K. D., & Taylor, G. S. (1985). An examination of the conflicting findings between job
satisfaction and absenteeism: A meta-analysis. Academy of Management Journa~ 28, 599-612.
Schneider, B. (1975). Organizational climate: An essay. Personnel Psychology, 28, 447-479. Skidmore, D. E. (1984). We used these few simple steps to cut teacher absenteeism in half- and
increased productive class time and community support in the bargain. American School Board Journal, 171(3), 40-41.
Smith, P. C., & Sandman, B. A. (1981). Some past, present, and future developments in the understanding and use of the Job Description Index. Virginia Tech Symposium on Applied Behavioral Science. Lexington, MA: Lexington Books.
Steers, R. M., & Rhodes, S. R. (1978). Major influences on employee attendance: A process model. Journal of Applied Psychology, 63, 391-407.
Steers, R. M., & Rhodes, S. R. (1984). Knowledge and speculation about absenteeism. In P. S. Goodman & R. S. Atkin (Eds.),Absenteeism: New approaches to understanding, measuring, and managing employee absence. San Francisco: Jossey-Bass.
Taylor, D. E. (1981). Absences from work among full-time employees. Monthly Labor Review, 104(3), 68-70.
Terborg, J. R. (1980). A multivariate investigation of employee absenteeism (fech. Rep. No. 80-5). Houston: University of Houston Press.
Watson, C. J. (1981 ). An evaluation of some aspects of the Steers and Rhodes model of employee attendance. Journal of Applied Psychology, 66, 385-389.
Winkler, D. R. (1980). The effects of sick-leave policy on teacher absenteeism. Industrial and Labor Relations Review, 33, 232-240.