Embed Size (px)
Citation preview
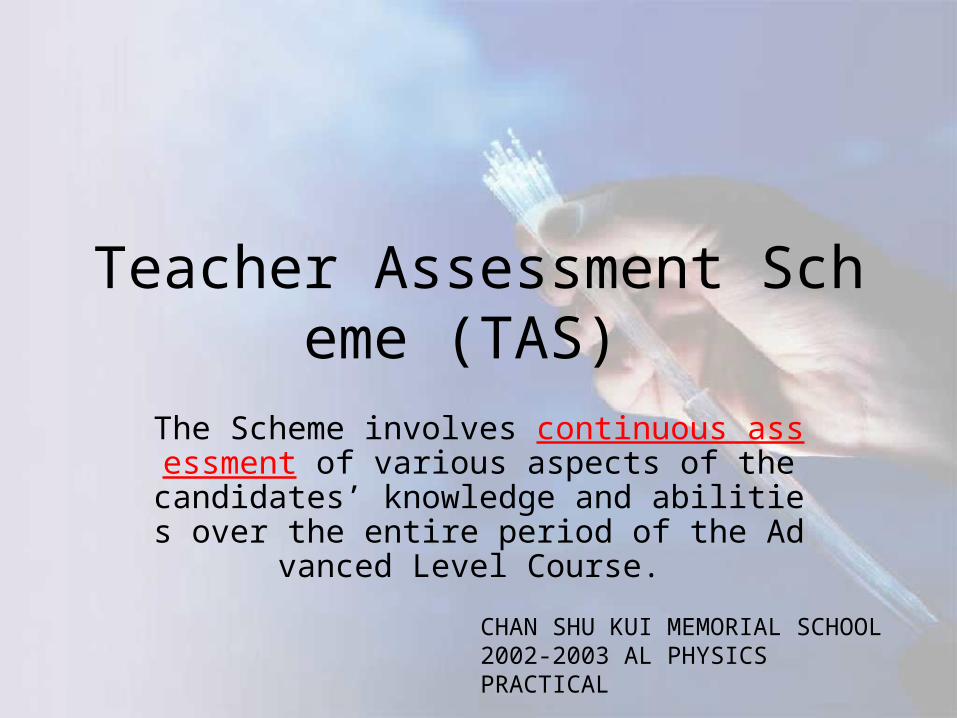
Teacher Assessment Scheme (TAS)
The Scheme involves continuous assessment of various aspects of the candidates’ knowledge and abilities over the entire period of the A
dvanced Level Course.
CHAN SHU KUI MEMORIAL SCHOOL 2002-2003 AL PHYSICS PRACTICAL
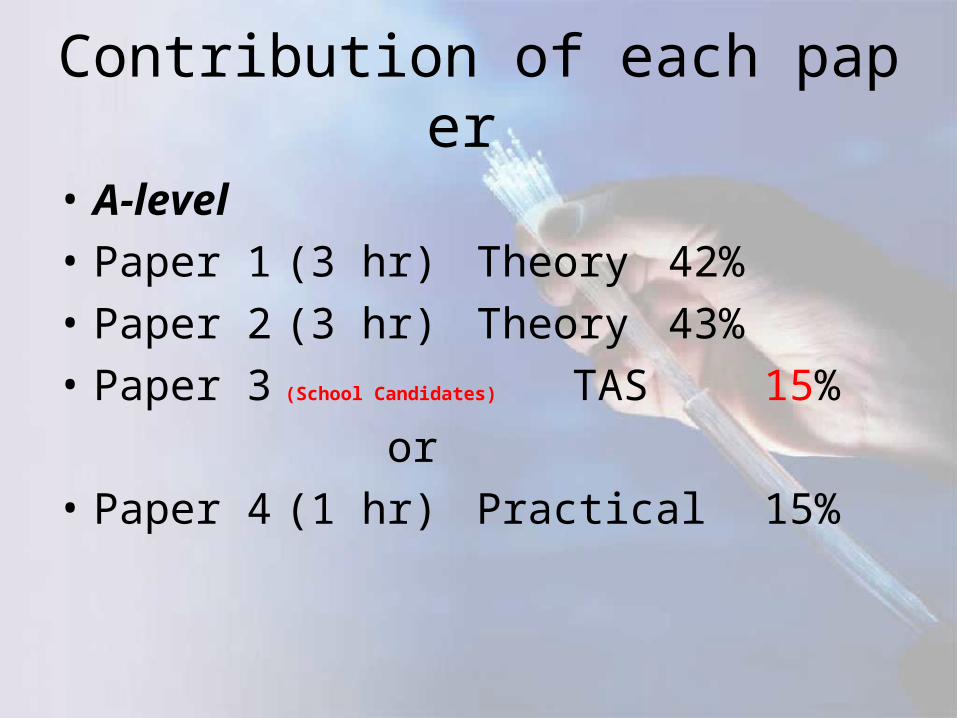
Contribution of each paper
• A-level
• Paper 1 (3 hr) Theory 42%
• Paper 2 (3 hr) Theory 43%
• Paper 3 (School Candidates) TAS 15%
or
• Paper 4 (1 hr) Practical 15%
During the A-level course
• Each candidate is required to keep a complete record of all the practical work performed in the A-level Physics course especially those used for assessment.
• A warning should be issued to students who are frequently absent from assessment activities, fail to submit work for assessment or fail to meet the minimum requirements.
Plagiarism and disqualification
• Any candidate who uses or is suspected of using any unfair means is to be reported immediately to the HKEA. If the HKEA is satisfied that a breach of the regulations has occurred, the candidate will be liable to be disqualified from the current A-level Physics Examination or the whole of the current A-level Examination.
• If a candidate is found to have engaged in plagiarism, the teacher will have to discount completely the exercise concerned and a mark of “0” be awarded to that particular assessment.
By the end of the A-level course
• Candidates’ should return all assessed work to their S7 Physics teacher for custody after the theory examination. Samples of candidates’ work will be collected by the HKEA for moderation purposes.
Making Assessments
• A scheme of marking (e.g. checklist) : to mark different parts of the student’s work/written reports – manipulation, – observations, – accuracy, – data treatment, – planning and – interpretation
• Impression marking
The assessment consists of two areas :
• Performance in practical work 66.7%
• Reporting of practical work 33.3%

Criteria involved in assessing performance in practical work
• The procedure for practical work is carried out safely
• Work is done in an organised and efficient way
• Apparatus are handled competently • Instruments are used in appropriate ways to
make accurate readings and measurements • Positive attitude towards scientific investigat
ion
REPORTING OF PRACTICAL WORK
• Quality of the written accounts on the procedures and techniques– Suitable techniques, including apparatus and
materials to be used, are stated. – The procedure shows a logical ordering of ste
ps and is written up clearly – Various precautions are mentioned and expla
ined.
REPORTING OF PRACTICAL WORK
• Quality of the recording and presentation of results – record of results indicates a high quality of ac
curacy. Appropriate units are stated. – Results are presented in appropriate forms su
ch as tables or graphs. – Calculations where necessary are clearly sho
wn.
REPORTING OF PRACTICAL WORK
• Quality of the interpretation of the results and conclusion – Trends and patterns in data are recognized. – Appropriate interpretations are made on the results in
relation to the problem under investigation. – A clear awareness is shown on the limitations of the
methods used, sources of errors and their influence on the accuracy of the results obtained.
– Suggestions for improvement in technique and for further investigations are given where appropriate.
– Appropriate conclusions are drawn, supported by reasoned arguments..
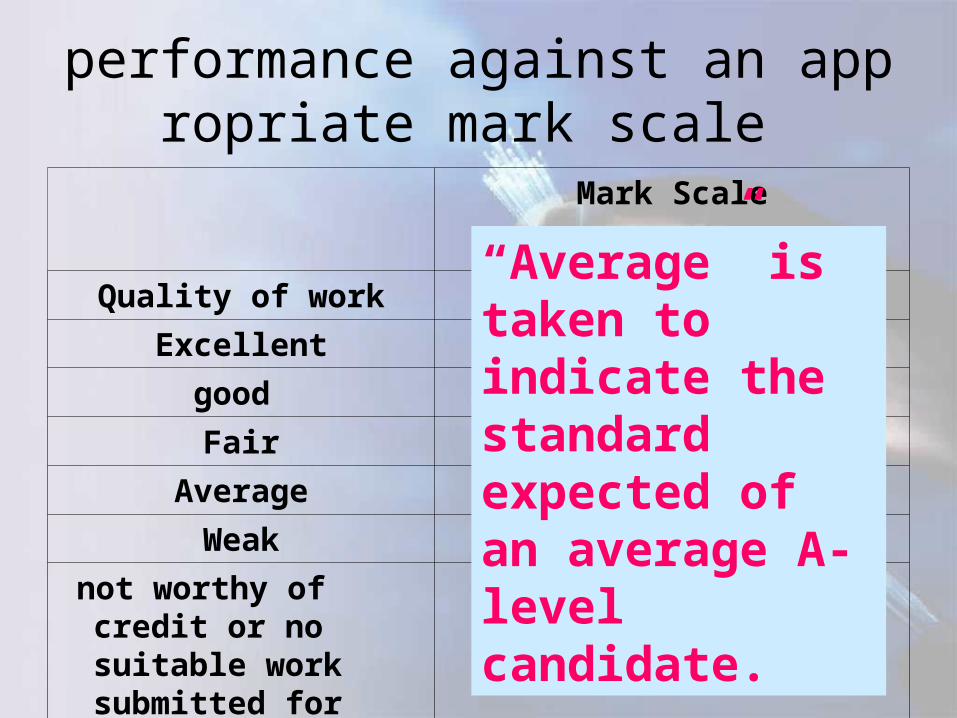
performance against an appropriate mark scale
Mark Scale
Quality of work 10-point scale
Excellent 9 - 10
good 7 - 8
Fair 5 - 6
Average 3 - 4
Weak 1 - 2
not worthy of credit or no suitable work submitted for assessment
0
“Average” is taken to indicate the standard expected of an average A-level candidate.
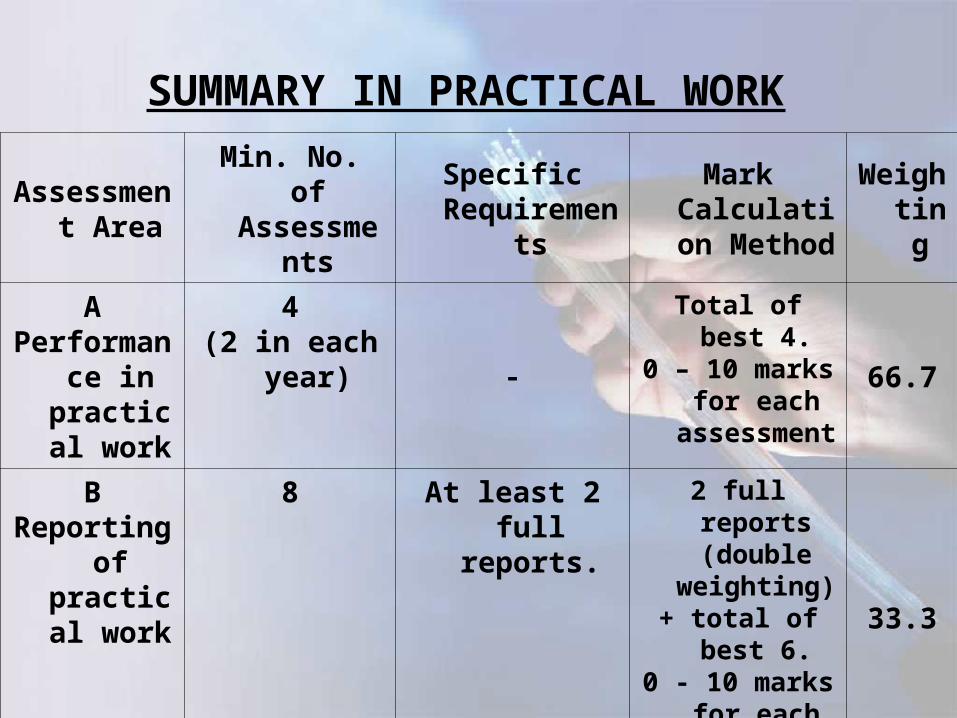
SUMMARY IN PRACTICAL WORK
Assessment Area
Min. No. of Assessments
Specific Requirements
Mark Calculation
Method
Weighting
APerformance
in practical
work
4(2 in each
year)
Total of best 4.0 – 10 marks for
each assessment
66.7
BReporting of
practical work
8 At least 2 full reports.
2 full reports (double
weighting) + total of best 6.0 - 10 marks for
each assessment
33.3
Language Medium of TAS
• The language used in the reports in S.7 must be consistent with that chosen for the written paper
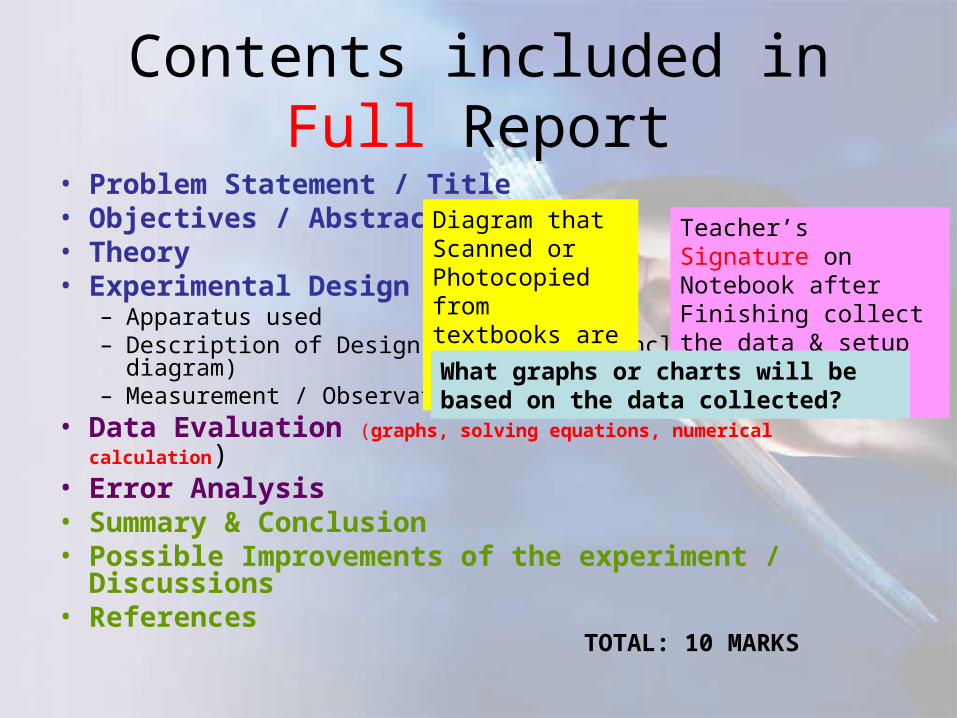
Contents included in Full Report
• Problem Statement / Title• Objectives / Abstract• Theory• Experimental Design
– Apparatus used– Description of Design / Procedure (include Setup diagram)– Measurement / Observations
• Data Evaluation (graphs, solving equations, numerical calculation)• Error Analysis• Summary & Conclusion• Possible Improvements of the experiment /
Discussions• References
Diagram that Scanned or Photocopied from textbooks are NOT ALLOWED!!!
Teacher’s Signature on Notebook after Finishing collect the data & setup diagram (hand write).
What data will be collected?How many trials will be completed?How will the variables be controlled?How will the data be interpreted?What graphs or charts will be based on
the data collected?
TOTAL: 10 MARKS
Student checklist for lab. period
• Have you got the Lab. Notebook, a graph paper book & the Lab. Manual?
• Do you have a sharp pencil, an eraser, a calculator & a transparent ruler?
• Do you have the appropriate appearance of eager anticipation?
• Have you prepared the experiments by studying the manual?
• Have you read the lab. Manual before coming the Laboratory?
• Have you read the introduction of graphs, errors, & significant figures?
BONUS
• Encourage the use of I.T. in handling the reports.– Use word processor like Microsoft Words to
type the full report.– Use Spreadsheets program like Microsoft
Excel to plot graph
Remember…
• Keeping a lab. Notebook• Record all reading directly• Do not rely on your mental arithmetic• Record reading in tables with name & unit on
each columns• Do not overwrite numbers, cross out the wrong
no. & record the new one alongside• Record all observations• Use plenty of space
Remember…
• Take average readings from raw data• Check the order of magnitude• Ask yourself whether your calculation or
measurement looks reasonable• Suppress meaningless digits arises from
calculation (avoid round off too crudely, check that inaccuracies introduced by rounding-off are negligible compared with the experimental error.)
• Always estimate errors in experimental measurements & calculations
• Only quote errors to one (or maybe two) sig. fig
Remember…
• Plot the dependent variable along the vertical axis & the independent one along the horizontal axis
• Label the axes with name & unit• Plot points as small dots in circles or crosses• Include error bar it there are errors in the variables• In general, put a smooth curve through the points, not a
zig-zag• Plot the graph as the experiment proceeds• When straight line obtained, it means the expression is i
n the form y = mx + C• Use spreadsheet programs to plot graph for high accura
cy
Remember…
• In write up full report, DO NOT REPEAT obvious details & theoretical derivations that may be given as background in the laboratory manual
• It is suggested to write the theory, procedures, measurements … in your OWN words, direct copy from lab. Manual; use copy & paste or even scanned from textbooks is prohibited
• The language written in the report should be concise & objective, never refer yourself as “I” but rather “WE” instead. Even better, take you away & use “Passive Voice”, in particular, for the procedure of the experiment, use past tense
*** THANK YOU ***
Please prepared the experiment A1 – Centripetal Force (P.28-30)