Embed Size (px)
Citation preview
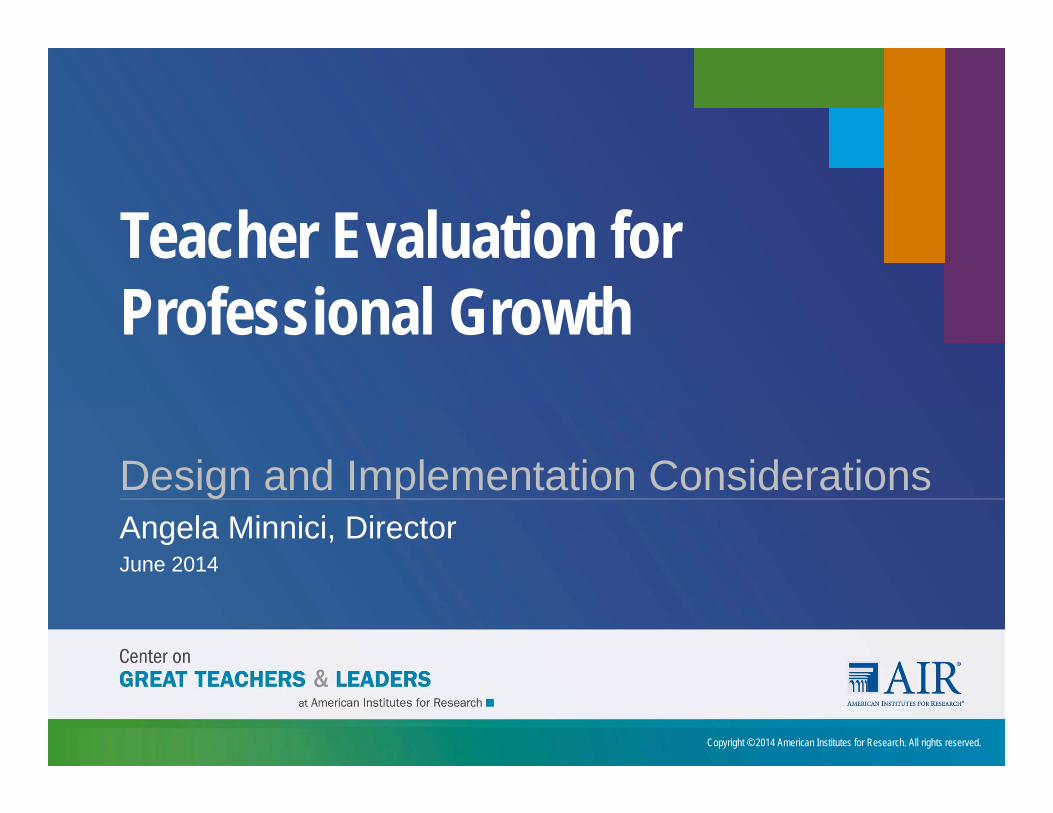
Teacher Evaluation for Professional Growth
Copyright © 2014 American Institutes for Research. All rights reserved.
Design and Implementation Considerations Angela Minnici, DirectorJune 2014
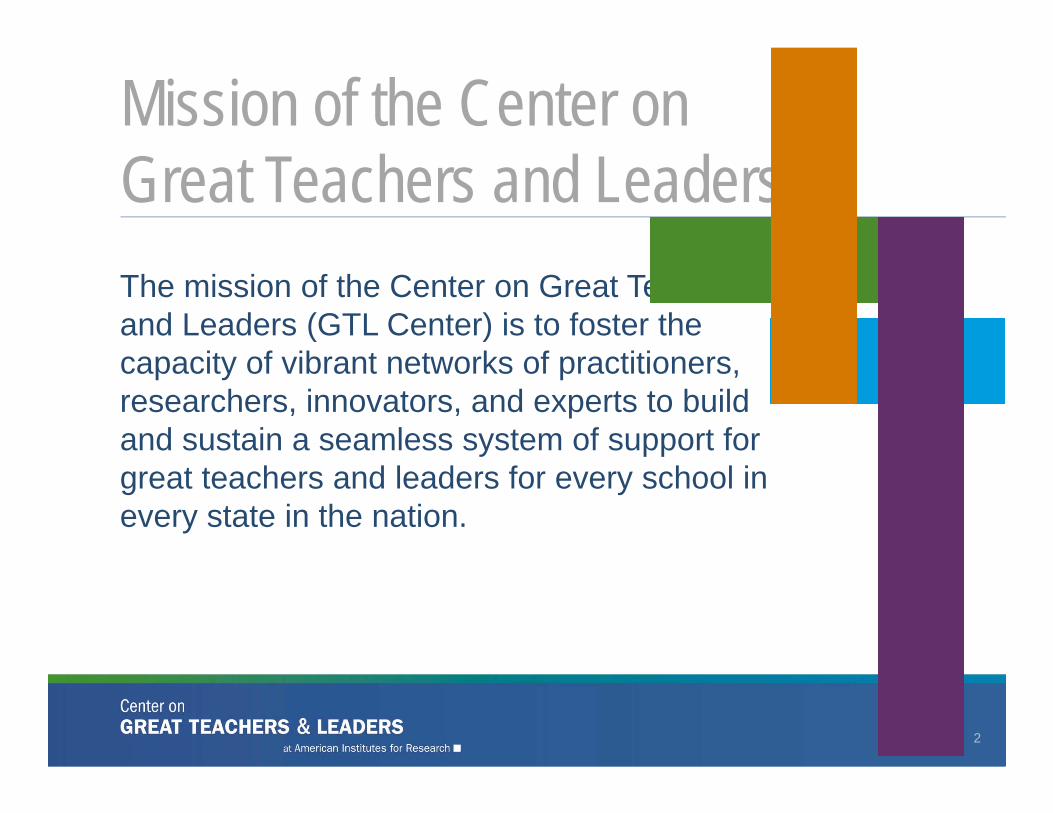
The mission of the Center on Great Teachers and Leaders (GTL Center) is to foster the capacity of vibrant networks of practitioners, researchers, innovators, and experts to build and sustain a seamless system of support for great teachers and leaders for every school in every state in the nation.
Mission of the Center on Great Teachers and Leaders
2
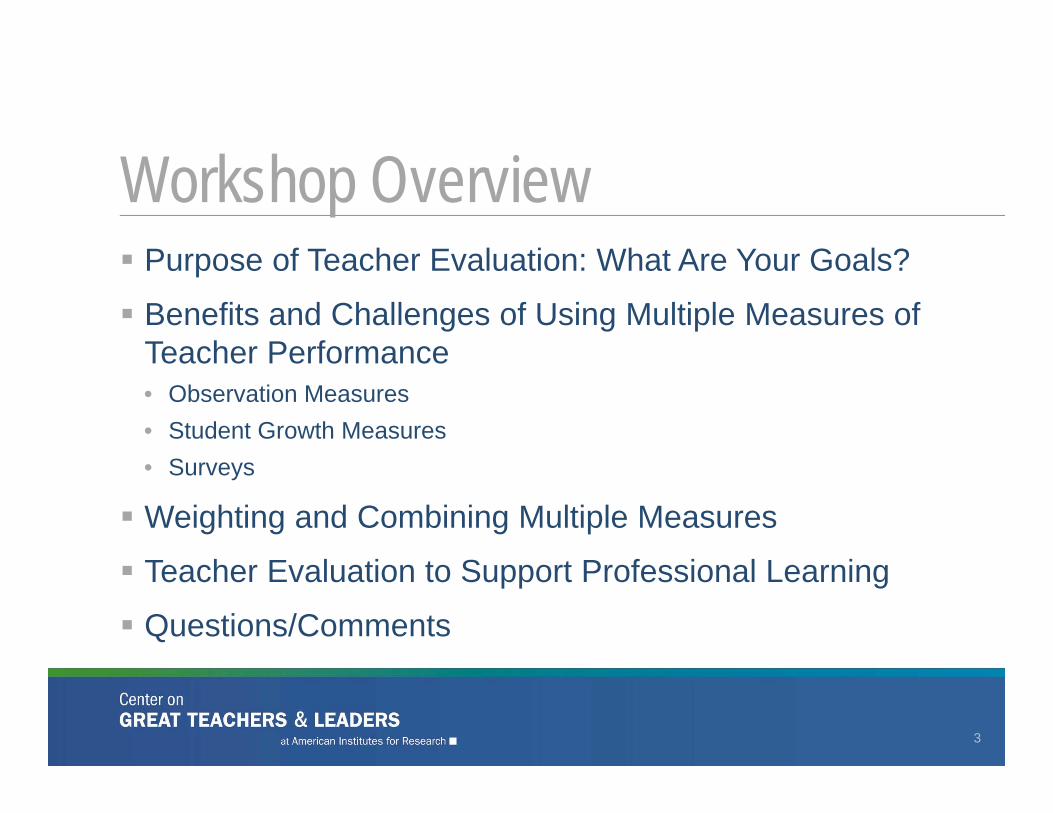
Purpose of Teacher Evaluation: What Are Your Goals?
Benefits and Challenges of Using Multiple Measures of Teacher Performance• Observation Measures• Student Growth Measures• Surveys
Weighting and Combining Multiple Measures
Teacher Evaluation to Support Professional Learning
Questions/Comments
Workshop Overview
3
Purposes of Teacher Evaluation
4
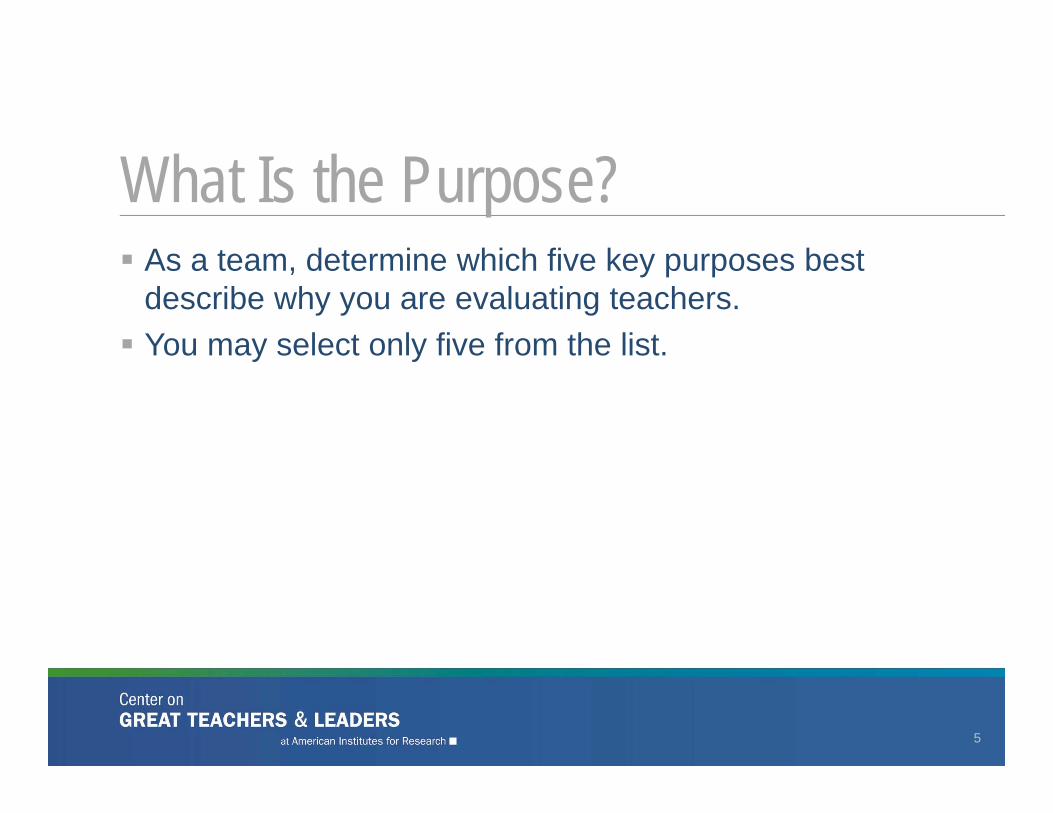
What Is the Purpose?
5
As a team, determine which five key purposes best describe why you are evaluating teachers. You may select only five from the list.
Benefits and Challenges of Multiple Measures of Teacher Performance
6
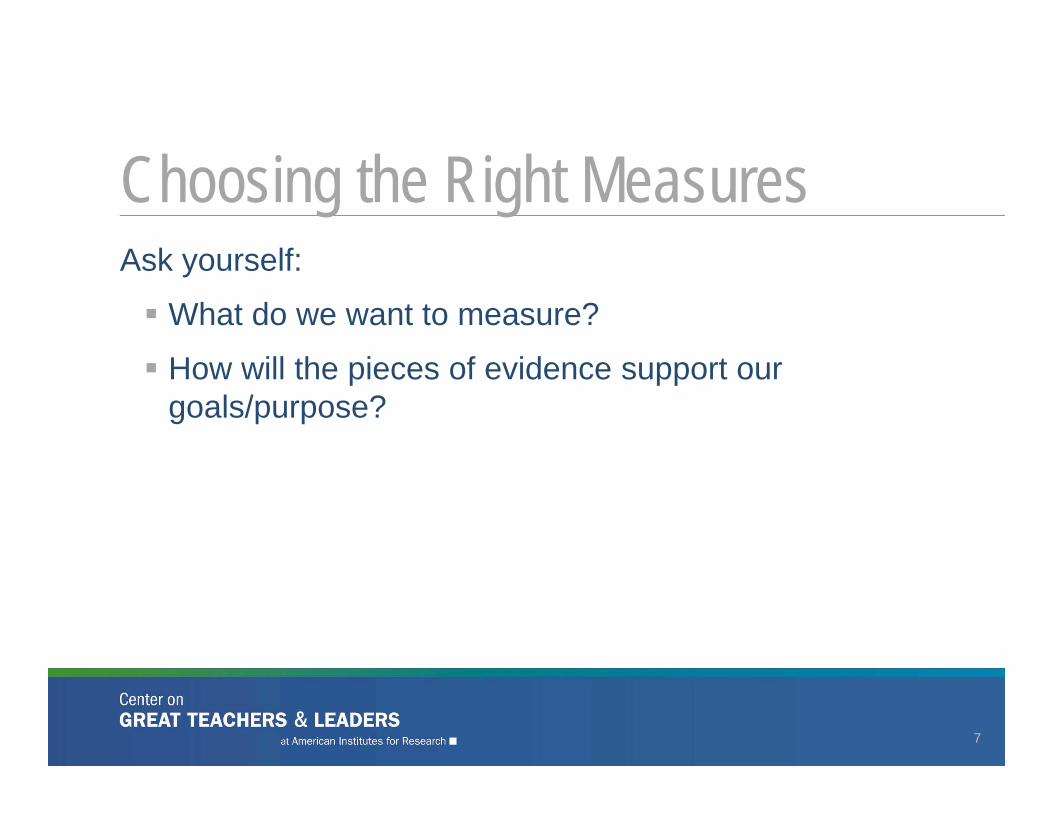
Ask yourself:
What do we want to measure?
How will the pieces of evidence support our goals/purpose?
7
Choosing the Right Measures
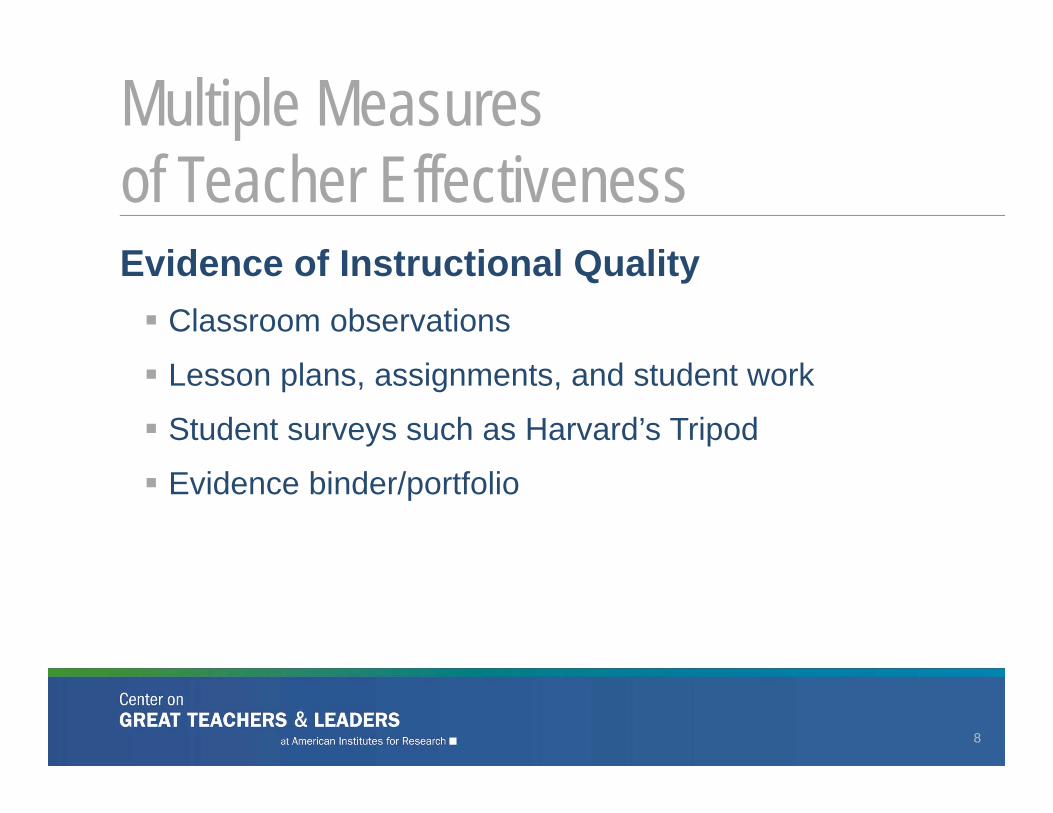
Evidence of Instructional Quality Classroom observations
Lesson plans, assignments, and student work
Student surveys such as Harvard’s Tripod
Evidence binder/portfolio
Multiple Measures of Teacher Effectiveness
8
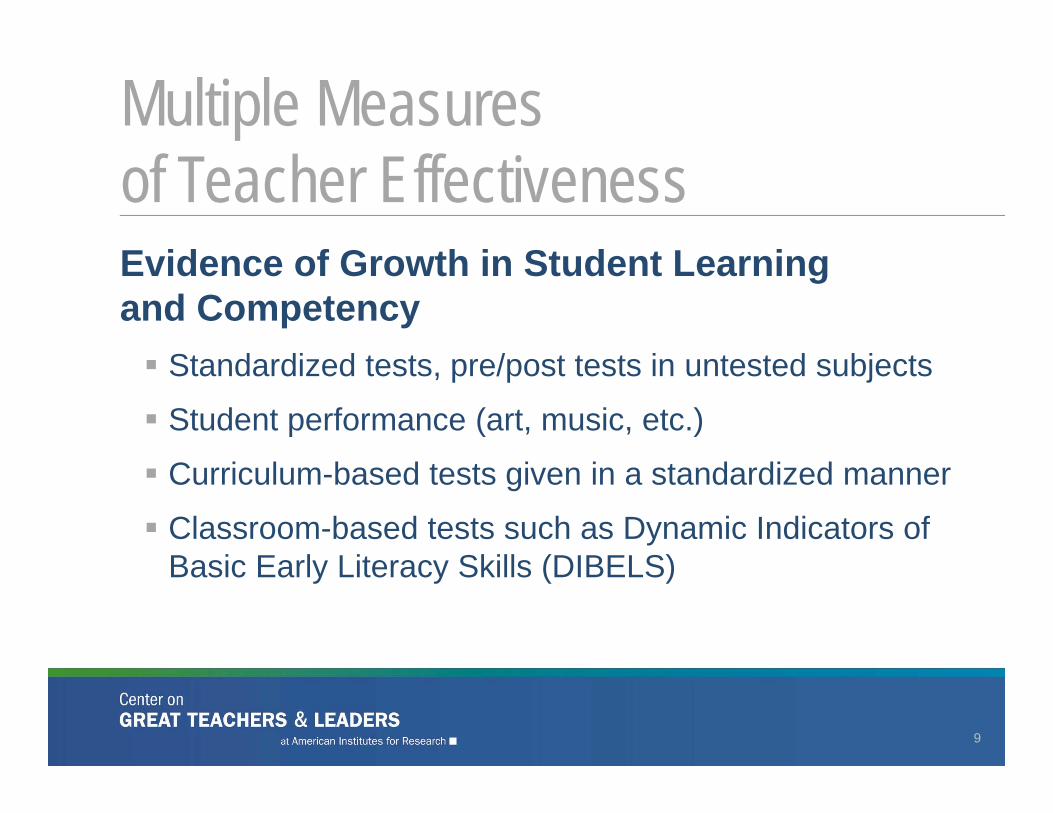
Evidence of Growth in Student Learning and Competency Standardized tests, pre/post tests in untested subjects
Student performance (art, music, etc.)
Curriculum-based tests given in a standardized manner
Classroom-based tests such as Dynamic Indicators of Basic Early Literacy Skills (DIBELS)
Multiple Measures of Teacher Effectiveness
9
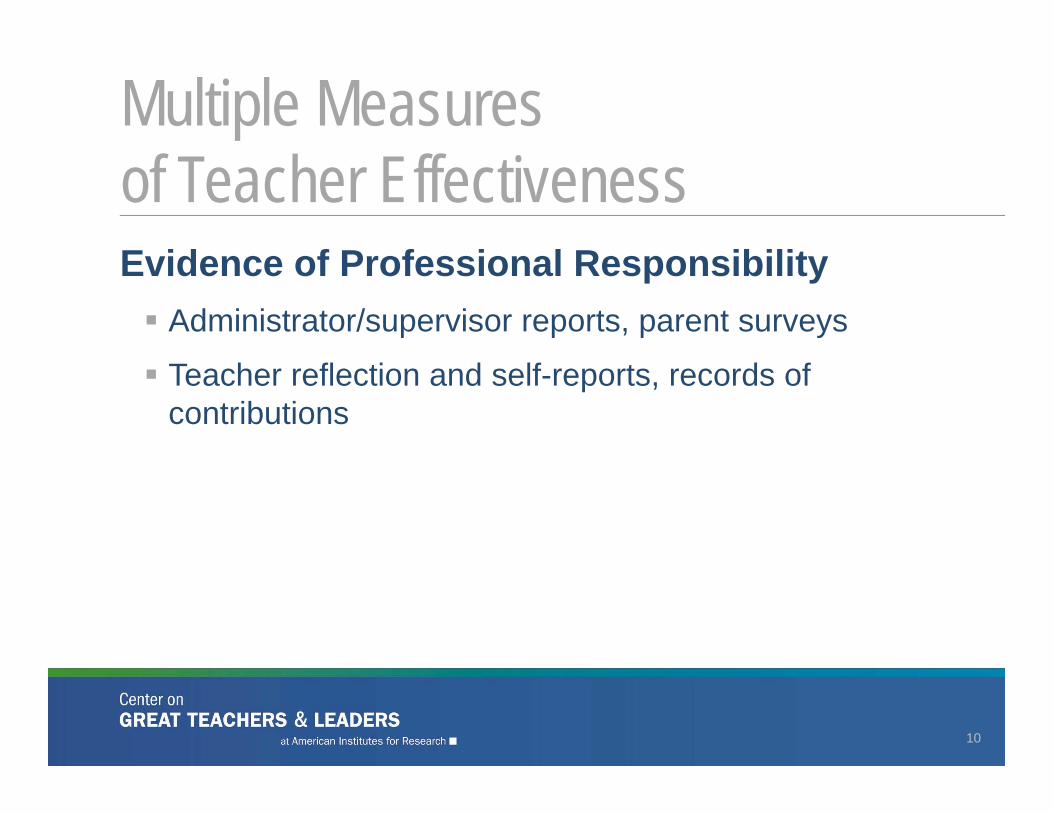
Evidence of Professional Responsibility Administrator/supervisor reports, parent surveys
Teacher reflection and self-reports, records of contributions
Multiple Measures of Teacher Effectiveness
10
Include protocols and processes that teachers can examine and comprehend.
Directly and explicitly align with teaching standards.
Motivate teachers to examine their own practice against specific standards.
Measures That Help Teachers Grow
11
Allow teachers to participate in or co-construct the evaluation (such as portfolios).
Give teachers opportunities to discuss the results for formative purposes with evaluators, administrators, teacher learning communities, mentors, coaches, etc.
Align with and inform professional growth and development offerings.
Measures That Help Teachers Grow
12
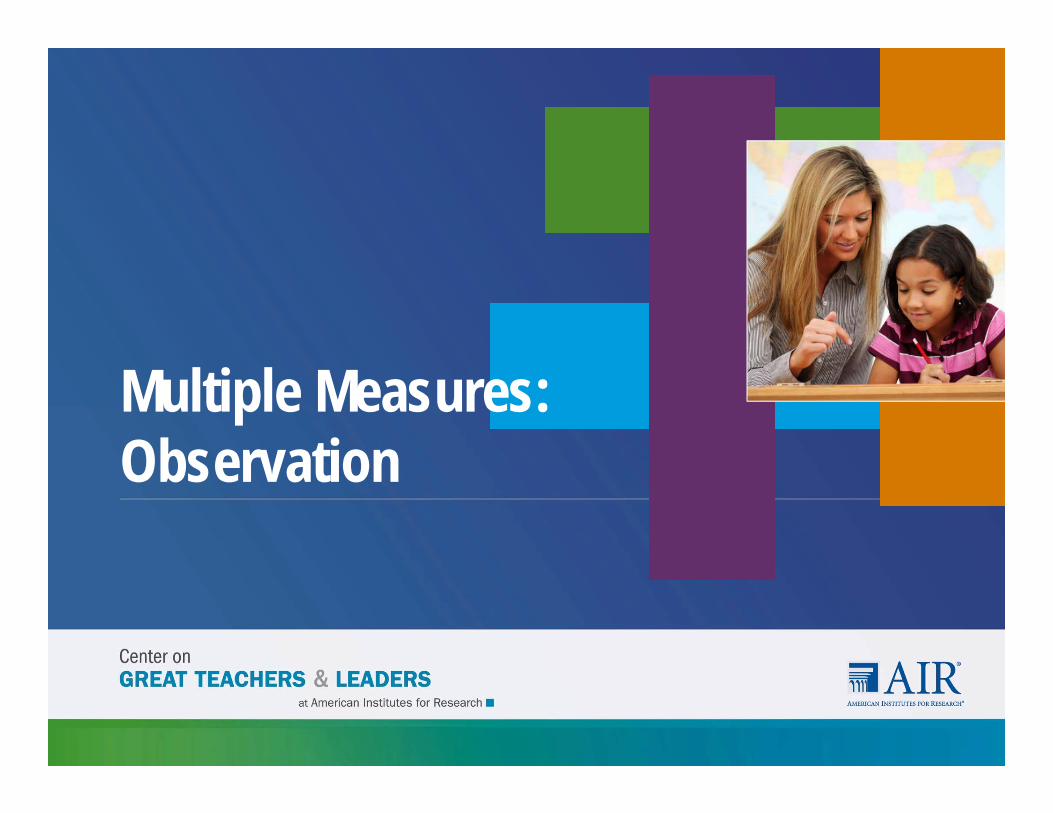
Multiple Measures: Observation
Great for teacher formative evaluation (if observation is followed by opportunity to discuss)
Helps evaluator (principals or others) understand teachers’ needs across school or across district
Teacher Observations: Strengths
14
Only as good as the instruments and the observers Considered “less objective” Expensive to conduct (personnel time, training, calibrating) Variance in validity of observation results depending on
who is conducting observations and the level of training and calibration of observers
Teacher Observations: Weaknesses
15
Observations are the traditional measure of teacher performance.
Teachers feel they have some control over the process and outcomes.
They report that having a conversation with the observation and receiving constructive feedback after the observation is greatly beneficial.
Evidence-centered discussions can help teachers improve instruction.
Peer evaluators often report that they learn new teaching techniques.
Why Teachers Generally Value Observations
16
They do not receive feedback at all.
The feedback they receive is not specific and actionable.
The observer suggests actions but is unable to offer the means and resources to carry out those actions.• Mentors/coaches, other support personnel• Time for individual growth planning/activities• Protected time for collaboration with others
When Teachers Don’t Value Observations, It’s Because…
17
Implementation Considerations for Teacher Observations
18
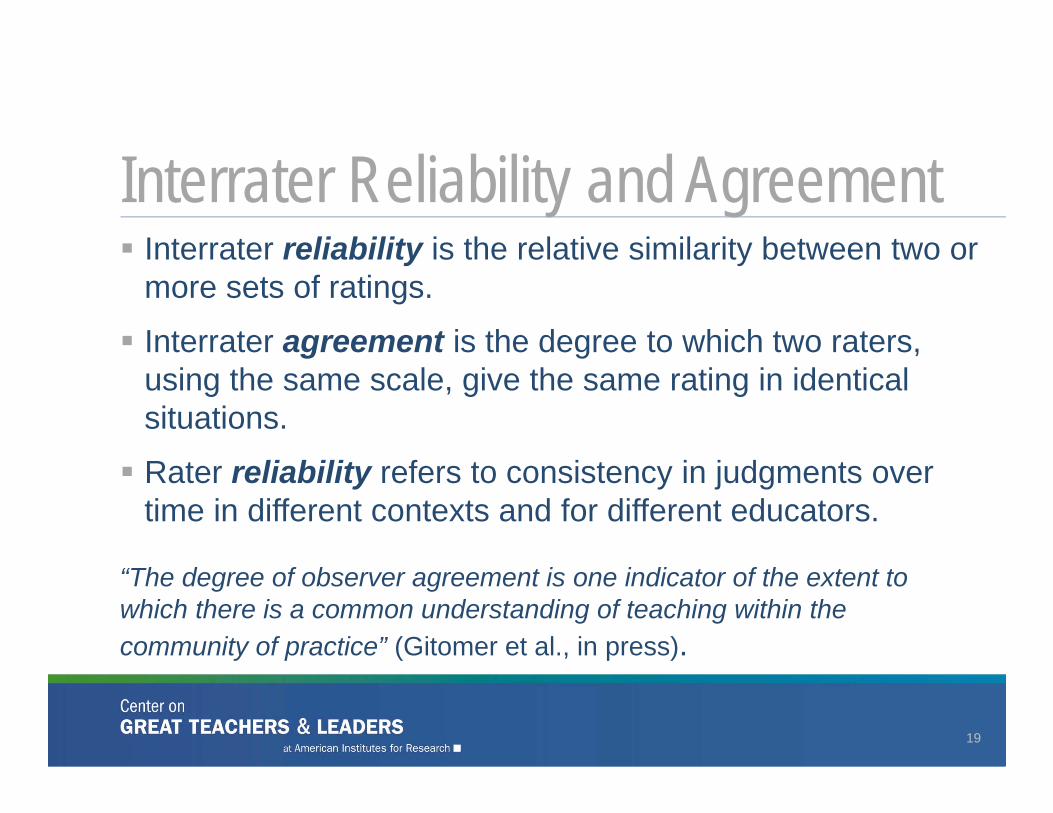
Interrater reliability is the relative similarity between two or more sets of ratings.
Interrater agreement is the degree to which two raters, using the same scale, give the same rating in identical situations.
Rater reliability refers to consistency in judgments over time in different contexts and for different educators.
“The degree of observer agreement is one indicator of the extent to which there is a common understanding of teaching within the community of practice” (Gitomer et al., in press).
Interrater Reliability and Agreement
19
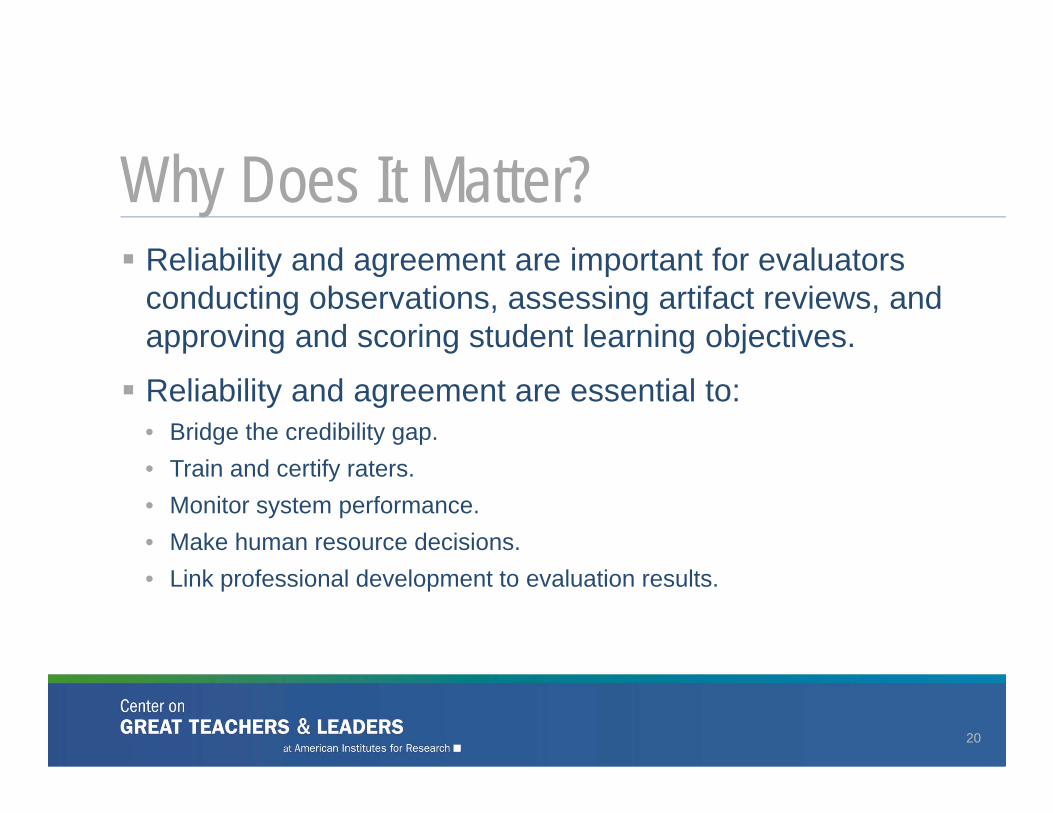
Reliability and agreement are important for evaluators conducting observations, assessing artifact reviews, and approving and scoring student learning objectives.
Reliability and agreement are essential to:• Bridge the credibility gap.• Train and certify raters.• Monitor system performance.• Make human resource decisions.• Link professional development to evaluation results.
Why Does It Matter?
20
What Is Interrater Reliability?
21
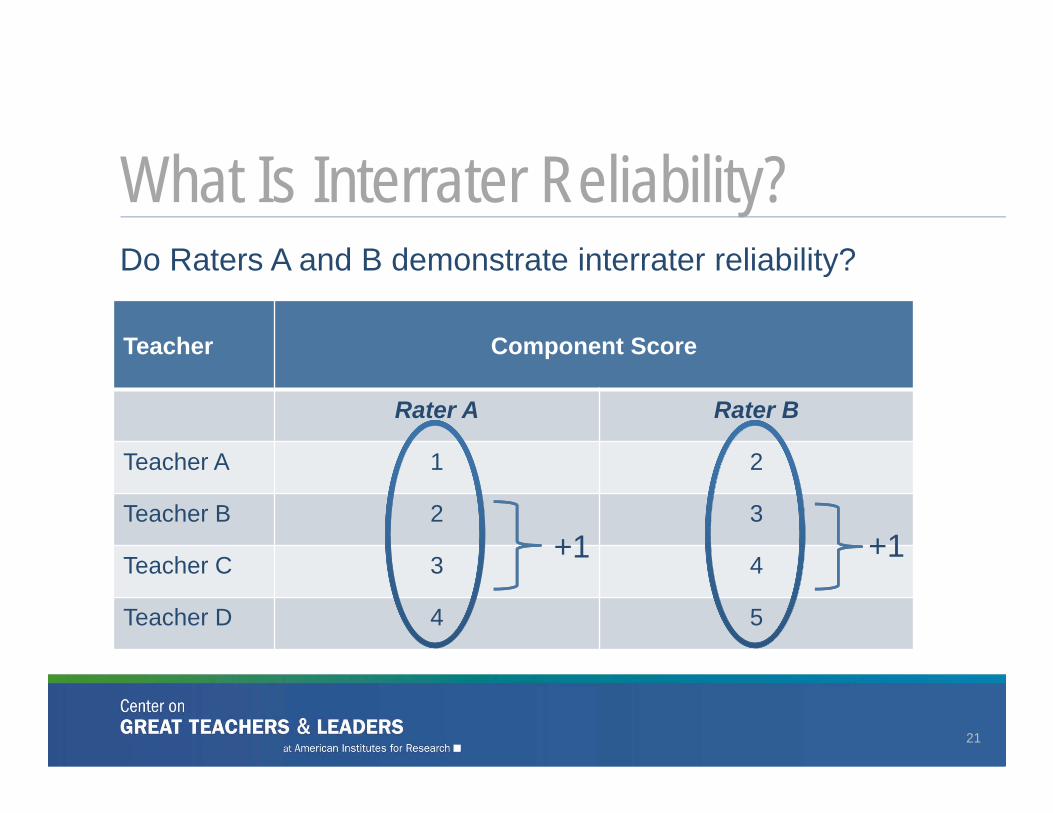
Teacher Component Score
Rater A Rater B
Teacher A 1 2
Teacher B 2 3
Teacher C 3 4
Teacher D 4 5
Do Raters A and B demonstrate interrater reliability?
+1 +1
Illustrating Rater Agreement
22
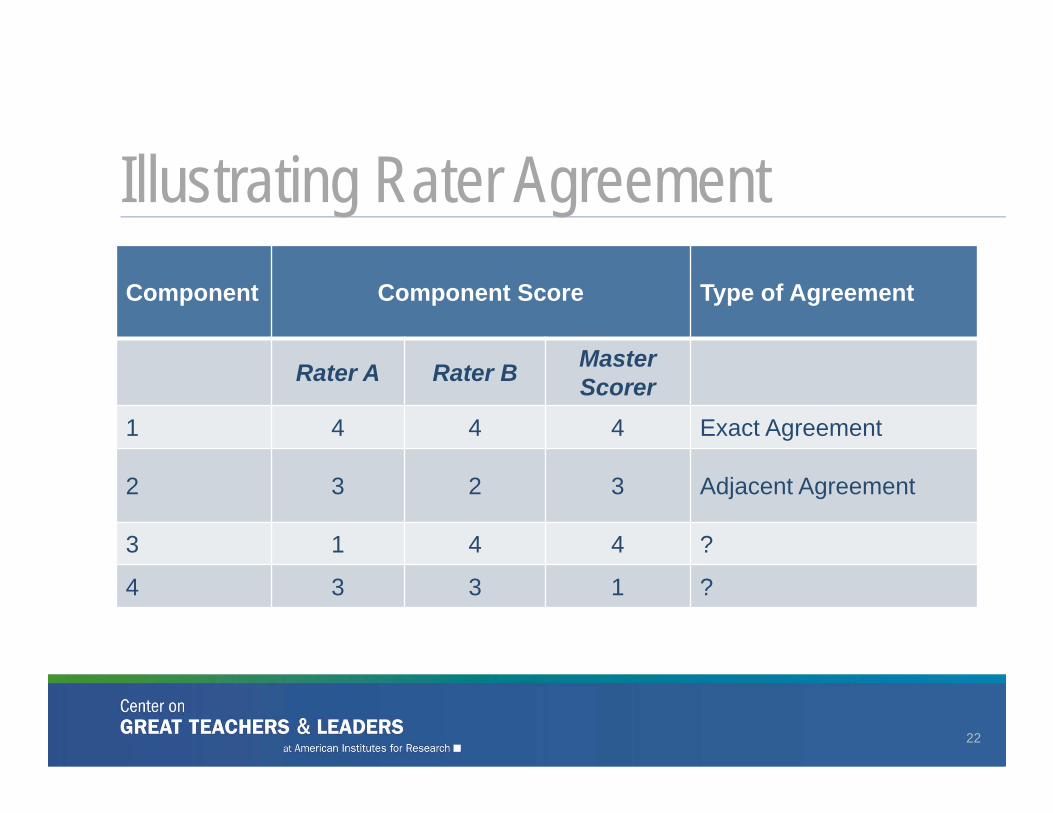
Component Component Score Type of Agreement
Rater A Rater B Master Scorer
1 4 4 4 Exact Agreement
2 3 2 3 Adjacent Agreement
3 1 4 4 ?
4 3 3 1 ?
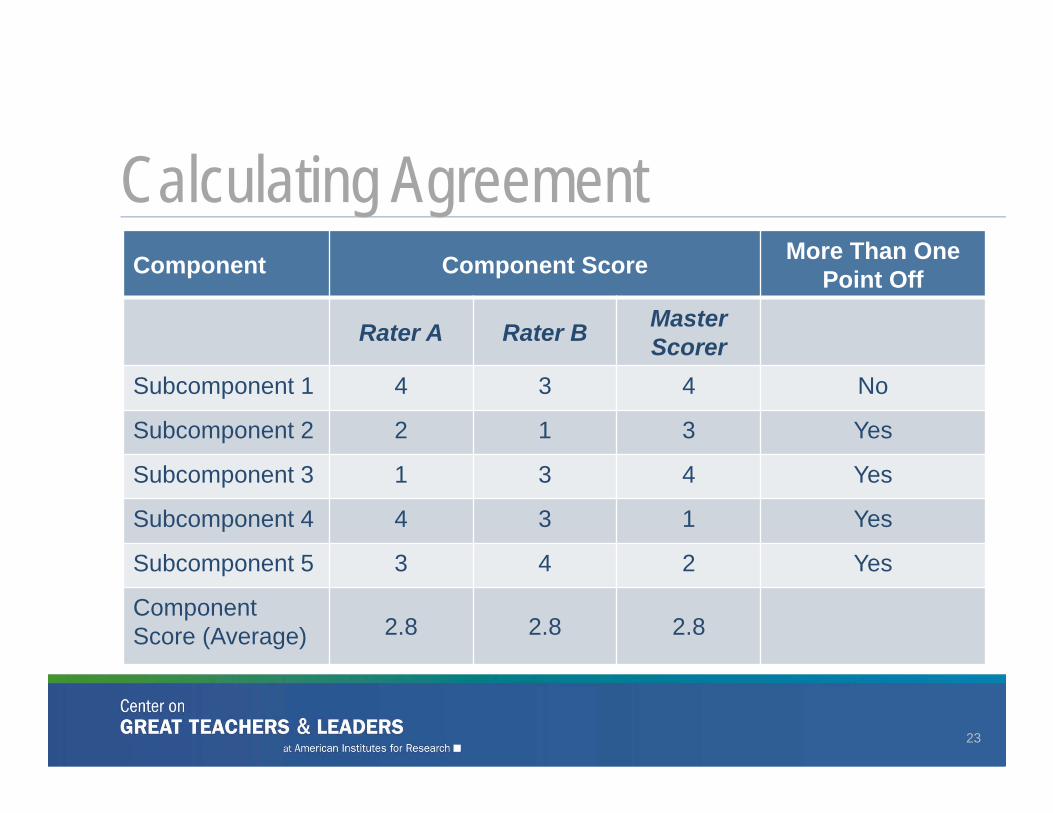
Calculating Agreement
23
Component Component Score More Than One Point Off
Rater A Rater B Master Scorer
Subcomponent 1 4 3 4 No
Subcomponent 2 2 1 3 Yes
Subcomponent 3 1 3 4 Yes
Subcomponent 4 4 3 1 Yes
Subcomponent 5 3 4 2 Yes
ComponentScore (Average) 2.8 2.8 2.8
There is currently no standard for the level of agreement or reliability for the use of measures in high-stakes performance evaluation. Experts tend to agree, however, that at minimum:
Absolute agreement should be 75 percent.
Kappa rating should be .75.
Intra-class correlations should be .70.
Interrater Reliability and Agreement: How Much Is Enough?
24
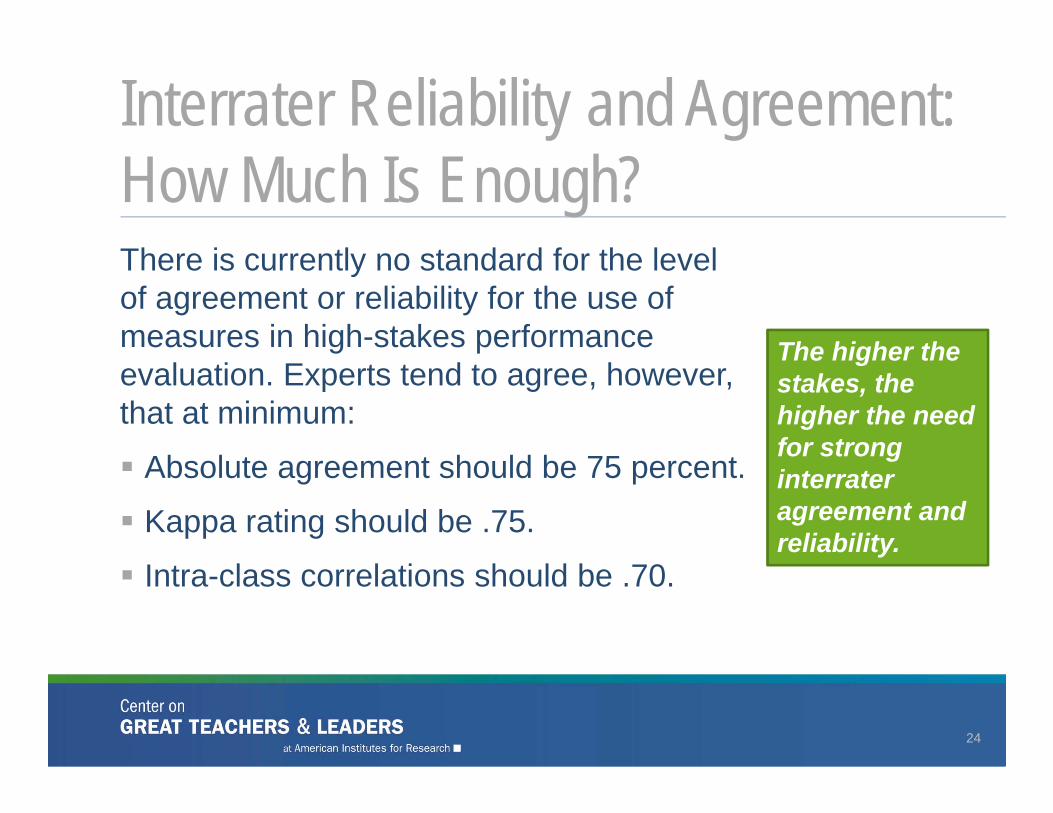
The higher the stakes, the higher the need for strong interrater agreement and reliability.
Quality of the Observation Instrument Number and complexity
of components and indicators
Clarity and consistency of language
Meaningful, realistic distinctions across levels of performance
Likelihood of seeing the described practice in the classroom
What Affects Reliability and Agreement in Observation?
25
What Affects Reliability and Agreement in Observation?
Observer Bias: What are some of the various “lenses” that might bias:
A teacher evaluator?
A principal evaluator?
26
Example Activity: Strategizingfor Reducing BiasHandout 2: Common Sources of Bias Step 1. At your table, work as a group to match each
common rater error with a possible strategy evaluators can use to avoid the error.
Step 2. After each match, discuss other possible strategies you have seen used or that you think might be effective.
27
Answer Key 1 = D
2 = G
3 = A
4 = F
5 = B
6 = E
7 = H
8 = C
28
Example Activity: Strategizingfor Reducing Bias
What Affects Reliability and Agreement in Observation?
Context Relationship to observed teacher
Other demands on observer’s time
Level of students
Particular challenges of students
How results will be used (e.g., high stakes versus formative)
29
A Corrective Lens: The Observation Instrument
Quality of the Observation Instrument Number and complexity of
components and indicators
Clarity and consistency of language
Meaningful, realistic distinctions across levels of performance
Likelihood of seeing the described practice in the classroom
30
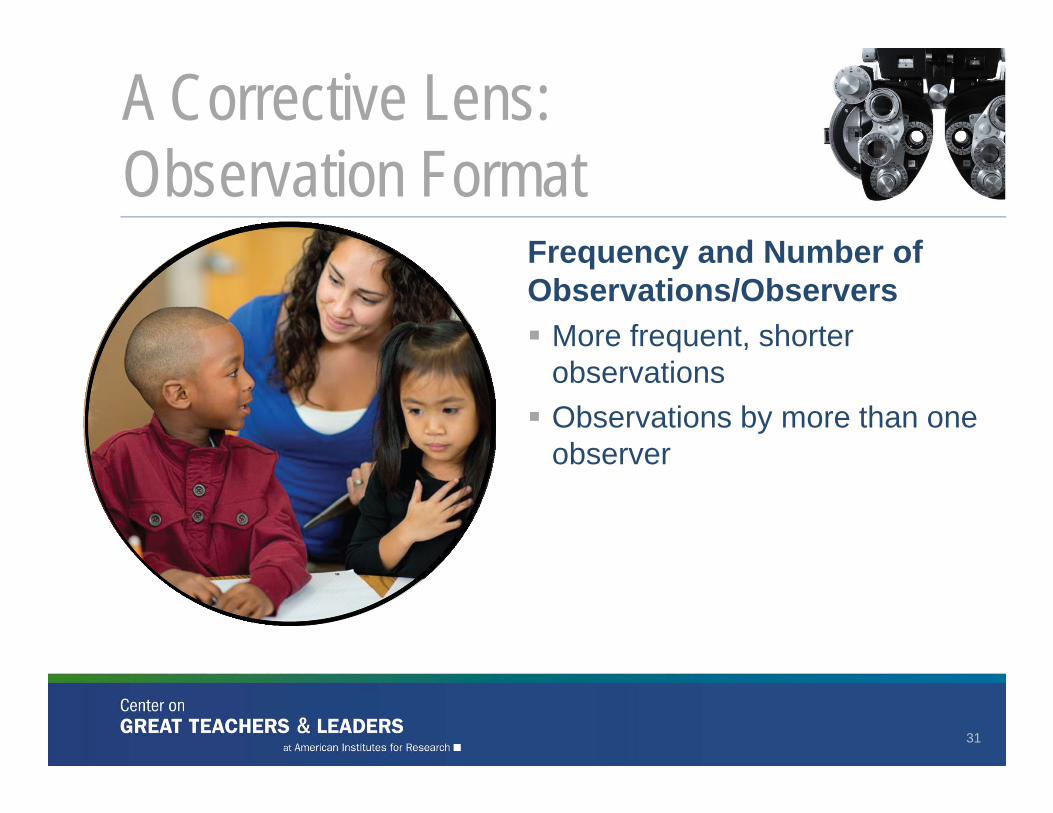
A Corrective Lens: Observation Format
Frequency and Number of Observations/Observers More frequent, shorter
observations Observations by more than one
observer
31
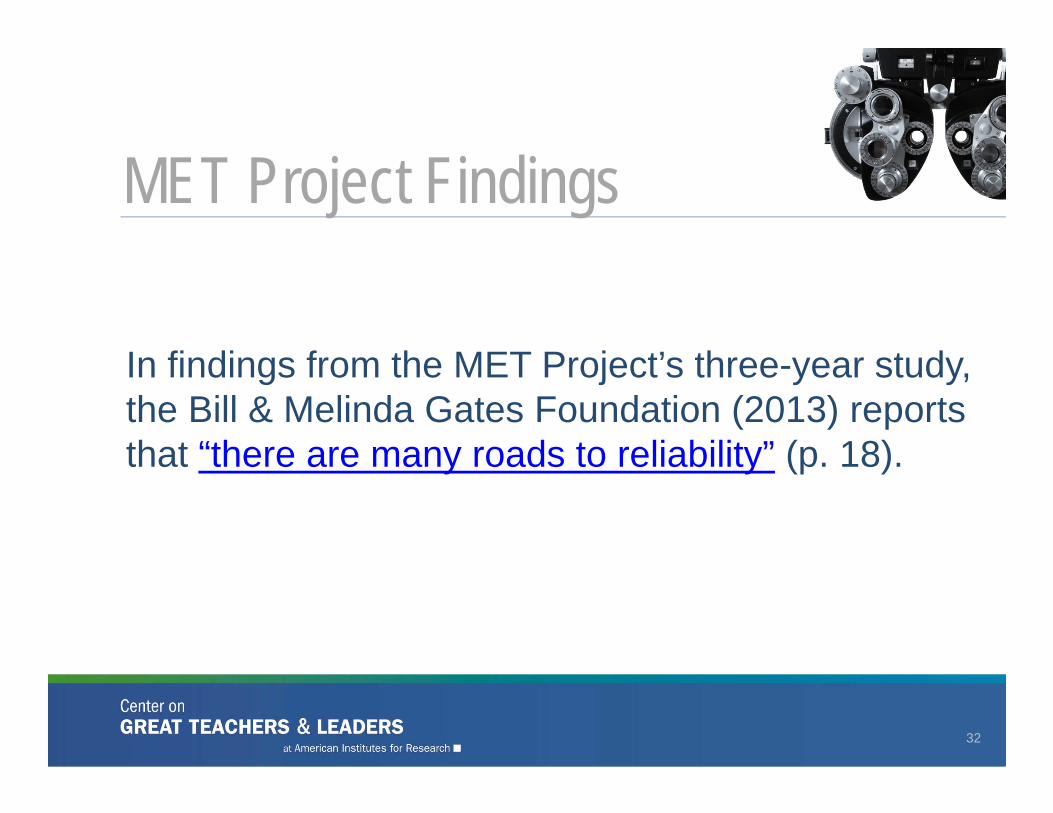
MET Project Findings
32
In findings from the MET Project’s three-year study, the Bill & Melinda Gates Foundation (2013) reports that “there are many roads to reliability” (p. 18).
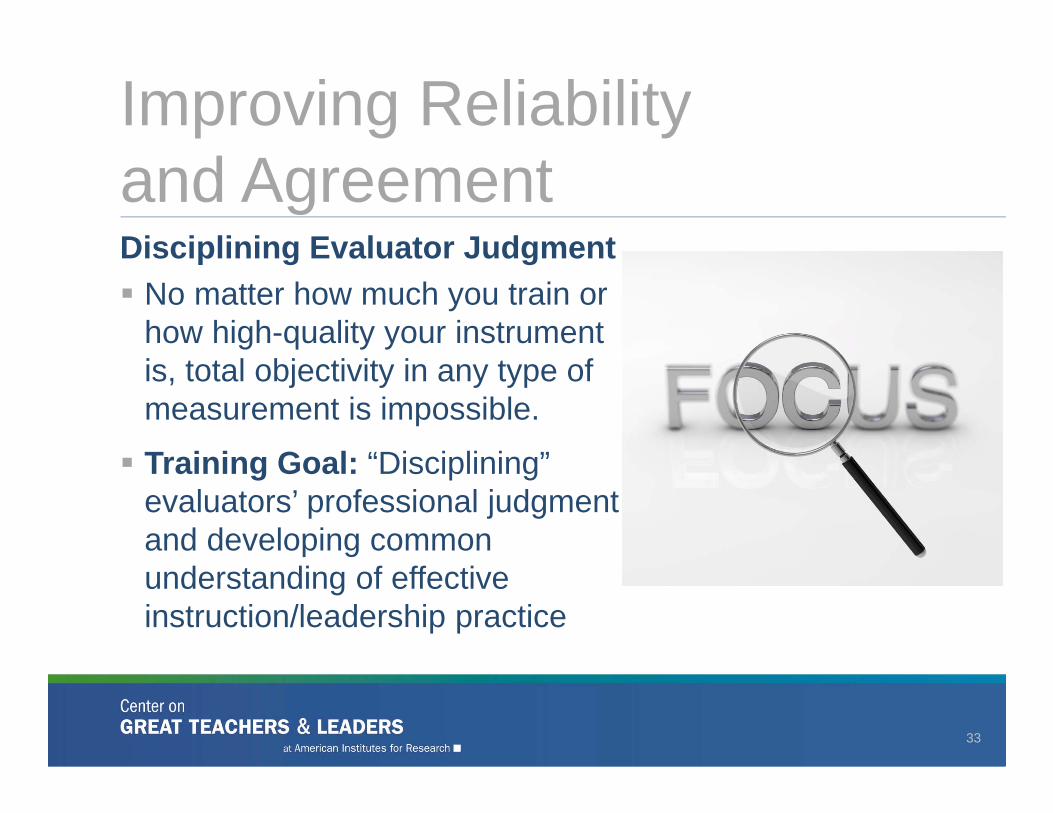
Disciplining Evaluator Judgment No matter how much you train or
how high-quality your instrument is, total objectivity in any type of measurement is impossible.
Training Goal: “Disciplining” evaluators’ professional judgment and developing common understanding of effective instruction/leadership practice
Improving Reliability and Agreement
33
What Does Research Say?
34
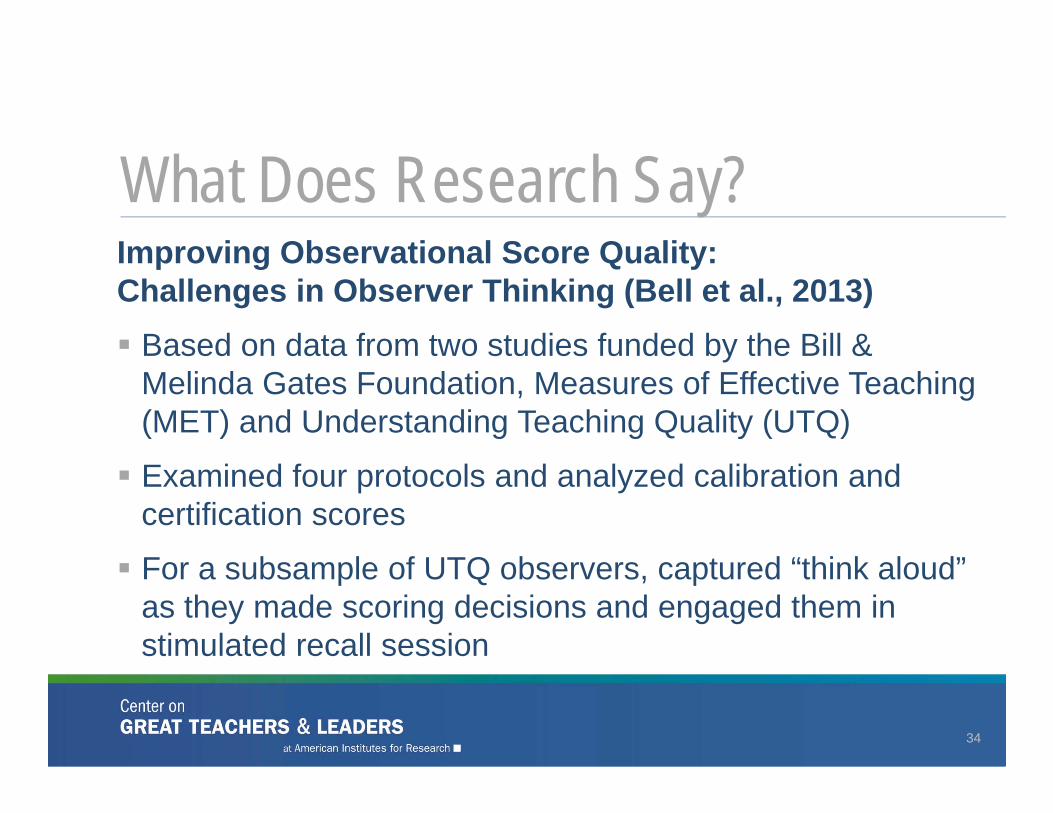
Improving Observational Score Quality: Challenges in Observer Thinking (Bell et al., 2013) Based on data from two studies funded by the Bill &
Melinda Gates Foundation, Measures of Effective Teaching (MET) and Understanding Teaching Quality (UTQ)
Examined four protocols and analyzed calibration and certification scores
For a subsample of UTQ observers, captured “think aloud” as they made scoring decisions and engaged them in stimulated recall session
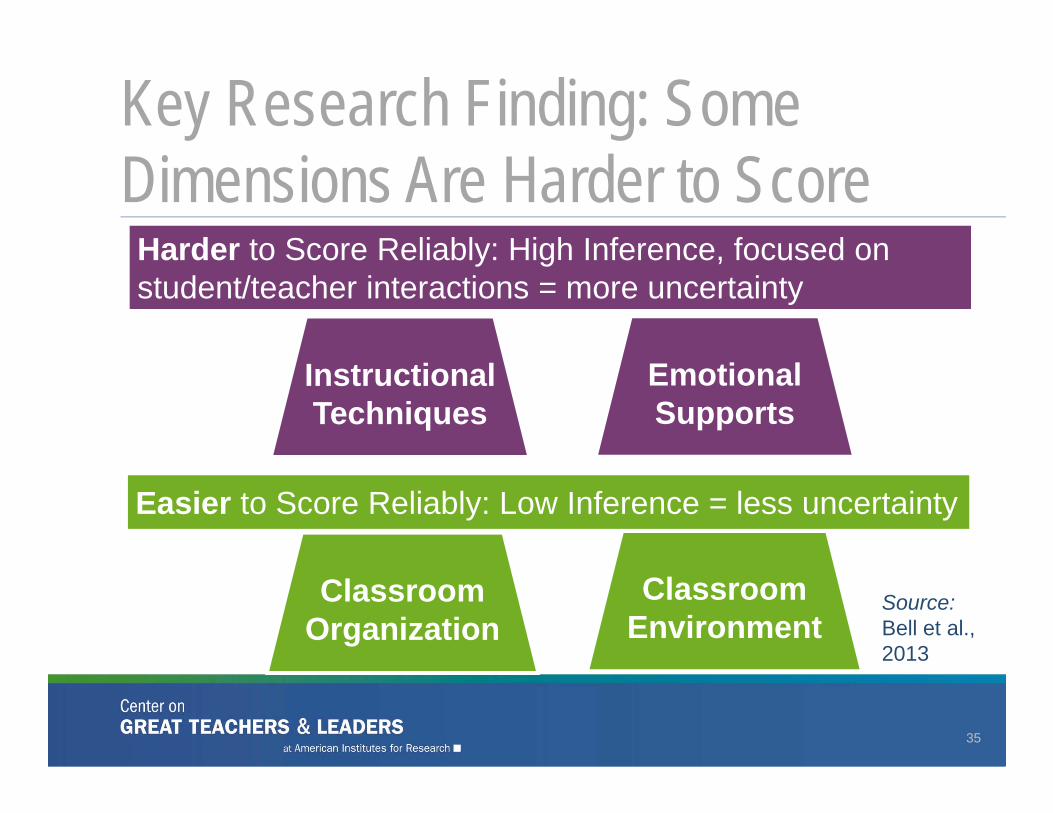
Key Research Finding: Some Dimensions Are Harder to Score
35
Harder to Score Reliably: High Inference, focused on student/teacher interactions = more uncertainty
Classroom Organization
Classroom Environment
Easier to Score Reliably: Low Inference = less uncertainty
Instructional Instructional Techniques
Emotional Supports
Source:Bell et al., 2013
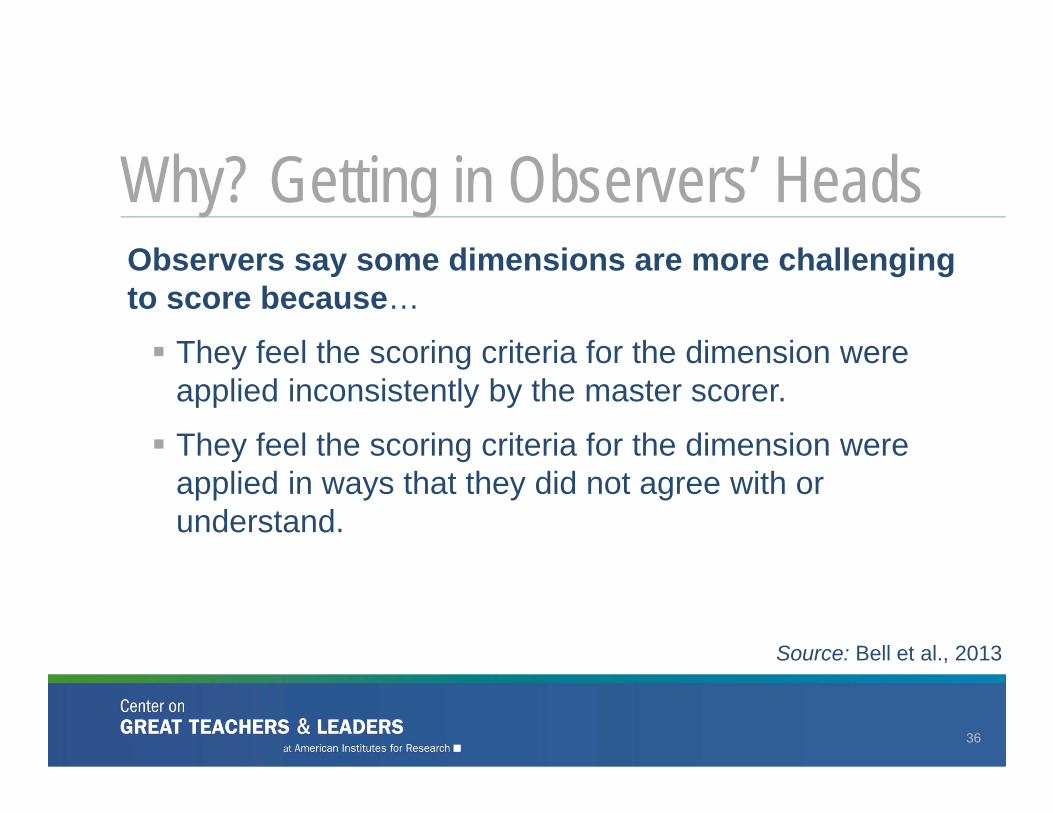
Why? Getting in Observers’ Heads
36
Observers say some dimensions are more challenging to score because…
They feel the scoring criteria for the dimension were applied inconsistently by the master scorer.
They feel the scoring criteria for the dimension were applied in ways that they did not agree with or understand.
Source: Bell et al., 2013
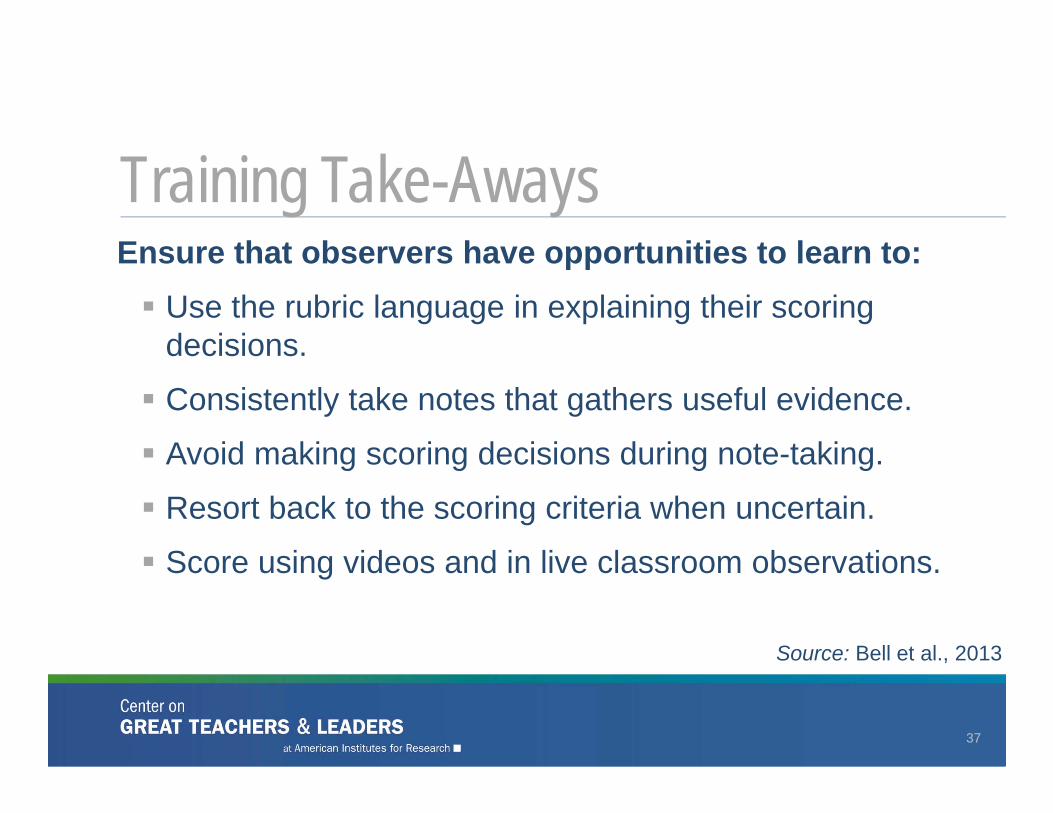
Training Take-Aways
37
Ensure that observers have opportunities to learn to: Use the rubric language in explaining their scoring
decisions.
Consistently take notes that gathers useful evidence.
Avoid making scoring decisions during note-taking.
Resort back to the scoring criteria when uncertain.
Score using videos and in live classroom observations.
Source: Bell et al., 2013
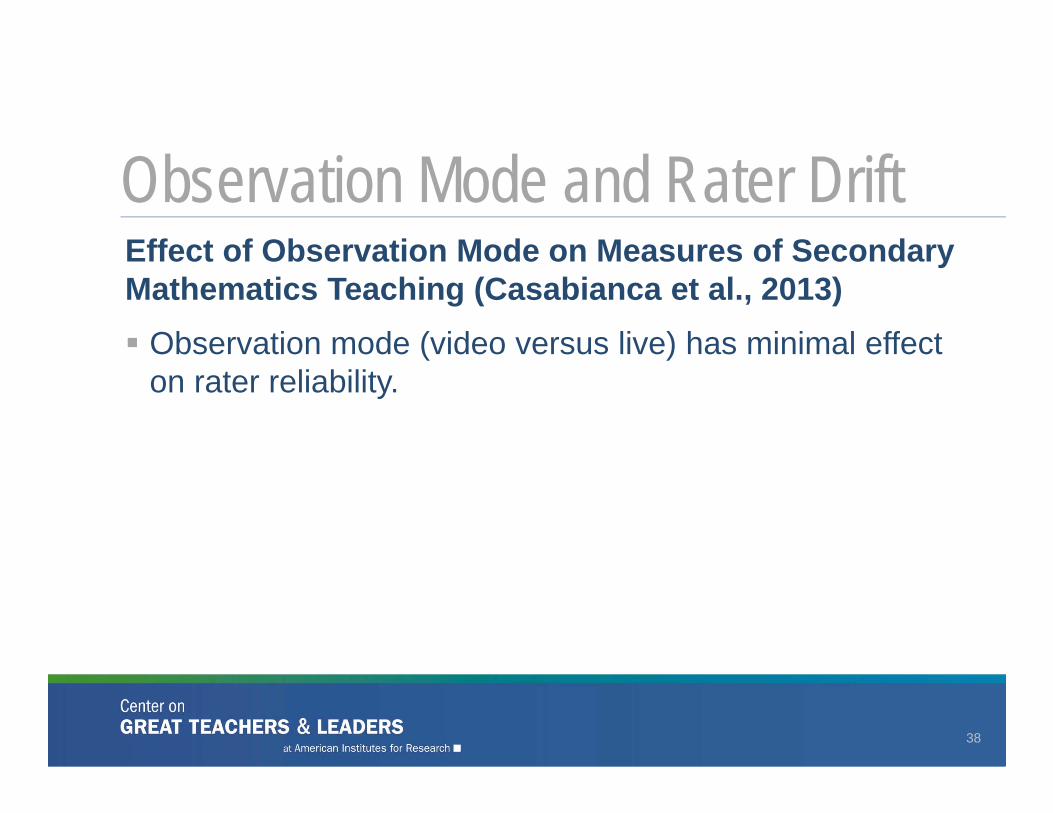
Observation Mode and Rater Drift
38
Effect of Observation Mode on Measures of Secondary Mathematics Teaching (Casabianca et al., 2013) Observation mode (video versus live) has minimal effect
on rater reliability.
Concrete examples of the practices described in the rubric at each performance level for both evaluators and educators
Opportunities to practice scoring, receive immediate feedback on scoring, and regularly calibrate their scores against master scorers on an ongoing basis
39
What Improves Evaluators’ Reliability and Agreement?
Supplemental training on hard to score sections, for example:
• Learning to focus on student responses• Weighing competing evidence• Understanding what a specific element looks like in
classrooms
40
What Improves Evaluators’ Reliability and Agreement?
An assessment and/or certification test to ensure that evaluators can meet a minimum level of reliability and agreement before evaluating educators
Ongoing recalibration, opportunities to collaborate with fellow observers to strengthen skill in difficult-to-score components
Annual refresher and recertification test
41
What Improves Evaluators’ Reliability and Agreement?
What Does Observation Training Usually Look Like?
42
Learning the Observation Framework The educational philosophy and research base used to
develop the instructional or leadership framework and observation rubrics
The purpose and logic for each performance level and scale in the framework or rubric
The framework or rubric structure and the core performance behaviors included in each dimension or component
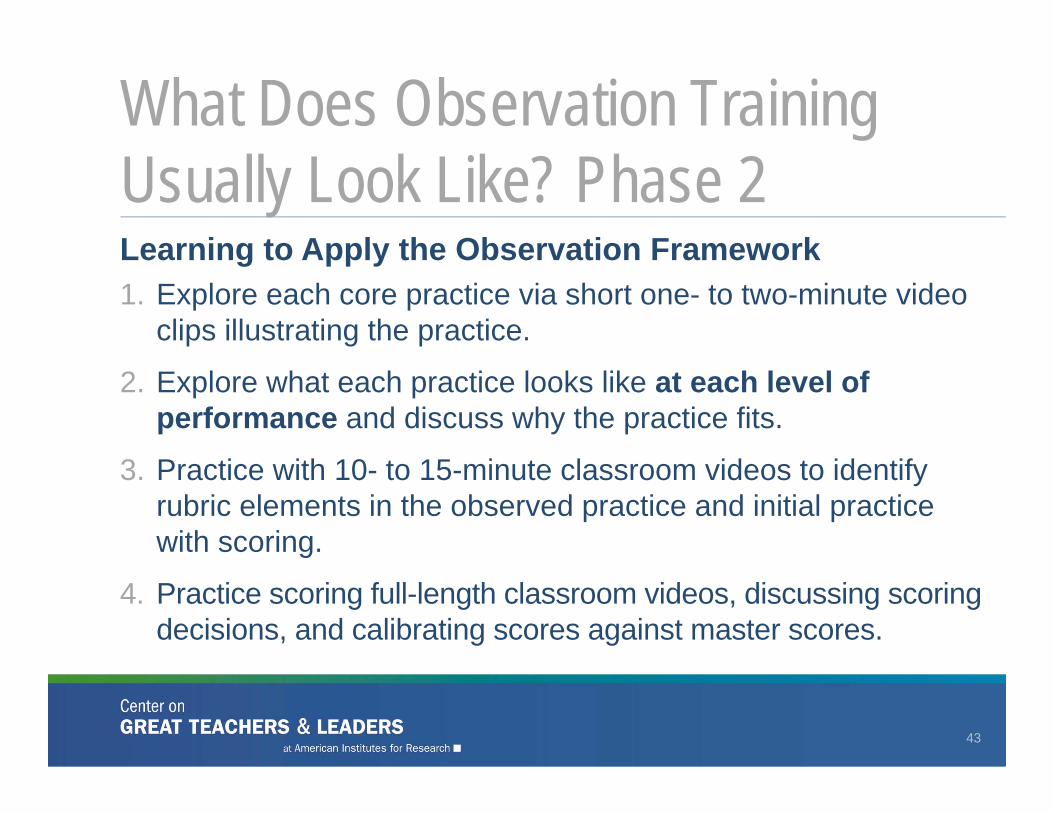
What Does Observation Training Usually Look Like? Phase 2
43
Learning to Apply the Observation Framework1. Explore each core practice via short one- to two-minute video
clips illustrating the practice.
2. Explore what each practice looks like at each level of performance and discuss why the practice fits.
3. Practice with 10- to 15-minute classroom videos to identify rubric elements in the observed practice and initial practice with scoring.
4. Practice scoring full-length classroom videos, discussing scoring decisions, and calibrating scores against master scores.
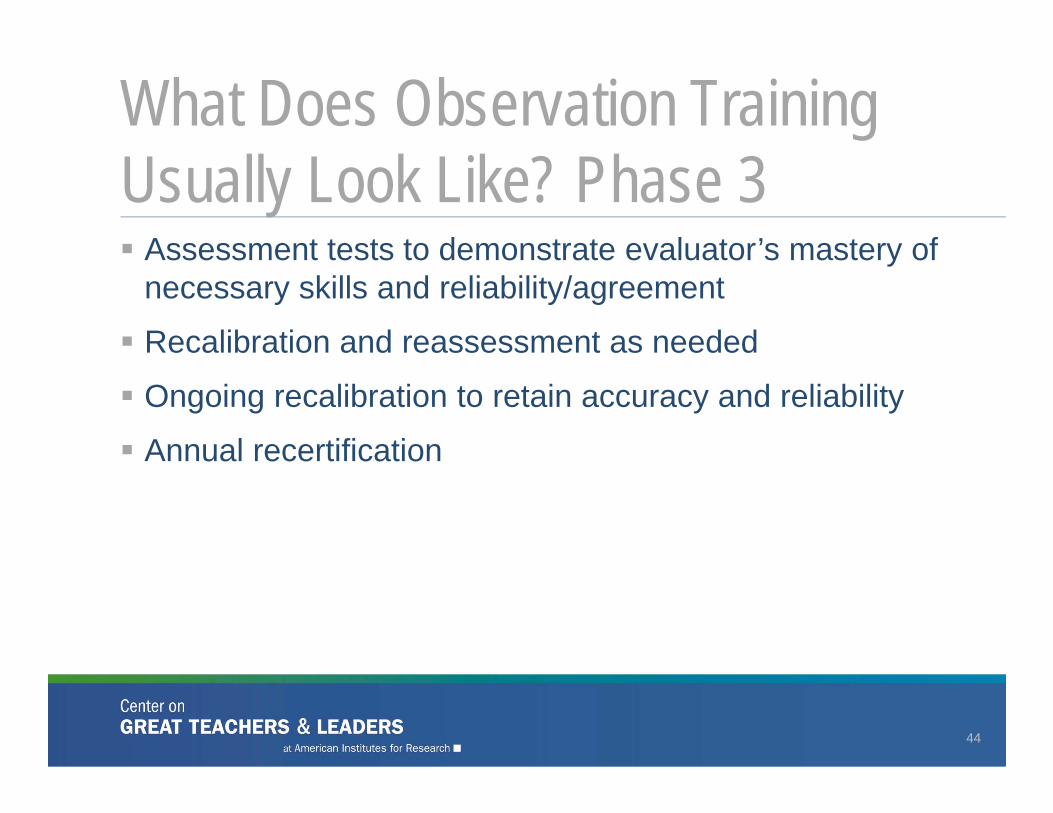
What Does Observation Training Usually Look Like? Phase 3
44
Assessment tests to demonstrate evaluator’s mastery of necessary skills and reliability/agreement
Recalibration and reassessment as needed
Ongoing recalibration to retain accuracy and reliability
Annual recertification
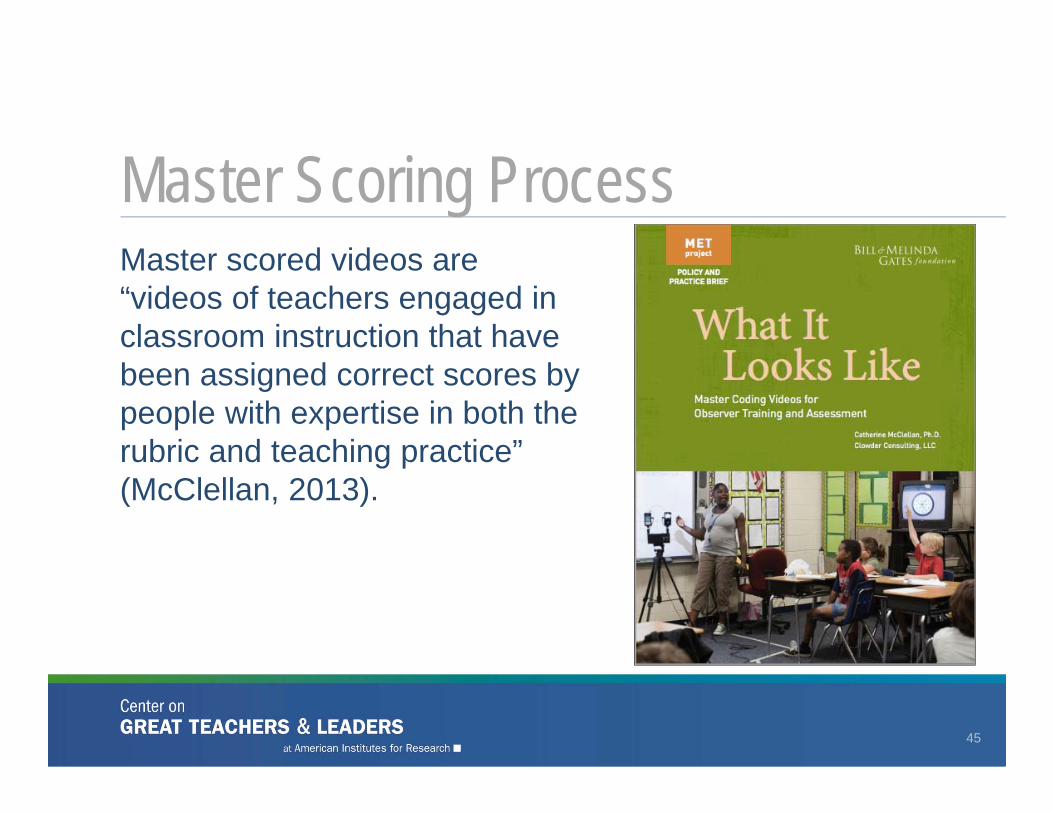
Master scored videos are “videos of teachers engaged in classroom instruction that have been assigned correct scores by people with expertise in both the rubric and teaching practice” (McClellan, 2013).
Master Scoring Process
45
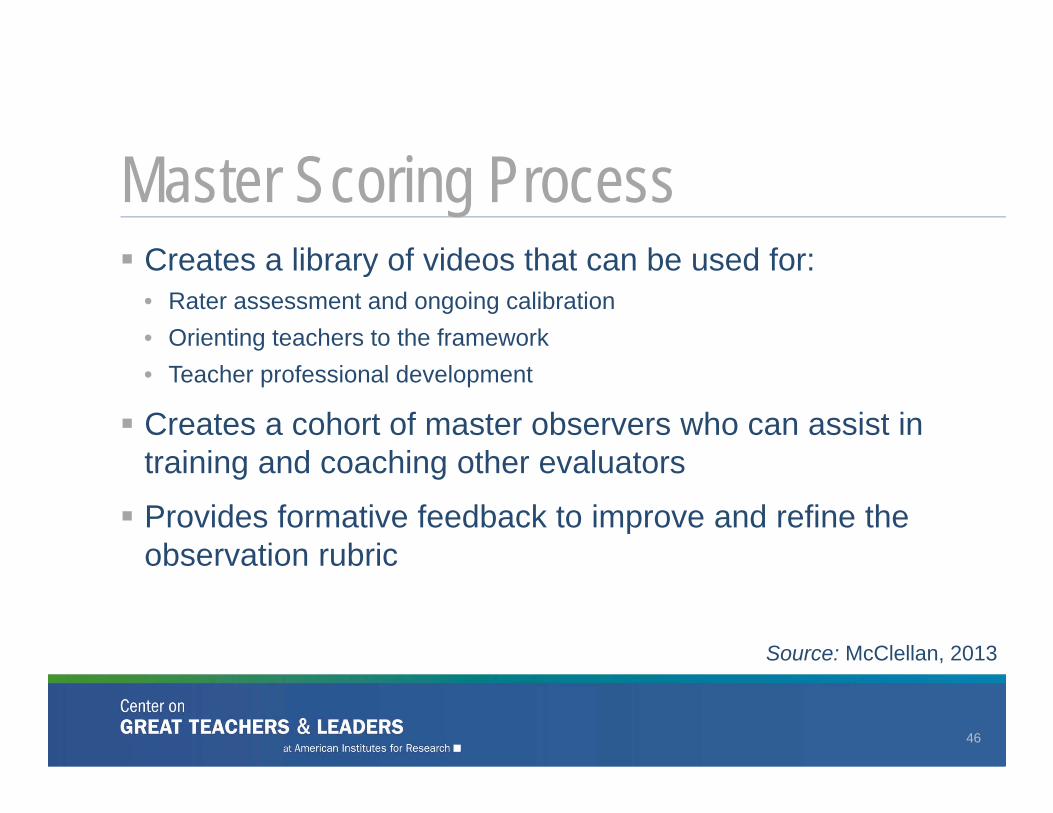
Creates a library of videos that can be used for:• Rater assessment and ongoing calibration• Orienting teachers to the framework• Teacher professional development
Creates a cohort of master observers who can assist in training and coaching other evaluators
Provides formative feedback to improve and refine the observation rubric
Master Scoring Process
46
Source: McClellan, 2013
Multiple Measures: Student Growth
47
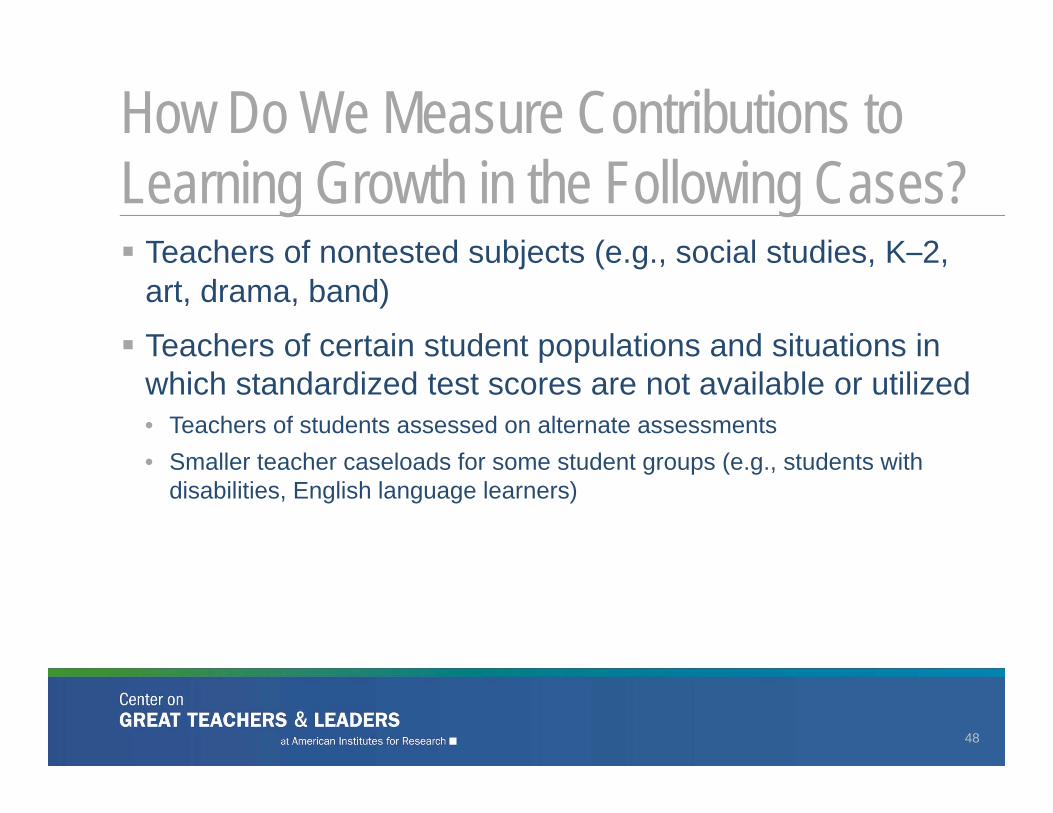
Teachers of nontested subjects (e.g., social studies, K–2, art, drama, band)
Teachers of certain student populations and situations in which standardized test scores are not available or utilized• Teachers of students assessed on alternate assessments• Smaller teacher caseloads for some student groups (e.g., students with
disabilities, English language learners)
48
How Do We Measure Contributions to Learning Growth in the Following Cases?
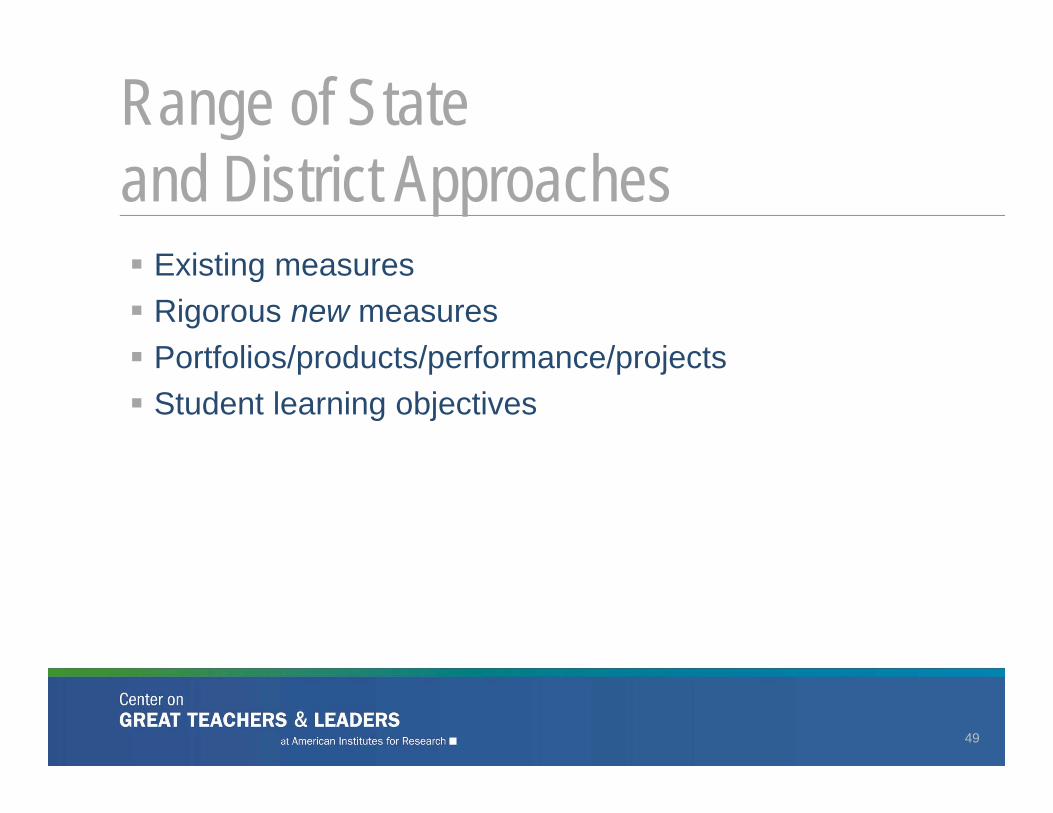
Range of State and District Approaches
49
Existing measures Rigorous new measures Portfolios/products/performance/projects Student learning objectives
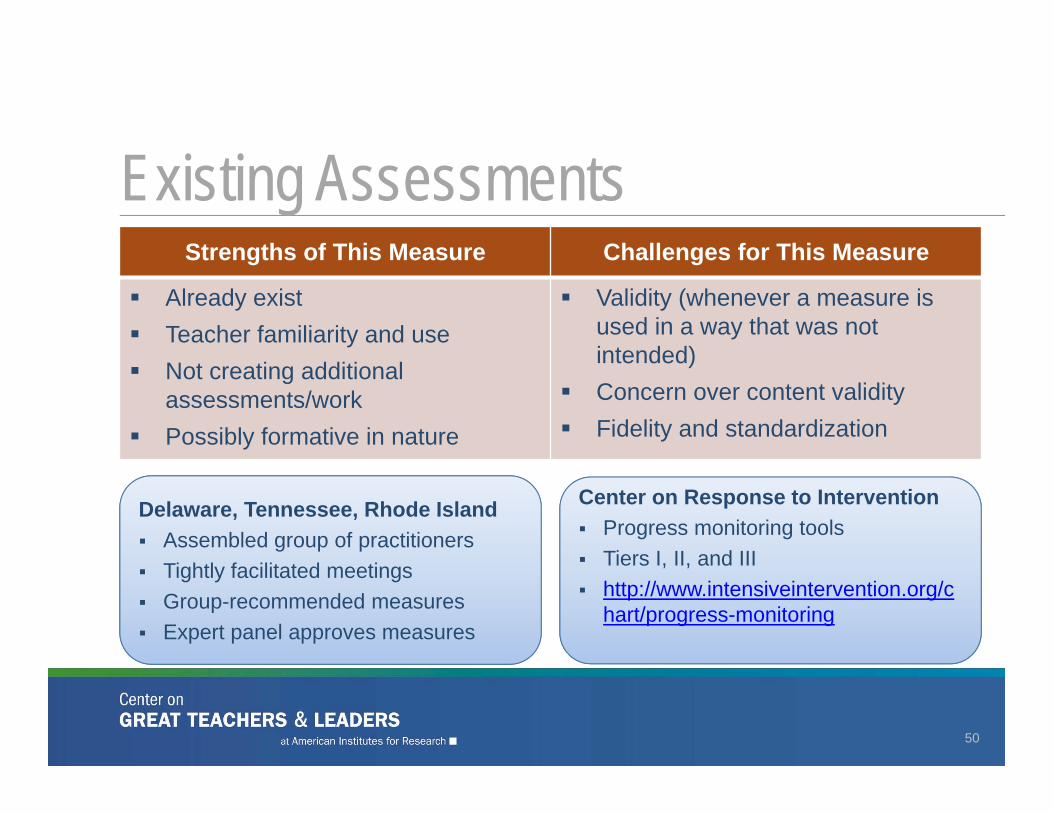
Existing Assessments
Delaware, Tennessee, Rhode Island Assembled group of practitioners Tightly facilitated meetings Group-recommended measures Expert panel approves measures
Center on Response to Intervention Progress monitoring tools Tiers I, II, and III http://www.intensiveintervention.org/c
hart/progress-monitoring
Strengths of This Measure Challenges for This Measure
Already exist Teacher familiarity and use Not creating additional
assessments/work Possibly formative in nature
Validity (whenever a measure is used in a way that was not intended)
Concern over content validity Fidelity and standardization
50
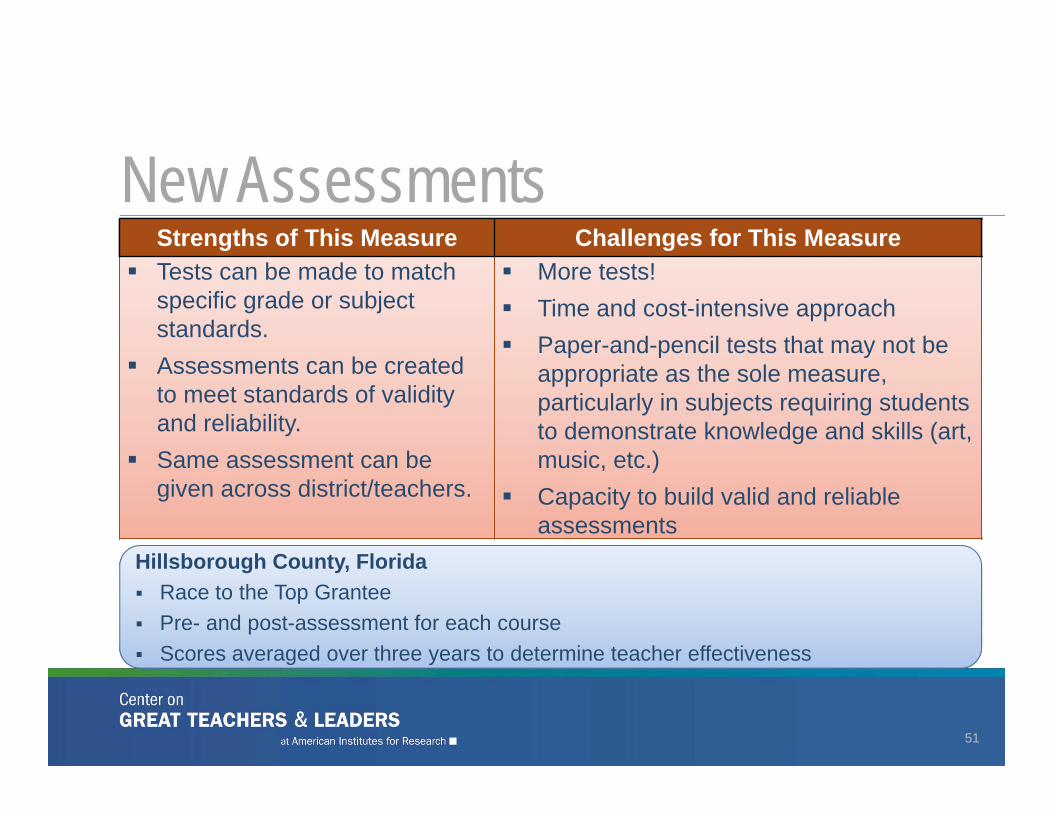
New Assessments
Hillsborough County, Florida Race to the Top Grantee Pre- and post-assessment for each course Scores averaged over three years to determine teacher effectiveness
Strengths of This Measure Challenges for This Measure Tests can be made to match
specific grade or subject standards.
Assessments can be created to meet standards of validity and reliability.
Same assessment can be given across district/teachers.
More tests! Time and cost-intensive approach Paper-and-pencil tests that may not be
appropriate as the sole measure, particularly in subjects requiring students to demonstrate knowledge and skills (art, music, etc.)
Capacity to build valid and reliable assessments
51
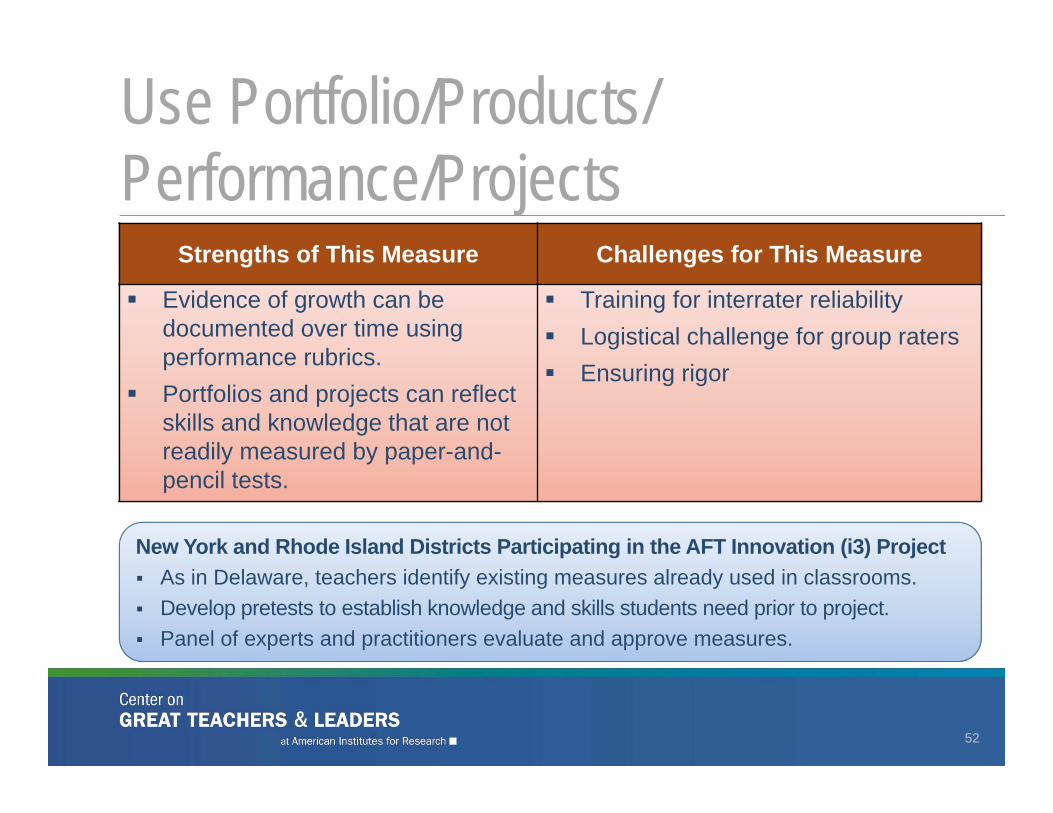
Use Portfolio/Products/ Performance/Projects
New York and Rhode Island Districts Participating in the AFT Innovation (i3) Project As in Delaware, teachers identify existing measures already used in classrooms. Develop pretests to establish knowledge and skills students need prior to project. Panel of experts and practitioners evaluate and approve measures.
Strengths of This Measure Challenges for This Measure
Evidence of growth can be documented over time using performance rubrics.
Portfolios and projects can reflect skills and knowledge that are not readily measured by paper-and-pencil tests.
Training for interrater reliability Logistical challenge for group raters Ensuring rigor
52
Multiple Measures: Student Learning Objectives
53
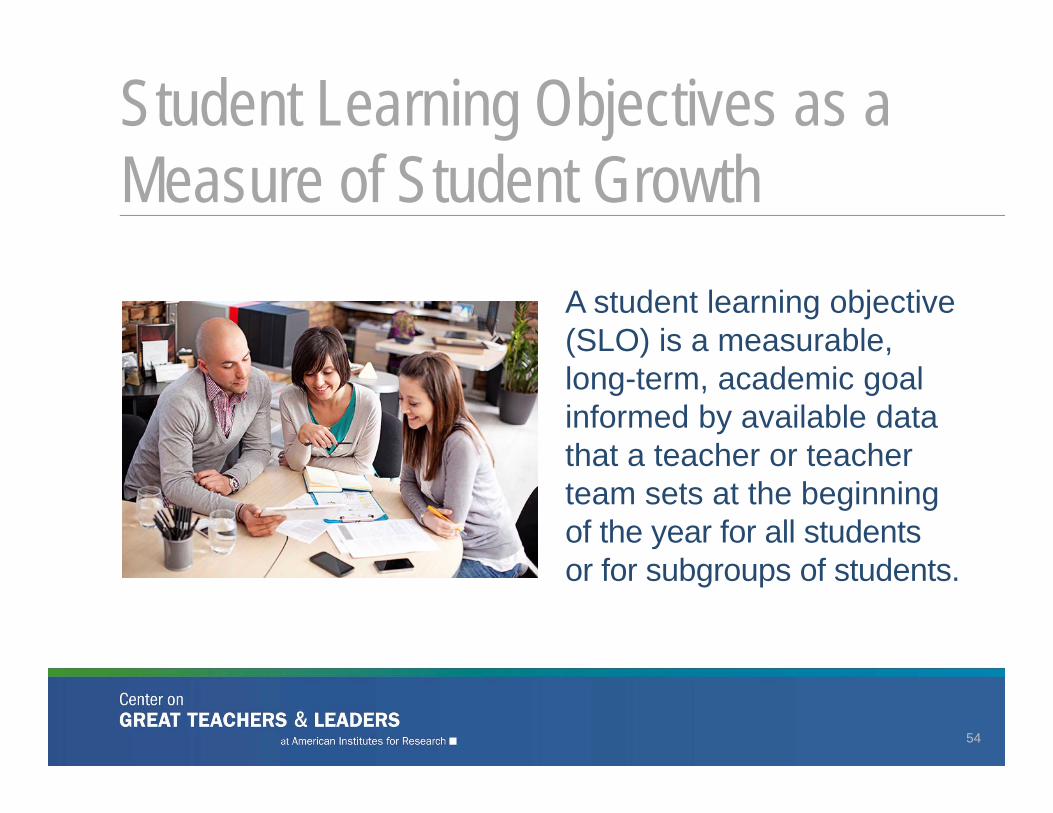
A student learning objective (SLO) is a measurable, long-term, academic goal informed by available data that a teacher or teacher team sets at the beginning of the year for all students or for subgroups of students.
Student Learning Objectives as a Measure of Student Growth
54
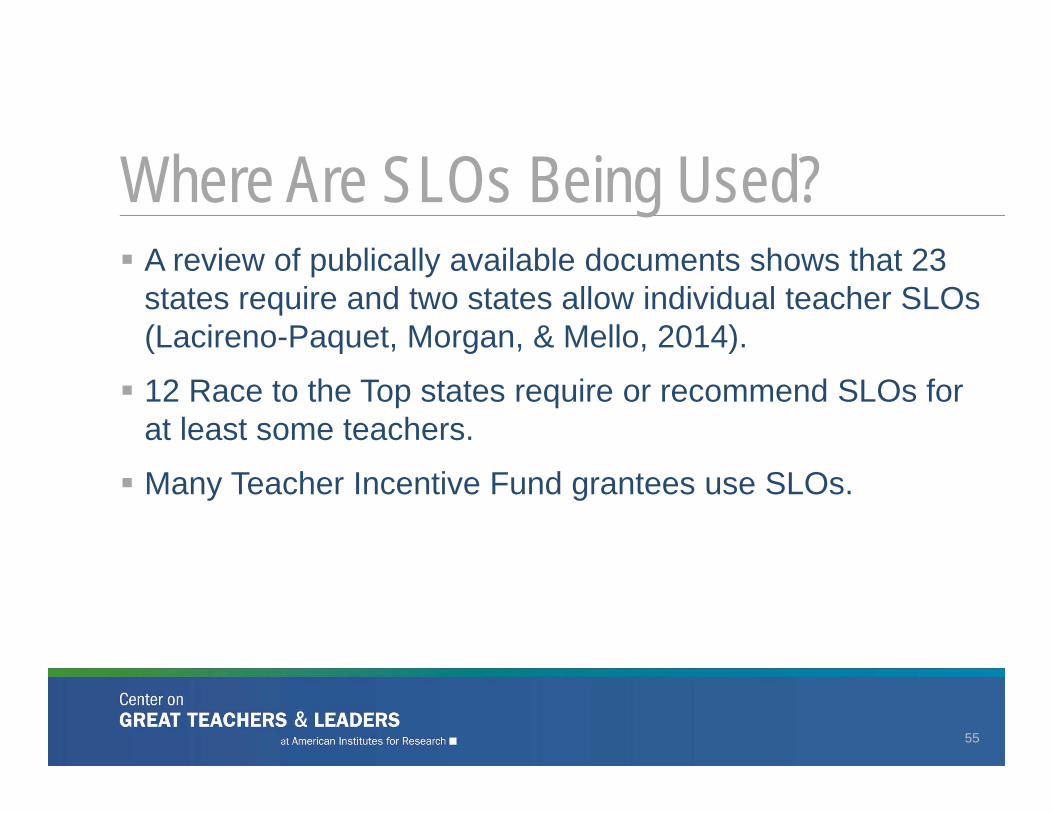
A review of publically available documents shows that 23 states require and two states allow individual teacher SLOs (Lacireno-Paquet, Morgan, & Mello, 2014).
12 Race to the Top states require or recommend SLOs for at least some teachers.
Many Teacher Incentive Fund grantees use SLOs.
Where Are SLOs Being Used?
55
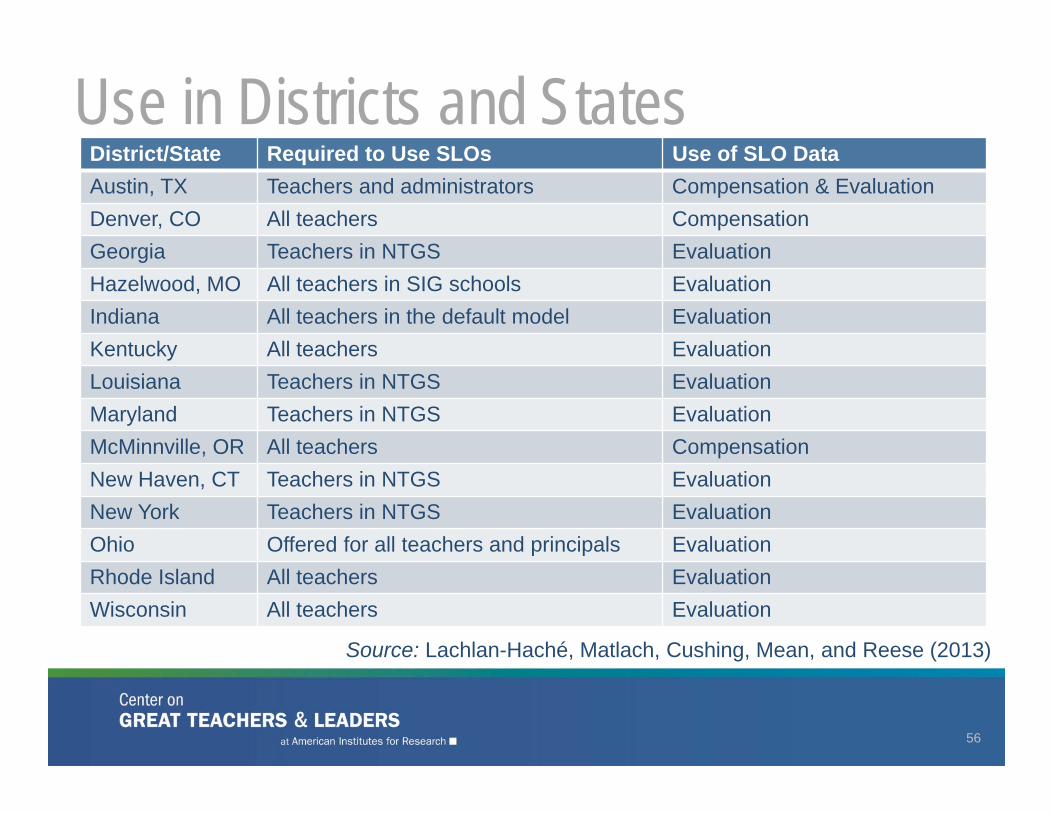
Use in Districts and States
56
District/State Required to Use SLOs Use of SLO DataAustin, TX Teachers and administrators Compensation & EvaluationDenver, CO All teachers CompensationGeorgia Teachers in NTGS EvaluationHazelwood, MO All teachers in SIG schools EvaluationIndiana All teachers in the default model EvaluationKentucky All teachers EvaluationLouisiana Teachers in NTGS EvaluationMaryland Teachers in NTGS EvaluationMcMinnville, OR All teachers CompensationNew Haven, CT Teachers in NTGS EvaluationNew York Teachers in NTGS EvaluationOhio Offered for all teachers and principals EvaluationRhode Island All teachers EvaluationWisconsin All teachers Evaluation
Source: Lachlan-Haché, Matlach, Cushing, Mean, and Reese (2013)
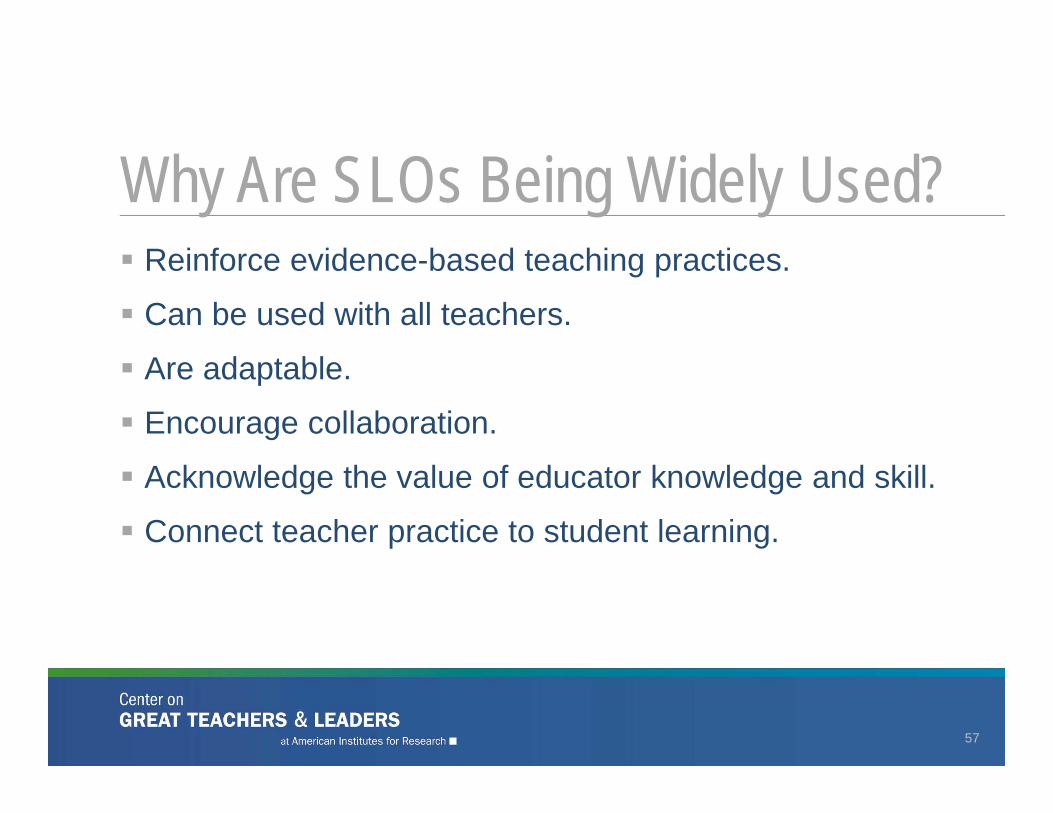
Reinforce evidence-based teaching practices.
Can be used with all teachers.
Are adaptable.
Encourage collaboration.
Acknowledge the value of educator knowledge and skill.
Connect teacher practice to student learning.
Why Are SLOs Being Widely Used?
57
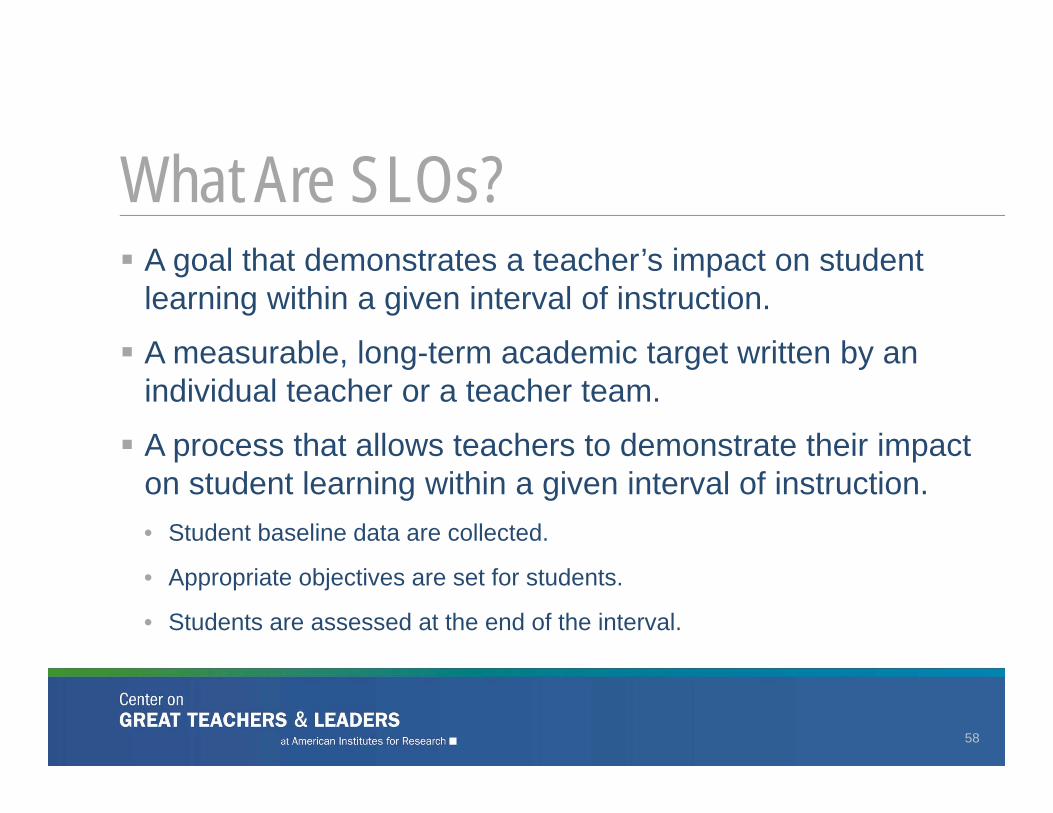
A goal that demonstrates a teacher’s impact on student learning within a given interval of instruction.
A measurable, long-term academic target written by an individual teacher or a teacher team.
A process that allows teachers to demonstrate their impact on student learning within a given interval of instruction.• Student baseline data are collected.
• Appropriate objectives are set for students.
• Students are assessed at the end of the interval.
What Are SLOs?
58
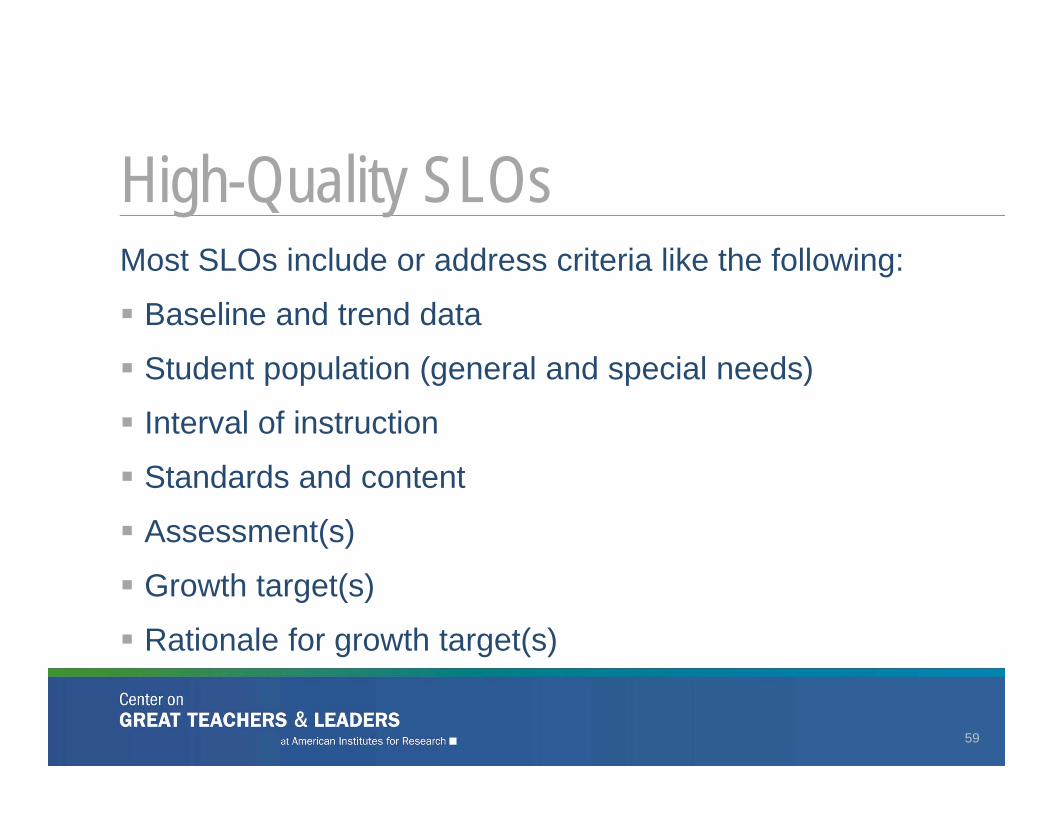
Most SLOs include or address criteria like the following:
Baseline and trend data
Student population (general and special needs)
Interval of instruction
Standards and content
Assessment(s)
Growth target(s)
Rationale for growth target(s)
High-Quality SLOs
59
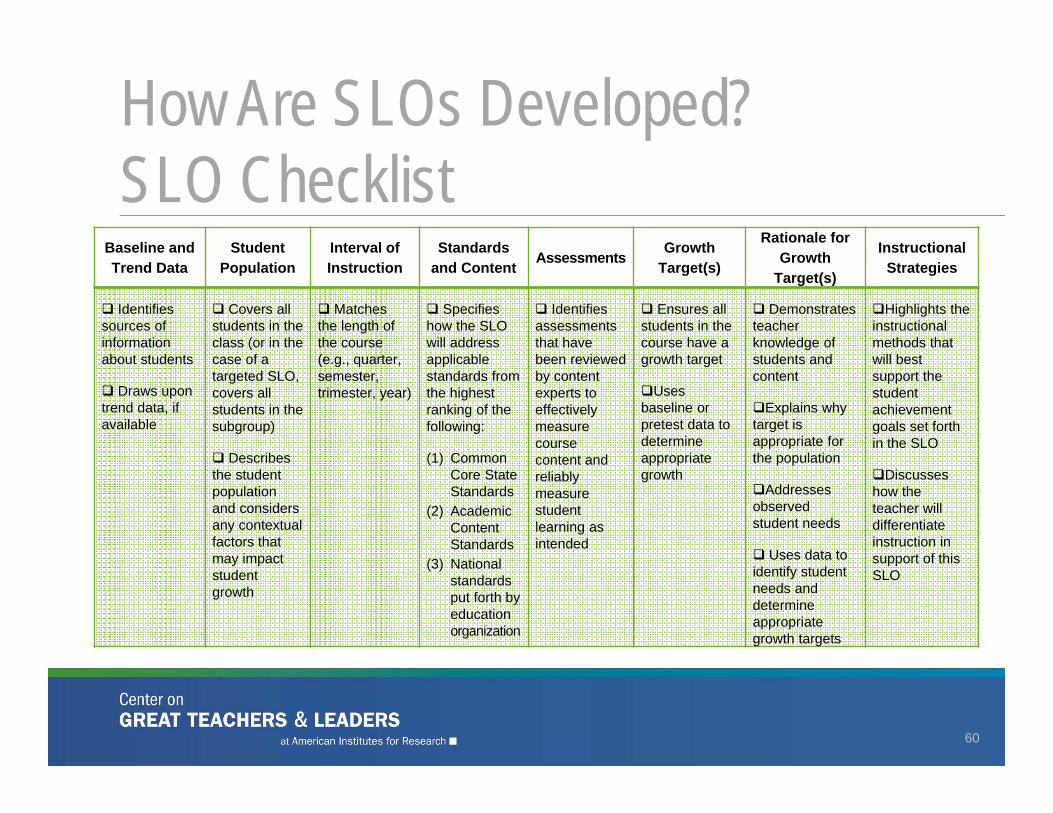
How Are SLOs Developed?SLO Checklist
60
Baseline and Trend Data
Student Population
Interval of Instruction
Standards and Content Assessments Growth
Target(s)
Rationale for Growth
Target(s)
Instructional Strategies
Identifies sources of information about students
Draws upon trend data, if available
Covers all students in the class (or in the case of a targeted SLO, covers all students in the subgroup)
Describes the student population and considers any contextual factors that may impact student growth
Matches the length of the course (e.g., quarter, semester, trimester, year)
Specifies how the SLO will address applicable standards from the highest ranking of the following:
(1) Common Core State Standards
(2) Academic Content Standards
(3) National standards put forth by education organization
Identifies assessments that have been reviewed by content experts to effectively measure course content and reliably measure student learning as intended
Ensures all students in the course have a growth target
Uses baseline or pretest data to determine appropriate growth
Demonstrates teacher knowledge of students and content
Explains why target is appropriate for the population
Addresses observed student needs
Uses data to identify student needs and determine appropriate growth targets
Highlights the instructional methods that will best support the student achievement goals set forth in the SLO
Discusses how the teacher will differentiate instruction in support of this SLO
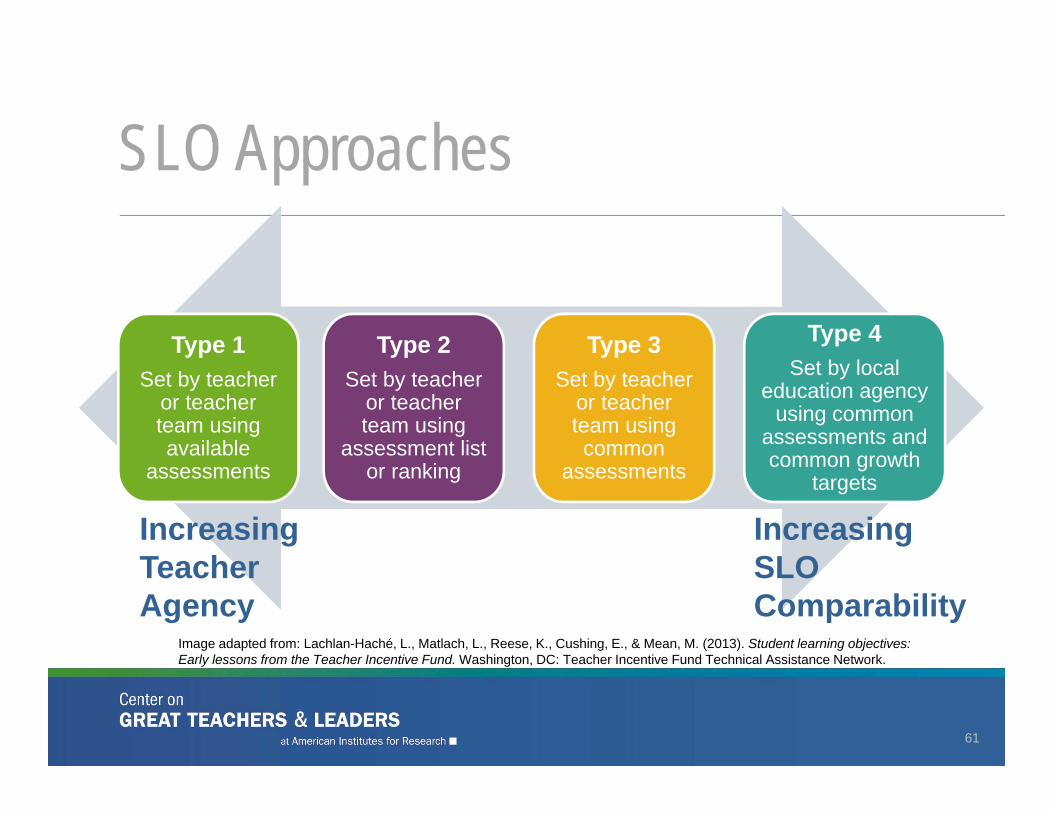
SLO Approaches
61
Increasing Teacher Agency
Increasing SLO Comparability
Type 1Set by teacher
or teacher team using available
assessments
Type 2Set by teacher
or teacher team using
assessment list or ranking
Type 3Set by teacher
or teacher team using common
assessments
Type 4Set by local
education agency using common
assessments and common growth
targets
Image adapted from: Lachlan-Haché, L., Matlach, L., Reese, K., Cushing, E., & Mean, M. (2013). Student learning objectives: Early lessons from the Teacher Incentive Fund. Washington, DC: Teacher Incentive Fund Technical Assistance Network.
Student Learning Objectives
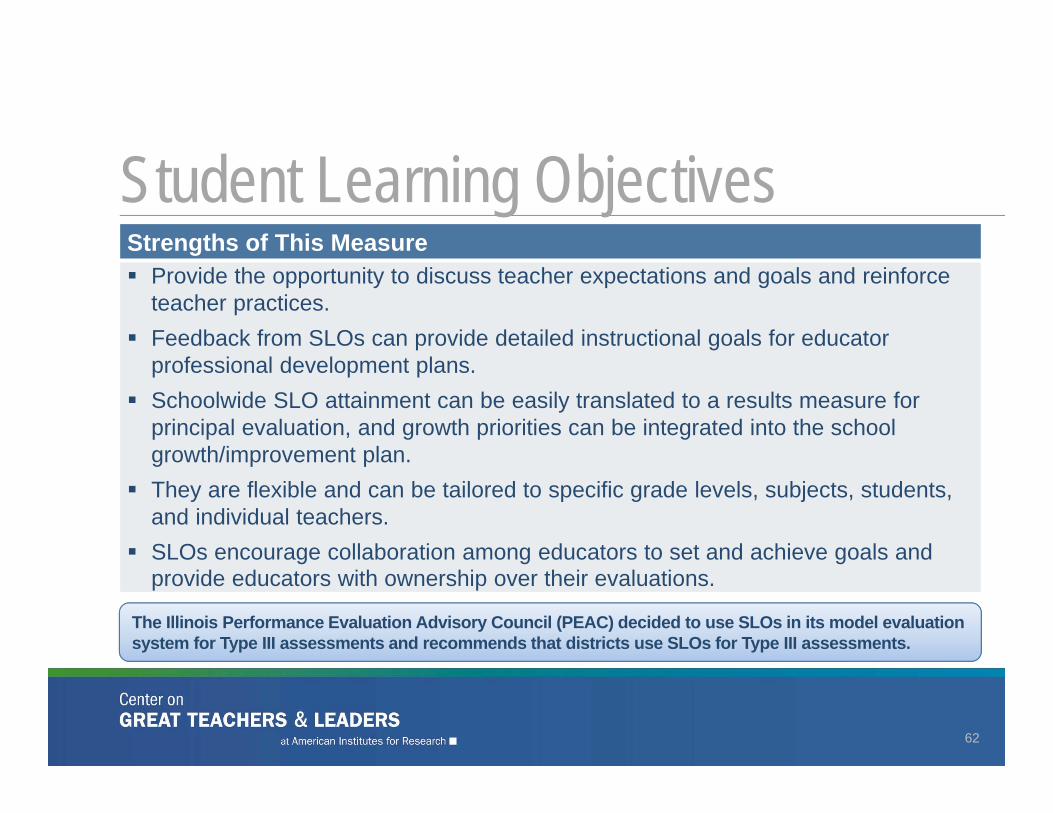
The Illinois Performance Evaluation Advisory Council (PEAC) decided to use SLOs in its model evaluation system for Type III assessments and recommends that districts use SLOs for Type III assessments.
62
Strengths of This Measure Provide the opportunity to discuss teacher expectations and goals and reinforce
teacher practices. Feedback from SLOs can provide detailed instructional goals for educator
professional development plans. Schoolwide SLO attainment can be easily translated to a results measure for
principal evaluation, and growth priorities can be integrated into the school growth/improvement plan.
They are flexible and can be tailored to specific grade levels, subjects, students, and individual teachers.
SLOs encourage collaboration among educators to set and achieve goals and provide educators with ownership over their evaluations.
Student Learning Objectives
63
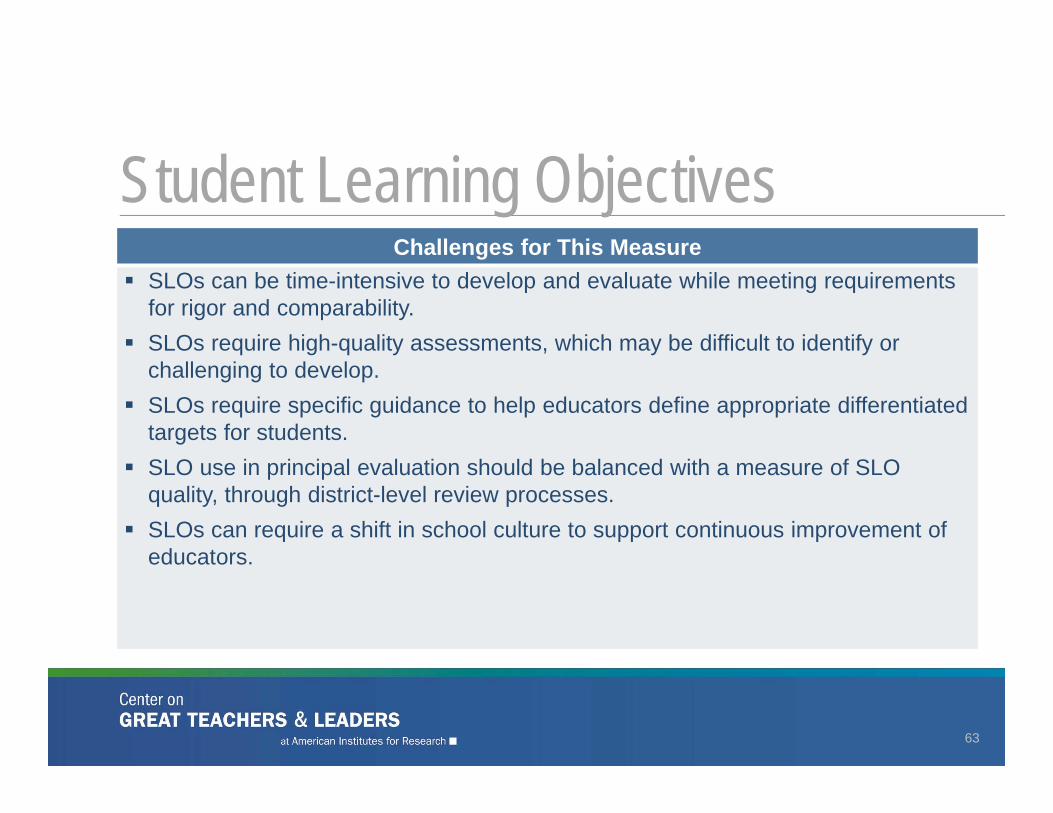
Challenges for This Measure SLOs can be time-intensive to develop and evaluate while meeting requirements
for rigor and comparability. SLOs require high-quality assessments, which may be difficult to identify or
challenging to develop. SLOs require specific guidance to help educators define appropriate differentiated
targets for students. SLO use in principal evaluation should be balanced with a measure of SLO
quality, through district-level review processes. SLOs can require a shift in school culture to support continuous improvement of
educators.
SLOs: Setting Growth Targets
64
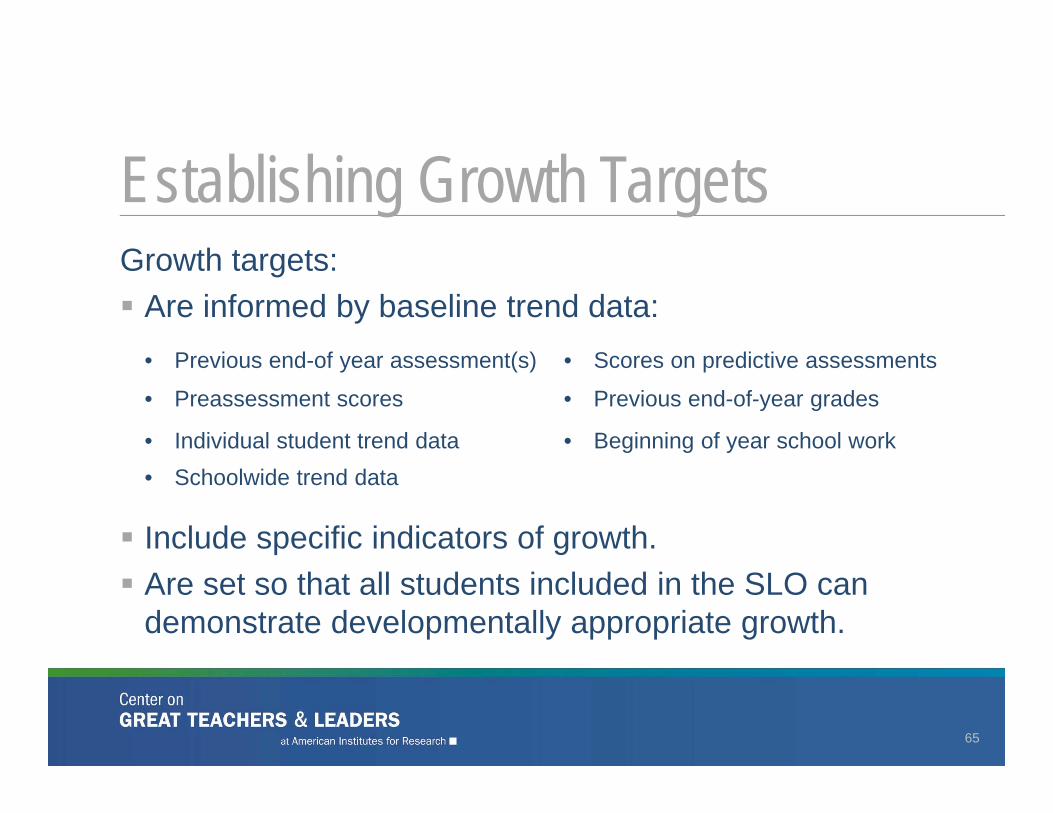
Growth targets: Are informed by baseline trend data:
Include specific indicators of growth. Are set so that all students included in the SLO can
demonstrate developmentally appropriate growth.
Establishing Growth Targets
65
• Previous end-of year assessment(s) • Scores on predictive assessments
• Preassessment scores • Previous end-of-year grades
• Individual student trend data • Beginning of year school work• Schoolwide trend data
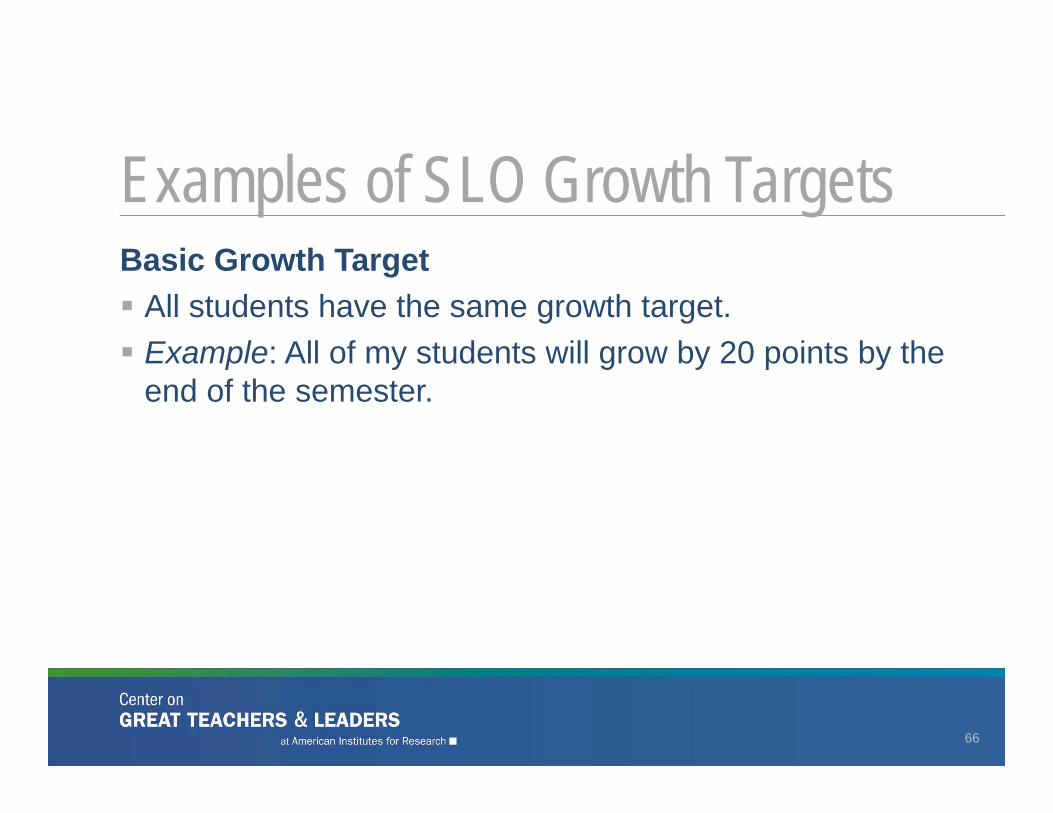
Basic Growth Target All students have the same growth target. Example: All of my students will grow by 20 points by the
end of the semester.
Examples of SLO Growth Targets
66
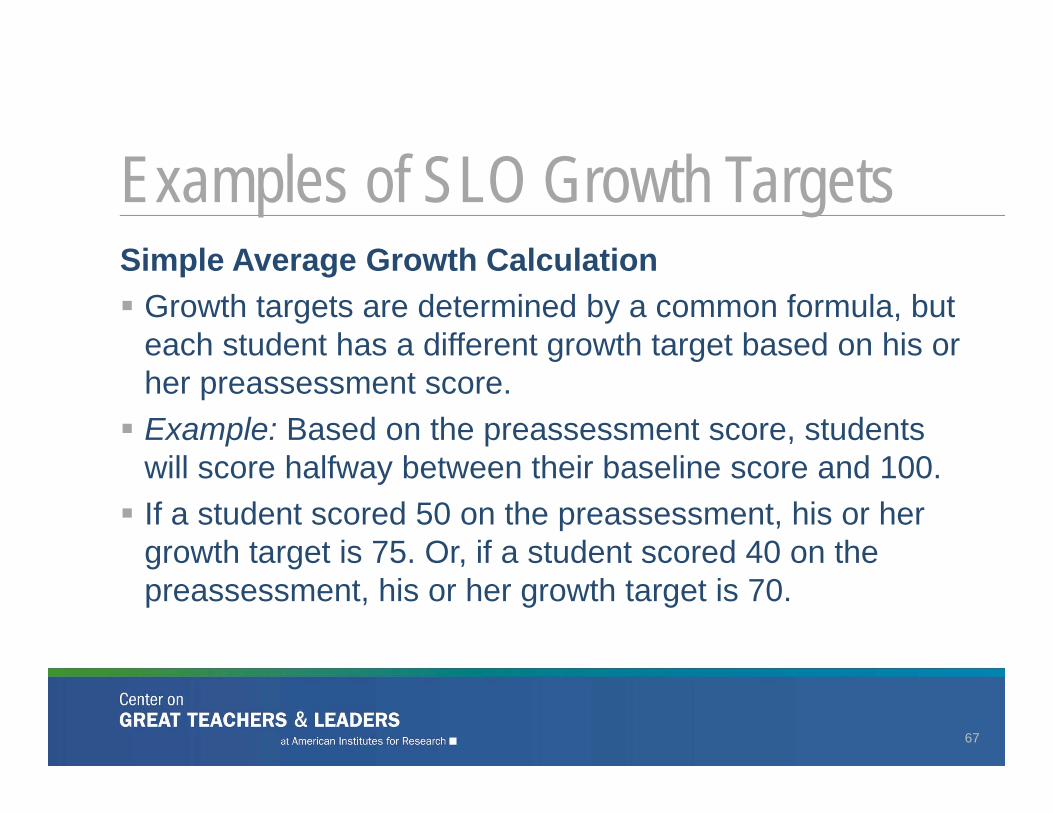
Simple Average Growth Calculation Growth targets are determined by a common formula, but
each student has a different growth target based on his or her preassessment score. Example: Based on the preassessment score, students
will score halfway between their baseline score and 100. If a student scored 50 on the preassessment, his or her
growth target is 75. Or, if a student scored 40 on the preassessment, his or her growth target is 70.
Examples of SLO Growth Targets
67
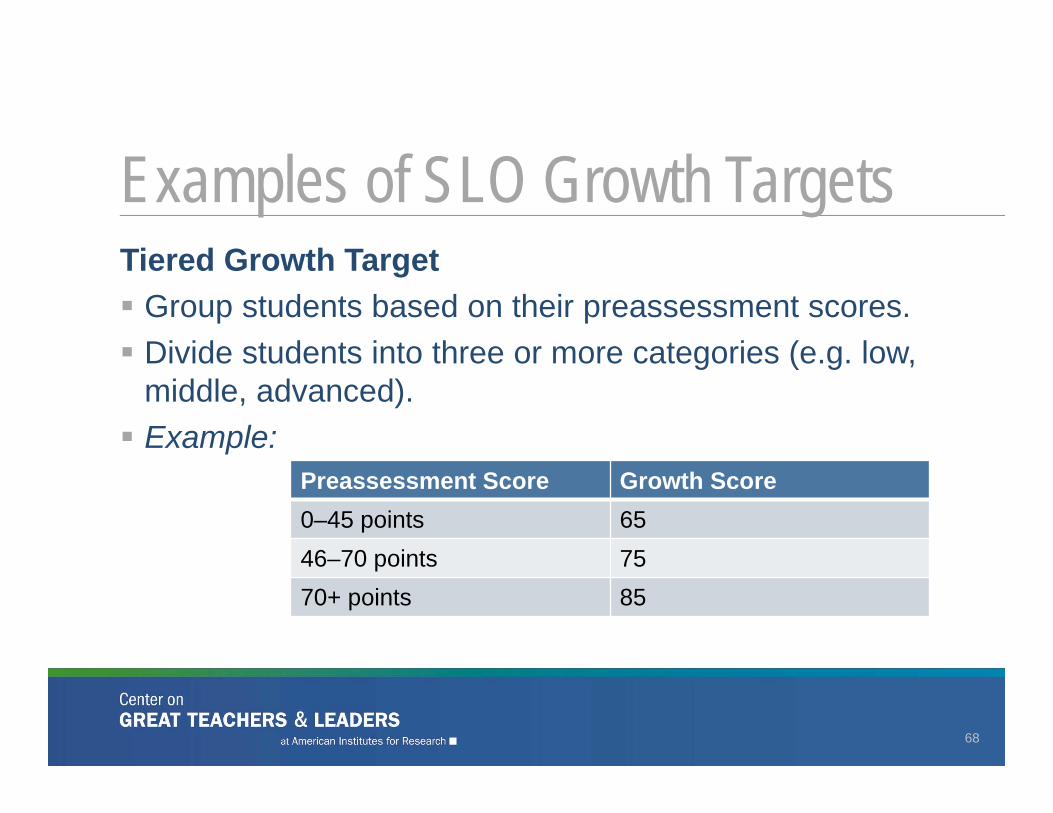
Tiered Growth Target Group students based on their preassessment scores. Divide students into three or more categories (e.g. low,
middle, advanced). Example:
Examples of SLO Growth Targets
68
Preassessment Score Growth Score 0–45 points 6546–70 points 7570+ points 85
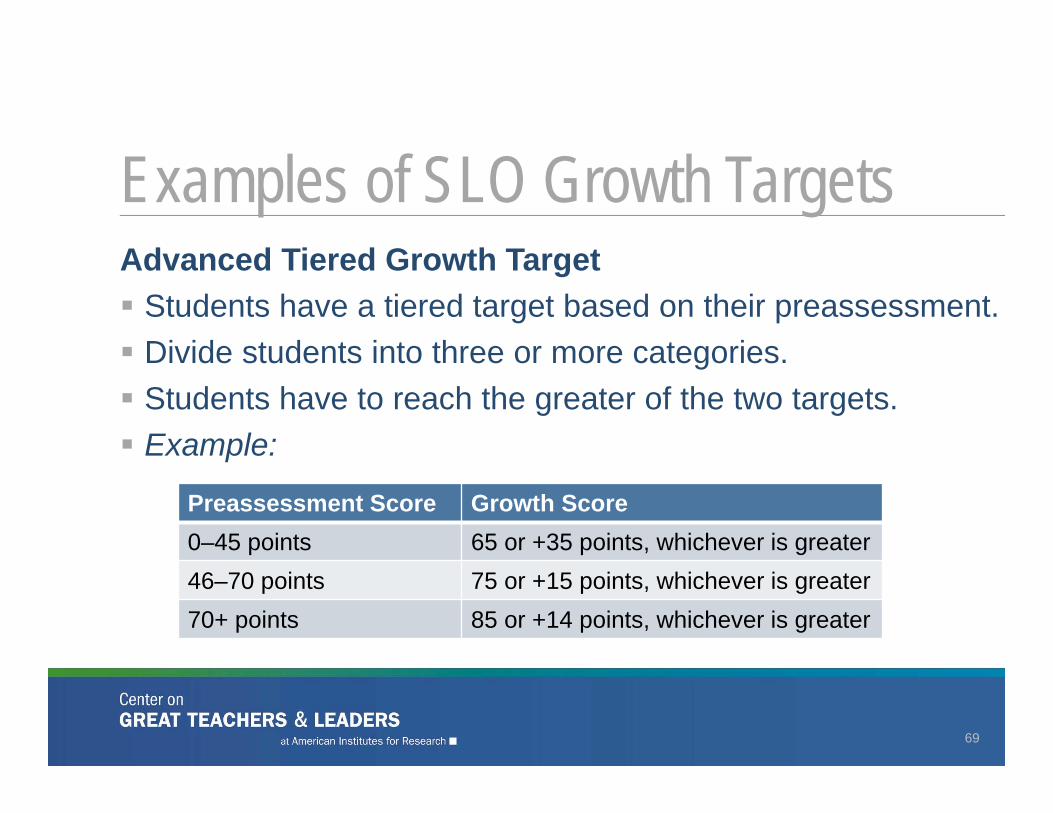
Advanced Tiered Growth Target Students have a tiered target based on their preassessment. Divide students into three or more categories. Students have to reach the greater of the two targets. Example:
Examples of SLO Growth Targets
69
Preassessment Score Growth Score 0–45 points 65 or +35 points, whichever is greater46–70 points 75 or +15 points, whichever is greater70+ points 85 or +14 points, whichever is greater
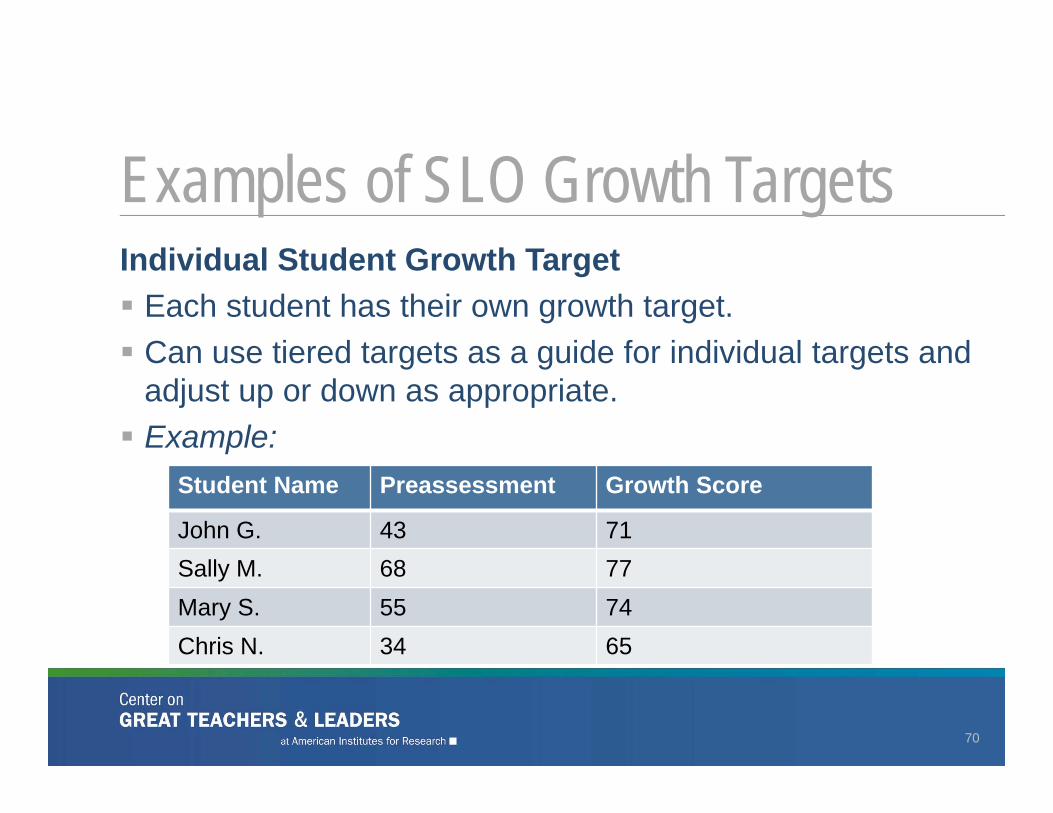
Individual Student Growth Target Each student has their own growth target. Can use tiered targets as a guide for individual targets and
adjust up or down as appropriate. Example:
Examples of SLO Growth Targets
70
Student Name Preassessment Growth Score
John G. 43 71Sally M. 68 77Mary S. 55 74Chris N. 34 65
SLO Growth Target Writing Activity
71
• Review the SLO baseline data provided.• Analyze the baseline data to determine:
• What the information is telling you about your students• What kind of growth target would you develop for these students? • If using a tiered target, what are some natural groupings of students?
• Discuss your analysis and approach with a colleague.
SLO Activity
72
• What type of baseline and trend data are available to teachers?
• How are teachers supported in analyzing baseline data?• How are evaluators supported in knowing “how much growth
is enough”?
Questions to Consider
73
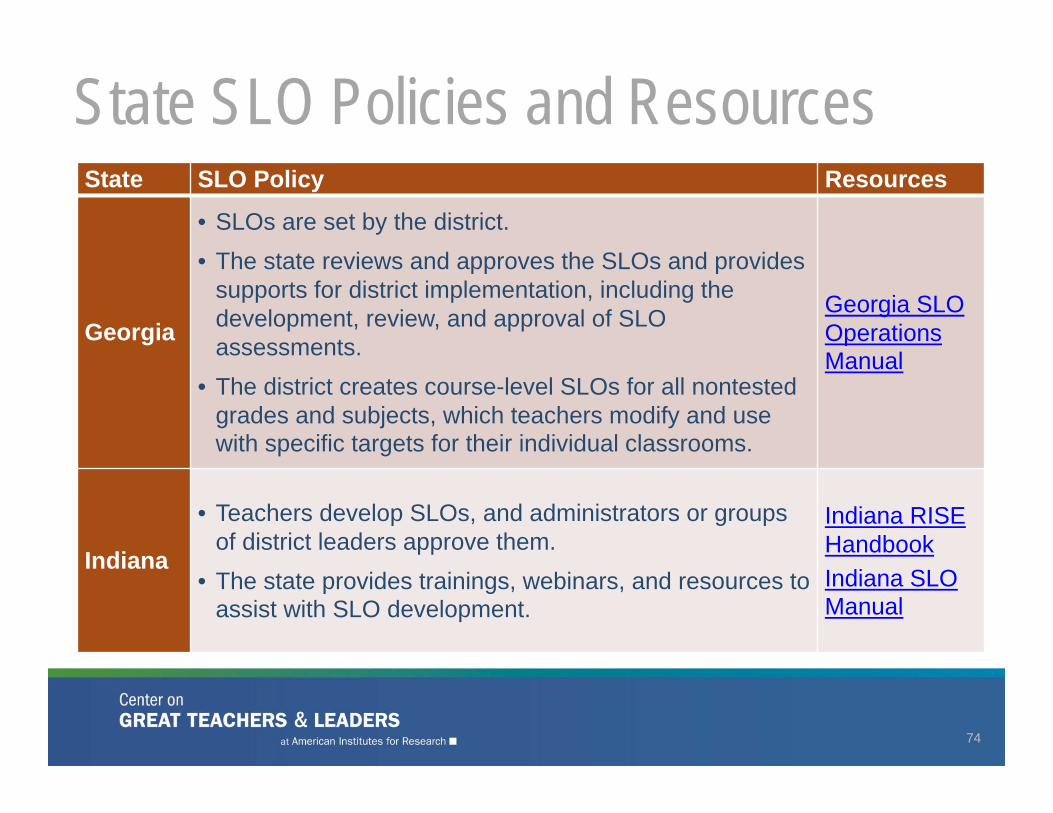
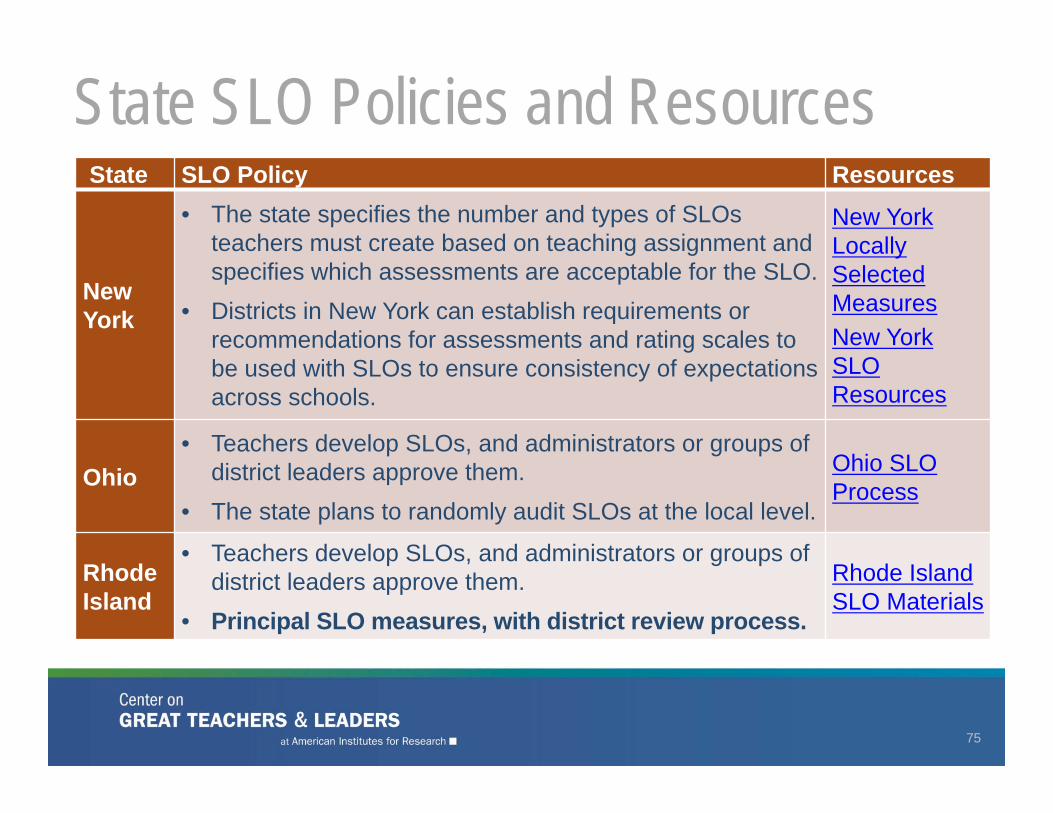
State SLO Policies and Resources
74
State SLO Policy Resources
Georgia
• SLOs are set by the district.• The state reviews and approves the SLOs and provides
supports for district implementation, including the development, review, and approval of SLO assessments.
• The district creates course-level SLOs for all nontested grades and subjects, which teachers modify and use with specific targets for their individual classrooms.
Georgia SLO Operations Manual
Indiana
• Teachers develop SLOs, and administrators or groups of district leaders approve them.
• The state provides trainings, webinars, and resources to assist with SLO development.
Indiana RISE HandbookIndiana SLO Manual
State SLO Policies and Resources
75
State SLO Policy Resources
New York
• The state specifies the number and types of SLOs teachers must create based on teaching assignment and specifies which assessments are acceptable for the SLO.
• Districts in New York can establish requirements or recommendations for assessments and rating scales to be used with SLOs to ensure consistency of expectations across schools.
New York Locally Selected MeasuresNew York SLO Resources
Ohio• Teachers develop SLOs, and administrators or groups of
district leaders approve them. • The state plans to randomly audit SLOs at the local level.
Ohio SLO Process
Rhode Island
• Teachers develop SLOs, and administrators or groups of district leaders approve them.
• Principal SLO measures, with district review process.
Rhode Island SLO Materials
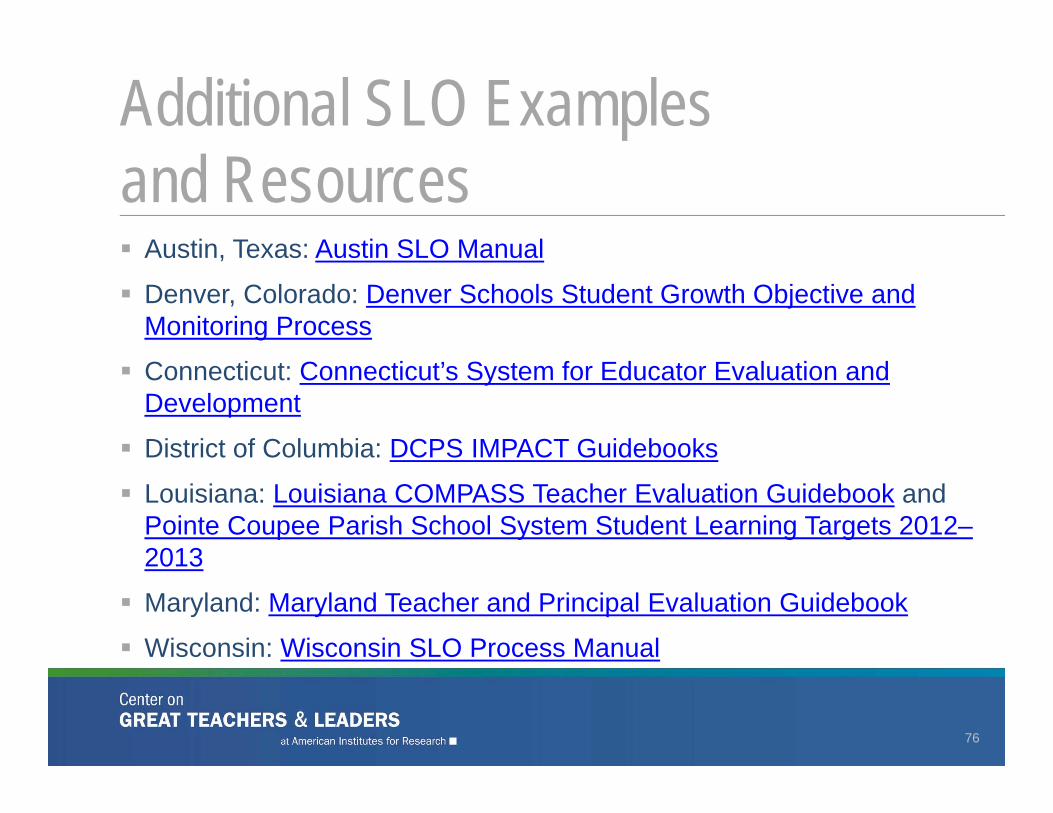
Austin, Texas: Austin SLO Manual
Denver, Colorado: Denver Schools Student Growth Objective and Monitoring Process
Connecticut: Connecticut’s System for Educator Evaluation and Development
District of Columbia: DCPS IMPACT Guidebooks
Louisiana: Louisiana COMPASS Teacher Evaluation Guidebook and Pointe Coupee Parish School System Student Learning Targets 2012–2013
Maryland: Maryland Teacher and Principal Evaluation Guidebook
Wisconsin: Wisconsin SLO Process Manual
Additional SLO Examples and Resources
76
Multiple Measures: Surveys
77
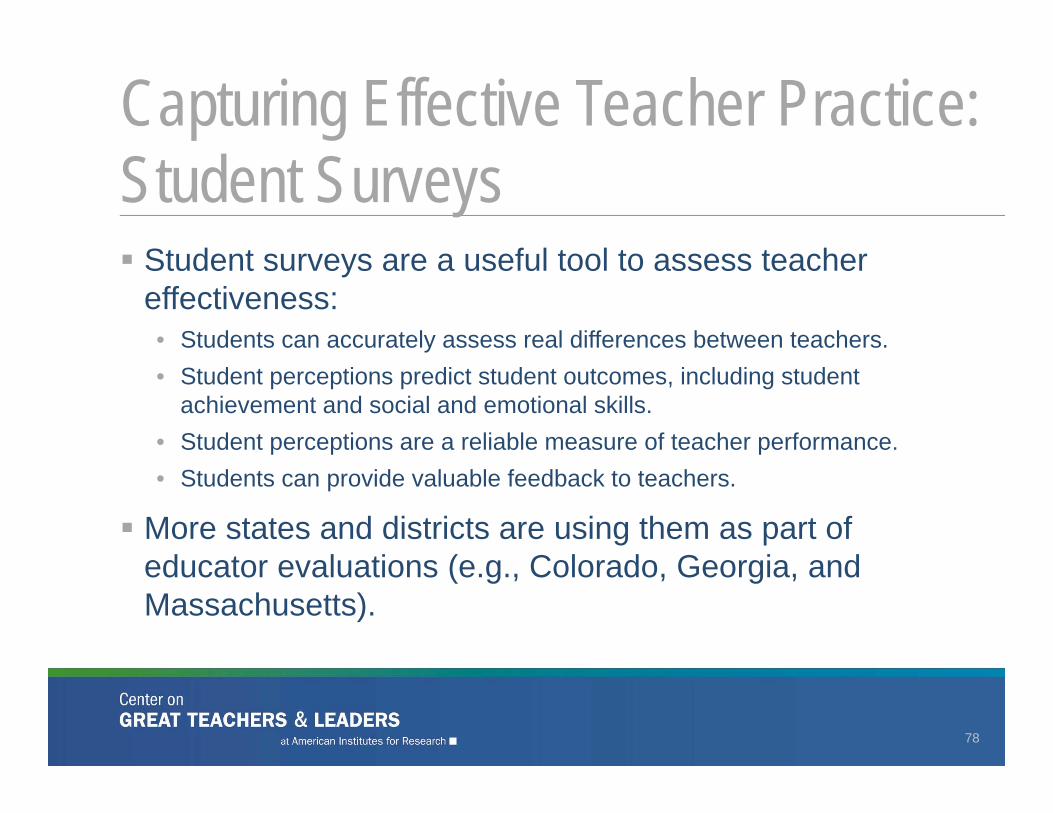
Student surveys are a useful tool to assess teacher effectiveness:• Students can accurately assess real differences between teachers.• Student perceptions predict student outcomes, including student
achievement and social and emotional skills.• Student perceptions are a reliable measure of teacher performance.• Students can provide valuable feedback to teachers.
More states and districts are using them as part of educator evaluations (e.g., Colorado, Georgia, and Massachusetts).
Capturing Effective Teacher Practice: Student Surveys
78
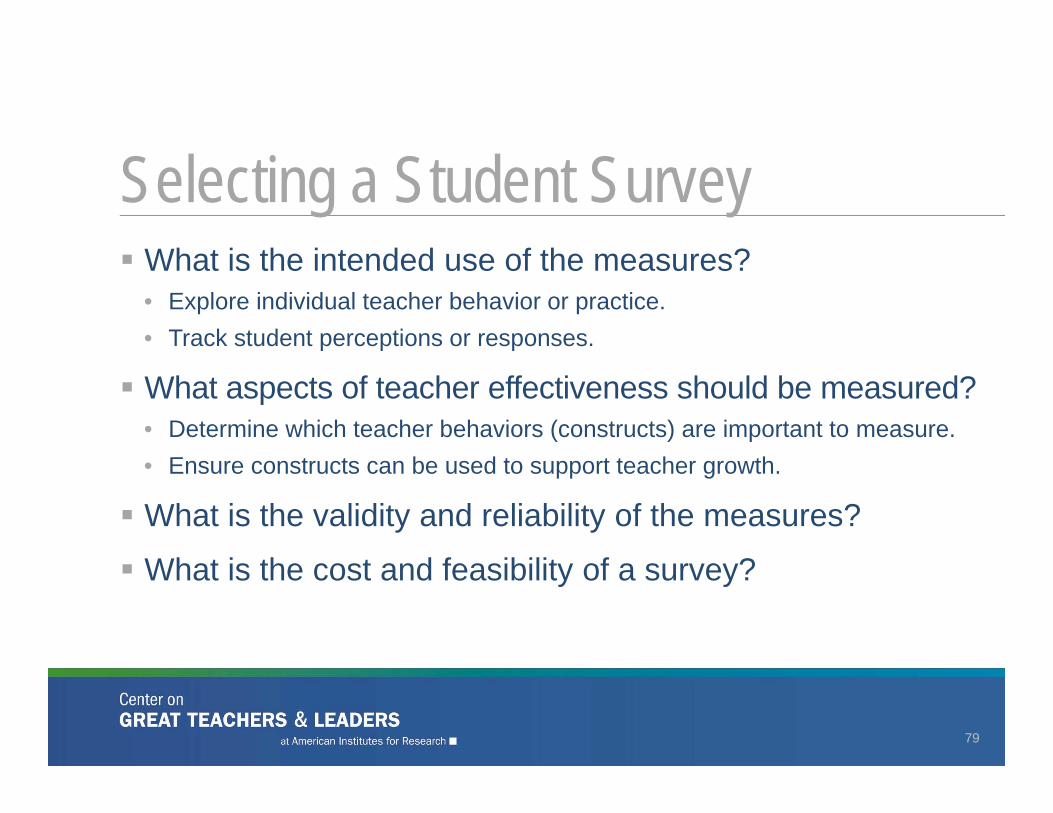
What is the intended use of the measures?• Explore individual teacher behavior or practice.• Track student perceptions or responses.
What aspects of teacher effectiveness should be measured?• Determine which teacher behaviors (constructs) are important to measure.• Ensure constructs can be used to support teacher growth.
What is the validity and reliability of the measures?
What is the cost and feasibility of a survey?
Selecting a Student Survey
79
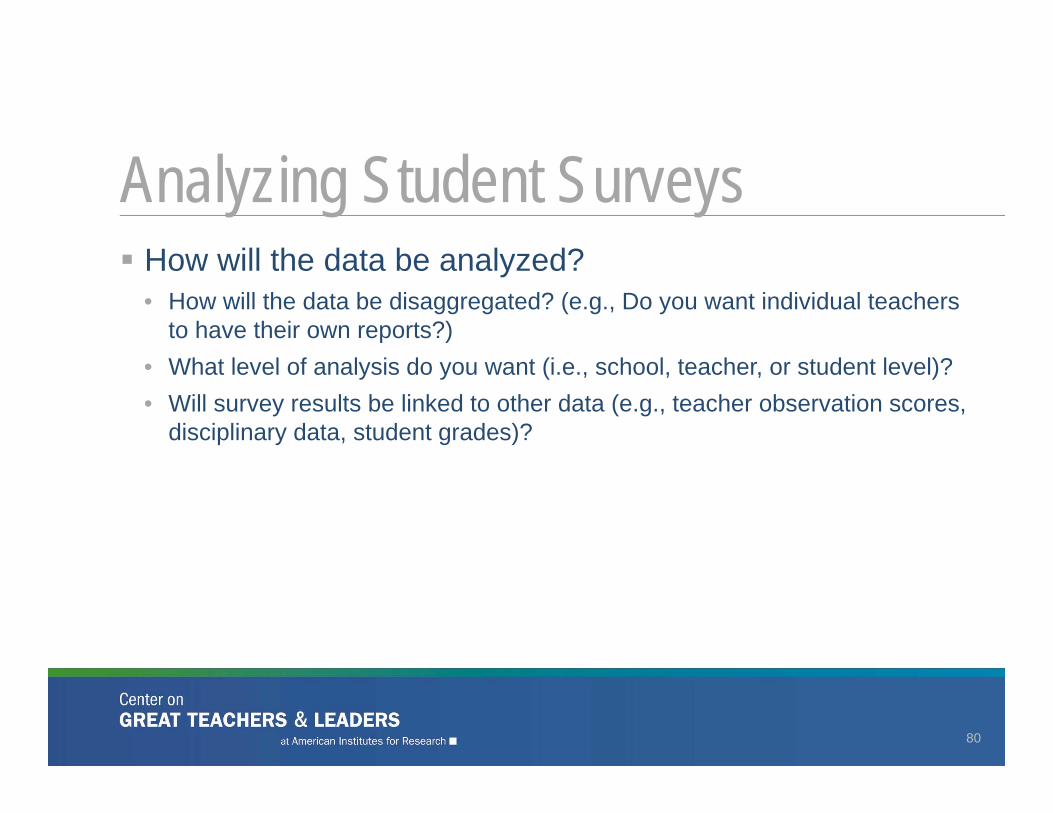
How will the data be analyzed?• How will the data be disaggregated? (e.g., Do you want individual teachers
to have their own reports?)• What level of analysis do you want (i.e., school, teacher, or student level)?• Will survey results be linked to other data (e.g., teacher observation scores,
disciplinary data, student grades)?
Analyzing Student Surveys
80
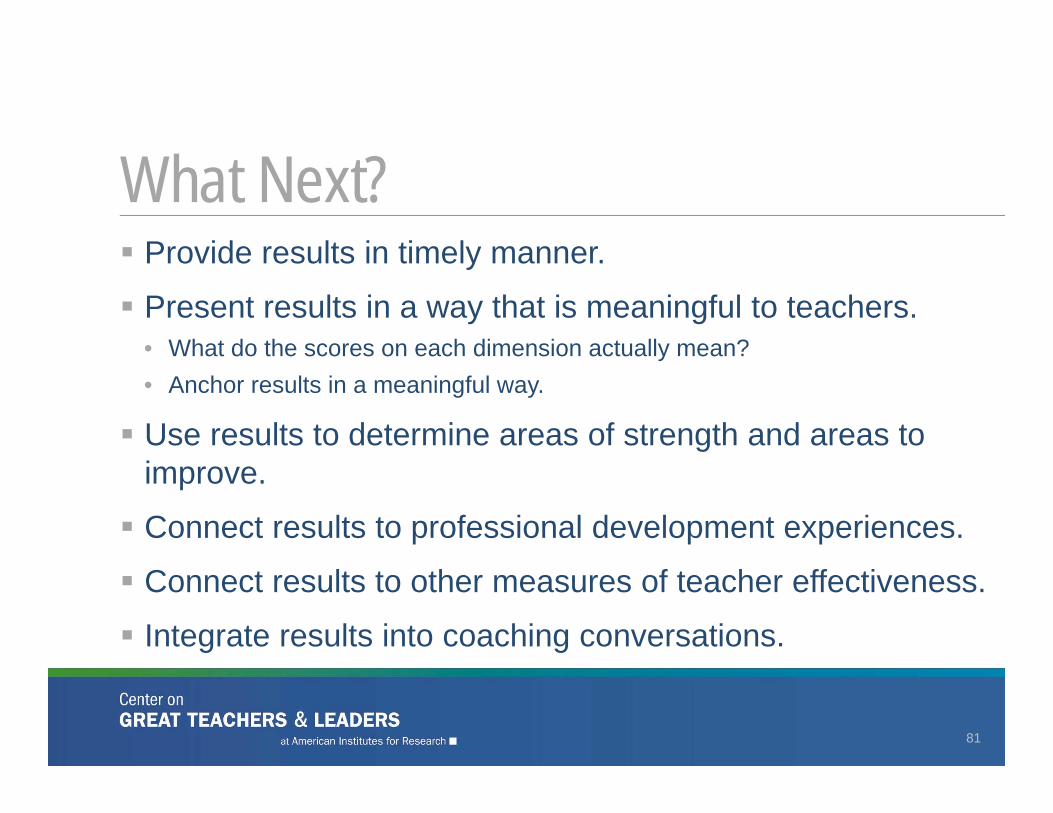
Provide results in timely manner.
Present results in a way that is meaningful to teachers. • What do the scores on each dimension actually mean?• Anchor results in a meaningful way.
Use results to determine areas of strength and areas to improve.
Connect results to professional development experiences.
Connect results to other measures of teacher effectiveness.
Integrate results into coaching conversations.
What Next?
81
Tripod
82
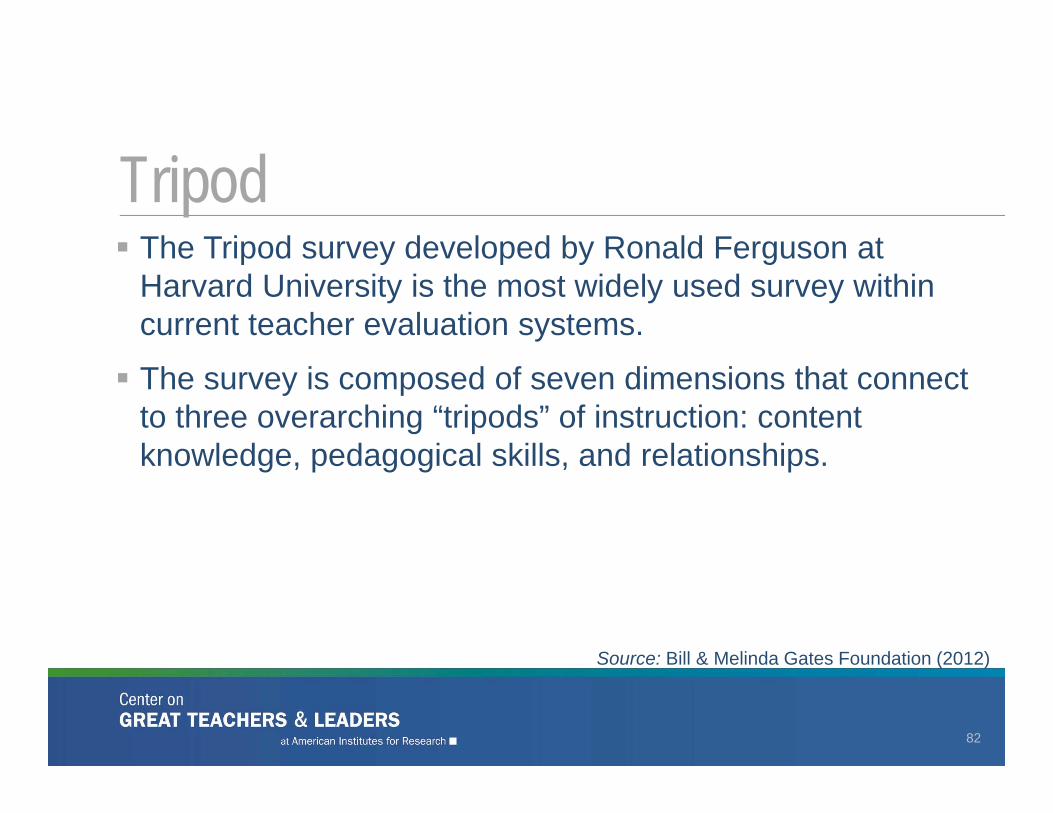
The Tripod survey developed by Ronald Ferguson at Harvard University is the most widely used survey within current teacher evaluation systems.
The survey is composed of seven dimensions that connect to three overarching “tripods” of instruction: content knowledge, pedagogical skills, and relationships.
Source: Bill & Melinda Gates Foundation (2012)
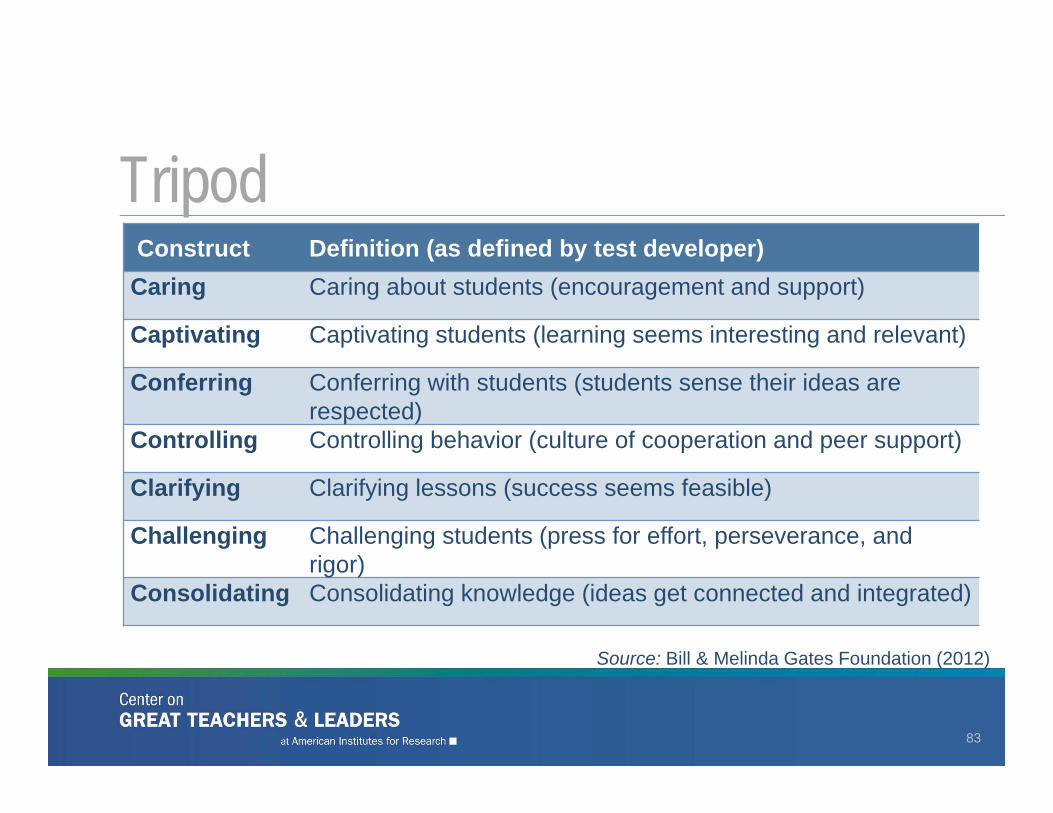
Construct Definition (as defined by test developer)Caring Caring about students (encouragement and support)
Captivating Captivating students (learning seems interesting and relevant)
Conferring Conferring with students (students sense their ideas are respected)
Controlling Controlling behavior (culture of cooperation and peer support)
Clarifying Clarifying lessons (success seems feasible)
Challenging Challenging students (press for effort, perseverance, and rigor)
Consolidating Consolidating knowledge (ideas get connected and integrated)
Tripod
83
Source: Bill & Melinda Gates Foundation (2012)
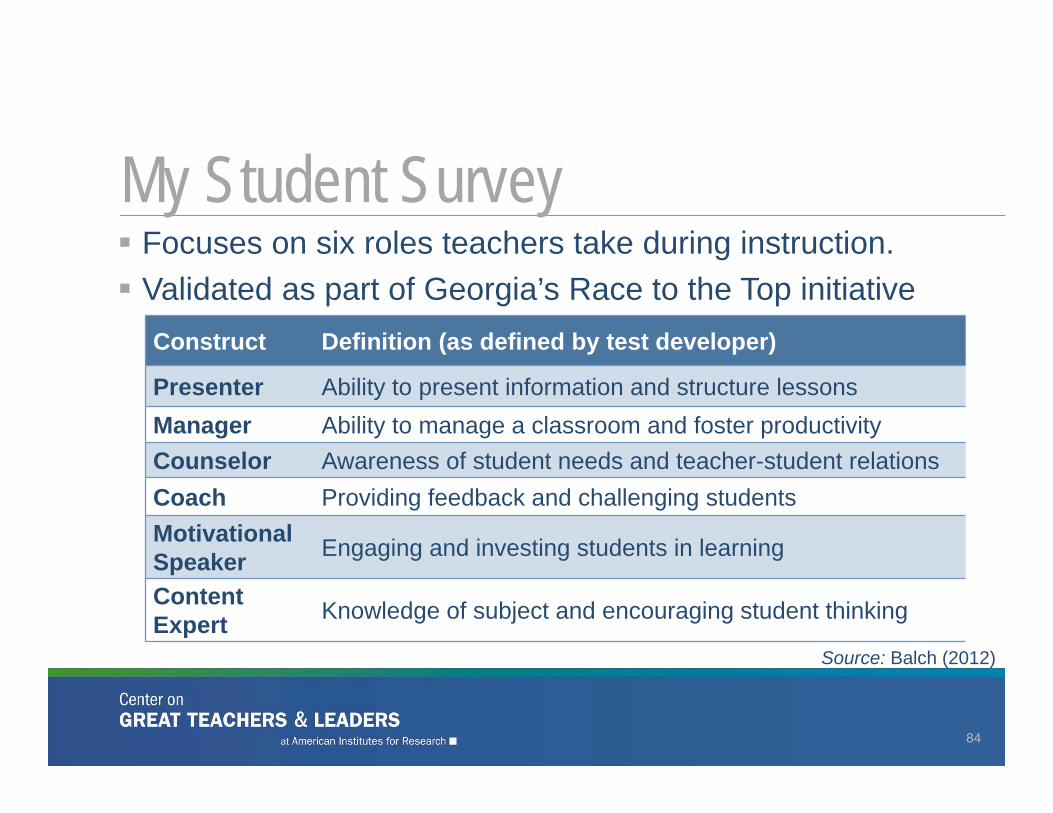
Construct Definition (as defined by test developer)
Presenter Ability to present information and structure lessonsManager Ability to manage a classroom and foster productivityCounselor Awareness of student needs and teacher-student relationsCoach Providing feedback and challenging studentsMotivational Speaker Engaging and investing students in learning
Content Expert Knowledge of subject and encouraging student thinking
My Student Survey
84
Focuses on six roles teachers take during instruction. Validated as part of Georgia’s Race to the Top initiative
Source: Balch (2012)
Weighting and Combining Measures
85
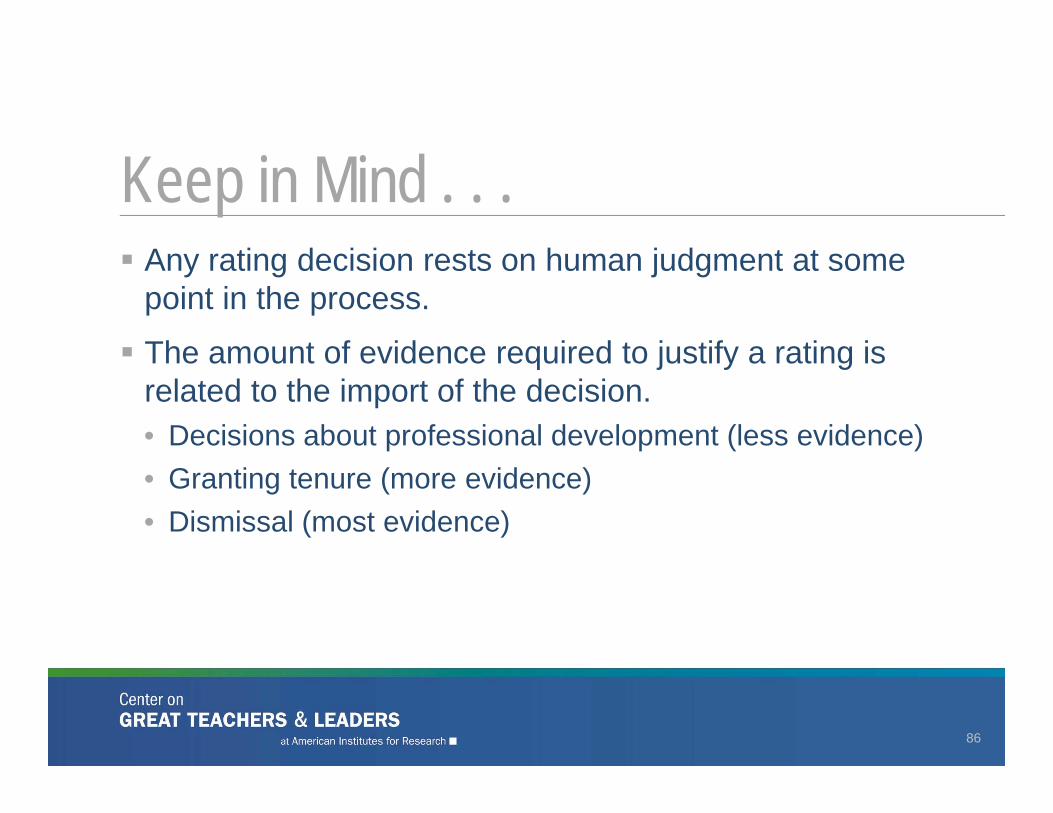
Any rating decision rests on human judgment at some point in the process.
The amount of evidence required to justify a rating is related to the import of the decision.• Decisions about professional development (less evidence)• Granting tenure (more evidence)• Dismissal (most evidence)
Keep in Mind . . .
86
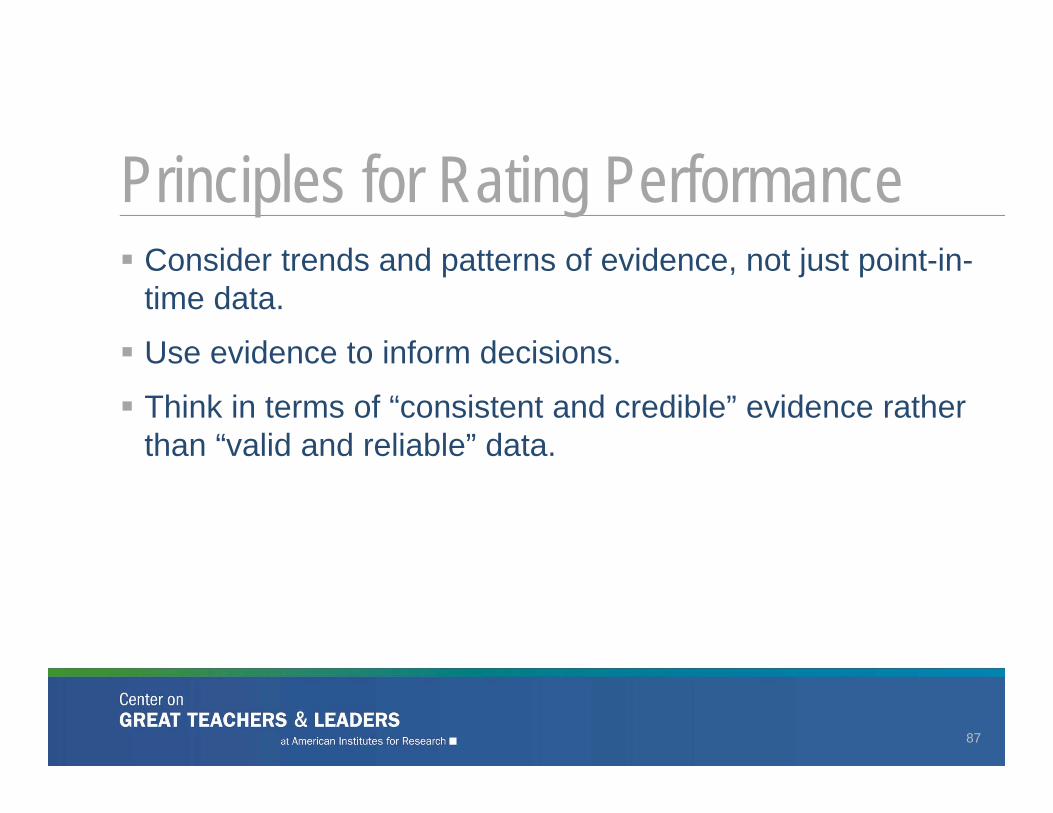
Consider trends and patterns of evidence, not just point-in-time data.
Use evidence to inform decisions.
Think in terms of “consistent and credible” evidence rather than “valid and reliable” data.
Principles for Rating Performance
87
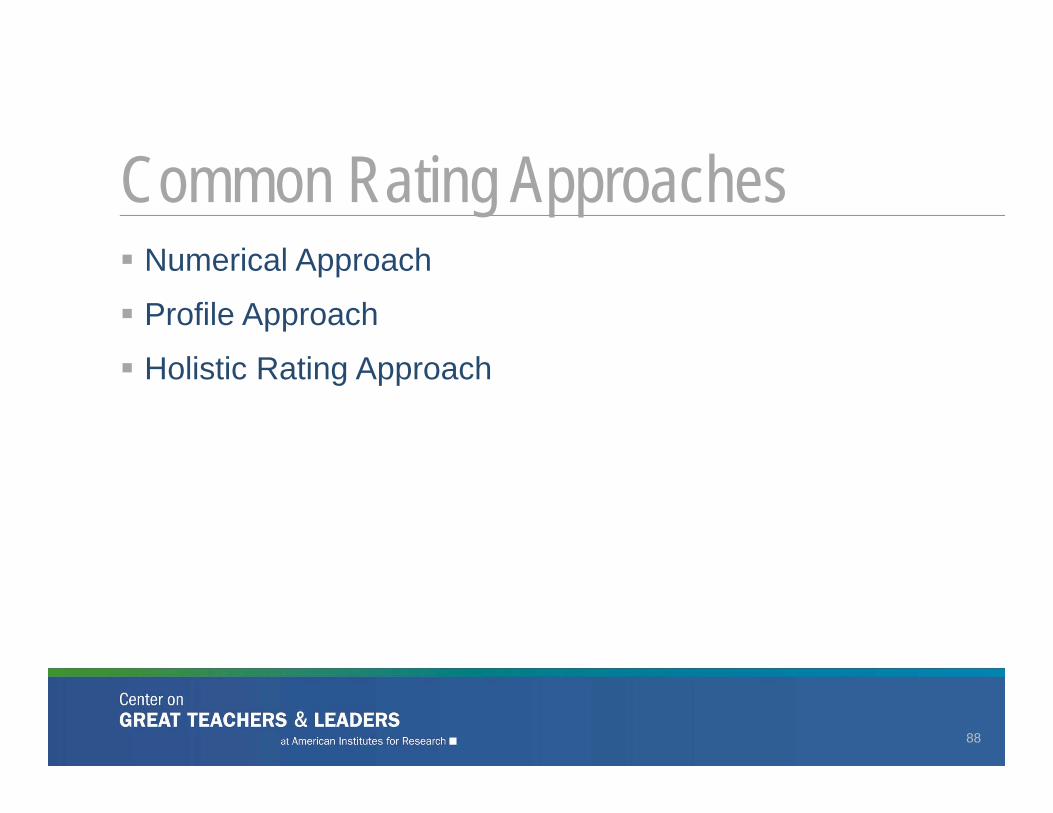
Numerical Approach
Profile Approach
Holistic Rating Approach
Common Rating Approaches
88
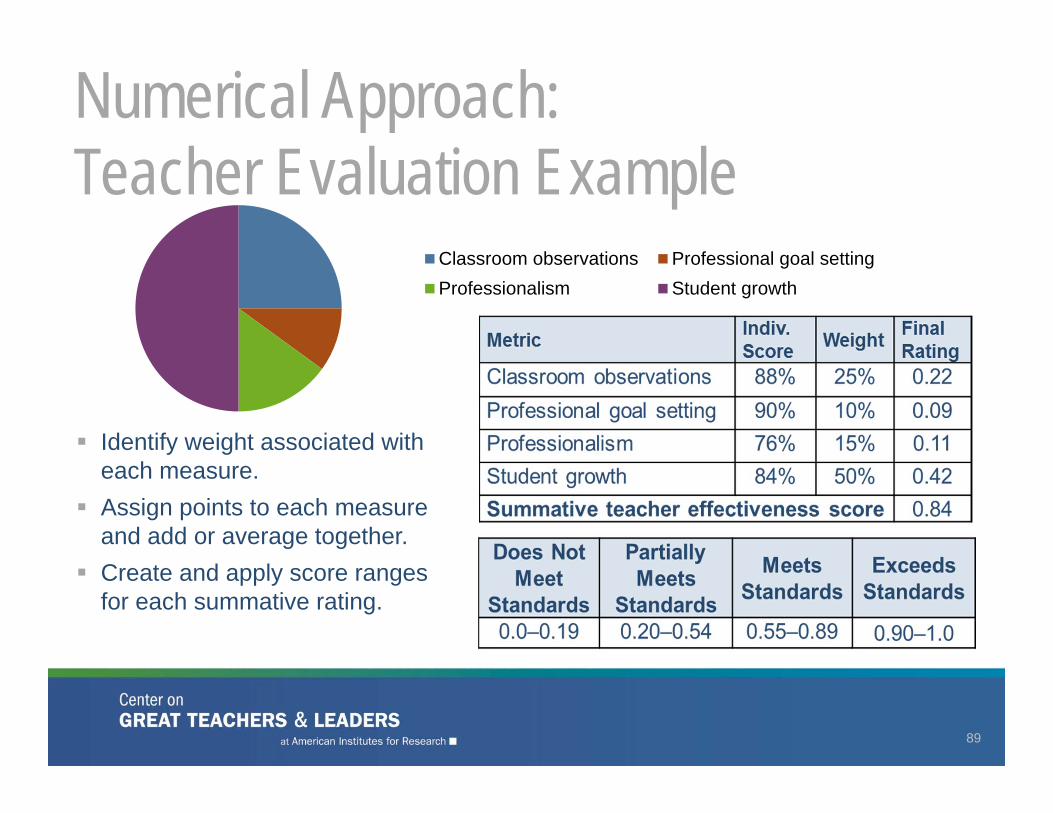
Numerical Approach:Teacher Evaluation Example
89
Classroom observations Professional goal settingProfessionalism Student growth
Identify weight associated with each measure.
Assign points to each measure and add or average together.
Create and apply score ranges for each summative rating.
Profile Approach
90
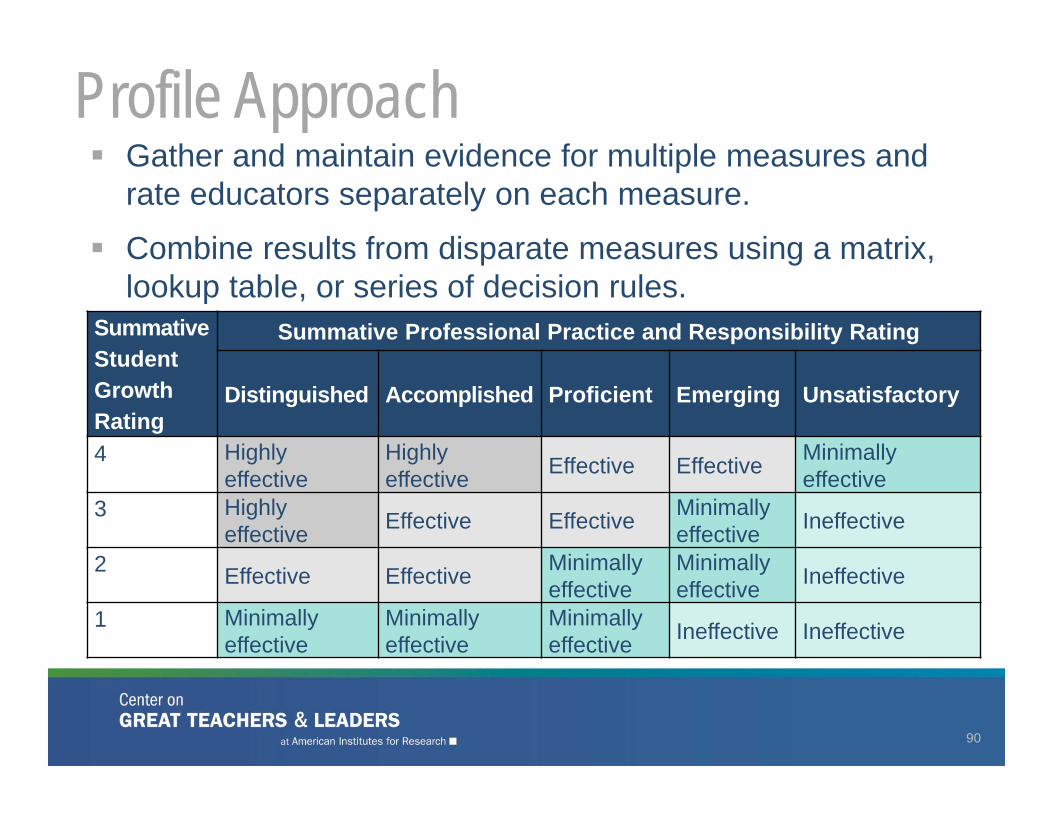
Summative Student Growth Rating
Summative Professional Practice and Responsibility Rating
Distinguished Accomplished Proficient Emerging Unsatisfactory
4 Highly effective
Highly effective Effective Effective Minimally
effective3 Highly
effective Effective Effective Minimally effective Ineffective
2 Effective Effective Minimally effective
Minimally effective Ineffective
1 Minimally effective
Minimally effective
Minimally effective Ineffective Ineffective
Gather and maintain evidence for multiple measures and rate educators separately on each measure.
Combine results from disparate measures using a matrix, lookup table, or series of decision rules.
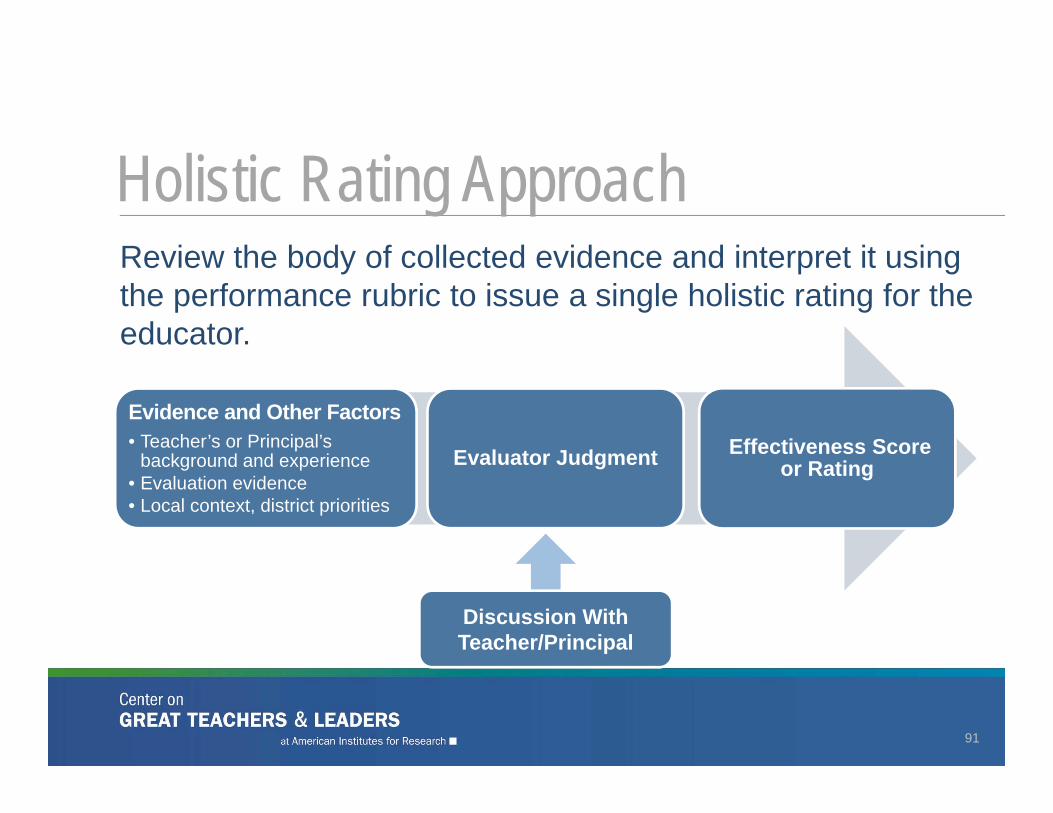
Holistic Rating ApproachReview the body of collected evidence and interpret it using the performance rubric to issue a single holistic rating for the educator.
Evidence and Other Factors• Teacher’s or Principal’s
background and experience• Evaluation evidence• Local context, district priorities
Evaluator Judgment Effectiveness Score or Rating
Discussion With Teacher/Principal
91
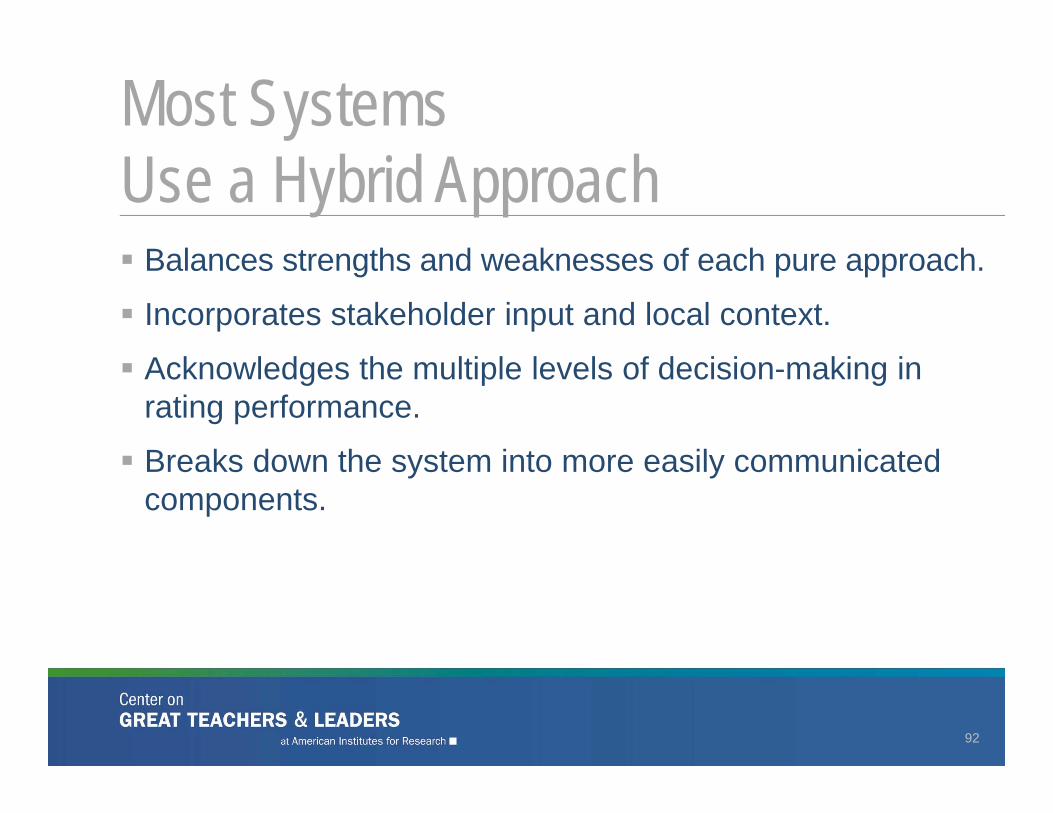
Balances strengths and weaknesses of each pure approach.
Incorporates stakeholder input and local context.
Acknowledges the multiple levels of decision-making in rating performance.
Breaks down the system into more easily communicated components.
Most Systems Use a Hybrid Approach
92
Optional Implementation RulesMinimum Competence Thresholds Create decision rules related to minimum standards for some or
all performance criteria that supersede other rules. Apply these rules to all or some educators (e.g., veteran, those
nearing tenure).
Proficiency Progression Choose the performance criteria that are most critical for
proficiency in the first year or phase. Increase minimum requirements year by year until desired
proficiency standards are met.
93
Designing a Rating System and Setting Cut ScoresConsiderations Where you set the bar will affect an educator’s final rating
and the distribution of scores.
Using model performance data can help predict outcomes.
Ensure that technical and policy needs and priorities are taken into account.
Ensure that the components and the overall system are valid.
94
Teacher Evaluation to Support Professional Learning
95
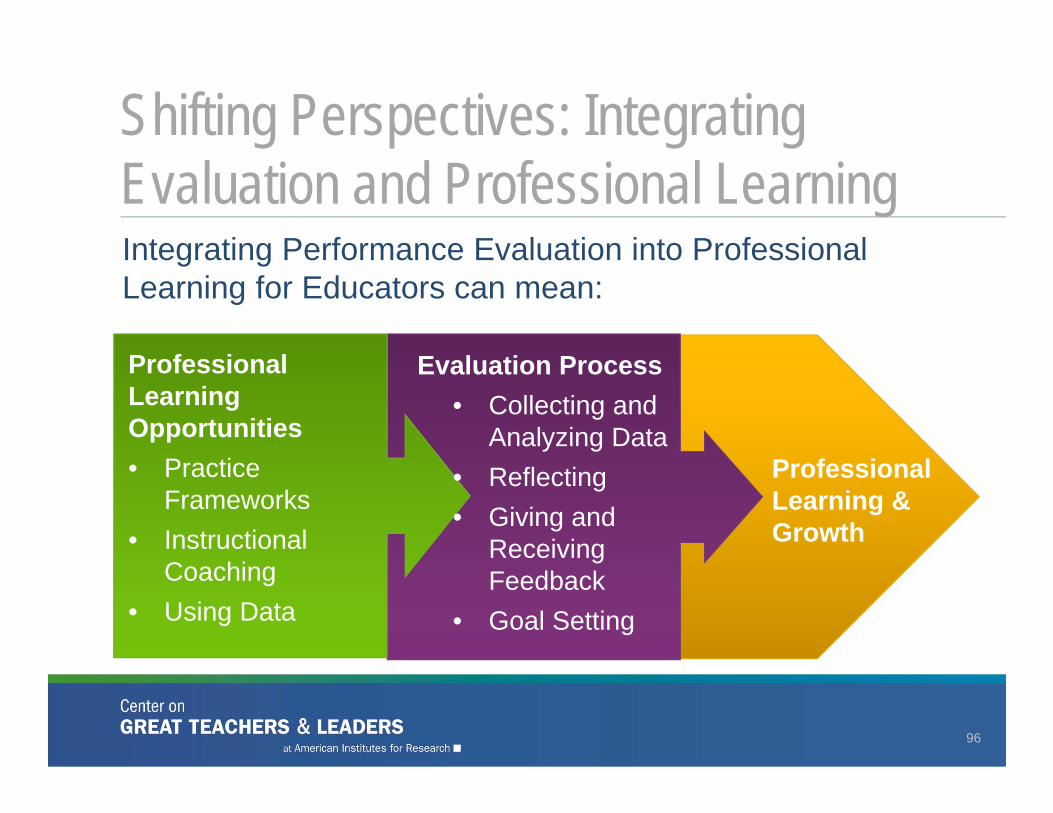
Integrating Performance Evaluation into Professional Learning for Educators can mean:
Shifting Perspectives: Integrating Evaluation and Professional Learning
96
Professional Learning & Growth
Professional Learning Opportunities • Practice
Frameworks• Instructional
Coaching• Using Data
Evaluation Process • Collecting and
Analyzing Data• Reflecting• Giving and
Receiving Feedback
• Goal Setting
Shifting Perspectives: Integrating Evaluation and Professional Learning
97
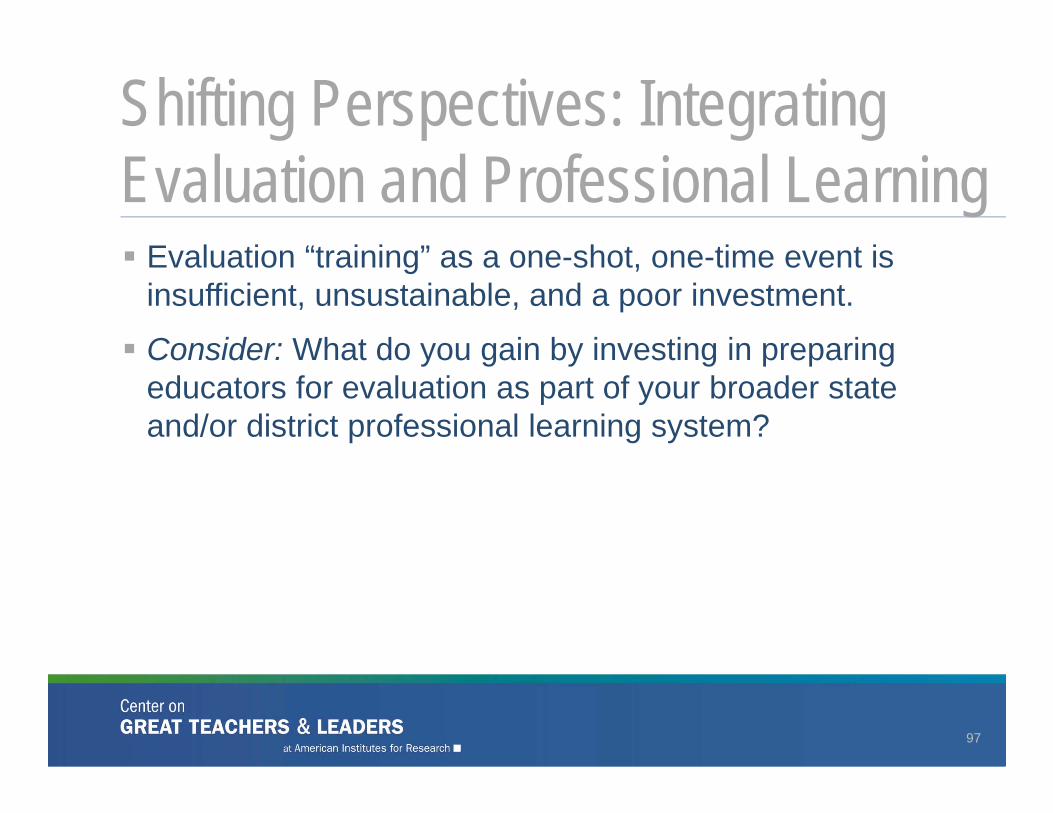
Evaluation “training” as a one-shot, one-time event is insufficient, unsustainable, and a poor investment.
Consider: What do you gain by investing in preparing educators for evaluation as part of your broader state and/or district professional learning system?
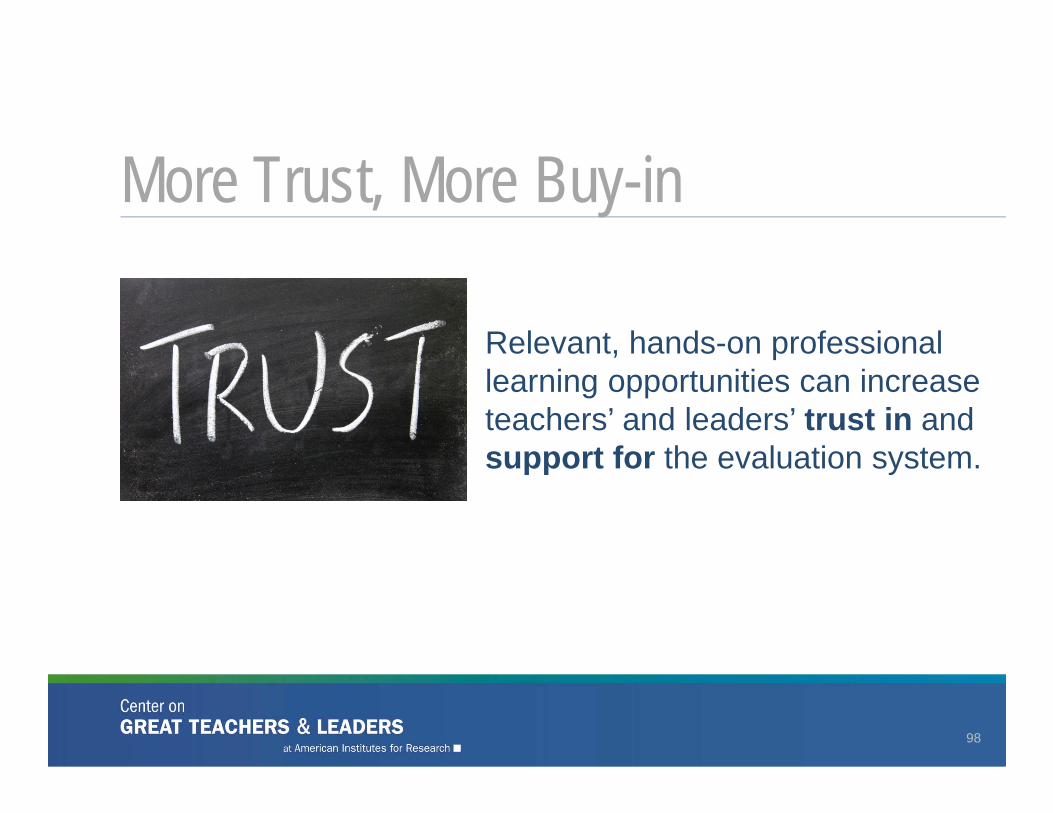
Relevant, hands-on professional learning opportunities can increase teachers’ and leaders’ trust in and support for the evaluation system.
More Trust, More Buy-in
98
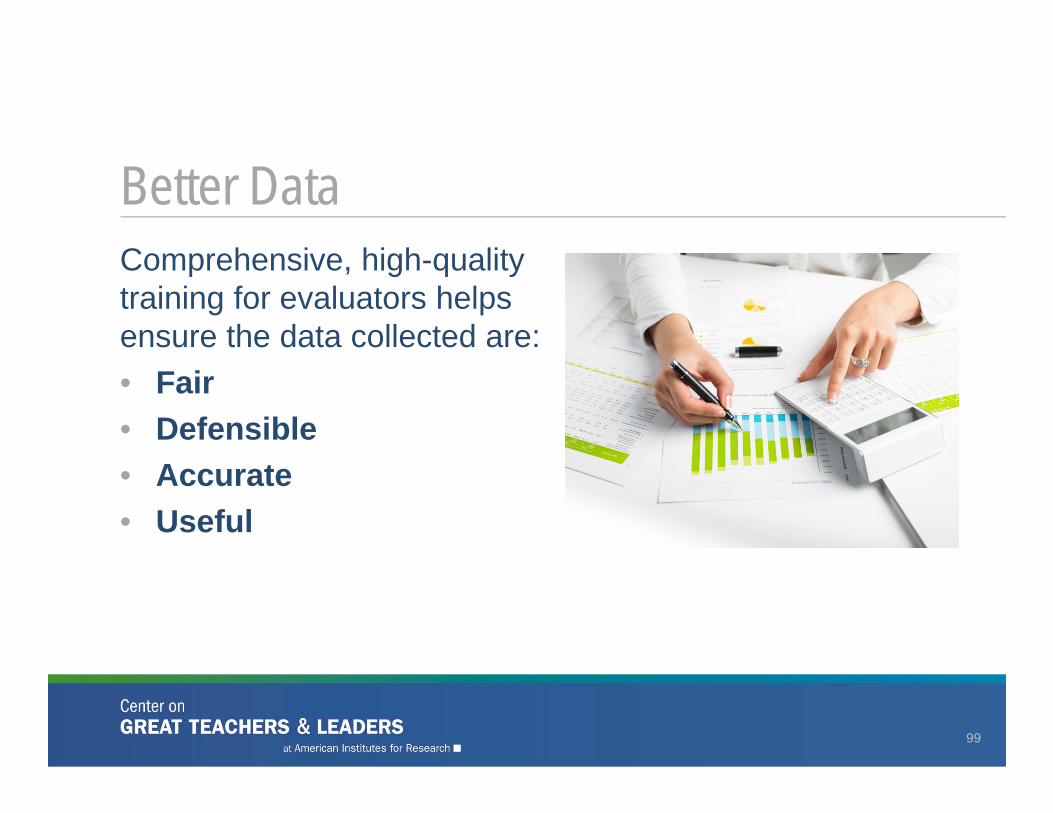
Better Data
99
Comprehensive, high-quality training for evaluators helps ensure the data collected are:• Fair• Defensible• Accurate• Useful
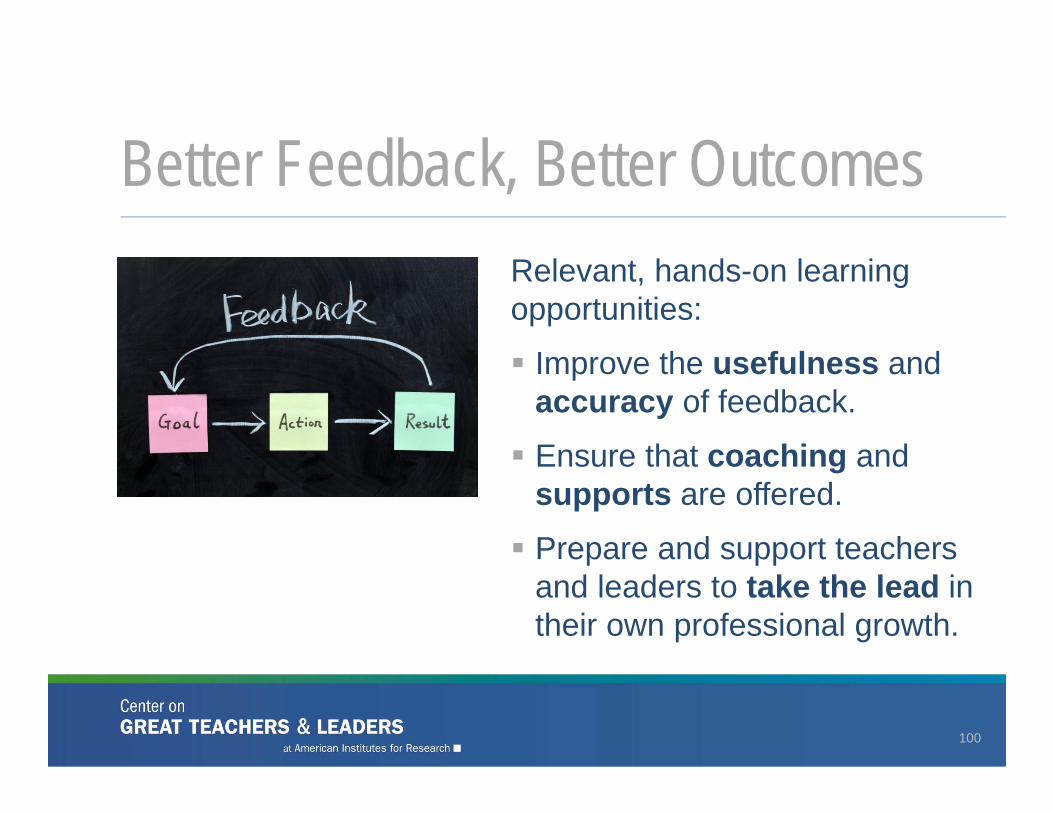
Better Feedback, Better Outcomes
100
Relevant, hands-on learning opportunities:
Improve the usefulness and accuracy of feedback.
Ensure that coaching and supports are offered.
Prepare and support teachers and leaders to take the lead in their own professional growth.
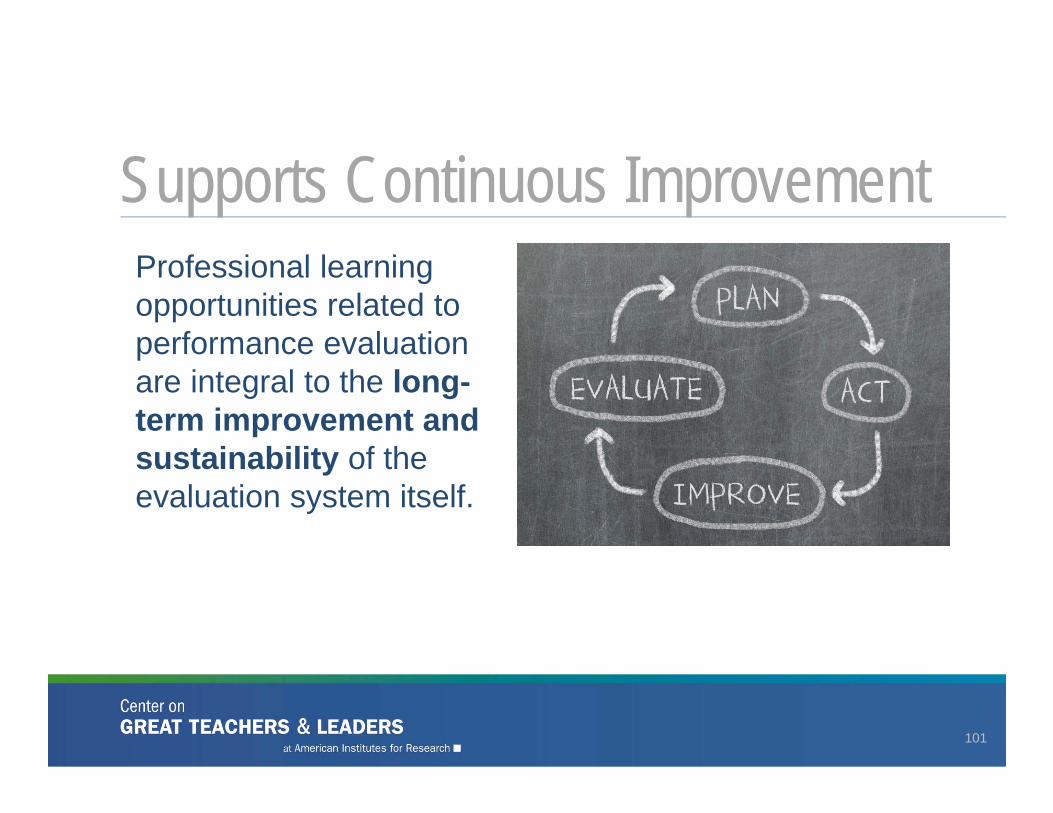
Professional learning opportunities related to performance evaluation are integral to the long-term improvement and sustainability of the evaluation system itself.
Supports Continuous Improvement
101
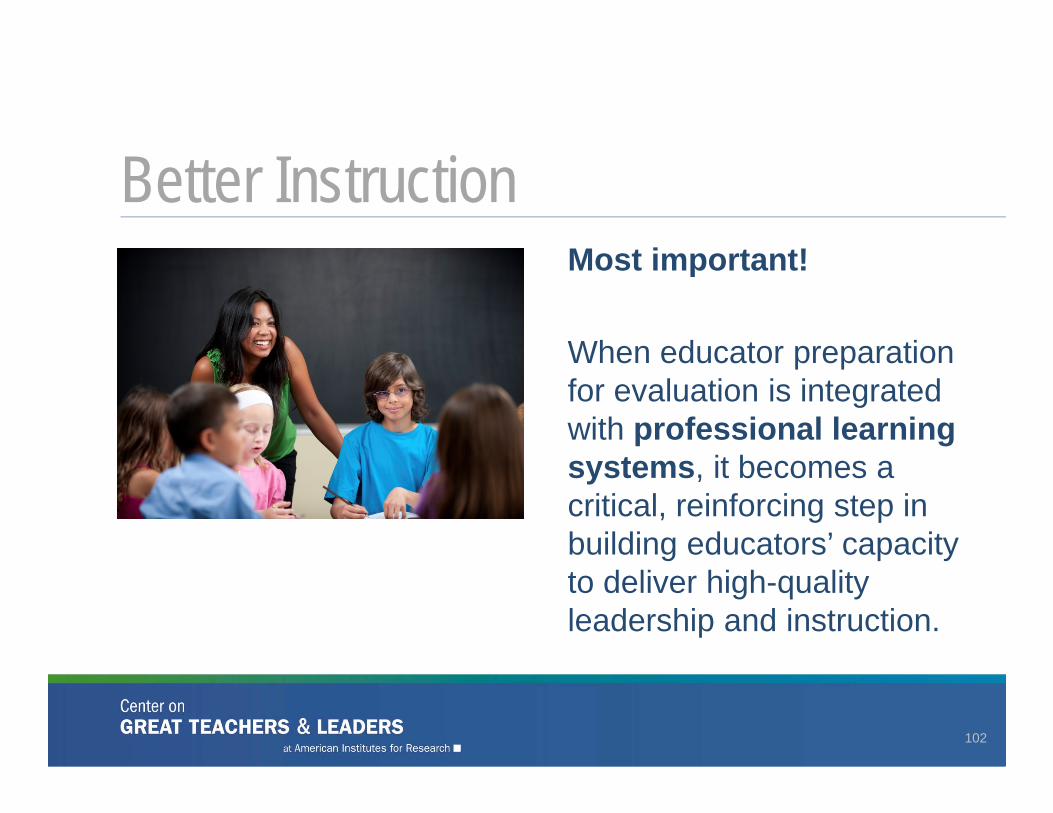
Most important!
When educator preparation for evaluation is integrated with professional learning systems, it becomes a critical, reinforcing step in building educators’ capacity to deliver high-quality leadership and instruction.
Better Instruction
102
High-Quality Professional Learning
103
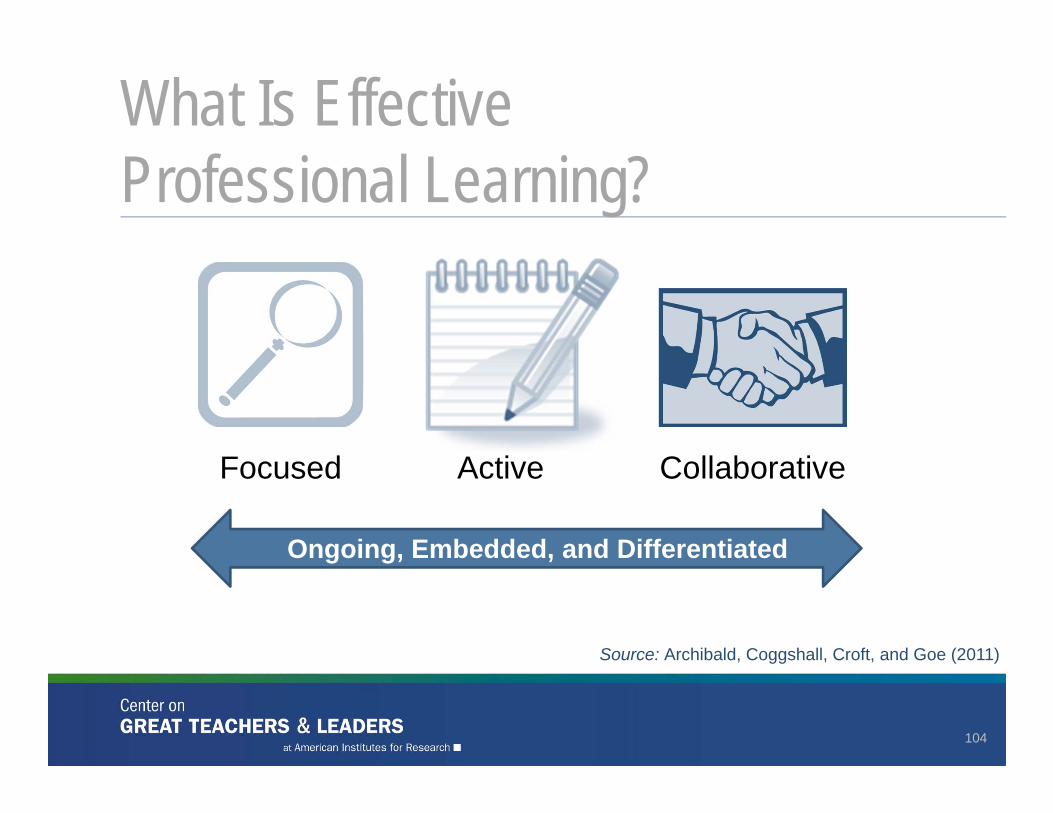
What Is Effective Professional Learning?
104
Source: Archibald, Coggshall, Croft, and Goe (2011)
Ongoing, Embedded, and Differentiated
CollaborativeFocused Active
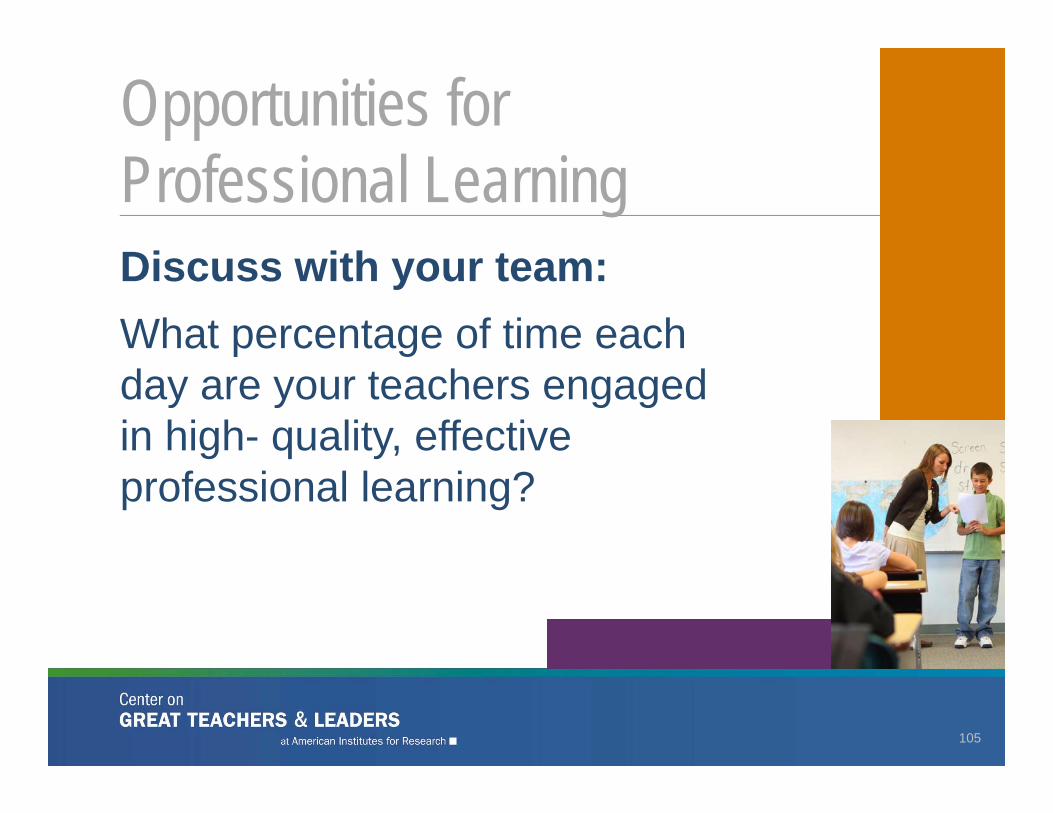
Discuss with your team:What percentage of time each day are your teachers engaged in high- quality, effective professional learning?
Opportunities for Professional Learning
105
Opportunities for Professional Learning in Teacher Evaluation
106
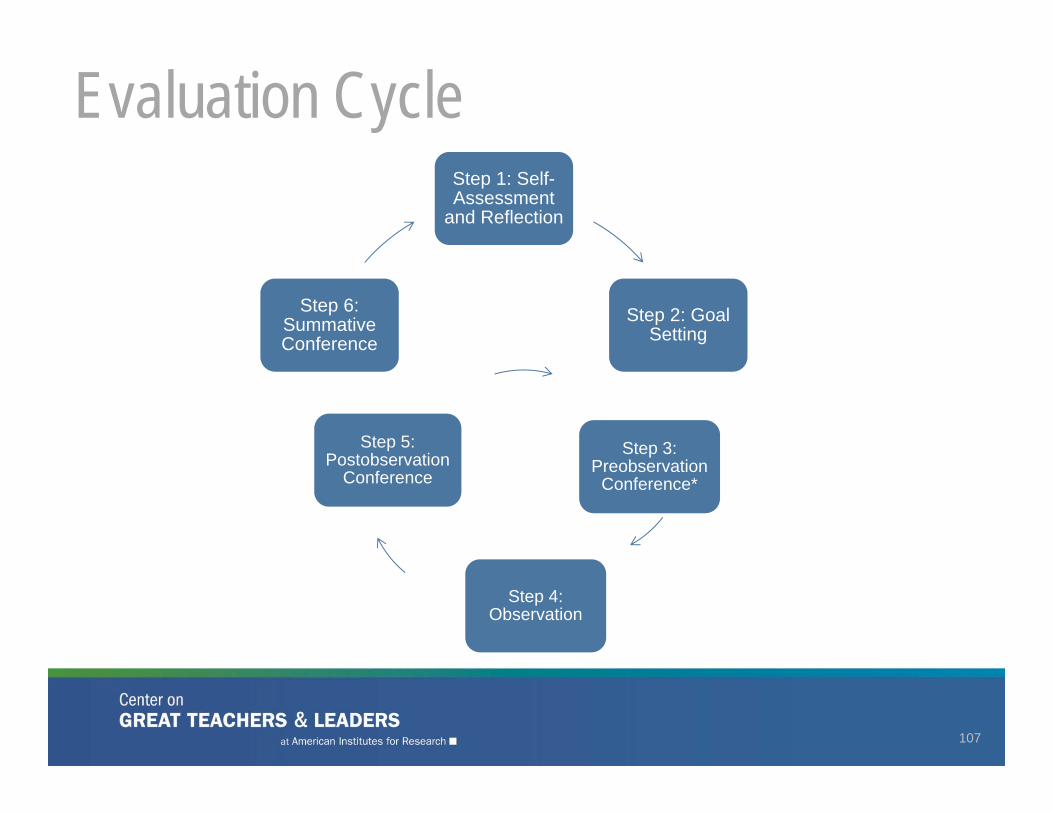
Evaluation Cycle
107
Step 1: Self-Assessment
and Reflection
Step 2: Goal Setting
Step 6: Summative Conference
Step 3: Preobservation
Conference*
Step 4: Observation
Step 5: Postobservation
Conference
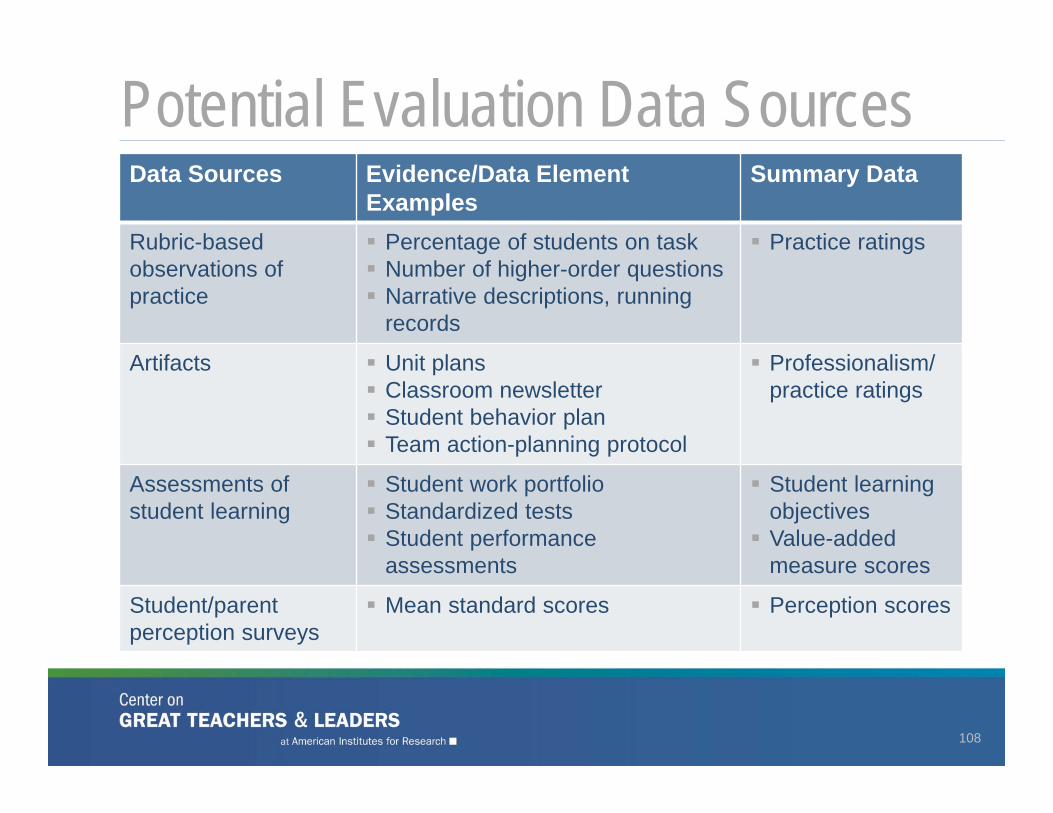
Potential Evaluation Data Sources
108
Data Sources Evidence/Data ElementExamples
Summary Data
Rubric-basedobservations of practice
Percentage of students on task Number of higher-order questions Narrative descriptions, running
records
Practice ratings
Artifacts Unit plans Classroom newsletter Student behavior plan Team action-planning protocol
Professionalism/ practice ratings
Assessments of student learning
Student work portfolio Standardized tests Student performance
assessments
Student learning objectives Value-added
measure scores
Student/parentperception surveys
Mean standard scores Perception scores
Using Evaluation Data for Self-Reflection and Goal Setting
109
In this step of the evaluation data use cycle, teachers take charge of their own growth in the following ways:• Analyzing the impact of their practice on student learning
• Engaging in reflection on their practice
• Setting focused professional and student learning goals, with concrete steps to get there
• Actively collaborating with colleagues to problem solve
• Adjusting their plans as a result of this reflection
Teacher Self-Reflection and Goal Setting
110
Using Evaluation Data for Formative Feedback
111
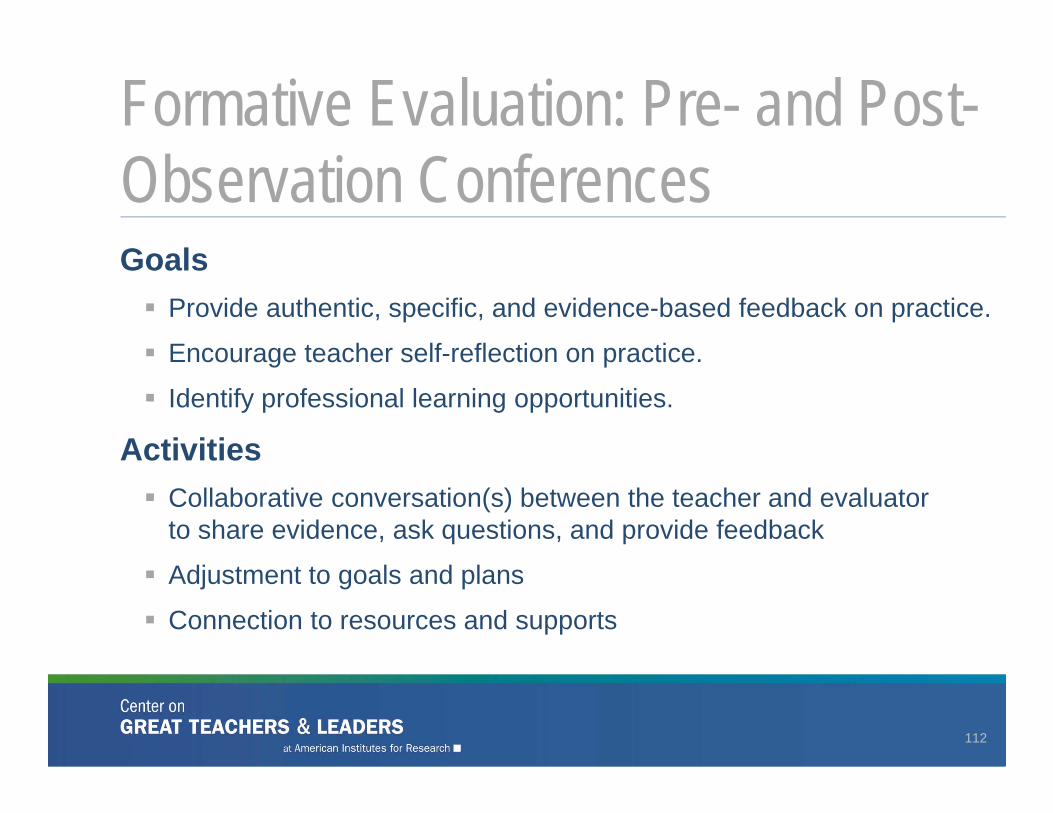
Goals Provide authentic, specific, and evidence-based feedback on practice.
Encourage teacher self-reflection on practice.
Identify professional learning opportunities.
Activities Collaborative conversation(s) between the teacher and evaluator
to share evidence, ask questions, and provide feedback
Adjustment to goals and plans
Connection to resources and supports
Formative Evaluation: Pre- and Post-Observation Conferences
112
Evaluators can translate evidence about teacher practice into actionable feedback to teachers.
Such feedback, when delivered effectively, will result in productive conversations and greater likelihood that professional learning will occur.
Translating Data Into Feedback
113
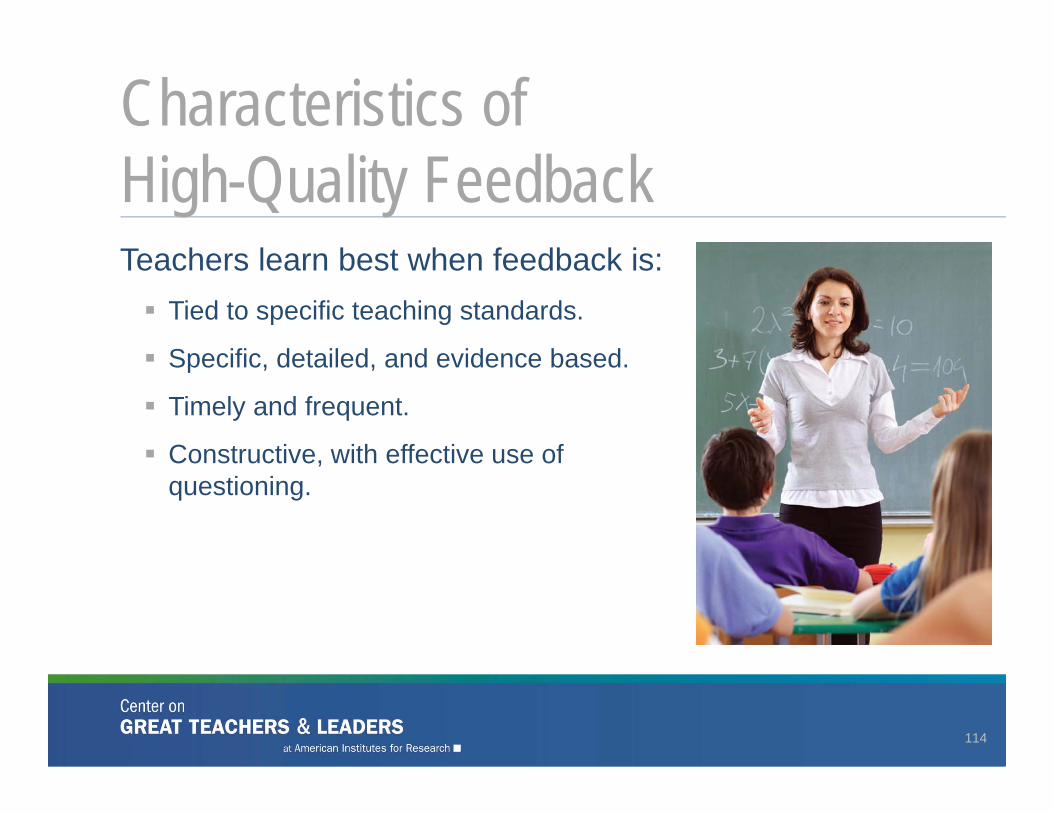
Teachers learn best when feedback is: Tied to specific teaching standards.
Specific, detailed, and evidence based.
Timely and frequent.
Constructive, with effective use of questioning.
Characteristics of High-Quality Feedback
114
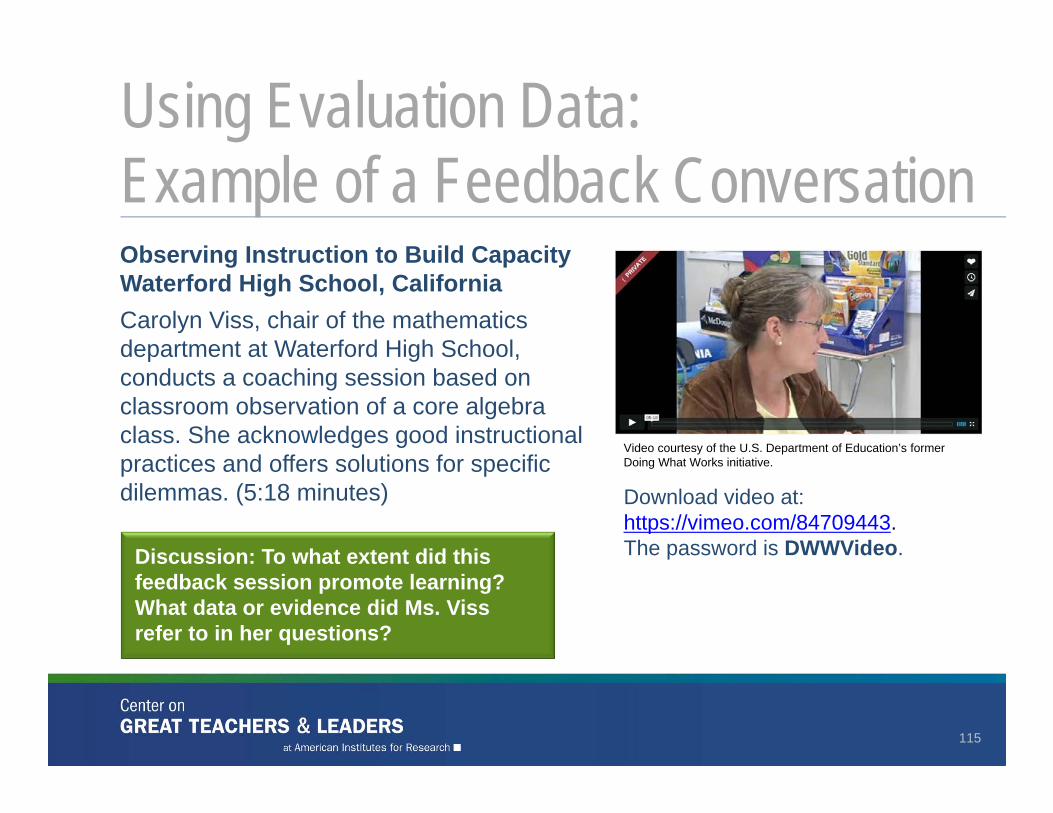
Observing Instruction to Build Capacity Waterford High School, CaliforniaCarolyn Viss, chair of the mathematics department at Waterford High School, conducts a coaching session based on classroom observation of a core algebra class. She acknowledges good instructional practices and offers solutions for specific dilemmas. (5:18 minutes)
Using Evaluation Data:Example of a Feedback Conversation
Discussion: To what extent did this feedback session promote learning? What data or evidence did Ms. Viss refer to in her questions?
Video courtesy of the U.S. Department of Education’s former Doing What Works initiative.
Download video at: https://vimeo.com/84709443. The password is DWWVideo.
115
Using Summative Evaluation Data for Individual and Schoolwide Planning
116
Goals• Summarize evaluation data for individual teachers.• Identify patterns in teacher and student performance across the school
to inform the allocation of resources.• Identify professional learning and career opportunities.
Activities• Analysis of individual teacher evaluation data to determine final rating(s)• Conversations between the teacher and evaluator about performance
trends and patterns• Connection of resources, supports, and opportunities for the next
evaluation cycle
Summative Evaluation
117
Read Handout 4, focusing on the scenario with Ms. Blue and her summative evaluation plan.
Answer the guiding questions in Handout 4.
Discuss your recommendations for a professional learning plan for Ms. Blue.
Include the following elements in your plan: • Professional learning goals• Professional learning activities• Success metrics
Activity: Using Data to Plan for Differentiated Professional Learning
118

Activity: Using Data to Plan for Schoolwide Professional Learning
119
Read Handout 5. As a table group, read the
summary ratings data for teachers at Orange School. Discuss and share:
• What patterns do you see in the data? • What are Orange School’s greatest areas
of need?• Based on these data, what professional
learning activities would you include in a schoolwide professional learning plan?
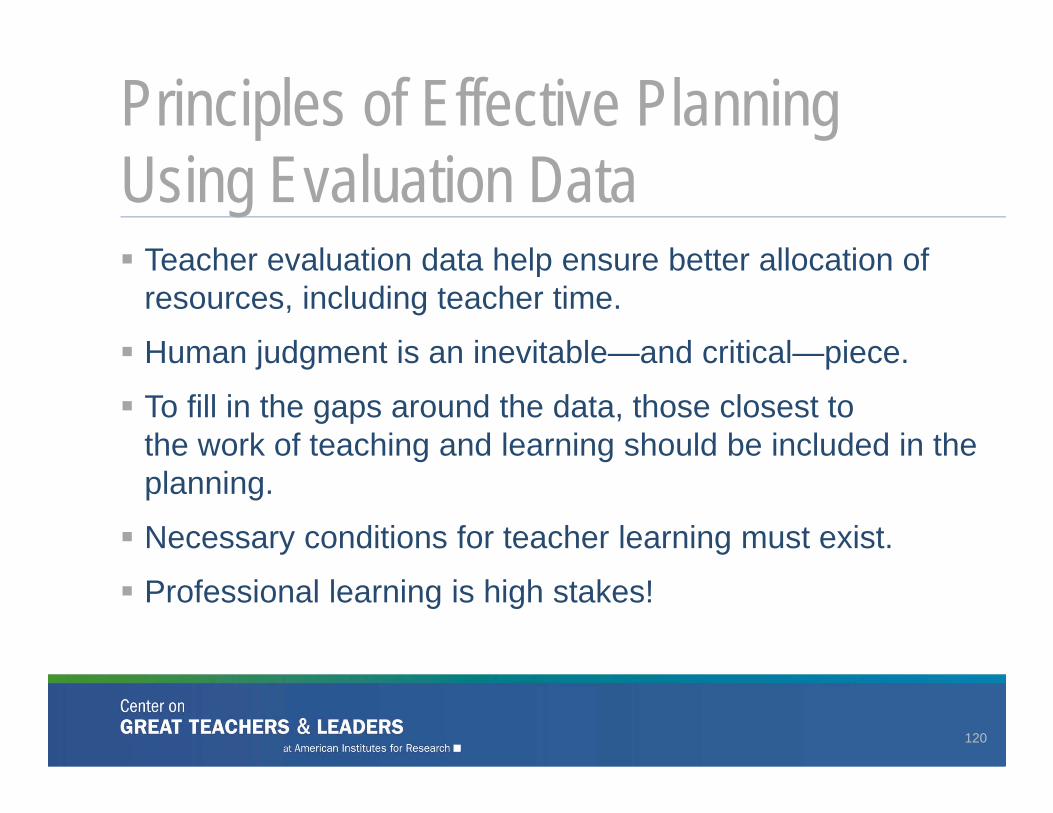
Teacher evaluation data help ensure better allocation of resources, including teacher time.
Human judgment is an inevitable—and critical—piece.
To fill in the gaps around the data, those closest to the work of teaching and learning should be included in the planning.
Necessary conditions for teacher learning must exist.
Professional learning is high stakes!
Principles of Effective Planning Using Evaluation Data
120
Group Activity
121
In your table groups:
List the main challenges associated with using evaluation data to inform professional learning and providing high-quality professional learning opportunities.
Think about specific challenges at the district and schoollevels.
Write a different challenge on each self-adhesive note.
We will collect the self-adhesive notes and facilitate a large-group discussion.
Group Activity
122
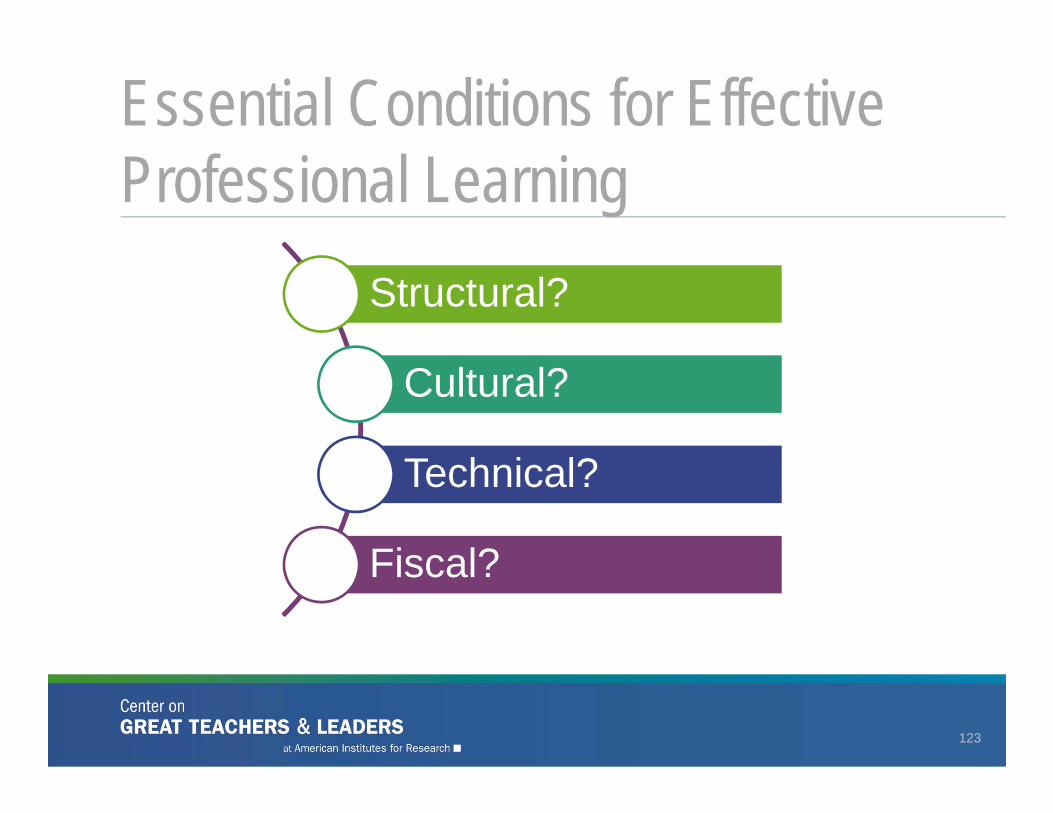
Structural?
Cultural?
Technical?
Fiscal?
Essential Conditions for Effective Professional Learning
123
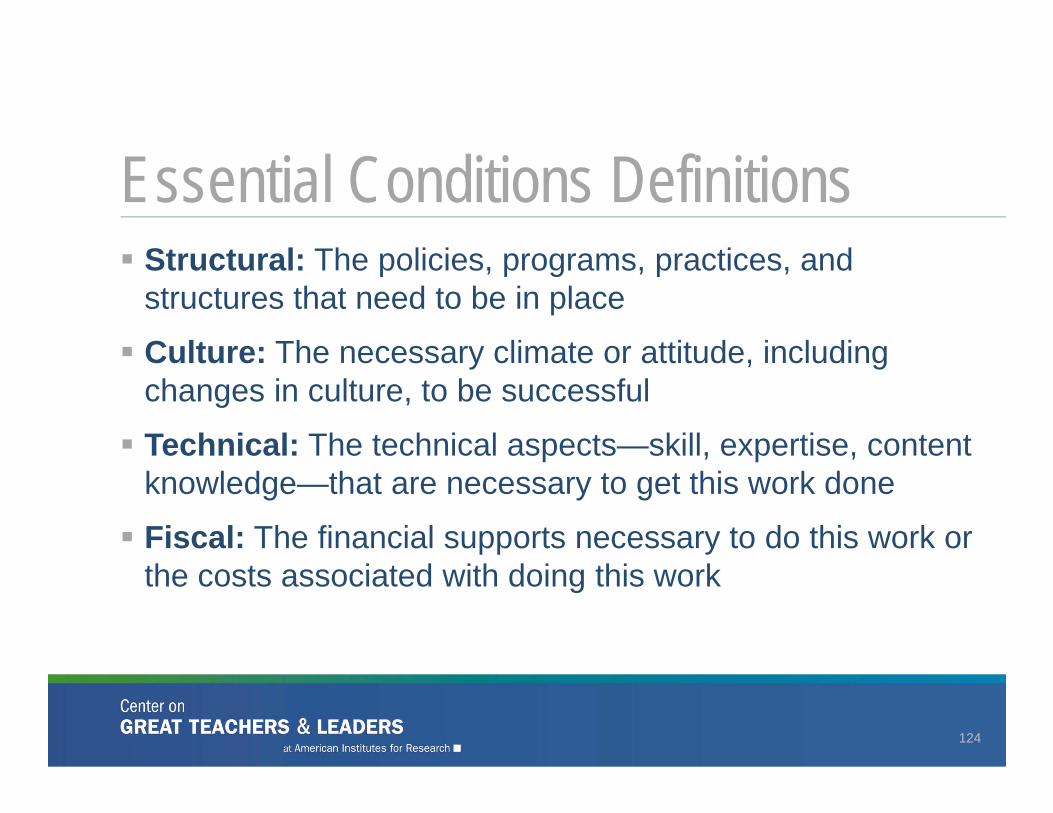
Structural: The policies, programs, practices, and structures that need to be in place
Culture: The necessary climate or attitude, including changes in culture, to be successful
Technical: The technical aspects—skill, expertise, content knowledge—that are necessary to get this work done
Fiscal: The financial supports necessary to do this work or the costs associated with doing this work
Essential Conditions Definitions
124
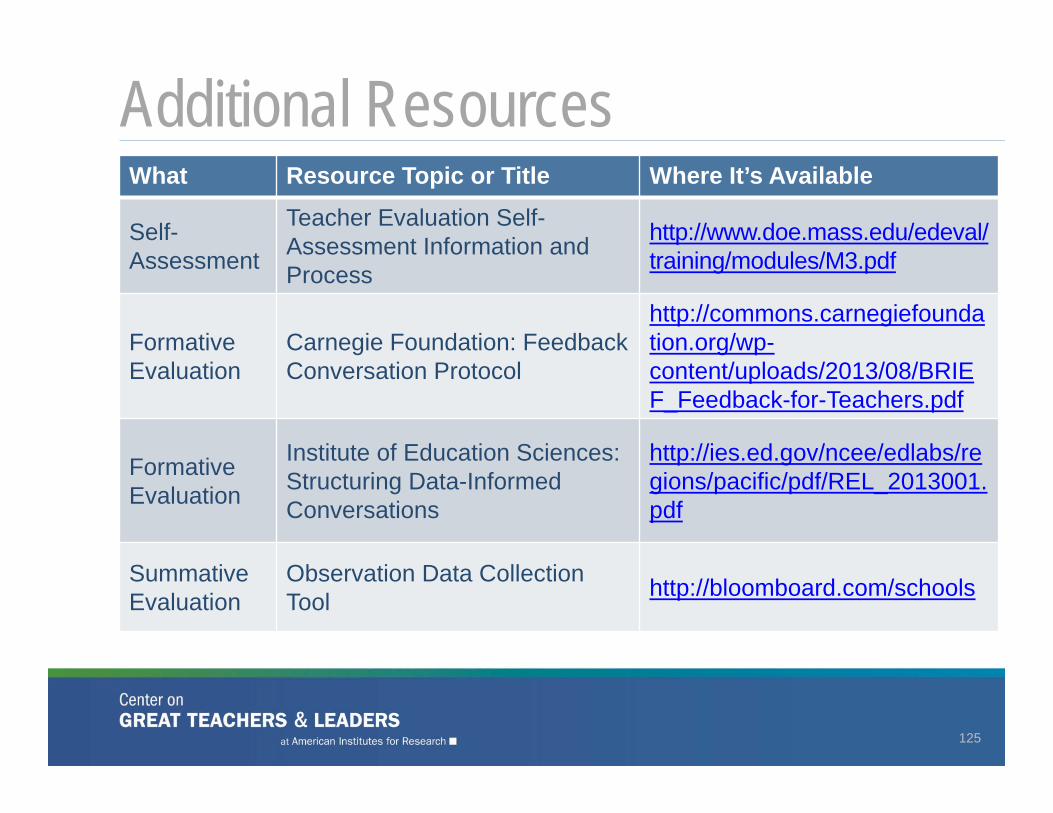
Additional Resources
125
What Resource Topic or Title Where It’s Available
Self-Assessment
Teacher Evaluation Self-Assessment Information and Process
http://www.doe.mass.edu/edeval/training/modules/M3.pdf
Formative Evaluation
Carnegie Foundation: Feedback Conversation Protocol
http://commons.carnegiefoundation.org/wp-content/uploads/2013/08/BRIEF_Feedback-for-Teachers.pdf
Formative Evaluation
Institute of Education Sciences: Structuring Data-Informed Conversations
http://ies.ed.gov/ncee/edlabs/regions/pacific/pdf/REL_2013001.pdf
Summative Evaluation
Observation Data Collection Tool http://bloomboard.com/schools
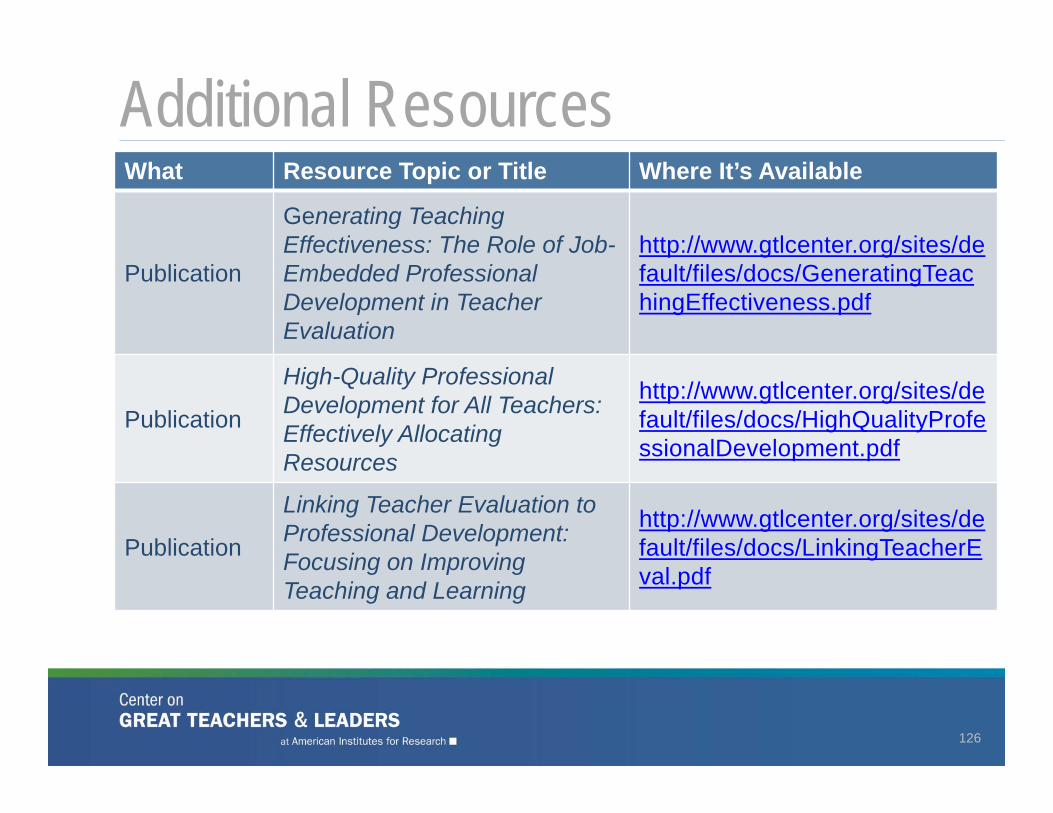
Additional Resources
126
What Resource Topic or Title Where It’s Available
Publication
Generating Teaching Effectiveness: The Role of Job-Embedded Professional Development in Teacher Evaluation
http://www.gtlcenter.org/sites/default/files/docs/GeneratingTeachingEffectiveness.pdf
Publication
High-Quality Professional Development for All Teachers: Effectively Allocating Resources
http://www.gtlcenter.org/sites/default/files/docs/HighQualityProfessionalDevelopment.pdf
Publication
Linking Teacher Evaluation to Professional Development: Focusing on Improving Teaching and Learning
http://www.gtlcenter.org/sites/default/files/docs/LinkingTeacherEval.pdf
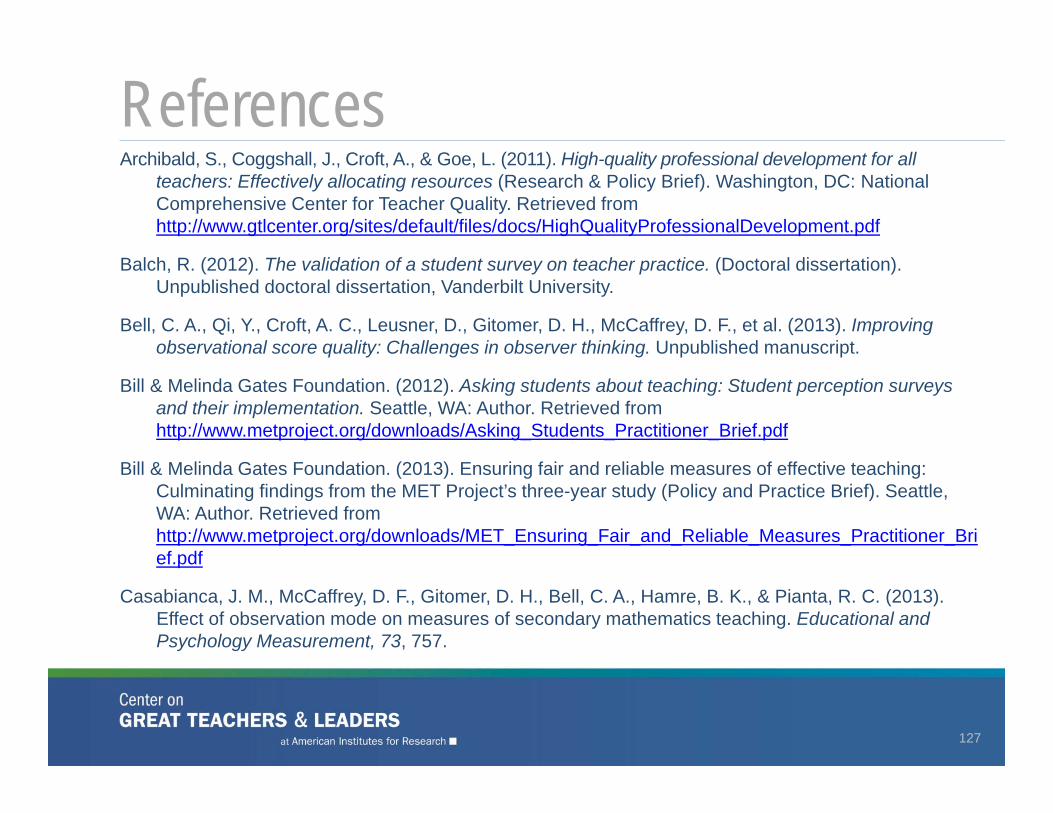
References
127
Archibald, S., Coggshall, J., Croft, A., & Goe, L. (2011). High-quality professional development for all teachers: Effectively allocating resources (Research & Policy Brief). Washington, DC: National Comprehensive Center for Teacher Quality. Retrieved from http://www.gtlcenter.org/sites/default/files/docs/HighQualityProfessionalDevelopment.pdf
Balch, R. (2012). The validation of a student survey on teacher practice. (Doctoral dissertation). Unpublished doctoral dissertation, Vanderbilt University.
Bell, C. A., Qi, Y., Croft, A. C., Leusner, D., Gitomer, D. H., McCaffrey, D. F., et al. (2013). Improving observational score quality: Challenges in observer thinking. Unpublished manuscript.
Bill & Melinda Gates Foundation. (2012). Asking students about teaching: Student perception surveys and their implementation. Seattle, WA: Author. Retrieved from http://www.metproject.org/downloads/Asking_Students_Practitioner_Brief.pdf
Bill & Melinda Gates Foundation. (2013). Ensuring fair and reliable measures of effective teaching: Culminating findings from the MET Project’s three-year study (Policy and Practice Brief). Seattle, WA: Author. Retrieved from http://www.metproject.org/downloads/MET_Ensuring_Fair_and_Reliable_Measures_Practitioner_Brief.pdf
Casabianca, J. M., McCaffrey, D. F., Gitomer, D. H., Bell, C. A., Hamre, B. K., & Pianta, R. C. (2013). Effect of observation mode on measures of secondary mathematics teaching. Educational and Psychology Measurement, 73, 757.
References
128
Cash, A. H., Hamre, B. K., Pianta, R. C., & Myers, S. S. (2012). Rater calibration when observational assessment occurs at large scale: Degree of calibration and characteristics of raters associated with calibration. Early Childhood Research Quarterly, 27(3), 529–542.
Gitomer, D. H., Bell, C. A., Qi, Y., McCaffrey, D., Hamre, B. K., & Pianta, R. C. (in press). The instructional challenge in improving teaching quality: Lessons from a classroom observation protocol. Teachers College Record.
Lachlan-Haché, L., Matlach, L., Cushing, E., Mean, M., & Reese, K. (2013). Student learning objectives: Early lessons from the Teacher Incentive Fund. Washington, DC: Teacher Incentive Fund Technical Assistance Network.
Lacireno-Paquet, N., Morgan, C., & Mello, D. (2014). How states use student learning objectives in teacher evaluation systems: A review of state websites (REL 2014-013). Washington, DC: U.S. Department of Education, Institute of Education Sciences, National Center for Education Evaluation and Regional Assistance, Regional Educational Laboratory Northeast & Islands. Retrieved from http://ies.ed.gov/ncee/edlabs/regions/northeast/pdf/REL_2014013.pdf
McClellan, C. (2013). What it looks like: Master coding videos for observer training and assessment. Seattle, WA: The MET Project, Bill & Melinda Gates Foundation. Retrieved from http://www.metproject.org/downloads/MET_Master_Coding_Brief.pdf

Advancing state efforts to grow, respect, and retain great teachers and leaders for all students
Angela [email protected]
1000 Thomas Jefferson Street NWWashington, DC [email protected]
129