Embed Size (px)
Citation preview

Teacher Labor Market
Presentation for Missouri State Board of Education
January 2016

Teacher Job Market
2
Part I
National Data

3 Why Teach Survey, October 2015
Primary Reasons Making a difference in the lives of students Working with children Interest in the subject
I thought I’d be good at it Making a difference in society

Teacher Production
4
1 Alternatively-certified teachers are not included, individuals who graduate but do not complete the requirements (e.g. Licensure tests) to receive a teaching credential are included, and teachers who receive a Bachelor's and higher degree in education may be double-counted
Missing Elements in the Discussion of Teacher Shortages, Calder Report, October 2015
Total
Other
ELEM
SPED STEM

5
Student-Teacher Ratio (37 Year Span)
Highest 1986 17.7
Lowest 2008 15.3
Current
National avg. 16 to 1
Missouri avg. 17 to 1
America’s Teaching Force, by the Numbers, September 2015

Hiring of new teachers
6 IPEDS Completion Data (Production) and the Schools and Staffing Survey

Vacancies by content area
7
Percentage of Schools with Vacancies Reporting Difficulty Filling Vacancies within Specific Disciplines
% SPED
% STEM
% ENG/SS
% ELEM

8
Teachers primarily stay in the profession because they feel they are good at it and they’re having an impact
Teachers primarily leave the profession because of the workload, but also poor leadership and insufficient pay
Why Teach Survey, October 2015
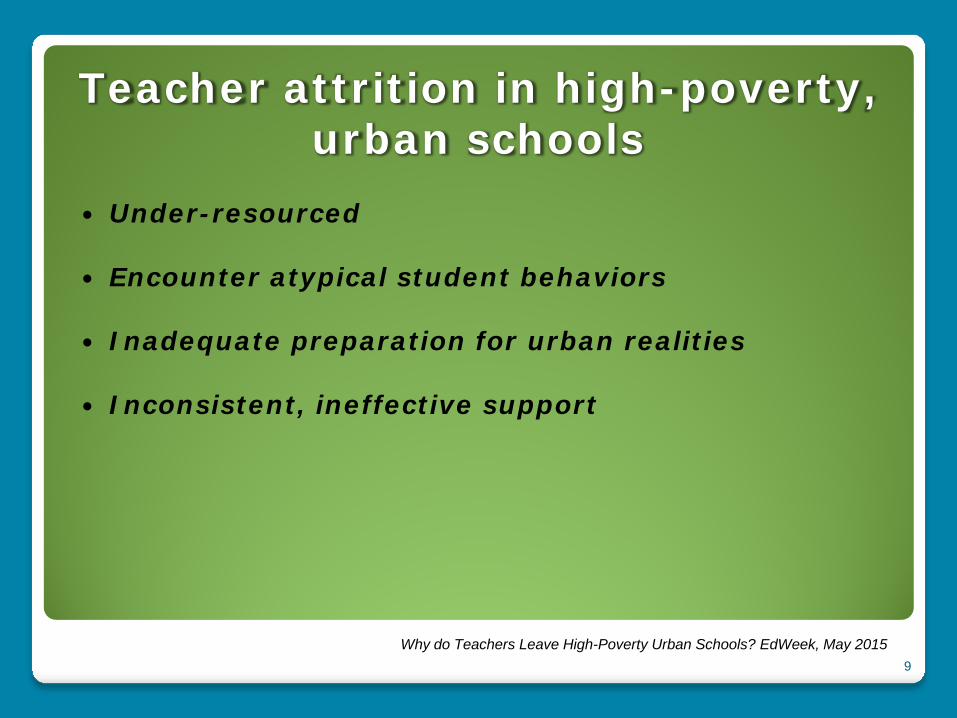
Teacher attrition in high-poverty, urban schools
9
Under-resourced
Encounter atypical student behaviors
Inadequate preparation for urban realities
Inconsistent, ineffective support
Why do Teachers Leave High-Poverty Urban Schools? EdWeek, May 2015

Teacher Retention in high-poverty, urban schools
10
High performing teachers (6-17%) and low performing teachers (6-21%) leave at strikingly
similar rates
The Irreplaceables: Understanding the Real Retention Crisis in America's Urban Schools. The New Teacher Project, 2012.
•Provide regular, positive feedback •Help to identify areas of development •Provide critical, informal feedback of performance
•Recognize accomplishments publicly •Identify areas of high performance
•Identify opportunities/paths for teacher leader roles •Put people in charge of something important
•Provide additional resources for the classroom
Feedback & Development
Recognition
Responsibility & Advancement
Resources
Teacher attrition in rural schools
11
Social and collegial isolation
Low salaries
Multiple grade or subject assignments
Lack of familiarity with the school/community
Preparing Teachers to Teach in Rural Schools, Barley & Brigham, 2008

Teacher Retention in rural schools
12
Teachers recruited by rural schools must be prepared for the conditions of rural teaching with the credentials they need but
also aware of the nature of small schools in small communities.
Recruiting and Retaining High-Quality Teachers in Rural Areas, Monk, 2007
•Grow Your Own (recruit HS students and others with ties to the community) •Distance learning opportunities and courses •Multiple certification opportunities •Clinical experiences in rural schools
•Effective mentoring and induction/socialization •Rich professional development opportunities
•Competitive salaries and wages •Loan forgiveness and housing incentives •Modernize telecommunications/technologies
Recruitment & Preparation
Support
Benefits

Teacher Job Market
13
Part II
State Data

Teacher Pipeline Numbers MEGA Assessments
14
Assessment Title
Fall 2014
Fall 2015
+ / -
Educator Profile 3,402 3,998 +596 Entry 1,709 1,297 -412 Para 106 126 +20 Content Assessments
*3,109 6,962 +3,853
*The number does not include approximately 3,000 Praxis II tests taken at the same time

MO Teacher Production 2014 (4,998 initial certificates issued)
15
Type of Certificate
Elementary (37%)Early Childhood (10%)Social Science 9-12 (6%)Mild Mod.(Spec. Ed) (6%)Eng. 9-12 (5%)P.E. K-12 (5%)Mathematics 9-12 (3%)General Science 5-9 (2%)33 other areas (26%)
33 other areas Elementary
Early Childhood
Certification Data, DESE 2014
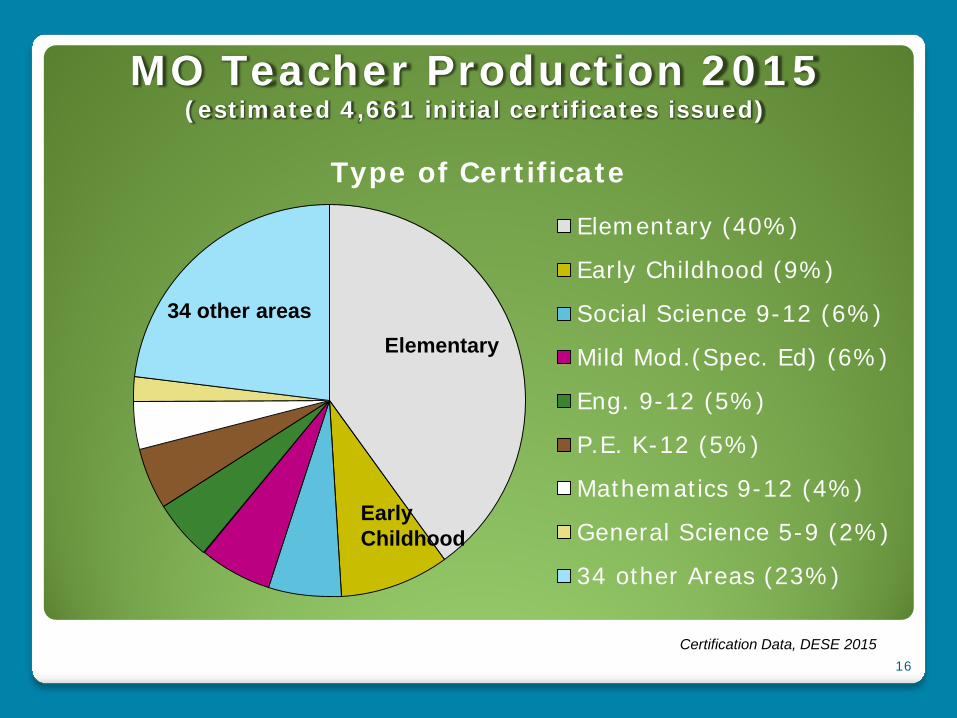
MO Teacher Production 2015 (estimated 4,661 initial certificates issued)
16
Type of Certificate
Elementary (40%)
Early Childhood (9%)
Social Science 9-12 (6%)
Mild Mod.(Spec. Ed) (6%)
Eng. 9-12 (5%)
P.E. K-12 (5%)
Mathematics 9-12 (4%)
General Science 5-9 (2%)
34 other Areas (23%)
34 other areas Elementary
Early Childhood
Certification Data, DESE 2015
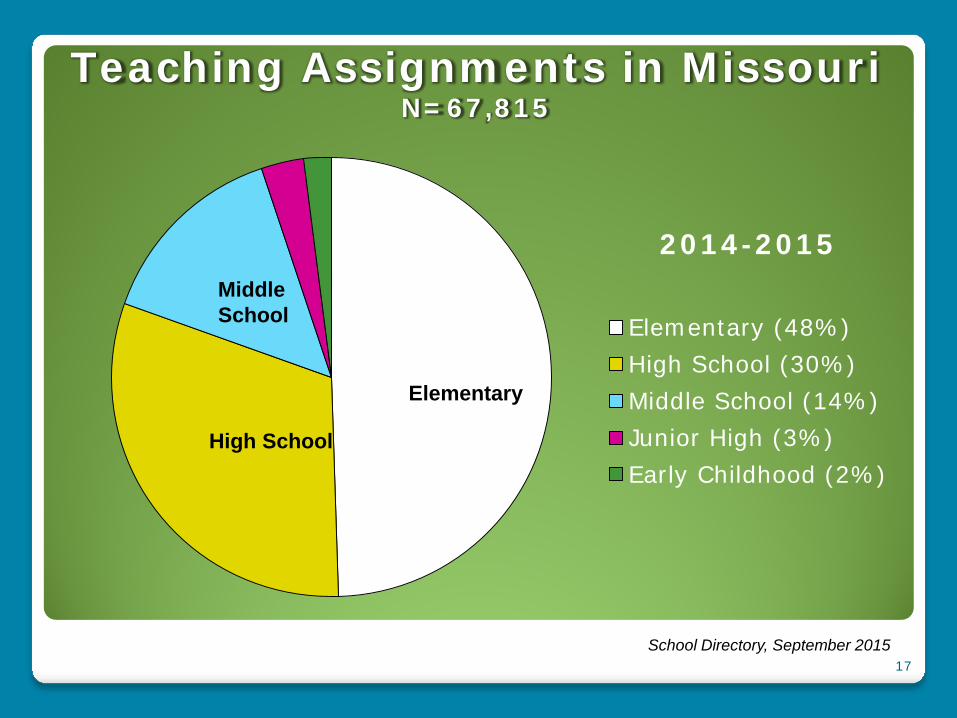
Teaching Assignments in Missouri N=67,815
17
2014-2015
Elementary (48%)High School (30%)Middle School (14%)Junior High (3%)Early Childhood (2%)
Middle School
Elementary
High School
School Directory, September 2015

18
Matching teaching candidates to teaching jobs
MO REAP
283 districts/schools
90,000 Applications Over 200 district
postings
8 other states participate
MO Teaching Jobs
400 districts/schools
70,000 applications Over 250 district
postings
Average of 20,000 hits a month
* MOTeaching Jobs; MOREAP data, 2015
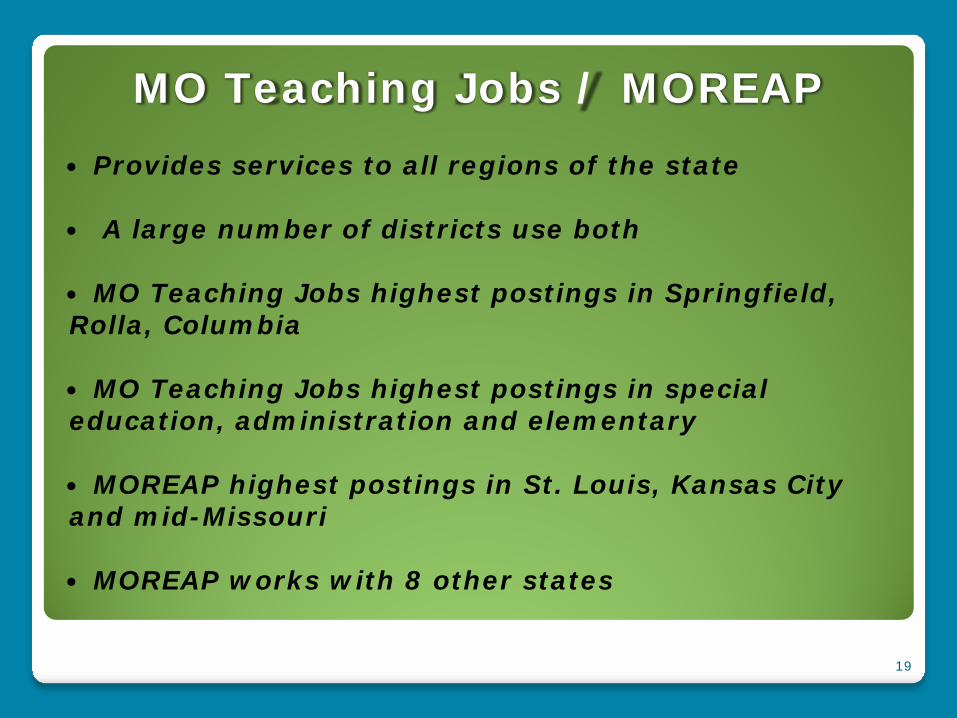
MO Teaching Jobs / MOREAP
19
Provides services to all regions of the state
A large number of districts use both
MO Teaching Jobs highest postings in Springfield, Rolla, Columbia
MO Teaching Jobs highest postings in special education, administration and elementary
MOREAP highest postings in St. Louis, Kansas City and mid-Missouri
MOREAP works with 8 other states

The Missouri Teacher
20
Gender
Male 22%
Female 78%
Ethnicity
White 93.5%
Other 1.6%
Black 4.9%
Age
30-39 40-49
20-29 50-59
60+
01020304050
0-5 6-10 11-15 16-20 20+
Years of Experience
% of Teachers
* Recruitment and Retention Report 2015

Trend Data Teacher age and experience
21
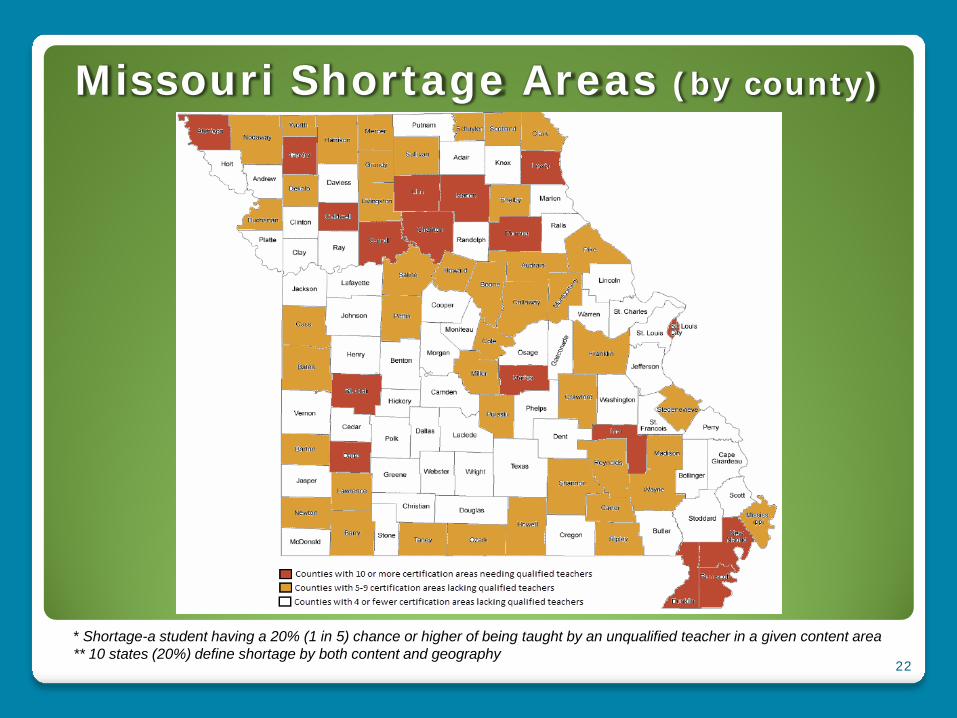
Missouri Shortage Areas (by county)
22
* Shortage-a student having a 20% (1 in 5) chance or higher of being taught by an unqualified teacher in a given content area ** 10 states (20%) define shortage by both content and geography
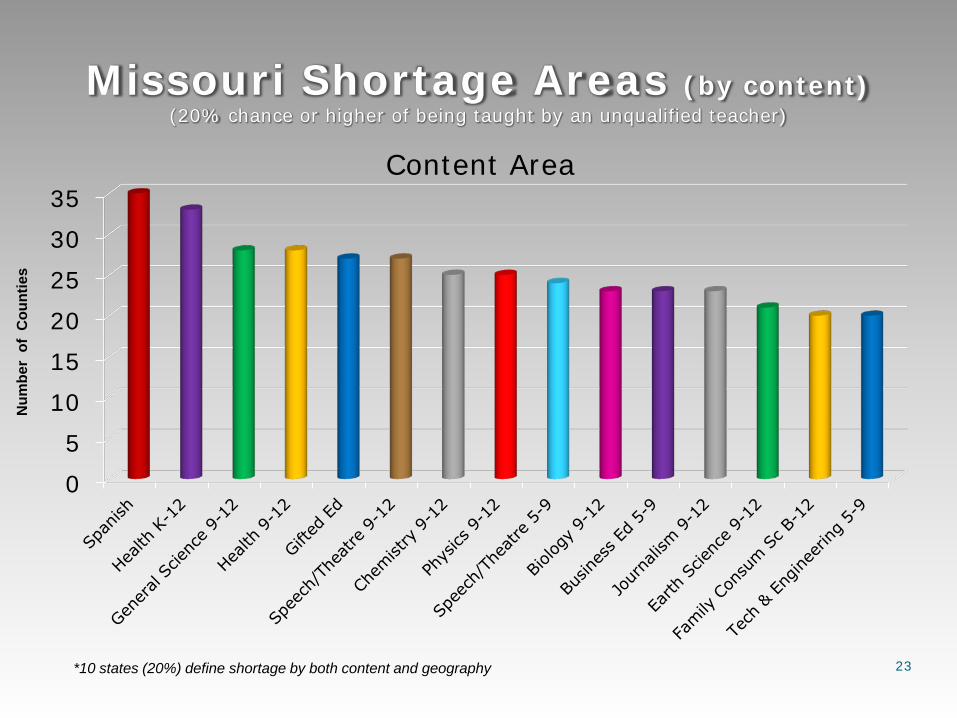
Missouri Shortage Areas (by content) (20% chance or higher of being taught by an unqualified teacher)
23
0
5
10
15
20
25
30
35Content Area
Num
ber
of C
ount
ies
*10 states (20%) define shortage by both content and geography
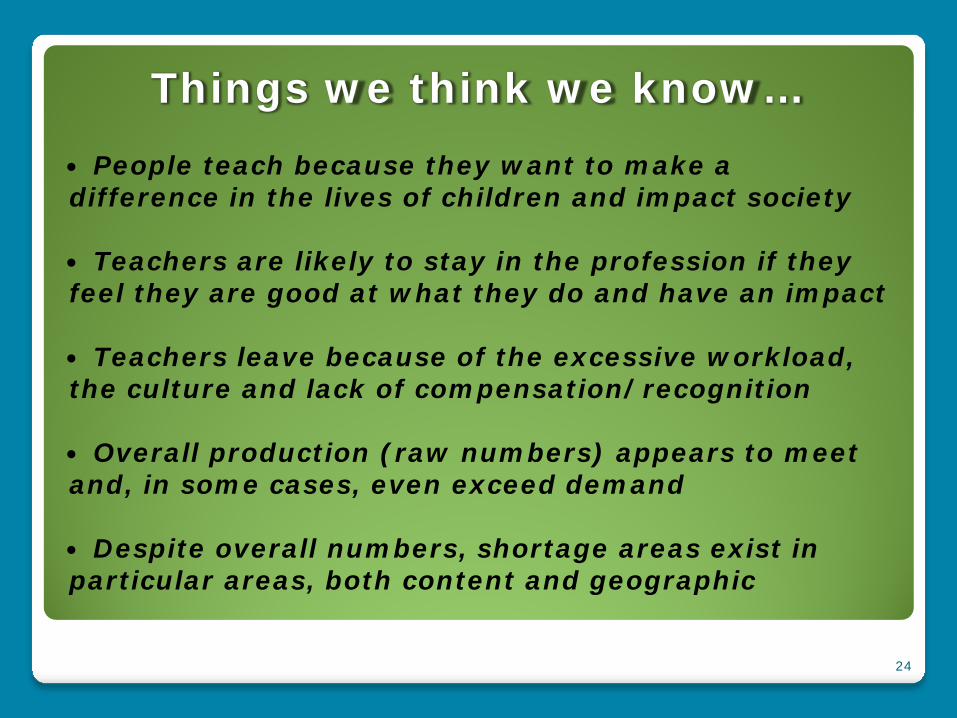
Things we think we know…
24
People teach because they want to make a difference in the lives of children and impact society
Teachers are likely to stay in the profession if they feel they are good at what they do and have an impact
Teachers leave because of the excessive workload, the culture and lack of compensation/recognition
Overall production (raw numbers) appears to meet and, in some cases, even exceed demand
Despite overall numbers, shortage areas exist in particular areas, both content and geographic

Things to consider…
25
Many conditions that drive teachers away from the profession are within our area of control
Recruitment done well could address shortage areas
Implementing the strategies of the Equity Plan can help address the particular challenges found in high-poverty, urban and rural schools
Mentoring/Induction is a invaluable part of retention
Working conditions and exit surveys can provide further information to act on
There are shortages of both qualified and effective teachers

Contact Us www.dese.mo.gov Email: [email protected] Phone: 573-751-2931