Embed Size (px)
Citation preview

Teacher Perception of the Academic Achievement of Athletes
at Menomonie High School
Craig A. Olson
A Research Paper Submitted in Partial Fulfillment of the
Requirements for the Master of Science Degree
in
Education
Approved: 2 Semester Credits
Dr. Steve Terry Research Advisor
The Graduate School
University of Wisconsin-Stout
July, 2006

The Graduate School University of Wisconsin-Stout
Menomonie, WI
ABSTRACT
Author: Olson, Craig A.
Title: Teacher Perception of the Academic Achievement of Athletes at
Menomonie High school
Graduate Degree1 Major: MS Education
Research Adviser: Dr. Steve Terry
Month~Year: July, 2006
Number of Pages: 47
Style Manual Used: American Psychological Association, 5th edition
The purpose of this study was to examine the perceptions of teachers at Menomonie
High School regarding the academic achievement of athletes. A review of the literature
indicates that athletes have better grades and standardized test scores than non-athletes.
Researchers have attempted to explain this discrepancy since it was first noted. Three
models (developmental, social capital and leading crowd) have been developed by
researchers which attempt to explain the academic achievement of athletes.
The survey was developed by the researcher based on the current literature and the
three prevailing models. Data was collected through a voluntary survey given to teachers
at Menomonie High School, a medium-sized school located in Northwestern Wisconsin.
Surveys were administered in written form using a 5 point Likert scale, a free response
question and a multiple choice question. Each survey contained 13 questions. The sample
. . . 111
population was divided into two sub-populations to determine if coaches and non-
coaches have different perceptions regarding the academic achievement of athletes.
The data collected was analyzed using mean and standard deviation for the entire
sample population. The sample population was then divided into two sub-populations
(coaches and non-coaches). Each sub-population was analyzed using mean and standard
deviation. A one-tailed Student's t-test was used to determine significance in differences
between the two sub-populations.
The results of the survey show that coaches at Menomonie High School significantly
favor the developmental model while non-coaching teachers slightly favor the leading
crowd model. Both groups dismiss the notion that minimum GPA requirements cause
athletes to outperform non-athletes academically. Also, both groups do not recognize a
teacher-bias as reason for improved academic performance. Finally, both groups do not
recognize the social capital model as being significant.
The Graduate School
University of Wisconsin Stout
Menomonie, WI
Acknowledgments
I would like to thank Dr. Steve Terry, my research advisor, for his guidance through
this entire process. I would also like to recognize the efforts of Dwight McNaughton in
helping with the statistical breakdown of the data. Finally, I would like to acknowledge
and thank my beautiful wife Anne for her tremendous support.

TABLE OF CONTENTS
Page
. . .................................................................................... ABSTRACT 11
.................................................................. CHAPTER 1 : Introduction 1
........................................................................ Statement of Problem 3
Research Questions .......................................................................... 3
......................................................................... Definition of Terms 3
.............................................................. Assumptions and Limitations 4
.................................................... CHAPTER 2: Review of the Literature 6
.......................................... Dumb Jocks, a Zero Sum Game and Violence 6
......................................................................... The Scholar Athlete 9
................................................................. The Developmental Model 10
................................................................. The Leading Crowd Model 11
.................................................................. The Social Capital Model 12
................................................................. CHAPTER 3: Methodology 16
.................................................................................. Introduction -16
......................................................... Sample Selection and Description 16
Instrumentation and Data Collection ...................................................... 17
................................................................................ Data Analysis 18
.................................................................................... Limitations 18
........................................................................ CHAPTER 4: Results 20
.............................................................................. Coaching Status 20

vi Support for Athletics ........................................................................ 21
Support for Athletics Score ................................................................. 23
Perception of Bias ........................................................................... 24
Perception of Research-Based Models ................................................... 24
CHAPTER 5: Discussion ..................................................................... 28
Summary ...................................................................................... 28
Conclusions ................................................................................... 30
Recommendations ........................................................................... 31
REFERENCES ................................................................................ 33
......................... APPENDIX A: Implied Consent Form and Survey Instrument 36
APPENDIX B: Results of Survey .......................................................... 38

1 CHAPTER 1: Introduction
High school athletics occupies a unique role in American culture. From rural towns to large
urban areas, high school athletics is prominent in nearly every American community. Athletics is
a constant source of entertainment and pride for community members. In many small towns, high
school sports are the only game around. Communities rally behind their teams and they expect
greatness from their players. Successful athletes and coaches are praised in the newspapers while
rivals are vilified. In the excitement of the season, many forget that the heroes on the field are
merely high school students; young adults struggling to balance the rigorous demands of athletics
and academics.
Athletics has also been a source of increasing conflict among community members. In the
face of budget constraints many question the value of expensive athletic programs. Also, the
benefit of athletic programs is questioned in the wake of increasingly violent high profile
incidents by players and spectators (Liu and Becerra, 2005). Finally, a tremendous backlash
against popularity, status and athletics is occurring in the wake of terrorist school violence, such
as the Columbine Massacre (for an example of such a backlash, see Melina, 1999). As such, the
perception of high school athletics involves a unique paradox. On one hand, high school athletes
are stereotyped as hard working, diligent and studious individuals who strive for excellence. On
the other hand, athletes are stereotyped as spoiled, violent idiots perpetuating a system of
popularity that crushes individual differences.
The paradox of high school athletics leads to natural questions. Is high school athletics
valuable or detrimental? Do students benefit academically from athletics, or is athletics somehow
damaging to the individuality of the student? Does a relationship exist between athletic
involvement and violence in males? What, if anything, causes athletes to improve academically?
Researchers have been struggling with these questions for forty-five years, but, thanks to some
excellent longitudinal studies and improved data collection methods, a consensus is starting to
form among researchers.
Early research into athletics and academics held that athletics detracts from academic pursuits
(Coleman, 1961). Researchers learned that the students with the highest status in American high
schools were male athletes. Researchers assumed that status was very important. The assumption
was that, in order to achieve status, high achieving students will join athletics. These students
will focus more on sport than on school and they will not achieve to their academic potential
(Coleman, 1961). This early research was extremely flawed, but it did lead to many good insights
into a new youth culture that began after World War 11.
Researchers began to see positive relationships between academics and athletics. Most
researchers found that a small, consistent and positive academic benefit occurs if a student is
involved in athletics (Broh, 2002; Bradock, 198 1 ; Chambers, 199 1 ; Marsh, 1992; Snyder and
Spreitzer, 1990). This research was due to improved data collection techniques and extensive
longitudinal studies in the 197OYs, studies that would have been difficult prior to that time. For
example, Bradock's study, published in 1981, was a review of national data from 14,000 students
over a six-year period. Such extensive data allowed researchers tremendous insight into athletics
and academics. Researchers then began looking for causes of improved academic performance
among athletes. Initially, it was assumed that involvement in athletics allowed a student to
develop skills that provide academic benefit as well. The developmental model holds that lessons
learned in the locker room, such as improved self-confidence and work ethic, cross over into the
3 classroom (Braddock, 198 1 ; Chambers, 199 1). The leading crowd model looks, on the other
hand, at status. Athletes hold a high status and, as such, constitute the elite of a school (Fejgin,
1994; Quiroz, Gonzales and Frank, 1996). This elite group is more likely to perform at high
levels academically (Hauser, Simmons and Pager, 2000). Lastly, the social capital model (Bratz
& Putnam, 1996; Coleman, 1988 and 1990) sees improvement in academics as a result of a social
network created by the athlete through participation in sport. All three models recognize that
athletes outperform non-athletes, but all three differ as to the cause.
Statement of the Problem
The purpose of the study is to examine teacher perceptions of the academic achievement of
athletes at Menomonie High School. There is no research to indicate if coaches and non-coaches
have different views as to why athletes have higher academic performance than non-athletes.
Research Questions
1. Why do teachers at Menomonie High School believe athletes outperform non-athletes
academically?
2. Is there a difference in the perceptions of teachers who coach and non-coaching teachers
in regards to the academic successes of athletes?
3. Is there a difference in the perceptions of teachers who are strong supporters of athletics
and teachers who do not support athletics in regards to the academic success of athletics?
Definition of Terms
Co-curricular Activities: School sponsored clubs that are an extension of the school
curriculum, such as Spanish Club or business and marketing clubs (FBLA).
Cultural Capital: Refers to the intangible benefits received through association with

4 the cultural elite, such as improved vocabulary or a greater stress on education values.
Extracurricular Athletics: School sponsored and sanctioned athletic teams which compete
against teams from other schools. Extracurricular athletic teams are not part of the
educational curriculum of the school.
Social Capital: Refers to the intangible benefits received as a member of a group through
relationships with other group members.
Zero-Sum Game: A zero-sum indicates that gains are equal to losses. For example, if an
individual uses three hours of time to play football they lose three hours of study time.
Assumptions and Limitations
It is assumed that athletes have higher grade point averages and class rank than do non-
athletes at Menomonie High School. The research is quite clear that athletes do indeed have
superior academic ranking than do non-athletes on average, but no good survey data exists for
these populations at Menomonie High School. It is assumed that Menomonie High School is
typical and that the research data listed in the literature review applies to students at MHS.
There are limitations in this survey. The first limitation is that this survey will be a study of
the perceptions of teachers and coaches at Menomonie High School. As the survey is limited to
one school, the population will be relatively small and data should not be extrapolated to other
populations. The second limitation is that the author of the survey is a teacher and coach at
Menomonie High School. The author will also administer the survey and analyze the survey data.
Also, the academic advisor for this survey is an athletic director, former coach and a parent of
former athletes at Menomonie High School. The third limitation is that the survey was designed
by the researcher and reliability and validity should be questioned when reviewing the findings of

5 this study. Lastly, the population sample will be limited due to the survey being conducted in the
summer months, a time when teachers are generally difficult to contact.

CHAPTER 2: Review of the Literature
There are two primary beliefs held by researchers in regards to athletics and its effects on
academics. The first belief, still widely held, is that athletic participation does harm to the
participant academically and socially. This view is held by many in our society who look down
on athletes as simple-minded "dumb jocks" or others who view athletes as overly aggressive and
violent. On the other hand, many see a positive correlation between academics and athletics. This
is a very commonly held view and is the focus of most of the recent research on academics and
athletics.
Dumb Joclcs, a Zero Sum Game and Violence
A groundbreaking study by James Coleman in 1961 provided an early assessment of
adolescent society, athletics and education. Coleman conducted a study in the late 1950's in
which he administered a 175-question survey to students at 10 Illinois high schools. One question
asked students how best they would like to be remembered by their peers. Students were asked to
state if they would like to be best remembered as a brilliant student, the most popular student or
an athletic star. Due to the nature of female sports in the late 1950's, the term "leader of
activities" was substituted for athletic star on questionnaires given to female students. Coleman
was surprised to find that a plurality of male students chose to be remembered as an athletic star.
In fact, forty-four percent of males chose to be remembered in this way. For females, thirty-seven
percent chose to be remembered as a leader in activities while thirty-four percent chose to be
remembered as the most popular.
Coleman used this study to formulate a series of beliefs about the nature of adolescence and
the culture of high schools in America. A new adolescent society was developing in America,

7 argued Coleman. This society was one in which parents had increasingly little influence. Sub-
urbanization, two income families and a shift away from an agrarian society created a situation in
which young people were spending less time learning to be adults. Instead, adolescents were
spending time being adolescents. A unique youth subculture had developed where peers played
an increasingly important role and high school students were striving not to become adults, but
were striving for perceived greatness by their own standards. Coleman's study is significant
because he was one of the first to document and recognize this new culture of adolescence.
In regards to athletics and adolescent society, Coleman made the drastic claim that youth
culture did not value or appreciate academics. Using the findings of his survey question on
remembrance, Coleman claimed that adolescent society was one in which highly skilled and
talented students would use energy and effort on the athletic field at the expense of academics.
After all, how can students focus on academics and athletics at the same time? Further, Coleman
saw the focus on athletics as being disastrous for our society. Coleman saw education as a zero-
sum game; the more energy spent on athletics, the less energy spent on academics.
Coleman's study has been replicated many times and, in general, male students want to be
remembered as great athletes (Eitzen, 1975, Holland & Andre, 1999). Findings, however, are
quite different when using the same questions, but changing the type of test. Goldberg and
Chandler (1989) conducted a study asking students to rate the value of athletics, academics and
popularity on a Likert scale. A majority stated that athletics and academics were very important
or important. This partially refutes Coleman's claim that adolescent society does not value
academics. Holland & Andre revisited Coleman's remembrance study in 1999, this time taking
into account student self perception and self-interest. Not surprisingly, students who perceived
8 themselves as athletic wanted to be remembered as an athletic star, while students who perceived
themselves as being academic wanted to be remembered as being a brilliant student.
Coleman's claims about a new youth culture were accurate and important. His assumptions
about youth culture not valuing academics, however, were plainly speculative based on his
remembrance study. Other than his lone remembrance question, he offered no research to show
that youth culture didn't value academics. He offered no research to show that athletics detracts
from academics. He used a zero-sum fallacy and his own beliefs to come to his conclusions. Still,
many do hold Coleman's views about academics and athletics. After all, with limited time and
energy, how can students possibly excel at both academics and athletics?
Another common perception is that athletics can cause deviant behavior among young males.
In 1994, Miracle and Rees published a study exploring sport culture in high schools. They
studied the history of physical education and extracurricular sport in the United States. They
claimed that sport and physical education is designed to create conformity and standardization
while denigrating creativity and individuality. Instead of developing self-confidence and
perseverance, athletics creates an over-developed sense of superiority and arrogance in
participants. Male athletes express this sense of superiority by being violent to those who are
perceived as being weak. Conformity and standardization, learned in the locker room from
coaches and teammates, is manifested as violence towards those perceived to be different.
Male athletes at the college and professional level are more likely to be involved in rape,
assault or domestic abuse than the general population. In 1994, Mesner and Sabo found that that
as many as 1 1 3 ~ ~ of campus rapes at the college level involved male athletes even though male
athletes made-up a much smaller fraction of the school population (see also Crosset, Benedict
9 and McDonald, 1995). Levels of arrest and incarceration for professional athletes are extremely
high and, in most cases, these athletes are engaging in violent criminal activity (Benedict, 1997;
Yeager and Benedict, 1998). Researchers claim that college and professional athletes are merely
the pinnacle of a sport system, beginning in high school, which preaches conformity and, in the
end, breeds violence towards the weak (Mesner and Sabo, 1994).
Studies of college and professional athletes are somewhat deceiving. By definition, college
and professional athletes are elite and their aggressive and sometimes criminal behavior may be a
result of an inflated sense of superiority cause by their elite status. Most high-school athletes,
however, are not elite and will not participate in college or professional athletics. Still, if such a
system of violence and abuse exists at the high school level, drastic reform is necessary and any
potential academic benefit arising from involvement in sport must be measured against potential
harm done by organized athletics at the high school level.
The Scholar Athlete
Most research refutes the notion that athletes don't take academics seriously. In fact, most
research shows a positive relationship between athletics and academics. For example, research
has shown that athletic involvement positively improves educational aspiration, self-concept,
college attendance after high school and time spent on homework (Bradock, 198 1 ; Fejgin, 1994;
Marsh, 1992). Grade point minimums for participation also improve academic achievement
among athletes (Snyder and Spreitzer, 1990). Participation in athletics significantly reduces a
student's likelihood of dropping- out, more so than other extracurricular activities such as
academic or vocational clubs (McNeal, 1995). Athletics also positively influences the morals of
students (Chambers, 199 1).

10 Assuming the research is correct, what causes athletes to have better academic records than
non-athletes? There are three widely held views in this regard. The first view, the developmental
model, states that athletes develop skills that carry over into the classroom. The second, the
leading crowd model, assumes that athletes are exposed to an elite crowd that values education.
The third view is that participation in athletics causes a student to develop a network of
relationships with parents, peers, teachers and coaches. That network provides resources that help
the athlete academically. This final view is referred to as the social capital model.
The Developmental Model
Athletics is generally seen in a positive light among parents, teachers and community
members. It is widely believed that athletic participation teaches lessons that cannot be taught in
the classroom. The traditional view holds that sport develops character. This view assumes that
athletic participation somehow instills a strong work ethic and respect for authority while
improving self-concept. Through competition it is assumed that the athlete learns life skills, such
as teamwork and perseverance. Success on the athletic field reinforces hard work, while defeat
on the athletic field teaches the participant how to cope with adversity. Of course, none of these
assumptions are easy to qualify or prove and some are questionable, but the traditional view does
persist. This traditional view assumes a developmental model. Students, through athletic
participation, develop skills, which transcend the athletic field and carry over into the classroom.
Self-esteem and self-concept are consistently stressed in the developmental model. It is
assumed that any increase in self-esteem will improve academic performance. Longitudinal
studies show that self-esteem does improve through athletic participation (Bradock, 198 1).
Research also indicates that academic self-concept improves, as does the student's work ethic,

11 through participation in athletics (Fejgin, 1994). Research, however, indicates that improvements
in self-esteem have no significant affect on grades or test scores (Ross and Broh, 2000).
The Leading Crowd Model
The leading crowd model follows Coleman's claim that elite students will be involved in
athletics to improve individual social status. Simply put, better students compete in athletics.
This results in the appearance that athletics improves academic performance. The leading crowd
model does not attribute improvement in academics to skills developed as an athlete. Instead, the
leading crowd model assumes bias. Bias occurs in the high school culture of status, causing high
achieving elite students to gravitate toward athletics. Many researchers have noted this selection
bias (Fejgin, 1994; Quiroz, Gonzales and Frank, 1996). If high achieving, "good" kids are
participating in sports then it is impossible to discern the effect sport has on academics, other
than to assume a positive effect.
Socioeconomic status is also considered an important characteristic of the leading crowd
model. Owens (1 996) found that individuals of a high socioeconomic status were more likely to
participate in extracunicular athletics at the high school and college level than individuals of low
socioeconomic status. McNeal(1999) attributed improved academic performance of individuals
involved in extracumcular activities, in part, to an increased access to cultural capital. Cultural
capital is an intangible benefit that comes from association with the educated elite. McNeal
argued that the educated elite have better language skills, values and educational expectations
than do other groups. Association with this group allows the athlete to acquire this cultural
capital, which leads to improved academic performance. Hauser, Simmons and Pager (2000)
conducted research that supported this claim. They found that individuals who associate with an
12 elite peer group are more likely to attend college, perform better on standardized tests, receive
higher grades and are much less likely to dropout of school.
There are many flaws with the leading crowd model. First, the leading crowd model assumes
a symbiotic relationship between status and sport; individuals with status will participate in
sports and enjoy the status that comes from such participation. This is a very narrow view of high
school athletics. Certainly not every high school athlete has status. A large percentage of students
are involved in athletics, yet, by definition, only the few enjoy elite status. Also, the rationale for
individual participation in high school athletics is certainly as diverse as the individuals involved.
Status as a rationale for athletic participation is overly simplistic. Also, recent research shows
that popularity has very little effect on grades and academics (Broh, 2002). Finally, the notion of
sport as the bastion of the socioeconomic elite is also significantly flawed. Guest and Schneider
(2003) found that athletic achievement is overvalued, in terms of status and educational
association, in poor communities and communities that place a low value on education. In
wealthier communities and communities that place a high value on education, athletic
achievement is not valued to such a high degree. Interestingly, athletic participation in wealthier
schools has a smaller positive correlation to academic achievement and, as a result, a lower status
association.
The Social Capital Model
The idea of social capital has been around since the 1920's, but recent breakthroughs in social
capital theory come from Robert Putnarn (1995, 2000). Social capital refers to connections
among individuals, specifically the need and desire of an individual to belong to groups and
develop a social network. Social organizations and groups are tremendously important to
individuals. Groups have rules, accepted norms of behavior and expectations for members.
Groups also provide tremendous benefit to members, benefits far beyond entertainment and
association. For example, a member of a cycling club might get financial advice, learn of a job
opening or be recommended a babysitter by others in the club. The benefits of such a social
network are very difficult to measure, but the benefits do exist. Schools have a vast number of
clubs, organizations, groups and networks for students. As such, social capital theory is very
relevant to the school setting (Bratz & Putnam, 1996). Ironically, though, early advances in social
capital theory specific to education were the result of research conducted by James Coleman
(1 988, 1990).
The purpose of high school athletics is to reinforce educational goals. From the social capital
perspective, educational goals are reinforced as the student-athlete becomes more attached to the
school and develops a social network of coaches, teachers, parents and peers that value school
involvement and place emphasis on education (Coleman, 1988). As a result, athletes are much
more likely to associate with a college-oriented peer group and have a better connection to
teachers (Broh 2002; McNeal, 1999). Athletes become empowered as their self-esteem improves
and as their commitment to the school grows. As the athlete becomes more connected to the
school they naturally become less apathetic about their school; the end result is improved
academic performance (Marsh, 1992).
This social network provides social capital for the athlete, granting numerous benefits that can
lead to academic improvement. For example, student-athletes have coaches and teammates that
can provide assistance on assignments, apply pressure to maintain good grades and enforce
standards of behavior. Perhaps, parents of athletes may meet at a sporting event and discuss
14 college choices, grades, teachers and discipline. With greater participation there is greater
contact, and the individual's network expands. Coleman (1988) argued that the social network of
the athlete not only provides benefit, but it also serves as a social control mechanism. It is due to
these networks and controls that athletes outperform non-athletes academically.
But, networks are not exclusive to athletes. Students in non-athletic extracurricular activities
are also involved in complex social networks. So why, then, do athletes see a greater benefit than
non-athletes? Broh (2002) found the social network of the athlete to be somewhat unique.
Athletes spend more time at school than do participants in other extracurricular and co-curricular
activities. Athletes have greater contact with teachers outside of class. Athletes talk with their
parents about school more than non-athletes. Also, parents of athletes have greater contact with
the school than do the parents of non-athletes.
One of the results of social networks and social capital is that many high achieving students
become hyper-networked (Quiroz, Gonzales and Frank, 1996). They are involved in numerous
extracurricular activities, both athletic and co-curricular. They are very successful academically,
they are exceptional athletes and they have significant status among their peers.
The social capital model does have one major flaw. Social capital is a hypothetical construct
and, as such, is very difficult to measure. Researchers know that social capital is important and
that actual benefit does exist for individuals involved in a social network. Researchers know that
a lack of a social network for an individual is detrimental (Putnam, 1995). Still, it is extremely
difficult to not only measure individual utility from relationships and networks, but it is nearly
impossible to measure specific benefit from networks. Longitudinal studies offer some
measurement of benefits from participation, but specifically assigning those benefits to a social

15 network is sometimes speculative. Still, the social capital model provides tremendous insight as
to why athletes achieve at a higher level than do non-athletes.
CHAPTER 3: Methodology
Introduction
The purpose of this study was to determine why students that are involved in extracurricular
athletics have higher academic standing than non-athletes, specific to Menomonie High School.
This chapter includes information about the method of data collection and data analysis, a
description of both the student population and sample population as well as limitations of the
study.
Sample Selection and Description
The population for this study was teachers at Menomonie High School. The school serves
students grades nine through twelve and has an enrollment that fluctuates from 1 150 to 1250
students. The school serves a largely middle class, mostly white student population, very typical
of a mid-size Midwestern town. The population surveyed consisted of teachers that teach at the
high school, divided into two sub-populations; coaches and non-coaches.
The University of Wisconsin-Stout Institutional Review Board for the Protection of Human
Subjects (IRB) approved this survey, which was then distributed to teachers at Menomonie High
School. The survey used in this study was developed specifically for this study by the
researcher. The survey was developed based on the literature review findings of three distinct
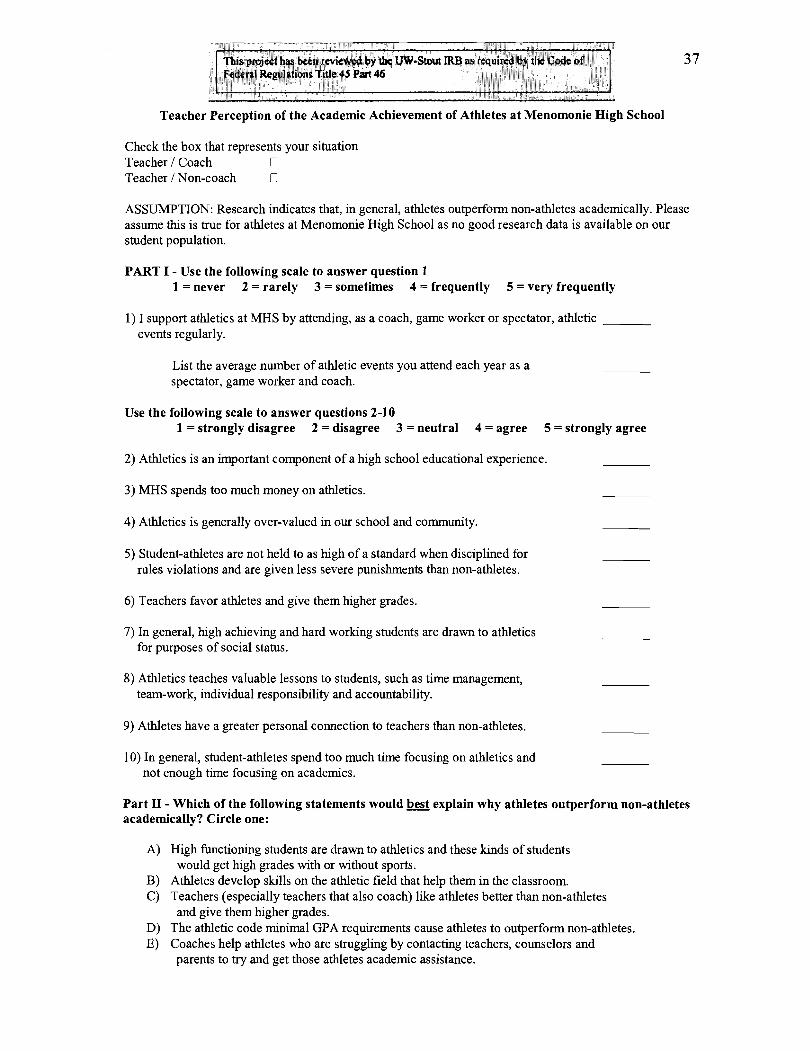
models that explain the academic achievement of athletes. The survey, along with the implied
consent form, can be found in Appendix A.
Menomonie High School currently has 73 teachers. Surveys were administered during the
second week of July, a time when many teachers are not in the building and are not available.
A total of 22 teachers responded to the survey.
17 Instrumentation and Data Collection
The survey was a one page, contained 13 questions and was administered in written form.
The survey was voluntary and equal representation of coaches and non-coaches was desirable,
although not necessary. Surveys were administered with implied consent forms and respondents
anonymously returned completed surveys to a secure location or returned surveys in sealed
envelopes directly to the researcher.
Part I of the survey asked general questions about respondents support for athletics. The first
question (unnumbered) on the survey asked respondents to identify themselves as coaches or
non-coaches. The second question (number 1) asked respondents to rank, on a Likert scale,
support for athletics through number of athletic events attended. The third question
(unnumbered) asked respondents to specifically state the average number of events attended each
year and was a free response question not using a Likert scale. The fourth through sixth questions
(numbered 2 through 4) asked respondents to state agreement or disagreement to various
statements regarding athletics. For example, the fourth question (number 2) asked respondents if
they feel athletics is an important component of a high school experience. Answers to questions
numbered one through four were used to obtain a support for athletic score.
The seventh and eight questions (numbered 5 and 6) asked respondents to rank, on a Likert
scale, agreement or disagreement to statements about bias. Question number six, for example,
asked respondents if they believe teachers favor athletes and give them higher grades.
The final four questions using the Likert scale asked respondents to state agreement or
disagreement to statements reflecting opinions of researchers regarding why athletes outperform
non-athletes academically. Questions 7 and 10 for example, deal with the beliefs first articulated

18 by Coleman (1 961) addressing the notion that high achieving students are drawn to athletics for
social status and that these students spend too much time on sport. Question eight asked about
the developmental model and question nine asks about the social capital model and teacher
connectivity.
The final, and most important, question asked respondents to circle the statement that they
feel best reflects why athletes outperform non-athletes academically. Five statements follow the
question; three statements address the three prevailing theories (developmental model, social
capital model and leading crowd model), one statement addresses bias and another asked about
the athletic code as a justification for higher achievement among athletes. Respondents were
instructed to circle one statement.
Data Analysis
Each survey returned was separated into two groups, coaches and non-coaches. Each survey
was then numbered and a histogram of each response was created. A graph of each survey
response can be found in Appendix B. From responses, a spreadsheet was prepared and data was
analyzed using mean and standard deviation. A Student's t-test was preformed to compare
responses of coaches and non-coaches for each question. T-tests were used to determine the
extent and significance of the differences in the perceptions of coaches and non-coaches in
regards to academic achievement of athletes. One-tailed t-tests were used with a level of
significance of .050.
Limitations
The data analysis is, principally, a look at attitudes among teachers and coaches. Individual
responses vary based on the past experiences of the sample population. Also, every individual

19 surveyed was a teacher and coach at the same high school. This is a significant limitation in that
those surveyed may have shared experiences that shape their bias and skew survey data. Another
significant limitation is the number of respondents was limited due to the survey being conducted
in the summer. 22 of 73 teachers responded, and those that respond were in the school building
during July, either teaching summer school or involved with athletics as coaches and supervisors.
As such, the population was somewhat limited to teachers who are very involved in the school,
which may also skew survey data.

CHAPTER 4: Results
The research was conducted as a survey of teachers at Menomonie High School during the
second week of July, 2006. Surveys were administered to teachers that were at the high school,
mostly teaching summer school classes. Only high school teachers were asked to complete the
survey. There are 73 teachers working at Menomonie High School during the regular school year.
During the summer, this number drops significantly. Still, 22 teachers completed surveys,
representing 30.1 % of the teachers at the school, a very strong number considering the survey
was administered when most teachers are not in the building.
Of the 13 survey questions, the first question asked about coaching status. The next five
questions pertained to the individual's support for athletics. The next two questions asked about
teacher perception of bias. The next four questions were specific to research areas, dealing with
status, social networks and skill development. The final question was a multiple choice question
asking specifically why athletes outperform non-athletes based on the three models presented in
the literature review, as well as other factors sometimes attributed to academic performance of
athletes. Questions were worded in such a way as to ensure reliability. Results from each survey,
as well as statistical analysis of each question can be found in Appendix B.
Coaching Status
The first question asked the respondent about their coaching status. This question separated
respondents into two groups, those who coach and those who do not coach. The purpose of this
question was demographic and the survey population was divided into two sub-populations. This
was done to determine if perception of athletes was different for coaches and non-coaches. Of the
22 individuals completing the survey, eleven stated that they are coaches and eleven stated that
they are not coaches.
Support for Athletics
The next five questions (numbered 1-4) asked respondents about support for athletics. These
questions were used to determine level of support for athletics based on number of athletic events
attended, perception of the importance of athletics, perception of the cost of athletics and
perception of the value of athletics in the school.
Question 1: I support athletics at MHS by attending, as a coach, game worker or spectator,
athletic events regularly.
A Likert scale was used to for this first question. The scale range was 1 to 5, one being never
and 5 being very frequently. The mean for the entire group was 4.22 (n=22) with a standard
deviation of .99. The mean for coaches was 4.82 (n=l 1) with a standard deviation of .405. All
coaches responded that they attend athletic events very frequently or frequently. 82% (n=9) of
coaches responded that they attend athletic events very frequently while 18% (n=2) stated that
they attend events frequently, accounting for the very low standard deviation. Non-coaches
reported a mean of 3.64 (n=l1) with a standard deviation of 1.12, indicating a wider range of
responses from non-coaches. A Student's t-score of 3.29 indicated statistical significance when
comparing groups. Simply put, coaches attend more athletic events than non-coaches.
Question: List the average number of athletic events you attend each year as a spectator, game
worker and coach.
This question served as a test to the first question, to ensure reliability. The mean number of
games attended for the entire sample population was 25.3 (n = 21, one respondent did not
provide and answer). Coaches, however, reported a mean of 33.6 (n=l 1). For non-coaches, the
mean number of games attended was significantly lower at 16.1 (n=10). As stated earlier,
coaches attend more athletic events than non-coaches. A t-score of 2.76 indicates statistical
significance when comparing groups.
Question 2: Athletics is an important component of a high school educational experience.
A Likert scale was used for questions 2 through 10. The questions were actually statements,
and respondents were asked to rank agreement or disagreement with the statements based on the
scale; 1 being strong disagreement, 3 being neutral and 5 being strong agreement.
The group mean for this question was 4.64 (n=22) with a standard deviation of ,492,
indicating relatively narrow responses in the 4 to 5 range (agree and strongly agree). When
broken into sup-populations, the mean for coaches was 4.82 (n=l I), with nine respondents
indicating they strongly agree and two indicating they agree. The mean for non-coaches was 4.45
(n=l 1). A Student's t-score of 1.83 indicated statistical significance between he two groups.
Coaches and non-coaches were both likely to believe that athletics is important, but coaches
indicated significantly stronger support for athletics based on their responses to this question.
Question 3: MHS spends too much money on athletics.
Both coaches and non-coaches generally disagreed with this statement. The mean for the
entire group was 2 (n=22) with a standard deviation of .93. When divided into sub-populations,
the mean response for coaches was 1.64 (n=l 1, 0.674). Non-coaches recorded a mean of 2.36
(n=l 1, 0 = 1.03). Based on the sample data, both coaches and non-coaches were unlikely to
believe that MHS spends too much money on athletics. The difference between coaches and non-
coaches was significant, however, as indicated by a t-score of 1.96.
Question 4: Athletics is generally over-valued in our school and community.

23 The mean for the entire population (n=22) was 2.64 (u = 1.00), but non-coaches responded
with a mean of 3.09 (n=ll , u = 331) indicting they were generally neutral on the statement.
Coaches indicated disagreement with the statement with a mean of 2.1 8 (n=l 1, u = .982). Again,
this disagreement of coaches and non-coaches was significant with a t-score of 2.34. Coaches
were less likely to believe athletics is over-valued in the school and community.
Support for Athletics Score
From the first four questions, a score was given that represented the individual teacher's
support for athletics. The score was compiled by taking the sum of question 1 and question 2 and
subtracting the answers of question 3 and 4; (Q1 + 42) - (Q3 + Q4). The highest score possible
was 8, which would indicate a very strong support for athletics. The lowest score possible was -8,
which would indicate a very negative attitude about athletics. The scale ranked 6 to 8 as
indicating very strong support, 3 to 5 as fair support, 2 to -2 as a neutral, -3 to -5 as very little
support and -6 to -8 as hostility towards athletics. This score was used as a basis for comparison
to the final question asked. It was assumed that a correlation would exist between an individual's
support for athletics and that individual's perception of the academic achievement of athletes.
Not surprisingly, coaches have a much greater support for athletics score than non-coaches.
Coaches recorded a mean score of 5.91 (n=ll) with a standard deviation of 1.70 while non-
coaches recorded a mean score of 2.36 (n=l 1) with a standard deviation of 2.50. A t-score of
3.59 indicates a very high level of significance. This t-score (t=3.59, u = 2.14, degrees of
freedom = 20) indicates a probability of the null hypothesis of .2%. The support for athletics
score shows the greatest statistical variance of the entire survey. Coaches are far more supportive
of athletics than non-coaches.

Perception of Bias
Question 5: Student-athletes are not held to as high of a standard when disciplined for rules
violations and are given less severe punishments than non-athletes.
Responses to question 5 were similar for coaches and non-coaches. The survey population
recorded a mean of 2.36 (n=22) with a standard deviation of .953. Coaches were slightly lower,
with a mean of 2.09 (n=l 1) and a standard deviation of .944. Non-coaches were slightly more
likely to have a neutral opinion, responding with a mean of 2.64 (n=ll) with a standard deviation
of .944. These numbers demonstrate a pattern, but not one that is statistically important as a t-
score of 1.37 (. 186 probability) fails to demonstrate significance.
Question 6: Teachers favor athletes and give them higher grades.
Question six recorded interesting results. The survey population recorded a mean of 2.18
(n=22) with a standard deviation of .733. This indicates disagreement with the statement.
Interestingly, coaches and non-coaches recorded identical scores as sub-populations. Both groups
recorded a mean of 2.18 with a standard deviation of 1.0 (n for both groups was 1 1).
Questions five and six failed to show significance. Coaches and non-coaches are, first and
foremost, teachers. Both sub-populations disagreed with statements indicating teachers are biased
toward athletes. As such, teacher bias was resoundingly dismissed by the sample population. The
survey data indicates that teachers do not see themselves, or their colleagues, as biased towards
athletes.
Perception of Research-Based Models
Question 7: In general, high achieving and hard working students are drawn to athletics for
purposes of social status.
2 5 This statement is a reflection of Coleman's (1 96 1) research on adolescent society not valuing
academics. Coleman speculated that high-achieving male students will participate in athletics for
status. Coleman claimed that youth culture over-values athletic achievement and undervalues
academic achievement. As such, the best and brightest will focus on sport, instead of academics.
The sample population recorded a mean of 3.0 (n=22) with a standard deviation of .873, a
perfect neutral response. Non-coaches had a stronger tendency to agree with the statement,
recording a mean of 3.36 (n=ll, u = .674) while coaches disagreed with the statement, scoring a
mean of 2.55 (n=l 1, u = .82). A t-score of 2.56 (u = .75 1, degree of freedom = 20) indicates
statistical significance. Coaching status is a significant indicator of teacher perception of athletes
and status.
Question 8: Athletics teaches valuable lessons to students, such as time management, team-work,
individual responsibility and accountability.
This statement is a test of the developmental model, which states that athletes develop skills
on the playing field that carry over to the classroom. The sample population responded with a
mean of 4.77 (n=22, u = .429), a strong agreement to the statement. In fact, every respondent
stated that they agree or strongly agree with the statement. Non-coaches responded with a mean
of 4.64 (n=ll, u = .505) while coaches responded with a mean of 4.82 (n=ll, u = .405). For
coaches, 82% (n=9) responded with a 5 while 18% (n=2) responded with a 4. Both coaches and
non-coaches seem to believe that athletics develops academic skills and there was no statistical
significance in the responses of the two sub-populations.
Question 9: Athletes have a greaterpersonal connection to teachers than non-athletes.
26 The sample population recorded a mean of 3.64 (n=22) with a standard deviation of 1.05.
Both coaches and non-coaches recorded the same mean of 3.64 and standard deviations were
similar (.924 for non-coaches and 1.21 for coaches). Coaches and non-coaches basically agree
that athletes have a slightly greater personal connection to teachers. This supports the social
capital model somewhat, although response to question 9 is not as enthusiastic as responses to
question 8, supporting the developmental model.
Question 10: In general, student-athletes spend too much time focusing on athletics and not
enough time focusing on academics.
Question 10 is a reflection of the zero-sum game. The sample population generally disagreed
with this statement, scoring a mean of 2.27 (n=22) with a standard deviation of 327. Both sub-
populations recorded a mean less than 3, indicating disagreement. Non-coaches recorded a mean
of 2.55 (n=l 1) with a standard deviation of .934. Coaches recorded a mean of 2.08 (n=l 1) with a
standard deviation of .83 1. A t-score showed no significance between the two sub-populations.
Low score responses to this question seem again to refute the notion of Coleman's claims of a
zero-sum gain.
Question: Which of the following statements would best explain why athletes outperform non-
athletes academically?
A) High functioning students are drawn to athletics and these kinds of students would
get high grades with or without sports.
B) Athletes develop skills on the athletic field that help them in the classroom.
C) Teachers (especially teachers that also coach) like athletes better than non-athletes
and give them higher grades.

D) The athletic code minimal GPA requirements cause athletes to outperform non-
athletes.
E) Coaches help athletes who are struggling by contacting teachers, counselors and
parents to try and get those athletes academic assistance.
The final question attempted to answer the research question and determine why athletes
outperform non-athletes academically. Statement A is a reflection of the leading crowd model
while statement B is a reflection of the developmental model. Statement C indicates teacher bias
toward athletes. Statement D refers to the athletic code. Statement E is a reflection of the social
capital model regarding social networks.
Nine respondents indicated that statement A best explained why athletes outperform non-
athletes, while ten respondents selected statement B. Only two respondents selected statement E.
No respondents selected statement C or D. Of coaches and non-coaches, 54.5% of coaches
selected statement B, indicating the developmental model, while six non-coaches favored
statement A, indicating the leading crowd model. Both of the respondents that selected statement
E were coaches. Only three coaches (27.3%) selected statement A. One respondent's answer was
not counted as they selected multiple statements.
CHAPTER 5: Discussion
Summary
The sample population of 22 teachers at MHS was divided into two sub-populations; eleven
of which were coaches and eleven of which were not coaches. The survey data showed some
discrepancy in the attitudes of both sub-populations. The survey data indicated that coaches at
MHS have greater support for athletics than do non-coaches. Coaches are more likely to attend
athletic events and are more likely to believe that athletics is an important component of a high
school education. Non-coaches are more likely than coaches to believe that athletics is over-
valued in the community and school. This is not surprising. Coaches spend countless hours
working with athletes and are more likely to see athletics as being important. Clearly only a very
bad coach would refuse to attend athletic events or believe that athletics is unimportant. Teachers
who do not coach, however, may not place nearly as high a value on extracurricular athletic
involvement.
In regards to question five and six, the sample population did not perceive teacher-bias toward
athletes to be significant. Both sub-populations agreed that teacher-bias is not a strong factor in
the academic success of athletes. Perhaps this is because teachers do not perceive themselves to
be biased. If a teacher-bias toward athletes does exist, teachers would most likely not admit as
such. A bias would indicate a lack of professionalism among teachers at MHS, and no teacher
likes to think of themselves as being unprofessional. A survey of students and parents of teacher-
bias toward athletes could be far more revealing. This is not to suggest that a teacher-bias does
exist, it simply suggests that teachers are not the best people to ask about such a bias.

29 The final questions of the survey dealt with the three prevailing models that explain why
athletes outperfom non-athletes. Question seven, for example, was a test of the leading crowd
model and Coleman's initial claim that high functioning students are more likely to participate in
athletics for status. The survey population was neutral on this statement, however non-coaches
were more likely to agree than were coaches. In fact, non-coaches were much more likely to
believe that high functioning students participate in sport for status. Coaches generally disagreed
or were neutral.
The most surprising response was to question eight dealing with the developmental model.
The question asked respondents if they agree that athletics teaches lessons that apply to the
classroom, such as time management and work ethic. Every respondent agreed or strongly agreed
to the statement. Based on this data it would appear that teachers at MHS support the
developmental model. Both coaches and non-coaches had similarly strong responses. The
developmental model seems to be the most likely of the three models, according to the
perceptions of teachers at MHS. This was also supported by responses to the last question.
Responses to questions nine were nearly identical between sub-populations, indicating that
both coaches and non-coaches recognize that athletes have a greater personal connection to
teachers than do non-athletes at MHS. This is not surprising and suggests that the athletes are
more strongly involved in a social network that brings them into greater contact with teachers.
Responses to question 10 refuted the notion of the zero-sum game, further reinforcing the
belief that athletics is valuable. Low scores in response to question 10 indicate that teachers do
not see athletics as being detrimental at MHS. There was some difference in the response of
coaches and non-coaches, but that difference was not statistically significant. Generally speaking,

teachers at MHS disagreed with the statement that athletes spend too much time focusing on
sport and not enough time focusing on academics.
Responses to the final question supported both the developmental model and the leading
crowd model. In general, there was nearly an even split between the two, with 9 of 21 supporting
the leading crowd model and 10 of 21 supporting the developmental model. Only two
respondents supported the social capital model. Coaches were more likely than non-coaches to
support the developmental model, while non-coaches were more likely to support the leading
crowd model.
It should not be surprising that coaches supported the developmental model. Coaching is
voluntary and the pay is not significant. Individuals would not coach if they felt that there was no
benefit to sport. Coaches at MHS seem to believe that one of the benefits of sport is the
development of academic skills. Improved academic success justifies sport and, in a way,
provides a rationale and a value to athletics that can be tied to the curricular mission of the
school.
Non-coaches at MHS supported the leading crowd model slightly more than the
developmental model. 60% (n=6) of non-coaches favored the leading crowd model while 40%
(n=4) favored the developmental model. Again, this isn't surprising. Perhaps non-coaches see
some value in athletics, but they also see the importance of athletics to the status of high school
students. Responses to question seven indicate that non-coaches are more likely to believe that
high functioning students are drawn to athletics for status. This is apparent in the non-coach
response to the final question, a response which supported the leading crowd model.
Conclusions

3 1 The survey results indicate that the sample population viewed the developmental model and
the leading crowd model as both being important. Differences are apparent in that coaches
favored the developmental model while non-coaches slightly favored the leading crowd model.
Teacher-bias toward athletes was dismissed by the sample population. The sample population
generally believed that athletes have greater status and that athletics develop academic skills.
These findings support the literature.
The sample population of teachers at MHS was somewhat dismissive of the social capital
model. Both coaches and non-coaches were slightly above neutral in regards to greater teacher
connectivity for athletes. Only 2 of 21 respondents believed that athletes outperform non-athletes
due to greater connectivity with coaches and teachers. This somewhat refutes the social capital
model. Perhaps the social capital model is too complex for a simple survey. Perhaps the
developmental and leading crowd models are easier to understand and qualify.
Recommendations
Based on the survey data it is recommended that a larger survey be conducted of teachers and
coaches at other high schools. A larger sample population would provide much more
comprehensive data for purposes of study. It is recommended that students, preferably recent
graduates, also be surveyed. Surveys of recent graduates could perhaps better analyze the notion
of teacher-bias toward athletes.
The social capital model is very intriguing and should be further researched to indicate its
importance on the academic achievement of athletes. Survey questions could be altered to better
reflect social capital and social networks.
32 Lastly, the research indicates that athletes outperform non-athletes academically. Whatever
the reason, athletics is an important component to the academic success of many students. Be it
skill development or social networks, athletes simply do better than non-athletes in the
classroom. As such, great care should be taken when discussing athletic cuts for budgetary
purposes. If athletic involvement is related to academic achievement, then any cut in athletic
programs could have negative impact on the academic success of individual students.

REFERENCES
Benedict, Jeff (1997). Public Heroes, Private Felons: Athletes and Crimes Against
Women. Boston: Northeastern University Press.
Braddock, Jomills H. (1 98 1). Race, athletics and educational attainment: Dispelling the myths.
Youth & Society, 12(3), 335-50.
Bratz, Jay and Robert D. Putnam (1 996). Families, communities and education in America:
Exploring the evidence. (ERIC Documentation Reproduction No. ED 412 637)
Broh, Becket A. (2002) Linking extracumcular programming to academic achievement:
Who benefits and why? Sociology of Education, 75(1), 69-91. Retrieved June 10,2005, from
Ebsco Host database.
Chambers, Sam T. (1 991). Factors affecting elementary school student's participation in sports.
Elementary School Journal, 91 (9,413-41 9. Retrieved June 10,2005, from Ebsco Host
database.
Coleman, James S. (1961). The Adolescent Society. New York: Free Press.
Coleman, James S. (1990). Foundations of Social Theory. Cambridge, MA: Belknap Press of
Harvard University Press.
Crosset, Todd W., Jeffery R. Benedict and Mark A. McDonald (1995). Male student athletes
reported for sexual assault: A study of campus police departments and judicial affairs offices.
Journal of Sport and Social Issues, 19(2), 126- 140. Retrieved June 1 1,2005, from:
http://www.sp.uconn.edu/-yianlreseve/crosset.htm
Eitzen, D. Stanley (1975). Athletics in the status system of male adolescents: A
replication of Coleman's Adolescent Society. Adolescence, 10(38), 268-76.
3 4 Fejgin, Naomi (1994). Participation in High School Competitive Sports: A subversion of
school mission or contribution to academic goals? Sociology of Sport Journal, 11(3), 21 1-30.
Goldberg, A and T. Chandler (1989). The role of Athletics: The social world of high
school adolescents. Youth and Society, 21(2), 238-250.
Guest, Andrew and Barbra Schneider (2003). Adolescents extracurricular participation in
context: The mediating effect of schools, communities, and identity. Sociology of
Education, 76(2), 89- 100.
Hauser, Robert M., Solon J. Simmons and Devah I. Pager (2000). High school dropout Rate,
ethnicity and social background from the 1970 's to the 1990 's. (ERIC Documentation
Reproduction No. 449 277).
Holland, Alyce, and Thomas Andre (1999). Student Characteristics and Choice of High School
Remembrance Role. Adolescence, 34(134), 315-39. Retrieved June 10,2005, from Ebsco
Host database.
Liu, Caitlin and Hector Beccera (2005, July 9). Ballplayer, 13, Convicted of Fatal Beating with
Bat. Los Angeles Times, Retrieved July 12,2005 from: http://www.latimes.com
Marsh, H. W. (1992). Extracurricular activities: Beneficial extension of the traditional
curriculum or subversion of academic goals? Journal of Educational Psychology, 84(4), 553-
562. Retrieved June 15,2005, from Ebsco Host database.
McNeal, Ralph B. Jr. (1995). Extracurricular activities and high school dropouts. Sociology of
Education, 68(1), 62-8 1. Retrieved June 12,2005, fiom JSTOR Arts and Sciences database.
McNeal, Ralph B. Jr. (1 999). Participation in high school extracurricular activities: Investigating
school effects. Social Science Quarterly, 80(2) 291-310. Retrieved June 15,2005, from Ebsco
3 5 Host database.
Messner, Michael A., and Donald F. Sabo (1994). Sex, Violence and Power in Sports; Rethinking
Masculinity. Canada; Fitzhenry & Whitside.
Melina, Robert M. (1 999, Spring). Sport, Violence and Littleton - A Perspective, Retrieved from
Michigan State University, Youth Sport Innitiative on July 12, 2005 from:
http://ed-web3 .educ.msu.edu~ysi/Spring%201999%Bob.htm
Miracle, Andrew W., and Roger Rees (1994). Lessons of the Locker Room. The Myth of School
Sports. Buffalo, NY: Prometheus Books
Owens, Jefferey (1996). Who Participates in Varsity Intercollegiate Sports in Four-year
Colleges? Statistics in brief. (ERIC Documentation Reproduction No. 404 908).
Putnam, Robert D., (1995). Bowling Alone: America's declining social capital. Journal of
Democracy, 6(1), 65-78. Retrieved December, 2004, from Project MUSE database.
Putnam, Robert D., (2000). Bowling Alone: The Collapse and Revival of American Community.
New York: Simon & Schuster
Ross, Catherine E., and Beckett A. Broh (2000). The roles of self-esteem and the sense of
personal control in the academic achievement process. Sociology of Education, 73:270-84.
Snyder, Eldon E., and Elmer Sprietzer (1990) .High school athletic participation as related to
college attendance among Black, Hispanic and White Males: A research note. Youth and
Society, 21(3), 390-398
Yeager, Don and Jeff Benedict (1998). Pros and Cons: The Criminals who Play in the NFL.
Warner Books, Inc: New York

APPENDIXA: Consent form and Survey Instrument
Consent to Participate in UW-Stout Approved Research
Title: Teacher Perception of the Acadenric Achievement of Athletes at Menomonie High School
Investigator: Craig A. Olson Research Sponsor: Dr. Steve Terry 7 15.386.1078 (home) 715.232.2161 7 15.232.2606 x 229 (school)
Description: Research indicates that students involved in athletics outperform students that are not involved in athletics at the high school level. Researchers have developed three models that attempt to explain this phenomenon. The objective of this survey is to determine the perception of teachers as to why athletes outperform non-athletes. The population of teachers has been divided into two groups, those who coach and those who do not coach. The survey is designed to determine if a discrepancy exists between these two groups. Also, this survey will look at the respondent's overall attitudes about athletics and compare those attitudes to beliefs about athletes and grades.
Benefits and Risks: It is assumed that coaches and non-coaches view athletes differently. Very little research exists in this area and this survey seeks to determine if there is discrepancy, a lack of discrepancy or even if bias exists among the two groups. The benefits are that the research will further existing data and give teachers at MHS a unique perspective into their school environment. The risks are minimal. The survey is anonymous and voluntary. Do not complete the survey if you feel your response will not remain anonymous.
Confidentiality: Your name will not be included on any documents and all answers are confidential.
Right to Withdraw: Your participation is voluntary. You may choose not to participative without any adverse consequences. However, should you choose to participate and later wish to withdraw from the study, there is no way to identify your anonymous document after it has been turned in to the investigator.
IRB Approval: This study has been reviewed and approved by The University of Wisconsin- Stout's Institutional Review Board (IRB). The IRB has determined that this study meets the ethical obligations required by federal law and University policies. If you have questions or concerns regarding this study please contact the Investigator or Advisor. If you have any questions, concerns or reports regarding your rights as a research subject, please contact the IRB Administrator.
Investigator: Craig A. Olson IRB Administrator 715.386.1078 Sue Foxwell, Director, Research Services [email protected] 152 Vocational Rehabilitation Bldg.
UW-Stout Advisor: Dr. Steven Terry Menomonie, WI 5475 1
715.232.2161 7 15.232.2477 [email protected] [email protected]
Statement of Consent: By completing the following survey you agree to participate in the project entitled Teacher Perception of the Academic Achievement of Athletes at Menomonie High School.
Teacher Perception of the Academic Achievement of Athletes at Menomonie High School
Check the box that represents your situation Teacher / Coach Teacher / Non-coach
ASSUMPTION: Research indicates that, in general, athletes outperform non-athletes academically. Please assume this is true for athletes at Menomonie High School as no good research data is available on our student population.
PART I - Use the following scale to answer question 1 1 = never 2 = rarely 3 = sometimes 4 = frequently 5 = very frequently
I) I support athletics at MHS by attending, as a coach, game worker or spectator, athletic events regularly.
List the average number of athletic events you attend each year as a spectator, game worker and coach.
Use the following scale to answer questions 2-10 1 = strongly disagree 2 = disagree 3 = neutral 4 = agree 5 = strongly agree
2) Athletics is an important component of a high school educational experience.
3) MHS spends too much money on athletics.
4) Athletics is generally over-valued in our school and community.
5) Student-athletes are not held to as high of a standard when disciplined for rules violations and are given less severe punishments than non-athletes.
6) Teachers favor athletes and give them hgher grades.
7) In general, hgh acheving and hard working students are drawn to athletics for purposes of social status.
8) Athletics teaches valuable lessons to students, such as time management, team-work, individual responsibility and accountability.
9) Athletes have a greater personal connection to teachers than non-athletes.
10) In general, student-athletes spend too much time focusing on athletics and not enough time focusing on academics.
Part I1 - Which of the following statements would best explain why athletes outperform non-athletes academically? Circle one:
A) High hnctioning students are drawn to athletics and these h d s of students would get high grades with or without sports.
B) Athletes develop skills on the athletic field that help them in the classroom. C) Teachers (especially teachers that also coach) llke athletes better than non-athletes
and give them hgher grades. D) The athletic code minimal GPA requirements cause athletes to outperform non-athletes. E) Coaches help athletes who are struggling by contacting teachers, counselors and
parents to try and get those athletes academic assistance.
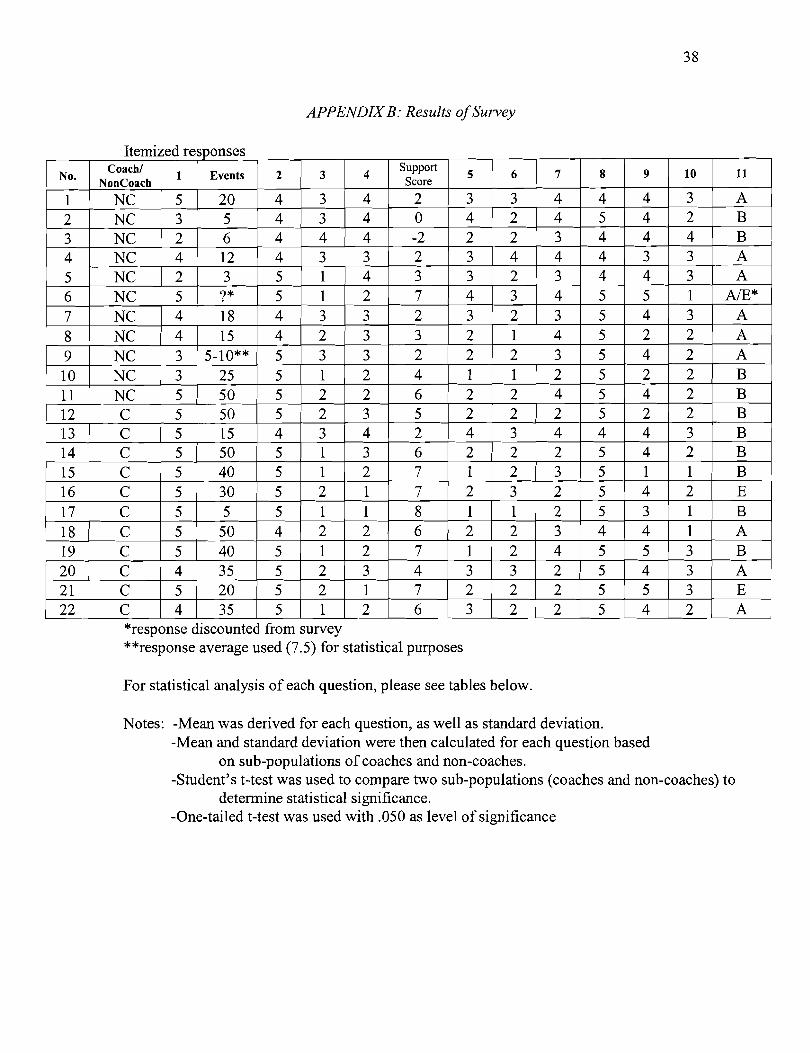
APPENDIX B: Results of Suwey
*response discounted from survey **response average used (7.5) for statistical purposes
For statistical analysis of each question, please see tables below
Notes: -Mean was derived for each question, as well as standard deviation. -Mean and standard deviation were then calculated for each question based
on sub-populations of coaches and non-coaches. -Student's t-test was used to compare two sub-populations (coaches and non-coaches) to
determine statistical significance. -One-tailed t-test was used with .050 as level of significance

- -
Question 1 All (n=22) Non-Coaches (n=l 1) Coaches (n=l 1) Mean = 4.22 Mean = 3.64 Mean = 4.82 0 = .99 0
t = -3.29 0 = 0.842 degrees of freedom = 20
Comments: Coaches attend more athletic events than do non-coaches.
TG probability of this result, assuming the null hypothesis, is 0.004, which is statistically significant. Games Attended
All (n=21) Non Coaches (n=10) Coaches (n=l 1) Mean = 25.3 Mean = 16.1 Mean = 33.6 o = 16.1 o= 13.9 o = 15
Question 3 All (n=22) Non Coaches (n=l 1) Coaches (n=l 1) Mean 2 Mean 2.36 Mean 1.64 cr = .93 cr= 1.03 cr = .674
t = -2.76 o = 14.5 degrees of freedom = 19 The probability of this result, assuming the null hypothesis, is
0 . 0 1 2 , i f l c a n t . I
Question 2 All (n=22) Non Coaches (n=l 1) Coaches (n=l 1) Mean = 4.64 Mean = 4.45 Mean = 4.82 0 = .492 0 = .522 0 = .405
note: 100% of those surveyed responded with a 4 or 5. 82% of coaches responded with a 5.
t = 1.96 1 Comments:
Comments: Again, coaches attend more athletic events than do non-coaches, which is not surprising.
T = -1.83 0 = 0.467 degrees of freedom = 20
Comments: Coaches are more likely to believe athletics is an important component of a h g h school experience than
t = 2.34 I Comments:
The probability of this result, assuming the null hypothesis, is non-coaches, 0.083, which has significance.
0 = 0.869 degrees of freedom = 20 The probability of this result, assuming the null hypothesis, is fi
cr = 0.910 1 Coaches were less likely to believe
Coaches were less likely to believe MHS spends too much money on athletics than were non-coaches, but significance was slight.
Question 4 All (n=22) Non Coaches (n=l 1) Coaches (n=l 1) Mean 2.64 Mean 3.09 Mean = 2.18 0 = 1.00 u = 331 0 = .982
degrees of freedom = 20 that athletics is over-valued in the school and community than non-
The probability of this result, assuming the null hypothesis, is , coaches~
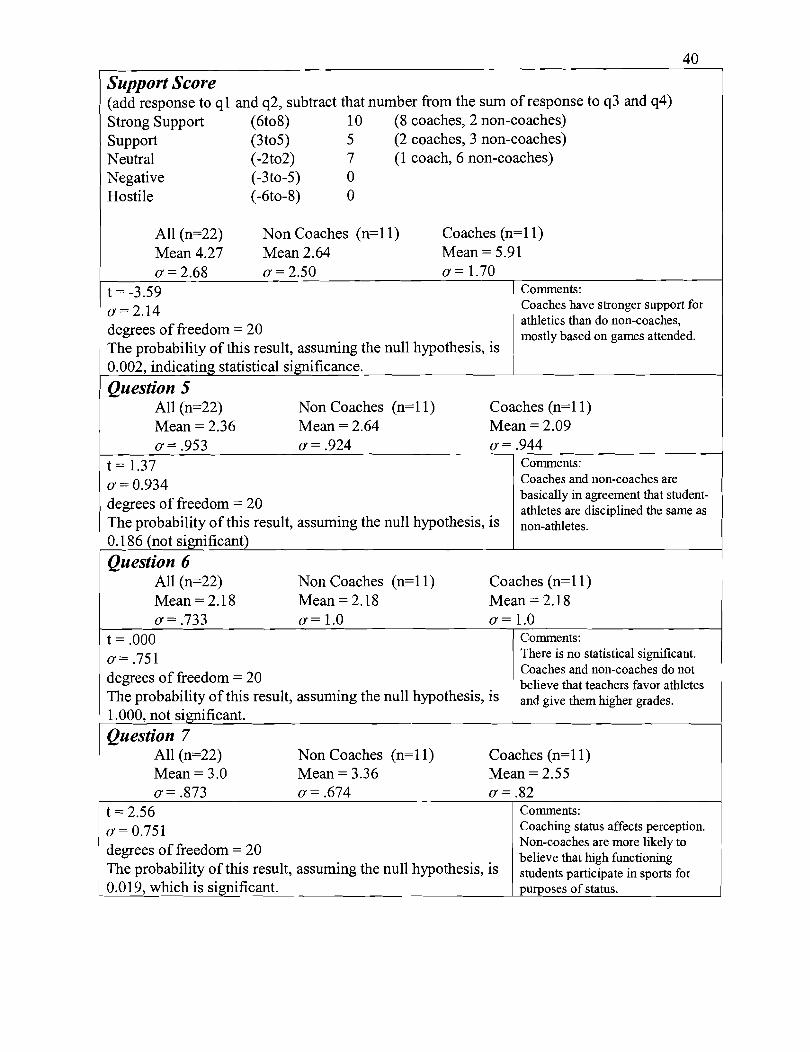
40
Support Score (add response to q l and q2, subtract that number from the sum of response to q3 and q4) Strong Support (6to8) 10 (8 coaches, 2 non-coaches) Support (3 to5) 5 (2 coaches, 3 non-coaches) Neutral (-2to2) 7 (1 coach, 6 non-coaches) Negative (-3to-5) 0 Hostile (-6to-8) 0
All (n=22) Non Coaches (n=l 1) Coaches (n=l 1) Mean 4.27 Mean 2.64 Mean = 5.91 0 = 2.68 0 = 2.50 o = 1.70
t = -3.59 ( Comments: ' 0=2.14 1 Coaches have stronger support for
degrees of freedom = 20
0.002, indicating statistical significance. I Question 5
All (n=22) Non Coaches (n=l 1) Coaches (n=l 1) Mean = 2.36 Mean = 2.64 Mean = 2.09 0 = .953 0 = .924 0 = .944
athletics than do non-coaches, mostly based on games attended.
t = 1.37 0 = 0.934
, degrees of freedom = 20 The probability of this result, assuming the null hypothesis, is 0.186 (not significant) Question 6
All (n=22) Non Coaches (n=l 1) Coaches (n=l 1) Mean = 2.18 Mean = 2.18 Mean = 2.18 0 = .733 0 = 1.0 0 = 1.0
The probability of this result, assuming the null hypothesis, is
Comments: Coaches and non-coaches are basically in agreement that student- athletes are disciplined the same as non-athletes.
t = .000 o= .751
0 = 0.751 degrees of freedom = 20 The probability of this result, assuming the null hypothesis, is 0.019, which is significant. -
Comments: There is no statistical significant. Coaches and non-coaches do not
Coaching status affects perception. Non-coaches are more likely to believe that high functioning students participate in sports for purposes of status.
degrees of freedom = 20 believe that teachers favor athletes
Question 7 All (n=22) Non Coaches (n=l 1) Coaches (n=l 1) Mean = 3.0 Mean = 3.36 Mean = 2.55
0 = .674 0 = .82 t = 2.56 Comments:

Question 8 All (n=22) Non Coaches (n=l 1 ) Coaches (n=l 1) Mean = 4.77 Mean = 4.64 Mean = 4.82 cr = .429 cr = .505 cr = .405
note: 100% of those surveyed responded with a 4 or a 5. 81% of coaches responded with a 5. t = -0.933 Comments:
CI = 0.457 Coaches and non-coaches basically agree that athletics teaches valuable
degrees of freedom = 20 lessons that apply to the classroom, The probability of th the developmental is 0.362, which is no model.
Question 9 All (n=22) Non Coaches (n=l 1 ) Coaches (n=l 1) Mean = 3.64 Mean = 3.64 Mean = 3.64 cr= 1.05 cr = .924
t = 0.00 a = 1.07 degrees of freedom = 20 The probability of this result, assuming the null hypothesis, is 1.000, which is not significant. Question 10
All (n=22) Non Coaches (n=l 1) Mean = 2.27 Mean = 2.55 cr= 227 cr = .934
c r = 1.21 Comments: Coaches and non-coaches basically agree that athletes have a greater personal connection to teachers, supporting the social capital model. Responses not as strong as question 8.
Coaches (n=l 1) Mean = 2.08 c r = 331
Response from above question based on support for athletics score Question 1 1 (n=21) High Support (n=10) Support (n= 4) Neutral (n=7)
A = 9 2 2 4 B = 10 5 2 3 C = 0 0 0 0 D = 0 0 0 0 E = 2 2 0 0
Zomrnents: Those individuals with strong support for athletics are more likely to believe that athletics develops skills, 'avoring the developmental model. Those individuals with some support or neutral support favor the developmental model md leading crowd model equally. Only two individuals, both of whom are coaches and both of whom have high support for ithletics, stated that coaches help athletes by contacting other teachers or counselors.
t = 1.21 o. = 0.884 degrees of freedom = 20 The probability of this result, assuming the null hypothesis, is 0.242, which is not significant.
Comments: There is no significant difference between coaches and non-coaches. Low score responses to thls question refute Coleman's claim of a zero-sum game in regards to athletics.
Question: Which statement best explains why athletes outperform non- athletes.
(n=2 1 ) Non Coaches (n=10) Coaches (n=ll) A = 9 6 (60%) 3 (27.3%) B = 10 4 (40%) 6 (54.5%) C = 0 0 0 D = 0 0 0 E = 2 0 2 (18.1%)