Embed Size (px)
Citation preview
for School
Foundations for Algebra
Solving Equations
Solving Inequalities
An Introduction to Functions
Linear Functions
Systems of Linear Equations and Inequalities
Exponents and Exponential Functions
Polynomials and Factoring
Quadratic Functions and Equations
Radical Expressions and Equations
Rational Expressions nd Functions
Data Analysis and Probability
1
2
3
4
5
6
7
8
9
10
11
12
ALWAYS LEARNING
ISBN-13:ISBN-10:
978-0-13-328313-60-13-328313-5
9 7 8 0 1 3 3 2 8 3 1 3 6
9 0 0 0 0
For Student Edition with 6-year online access to PowerAlgebra.com, order ISBN 0-13-318549-4.
Teacher Resource Sampler
Includes Spanish
Resources
2
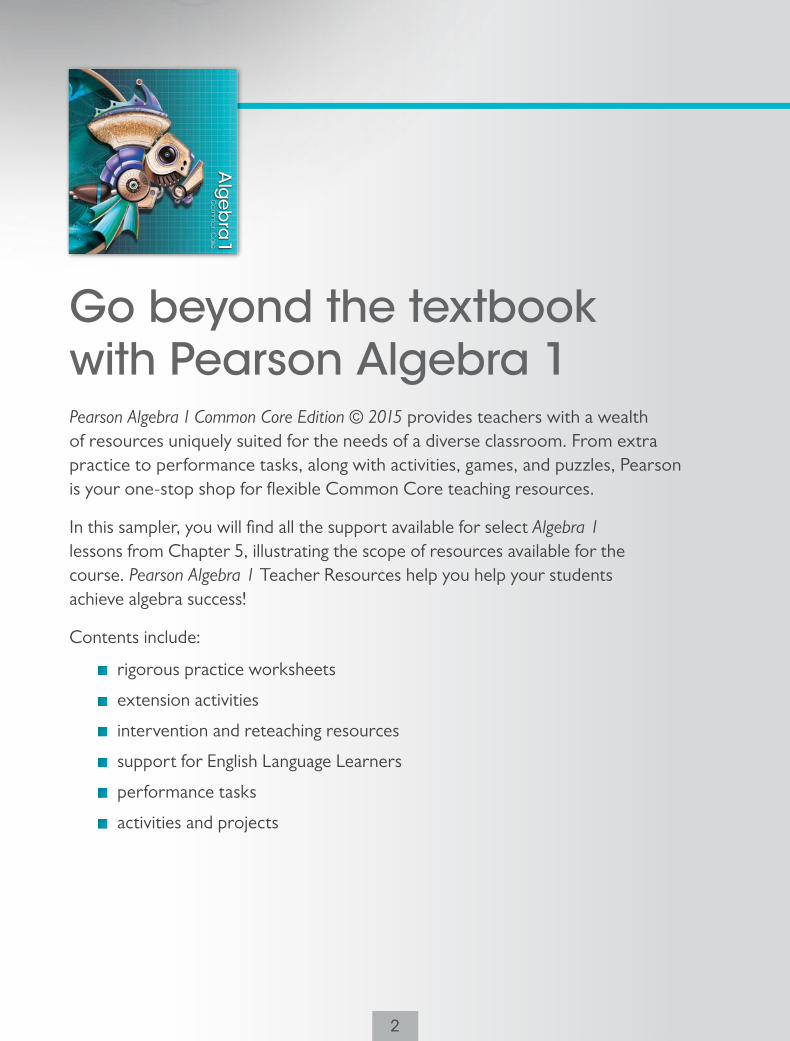
Pearson Algebra 1 Common Core Edition © 2015 provides teachers with a wealth of resources uniquely suited for the needs of a diverse classroom. From extra practice to performance tasks, along with activities, games, and puzzles, Pearson is your one-stop shop for flexible Common Core teaching resources.
In this sampler, you will find all the support available for select Algebra 1 lessons from Chapter 5, illustrating the scope of resources available for the course. Pearson Algebra 1 Teacher Resources help you help your students achieve algebra success!
Contents include:
rigorous practice worksheets
extension activities
intervention and reteaching resources
support for English Language Learners
performance tasks
activities and projects
Go beyond the textbook with Pearson Algebra 1
for School
Foundations for Algebra
Solving Equations
Solving Inequalities
An Introduction to Functions
Linear Functions
Systems of Linear Equations and Inequalities
Exponents and Exponential Functions
Polynomials and Factoring
Quadratic Functions and Equations
Radical Expressions and Equations
Rational Expressions nd Functions
Data Analysis and Probability
1
2
3
4
5
6
7
8
9
10
11
12
ALWAYS LEARNING
ISBN-13:ISBN-10:
978-0-13-328313-60-13-328313-5
9 7 8 0 1 3 3 2 8 3 1 3 6
9 0 0 0 0
For Student Edition with 6-year online access to PowerAlgebra.com, order ISBN 0-13-318549-4.
3
Contents
Student Companion 4
Think About a Plan 8
Practice G 9
Practice K 11
Standardized Test Prep 13
Reteaching 14
Additional Vocabulary Support 16
Activity 17
Game 18
Puzzle 19
Enrichment 20
Teaching with TI Technology 21
Chapter Quiz 23
Chapter Test 25
Find the Errors! 27
Performance Tasks 30
Extra Practice 32
Chapter Project 36
Cumulative Review 38
Weekly Common Core Standards Practice 40
Performance Based Assessment 42
Common Core Readiness Assessment 45
Cop
yrig
ht ©
by
Pear
son
Educ
atio
n, In
c. o
r its
aff
iliat
es. A
ll Ri
ghts
Res
erve
d.
Vocabulary
Review
Chapter 5 150
Point-Slope Form5-4
1. Circle the equation that has a y-intercept of 3.
y 5 3x 1 4 y 5 4x 2 3 y 5 5x 1 3 y 5 23x 1 2
2. Circle the equation that is in slope-intercept form.
2x 2 y 5 10 x 1 3y 1 11 5 0 y 2 4 5 23(x 1 7) y 5 2x 1 6
3. Circle the statement that is true about the y-intercept of any graph.
occurs where y 5 0 occurs where x 5 0 occurs where graph on the graph on the graph touches the x-axis
Vocabulary Builder
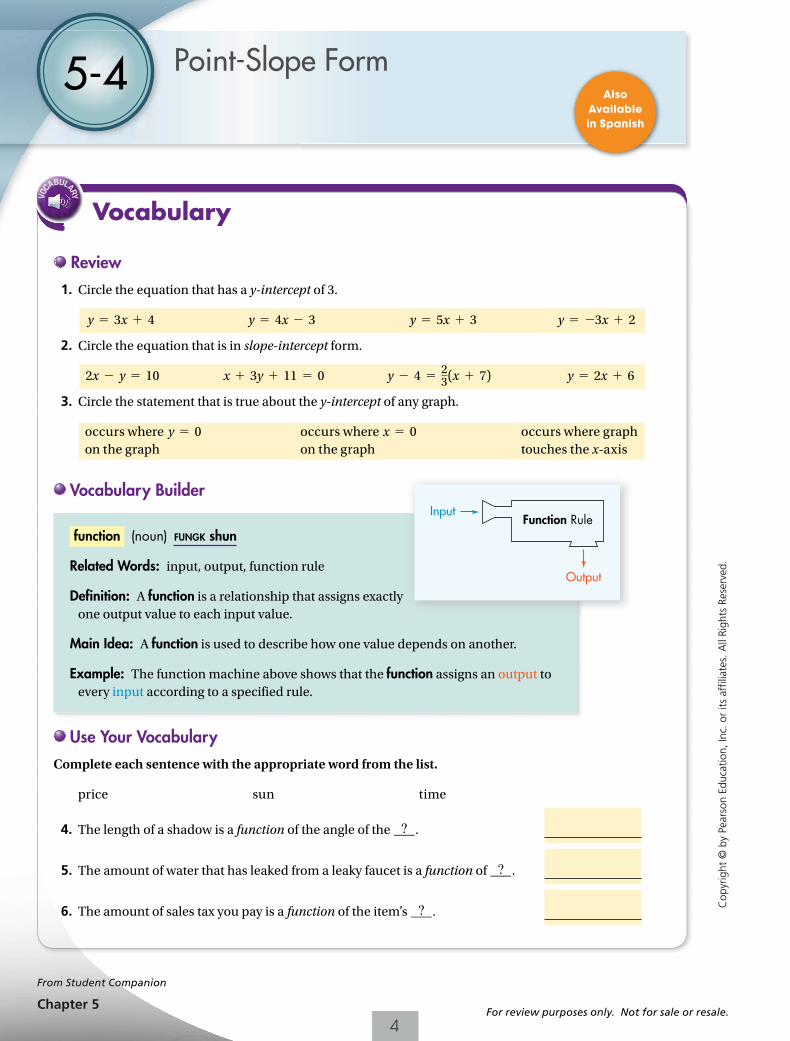
function (noun) FUNGK shun
Related Words: input, output, function rule
Definition: A function is a relationship that assigns exactly one output value to each input value.
Main Idea: A function is used to describe how one value depends on another.
Example: The function machine above shows that the function assigns an output to every input according to a specified rule.
Use Your Vocabulary
Complete each sentence with the appropriate word from the list.
price sun time
4. The length of a shadow is a function of the angle of the 9.
5. The amount of water that has leaked from a leaky faucet is a function of 9.
6. The amount of sales tax you pay is a function of the item’s 9.
InputFunction Rule
Output
From Student Companion
Also Available in Spanish
4For review purposes only. Not for sale or resale.
4
Cop
yrig
ht ©
by
Pear
son
Educ
atio
n, In
c. o
r its
aff
iliat
es. A
ll Ri
ghts
Res
erve
d.
Problem 1
Th e point-slope form of an equation of a nonvertical line with slope m and through point (x1, y1) is y 2 y1 5 m(x 2 x1).
7. In the above, what does (x1, y1) represent? 8. What does m represent?
Th i l
Key Concept Point-Slope Form of a Linear Equation
Problem 2
x
y
O 108642
2
4
6
8
246810
4
2
6
8
151 Lesson 5-4
Writing an Equation in Point-Slope Form
Got It? A line passes through (8, 24) and has slope 23. What is an equation in point-slope form of the line?
9. Use the point-slope form of an equation. For a line that passes through (8, 24) and has slope 23, circle x1and underline y1.
24 23 8 12
10. Now substitute into point-slope form.
11. An equation of the line is .
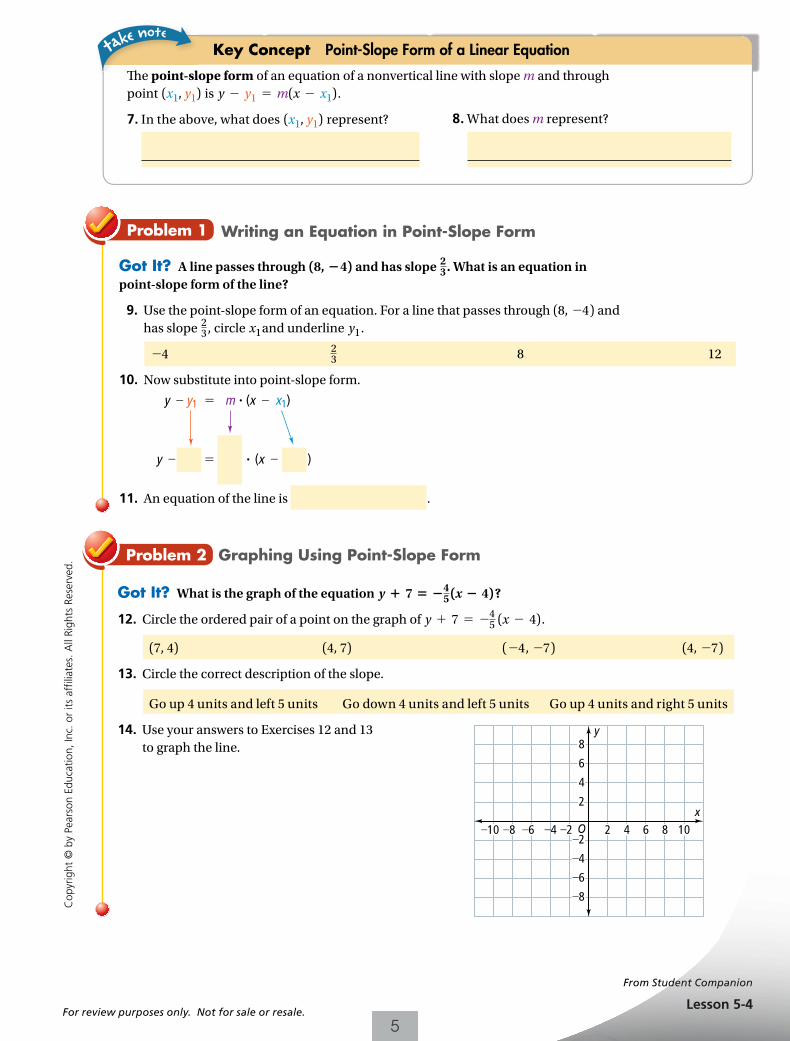
Graphing Using Point-Slope Form
Got It? What is the graph of the equation y 1 7 5 245 (x 2 4)?
12. Circle the ordered pair of a point on the graph of y 1 7 5 245 (x 2 4).
(7, 4) (4, 7) (24, 27) (4, 27)
13. Circle the correct description of the slope.
Go up 4 units and left 5 units Go down 4 units and left 5 units Go up 4 units and right 5 units
14. Use your answers to Exercises 12 and 13 to graph the line.
y y1 m (x x1)
y (x )
From Student Companion
5For review purposes only. Not for sale or resale.
5
Cop
yrig
ht ©
by
Pear
son
Educ
atio
n, In
c. o
r its
aff
iliat
es. A
ll Ri
ghts
Res
erve
d.
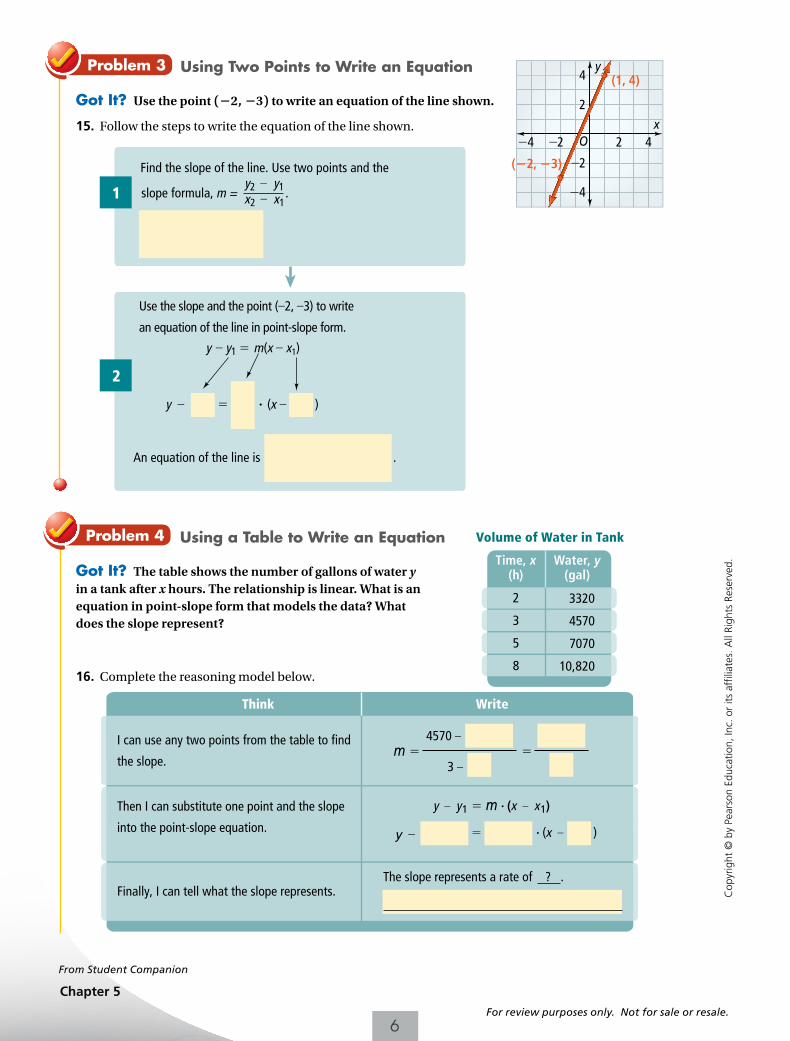
Problem 3
Think Write
I can use any two points from the table to find
the slope.
Then I can substitute one point and the slope
into the point-slope equation.
Finally, I can tell what the slope represents.
4570
3 m
y y1 m (x x1)
y (x )
The slope represents a rate of ? .
Problem 4
y
xO 2 4
2
4
2
4
24
(1, 4)
( 2, 3)
Chapter 5 152
Using Two Points to Write an Equation
Got It? Use the point (22, 23) to write an equation of the line shown.
15. Follow the steps to write the equation of the line shown.
Using a Table to Write an Equation
Got It? The table shows the number of gallons of water y in a tank after x hours. The relationship is linear. What is an equation in point-slope form that models the data? What does the slope represent?
16. Complete the reasoning model below.
1
2
Use the slope and the point ( 2, 3) to write
an equation of the line in point-slope form.
Find the slope of the line. Use two points and they2 y1x2 x1
slope formula, m = .
y y1 m(x x1)
y (x )
An equation of the line is .
Time, x(h)
Water, y(gal)
3320
4570
7070
10,820
2
3
5
8
Volume of Water in Tank
From Student Companion
6For review purposes only. Not for sale or resale.
Cop
yrig
ht ©
by
Pear
son
Educ
atio
n, In
c. o
r its
aff
iliat
es. A
ll Ri
ghts
Res
erve
d.C
opyr
ight
© b
y Pe
arso
n Ed
ucat
ion,
Inc.
or
its a
ffili
ates
. All
Righ
ts R
eser
ved.
Lesson Check
Now Iget it!
Need toreview
0 2 4 6 8 10
Math Success
153 Lesson 5-4
• Do you UNDERSTAND?
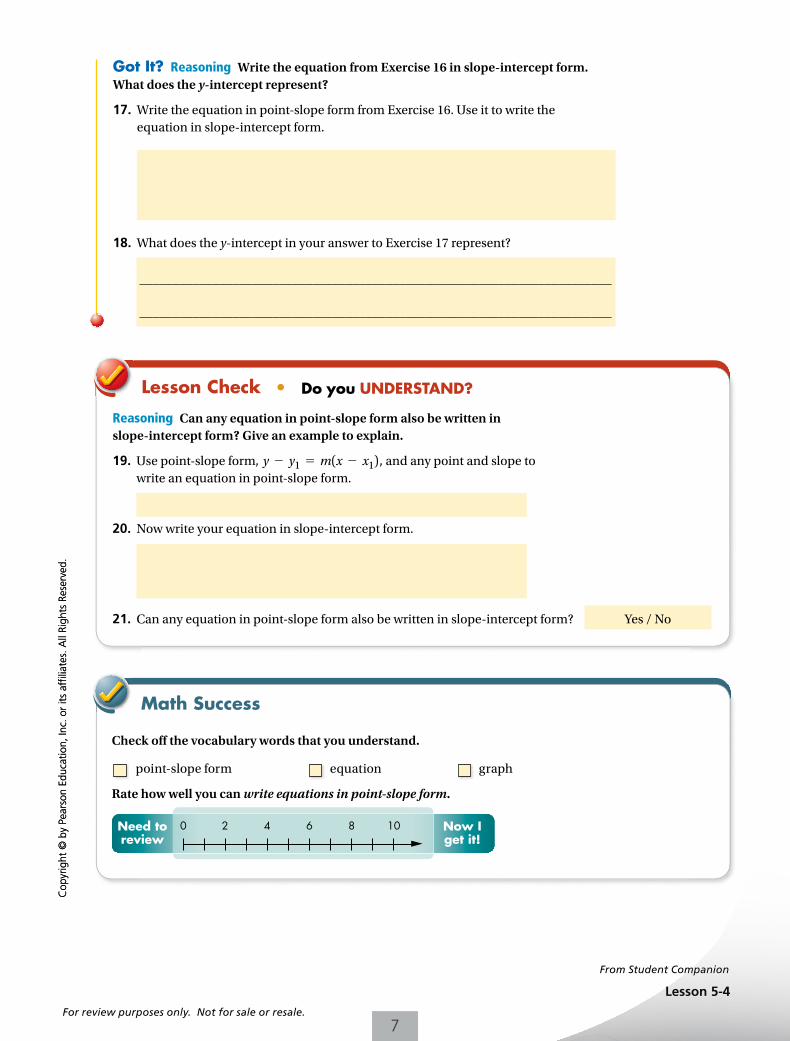
Got It? Reasoning Write the equation from Exercise 16 in slope-intercept form. What does the y-intercept represent?
17. Write the equation in point-slope form from Exercise 16. Use it to write the equation in slope-intercept form.
18. What does the y-intercept in your answer to Exercise 17 represent?
_______________________________________________________________________
_______________________________________________________________________
Reasoning Can any equation in point-slope form also be written inslope-intercept form? Give an example to explain.
19. Use point-slope form, y 2 y1 5 m(x 2 x1), and any point and slope to write an equation in point-slope form.
20. Now write your equation in slope-intercept form.
21. Can any equation in point-slope form also be written in slope-intercept form? Yes / No
Check off the vocabulary words that you understand.
point-slope form equation graph
Rate how well you can write equations in point-slope form.
From Student Companion
7For review purposes only. Not for sale or resale.
Name Class Date
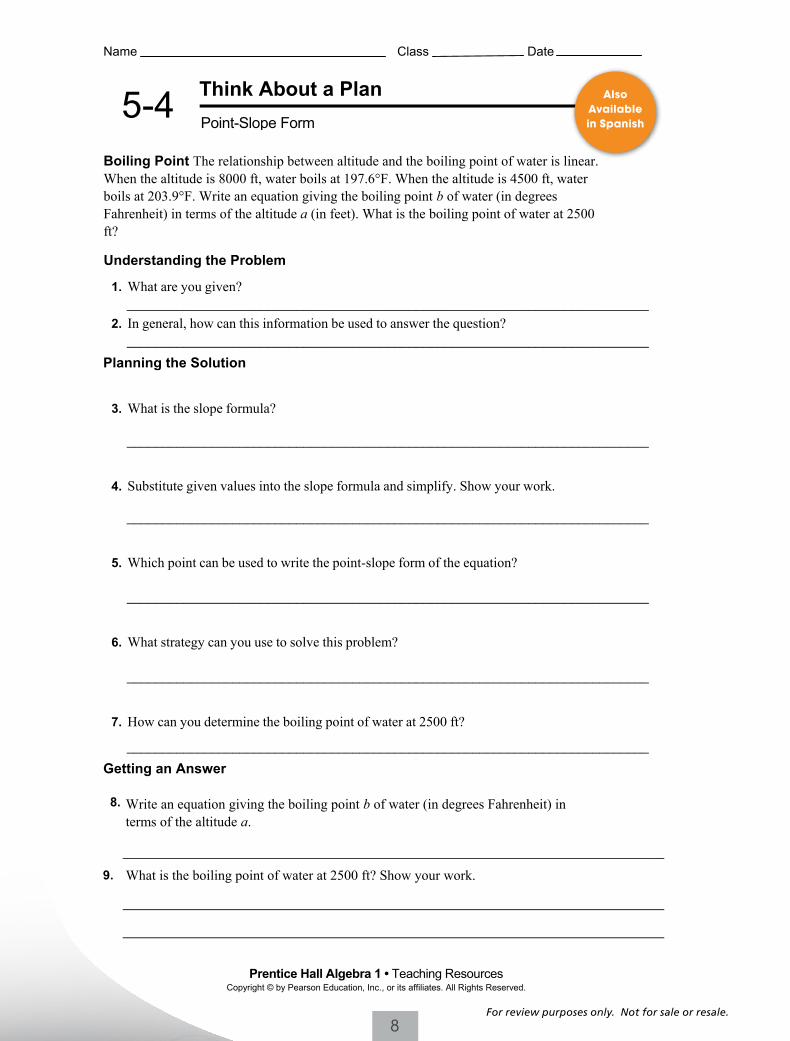
5-4 Think About a PlanPoint-Slope Form
Boiling Point The relationship between altitude and the boiling point of water is linear. When the altitude is 8000 ft, water boils at 197.6°F. When the altitude is 4500 ft, water boils at 203.9°F. Write an equation giving the boiling point b of water (in degrees Fahrenheit) in terms of the altitude a (in feet). What is the boiling point of water at 2500 ft?
Understanding the Problem
1. What are you given?__________________________________________________________________________
2. In general, how can this information be used to answer the question?__________________________________________________________________________
Planning the Solution
3. What is the slope formula?
__________________________________________________________________________
4. Substitute given values into the slope formula and simplify. Show your work.
__________________________________________________________________________
5. Which point can be used to write the point-slope form of the equation?
__________________________________________________________________________
6. What strategy can you use to solve this problem?
__________________________________________________________________________
7. How can you determine the boiling point of water at 2500 ft?
__________________________________________________________________________
Getting an Answer
Prentice Hall Algebra 1 • Teaching Resources Copyright © by Pearson Education, Inc., or its affiliates. All Rights Reserved.
8. Write an equation giving the boiling point b of water (in degrees Fahrenheit) in terms of the altitude a.
9. What is the boiling point of water at 2500 ft? Show your work.
32
Also Available in Spanish
8For review purposes only. Not for sale or resale.
Name Class Date
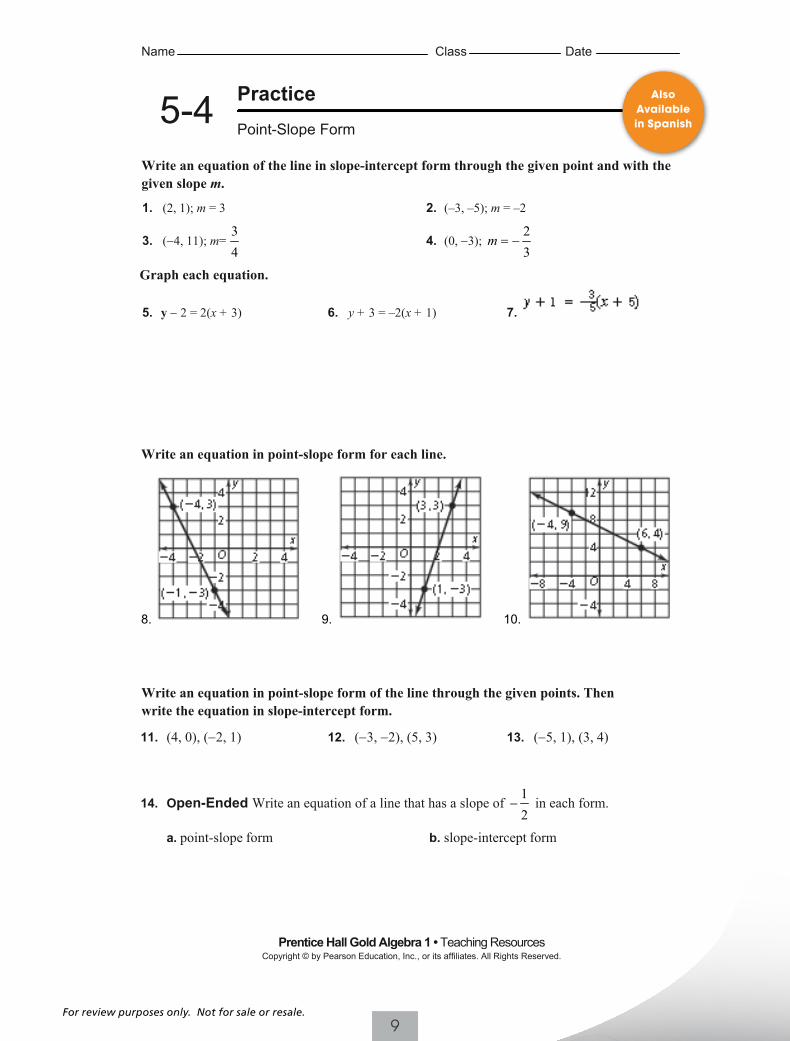
5-4 Practice Form G
Point-Slope Form
Write an equation of the line in slope-intercept form through the given point and with the given slope m.
1. (2, 1); m = 3 2. (–3, –5); m = –2
3. (−4, 11); m=34
4. (0, −3); 23
m = −
Graph each equation.
5. y − 2 = 2(x + 3) 6. y + 3 = –2(x + 1) 7.
Write an equation in point-slope form for each line.
8. 9. 10.
Write an equation in point-slope form of the line through the given points. Then write the equation in slope-intercept form.
11. (4, 0), (−2, 1) 12. (−3, −2), (5, 3) 13. (−5, 1), (3, 4)
14. Open-Ended Write an equation of a line that has a slope of 12
− in each form.
a. point-slope form b. slope-intercept form
Prentice Hall Gold Algebra 1 • Teaching ResourcesCopyright © by Pearson Education, Inc., or its affiliates. All Rights Reserved.
33
Also Available in Spanish
9For review purposes only. Not for sale or resale.
Name Class Date
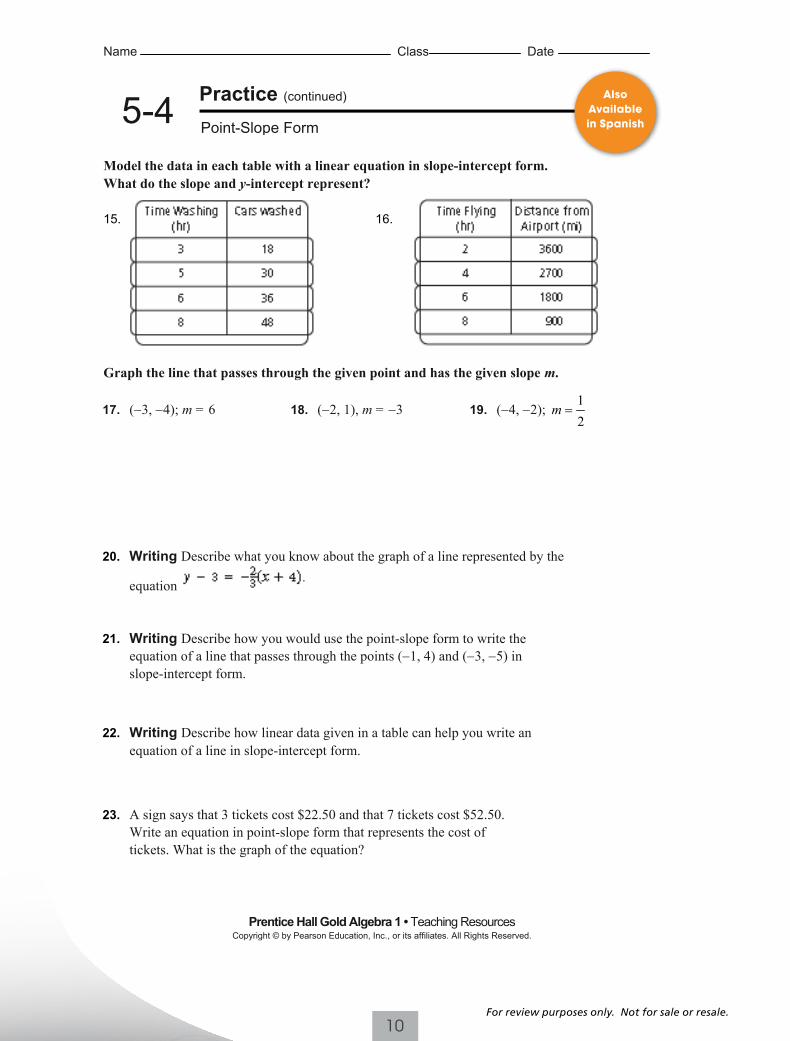
5-4 Practice (continued) Form G
Point-Slope Form
Model the data in each table with a linear equation in slope-intercept form. What do the slope and y-intercept represent?
15. 16.
Graph the line that passes through the given point and has the given slope m.
17. (−3, −4); m = 6 18. (−2, 1), m = −3 19. (−4, −2);12
m =
20. Writing Describe what you know about the graph of a line represented by the
equation
21. Writing Describe how you would use the point-slope form to write the equation of a line that passes through the points (−1, 4) and (−3, −5) in slope-intercept form.
22. Writing Describe how linear data given in a table can help you write an equation of a line in slope-intercept form.
23. A sign says that 3 tickets cost $22.50 and that 7 tickets cost $52.50. Write an equation in point-slope form that represents the cost of tickets. What is the graph of the equation?
Prentice Hall Gold Algebra 1 • Teaching ResourcesCopyright © by Pearson Education, Inc., or its affiliates. All Rights Reserved.
34
Also Available in Spanish
10For review purposes only. Not for sale or resale.
Name Class Date
5-4 Practice Form K
Point-Slope Form
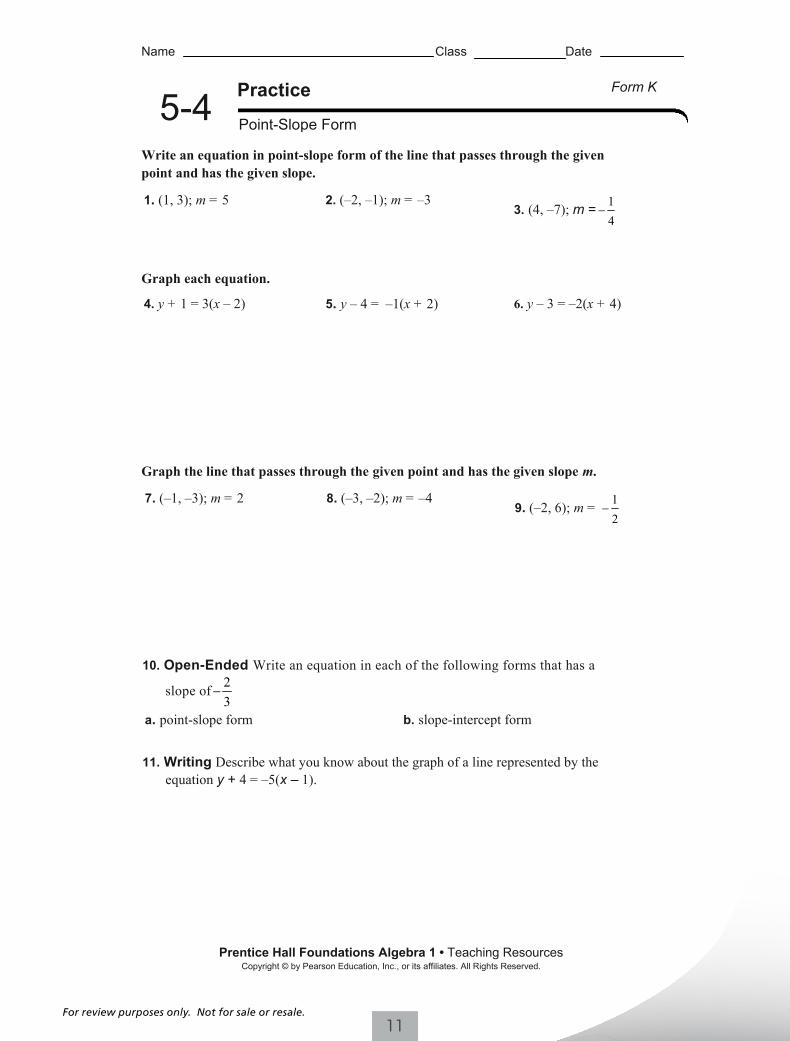
Write an equation in point-slope form of the line that passes through the given point and has the given slope.
1. (1, 3); m = 5 2. (–2, –1); m = –33. (4, –7); m = 1
4−
Graph each equation.
4. y + 1 = 3(x – 2) 5. y – 4 = –1(x + 2) 6. y – 3 = –2(x + 4)
Graph the line that passes through the given point and has the given slope m.
7. (–1, –3); m = 2 8. (–3, –2); m = –49. (–2, 6); m = 1
2−
10. Open-Ended Write an equation in each of the following forms that has a
slope of 23
−
a. point-slope form b. slope-intercept form
11. Writing Describe what you know about the graph of a line represented by the equation y + 4 = –5(x – 1).
Prentice Hall Foundations Algebra 1 • Teaching ResourcesCopyright © by Pearson Education, Inc., or its affiliates. All Rights Reserved.
35
11For review purposes only. Not for sale or resale.
Name Class Date
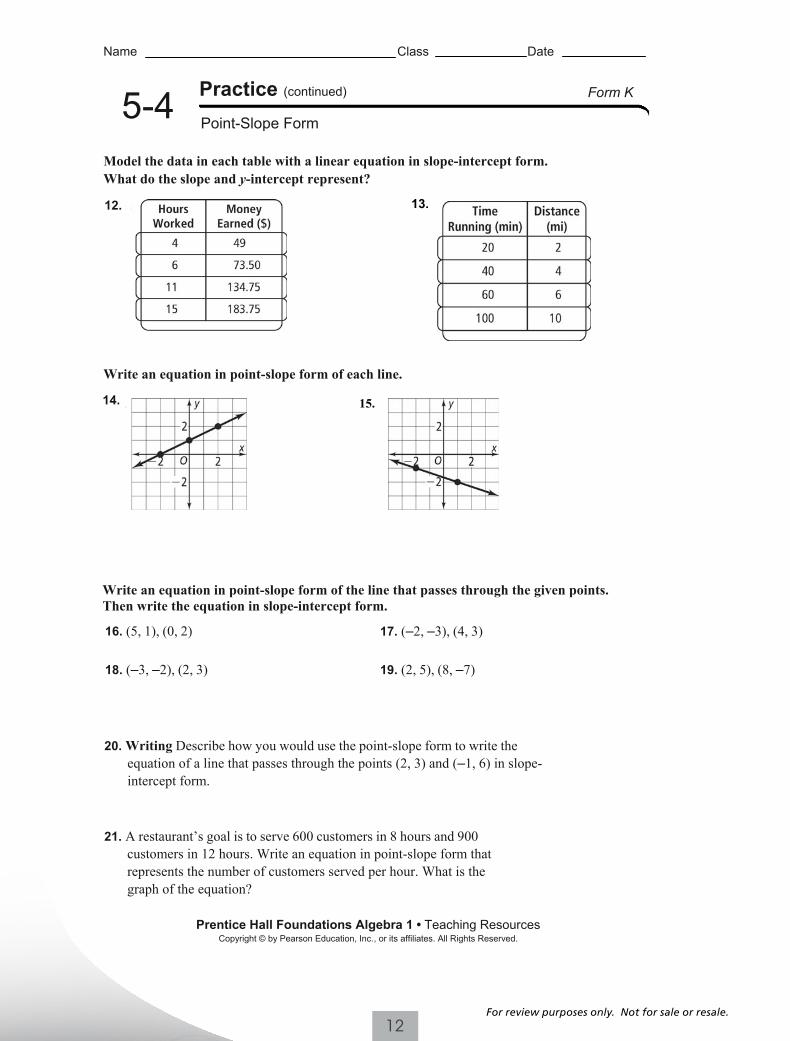
5-4 Practice (continued) Form K
Point-Slope Form
Model the data in each table with a linear equation in slope-intercept form. What do the slope and y-intercept represent?
13.12.
Write an equation in point-slope form of each line.
14. 15.
Write an equation in point-slope form of the line that passes through the given points. Then write the equation in slope-intercept form.
16. (5, 1), (0, 2) 17. (–2, –3), (4, 3)
18. (–3, –2), (2, 3) 19. (2, 5), (8, –7)
20. Writing Describe how you would use the point-slope form to write theequation of a line that passes through the points (2, 3) and (–1, 6) in slope-intercept form.
21. A restaurant’s goal is to serve 600 customers in 8 hours and 900 customers in 12 hours. Write an equation in point-slope form that represents the number of customers served per hour. What is the graph of the equation?
Prentice Hall Foundations Algebra 1 • Teaching ResourcesCopyright © by Pearson Education, Inc., or its affiliates. All Rights Reserved.
36
12For review purposes only. Not for sale or resale.
Prentice Hall Algebra 1 • Teaching ResourcesCopyright © by Pearson Education, Inc., or its affiliates. All Rights Reserved.
37
Name Class Date
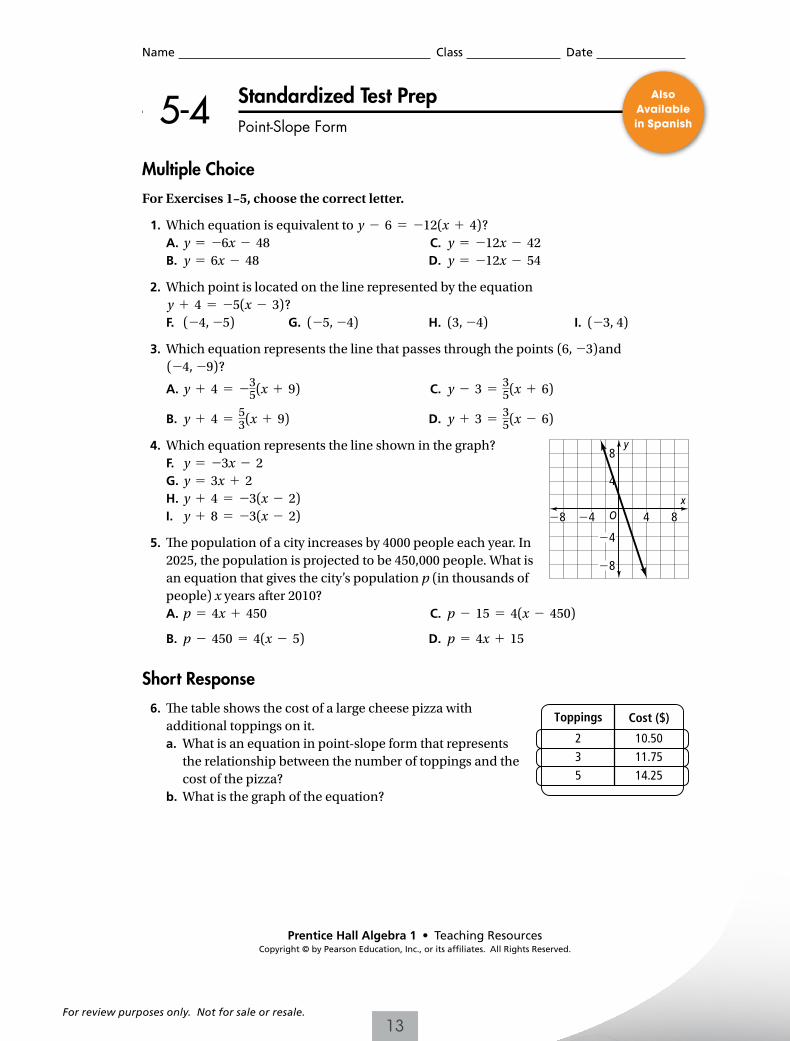
5-4 Standardized Test PrepPoint-Slope Form
Multiple Choice
For Exercises 1–5, choose the correct letter.
1. Which equation is equivalent to y 2 6 5 212(x 1 4)? A. y 5 26x 2 48 C. y 5 212x 2 42 B. y 5 6x 2 48 D. y 5 212x 2 54
2. Which point is located on the line represented by the equation y 1 4 5 25(x 2 3)?
F. (24, 25) G. (25, 24) H. (3, 24) I. (23, 4)
3. Which equation represents the line that passes through the points (6, 23)and (24, 29)?
A. y 1 4 5 235(x 1 9) C. y 2 3 5 3
5(x 1 6)
B. y 1 4 5 53(x 1 9) D. y 1 3 5 3
5(x 2 6)
4. Which equation represents the line shown in the graph? F. y 5 23x 2 2 G. y 5 3x 1 2 H. y 1 4 5 23(x 2 2) I. y 1 8 5 23(x 2 2)
5. Th e population of a city increases by 4000 people each year. In 2025, the population is projected to be 450,000 people. What is an equation that gives the city’s population p (in thousands of people) x years after 2010?
A. p 5 4x 1 450 C. p 2 15 5 4(x 2 450)
B. p 2 450 5 4(x 2 5) D. p 5 4x 1 15
Short Response
6. Th e table shows the cost of a large cheese pizza with additional toppings on it.
a. What is an equation in point-slope form that represents the relationship between the number of toppings and the cost of the pizza?
b. What is the graph of the equation?
Cost ($)Toppings
235
10.5011.7514.25
xO
y8
4
4
8
4
8 4 8
Also Available in Spanish
13For review purposes only. Not for sale or resale.
Name Class Date
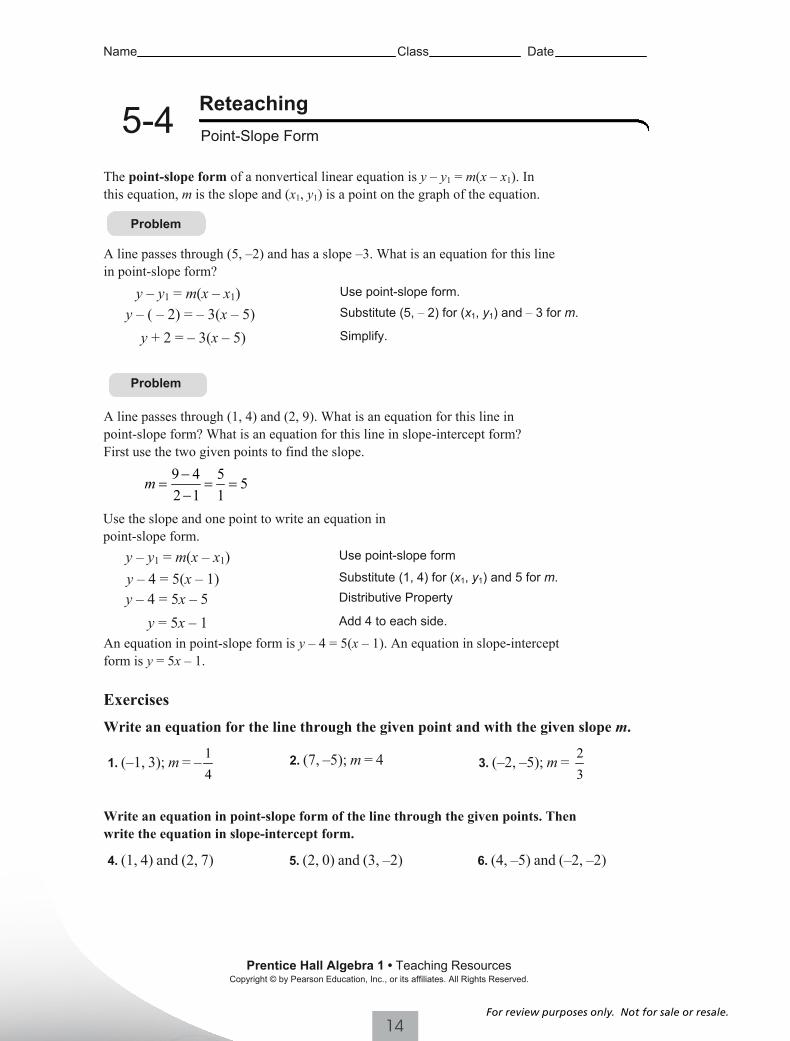
5-4 ReteachingPoint-Slope Form
The point-slope form of a nonvertical linear equation is y – y1 = m(x – x1). In this equation, m is the slope and (x1, y1) is a point on the graph of the equation.
Problem
A line passes through (5, –2) and has a slope –3. What is an equation for this line in point-slope form?
y – y1 = m(x – x1) Use point-slope form.
y – ( – 2) = – 3(x – 5) Substitute (5, – 2) for (x1, y1) and – 3 for m.
y + 2 = – 3(x – 5) Simplify.
Problem
A line passes through (1, 4) and (2, 9). What is an equation for this line in point-slope form? What is an equation for this line in slope-intercept form? First use the two given points to find the slope.
9 4 5 52 1 1
m −= = =
−Use the slope and one point to write an equation in point-slope form.
y – y1 = m(x – x1) Use point-slope form
y – 4 = 5(x – 1) Substitute (1, 4) for (x1, y1) and 5 for m.
y – 4 = 5x – 5 Distributive Property
y = 5x – 1 Add 4 to each side.
An equation in point-slope form is y – 4 = 5(x – 1). An equation in slope-intercept form is y = 5x – 1.
ExercisesWrite an equation for the line through the given point and with the given slope m.
1. (–1, 3); m = – 14
2. (7, –5); m = 4 3. (–2, –5); m = 23
Write an equation in point-slope form of the line through the given points. Then write the equation in slope-intercept form.
4. (1, 4) and (2, 7) 5. (2, 0) and (3, –2) 6. (4, –5) and (–2, –2)
Prentice Hall Algebra 1 • Teaching ResourcesCopyright © by Pearson Education, Inc., or its affiliates. All Rights Reserved.
39
14For review purposes only. Not for sale or resale.
Name Class Date
5-4 Reteaching (continued)
Point-Slope Form
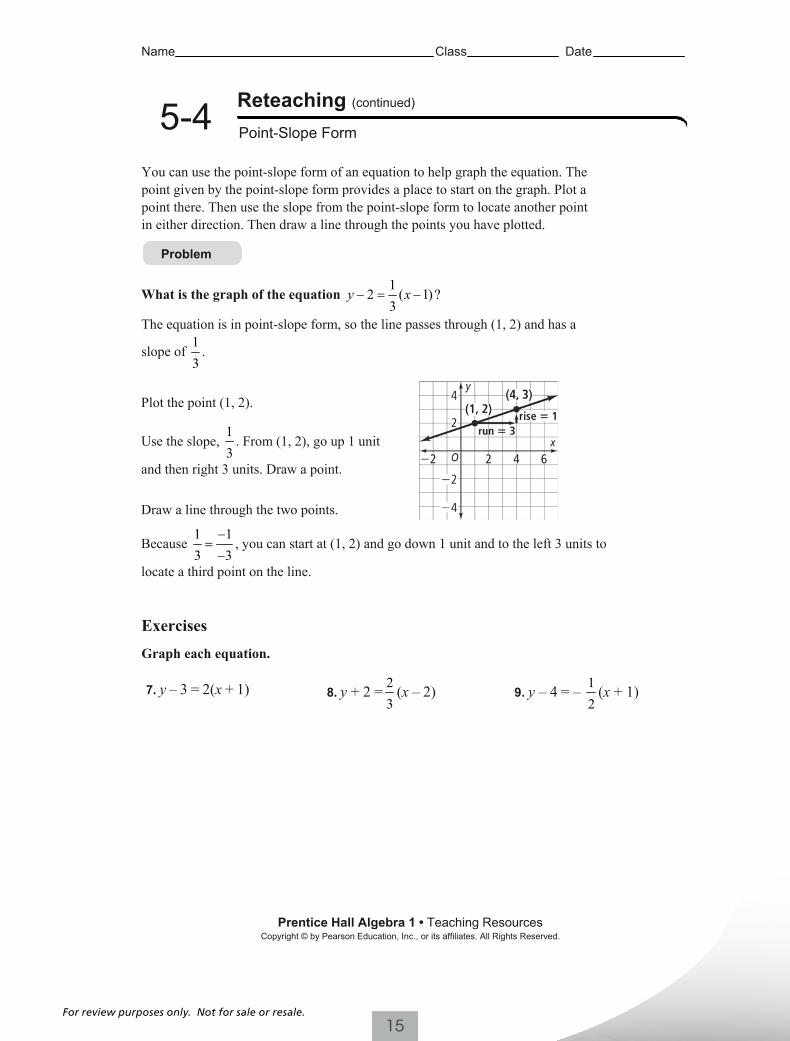
You can use the point-slope form of an equation to help graph the equation. The point given by the point-slope form provides a place to start on the graph. Plot a point there. Then use the slope from the point-slope form to locate another point in either direction. Then draw a line through the points you have plotted.
Problem
What is the graph of the equation 1
2 ( 1)3
y x− = − ?
The equation is in point-slope form, so the line passes through (1, 2) and has a
slope of 13
.
Plot the point (1, 2).
Use the slope, 13
. From (1, 2), go up 1 unit
and then right 3 units. Draw a point.
Draw a line through the two points.
Because 13 3
−=−
1, you can start at (1, 2) and go down 1 unit and to the left 3 units to
locate a third point on the line.
ExercisesGraph each equation.
7. y – 3 = 2(x + 1) 8. y + 2 = 23
(x – 2) 9. y – 4 = – 12
(x + 1)
Prentice Hall Algebra 1 • Teaching ResourcesCopyright © by Pearson Education, Inc., or its affiliates. All Rights Reserved.
40
15For review purposes only. Not for sale or resale.
Name Class Date
5-4 Additional Vocabulary Support
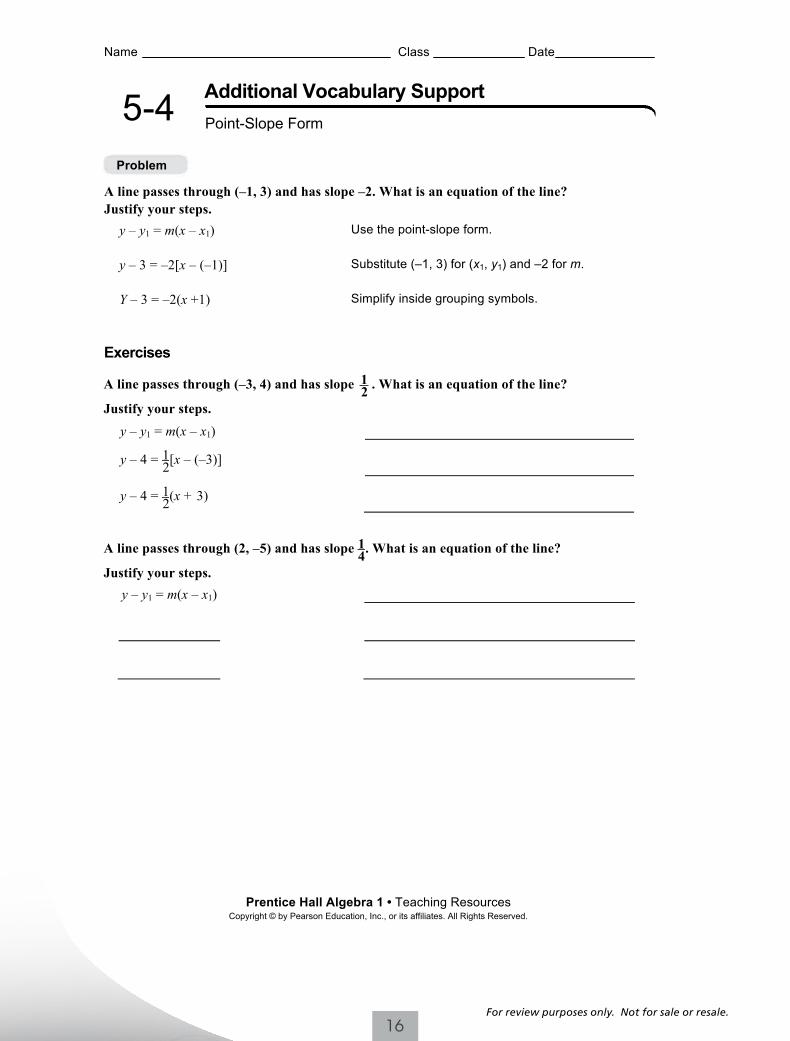
A line passes through (–1, 3) and has slope –2. What is an equation of the line? Justify your steps.
y – y1 = m(x – x1) Use the point-slope form.
y – 3 = –2[x – (–1)] Substitute (–1, 3) for (x1, y1) and –2 for m.
Y – 3 = –2(x +1) Simplify inside grouping symbols.
Exercises
A line passes through (–3, 4) and has slope 12 . What is an equation of the line?
Justify your steps.
y – y1 = m(x – x1)
y – 4 = 12[x – (–3)]
y – 4 = 12(x + 3)
A line passes through (2, –5) and has slope 14. What is an equation of the line?
Justify your steps.
y – y1 = m(x – x1)
Prentice Hall Algebra 1 • Teaching Resources Copyright © by Pearson Education, Inc., or its affiliates. All Rights Reserved.
31
Point-Slope Form
Problem
16For review purposes only. Not for sale or resale.
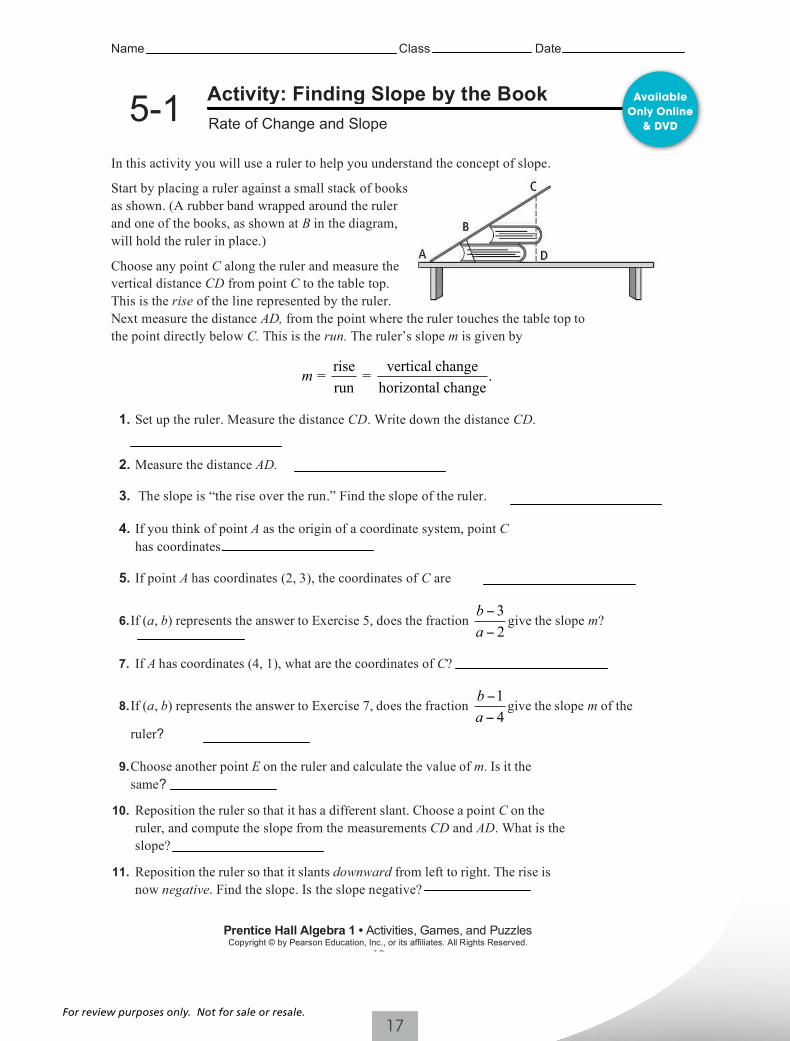
In this activity you will use a ruler to help you understand the concept of slope.
Start by placing a ruler against a small stack of books as shown. (A rubber band wrapped around the ruler and one of the books, as shown at B in the diagram, will hold the ruler in place.)
Choose any point C along the ruler and measure thevertical distance CD from point C to the table top.This is the rise of the line represented by the ruler.Next measure the distance AD, from the point where the ruler touches the table top tothe point directly below C. This is the run. The ruler’s slope m is given by
rise vertical change = = .run horizontal change
m
1. Set up the ruler. Measure the distance CD. Write down the distance CD.
2. Measure the distance AD.
3. The slope is “the rise over the run.” Find the slope of the ruler.
4. If you think of point A as the origin of a coordinate system, point Chas coordinates.
5. If point A has coordinates (2, 3), the coordinates of C are
6.If (a, b) represents the answer to Exercise 5, does the fraction 32
ba
give the slope m?
7. If A has coordinates (4, 1), what are the coordinates of C?
8. If (a, b) represents the answer to Exercise 7, does the fraction 14
ba
give the slope m of the
ruler?
9. Choose another point E on the ruler and calculate the value of m. Is it the same?
10. Reposition the ruler so that it has a different slant. Choose a point C on the ruler, and compute the slope from the measurements CD and AD. What is the slope?
11. Reposition the ruler so that it slants downward from left to right. The rise isnow negative. Find the slope. Is the slope negative?
Prentice Hall Algebra 1 • Activities, Games, and PuzzlesCopyright © by Pearson Education, Inc., or its affiliates. All Rights Reserved.
42
Name Class Date
Activity: Finding Slope by the Book5-1 Rate of Change and Slope
Available Only Online
& DVD
17For review purposes only. Not for sale or resale.
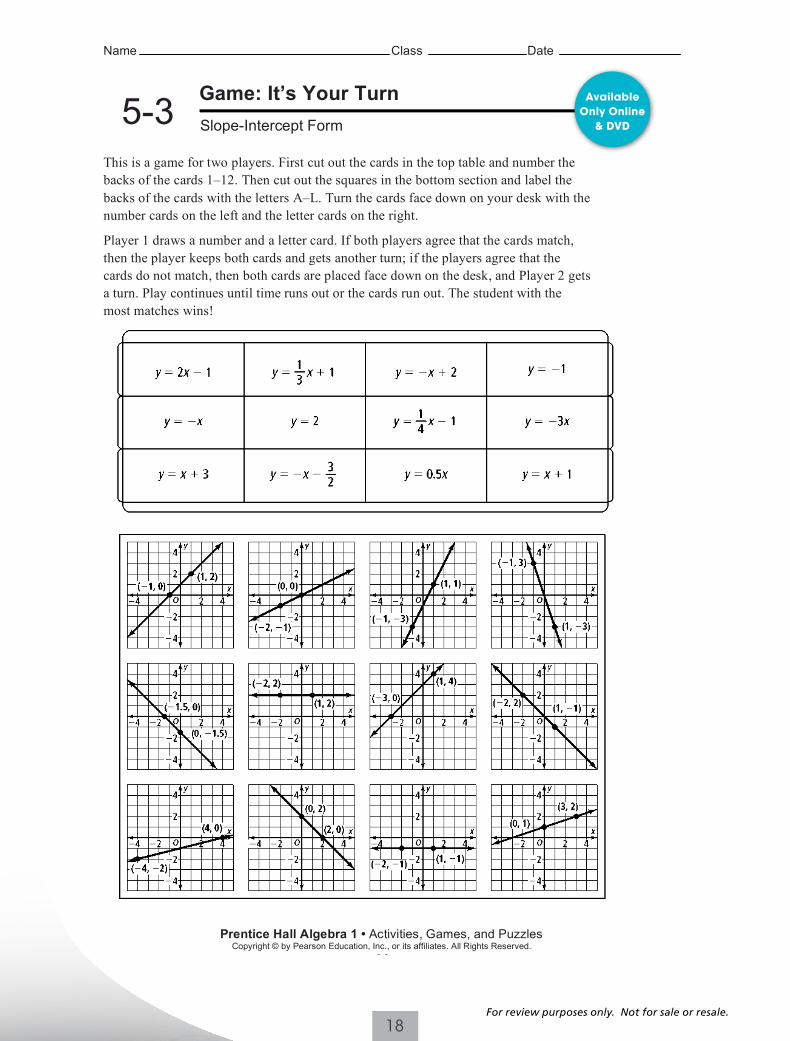
This is a game for two players. First cut out the cards in the top table and number the backs of the cards 1–12. Then cut out the squares in the bottom section and label the backs of the cards with the letters A–L. Turn the cards face down on your desk with the number cards on the left and the letter cards on the right.
Player 1 draws a number and a letter card. If both players agree that the cards match, then the player keeps both cards and gets another turn; if the players agree that the cards do not match, then both cards are placed face down on the desk, and Player 2 gets a turn. Play continues until time runs out or the cards run out. The student with the most matches wins!
Prentice Hall Algebra 1 • Activities, Games, and PuzzlesCopyright © by Pearson Education, Inc., or its affiliates. All Rights Reserved.
44
Name Class Date
Game: It’s Your Turn5-3 Slope-Intercept Form
Available Only Online
& DVD
18For review purposes only. Not for sale or resale.
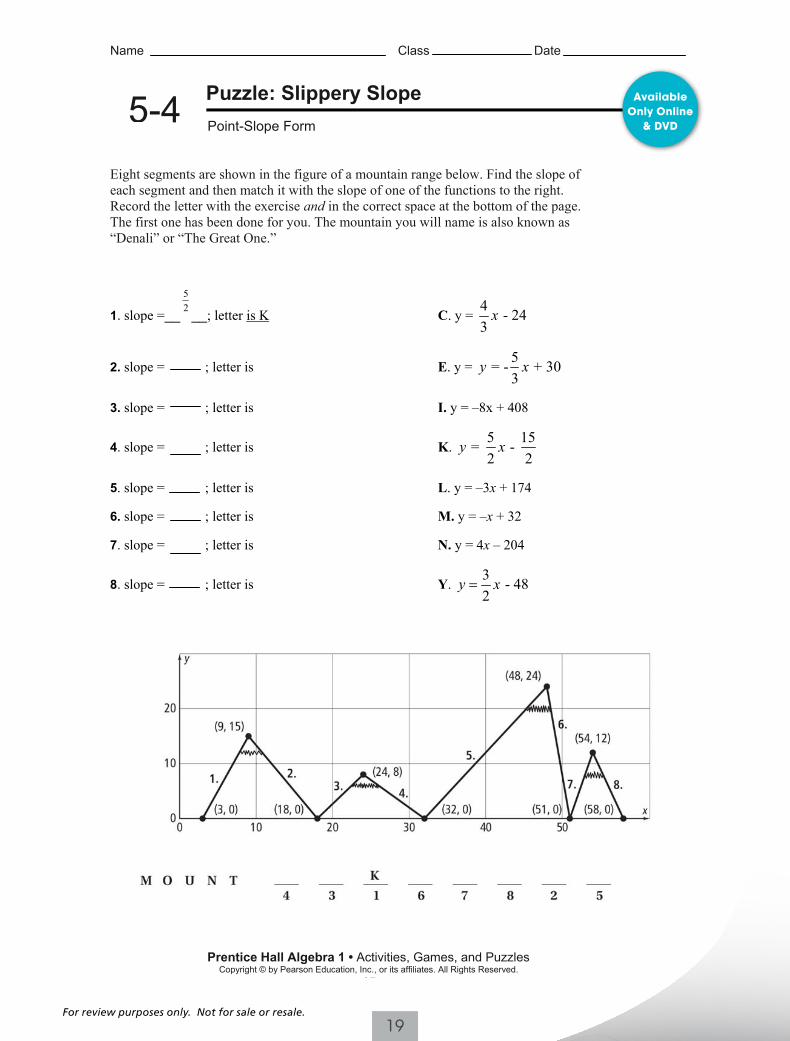
Eight segments are shown in the figure of a mountain range below. Find the slope of each segment and then match it with the slope of one of the functions to the right. Record the letter with the exercise and in the correct space at the bottom of the page. The first one has been done for you. The mountain you will name is also known as “Denali” or “The Great One.”
1. slope =__52 __; letter is K C. y =
4 - 243
x
2. slope = ; letter is E. y = 5= - + 303
y x
3. slope = ; letter is I. y = –8x + 408
4. slope = ; letter is K.5 1= - 2 2
y x 5
5. slope = ; letter is L. y = –3x + 174
6. slope = ; letter is M. y = –x + 32
7. slope = ; letter is N. y = 4x – 204
8. slope = ; letter is Y.3 - 482
y x=
Name Class Date
Puzzle: Slippery Slope5-4 Point-Slope Form
Prentice Hall Algebra 1 • Activities, Games, and PuzzlesCopyright © by Pearson Education, Inc., or its affiliates. All Rights Reserved.
45
Available Only Online
& DVD
19For review purposes only. Not for sale or resale.
Name Class Date
5-4 EnrichmentPoint-Slope Form
Point-slope form can be used to quickly write the equation of a line when given one point on the line and the slope of the line. If two points are given, there is an additional step of determining the slope between those two points.
There are special cases for which the equation of a line can be written quickly.
1. Write an equation in point-slope form for the line with slope m that has x-intercept (a, 0).
2. Write an equation in point-slope form for the line with slope m that has y-intercept (0, b).
3. Use your result from Exercise 1 to write an equation in point-slope form for the line with slope 3 that has x-intercept (–1, 0).
4. Use your result from Exercise 2 to write an equation in point-slope form for the line with slope –4 that has y-intercept (0, 2).
5. A line has x-intercept (a, 0) and y-intercept (0, b).a. Write an equation in point-slope form for the line using the x-intercept.
b. Write an equation in point-slope form for the line using the y-intercept.
c. Show that the equations you wrote in parts (a) and (b) are equivalent.
Prentice Hall Algebra 1 • Teaching ResourcesCopyright © by Pearson Education, Inc., or its affiliates. All Rights Reserved.
38
20For review purposes only. Not for sale or resale.
21For review purposes only. Not for sale or resale.
22For review purposes only. Not for sale or resale.
Name Class Date
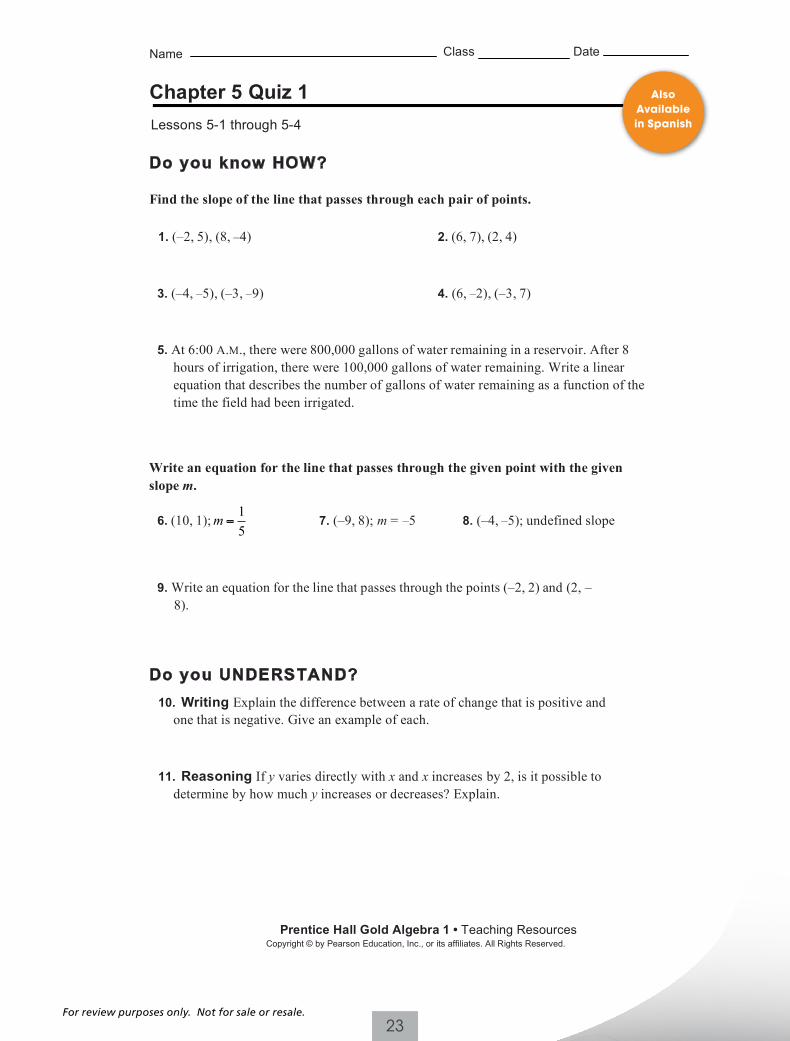
Chapter 5 Quiz 1 Form G
Do you know HOW?
Find the slope of the line that passes through each pair of points.
1. (–2, 5), (8, –4) 2. (6, 7), (2, 4)
3. (–4, –5), (–3, –9) 4. (6, –2), (–3, 7)
5. At 6:00 A.M., there were 800,000 gallons of water remaining in a reservoir. After 8 hours of irrigation, there were 100,000 gallons of water remaining. Write a linear equation that describes the number of gallons of water remaining as a function of the time the field had been irrigated.
Write an equation for the line that passes through the given point with the given slope m.
6. (10, 1);15
m = 7. (–9, 8); m = –5 8. (–4, –5); undefined slope
9. Write an equation for the line that passes through the points (–2, 2) and (2, –8).
Do you UNDERSTAND?10. Writing Explain the difference between a rate of change that is positive and
one that is negative. Give an example of each.
11. Reasoning If y varies directly with x and x increases by 2, is it possible to determine by how much y increases or decreases? Explain.
Prentice Hall Gold Algebra 1 • Teaching ResourcesCopyright © by Pearson Education, Inc., or its affiliates. All Rights Reserved.
81
Lessons 5-1 through 5-4
Also Available in Spanish
23For review purposes only. Not for sale or resale.
Name Class Date
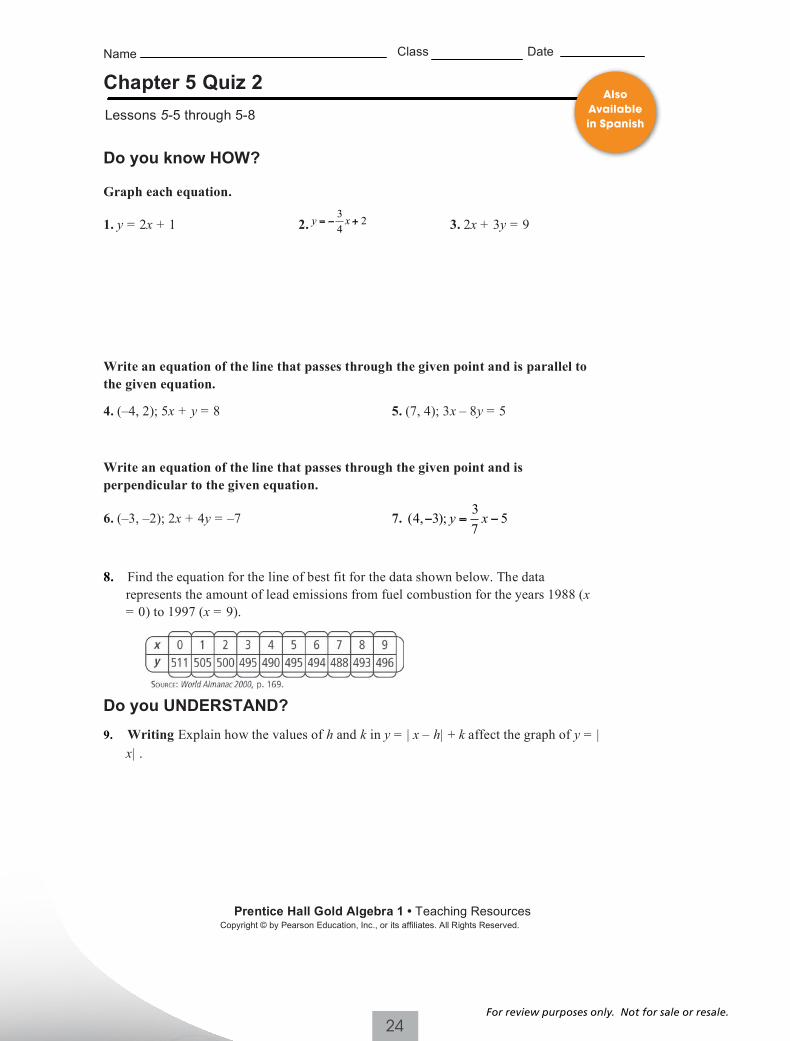
Chapter 5 Quiz 2 Form G
Do you know HOW?
Graph each equation.
1. y = 2x + 1 2.3 24
y x= + 3. 2x + 3y = 9
Write an equation of the line that passes through the given point and is parallel to the given equation.
4. (–4, 2); 5x + y = 8 5. (7, 4); 3x – 8y = 5
Write an equation of the line that passes through the given point and is perpendicular to the given equation.
6. (–3, –2); 2x + 4y = –7 7. (4, 3); y =37
x 5
8. Find the equation for the line of best fit for the data shown below. The data represents the amount of lead emissions from fuel combustion for the years 1988 (x= 0) to 1997 (x = 9).
Do you UNDERSTAND?9. Writing Explain how the values of h and k in y = | x – h| + k affect the graph of y = |
x| .
Prentice Hall Gold Algebra 1 • Teaching ResourcesCopyright © by Pearson Education, Inc., or its affiliates. All Rights Reserved.
8282
Lessons 5-5 through 5-8Also
Available in Spanish
24For review purposes only. Not for sale or resale.
Name Class Date
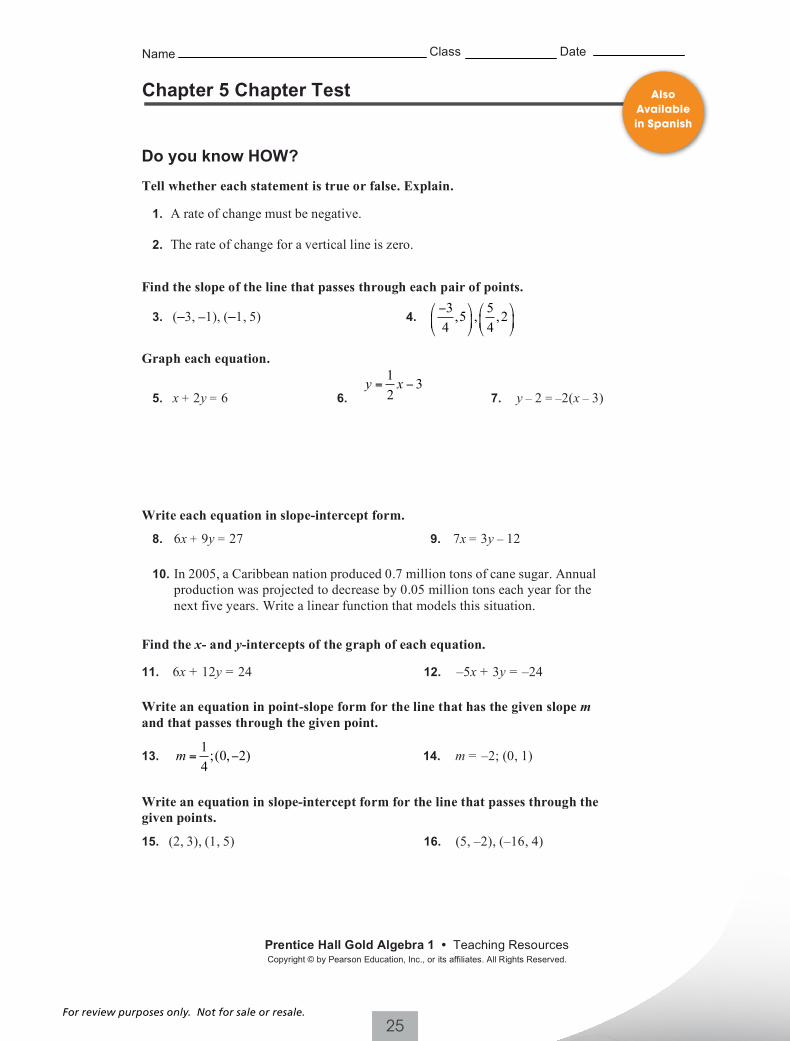
Chapter 5 Chapter Test Form G
Do you know HOW?
Tell whether each statement is true or false. Explain.
1. A rate of change must be negative.
2. The rate of change for a vertical line is zero.
Find the slope of the line that passes through each pair of points.
3. (–3, –1), (–1, 5) 4. 3 5,5 , ,2
4 4
Graph each equation.
5. x + 2y = 6 6.
1 32
y x= 7. y – 2 = –2(x – 3)
Write each equation in slope-intercept form.
8. 6x + 9y = 27 9. 7x = 3y – 12
10. In 2005, a Caribbean nation produced 0.7 million tons of cane sugar. Annual production was projected to decrease by 0.05 million tons each year for the next five years. Write a linear function that models this situation.
Find the x- and y-intercepts of the graph of each equation.
11. 6x + 12y = 24 12. –5x + 3y = –24
Write an equation in point-slope form for the line that has the given slope mand that passes through the given point.
13. 1 ;(0, 2)4
m = 14. m = –2; (0, 1)
Write an equation in slope-intercept form for the line that passes through the given points.
15. (2, 3), (1, 5) 16. (5, –2), (–16, 4)
Prentice Hall Gold Algebra 1 • Teaching ResourcesCopyright © by Pearson Education, Inc., or its affiliates. All Rights Reserved.
83
Also Available in Spanish
25For review purposes only. Not for sale or resale.
Name Class Date
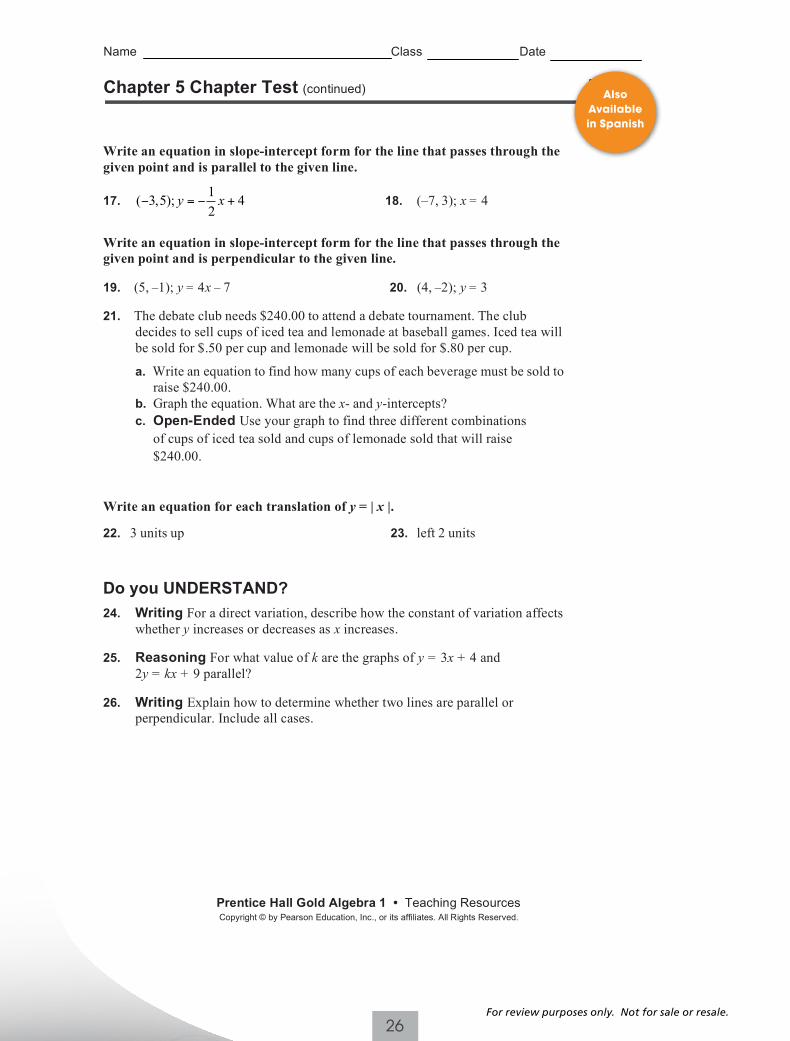
Chapter 5 Chapter Test (continued) Form G
Write an equation in slope-intercept form for the line that passes through the given point and is parallel to the given line.
17. 1( 3,5); 42
y x= + 18. (–7, 3); x = 4
Write an equation in slope-intercept form for the line that passes through the given point and is perpendicular to the given line.
19. (5, –1); y = 4x – 7 20. (4, –2); y = 3
21. The debate club needs $240.00 to attend a debate tournament. The club decides to sell cups of iced tea and lemonade at baseball games. Iced tea will be sold for $.50 per cup and lemonade will be sold for $.80 per cup.
a. Write an equation to find how many cups of each beverage must be sold toraise $240.00.
b. Graph the equation. What are the x- and y-intercepts?c. Open-Ended Use your graph to find three different combinations
of cups of iced tea sold and cups of lemonade sold that will raise $240.00.
Write an equation for each translation of y = | x |.
22. 3 units up 23. left 2 units
Do you UNDERSTAND?24. Writing For a direct variation, describe how the constant of variation affects
whether y increases or decreases as x increases.
25. Reasoning For what value of k are the graphs of y = 3x + 4 and 2y = kx + 9 parallel?
26. Writing Explain how to determine whether two lines are parallel or perpendicular. Include all cases.
Prentice Hall Gold Algebra 1 • Teaching ResourcesCopyright © by Pearson Education, Inc., or its affiliates. All Rights Reserved.
84
Also Available in Spanish
26For review purposes only. Not for sale or resale.
Prentice Hall Algebra 1 • Find the Errors!Copyright © by Pearson Education, Inc., or its affiliates. All Rights Reserved.
25
Name Class Date
For each exercise, identify the error(s) in planning the solution or solving the problem. Th en write the correct solution.
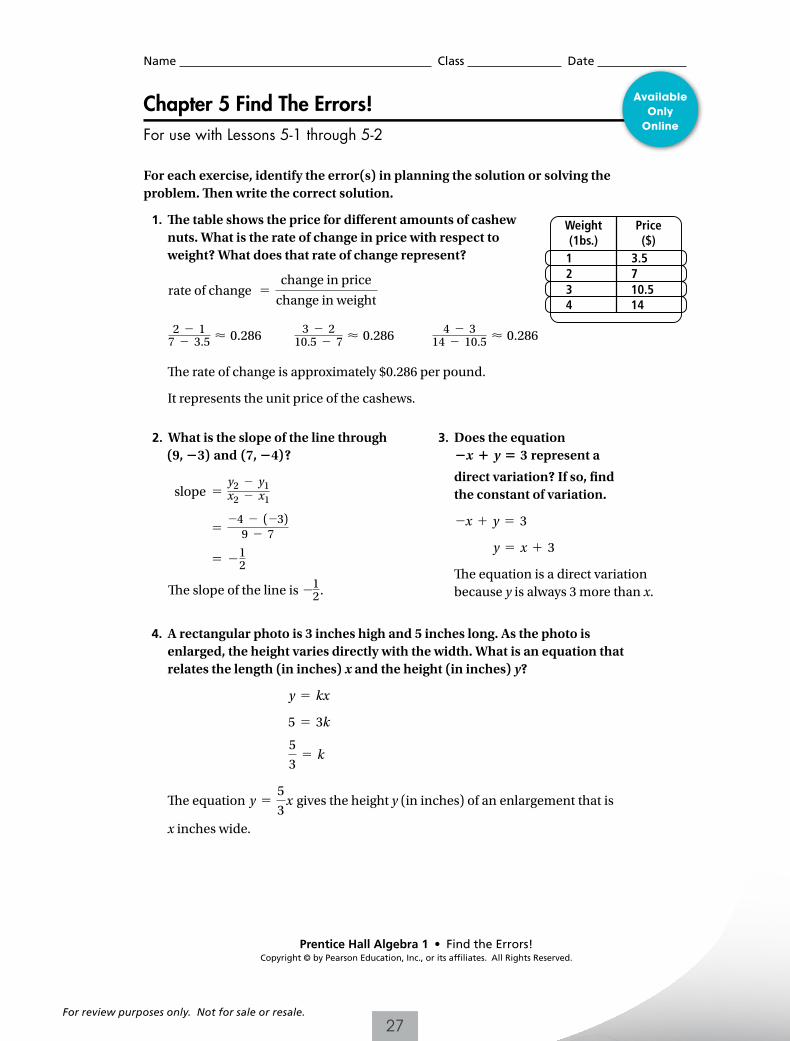
1. Th e table shows the price for diff erent amounts of cashew nuts. What is the rate of change in price with respect to weight? What does that rate of change represent?
rate of change 5change in price
change in weight
2 2 17 2 3.5 < 0.286 3 2 2
10.5 2 7 < 0.286 4 2 314 2 10.5 < 0.286
Th e rate of change is approximately $0.286 per pound.
It represents the unit price of the cashews.
2. What is the slope of the line through (9, 23) and (7, 24)?
slope 5y2 2 y1x2 2 x1
524 2 (23)
9 2 7
5 2 12
Th e slope of the line is 212.
3. Does the equation 2x 1 y 5 3 represent a
direct variation? If so, fi nd the constant of variation.
2x 1 y 5 3
y 5 x 1 3
Th e equation is a direct variation because y is always 3 more than x.
4. A rectangular photo is 3 inches high and 5 inches long. As the photo is enlarged, the height varies directly with the width. What is an equation that relates the length (in inches) x and the height (in inches) y?
y 5 kx
5 5 3k
5
35 k
Th e equation y 55
3 x gives the height y (in inches) of an enlargement that is
x inches wide.
Chapter 5 Find The Errors!For use with Lessons 5-1 through 5-2
1234
3.5710.514
Weight(1bs.)
Price($)
Available Only
Online
27For review purposes only. Not for sale or resale.
Prentice Hall Algebra 1 • Find the Errors!Copyright © by Pearson Education, Inc., or its affiliates. All Rights Reserved.
27
Name Class Date
Chapter 5 Find The Errors!For use with Lessons 5-3 through 5-5
For each exercise, identify the error(s) in planning the solution or solving the problem. Th en write the correct solution.
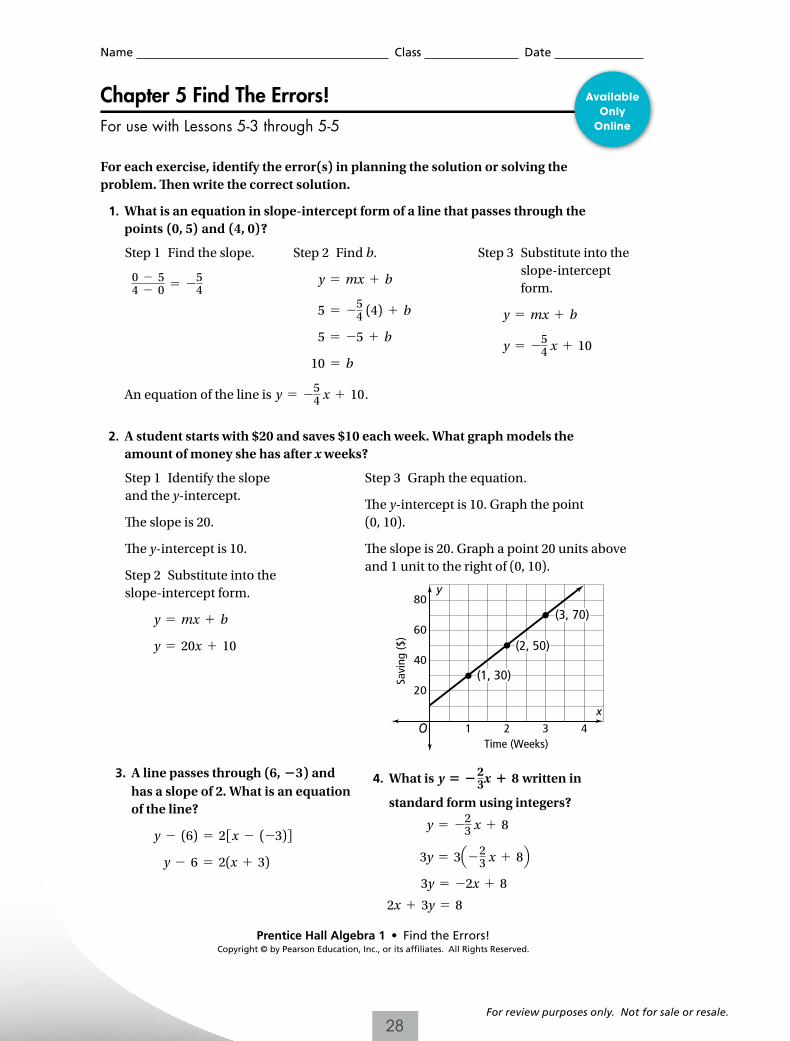
1. What is an equation in slope-intercept form of a line that passes through the points (0, 5) and (4, 0)?
Step 1 Find the slope.
0 2 54 2 0 5 2
54
Step 2 Find b.
y 5 mx 1 b
5 5 254 (4) 1 b
5 5 25 1 b
10 5 b
Step 3 Substitute into the slope-intercept form.
y 5 mx 1 b
y 5 254 x 1 10
An equation of the line is y 5 254 x 1 10.
2. A student starts with $20 and saves $10 each week. What graph models the amount of money she has after x weeks?
Step 1 Identify the slope and the y-intercept.
Th e slope is 20.
Th e y-intercept is 10.
Step 2 Substitute into the slope-intercept form.
y 5 mx 1 b
y 5 20x 1 10
Step 3 Graph the equation.
Th e y-intercept is 10. Graph the point (0, 10).
Th e slope is 20. Graph a point 20 units above and 1 unit to the right of (0, 10).
3. A line passes through (6, 23) and has a slope of 2. What is an equation of the line?
y 2 (6) 5 2fx 2 (23)g
y 2 6 5 2(x 1 3)
4. What is y 5 2 23x 1 8 written in
standard form using integers?
y 5 223 x 1 8
3y 5 3Q2 23 x 1 8R
3y 5 22x 1 8
2x 1 3y 5 8
O
80
60
40
20
1 2 3 4
Savi
ng ($
)
(1, 30)
(2, 50)
(3, 70)
Time (Weeks)
x
y
Available Only
Online
28For review purposes only. Not for sale or resale.
Prentice Hall Algebra 1 • Find the Errors!Copyright © by Pearson Education, Inc., or its affiliates. All Rights Reserved.
29
Name Class Date
Chapter 5 Find The Errors!For use with Lessons 5-6 through 5-8
For each exercise, identify the error(s) in planning the solution or solving the problem. Th en write the correct solution.
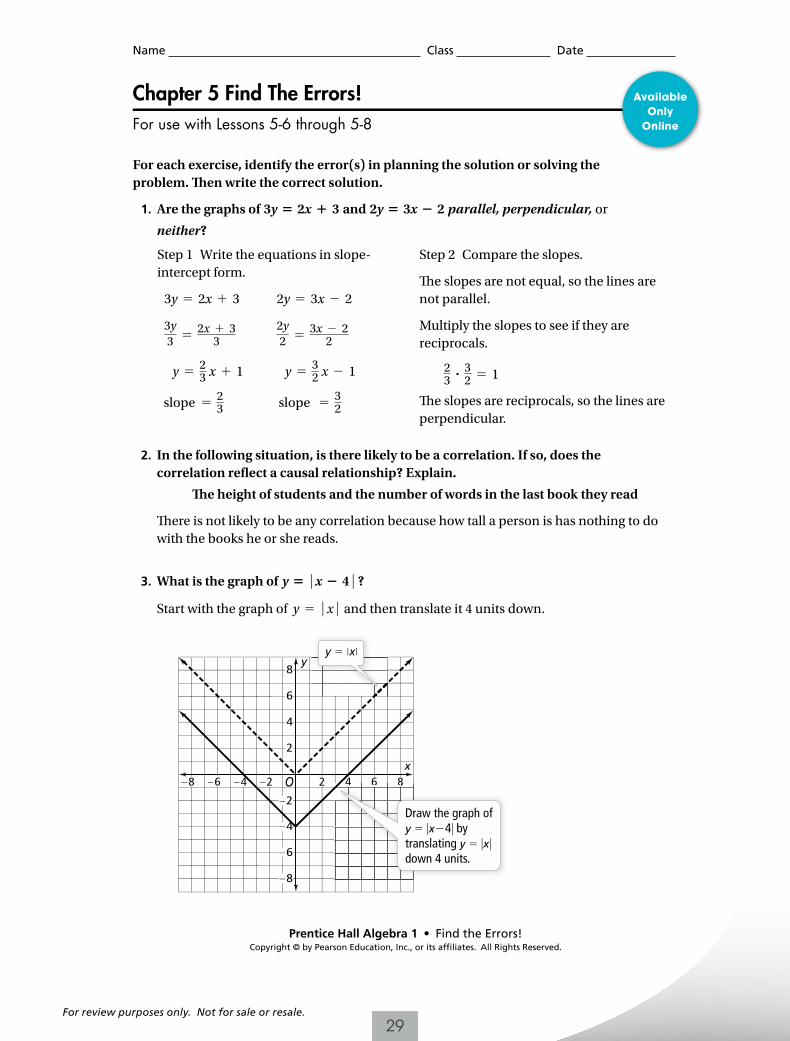
1. Are the graphs of 3y 5 2x 1 3 and 2y 5 3x 2 2 parallel, perpendicular, or
neither?
Step 1 Write the equations in slope-intercept form.
3y 5 2x 1 3 2y 5 3x 2 2
3y3 5
2x 1 33
2y2 5
3x 2 22
y 5 23 x 1 1 y 5 3
2 x 2 1
slope 5 23 slope 5 3
2
Step 2 Compare the slopes.
Th e slopes are not equal, so the lines are not parallel.
Multiply the slopes to see if they are reciprocals.
23 ?
32 5 1
Th e slopes are reciprocals, so the lines are perpendicular.
2. In the following situation, is there likely to be a correlation. If so, does the correlation refl ect a causal relationship? Explain.
Th e height of students and the number of words in the last book they read
Th ere is not likely to be any correlation because how tall a person is has nothing to do with the books he or she reads.
3. What is the graph of y 5 u x 2 4 u ?
Start with the graph of y 5 u x u and then translate it 4 units down.
y
xO 2 4 6 8
8
6
4
2
2
4
6
8
44 6 88
Draw the graph ofy x 4 bytranslating y xdown 4 units.
y x
2468
Available Only
Online
29For review purposes only. Not for sale or resale.
Prentice Hall Algebra 1 • Teaching ResourcesCopyright © by Pearson Education, Inc., or its affiliates. All Rights Reserved.
89
Name Class Date
Performance TasksChapter 5
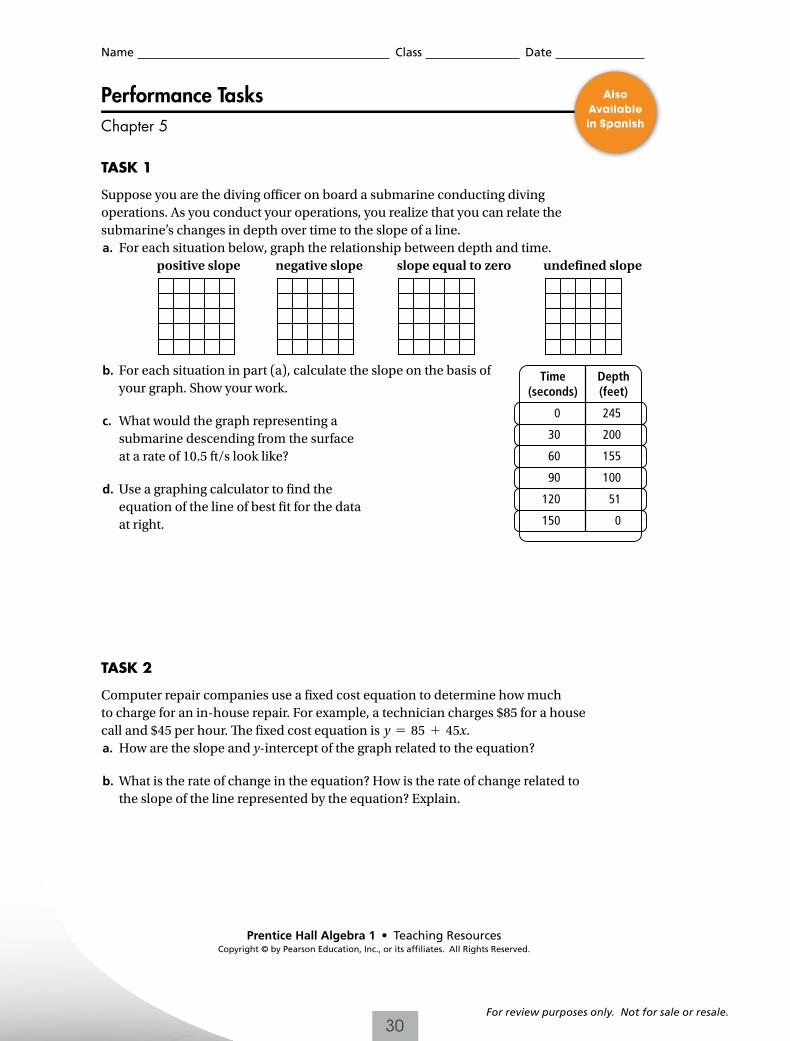
TASK 1
Suppose you are the diving offi cer on board a submarine conducting diving operations. As you conduct your operations, you realize that you can relate the submarine’s changes in depth over time to the slope of a line. a. For each situation below, graph the relationship between depth and time. positive slope negative slope slope equal to zero undefi ned slope
b. For each situation in part (a), calculate the slope on the basis of your graph. Show your work.
c. What would the graph representing a submarine descending from the surface at a rate of 10.5 ft/s look like?
d. Use a graphing calculator to fi nd the equation of the line of best fi t for the data at right.
TASK 2
Computer repair companies use a fi xed cost equation to determine how much to charge for an in-house repair. For example, a technician charges $85 for a house call and $45 per hour. Th e fi xed cost equation is y 5 85 1 45x. a. How are the slope and y-intercept of the graph related to the equation?
b. What is the rate of change in the equation? How is the rate of change related to the slope of the line represented by the equation? Explain.
Time(seconds)
0
30
60
90
120
150
245
200
155
100
51
0
Depth(feet)
Also Available in Spanish
30For review purposes only. Not for sale or resale.
Prentice Hall Algebra 1 • Teaching ResourcesCopyright © by Pearson Education, Inc., or its affiliates. All Rights Reserved.
90
Name Class Date
Performance Tasks (continued)
Chapter 5
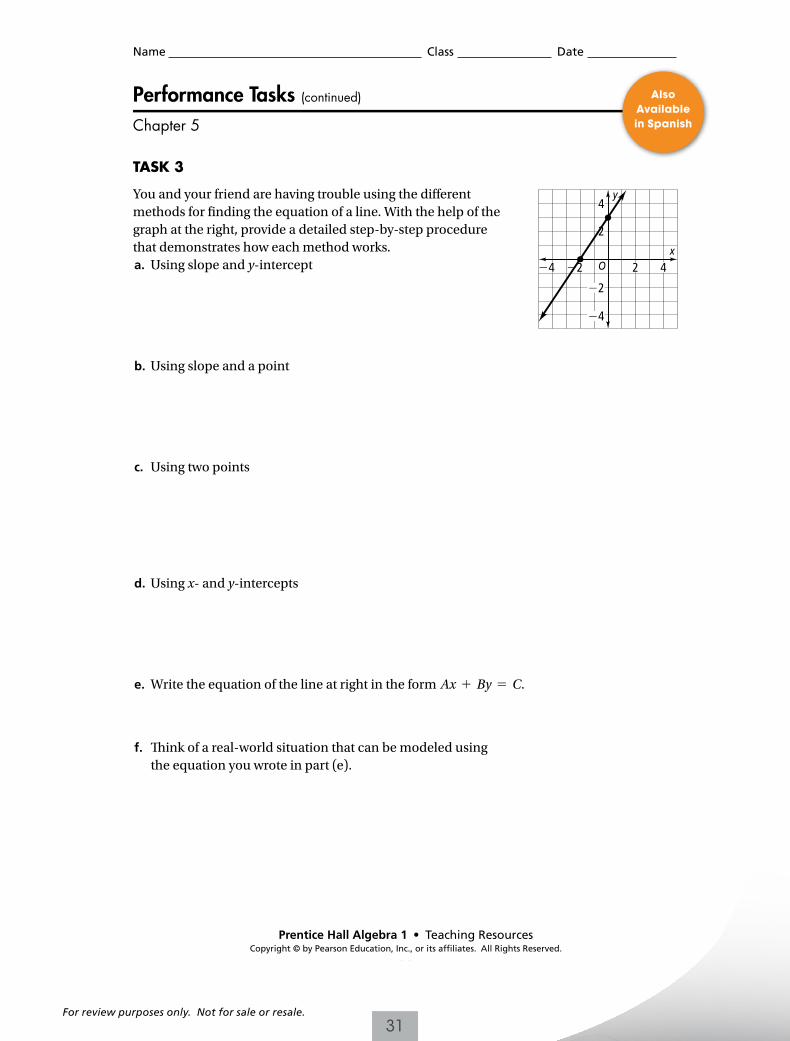
TASK 3
You and your friend are having trouble using the diff erent methods for fi nding the equation of a line. With the help of the graph at the right, provide a detailed step-by-step procedure that demonstrates how each method works. a. Using slope and y-intercept
b. Using slope and a point
c. Using two points
d. Using x- and y-intercepts
e. Write the equation of the line at right in the form Ax 1 By 5 C.
f. Th ink of a real-world situation that can be modeled using the equation you wrote in part (e).
xO
y4
2
2
4
2
4 42
Also Available in Spanish
31For review purposes only. Not for sale or resale.
Name Class Date
Extra PracticeChapter 5
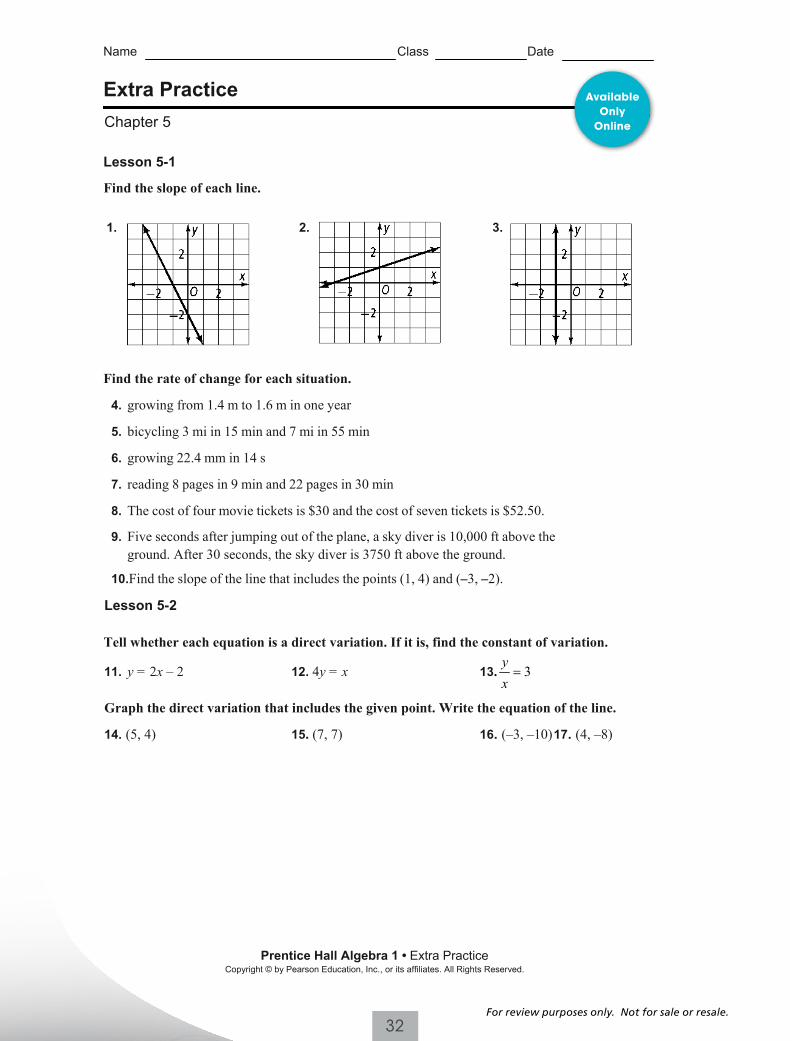
Lesson 5-1
Find the slope of each line.
1. 2. 3.
Find the rate of change for each situation.
4. growing from 1.4 m to 1.6 m in one year
5. bicycling 3 mi in 15 min and 7 mi in 55 min
6. growing 22.4 mm in 14 s
7. reading 8 pages in 9 min and 22 pages in 30 min
8. The cost of four movie tickets is $30 and the cost of seven tickets is $52.50.
9. Five seconds after jumping out of the plane, a sky diver is 10,000 ft above theground. After 30 seconds, the sky diver is 3750 ft above the ground.
10.Find the slope of the line that includes the points (1, 4) and (–3, –2).
Lesson 5-2
Tell whether each equation is a direct variation. If it is, find the constant of variation.
11. y = 2x – 2 12. 4y = x 13. 3yx=
Graph the direct variation that includes the given point. Write the equation of the line.
14. (5, 4) 15. (7, 7) 16. (–3, –10)17. (4, –8)
Prentice Hall Algebra 1 • Extra PracticeCopyright © by Pearson Education, Inc., or its affiliates. All Rights Reserved.
17
Available Only
Online
32For review purposes only. Not for sale or resale.
Name Class Date
Extra Practice (continued)
Chapter 5
Write a direct variation to model each situation. Then answer the question.
18. After 30 minutes, a car moving at a constant speed has traveled 25 miles. Moving at thesame speed, how far will it travel in 140 minutes?
19. What is the perimeter of a square with side length 13.4 inches?
Lesson 5-3
Find the slope and y-intercept.
20. y = 6x + 8 21. 3x + 4y = –24 22. 2y = 8
23.3 8
4y x−= − 24. 2y= 3x –1 25. 4x – 5y = 2
A line passes through the given points. Write an equation for the line in slope-intercept form.
26. (–2, 4) and (3, 9) 27. (1, 6) and (9, –4) 28. (0, –7) and (–1, 0)
29. (7, 0) and (3, –4) 30. (0, 0) and (–7, 1) 31. (10, 0) and (0, 7)
Graph each equation.
32. y = 2x – 3 33. y = 23
x – 4
Write an equation in slope-intercept form for each situation.
34. A skateboard ramp is 5 ft high and 12 ft long from end to end.
35. An airplane with no fuel weighs 2575 lbs. Each gallon of gasoline added to the fuel tanks weighs 6 lbs.
Lessons 5-4 and 5-5
Write an equation in point-slope form for the line through the given point with the given slope.
36. (4, 6); m = –5 37. (3, –1); m = 1 38. (8, 5); m = 12
Prentice Hall Algebra 1 • Extra PracticeCopyright © by Pearson Education, Inc., or its affiliates. All Rights Reserved.
18
Available Only
Online
33For review purposes only. Not for sale or resale.
Name Class Date
Extra Practice (continued)
Chapter 5
Find the x- and y-intercepts for each equation.
39. y = –7x 40. y = 12
x + 3 41. –2y = 5x – 12
Graph each equation.
42. x + 4y = 8 43. y – 5 = –2(x + 1) 44. x + 3 = 0
45. 4x – 3y = 12 46. y = –1 47. y + 1 = – 12
(x + 2)
Write an equation in point-slope form for each situation.
48. A train travels at a rate of 70 mi/h. Two hours after leaving the station it is 210 miles from its destination.
49. An escalator has a slope of 34
. After traveling forward 32 feet, the escalator is 24 feet
above the floor.
Write an equation in standard form for each situation.
50. Juan can ride his bike at 12 mi/h and walk at 4 mi/h. Write an equation that relates the amount of time he can spend riding or walking combined, to travel 20 miles.
51. You have $25 to buy supplies for a class party. Juice costs $3 per bottle andchips cost $2 per bag. Write an equation that relates the amount of juice and chips you can buy using $25.
Lesson 5-6
Write an equation in standard form that satisfies the given conditions.
52. parallel to y = 4x + 1, 53. perpendicular to y = –x – 3, through (–3, 5) through (0, 0)
Prentice Hall Algebra 1 • Extra PracticeCopyright © by Pearson Education, Inc., or its affiliates. All Rights Reserved.
19
Available Only
Online
34For review purposes only. Not for sale or resale.
Name Class Date
Extra Practice (continued)
Chapter 5
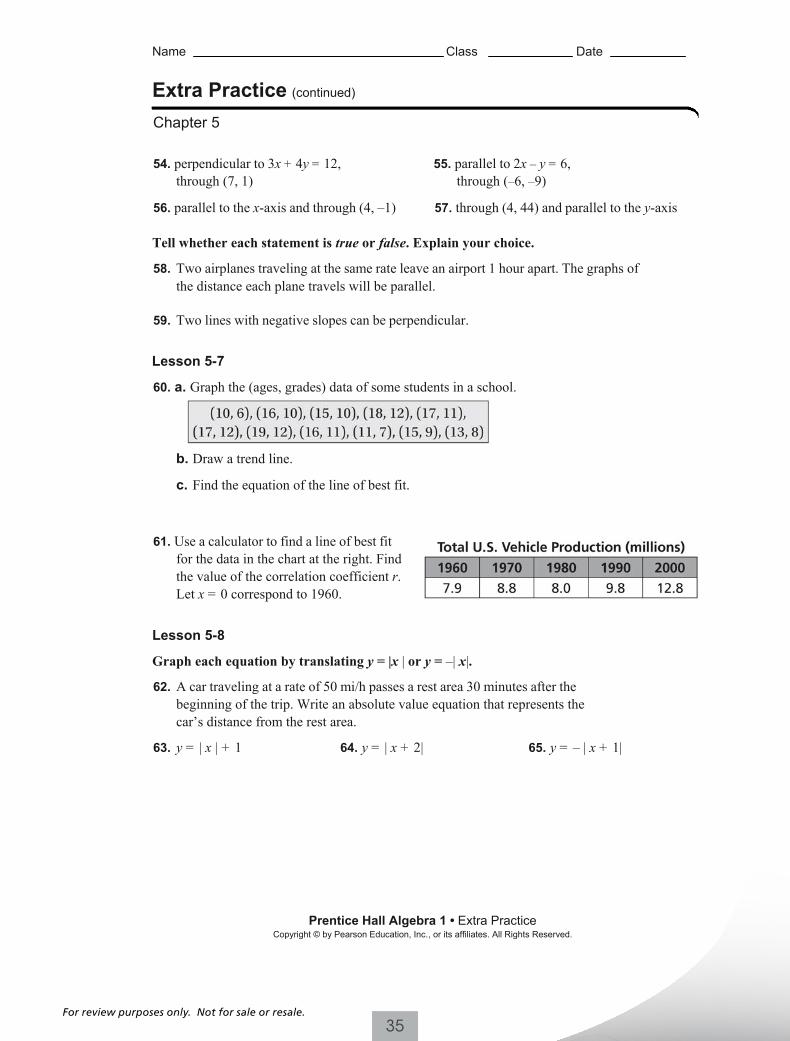
54. perpendicular to 3x + 4y = 12, 55. parallel to 2x – y = 6,through (7, 1) through (–6, –9)
56. parallel to the x-axis and through (4, –1) 57. through (4, 44) and parallel to the y-axis
Tell whether each statement is true or false. Explain your choice.
58. Two airplanes traveling at the same rate leave an airport 1 hour apart. The graphs of the distance each plane travels will be parallel.
59. Two lines with negative slopes can be perpendicular.
Lesson 5-7
60. a. Graph the (ages, grades) data of some students in a school.
b. Draw a trend line.
c. Find the equation of the line of best fit.
61. Use a calculator to find a line of best fitfor the data in the chart at the right. Find the value of the correlation coefficient r.Let x = 0 correspond to 1960.
Lesson 5-8
Graph each equation by translating y = |x | or y = –| x|.
62. A car traveling at a rate of 50 mi/h passes a rest area 30 minutes after thebeginning of the trip. Write an absolute value equation that represents the car’s distance from the rest area.
63. y = | x | + 1 64. y = | x + 2| 65. y = – | x + 1|
Prentice Hall Algebra 1 • Extra PracticeCopyright © by Pearson Education, Inc., or its affiliates. All Rights Reserved.
20
35For review purposes only. Not for sale or resale.
Prentice Hall Algebra 1 • Teaching ResourcesCopyright © by Pearson Education, Inc., or its affiliates. All Rights Reserved.
94
Name Class Date
Chapter 5 Project: The Choice Is Yours
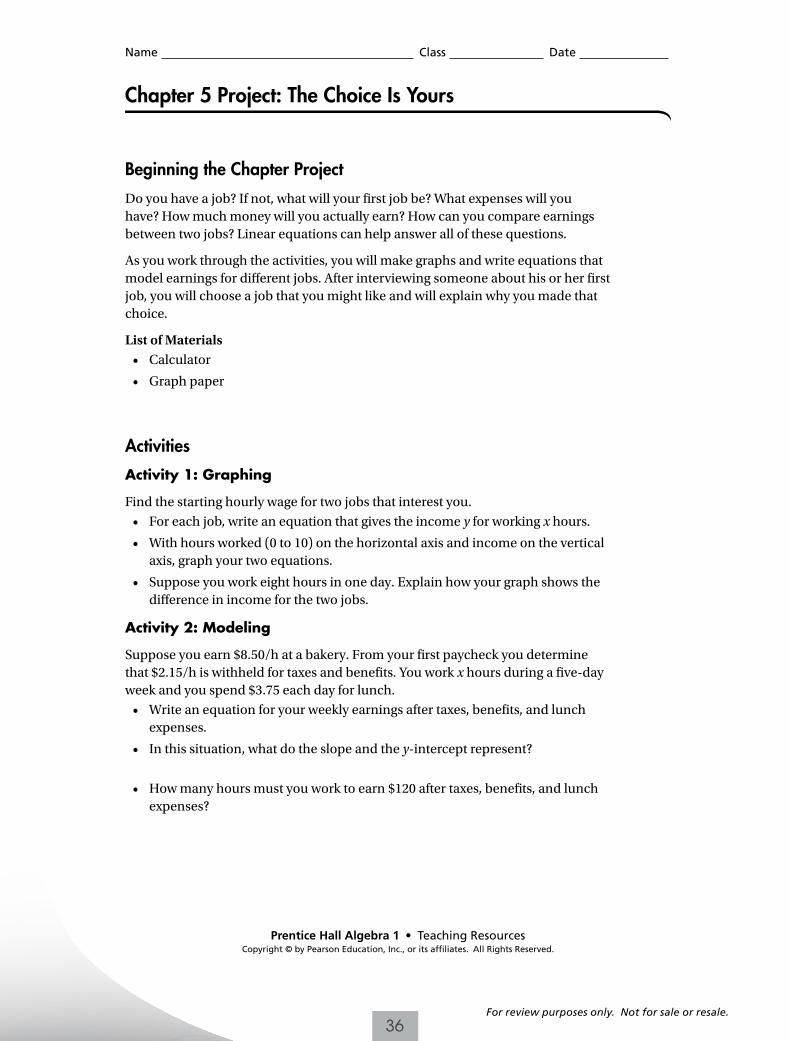
Beginning the Chapter Project
Do you have a job? If not, what will your fi rst job be? What expenses will you have? How much money will you actually earn? How can you compare earnings between two jobs? Linear equations can help answer all of these questions.
As you work through the activities, you will make graphs and write equations that model earnings for diff erent jobs. After interviewing someone about his or her fi rst job, you will choose a job that you might like and will explain why you made that choice.
List of Materials• Calculator
• Graph paper
Activities
Activity 1: Graphing
Find the starting hourly wage for two jobs that interest you.
• For each job, write an equation that gives the income y for working x hours.
• With hours worked (0 to 10) on the horizontal axis and income on the vertical axis, graph your two equations.
• Suppose you work eight hours in one day. Explain how your graph shows the diff erence in income for the two jobs.
Activity 2: Modeling
Suppose you earn $8.50/h at a bakery. From your fi rst paycheck you determine that $2.15/h is withheld for taxes and benefi ts. You work x hours during a fi ve-day week and you spend $3.75 each day for lunch.
• Write an equation for your weekly earnings after taxes, benefi ts, and lunch expenses.
• In this situation, what do the slope and the y-intercept represent?
• How many hours must you work to earn $120 after taxes, benefi ts, and lunch expenses?
36For review purposes only. Not for sale or resale.
Prentice Hall Algebra 1 • Teaching ResourcesCopyright © by Pearson Education, Inc., or its affiliates. All Rights Reserved.
94
Name Class Date
Chapter 5 Project: The Choice Is Yours
Beginning the Chapter Project
Do you have a job? If not, what will your fi rst job be? What expenses will you have? How much money will you actually earn? How can you compare earnings between two jobs? Linear equations can help answer all of these questions.
As you work through the activities, you will make graphs and write equations that model earnings for diff erent jobs. After interviewing someone about his or her fi rst job, you will choose a job that you might like and will explain why you made that choice.
List of Materials• Calculator
• Graph paper
Activities
Activity 1: Graphing
Find the starting hourly wage for two jobs that interest you.
• For each job, write an equation that gives the income y for working x hours.
• With hours worked (0 to 10) on the horizontal axis and income on the vertical axis, graph your two equations.
• Suppose you work eight hours in one day. Explain how your graph shows the diff erence in income for the two jobs.
Activity 2: Modeling
Suppose you earn $8.50/h at a bakery. From your fi rst paycheck you determine that $2.15/h is withheld for taxes and benefi ts. You work x hours during a fi ve-day week and you spend $3.75 each day for lunch.
• Write an equation for your weekly earnings after taxes, benefi ts, and lunch expenses.
• In this situation, what do the slope and the y-intercept represent?
• How many hours must you work to earn $120 after taxes, benefi ts, and lunch expenses?
Prentice Hall Algebra 1 • Teaching ResourcesCopyright © by Pearson Education, Inc., or its affiliates. All Rights Reserved.
95
Name Class Date
Chapter 5 Project: The Choice Is Yours (contined)
Activity 3: Interviewing
Interview an adult about a job he or she had as a teenager. Ask about positive and negative aspects of the job, salary, and expenses. Write an equation that describes the person’s weekly earnings after expenses.
Finishing the Project
Th e answers to the three activities should help you complete your project. Work with several classmates. Share what you learned about jobs for teenagers. List positive and negative aspects of income and expenses for several jobs. On your own, organize your graphs, equations, and job information in a folder. Write a fi nal paragraph that explains what job you would like and why.
Refl ect and Revise
You should present job-comparison information in a well-organized format. Your graphs should be easy to understand. Be sure you have explained clearly how your equations model each income. Make any revisions necessary to improve your project.
Extending the Project
Some employers will only hire people with experience in the job for which they apply. You can gain experience by working independently. Find out how you might go about starting your own business. Research potential expenses and income.
37For review purposes only. Not for sale or resale.
Prentice Hall Algebra 1 • Teaching ResourcesCopyright © by Pearson Education, Inc., or its affiliates. All Rights Reserved.
91
Name Class Date
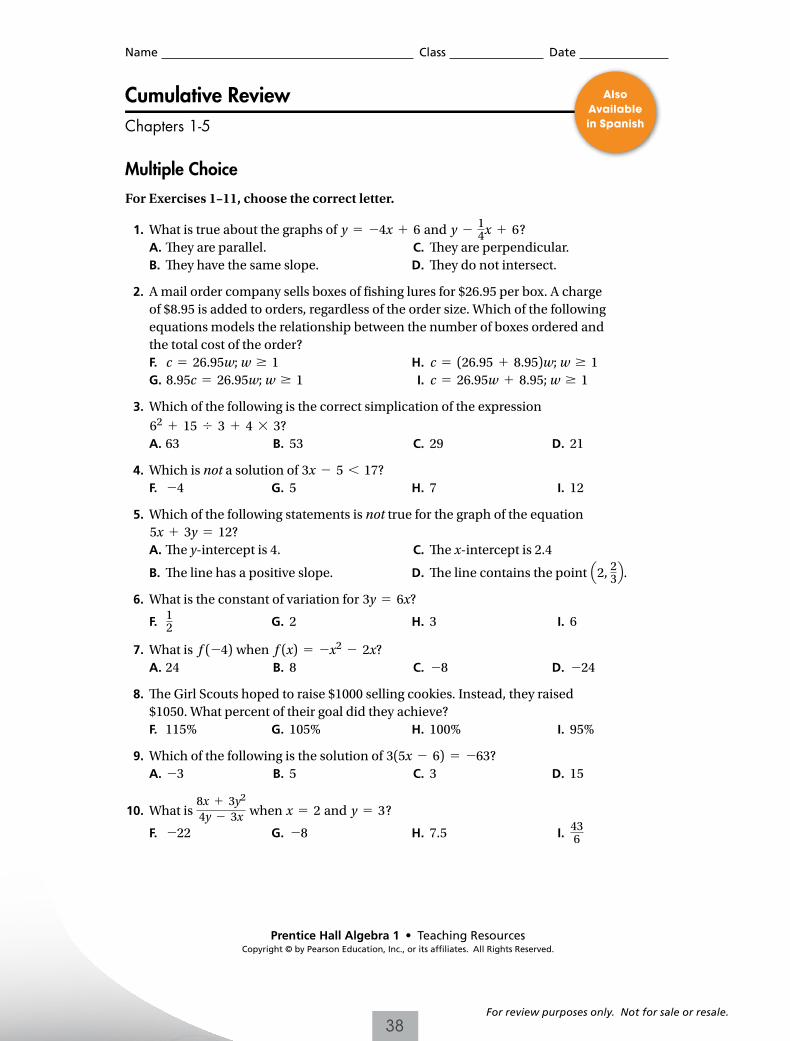
Cumulative ReviewChapters 1-5
Multiple Choice
For Exercises 1–11, choose the correct letter.
1. What is true about the graphs of y 5 24x 1 6 and y 2 14x 1 6?
A. Th ey are parallel. C. Th ey are perpendicular. B. Th ey have the same slope. D. Th ey do not intersect.
2. A mail order company sells boxes of fi shing lures for $26.95 per box. A charge of $8.95 is added to orders, regardless of the order size. Which of the following equations models the relationship between the number of boxes ordered and the total cost of the order?
F. c 5 26.95w; w $ 1 H. c 5 (26.95 1 8.95)w; w $ 1 G. 8.95c 5 26.95w; w $ 1 I. c 5 26.95w 1 8.95; w $ 1
3. Which of the following is the correct simplication of the expression
62 1 15 4 3 1 4 3 3? A. 63 B. 53 C. 29 D. 21
4. Which is not a solution of 3x 2 5 , 17? F. 24 G. 5 H. 7 I. 12
5. Which of the following statements is not true for the graph of the equation 5x 1 3y 5 12?
A. Th e y-intercept is 4. C. Th e x-intercept is 2.4
B. Th e line has a positive slope. D. Th e line contains the point Q2, 23R. 6. What is the constant of variation for 3y 5 6x?
F. 12 G. 2 H. 3 I. 6
7. What is f (24) when f (x) 5 2x2 2 2x? A. 24 B. 8 C. 28 D. 224
8. Th e Girl Scouts hoped to raise $1000 selling cookies. Instead, they raised $1050. What percent of their goal did they achieve?
F. 115% G. 105% H. 100% I. 95%
9. Which of the following is the solution of 3(5x 2 6) 5 263? A. 23 B. 5 C. 3 D. 15
10. What is 8x 1 3y2
4y 2 3x when x 5 2 and y 5 3?
F. 222 G. 28 H. 7.5 I. 436
Also Available in Spanish
38For review purposes only. Not for sale or resale.
Prentice Hall Algebra 1 • Teaching ResourcesCopyright © by Pearson Education, Inc., or its affiliates. All Rights Reserved.
91
Name Class Date
Cumulative ReviewChapters 1-5
Multiple Choice
For Exercises 1–11, choose the correct letter.
1. What is true about the graphs of y 5 24x 1 6 and y 2 14x 1 6?
A. Th ey are parallel. C. Th ey are perpendicular. B. Th ey have the same slope. D. Th ey do not intersect.
2. A mail order company sells boxes of fi shing lures for $26.95 per box. A charge of $8.95 is added to orders, regardless of the order size. Which of the following equations models the relationship between the number of boxes ordered and the total cost of the order?
F. c 5 26.95w; w $ 1 H. c 5 (26.95 1 8.95)w; w $ 1 G. 8.95c 5 26.95w; w $ 1 I. c 5 26.95w 1 8.95; w $ 1
3. Which of the following is the correct simplication of the expression
62 1 15 4 3 1 4 3 3? A. 63 B. 53 C. 29 D. 21
4. Which is not a solution of 3x 2 5 , 17? F. 24 G. 5 H. 7 I. 12
5. Which of the following statements is not true for the graph of the equation 5x 1 3y 5 12?
A. Th e y-intercept is 4. C. Th e x-intercept is 2.4
B. Th e line has a positive slope. D. Th e line contains the point Q2, 23R. 6. What is the constant of variation for 3y 5 6x?
F. 12 G. 2 H. 3 I. 6
7. What is f (24) when f (x) 5 2x2 2 2x? A. 24 B. 8 C. 28 D. 224
8. Th e Girl Scouts hoped to raise $1000 selling cookies. Instead, they raised $1050. What percent of their goal did they achieve?
F. 115% G. 105% H. 100% I. 95%
9. Which of the following is the solution of 3(5x 2 6) 5 263? A. 23 B. 5 C. 3 D. 15
10. What is 8x 1 3y2
4y 2 3x when x 5 2 and y 5 3?
F. 222 G. 28 H. 7.5 I. 436
Prentice Hall Algebra 1 • Teaching ResourcesCopyright © by Pearson Education, Inc., or its affiliates. All Rights Reserved.
92
Name Class Date
Cumulative Review (continued)
Chapters 1-5
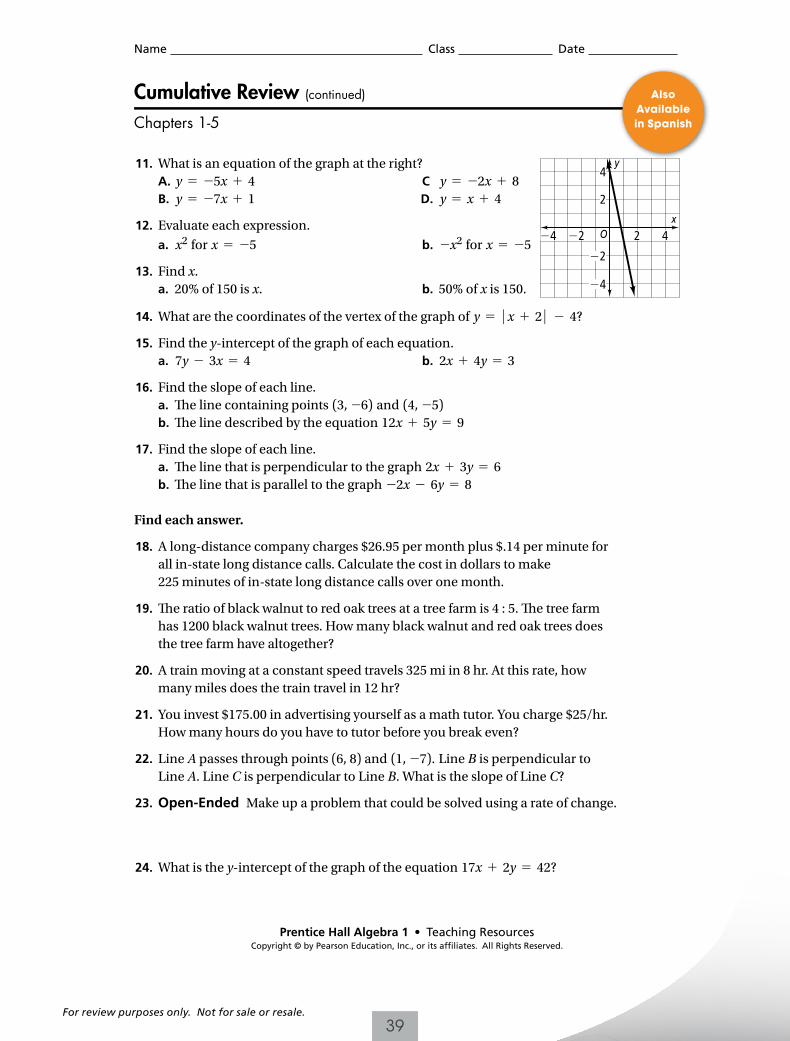
11. What is an equation of the graph at the right? A. y 5 25x 1 4 C y 5 22x 1 8 B. y 5 27x 1 1 D. y 5 x 1 4
12. Evaluate each expression.
a. x2 for x 5 25 b. 2x2 for x 5 25
13. Find x. a. 20% of 150 is x. b. 50% of x is 150.
14. What are the coordinates of the vertex of the graph of y 5 u x 1 2 u 2 4?
15. Find the y-intercept of the graph of each equation. a. 7y 2 3x 5 4 b. 2x 1 4y 5 3
16. Find the slope of each line. a. Th e line containing points (3, 26) and (4, 25) b. Th e line described by the equation 12x 1 5y 5 9
17. Find the slope of each line. a. Th e line that is perpendicular to the graph 2x 1 3y 5 6 b. Th e line that is parallel to the graph 22x 2 6y 5 8
Find each answer.
18. A long-distance company charges $26.95 per month plus $.14 per minute for all in-state long distance calls. Calculate the cost in dollars to make 225 minutes of in-state long distance calls over one month.
19. Th e ratio of black walnut to red oak trees at a tree farm is 4 : 5. Th e tree farm has 1200 black walnut trees. How many black walnut and red oak trees does the tree farm have altogether?
20. A train moving at a constant speed travels 325 mi in 8 hr. At this rate, how many miles does the train travel in 12 hr?
21. You invest $175.00 in advertising yourself as a math tutor. You charge $25/hr. How many hours do you have to tutor before you break even?
22. Line A passes through points (6, 8) and (1, 27). Line B is perpendicular to Line A. Line C is perpendicular to Line B. What is the slope of Line C?
23. Open-Ended Make up a problem that could be solved using a rate of change.
24. What is the y-intercept of the graph of the equation 17x 1 2y 5 42?
xO
y4
2
2
4
2
4 42
Also Available in Spanish
39For review purposes only. Not for sale or resale.
Name Class Date
Copyright © by Pearson Education, Inc., or its affiliates. All Rights Reserved.
12
Common Core Standards Practice Week 12
Selected Response
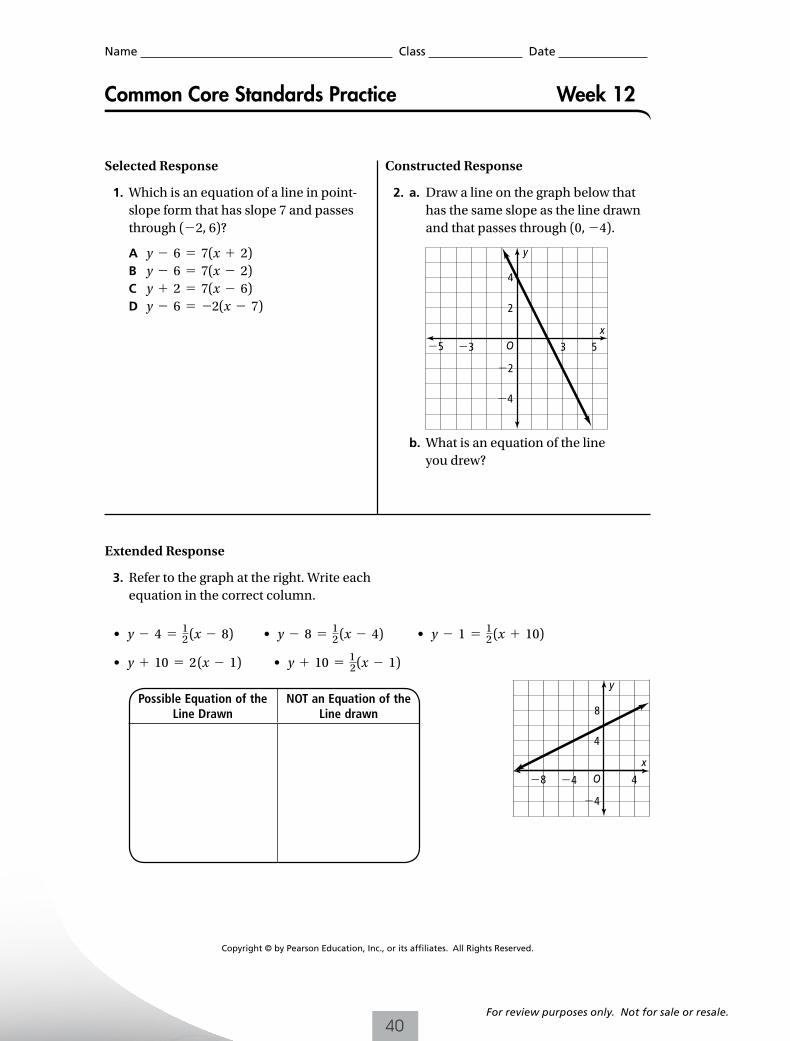
1. Which is an equation of a line in point-slope form that has slope 7 and passes through (22, 6)?
A y 2 6 5 7(x 1 2) B y 2 6 5 7(x 2 2) C y 1 2 5 7(x 2 6) D y 2 6 5 22(x 2 7)
Constructed Response
2. a. Draw a line on the graph below that has the same slope as the line drawn and that passes through (0, 24).
3 55 3 O
4
2
2
4
y
x
b. What is an equation of the line you drew?
Extended Response
3. Refer to the graph at the right. Write each equation in the correct column.
• y 2 4 5 12
(x 2 8) • y 2 8 5 12
(x 2 4) • y 2 1 5 12
(x 1 10)
• y 1 10 5 2 (x 2 1) • y 1 10 5 1
2(x 2 1)
Possible Equation of the Line Drawn
NOT an Equation of the Line drawn
O
y
x
�8 �4
�4
4
4
8
A1_PMA_Week12_P140.indd 12 28/02/13 4:48 PM
40For review purposes only. Not for sale or resale.
Overview
Looking Back Mathematics of the week Looking Ahead
Earlier in chapter 5, students found slope and wrote equa-tions for direct variations and linear functions. They also graphed linear equations using y-intercept and slope (A.CED.2, F.IF.4, F.IF.6, F.IF.7.a).
Students graph equations in point-slope form. Students use two points or information in a table, identifying two points, to write an equation in point-slope form.
Later this chapter, students will use equations in various forms to identify parallel and perpen-dicular lines (G.GPE.5). Also, students use the point-slope form to write equations for trend lines (S.ID.6.c)
COMMOn COre COntent StAndArdS
A.SSE.2 Use the structure of an expression to identify ways to rewrite it.
A.CED.2 Create equations in two or more variables to represent relationships between quan-tities; graph equations on coordinate axes with labels and scales.
F.IF.4 For a function that models a relationship between two quantities, interpret key features of graphs . . . and sketch graphs showing key features given a verbal description of the relation-ship.
F.IF.7.a Graph linear and quadratic functions and show intercepts, maxima, and minima.
F.BF.1.a Determine an explicit expression, . . . or steps for calculation from a context.
F.LE.2 Construct linear and exponential functions, . . . given a graph, a description of a rela-tionship, or two input-output pairs (include reading these from a table).
Mathematical Practice Standards: 1, 4, 7
teAChing nOteS
Selected response 1. Error Analysis: Students write a linear equation in a given form. If a student selects answer
choice B, he or she does not understand that for an x coordinate of 22, he or she must sim-plify (x 2 (22)), which is (x 1 2), for (x 2 x
1) in point-slope form. If a student selects answer
choice C, he or she has substituted the x-coordinate for y1 and the y-coordinate for x
1. If a stu-
dent selects answer choice D, he or she is probably guessing and does not understand what to substitute for slope and the correct placement of the x and y coordinates in point-slope form.
Constructed response 2. Students show understanding of parallel lines on a coordinate plane. For part (a), remind
students to first determine what the slope of the line is and ask what that looks like to the left of (0, 24) as well as to the right. For part (b), have students check their equation by substi-tuting the coordinates of two points from their graph in the equation.
extended response 3. Students match equations to the graph of a line. Encourage students to determine the
slope of the line, and eliminate any equation that does not have that slope. Then encour-age students to identify the point that is indicated by each equation and determine if that point is on the line. Students may want to add a line for x 5 8 and extend the line to find the value of y when x 5 8.
COMMON CORE STANDARDS PRACTICECommon Core Standards Practice week 12 For use after Lesson 5-4 Algebra 1
Copyright © by Pearson Education, Inc., or its affiliates. All Rights Reserved.
T12
ALG1_TG_WP12_TN.indd 12 01/03/13 1:09 AM
41For review purposes only. Not for sale or resale.
Copyright © by Pearson Education, Inc., or its affiliates. All Rights Reserved.
107
Name Class Date
Complete this performance task in the space provided. Fully answer all parts of the performance task with detailed responses. You should provide sound mathematical reasoning to support your work.
Performance Task: Choosing a Movie-Rental Plan
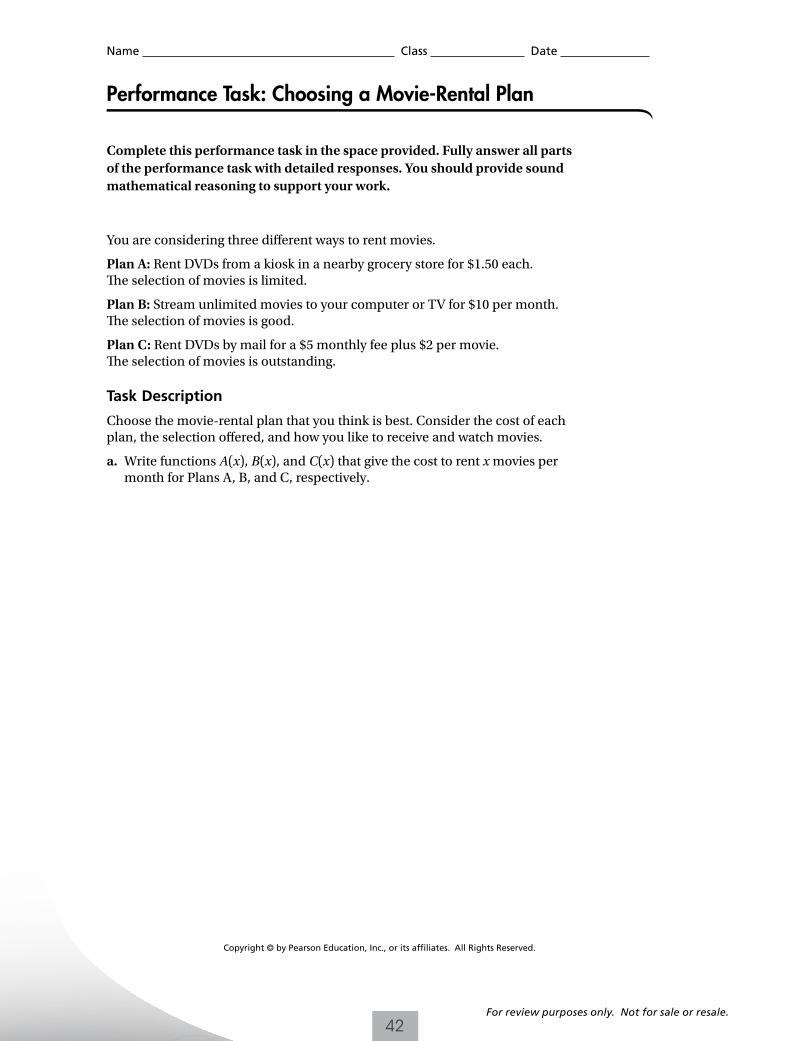
You are considering three different ways to rent movies.
Plan A: Rent DVDs from a kiosk in a nearby grocery store for $1.50 each. The selection of movies is limited.
Plan B: Stream unlimited movies to your computer or TV for $10 per month. The selection of movies is good.
Plan C: Rent DVDs by mail for a $5 monthly fee plus $2 per movie. The selection of movies is outstanding.
Task Description
Choose the movie-rental plan that you think is best. Consider the cost of each plan, the selection offered, and how you like to receive and watch movies.
a. Write functions A(x), B(x), and C(x) that give the cost to rent x movies per month for Plans A, B, and C, respectively.
HSMTH12_ANC_A1_AL_PT.indd 107 10/02/13 2:01 PM
42For review purposes only. Not for sale or resale.
Copyright © by Pearson Education, Inc., or its affiliates. All Rights Reserved.
108
Name Class Date
Performance Task: Choosing a Movie-Rental Plan (continued)
b. If you consider only cost, under what condition does it make sense to choose Plan B over Plan A?
c. If you consider only cost, under what condition does it make sense to choose Plan C over Plan B?
d. Show that Plan A is always more cost-effective than Plan C. Does that mean that Plan A is a better choice than Plan C for everyone? Explain.
e. Which movie-rental plan would you choose? Justify your answer.
HSMTH12_ANC_A1_AL_PT.indd 108 10/02/13 2:01 PM
43For review purposes only. Not for sale or resale.
Name Class Date
Copyright © by Pearson Education, Inc., or its affiliates. All Rights Reserved.
A16
Performance Task 1 Scoring Rubric
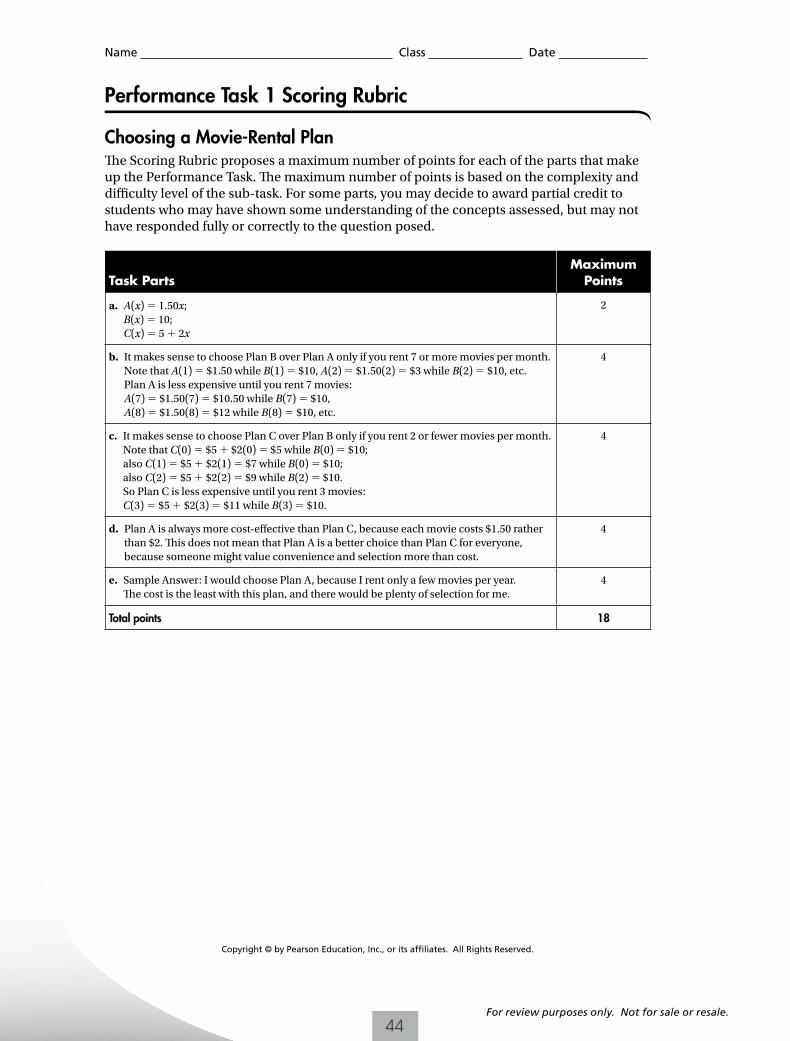
Choosing a Movie-Rental PlanThe Scoring Rubric proposes a maximum number of points for each of the parts that make up the Performance Task. The maximum number of points is based on the complexity and difficulty level of the sub-task. For some parts, you may decide to award partial credit to students who may have shown some understanding of the concepts assessed, but may not have responded fully or correctly to the question posed.
Task PartsMaximum
Points
a. A(x) 5 1.50x;B(x) 5 10; C(x) 5 5 1 2x
2
b. It makes sense to choose Plan B over Plan A only if you rent 7 or more movies per month. Note that A(1) 5 $1.50 while B(1) 5 $10, A(2) 5 $1.50(2) 5 $3 while B(2) 5 $10, etc. Plan A is less expensive until you rent 7 movies: A(7) 5 $1.50(7) 5 $10.50 while B(7) 5 $10, A(8) 5 $1.50(8) 5 $12 while B(8) 5 $10, etc.
4
c. It makes sense to choose Plan C over Plan B only if you rent 2 or fewer movies per month. Note that C(0) 5 $5 1 $2(0) 5 $5 while B(0) 5 $10; also C(1) 5 $5 1 $2(1) 5 $7 while B(0) 5 $10; also C(2) 5 $5 1 $2(2) 5 $9 while B(2) 5 $10. So Plan C is less expensive until you rent 3 movies: C(3) 5 $5 1 $2(3) 5 $11 while B(3) 5 $10.
4
d. Plan A is always more cost-effective than Plan C, because each movie costs $1.50 rather than $2. This does not mean that Plan A is a better choice than Plan C for everyone, because someone might value convenience and selection more than cost.
4
e. Sample Answer: I would choose Plan A, because I rent only a few movies per year. The cost is the least with this plan, and there would be plenty of selection for me.
4
Total points 18
CC_PMA_A1_PT_Rubric.indd 16 12/02/13 5:15 PM
44For review purposes only. Not for sale or resale.
Name Class Date
Copyright © by Pearson Education, Inc., or its affiliates. All Rights Reserved.
43
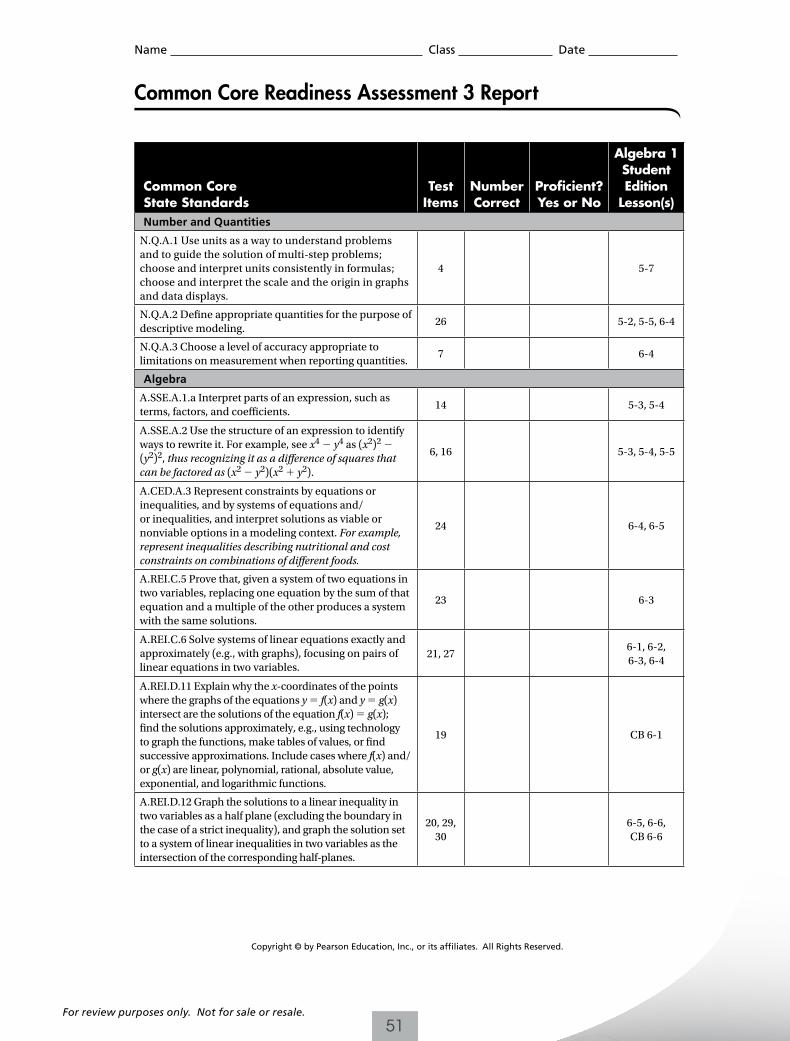
Common Core Readiness Assessment 3
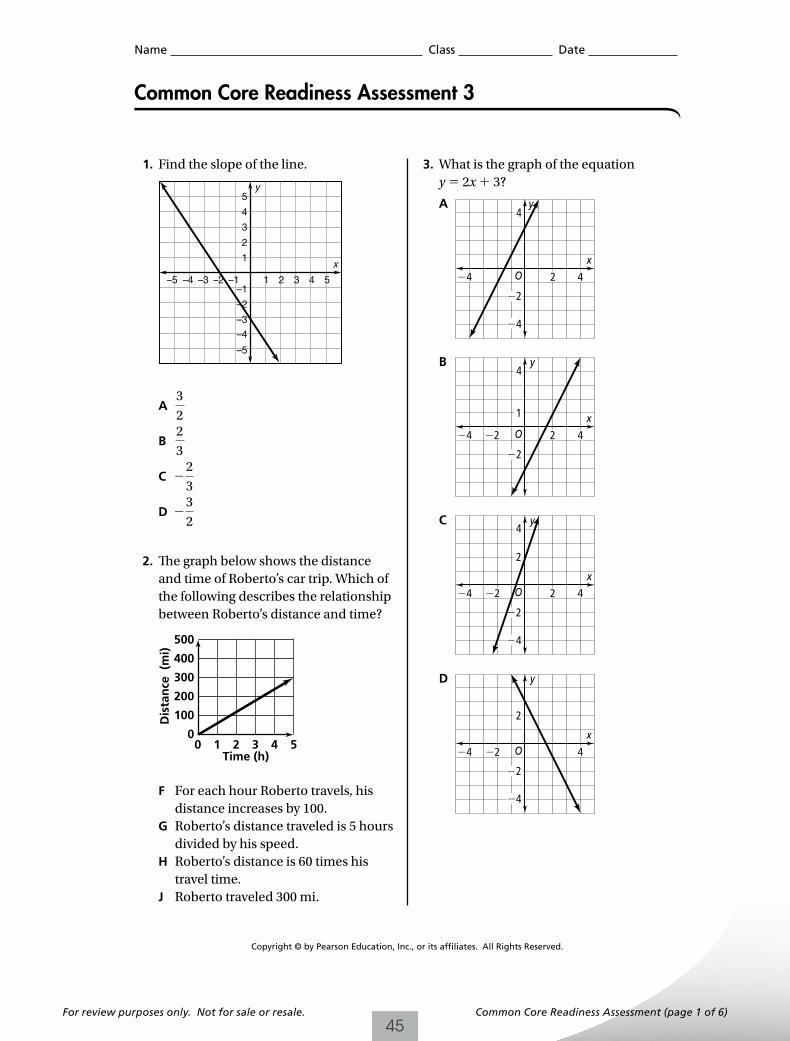
1. Find the slope of the line.
A 3
2
B 2
3
C 2
2
3
D 2
3
2
2. The graph below shows the distance and time of Roberto’s car trip. Which of the following describes the relationship between Roberto’s distance and time?
F For each hour Roberto travels, his distance increases by 100.
G Roberto’s distance traveled is 5 hours divided by his speed.
H Roberto’s distance is 60 times his travel time.
J Roberto traveled 300 mi.
3. What is the graph of the equation y 5 2x 1 3?
A
B
C
D
4 5321–4–5 –3 –2 –1
x
4
5
3
2
1
–1
–2
–3
–4
–5
y
100
200
300
400
500
00 1 2 3 4 5
Time (h)
Dis
tan
ce (
mi)
y
x
�4 O 2 4
4
�2
�4
y
x
�2�4 O 2 4
4
1
�2
y
x
�2�4 O 2 4
2
4
�4
�2
y
x
�2�4 O 4
2
�2
�4
PHS4674_NAA1_BM3.indd 43 09/02/13 8:01 PM
45For review purposes only. Not for sale or resale. Common Core Readiness Assessment (page 1 of 6)
Copyright © by Pearson Education, Inc., or its affiliates. All Rights Reserved.
44
Name Class Date
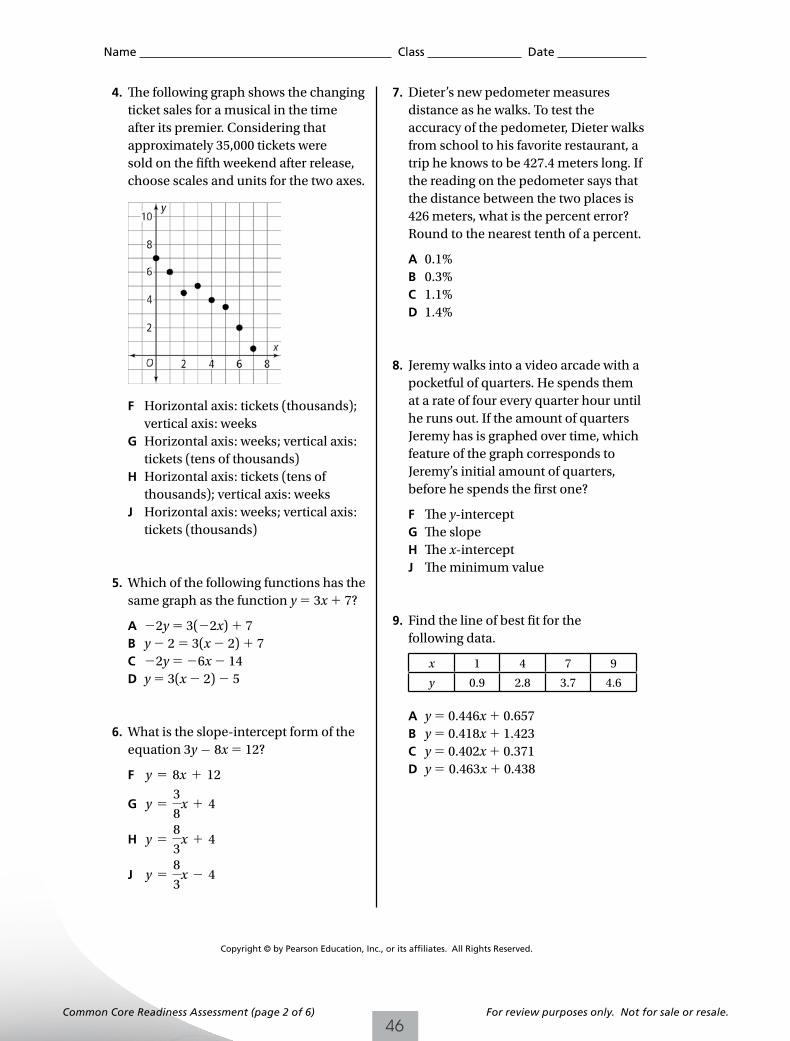
4. The following graph shows the changing ticket sales for a musical in the time after its premier. Considering that approximately 35,000 tickets were sold on the fifth weekend after release, choose scales and units for the two axes.
F Horizontal axis: tickets (thousands); vertical axis: weeks
G Horizontal axis: weeks; vertical axis: tickets (tens of thousands)
H Horizontal axis: tickets (tens of thousands); vertical axis: weeks
J Horizontal axis: weeks; vertical axis: tickets (thousands)
5. Which of the following functions has the same graph as the function y 5 3x 1 7?
A 22y 5 3(22x) 1 7 B y 2 2 5 3(x 2 2) 1 7 C 22y 5 26x 2 14 D y 5 3(x 2 2) 2 5
6. What is the slope-intercept form of the equation 3y 2 8x 5 12?
F y 5 8x 1 12
G y 53
8x 1 4
H y 58
3x 1 4
J y 58
3x 2 4
7. Dieter’s new pedometer measures distance as he walks. To test the accuracy of the pedometer, Dieter walks from school to his favorite restaurant, a trip he knows to be 427.4 meters long. If the reading on the pedometer says that the distance between the two places is 426 meters, what is the percent error? Round to the nearest tenth of a percent.
A 0.1% B 0.3% C 1.1% D 1.4%
8. Jeremy walks into a video arcade with a pocketful of quarters. He spends them at a rate of four every quarter hour until he runs out. If the amount of quarters Jeremy has is graphed over time, which feature of the graph corresponds to Jeremy’s initial amount of quarters, before he spends the first one?
F The y-intercept G The slope H The x-intercept J The minimum value
9. Find the line of best fit for the following data.
x 1 4 7 9
y 0.9 2.8 3.7 4.6
A y 5 0.446x 1 0.657 B y 5 0.418x 1 1.423 C y 5 0.402x 1 0.371 D y 5 0.463x 1 0.438
PHS4674_NAA1_BM3.indd 44 09/02/13 8:01 PM
46For review purposes only. Not for sale or resale.Common Core Readiness Assessment (page 2 of 6)
Copyright © by Pearson Education, Inc., or its affiliates. All Rights Reserved.
45
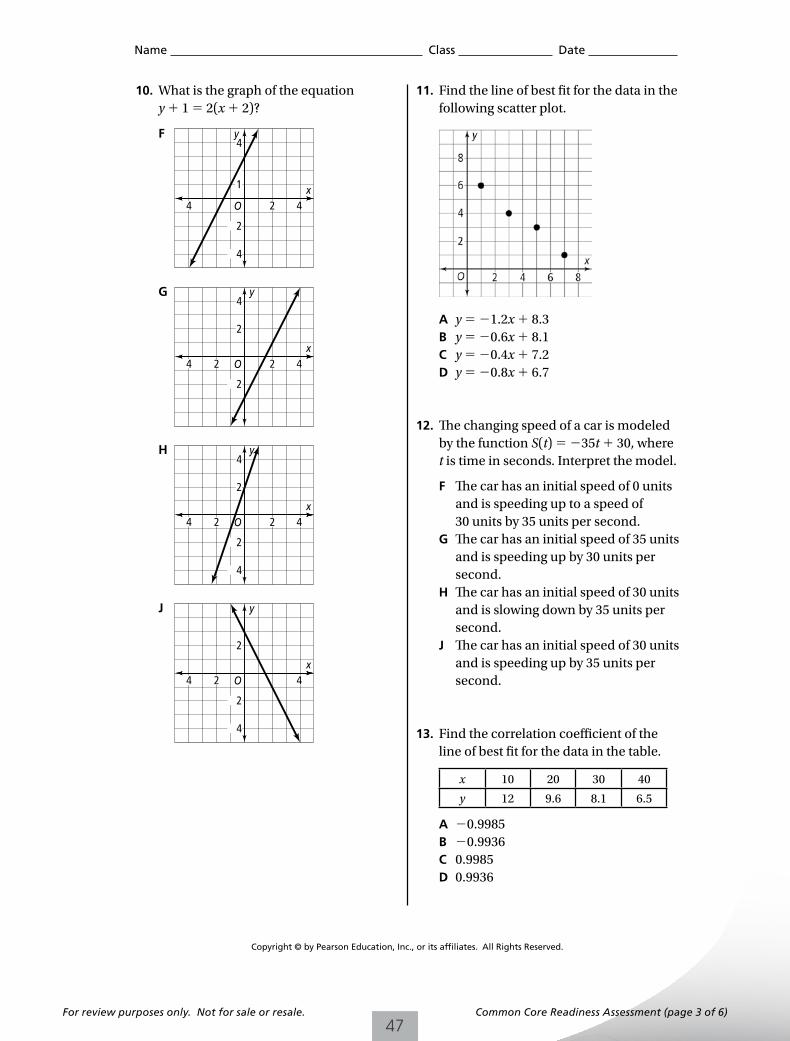
Name Class Date
10. What is the graph of the equation y 1 1 5 2(x 1 2)?
F
G
H
J
11. Find the line of best fit for the data in the following scatter plot.
A y 5 21.2x 1 8.3 B y 5 20.6x 1 8.1 C y 5 20.4x 1 7.2 D y 5 20.8x 1 6.7
12. The changing speed of a car is modeled by the function S(t) 5 235t 1 30, where t is time in seconds. Interpret the model.
F The car has an initial speed of 0 units and is speeding up to a speed of 30 units by 35 units per second.
G The car has an initial speed of 35 units and is speeding up by 30 units per second.
H The car has an initial speed of 30 units and is slowing down by 35 units per second.
J The car has an initial speed of 30 units and is speeding up by 35 units per second.
13. Find the correlation coefficient of the line of best fit for the data in the table.
x 10 20 30 40
y 12 9.6 8.1 6.5
A 20.9985 B 20.9936 C 0.9985 D 0.9936
xO 2 4
� 4
� 2
1
4
� 4
y
xO 2 4
� 2
4
� 4 � 2
y
2
xO 2 4
� 2
� 4
4
� 4 � 2
y
2
xO 4
� 2
� 4
� 4 � 2
y
2
PHS4674_NAA1_BM3.indd 45 09/02/13 8:01 PM
47For review purposes only. Not for sale or resale. Common Core Readiness Assessment (page 3 of 6)
Copyright © by Pearson Education, Inc., or its affiliates. All Rights Reserved.
46
Name Class Date
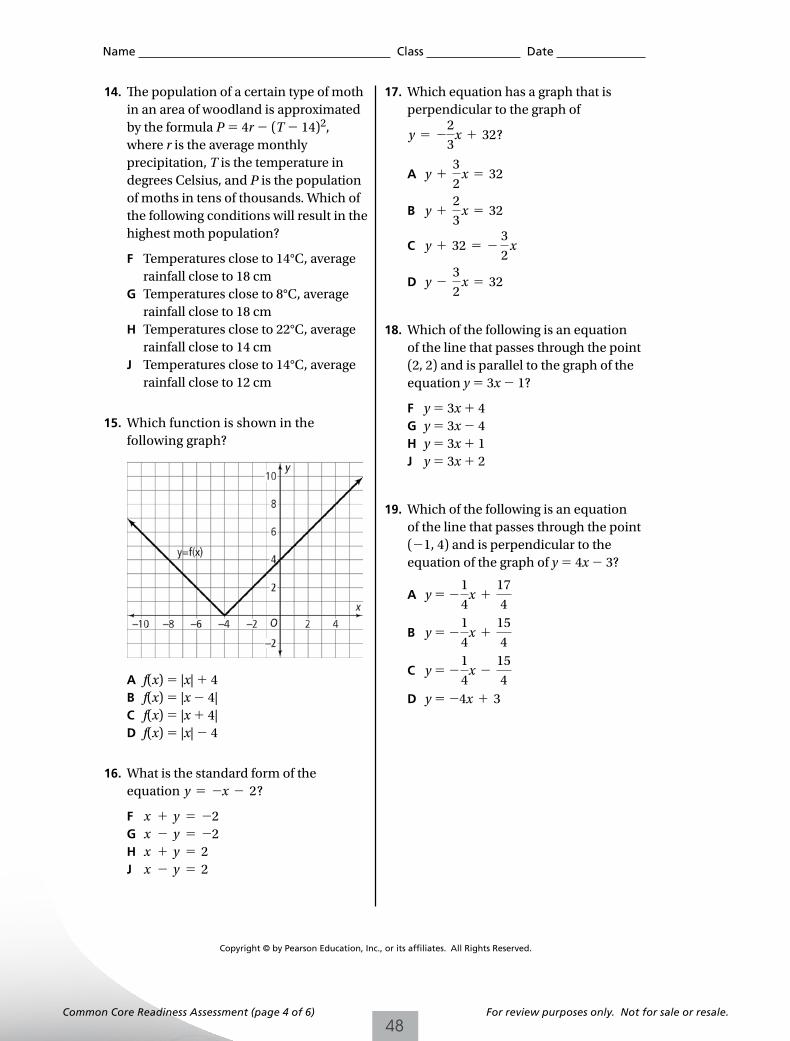
14. The population of a certain type of moth in an area of woodland is approximated by the formula P 5 4r 2 (T 2 14)2, where r is the average monthly precipitation, T is the temperature in degrees Celsius, and P is the population of moths in tens of thousands. Which of the following conditions will result in the highest moth population?
F Temperatures close to 14°C, average rainfall close to 18 cm
G Temperatures close to 8°C, average rainfall close to 18 cm
H Temperatures close to 22°C, average rainfall close to 14 cm
J Temperatures close to 14°C, average rainfall close to 12 cm
15. Which function is shown in the following graph?
A f(x) 5 |x| 1 4 B f(x) 5 |x 2 4| C f(x) 5 |x 1 4| D f(x) 5 |x| 2 4
16. What is the standard form of the equation y 5 2x 2 2?
F x 1 y 5 22 G x 2 y 5 22 H x 1 y 5 2 J x 2 y 5 2
17. Which equation has a graph that is perpendicular to the graph of
y 5 22
3x 1 32?
A y 13
2 x 5 32
B y 12
3 x 5 32
C y 1 32 5 2 3
2 x
D y 23
2 x 5 32
18. Which of the following is an equation of the line that passes through the point (2, 2) and is parallel to the graph of the equation y 5 3x 2 1?
F y 5 3x 1 4 G y 5 3x 2 4 H y 5 3x 1 1 J y 5 3x 1 2
19. Which of the following is an equation of the line that passes through the point (21, 4) and is perpendicular to the equation of the graph of y 5 4x 2 3?
A y 5 2
1
4x 1
17
4
B y 5 2
1
4x 1
15
4
C y 5 2
1
4x 2
15
4 D y 5 24x 1 3
PHS4674_NAA1_BM3.indd 46 09/02/13 8:01 PM
48For review purposes only. Not for sale or resale.Common Core Readiness Assessment (page 4 of 6)
Copyright © by Pearson Education, Inc., or its affiliates. All Rights Reserved.
47
Name Class Date
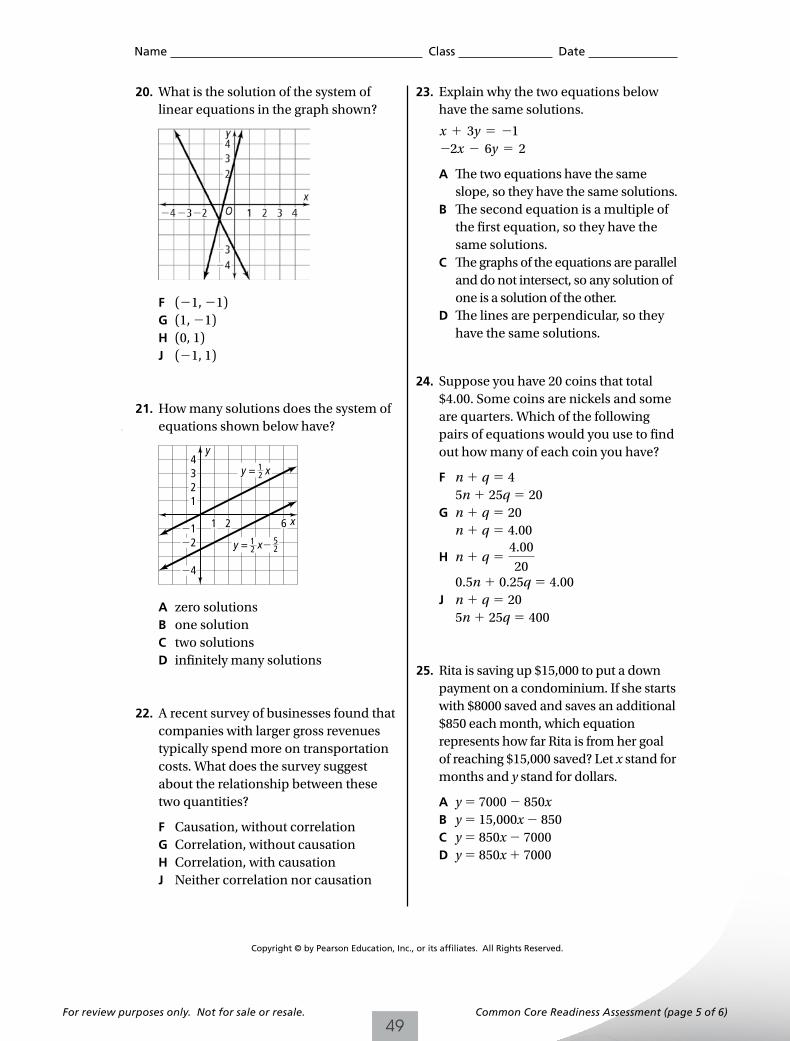
20. What is the solution of the system of linear equations in the graph shown?
F (21, 21) G (1, 21) H (0, 1) J (21, 1)
21. How many solutions does the system of equations shown below have?
A zero solutions B one solution C two solutions D infinitely many solutions
22. A recent survey of businesses found that companies with larger gross revenues typically spend more on transportation costs. What does the survey suggest about the relationship between these two quantities?
F Causation, without correlation G Correlation, without causation H Correlation, with causation J Neither correlation nor causation
23. Explain why the two equations below have the same solutions.
x 1 3y 5 21 22x 2 6y 5 2
A The two equations have the same slope, so they have the same solutions.
B The second equation is a multiple of the first equation, so they have the same solutions.
C The graphs of the equations are parallel and do not intersect, so any solution of one is a solution of the other.
D The lines are perpendicular, so they have the same solutions.
24. Suppose you have 20 coins that total $4.00. Some coins are nickels and some are quarters. Which of the following pairs of equations would you use to find out how many of each coin you have?
F n 1 q 5 45n 1 25q 5 20
G n 1 q 5 20n 1 q 5 4.00
H n 1 q 5 4.00
20 0.5n 1 0.25q 5 4.00 J n 1 q 5 20
5n 1 25q 5 400
25. Rita is saving up $15,000 to put a down payment on a condominium. If she starts with $8000 saved and saves an additional $850 each month, which equation represents how far Rita is from her goal of reaching $15,000 saved? Let x stand for months and y stand for dollars.
A y 5 7000 2 850x B y 5 15,000x 2 850 C y 5 850x 2 7000 D y 5 850x 1 7000
y
x
y = 12 x� 52
1234
�2�1 1 2 6
�4
y = 12 x
PHS4674_NAA1_BM3.indd 47 12/02/13 8:16 PM
49For review purposes only. Not for sale or resale. Common Core Readiness Assessment (page 5 of 6)
Copyright © by Pearson Education, Inc., or its affiliates. All Rights Reserved.
48
Name Class Date
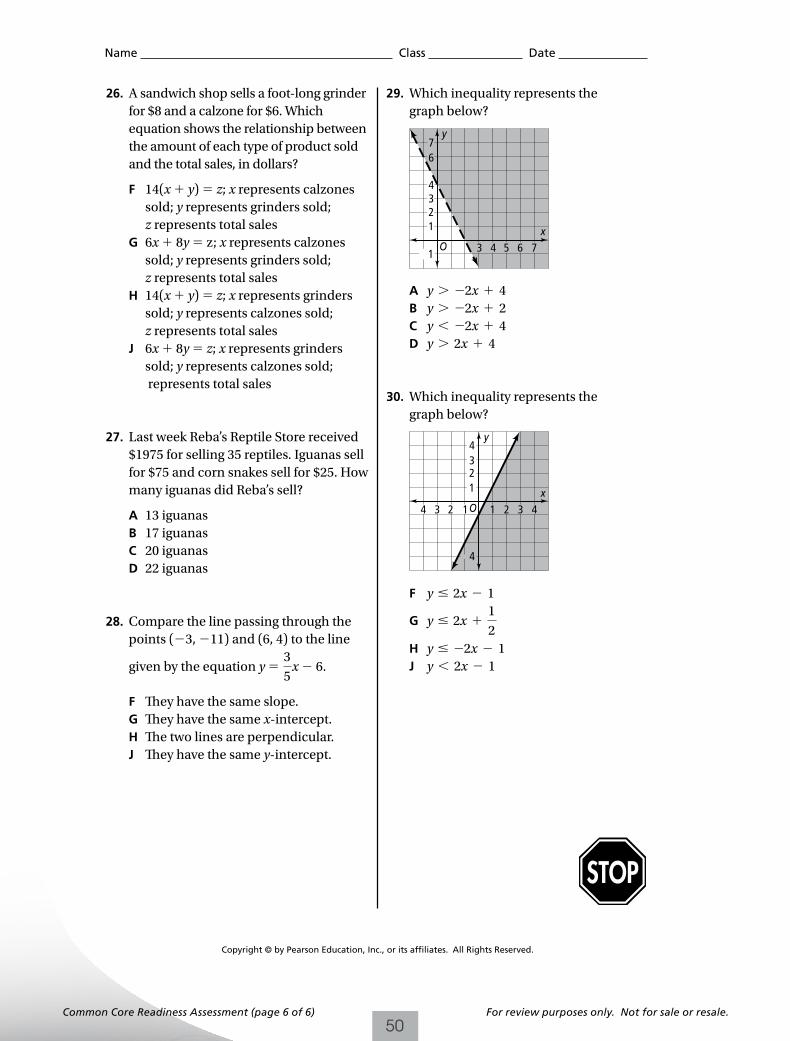
26. A sandwich shop sells a foot-long grinder for $8 and a calzone for $6. Which equation shows the relationship between the amount of each type of product sold and the total sales, in dollars?
F 14(x 1 y) 5 z; x represents calzones sold; y represents grinders sold; z represents total sales
G 6x 1 8y 5 z; x represents calzones sold; y represents grinders sold; z represents total sales
H 14(x 1 y) 5 z; x represents grinders sold; y represents calzones sold; z represents total sales
J 6x 1 8y 5 z; x represents grinders sold; y represents calzones sold; represents total sales
27. Last week Reba’s Reptile Store received $1975 for selling 35 reptiles. Iguanas sell for $75 and corn snakes sell for $25. How many iguanas did Reba’s sell?
A 13 iguanas B 17 iguanas C 20 iguanas D 22 iguanas
28. Compare the line passing through the points (23, 211) and (6, 4) to the line
given by the equation y 5 3
5x 2 6.
F They have the same slope. G They have the same x-intercept. H The two lines are perpendicular. J They have the same y-intercept.
29. Which inequality represents the graph below?
A y . 22x 1 4 B y . 22x 1 2 C y , 22x 1 4 D y . 2x 1 4
30. Which inequality represents the graph below?
F y # 2x 2 1
G y # 2x 11
2 H y # 22x 2 1 J y , 2x 2 1
y
x1234
67
O 4 5 6 73� 1
y
x1234
O 1� 1� 2� 3� 4 2 3 4
� 4
STOP
PHS4674_NAA1_BM3.indd 48 09/02/13 8:01 PM
50For review purposes only. Not for sale or resale.Common Core Readiness Assessment (page 6 of 6)
Name Class Date
Common Core Readiness Assessment 3 Report
Copyright © by Pearson Education, Inc., or its affiliates. All Rights Reserved.
48A
Common Core State Standards
Test Items
Number Correct
Proficient? Yes or No
Algebra 1Student Edition
Lesson(s)Number and Quantities
N.Q.A.1 Use units as a way to understand problems and to guide the solution of multi-step problems; choose and interpret units consistently in formulas; choose and interpret the scale and the origin in graphs and data displays.
4 5-7
N.Q.A.2 Define appropriate quantities for the purpose of descriptive modeling.
26 5-2, 5-5, 6-4
N.Q.A.3 Choose a level of accuracy appropriate to limitations on measurement when reporting quantities.
7 6-4
Algebra
A.SSE.A.1.a Interpret parts of an expression, such as terms, factors, and coefficients.
14 5-3, 5-4
A.SSE.A.2 Use the structure of an expression to identify ways to rewrite it. For example, see x4 2 y4 as (x2)2 2 (y2)2, thus recognizing it as a difference of squares that can be factored as (x2 2 y2)(x2 1 y2).
6, 16 5-3, 5-4, 5-5
A.CED.A.3 Represent constraints by equations or inequalities, and by systems of equations and/or inequalities, and interpret solutions as viable or nonviable options in a modeling context. For example, represent inequalities describing nutritional and cost constraints on combinations of different foods.
24 6-4, 6-5
A.REI.C.5 Prove that, given a system of two equations in two variables, replacing one equation by the sum of that equation and a multiple of the other produces a system with the same solutions.
23 6-3
A.REI.C.6 Solve systems of linear equations exactly and approximately (e.g., with graphs), focusing on pairs of linear equations in two variables.
21, 276-1, 6-2, 6-3, 6-4
A.REI.D.11 Explain why the x-coordinates of the points where the graphs of the equations y 5 f(x) and y 5 g(x) intersect are the solutions of the equation f(x) 5 g(x); find the solutions approximately, e.g., using technology to graph the functions, make tables of values, or find successive approximations. Include cases where f(x) and/or g(x) are linear, polynomial, rational, absolute value, exponential, and logarithmic functions.
19 CB 6-1
A.REI.D.12 Graph the solutions to a linear inequality in two variables as a half plane (excluding the boundary in the case of a strict inequality), and graph the solution set to a system of linear inequalities in two variables as the intersection of the corresponding half-planes.
20, 29, 30
6-5, 6-6, CB 6-6
PHS4674_NAA1_BM3.indd 1 28/02/13 2:02 PM
51For review purposes only. Not for sale or resale.
Name Class Date
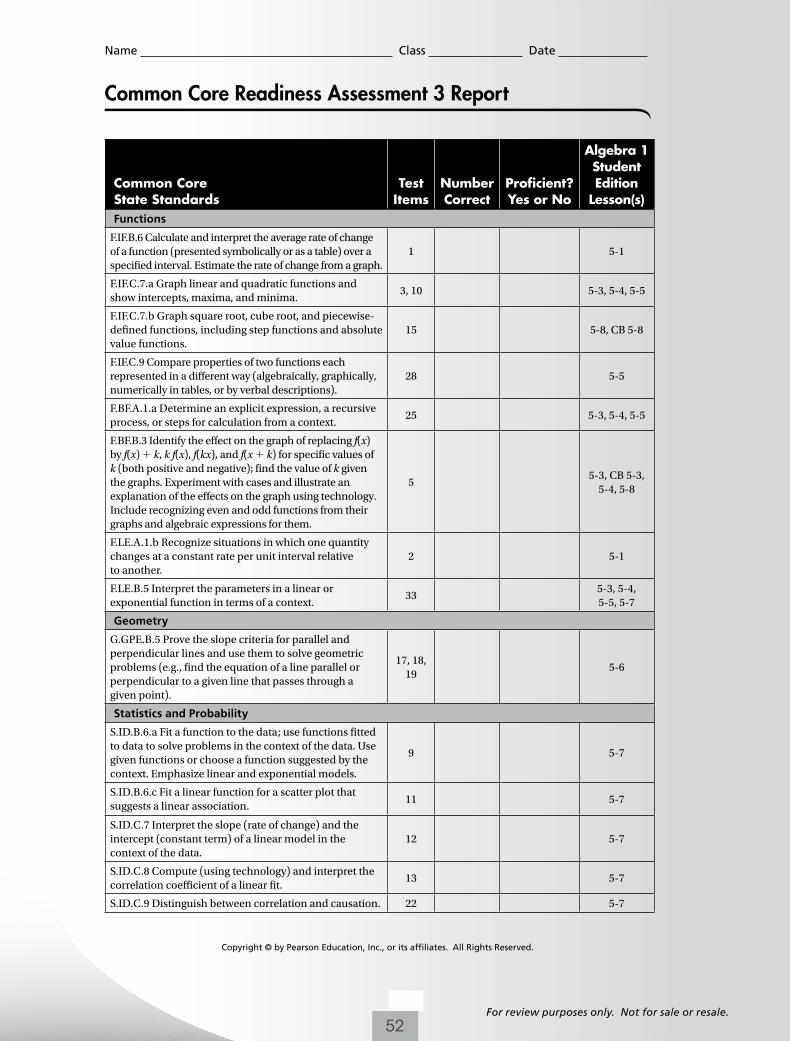
Common Core Readiness Assessment 3 Report
Copyright © by Pearson Education, Inc., or its affiliates. All Rights Reserved.
48B
Common Core State Standards
Test Items
Number Correct
Proficient? Yes or No
Algebra 1Student Edition
Lesson(s)Functions
F.IF.B.6 Calculate and interpret the average rate of change of a function (presented symbolically or as a table) over a specified interval. Estimate the rate of change from a graph.
1 5-1
F.IF.C.7.a Graph linear and quadratic functions and show intercepts, maxima, and minima.
3, 10 5-3, 5-4, 5-5
F.IF.C.7.b Graph square root, cube root, and piecewise-defined functions, including step functions and absolute value functions.
15 5-8, CB 5-8
F.IF.C.9 Compare properties of two functions each represented in a different way (algebraically, graphically, numerically in tables, or by verbal descriptions).
28 5-5
F.BF.A.1.a Determine an explicit expression, a recursive process, or steps for calculation from a context.
25 5-3, 5-4, 5-5
F.BF.B.3 Identify the effect on the graph of replacing f(x) by f(x) 1 k, k f(x), f(kx), and f(x 1 k) for specific values of k (both positive and negative); find the value of k given the graphs. Experiment with cases and illustrate an explanation of the effects on the graph using technology. Include recognizing even and odd functions from their graphs and algebraic expressions for them.
55-3, CB 5-3,
5-4, 5-8
F.LE.A.1.b Recognize situations in which one quantity changes at a constant rate per unit interval relative to another.
2 5-1
F.LE.B.5 Interpret the parameters in a linear or exponential function in terms of a context.
335-3, 5-4, 5-5, 5-7
Geometry
G.GPE.B.5 Prove the slope criteria for parallel and perpendicular lines and use them to solve geometric problems (e.g., find the equation of a line parallel or perpendicular to a given line that passes through a given point).
17, 18, 19
5-6
Statistics and Probability
S.ID.B.6.a Fit a function to the data; use functions fitted to data to solve problems in the context of the data. Use given functions or choose a function suggested by the context. Emphasize linear and exponential models.
9 5-7
S.ID.B.6.c Fit a linear function for a scatter plot that suggests a linear association.
11 5-7
S.ID.C.7 Interpret the slope (rate of change) and the intercept (constant term) of a linear model in the context of the data.
12 5-7
S.ID.C.8 Compute (using technology) and interpret the correlation coefficient of a linear fit.
13 5-7
S.ID.C.9 Distinguish between correlation and causation. 22 5-7
PHS4674_NAA1_BM3.indd 2 01/03/13 1:13 AM
52For review purposes only. Not for sale or resale.

53
Notes
54
Notes
55
Notes
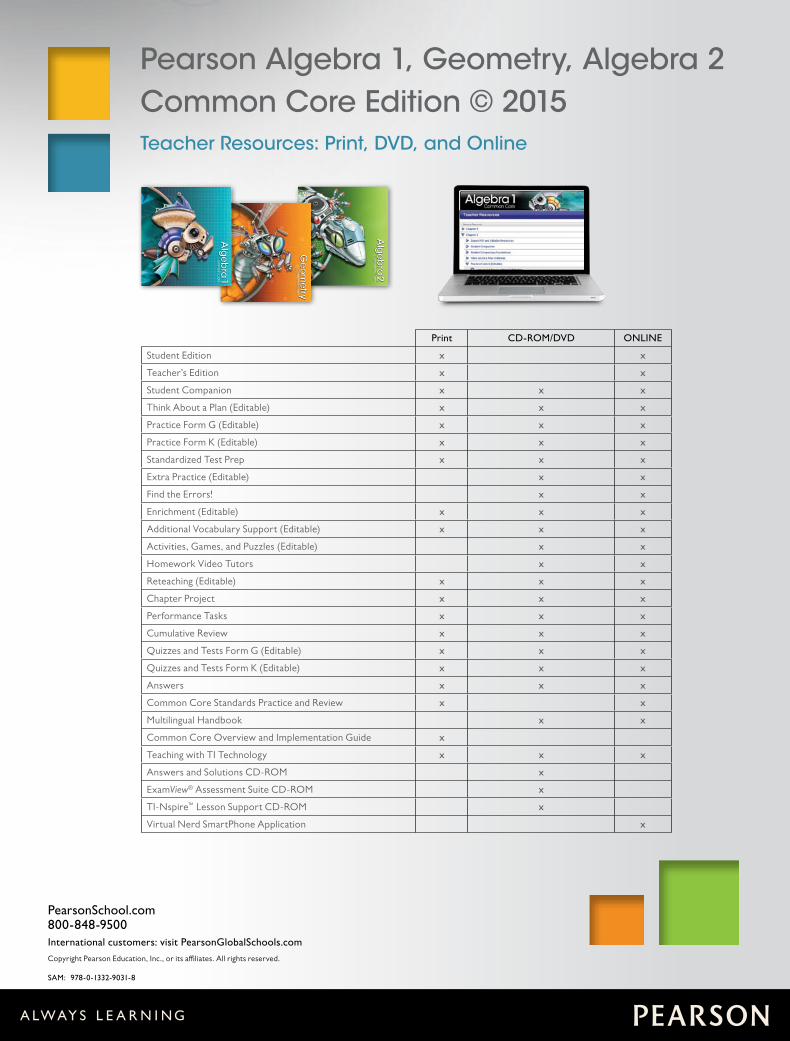
PearsonSchool.com800-848-9500International customers: visit PearsonGlobalSchools.com
Copyright Pearson Education, Inc., or its affiliates. All rights reserved.
SAM: 978-0-1332-9031-8
Pearson Algebra 1, Geometry, Algebra 2 Common Core Edition © 2015Teacher Resources: Print, DVD, and Online
ISBN-13:ISBN-10:
978-0-13-318602-40-13-318602-4
9 7 8 0 1 3 3 1 8 6 0 2 4
9 0 0 0 0
For Student Edition with 6-year online access to PowerAlgebra.com, order ISBN 0-13-318603-2.
for School
Expressions, Equations, and Inequalities
Functions, Equations, and Graphs
Linear Systems
Quadratic Functions and Equations
Polynomials and Polynomial Functions
Radical Functions and Rational Exponents
Exponential and Logarithmic Functions
Rational Functions
Sequences and Series
Quadratic Relations and Conic Sections
Probability and Statistics
Matrices
Periodic Functions and Trigonometry
Trigonometric Identities and Equations
1
2
3
4
5
6
7
8
9
10
11
12
13
14
ALWAYS LEARNING
ISBN-13:ISBN-10:
978-0-13-318602-40-13-318602-4
9 7 8 0 1 3 3 1 8 6 0 2 4
9 0 0 0 0
For Student Edition with 6-year online access to PowerGeometry.com, order ISBN 0-13-318583-4.
ALWAYS LEARNING
for School
Tools of Geometry
Reasoning and Proof
Parallel and Perpendicular Lines
Congruent Triangles
Relationships Within Triangles
Polygons and Quadrilaterals
Similarity
Right Triangles and Trigonometry
Transformations
Area
Surface Area and Volume
Circles
Probability
1
2
3
4
5
6
7
8
9
10
11
12
13
for School
Foundations for Algebra
Solving Equations
Solving Inequalities
An Introduction to Functions
Linear Functions
Systems of Linear Equations and Inequalities
Exponents and Exponential Functions
Polynomials and Factoring
Quadratic Functions and Equations
Radical Expressions and Equations
Rational Expressions nd Functions
Data Analysis and Probability
1
2
3
4
5
6
7
8
9
10
11
12
ALWAYS LEARNING
ISBN-13:ISBN-10:
978-0-13-328313-60-13-328313-5
9 7 8 0 1 3 3 2 8 3 1 3 6
9 0 0 0 0
For Student Edition with 6-year online access to PowerAlgebra.com, order ISBN 0-13-318549-4.
Print CD-ROM/DVD ONLINE
Student Edition x x
Teacher’s Edition x x
Student Companion x x x
Think About a Plan (Editable) x x x
Practice Form G (Editable) x x x
Practice Form K (Editable) x x x
Standardized Test Prep x x x
Extra Practice (Editable) x x
Find the Errors! x x
Enrichment (Editable) x x x
Additional Vocabulary Support (Editable) x x x
Activities, Games, and Puzzles (Editable) x x
Homework Video Tutors x x
Reteaching (Editable) x x x
Chapter Project x x x
Performance Tasks x x x
Cumulative Review x x x
Quizzes and Tests Form G (Editable) x x x
Quizzes and Tests Form K (Editable) x x x
Answers x x x
Common Core Standards Practice and Review x x
Multilingual Handbook x x
Common Core Overview and Implementation Guide x
Teaching with TI Technology x x x
Answers and Solutions CD-ROM x
ExamView® Assessment Suite CD-ROM x
TI-Nspire™ Lesson Support CD-ROM x
Virtual Nerd SmartPhone Application x