Embed Size (px)
Citation preview
TEACHER TURNOVER WASTAGE and DESTINATIONS
Alan Smithers and Pamela Robinson Centre for Education and Employment Research
Report for the DfES, June 2004
e
Contents
Executive Summary i
1. Introduction 1
2. Resignations 8
3. Destinations 12
4. Turnover and Wastage Across the Maintained Sector 17
5. Turnover and Wastage by School 24
6. Is ‘Wastage’ Wastage? 33
7. Policy Pointers 38
References 42
Appendix A: Methods 45
Appendix B: Samples Compared to National Distributions 53
Executive Summary The DfES commissioned the Centre for Education and Employment Research at Liverpool University to investigate teacher turnover, wastage and destinations in the calendar year 2003. The study was, in part, a continuation and replication of research into the factors affecting teachers’ decisions to leave the profession in 2002. The focus of the present project was retention differences between schools.
Key Findings There were fewer resignations in 2003 than 2002, with the drop mainly due to fewer moves between primary schools, perhaps reflecting decreased opportunities associated with falling rolls. Turnover of full-time primary teachers was down from15.3 to 13.6 per cent, and of secondary teachers from 13.1 to 12.8 per cent, but wastage rates remained unchanged at respectively 9.2 and 7.2 per cent.
Turnover, but not wastage, of teachers from secondary schools was found to correlate with GCSE results (inversely), eligibility for free school meals and special needs, suggesting that there tended to be movement away from schools in the morechallenging circumstances.
Comparing schools grouped on these characteristics confirmed the pattern for turnover in secondary schools. Wastage in secondary schools and turnover and wastage in primary schools were similar, but did not reach statistical significance because of the wide variation between schools.
School retention rates were also found to be related to size and funding category. Turnover tended to be higher in middle schools perhaps not unconnected with reorganisation to primary/secondary in a number of authorities.
There were indications of a pattern across schools receiving grants and awards, although individual comparisons did not reach statistical significance. Wastage tended to be lower in schools receiving extra funding perhaps reflecting enhanced teacher affordability. Secondary schools given recognition through beacon or leading-edge status tended have lower turnover and wastage.
Leavers from the profession in 2003, as in 2002, tended to come disproportionately from either the young, or those older and approaching retirement. Turnover amongthe under 30s was about 25 per cent. About half were moves to other schools. Turnover among the over 50s was about 12 per cent, but most of this was wastage.
Turnover and wastage rates tended to be higher among women than men, greater from schools in London, the East and South East than other parts of the country, and there were indications that loss could be higher from shortage subjects.
About a quarter of the leavers from primary schools thought it likely that they would return to teach full-time, as did about 16 per cent of the secondary leavers. It was the younger leavers, those with five years’ service or less, female leavers and those leaving schools in London who were most likely to expect to return.
i
AimsThe investigation had four main aims:
to quantify turnover and wastage of teachers in 2003 and compare the rates of loss with previous years;
to identify the destinations of those leaving;
to compare turnover in, and wastage from, different types of schools;
to assess the likelihood of return of teachers leaving the profession.
BackgroundThe study was commissioned to continue research begun in 2002. This focused on factors affecting teachers’ decisions to leave the profession. Previous monitoring by the DfES and the Employers’ Organisation for Local Government had provided a statistical description of how many teachers were leaving schools (turnover) and leaving the maintained sector (wastage). There had also been some quantitative and qualitative studies which had contributed some understanding of the reasons and destinations, both nationally and locally. The 2002 study (Smithers and Robinson, 2003a) drew these findings together, presented new information based on surveys, interviews and a follow-up study, and offered some policy pointers. The present study was designed to determine whether the trends revealed had continued and, in particular, to consider differences between schools.
MethodologySchools participating in the 2002 study were surveyed again close to the three resignation dates in 2003 to discover how many teachers were leaving and where they were going. Teachers leaving the profession were sent questionnaires via the schools.
Response rates were very good, at least 75 per cent in the schools’ surveys. Fromamong those schools responding on all three occasions, structured samples of 5 per cent of primary schools (N=898) and 10 per cent of secondary schools, including middle deemed secondary (N=346), were constructed to reflect the populations in terms of region and size. The samples also corresponded closely with the national distributions of schools in terms of other characteristics.
The schools listed a total of 4,091 teachers leaving them during 2003. Questionnaires were sent, via the schools, to those leavers who were not going on to a full-time or part-time post in a maintained school, taking maternity leave or who had reached normal-age retirement and we received 884 responses.
We had available to us for each school a number of descriptors, of three kinds: pupil characteristics (eg performance, free school meals, special needs), organisational characteristics (eg size, type, age range, funding category) and grants and awards (eg Beacon status, Investors in People, Leadership Incentive Grant).
ii
FindingsResignations: Resignations from full-time posts fell in 2003 compared with 2002. Comparison of the same schools in the two years shows this reduction was mainly due to fewer moves between primary schools. Wastage from primary schools, and wastage and turnover from secondary schools remained at about the same levels in 2003 as in 2002, and down from the peak in 2001.
Destinations: The overall shape of the results in 2003 for both the primary and secondary phases across the different contracts and by gender was similar to that in 2002 suggesting that there is a statistical consistency in the populations of teachers. The main change in 2003 was fewer moves between full-time posts in primary schools.The emerging feature to note is the effect of falling pupil numbers on the requirementfor teachers, at present in primary schools, but soon to affect secondary schools.
Turnover and Wastage Across the Maintained Sector: Turnover and wastage rates are higher in the primary phase and higher for women than men. In part, this is due to maternity, but male primary teachers are also more likely to leave than their secondary counterparts. Turnover among teachers under 30 is about 25 per cent. About half of this is, however, for moves to other schools. Although turnover among older teachers is lower, most of this is wastage. Wastage rates were higher among younger and older teachers than those aged 30-49. There was regional variation with loss generally greater in London, the East and South East than other parts of the country. Changes in pupil numbers and the age profile of the teachers are likely to have been among the factors contributing to the different rates. No evidence was found that full-timeteachers from ethnic minority groups are more likely to leave. There was, however, some suggestion of higher rates of loss among teachers of the core subjects of English, mathematics and science.
Turnover and Wastage by School: Teacher retention rates were found to vary with type of school. Turnover was found to be higher in secondary schools with poorer academic performance, higher eligibility for free school meals, and having proportionally more pupils with special needs. Analysis of variance of graded groups showed similar patterns in primary schools and for wastage, but they did not reach statistical significance because of the wide variation between schools. Differences were found also with respect to size, type, age range, and funding category. Turnover tended to be particularly high in middle schools whether deemed primary or secondary.Turnover and wastage tended to be higher in community schools than other funding categories. Turnover and wastage tended to be lower in Beacon and Leading Edge secondary schools, and wastage lower in schools in Education Action Zones and Excellence in Cities areas and those receiving a Leadership Incentive Grant.
Likelihood of Return: Overall about a quarter of the primary leavers and about 16 per cent of the secondary leavers thought it likely they would return to teach full-time.Within those broad phase groupings, it was the younger leavers, those with five years’ service or under, female leavers, and those leaving schools in London who were mostlikely to expect to return.
iii

Policy Pointers 1. An emerging aspect of teacher wastage is the loss of potentially valuable teachers through redundancy or non-renewal of fixed-term contracts. Consideration should be given to developing a strategy for managing redundancy, in particular, how best to support those wishing to find new posts.
2. Schools, particularly in the secondary phase, with low achieving pupils, with high eligibility for free schools meals, and with an above average proportion with special needs, tend to find it more difficult to retain staff. Further consideration should be given as to how to attract and retain good teachers in those schools.
3. Progress towards recruiting and retaining teachers in schools which have found it persistently difficult to maintain a full complement of good staff, including existing schemes and proposals from the STRB, should be reviewed in the light of the new evidence and policies.
4. Wastage is related to age and length of service with those at the two ends of the spectrum more likely to go, but for different reasons. Could more be done to retain these teachers?
5. There are suggestions of higher turnover rates in the shortage subjects, but conclusive comparisons await better national statistics on school staffing by subject.
6. In seeking to encourage re-entry, there are some groups who should be targeted, for example, young people coming back to this country from travelling or teaching abroad, or mothers looking for flexible part-time posts, or resignees looking to move from one part of the country to another.
7. The considerable differences between the primary and secondary phases should be recognised and consideration should be given to explicitly developing separate policies for them.
iv
1. Introduction1.1 The Centre for Education and Employment Research at the University of Liverpool
has been commissioned by the DfES to continue and partly replicate a study which it had funded of teachers’ decisions to leave the profession in 2002 (Smithers and Robinson, 2003a).
Remit1.2 The main purpose of the continuation study is to quantify turnover, wastage and
destinations, particularly in relation to previous years, and at the school level. The brief specified the main aims as:
to quantify turnover and wastage of teachers in 2003 and compare the rates of loss with previous years;
to record the destinations of those leaving;
to compare turnover in, and wastage from, different types of schools;
to assess the likelihood of return of teachers leaving the profession.
BackgroundContext
1.3 The 2002 study was commissioned against a background of increasing concern over recruiting and retaining enough teachers of sufficient quality. It was noted that this was not a problem unique to England. The Information Network on Education in Europe had recently published the first two in a series of reports on the teaching profession (Eurydice, 2002a,b) in which it found that, of 31 countries providing information, 21 including England reported shortages, six reported a surplus which itself can be a problem, and only four a reasonable balance. Monitoring of teacher demand and supply in England is generally good and it was one of only four countries that were able to provide Eurydice with comprehensive trend data.
Teacher Supply 1.4 Nevertheless, the DfES recognised that more data are needed. Policy decisions
aimed at maintaining a full complement of high quality staff in schools require both up-to-date information and an understanding of the complex processes involved. Early research on teacher supply was dominated by studies of recruitment(Edmonds, Sharp and Benefield, 2002). More recently, teacher retention has become the focus, particularly in America.
Teacher Retention 1.5 The first large scale study of teacher resignations in England and Wales was in 1991
(Robinson and Smithers, 1991). It drew a distinction between turnover (teachers leaving a school including to move to another school) and wastage (teachers leaving the maintained sector). Both have increased considerably in recent years (Smithersand Robinson, 2001). Quantitative and qualitative research studies have provided some understanding of the reasons for quitting and some description of the destinations of those leaving. Excessive workload has been a recurring theme
1
(Varlaam, Nuttall and Walker, 1992; Scott, 1999; Wilkins and Head, 2002). Poor pupil behaviour, particularly in the secondary phase, is another important factor (Smithers and Robinson, 2001; General Teaching Council, 2003). Relative salary has also emerged as an issue (Dolton and Klaauw, 1995, 1999), as has work-life balance (Sturman, 2002; Troman and Woods, 2001).
1.6 There are differences with region and subject. Hutchings, Menter, Ross, and Thomson, with Bedford (2000) found that the demographic profile of teachers in London is different from much of the rest of the country with more short-termteachers, both young recently trained and from overseas. The high cost of living and the greater differential with other professions in the capital were identified as majorfactors in the high turnover (Cunningham, 2000). Elsewhere, the teaching profession is ageing, with the government in 2001 acknowledging that 45 per cent of serving teachers will reach 60 in the next 15 years (DfES, 2001), and few teachers serve to that age. Blackwell, Lynch and Jones (2001) have shown that the physical sciences are particularly vulnerable to teacher ageing. Teachers from some subjects seem more likely to leave prematurely, for example, those offering German (Pachler, 2001). An early study (Gooding, 1989) found that relatively few former teachers return to the classroom.
The 2002 Study 1.7 The 2002 study of factors affecting teachers’ decisions to the leave the profession
(Smithers and Robinson, 2003a) had two main purposes: to provide an accurate picture of teacher loss and to get behind the figures to tease out the underlying motivations of teachers leaving the profession. The main findings were that:
both turnover and wastage were lower than in 2001, following the sharp increases there had been in the previous three years;
five main factors influenced decisions to leave: workload, wanting a new challenge, the school situation (including pupil behaviour), salary and personal circumstances;
leavers tended to be either young with a few years’ service or older and approaching retirement, to be female, and to come from the shortage subjects;
older leavers tended to cite workload and younger leavers, travel, salary and personal circumstances, as the reasons for leaving;
teachers in London and the south and east were more likely to move to other schools and leave the profession than teachers in the north and midlands;
only about 20 per cent of the leavers from full-time posts thought it ‘likely’ they would return to the classroom full-time compared to over 55 per cent who thought it ‘unlikely’;
likelihood of return was inversely related to age and length of service, with those leaving to travel or teach abroad the most likely to return and those leaving for other employment, independent schools or retirement the least;
2
most of the leavers followed up one or two terms after quitting were sure they had done the right thing, though some 10 per cent had in fact accepted new contracts in maintained schools, usually part-time.
Recent Research and Developments 1.8 Since the evidence on teacher provision was reviewed in Smithers and Robinson
(2003a) several new studies and reports have appeared.
Teacher Retention 1.9 The National Commission on Teaching and America’s Future (2003) has underlined
its analysis of the staffing crisis in the United States by dubbing teaching, “the revolving door profession”. Drawing on the work of Ingersoll (2003), it calculated that roughly a third of all teachers entered or departed their schools annually. It found that except in maths, science, special education and bi-lingual education supply is sufficient to meet demand. This led it to conclude that there has been a misdiagnosis of the problem: “the conventional wisdom is that we lack enough good teachers. But the conventional wisdom is wrong. The real school staffing problem is teacher retention (emphasis original)”. Furthermore high turnover is aggravated by “hiring unqualified and under prepared replacements who leave teaching at very high rates”. The National Commission has proposed that teacher retention should be improved by at least 50 per cent by 2006 using various incentives and rewards. It has recommended a number of ‘action steps’ under the headings of ‘organising schools for teaching and learning success’, ‘quality teacher preparation’, ‘accreditation and licensure’, and ‘building a professionally rewarding career in teaching’.
Reviews1.10 A third report in the Information Network on Education in Europe series on the
teaching profession has appeared. It is devoted to working conditions and pay in lower-secondary education (Eurydice, 2003) and is based on two premises: that the attractiveness of teaching, as of other occupations, depends largely on an optimalcombination of working conditions; and, secondly, that good salary prospects do not in themselves generally guarantee that a profession will be attractive. Its diagnosis is that reforms to school education over the last ten years, alongside society’s new expectations of teachers, have created new tasks and responsibilities for teachers. Yet the perception persists, in at least some countries, that the teachers’ workload is less than that of other professions.
1.11 Eurydice (2003) found that in some countries both teaching tasks and teaching timeare statutorily defined. But England is one of a group, including Denmark and Sweden, where employers have considerable leeway in determining requirements.This can lead to an excessive workload for teachers. Changes to working practices and increased workload have fuelled work-related stress, but the report found there were few formal arrangements to support teachers. However, across the participating countries, the profession tended to have the benefit of relatively good job security and a high level of protection against redundancy, but only modestsalaries. Relative to per capita GDP minimum basic salary in England compareswell with other countries.
3
1.12 A fourth and final report in the series (due January 2004, but not yet published) is planned to examine the major reforms that have affected the teaching profession and the reasons underlying them. It will draw together the findings of the first three reports, considering in particular professional identity and the influences on staying or leaving.
1.13 Elsewhere, the widespread concern over the adequacy of teacher provision led OECD Education Ministers in 2001 to identify teaching and learning as one of the four key areas for the new education mandate. The Education Committee in 2002 agreed to undertake a programme of work on ‘Promoting Quality Teaching and Learning’, with teacher policy as its focus. This was later refined to ‘Aspects of Teacher Policy dealing with how to Attract, Recruit, Develop and Retain Effective Teachers’ (OECD, 2002). Two background papers have been published – by Santiago and Coolahan. Santiago (2002) reviewed the issues, concluding that in a number of countries the age profile of teachers is skewed toward the older end of the age range and is worsening, that relative salaries have declined in recent years, that proportionally fewer teachers hold regular teaching licences and that more teachers are teaching outside their subjects. Coolahan (2002) examined teacher education and the teaching career in an era of lifelong learning. He proposed that the concept of the ‘3Is’ – initial, induction and inservice education – should be fully adopted as established policy.
1.14 The methodology followed by the OECD involves two complementary strands: analytical review and thematic country review. Two working papers have been published as part of the analytical review. Dolton, Tremayne, and Chung (2003) have carried out an econometric analysis showing that teacher supply is related to the economic cycle. They found that in the UK relative wages appear to remain an important factor affecting the teacher labour market, with male teachers more likely to be affected than female teachers. In policy terms, the evidence suggests that relative wages might be used as a ‘tool’ to improve teacher supply. The second paper, Mulford (2003), focuses on school leadership and the impact on teacher and school effectiveness. He suggests that the key relationships in the ways school leaders strengthen teacher recruitment, development and retention have been shown to be teacher satisfaction, school effectiveness, improvement capacity, professional autonomy, distributive leadership and organisational learning. School leaders also have an important role as a “buffer against the excesses of the mounting and sometimes contradictory external pressures”.
1.15 In tandem with the analytical review, thematic country reviews are being undertaken within a framework specified by the OECD covering the administration and management of the recruitment, development and retention of teachers. The description for the UK was prepared by Ross and Hutchings (2003). They report that although the educational systems of the four constituent countries - England, Wales, Northern Ireland and Scotland – differ in many ways in all of them “teacher retention is at least as much of a concern as recruitment”. Teacher workload has been identified as a key factor. “All four administrations are taking steps to ensure that workload patterns are reduced, career patterns and remuneration addressed, and the nature and status of the profession is recognised and enhanced.”
4
1.16 Teacher provision has also been reviewed in Wales by White, See, Gorard. and Robert (2003). They were commissioned by the General Teaching Council there to conduct “a detailed desk based study of existing secondary sources on teacher recruitment and retention”, including the collection and analysis of relevant secondary data. The report challenges what it describes as “the dominant discourse”.It argues that there is no supply crisis in Wales, nor is there in most of England. “There are some regional, occasional and subject-specific disparities”. But, it suggests, there are more trained teachers than ever before and the major constraint on new supply is the allocation of places, not the quality or availability of applicants.It is noted that vacancy levels correlate with the pupil-teacher ratio, with the low PTR in Inner London associated with a high level of vacancies while the reverse is the case for regions like the South West. The report does, however, recognise the role of turnover in creating vacancies and it suggests that there should be further research to determine whether divergence in vacancy rates is “indeed a problem of supply, or simply one of increased turnover”.
1.17 Another review is attempted by Cockburn and Haydn (2004). They argue that the crisis in the teacher supply and demand balance is not being adequately addressed because there is insufficient understanding of teachers’ lives, aspirations and work situations. Drawing together the evidence from the literature and some small-scalestudies of their own, they pose a number of questions: what do job seekers want; what factors influence trainees’ experience in schools; what are trainee teachers looking for in their first posts; what do teachers want in their jobs; how do schools attract and retain good teachers and finally what can schools do? They suggest that schools should look to their own arrangements for recruiting and retaining new teachers. Some of the so-called ‘soft factors’ such as the physical surroundings in the school, including the staff room, are highlighted. Support for teachers particularly early professional development, ‘planning time’ for teachers, management style and the general ‘climate of the school are pinpointed as potential areas for improvement. Policy makers are urged to listen to teachers and headteachers, and to take their advice. The report advocates acknowledging teachers’ professionalism to counteract the negative effects of accountability. It also calls for a reduction in prescription and bureaucracy in schools.
The Present Project 1.18 The present project is, in part, an attempt to replicate the findings of the 2002 study.
While, however, the focus of that study was the factors influencing individual decisions, the thrust of the current research is differences between schools.
Methods1.19 Essentially the same approach has been adopted as in 2002. Schools who had
participated in 2002 were sent a questionnaire close to the three teacher resignation dates in February, May and October. The school questionnaire was the same as in 2002 except the request for background information was simplified since this was already on file. For each teacher resigning, the school was asked to provide (anonymously) details of the post relinquished, characteristics of the leaver, and destination.
5
1.20 A leaver questionnaire was sent, via the schools, to those resigning or coming to the end of fixed-term contracts who were not going on to a full-time or part-time post in a maintained school, taking maternity leave or who had reached normal-ageretirement. This was a scaled down two-page version of the questionnaire used in 2002 when the focus was on reasons for leaving. The first page asked for somepersonal details from the leaver, such as age and years teaching, which were not likely to be readily available to the school, and the second asked about destination (as a check on the schools’ information) and likelihood of a return to teaching. The methods are described in full in Appendix A.
1.21 The DfES made available to us, in confidence, information on schools which has enabled us to examine turnover and wastage by individual school. Among the data provided were:
the number of qualified full-time teachers (permanent and fixed-termtogether);
the proportion of pupils in each school who were eligible for free school meals;
the percentage of pupils with special needs: (a) with statements; and (b) without statements;
whether the school was eligible for a Leadership Incentive Grant;
whether the school was within an Education Action Zone or an Excellence in Cities area;
whether the school had been designated as a Beacon School or has been chosen as a lead school in the Leading Edge Programme;
whether the school has been recognised as an Investor in People.
1.22 From the DfES website we were able to obtain also the Key Stage 2 results for mostof the primary schools in the sample teaching this age range (but some were too small to have their results listed), and the GCSE results of most of the secondary schools in the sample in which pupils were entered for the exam (30 schools were middle deemed secondary).
Analysis1.23 Turnover and wastage at school level is an important new area of inquiry, but as we
discuss in Appendix A (paragraphs A23-A25) averaging the individual school rates leads to slightly different estimates of the overall rates than are arrived at by dividing the total number of leavers by the total teacher complement. Turnover and wastage rates also come out differently according to how they are defined and who is being compared. In Smithers and Robinson (2003a) we devoted a chapter (Chapter 5, page 38 et seq) to examining in detail the very different values obtained by the DfES and the Employers’ Organisation for Local Government, and we calculated turnover and wastage in a number of different ways conforming to the different definitions.
6
1.24 In this report, for simplicity and comparability, we stay where possible with the DfES’ definitions. This means that, in the main, we concentrate on teachers leaving full-time posts (both permanent and fixed term). Turnover is defined as teachers leaving full-time posts whatever the destination. Wastage is loss of full-timeteachers to other than full-time posts in maintained schools. Calculation of the rates throughout most of the report is based on totals so that trends can be examined, but in Chapter 5 the overall rates are the averages of those of the individual schools. Comparison of schools in Chapter 5 is by one-way analysis of variance, and associations are explored through Pearson’s product-moment correlation coefficient. The wide variation in individual school rates means that only large differences comeout as statistically significant, so we also comment on indicative differences that do not reach significance.
The Report 1.25 We begin our account of the findings, in Chapter 2, by considering all teachers
leaving schools, irrespective of whether they are moving to another maintainedschool or leaving the sector, and asking how do the numbers compare with last year and previous years? Having established the extent and nature of the differences we turn, in Chapter 3, to considering the destinations of the leavers, again looking at how they compare with last year.
1.26 Two major analytical chapters follow in which variations in teacher loss in different categories and by type of school are examined. In the first, Chapter 4, turnover and wastage are compared across the maintained sector by phase, region, gender, age, ethnic background and subject, using the national populations as a basis for calculating the percentage losses. In the second, Chapter 5, we calculate turnover and wastage for each school in the samples on the basis of the school-level information provided by the DfES. Comparisons are made in terms of pupil characteristics (for example, test and examination performance), organisational characteristics (for example, size) and the grants and awards received (for example,Beacon status). The main question addressed is: are some types of schools moreable to retain their teachers?
1.27 In Chapter 6 we return to a question first posed in the 2002 study: what is the likelihood of the leavers returning? We first look to see if the picture emerging in 2002 is confirmed and then examine how the likelihood of returning varies with age, length of service, gender, and region. As last year, it is possible to identify somepolicy pointers in the evidence and these are set out in Chapter 7. The appendices give full details of the methods, and compare the samples with the populations of primary and secondary schools on a number of characteristics where the national distributions are known.
7
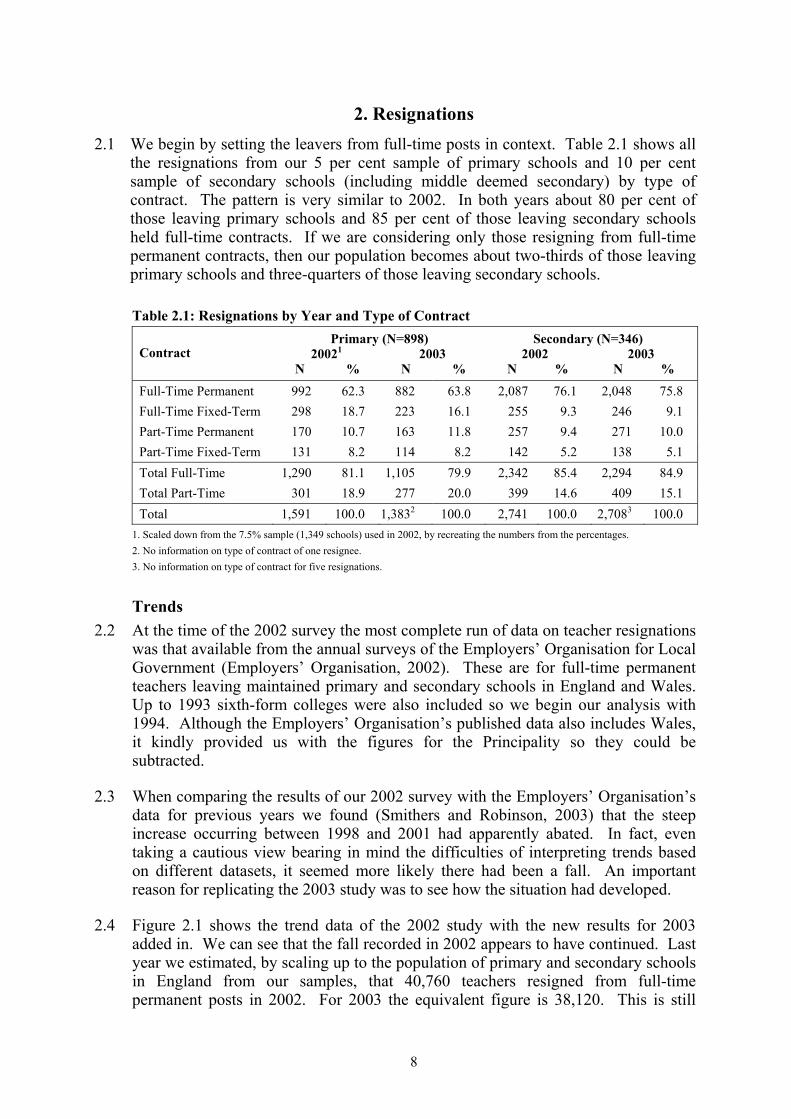
2. Resignations 2.1 We begin by setting the leavers from full-time posts in context. Table 2.1 shows all
the resignations from our 5 per cent sample of primary schools and 10 per cent sample of secondary schools (including middle deemed secondary) by type of contract. The pattern is very similar to 2002. In both years about 80 per cent of those leaving primary schools and 85 per cent of those leaving secondary schools held full-time contracts. If we are considering only those resigning from full-timepermanent contracts, then our population becomes about two-thirds of those leaving primary schools and three-quarters of those leaving secondary schools.
Table 2.1: Resignations by Year and Type of Contract Primary (N=898) Secondary (N=346)
20021 2003 2002 2003ContractN % N % N % N %
Full-Time Permanent 992 62.3 882 63.8 2,087 76.1 2,048 75.8Full-Time Fixed-Term 298 18.7 223 16.1 255 9.3 246 9.1Part-Time Permanent 170 10.7 163 11.8 257 9.4 271 10.0Part-Time Fixed-Term 131 8.2 114 8.2 142 5.2 138 5.1Total Full-Time 1,290 81.1 1,105 79.9 2,342 85.4 2,294 84.9Total Part-Time 301 18.9 277 20.0 399 14.6 409 15.1Total 1,591 100.0 1,3832 100.0 2,741 100.0 2,7083 100.0
1. Scaled down from the 7.5% sample (1,349 schools) used in 2002, by recreating the numbers from the percentages.2. No information on type of contract of one resignee.3. No information on type of contract for five resignations.
Trends2.2 At the time of the 2002 survey the most complete run of data on teacher resignations
was that available from the annual surveys of the Employers’ Organisation for Local Government (Employers’ Organisation, 2002). These are for full-time permanentteachers leaving maintained primary and secondary schools in England and Wales. Up to 1993 sixth-form colleges were also included so we begin our analysis with 1994. Although the Employers’ Organisation’s published data also includes Wales, it kindly provided us with the figures for the Principality so they could be subtracted.
2.3 When comparing the results of our 2002 survey with the Employers’ Organisation’s data for previous years we found (Smithers and Robinson, 2003) that the steep increase occurring between 1998 and 2001 had apparently abated. In fact, even taking a cautious view bearing in mind the difficulties of interpreting trends based on different datasets, it seemed more likely there had been a fall. An importantreason for replicating the 2003 study was to see how the situation had developed.
2.4 Figure 2.1 shows the trend data of the 2002 study with the new results for 2003 added in. We can see that the fall recorded in 2002 appears to have continued. Last year we estimated, by scaling up to the population of primary and secondary schools in England from our samples, that 40,760 teachers resigned from full-timepermanent posts in 2002. For 2003 the equivalent figure is 38,120. This is still
8
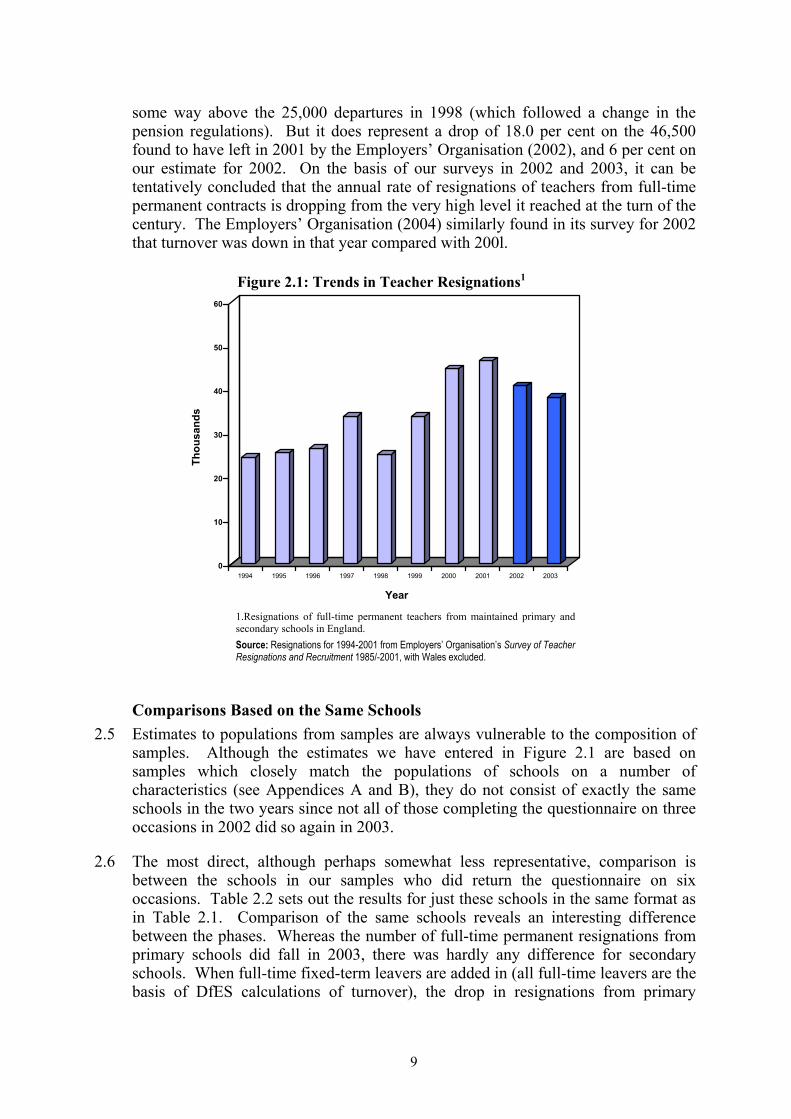
some way above the 25,000 departures in 1998 (which followed a change in the pension regulations). But it does represent a drop of 18.0 per cent on the 46,500 found to have left in 2001 by the Employers’ Organisation (2002), and 6 per cent on our estimate for 2002. On the basis of our surveys in 2002 and 2003, it can be tentatively concluded that the annual rate of resignations of teachers from full-timepermanent contracts is dropping from the very high level it reached at the turn of the century. The Employers’ Organisation (2004) similarly found in its survey for 2002 that turnover was down in that year compared with 200l.
Figure 2.1: Trends in Teacher Resignations1
0
10
20
30
40
50
60
Thousands
1994 1995 1996 1997 1998 1999 2000 2001 2002 2003
Year
1.Resignations of full-time permanent teachers from maintained primary and secondary schools in England.Source: Resignations for 1994-2001 from Employers’ Organisation’s Survey of Teacher Resignations and Recruitment 1985/-2001, with Wales excluded.
Comparisons Based on the Same Schools 2.5 Estimates to populations from samples are always vulnerable to the composition of
samples. Although the estimates we have entered in Figure 2.1 are based on samples which closely match the populations of schools on a number of characteristics (see Appendices A and B), they do not consist of exactly the sameschools in the two years since not all of those completing the questionnaire on three occasions in 2002 did so again in 2003.
2.6 The most direct, although perhaps somewhat less representative, comparison is between the schools in our samples who did return the questionnaire on six occasions. Table 2.2 sets out the results for just these schools in the same format as in Table 2.1. Comparison of the same schools reveals an interesting difference between the phases. Whereas the number of full-time permanent resignations fromprimary schools did fall in 2003, there was hardly any difference for secondary schools. When full-time fixed-term leavers are added in (all full-time leavers are the basis of DfES calculations of turnover), the drop in resignations from primary
9
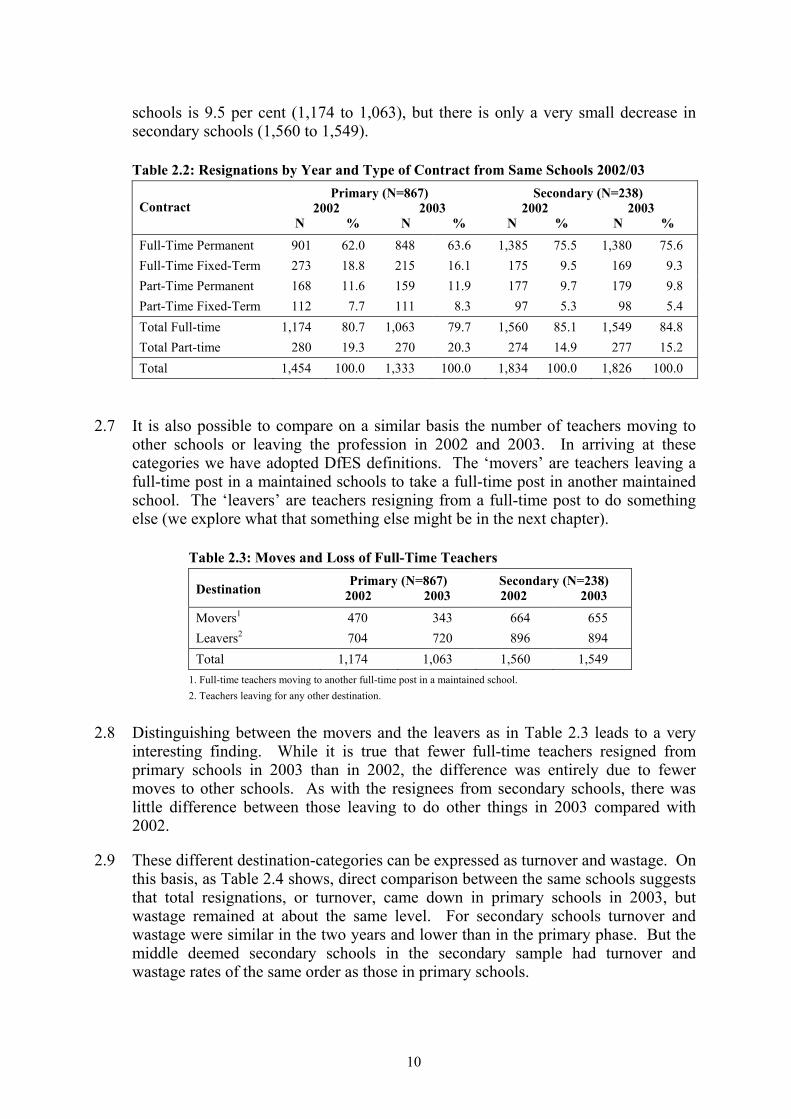
schools is 9.5 per cent (1,174 to 1,063), but there is only a very small decrease in secondary schools (1,560 to 1,549).
Table 2.2: Resignations by Year and Type of Contract from Same Schools 2002/03 Primary (N=867) Secondary (N=238)
2002 2003 2002 2003ContractN % N % N % N %
Full-Time Permanent 901 62.0 848 63.6 1,385 75.5 1,380 75.6Full-Time Fixed-Term 273 18.8 215 16.1 175 9.5 169 9.3Part-Time Permanent 168 11.6 159 11.9 177 9.7 179 9.8Part-Time Fixed-Term 112 7.7 111 8.3 97 5.3 98 5.4Total Full-time 1,174 80.7 1,063 79.7 1,560 85.1 1,549 84.8Total Part-time 280 19.3 270 20.3 274 14.9 277 15.2Total 1,454 100.0 1,333 100.0 1,834 100.0 1,826 100.0
2.7 It is also possible to compare on a similar basis the number of teachers moving to other schools or leaving the profession in 2002 and 2003. In arriving at these categories we have adopted DfES definitions. The ‘movers’ are teachers leaving a full-time post in a maintained schools to take a full-time post in another maintainedschool. The ‘leavers’ are teachers resigning from a full-time post to do somethingelse (we explore what that something else might be in the next chapter).
Table 2.3: Moves and Loss of Full-Time TeachersPrimary (N=867) Secondary (N=238) Destination 2002 2003 2002 2003
Movers1 470 343 664 655Leavers2 704 720 896 894Total 1,174 1,063 1,560 1,549
1. Full-time teachers moving to another full-time post in a maintained school. 2. Teachers leaving for any other destination.
2.8 Distinguishing between the movers and the leavers as in Table 2.3 leads to a very interesting finding. While it is true that fewer full-time teachers resigned fromprimary schools in 2003 than in 2002, the difference was entirely due to fewer moves to other schools. As with the resignees from secondary schools, there was little difference between those leaving to do other things in 2003 compared with 2002.
2.9 These different destination-categories can be expressed as turnover and wastage. On this basis, as Table 2.4 shows, direct comparison between the same schools suggests that total resignations, or turnover, came down in primary schools in 2003, but wastage remained at about the same level. For secondary schools turnover and wastage were similar in the two years and lower than in the primary phase. But the middle deemed secondary schools in the secondary sample had turnover and wastage rates of the same order as those in primary schools.
10
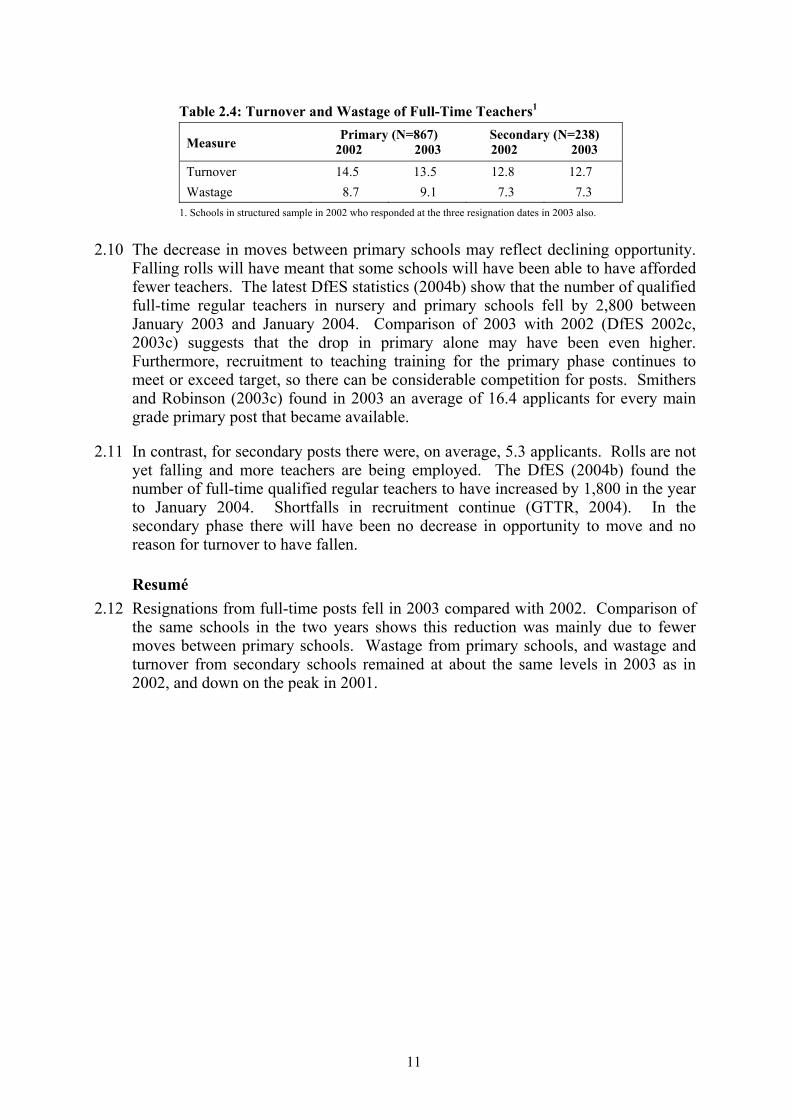
Table 2.4: Turnover and Wastage of Full-Time Teachers1
Primary (N=867) Secondary (N=238) Measure 2002 2003 2002 2003
Turnover 14.5 13.5 12.8 12.7Wastage 8.7 9.1 7.3 7.3
1. Schools in structured sample in 2002 who responded at the three resignation dates in 2003 also.
2.10 The decrease in moves between primary schools may reflect declining opportunity. Falling rolls will have meant that some schools will have been able to have afforded fewer teachers. The latest DfES statistics (2004b) show that the number of qualified full-time regular teachers in nursery and primary schools fell by 2,800 between January 2003 and January 2004. Comparison of 2003 with 2002 (DfES 2002c, 2003c) suggests that the drop in primary alone may have been even higher. Furthermore, recruitment to teaching training for the primary phase continues to meet or exceed target, so there can be considerable competition for posts. Smithersand Robinson (2003c) found in 2003 an average of 16.4 applicants for every maingrade primary post that became available.
2.11 In contrast, for secondary posts there were, on average, 5.3 applicants. Rolls are not yet falling and more teachers are being employed. The DfES (2004b) found the number of full-time qualified regular teachers to have increased by 1,800 in the year to January 2004. Shortfalls in recruitment continue (GTTR, 2004). In the secondary phase there will have been no decrease in opportunity to move and no reason for turnover to have fallen.
Resumé2.12 Resignations from full-time posts fell in 2003 compared with 2002. Comparison of
the same schools in the two years shows this reduction was mainly due to fewer moves between primary schools. Wastage from primary schools, and wastage and turnover from secondary schools remained at about the same levels in 2003 as in 2002, and down on the peak in 2001.
11
3. Destinations 3.1 In Chapter 2 we divided destinations into moves to full-time posts in other
maintained schools and the rest. In this chapter we look in more detail at those other destinations.
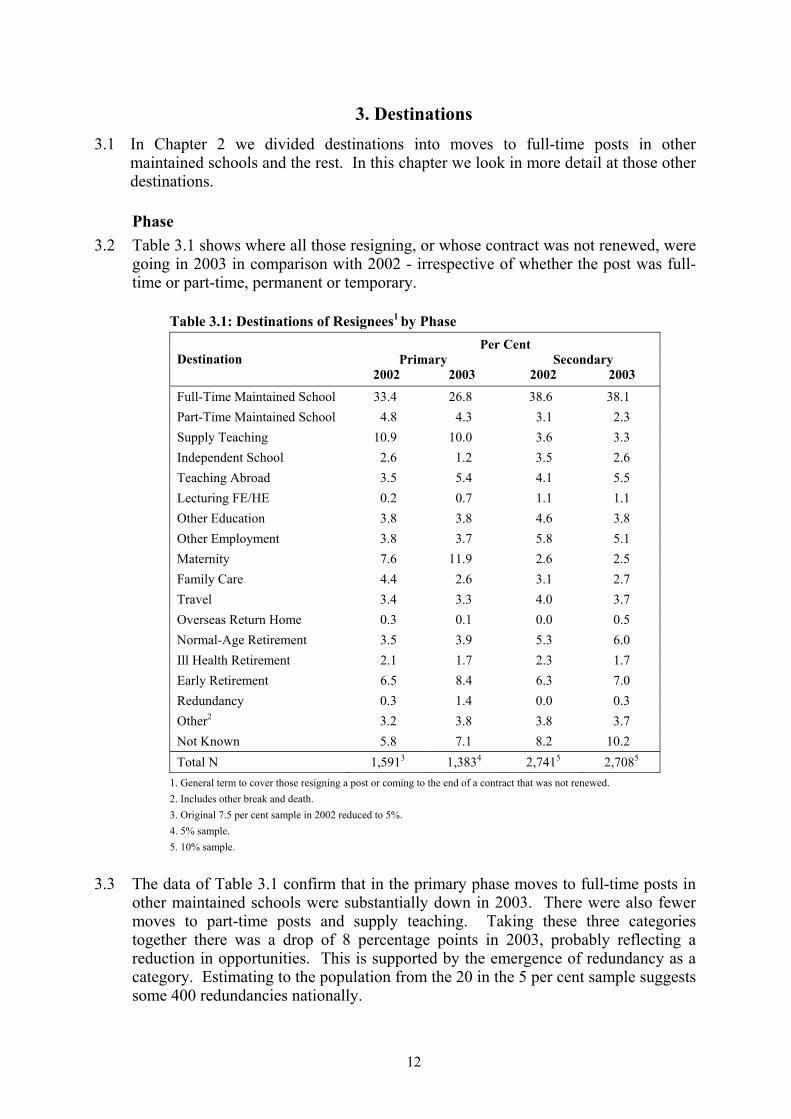
Phase3.2 Table 3.1 shows where all those resigning, or whose contract was not renewed, were
going in 2003 in comparison with 2002 - irrespective of whether the post was full-time or part-time, permanent or temporary.
Table 3.1: Destinations of Resignees1 by Phase Per Cent
Primary SecondaryDestination2002 2003 2002 2003
Full-Time Maintained School 33.4 26.8 38.6 38.1Part-Time Maintained School 4.8 4.3 3.1 2.3Supply Teaching 10.9 10.0 3.6 3.3Independent School 2.6 1.2 3.5 2.6Teaching Abroad 3.5 5.4 4.1 5.5Lecturing FE/HE 0.2 0.7 1.1 1.1Other Education 3.8 3.8 4.6 3.8Other Employment 3.8 3.7 5.8 5.1Maternity 7.6 11.9 2.6 2.5Family Care 4.4 2.6 3.1 2.7Travel 3.4 3.3 4.0 3.7Overseas Return Home 0.3 0.1 0.0 0.5Normal-Age Retirement 3.5 3.9 5.3 6.0Ill Health Retirement 2.1 1.7 2.3 1.7Early Retirement 6.5 8.4 6.3 7.0Redundancy 0.3 1.4 0.0 0.3Other2 3.2 3.8 3.8 3.7Not Known 5.8 7.1 8.2 10.2Total N 1,5913 1,3834 2,7415 2,7085
1. General term to cover those resigning a post or coming to the end of a contract that was not renewed.2. Includes other break and death.3. Original 7.5 per cent sample in 2002 reduced to 5%.4. 5% sample.5. 10% sample.
3.3 The data of Table 3.1 confirm that in the primary phase moves to full-time posts in other maintained schools were substantially down in 2003. There were also fewer moves to part-time posts and supply teaching. Taking these three categories together there was a drop of 8 percentage points in 2003, probably reflecting a reduction in opportunities. This is supported by the emergence of redundancy as a category. Estimating to the population from the 20 in the 5 per cent sample suggests some 400 redundancies nationally.
12
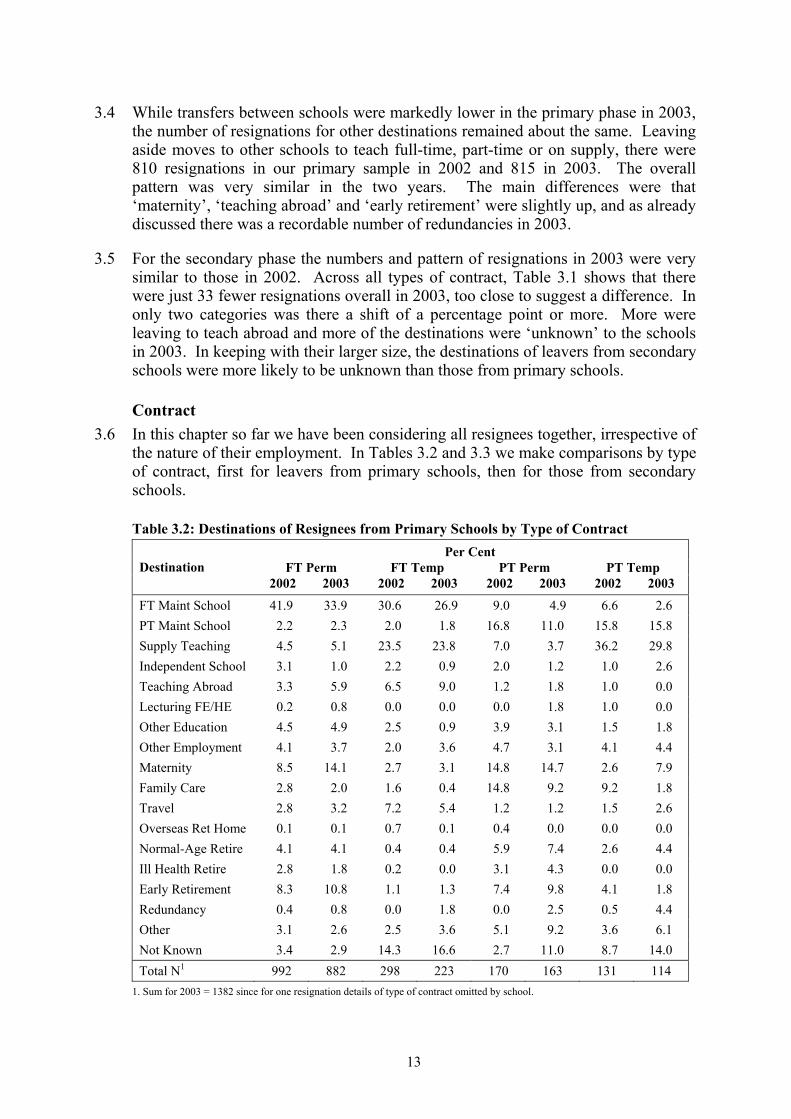
3.4 While transfers between schools were markedly lower in the primary phase in 2003, the number of resignations for other destinations remained about the same. Leaving aside moves to other schools to teach full-time, part-time or on supply, there were 810 resignations in our primary sample in 2002 and 815 in 2003. The overall pattern was very similar in the two years. The main differences were that ‘maternity’, ‘teaching abroad’ and ‘early retirement’ were slightly up, and as already discussed there was a recordable number of redundancies in 2003.
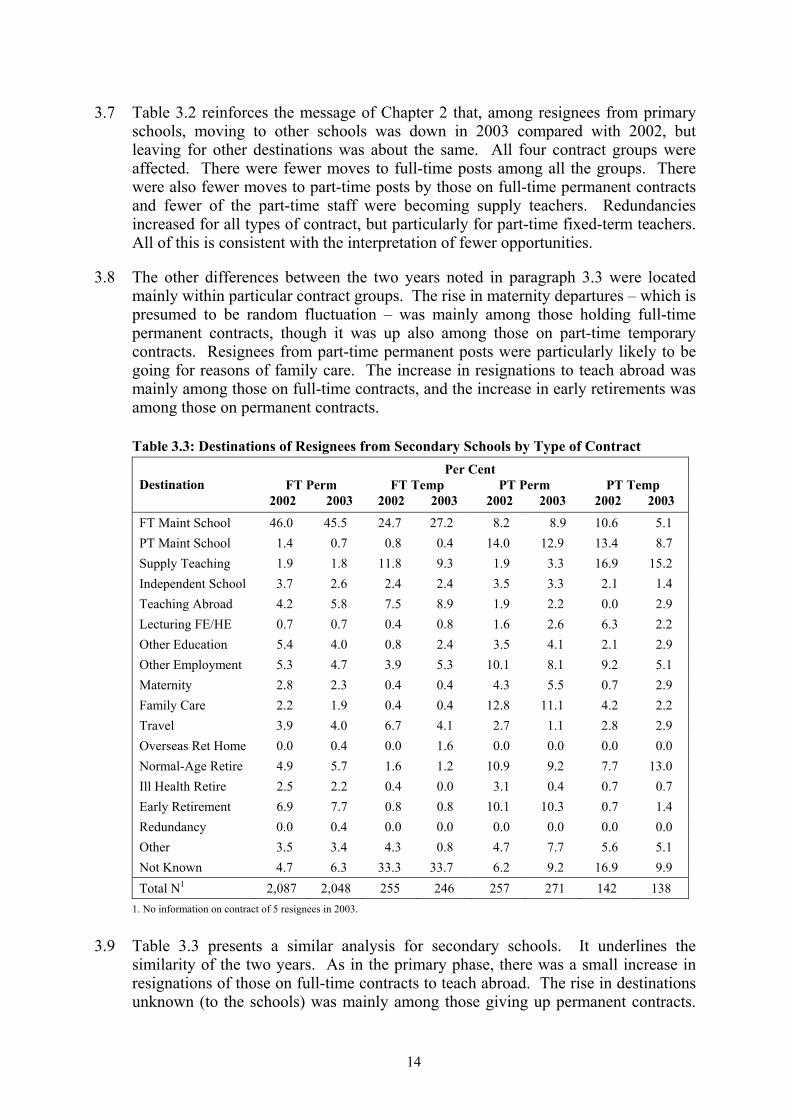
3.5 For the secondary phase the numbers and pattern of resignations in 2003 were very similar to those in 2002. Across all types of contract, Table 3.1 shows that there were just 33 fewer resignations overall in 2003, too close to suggest a difference. In only two categories was there a shift of a percentage point or more. More were leaving to teach abroad and more of the destinations were ‘unknown’ to the schools in 2003. In keeping with their larger size, the destinations of leavers from secondary schools were more likely to be unknown than those from primary schools.
Contract3.6 In this chapter so far we have been considering all resignees together, irrespective of
the nature of their employment. In Tables 3.2 and 3.3 we make comparisons by type of contract, first for leavers from primary schools, then for those from secondary schools.
Table 3.2: Destinations of Resignees from Primary Schools by Type of Contract Per Cent
FT Perm FT Temp PT Perm PT Temp Destination2002 2003 2002 2003 2002 2003 2002 2003
FT Maint School 41.9 33.9 30.6 26.9 9.0 4.9 6.6 2.6PT Maint School 2.2 2.3 2.0 1.8 16.8 11.0 15.8 15.8Supply Teaching 4.5 5.1 23.5 23.8 7.0 3.7 36.2 29.8Independent School 3.1 1.0 2.2 0.9 2.0 1.2 1.0 2.6Teaching Abroad 3.3 5.9 6.5 9.0 1.2 1.8 1.0 0.0Lecturing FE/HE 0.2 0.8 0.0 0.0 0.0 1.8 1.0 0.0Other Education 4.5 4.9 2.5 0.9 3.9 3.1 1.5 1.8Other Employment 4.1 3.7 2.0 3.6 4.7 3.1 4.1 4.4Maternity 8.5 14.1 2.7 3.1 14.8 14.7 2.6 7.9Family Care 2.8 2.0 1.6 0.4 14.8 9.2 9.2 1.8Travel 2.8 3.2 7.2 5.4 1.2 1.2 1.5 2.6Overseas Ret Home 0.1 0.1 0.7 0.1 0.4 0.0 0.0 0.0Normal-Age Retire 4.1 4.1 0.4 0.4 5.9 7.4 2.6 4.4Ill Health Retire 2.8 1.8 0.2 0.0 3.1 4.3 0.0 0.0Early Retirement 8.3 10.8 1.1 1.3 7.4 9.8 4.1 1.8Redundancy 0.4 0.8 0.0 1.8 0.0 2.5 0.5 4.4Other 3.1 2.6 2.5 3.6 5.1 9.2 3.6 6.1Not Known 3.4 2.9 14.3 16.6 2.7 11.0 8.7 14.0Total N1 992 882 298 223 170 163 131 114
1. Sum for 2003 = 1382 since for one resignation details of type of contract omitted by school.
13
3.7 Table 3.2 reinforces the message of Chapter 2 that, among resignees from primaryschools, moving to other schools was down in 2003 compared with 2002, but leaving for other destinations was about the same. All four contract groups were affected. There were fewer moves to full-time posts among all the groups. There were also fewer moves to part-time posts by those on full-time permanent contracts and fewer of the part-time staff were becoming supply teachers. Redundancies increased for all types of contract, but particularly for part-time fixed-term teachers. All of this is consistent with the interpretation of fewer opportunities.
3.8 The other differences between the two years noted in paragraph 3.3 were located mainly within particular contract groups. The rise in maternity departures – which is presumed to be random fluctuation – was mainly among those holding full-timepermanent contracts, though it was up also among those on part-time temporarycontracts. Resignees from part-time permanent posts were particularly likely to be going for reasons of family care. The increase in resignations to teach abroad was mainly among those on full-time contracts, and the increase in early retirements was among those on permanent contracts.
Table 3.3: Destinations of Resignees from Secondary Schools by Type of ContractPer Cent
FT Perm FT Temp PT Perm PT Temp Destination2002 2003 2002 2003 2002 2003 2002 2003
FT Maint School 46.0 45.5 24.7 27.2 8.2 8.9 10.6 5.1PT Maint School 1.4 0.7 0.8 0.4 14.0 12.9 13.4 8.7Supply Teaching 1.9 1.8 11.8 9.3 1.9 3.3 16.9 15.2Independent School 3.7 2.6 2.4 2.4 3.5 3.3 2.1 1.4Teaching Abroad 4.2 5.8 7.5 8.9 1.9 2.2 0.0 2.9Lecturing FE/HE 0.7 0.7 0.4 0.8 1.6 2.6 6.3 2.2Other Education 5.4 4.0 0.8 2.4 3.5 4.1 2.1 2.9Other Employment 5.3 4.7 3.9 5.3 10.1 8.1 9.2 5.1Maternity 2.8 2.3 0.4 0.4 4.3 5.5 0.7 2.9Family Care 2.2 1.9 0.4 0.4 12.8 11.1 4.2 2.2Travel 3.9 4.0 6.7 4.1 2.7 1.1 2.8 2.9Overseas Ret Home 0.0 0.4 0.0 1.6 0.0 0.0 0.0 0.0Normal-Age Retire 4.9 5.7 1.6 1.2 10.9 9.2 7.7 13.0Ill Health Retire 2.5 2.2 0.4 0.0 3.1 0.4 0.7 0.7Early Retirement 6.9 7.7 0.8 0.8 10.1 10.3 0.7 1.4Redundancy 0.0 0.4 0.0 0.0 0.0 0.0 0.0 0.0Other 3.5 3.4 4.3 0.8 4.7 7.7 5.6 5.1Not Known 4.7 6.3 33.3 33.7 6.2 9.2 16.9 9.9Total N1 2,087 2,048 255 246 257 271 142 138
1. No information on contract of 5 resignees in 2003.
3.9 Table 3.3 presents a similar analysis for secondary schools. It underlines the similarity of the two years. As in the primary phase, there was a small increase in resignations of those on full-time contracts to teach abroad. The rise in destinations unknown (to the schools) was mainly among those giving up permanent contracts.
14
‘Unknowns’ among those on full-time temporary contracts remained at the very high level of about a third.
3.10 Comparing just those resigning from full-time permanent contracts in the two phases brings out once more that in 2003 moves to full-time posts were down appreciably in the primary phase, but were sustained at the secondary level except for those leaving part-time temporary contracts. As in 2002, leavers from part-time posts were more likely to take part-time or supply posts. Going to teach abroad was up in both phases. But the rise in maternity leavers is striking. Three times higher in primary than secondary in 2002, the ratio rose to six in 2003. This substantial difference between the phases reflects the age and gender of the teaching staff.
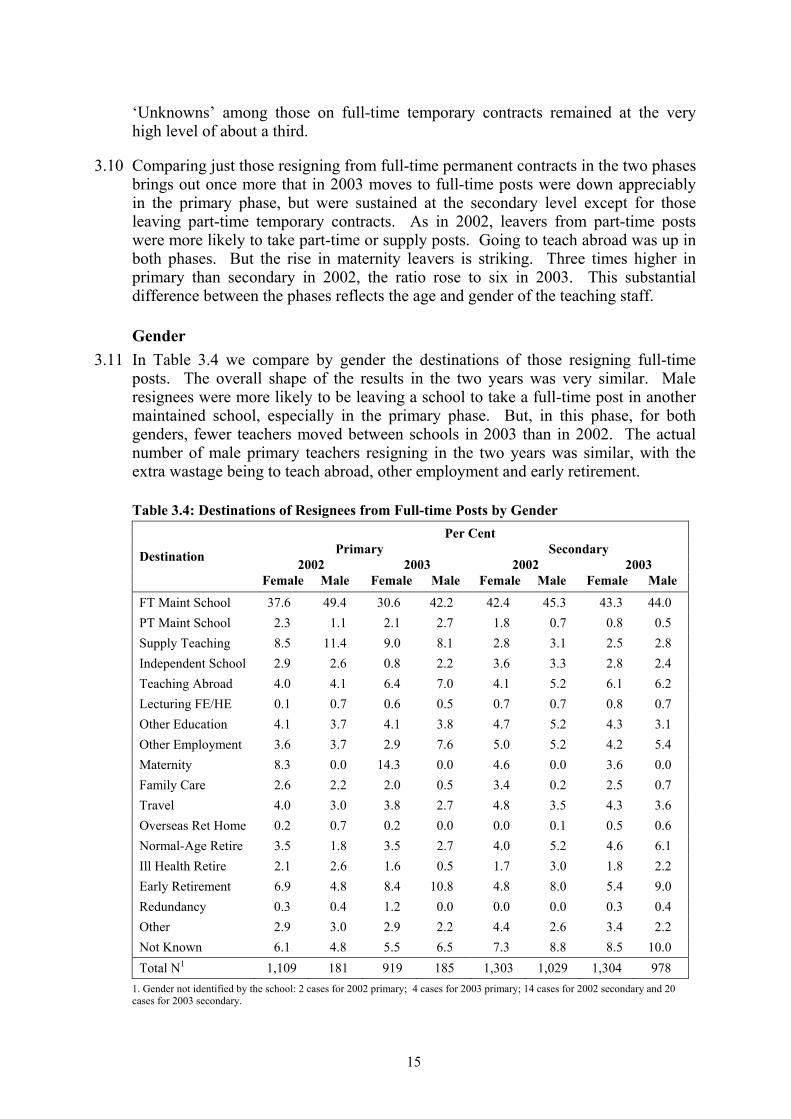
Gender3.11 In Table 3.4 we compare by gender the destinations of those resigning full-time
posts. The overall shape of the results in the two years was very similar. Male resignees were more likely to be leaving a school to take a full-time post in another maintained school, especially in the primary phase. But, in this phase, for both genders, fewer teachers moved between schools in 2003 than in 2002. The actual number of male primary teachers resigning in the two years was similar, with the extra wastage being to teach abroad, other employment and early retirement.
Table 3.4: Destinations of Resignees from Full-time Posts by GenderPer Cent
Primary Secondary2002 2003 2002 2003Destination
Female Male Female Male Female Male Female Male
FT Maint School 37.6 49.4 30.6 42.2 42.4 45.3 43.3 44.0PT Maint School 2.3 1.1 2.1 2.7 1.8 0.7 0.8 0.5Supply Teaching 8.5 11.4 9.0 8.1 2.8 3.1 2.5 2.8Independent School 2.9 2.6 0.8 2.2 3.6 3.3 2.8 2.4Teaching Abroad 4.0 4.1 6.4 7.0 4.1 5.2 6.1 6.2Lecturing FE/HE 0.1 0.7 0.6 0.5 0.7 0.7 0.8 0.7Other Education 4.1 3.7 4.1 3.8 4.7 5.2 4.3 3.1Other Employment 3.6 3.7 2.9 7.6 5.0 5.2 4.2 5.4Maternity 8.3 0.0 14.3 0.0 4.6 0.0 3.6 0.0Family Care 2.6 2.2 2.0 0.5 3.4 0.2 2.5 0.7Travel 4.0 3.0 3.8 2.7 4.8 3.5 4.3 3.6Overseas Ret Home 0.2 0.7 0.2 0.0 0.0 0.1 0.5 0.6Normal-Age Retire 3.5 1.8 3.5 2.7 4.0 5.2 4.6 6.1Ill Health Retire 2.1 2.6 1.6 0.5 1.7 3.0 1.8 2.2Early Retirement 6.9 4.8 8.4 10.8 4.8 8.0 5.4 9.0Redundancy 0.3 0.4 1.2 0.0 0.0 0.0 0.3 0.4Other 2.9 3.0 2.9 2.2 4.4 2.6 3.4 2.2Not Known 6.1 4.8 5.5 6.5 7.3 8.8 8.5 10.0Total N1 1,109 181 919 185 1,303 1,029 1,304 978
1. Gender not identified by the school: 2 cases for 2002 primary; 4 cases for 2003 primary; 14 cases for 2002 secondary and 20cases for 2003 secondary.
15
3.12 In the secondary phase, male teachers were more likely than female teachers to retire. Male teachers were also less likely to leave for reasons of family care. Both genders in both phases were resigning more often in 2003 to teach abroad. As we have seen previously, secondary schools which are generally much larger, were less likely to know the destinations of their resignees.
3.13 Interestingly, maternity resignations are much higher among female primaryteachers than their counterparts in secondary schools. In 2002 they were twice as likely to leave for this reason and in 2003, when primary maternities rose appreciably, the ratio was nearly four to one (1.9 per cent of total full-timeresignations in primary and 0.49 per cent in secondary).
3.14 The detail of destinations can be hard to take in and many of the comparisons are best made at a more general level. But in the detail we can begin to see why, for example, the loss of primary teachers should be greater. It arises, at least in part, from proportionally more of them being female and a greater likelihood of femaleteachers in that phase leaving for maternity. We pursue the theme of turnover and wastage at the system level in the next chapter.
Resumé3.15 Detailed scrutiny of destinations confirms that the main change in 2003 from 2002
was fewer moves between full-time posts in primary schools. The overall shape of the results in 2003, for both the primary and secondary phases across the different contracts and by gender, was similar to that in 2002 suggesting that there is a statistical consistency in the populations of teachers. In 2002, we conducted a detailed analysis of the reasons for leaving which was not repeated in 2003, but it seems reasonable to assume in view of the other similarities found between the two years that the explanations arrived at then will still hold. The emerging feature to note is the effect of falling pupil numbers on the requirement for teachers, currently evident in primary schools, but soon to impact on secondary schools as well.
16
4. Turnover and Wastage Across the Maintained Sector4.1 In this chapter we bring together the destination data in terms of the constructs of
‘turnover’ (full-time teachers resigning or finishing their contracts) and ‘wastage’ (full-time teachers leaving but not moving to a full-time post in another maintainedschool). Our representative samples of primary schools and secondary schools reveal how many teachers were resigning in 2002 and 2003. In order to calculate the turnover and wastage rates we need to know how many full-time teachers there were in total. This is available for phase, region, gender and age. There is also less complete information on ethnicity and subject. We are, therefore, able to makecomparisons for these six characteristics at the level of the maintained education system as a whole.
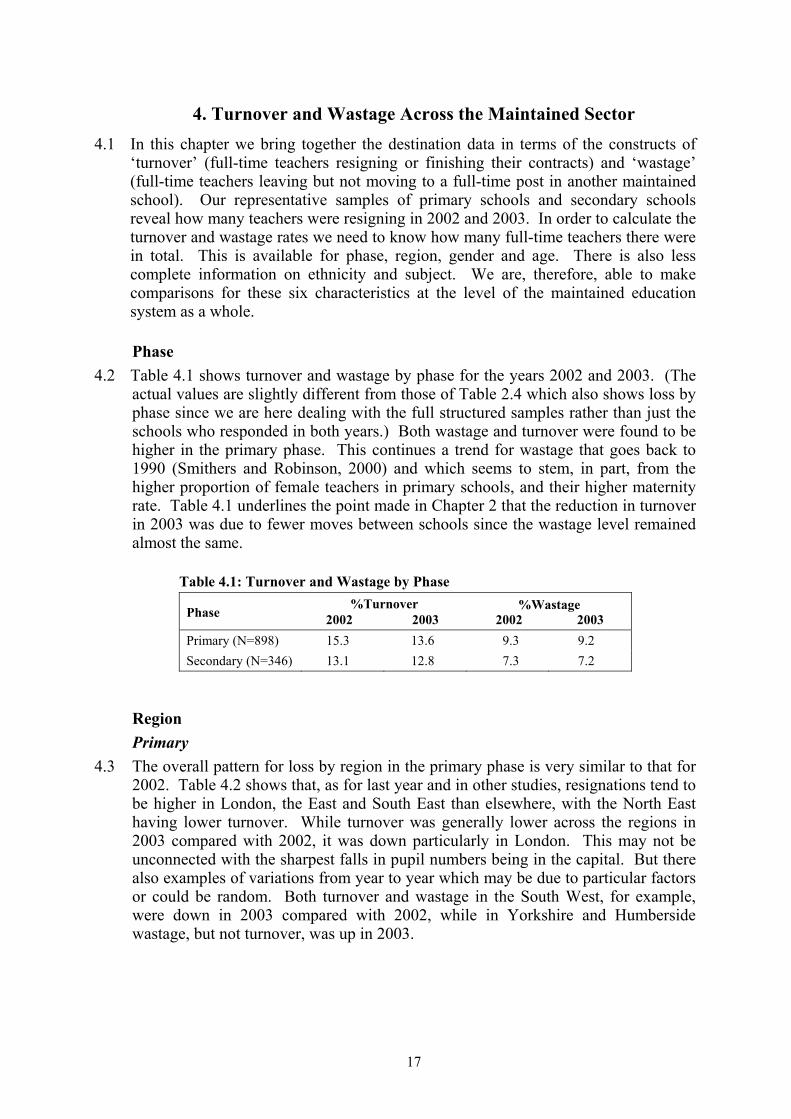
Phase4.2 Table 4.1 shows turnover and wastage by phase for the years 2002 and 2003. (The
actual values are slightly different from those of Table 2.4 which also shows loss by phase since we are here dealing with the full structured samples rather than just the schools who responded in both years.) Both wastage and turnover were found to be higher in the primary phase. This continues a trend for wastage that goes back to 1990 (Smithers and Robinson, 2000) and which seems to stem, in part, from the higher proportion of female teachers in primary schools, and their higher maternityrate. Table 4.1 underlines the point made in Chapter 2 that the reduction in turnover in 2003 was due to fewer moves between schools since the wastage level remainedalmost the same.
Table 4.1: Turnover and Wastage by Phase%Turnover %WastagePhase 2002 2003 2002 2003
Primary (N=898) 15.3 13.6 9.3 9.2Secondary (N=346) 13.1 12.8 7.3 7.2
RegionPrimary
4.3 The overall pattern for loss by region in the primary phase is very similar to that for 2002. Table 4.2 shows that, as for last year and in other studies, resignations tend to be higher in London, the East and South East than elsewhere, with the North East having lower turnover. While turnover was generally lower across the regions in 2003 compared with 2002, it was down particularly in London. This may not be unconnected with the sharpest falls in pupil numbers being in the capital. But there also examples of variations from year to year which may be due to particular factors or could be random. Both turnover and wastage in the South West, for example,were down in 2003 compared with 2002, while in Yorkshire and Humbersidewastage, but not turnover, was up in 2003.
17
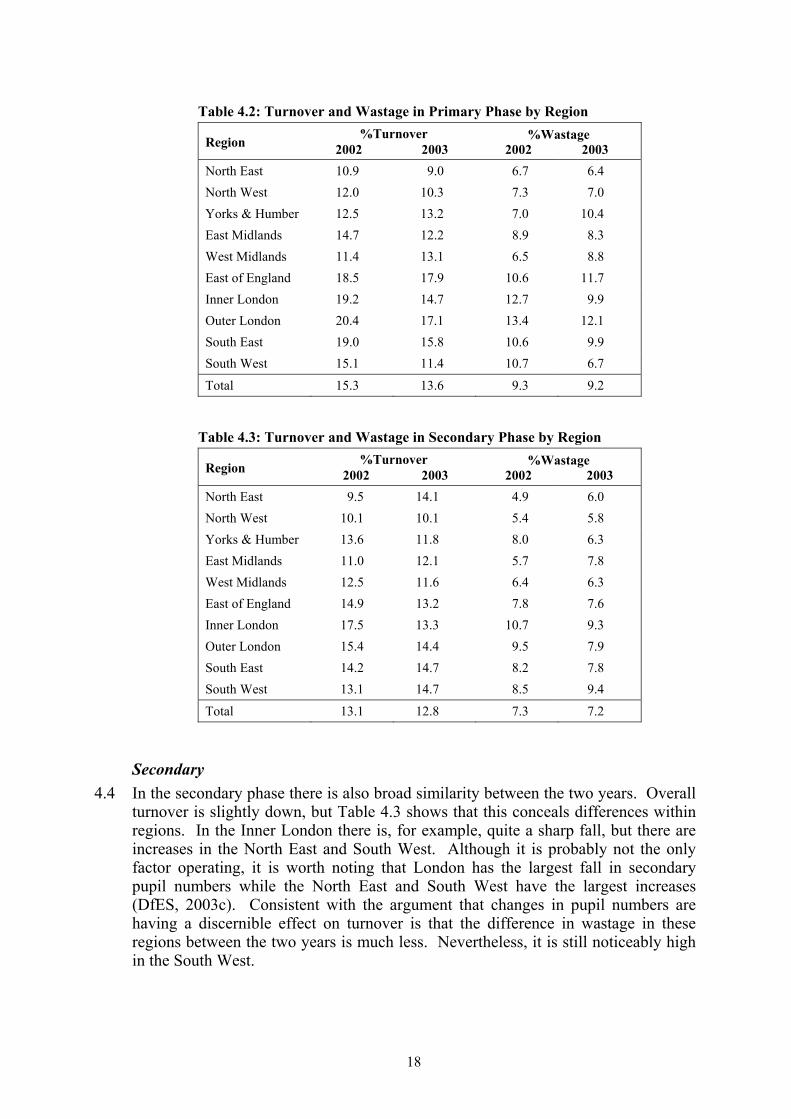
Table 4.2: Turnover and Wastage in Primary Phase by Region%Turnover %WastageRegion 2002 2003 2002 2003
North East 10.9 9.0 6.7 6.4North West 12.0 10.3 7.3 7.0Yorks & Humber 12.5 13.2 7.0 10.4East Midlands 14.7 12.2 8.9 8.3West Midlands 11.4 13.1 6.5 8.8East of England 18.5 17.9 10.6 11.7Inner London 19.2 14.7 12.7 9.9Outer London 20.4 17.1 13.4 12.1South East 19.0 15.8 10.6 9.9South West 15.1 11.4 10.7 6.7
Total 15.3 13.6 9.3 9.2
Table 4.3: Turnover and Wastage in Secondary Phase by Region%Turnover %WastageRegion 2002 2003 2002 2003
North East 9.5 14.1 4.9 6.0North West 10.1 10.1 5.4 5.8Yorks & Humber 13.6 11.8 8.0 6.3East Midlands 11.0 12.1 5.7 7.8West Midlands 12.5 11.6 6.4 6.3East of England 14.9 13.2 7.8 7.6Inner London 17.5 13.3 10.7 9.3Outer London 15.4 14.4 9.5 7.9South East 14.2 14.7 8.2 7.8South West 13.1 14.7 8.5 9.4
Total 13.1 12.8 7.3 7.2
Secondary4.4 In the secondary phase there is also broad similarity between the two years. Overall
turnover is slightly down, but Table 4.3 shows that this conceals differences within regions. In the Inner London there is, for example, quite a sharp fall, but there are increases in the North East and South West. Although it is probably not the only factor operating, it is worth noting that London has the largest fall in secondary pupil numbers while the North East and South West have the largest increases (DfES, 2003c). Consistent with the argument that changes in pupil numbers are having a discernible effect on turnover is that the difference in wastage in these regions between the two years is much less. Nevertheless, it is still noticeably high in the South West.
18
4.5 Another factor which could be contributing to the differences between regions is the age of the teachers. Later in this chapter (Table, 4.8) we report that the age of the leaver varies greatly between the regions. In London, for example, many of the leavers are young and few are old, while the precise opposite is the case in the North East and North West.
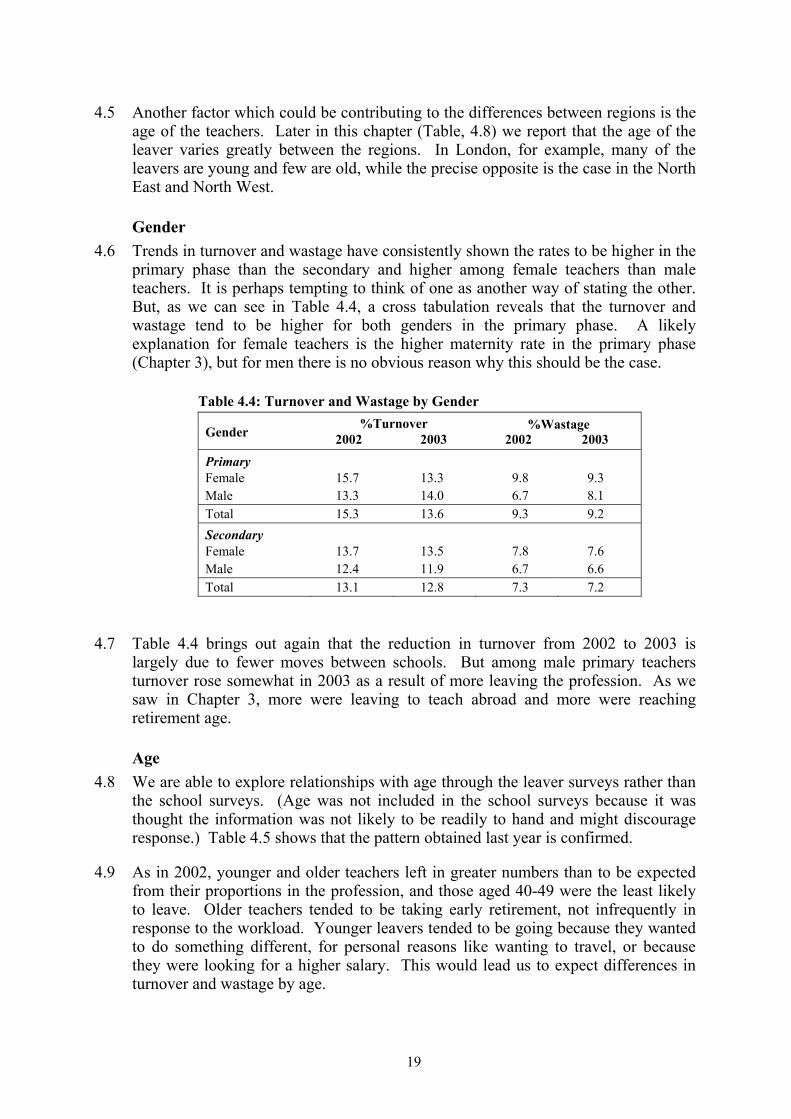
Gender4.6 Trends in turnover and wastage have consistently shown the rates to be higher in the
primary phase than the secondary and higher among female teachers than maleteachers. It is perhaps tempting to think of one as another way of stating the other. But, as we can see in Table 4.4, a cross tabulation reveals that the turnover and wastage tend to be higher for both genders in the primary phase. A likely explanation for female teachers is the higher maternity rate in the primary phase (Chapter 3), but for men there is no obvious reason why this should be the case.
Table 4.4: Turnover and Wastage by Gender%Turnover %WastageGender 2002 2003 2002 2003
PrimaryFemale 15.7 13.3 9.8 9.3Male 13.3 14.0 6.7 8.1Total 15.3 13.6 9.3 9.2SecondaryFemale 13.7 13.5 7.8 7.6Male 12.4 11.9 6.7 6.6Total 13.1 12.8 7.3 7.2
4.7 Table 4.4 brings out again that the reduction in turnover from 2002 to 2003 is largely due to fewer moves between schools. But among male primary teachers turnover rose somewhat in 2003 as a result of more leaving the profession. As we saw in Chapter 3, more were leaving to teach abroad and more were reaching retirement age.
Age4.8 We are able to explore relationships with age through the leaver surveys rather than
the school surveys. (Age was not included in the school surveys because it was thought the information was not likely to be readily to hand and might discourage response.) Table 4.5 shows that the pattern obtained last year is confirmed.
4.9 As in 2002, younger and older teachers left in greater numbers than to be expected from their proportions in the profession, and those aged 40-49 were the least likely to leave. Older teachers tended to be taking early retirement, not infrequently in response to the workload. Younger leavers tended to be going because they wanted to do something different, for personal reasons like wanting to travel, or because they were looking for a higher salary. This would lead us to expect differences in turnover and wastage by age.
19
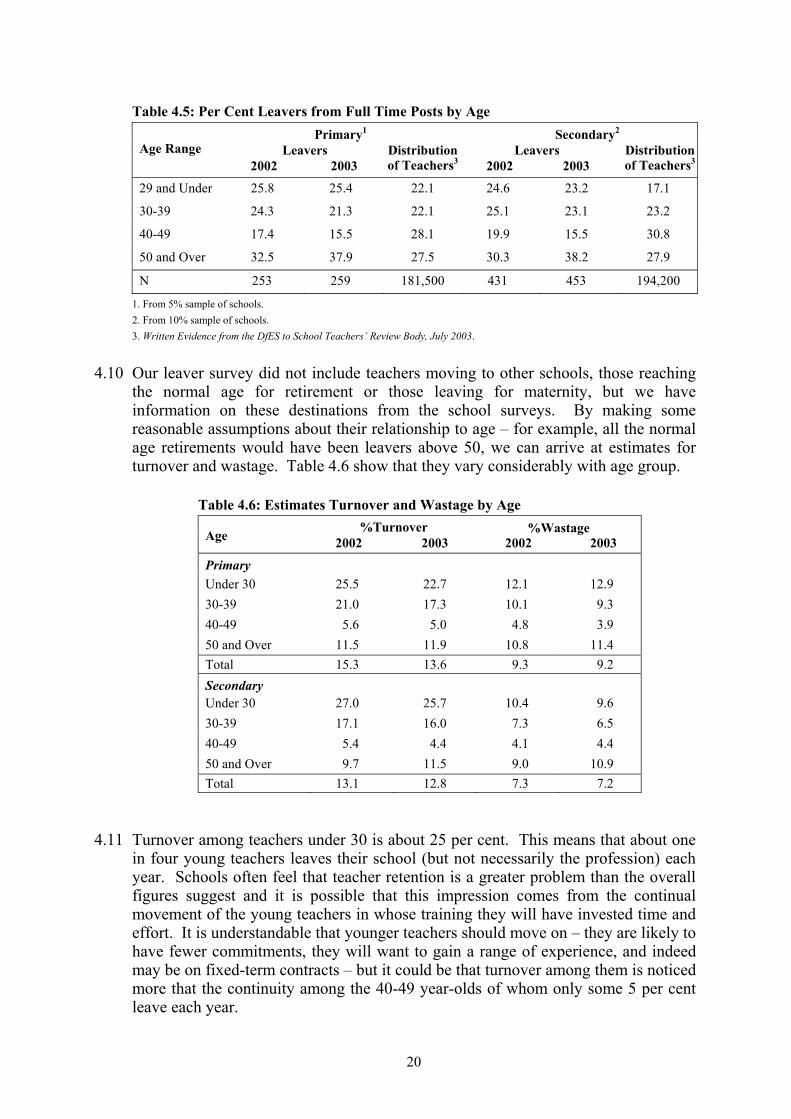
Table 4.5: Per Cent Leavers from Full Time Posts by AgePrimary1 Secondary2
Leavers LeaversAge Range 2002 2003
Distributionof Teachers3 2002 2003
Distributionof Teachers3
29 and Under 25.8 25.4 22.1 24.6 23.2 17.1
30-39 24.3 21.3 22.1 25.1 23.1 23.2
40-49 17.4 15.5 28.1 19.9 15.5 30.8
50 and Over 32.5 37.9 27.5 30.3 38.2 27.9
N 253 259 181,500 431 453 194,200
1. From 5% sample of schools.2. From 10% sample of schools.3. Written Evidence from the DfES to School Teachers’ Review Body, July 2003.
4.10 Our leaver survey did not include teachers moving to other schools, those reaching the normal age for retirement or those leaving for maternity, but we have information on these destinations from the school surveys. By making somereasonable assumptions about their relationship to age – for example, all the normalage retirements would have been leavers above 50, we can arrive at estimates for turnover and wastage. Table 4.6 show that they vary considerably with age group.
Table 4.6: Estimates Turnover and Wastage by Age%Turnover %WastageAge 2002 2003 2002 2003
PrimaryUnder 30 25.5 22.7 12.1 12.930-39 21.0 17.3 10.1 9.340-49 5.6 5.0 4.8 3.950 and Over 11.5 11.9 10.8 11.4Total 15.3 13.6 9.3 9.2SecondaryUnder 30 27.0 25.7 10.4 9.630-39 17.1 16.0 7.3 6.540-49 5.4 4.4 4.1 4.450 and Over 9.7 11.5 9.0 10.9Total 13.1 12.8 7.3 7.2
4.11 Turnover among teachers under 30 is about 25 per cent. This means that about one in four young teachers leaves their school (but not necessarily the profession) each year. Schools often feel that teacher retention is a greater problem than the overall figures suggest and it is possible that this impression comes from the continual movement of the young teachers in whose training they will have invested time and effort. It is understandable that younger teachers should move on – they are likely to have fewer commitments, they will want to gain a range of experience, and indeed may be on fixed-term contracts – but it could be that turnover among them is noticed more that the continuity among the 40-49 year-olds of whom only some 5 per cent leave each year.
20
4.12 Wastage among the young leavers is only about half or less of the turnover because of movements to other schools. But turnover among the over 50s is almost all wastage since few leave to take other full-time posts. Thus while turnover amongthe over 50s is less than half that of the under 30s, the wastage rate is about the same. As might be expected from Table 4.5, wastage among both groups is higher than for those aged 30 to 49.
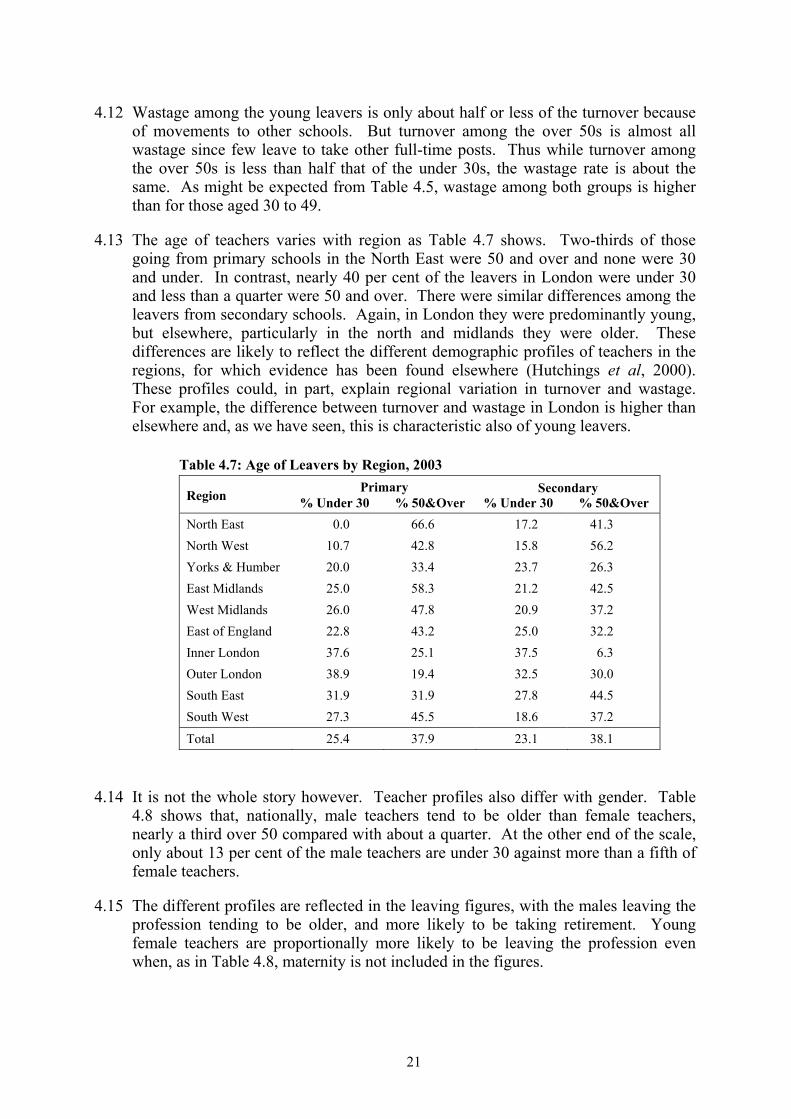
4.13 The age of teachers varies with region as Table 4.7 shows. Two-thirds of those going from primary schools in the North East were 50 and over and none were 30 and under. In contrast, nearly 40 per cent of the leavers in London were under 30 and less than a quarter were 50 and over. There were similar differences among the leavers from secondary schools. Again, in London they were predominantly young, but elsewhere, particularly in the north and midlands they were older. These differences are likely to reflect the different demographic profiles of teachers in the regions, for which evidence has been found elsewhere (Hutchings et al, 2000). These profiles could, in part, explain regional variation in turnover and wastage. For example, the difference between turnover and wastage in London is higher than elsewhere and, as we have seen, this is characteristic also of young leavers.
Table 4.7: Age of Leavers by Region, 2003Primary SecondaryRegion % Under 30 % 50&Over % Under 30 % 50&Over
North East 0.0 66.6 17.2 41.3North West 10.7 42.8 15.8 56.2Yorks & Humber 20.0 33.4 23.7 26.3East Midlands 25.0 58.3 21.2 42.5West Midlands 26.0 47.8 20.9 37.2East of England 22.8 43.2 25.0 32.2Inner London 37.6 25.1 37.5 6.3Outer London 38.9 19.4 32.5 30.0South East 31.9 31.9 27.8 44.5South West 27.3 45.5 18.6 37.2
Total 25.4 37.9 23.1 38.1
4.14 It is not the whole story however. Teacher profiles also differ with gender. Table 4.8 shows that, nationally, male teachers tend to be older than female teachers, nearly a third over 50 compared with about a quarter. At the other end of the scale, only about 13 per cent of the male teachers are under 30 against more than a fifth of female teachers.
4.15 The different profiles are reflected in the leaving figures, with the males leaving the profession tending to be older, and more likely to be taking retirement. Young female teachers are proportionally more likely to be leaving the profession even when, as in Table 4.8, maternity is not included in the figures.
21
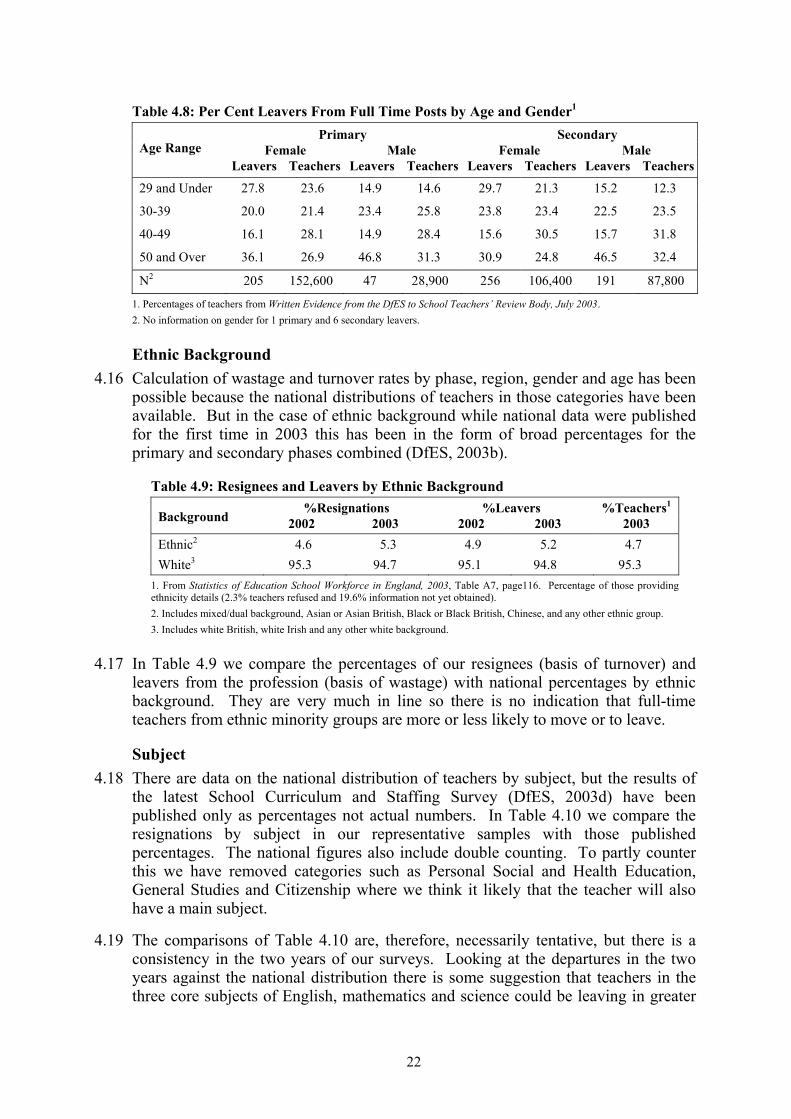
Table 4.8: Per Cent Leavers From Full Time Posts by Age and Gender1
Primary SecondaryFemale Male Female MaleAge Range
Leavers Teachers Leavers Teachers Leavers Teachers Leavers Teachers
29 and Under 27.8 23.6 14.9 14.6 29.7 21.3 15.2 12.3
30-39 20.0 21.4 23.4 25.8 23.8 23.4 22.5 23.5
40-49 16.1 28.1 14.9 28.4 15.6 30.5 15.7 31.8
50 and Over 36.1 26.9 46.8 31.3 30.9 24.8 46.5 32.4
N2 205 152,600 47 28,900 256 106,400 191 87,800
1. Percentages of teachers from Written Evidence from the DfES to School Teachers’ Review Body, July 2003.2. No information on gender for 1 primary and 6 secondary leavers.
Ethnic Background 4.16 Calculation of wastage and turnover rates by phase, region, gender and age has been
possible because the national distributions of teachers in those categories have been available. But in the case of ethnic background while national data were published for the first time in 2003 this has been in the form of broad percentages for the primary and secondary phases combined (DfES, 2003b).
Table 4.9: Resignees and Leavers by Ethnic Background%Resignations %Leavers %Teachers1
Background 2002 2003 2002 2003 2003Ethnic2 4.6 5.3 4.9 5.2 4.7White3 95.3 94.7 95.1 94.8 95.3
1. From Statistics of Education School Workforce in England, 2003, Table A7, page116. Percentage of those providingethnicity details (2.3% teachers refused and 19.6% information not yet obtained). 2. Includes mixed/dual background, Asian or Asian British, Black or Black British, Chinese, and any other ethnic group. 3. Includes white British, white Irish and any other white background.
4.17 In Table 4.9 we compare the percentages of our resignees (basis of turnover) and leavers from the profession (basis of wastage) with national percentages by ethnic background. They are very much in line so there is no indication that full-timeteachers from ethnic minority groups are more or less likely to move or to leave.
Subject4.18 There are data on the national distribution of teachers by subject, but the results of
the latest School Curriculum and Staffing Survey (DfES, 2003d) have been published only as percentages not actual numbers. In Table 4.10 we compare the resignations by subject in our representative samples with those published percentages. The national figures also include double counting. To partly counter this we have removed categories such as Personal Social and Health Education, General Studies and Citizenship where we think it likely that the teacher will also have a main subject.
4.19 The comparisons of Table 4.10 are, therefore, necessarily tentative, but there is a consistency in the two years of our surveys. Looking at the departures in the two years against the national distribution there is some suggestion that teachers in the three core subjects of English, mathematics and science could be leaving in greater
22
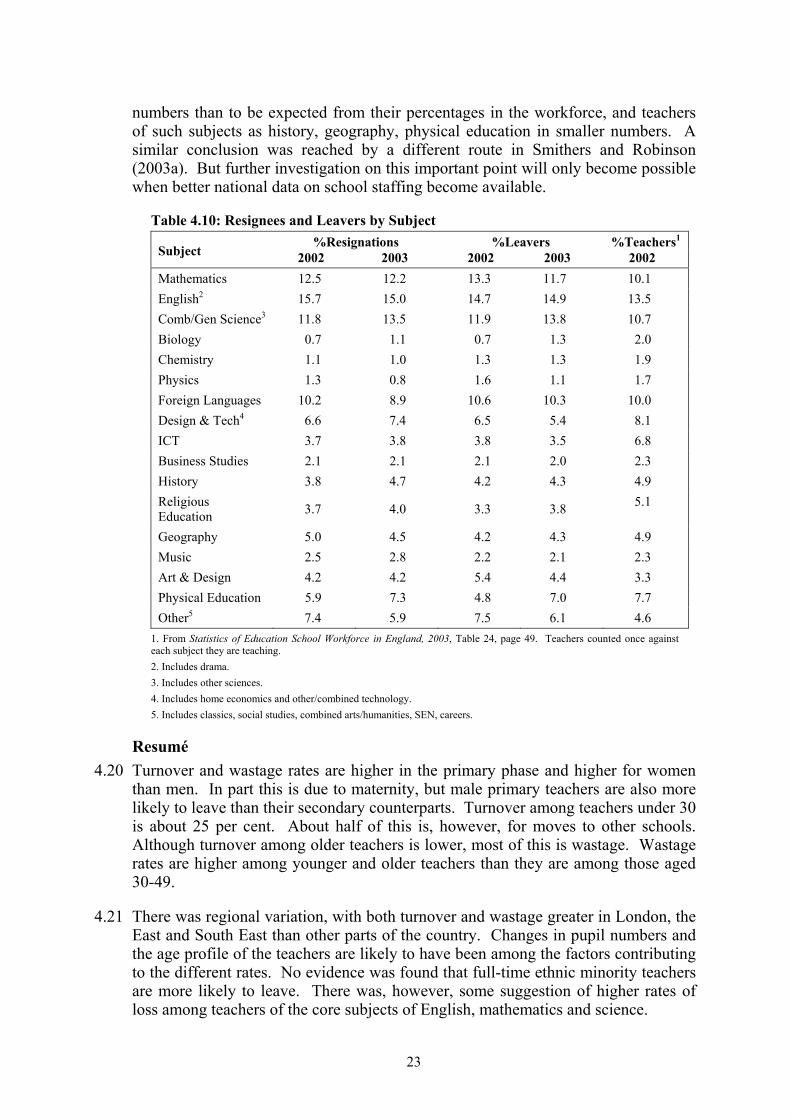
numbers than to be expected from their percentages in the workforce, and teachers of such subjects as history, geography, physical education in smaller numbers. A similar conclusion was reached by a different route in Smithers and Robinson (2003a). But further investigation on this important point will only become possible when better national data on school staffing become available.
Table 4.10: Resignees and Leavers by Subject %Resignations %Leavers %Teachers1
Subject 2002 2003 2002 2003 2002Mathematics 12.5 12.2 13.3 11.7 10.1English2 15.7 15.0 14.7 14.9 13.5Comb/Gen Science3 11.8 13.5 11.9 13.8 10.7Biology 0.7 1.1 0.7 1.3 2.0Chemistry 1.1 1.0 1.3 1.3 1.9Physics 1.3 0.8 1.6 1.1 1.7Foreign Languages 10.2 8.9 10.6 10.3 10.0Design & Tech4 6.6 7.4 6.5 5.4 8.1ICT 3.7 3.8 3.8 3.5 6.8Business Studies 2.1 2.1 2.1 2.0 2.3History 3.8 4.7 4.2 4.3 4.9ReligiousEducation 3.7 4.0 3.3 3.8 5.1
Geography 5.0 4.5 4.2 4.3 4.9Music 2.5 2.8 2.2 2.1 2.3Art & Design 4.2 4.2 5.4 4.4 3.3Physical Education 5.9 7.3 4.8 7.0 7.7Other5 7.4 5.9 7.5 6.1 4.6
1. From Statistics of Education School Workforce in England, 2003, Table 24, page 49. Teachers counted once against each subject they are teaching.2. Includes drama.3. Includes other sciences.4. Includes home economics and other/combined technology.5. Includes classics, social studies, combined arts/humanities, SEN, careers.
Resumé4.20 Turnover and wastage rates are higher in the primary phase and higher for women
than men. In part this is due to maternity, but male primary teachers are also morelikely to leave than their secondary counterparts. Turnover among teachers under 30 is about 25 per cent. About half of this is, however, for moves to other schools. Although turnover among older teachers is lower, most of this is wastage. Wastage rates are higher among younger and older teachers than they are among those aged 30-49.
4.21 There was regional variation, with both turnover and wastage greater in London, the East and South East than other parts of the country. Changes in pupil numbers and the age profile of the teachers are likely to have been among the factors contributing to the different rates. No evidence was found that full-time ethnic minority teachers are more likely to leave. There was, however, some suggestion of higher rates of loss among teachers of the core subjects of English, mathematics and science.
23
5. Turnover and Wastage By School5.1 In this chapter we concentrate on variation in turnover and wastage between schools.
We had measures of three kinds available to us:
pupil characteristics, for example, performance in tests and examinations,eligibility for free school meals;
organisational characteristics, for example, size, category;
grants and awards, for example, the Leadership Incentive Grant, Beacon Status.
5.2 Of these three groups, it was the first, pupil characteristics, that was found to be most strongly related to teacher resignations. In the analyses below, overall turnover and wastage are calculated by averaging individual school values, and they come out as somewhat higher than the rates derived from the totals across the phases. The main method used for interrogating the data is analysis of variance, but the variation between schools is such that only the largest differences emerge as statistically significant. We, therefore, comment also on some of the other indications of systematic variation that we think are worth noting.
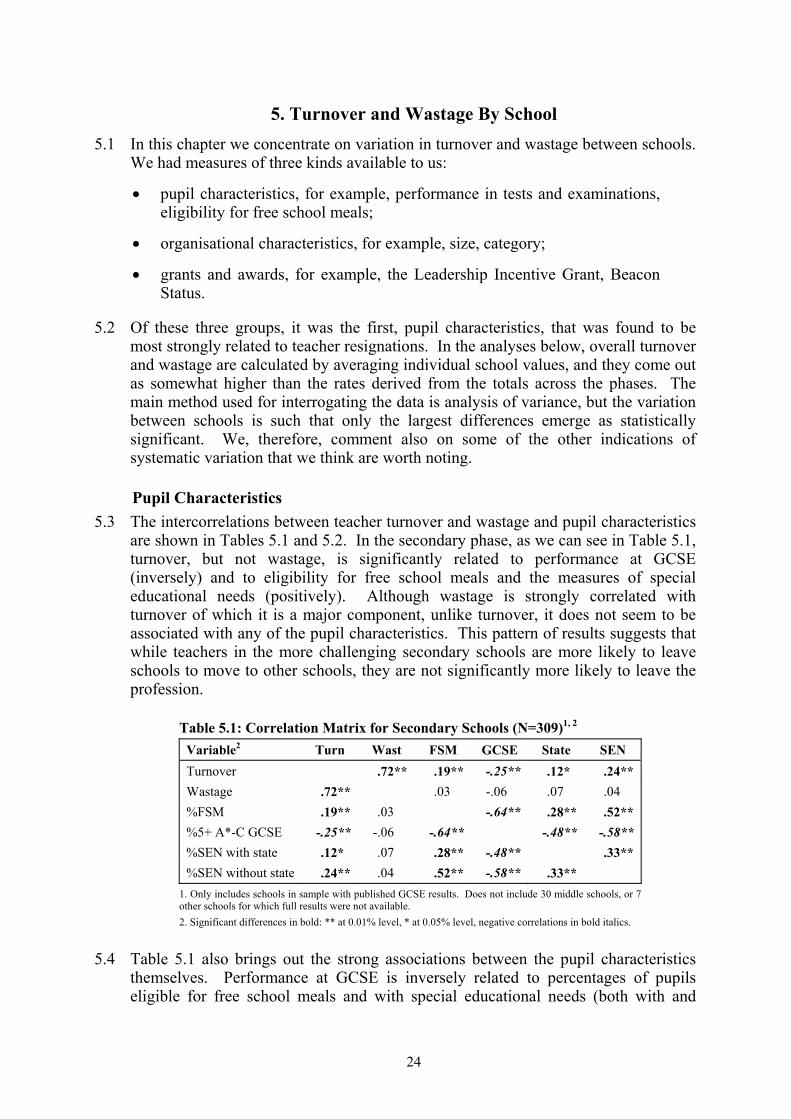
Pupil Characteristics 5.3 The intercorrelations between teacher turnover and wastage and pupil characteristics
are shown in Tables 5.1 and 5.2. In the secondary phase, as we can see in Table 5.1, turnover, but not wastage, is significantly related to performance at GCSE (inversely) and to eligibility for free school meals and the measures of special educational needs (positively). Although wastage is strongly correlated with turnover of which it is a major component, unlike turnover, it does not seem to be associated with any of the pupil characteristics. This pattern of results suggests that while teachers in the more challenging secondary schools are more likely to leave schools to move to other schools, they are not significantly more likely to leave the profession.
Table 5.1: Correlation Matrix for Secondary Schools (N=309)1, 2
Variable2 Turn Wast FSM GCSE State SENTurnover .72** .19** -.25** .12* .24**Wastage .72** .03 -.06 .07 .04%FSM .19** .03 -.64** .28** .52**%5+ A*-C GCSE -.25** -.06 -.64** -.48** -.58**%SEN with state .12* .07 .28** -.48** .33**%SEN without state .24** .04 .52** -.58** .33**
1. Only includes schools in sample with published GCSE results. Does not include 30 middle schools, or 7 other schools for which full results were not available.2. Significant differences in bold: ** at 0.01% level, * at 0.05% level, negative correlations in bold italics.
5.4 Table 5.1 also brings out the strong associations between the pupil characteristics themselves. Performance at GCSE is inversely related to percentages of pupils eligible for free school meals and with special educational needs (both with and
24
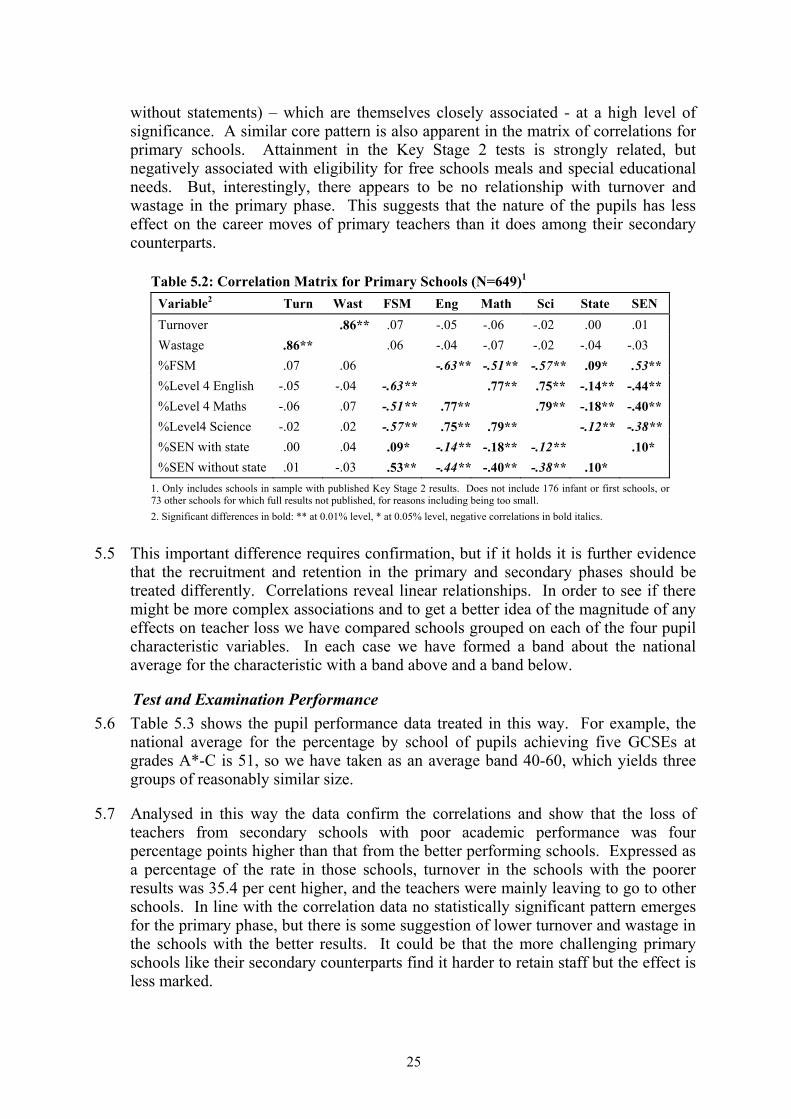
without statements) – which are themselves closely associated - at a high level of significance. A similar core pattern is also apparent in the matrix of correlations for primary schools. Attainment in the Key Stage 2 tests is strongly related, but negatively associated with eligibility for free schools meals and special educational needs. But, interestingly, there appears to be no relationship with turnover and wastage in the primary phase. This suggests that the nature of the pupils has less effect on the career moves of primary teachers than it does among their secondary counterparts.
Table 5.2: Correlation Matrix for Primary Schools (N=649)1
Variable2 Turn Wast FSM Eng Math Sci State SENTurnover .86** .07 -.05 -.06 -.02 .00 .01Wastage .86** .06 -.04 -.07 -.02 -.04 -.03%FSM .07 .06 -.63** -.51** -.57** .09* .53**%Level 4 English -.05 -.04 -.63** .77** .75** -.14** -.44**%Level 4 Maths -.06 .07 -.51** .77** .79** -.18** -.40**%Level4 Science -.02 .02 -.57** .75** .79** -.12** -.38**%SEN with state .00 .04 .09* -.14** -.18** -.12** .10*%SEN without state .01 -.03 .53** -.44** -.40** -.38** .10*
1. Only includes schools in sample with published Key Stage 2 results. Does not include 176 infant or first schools, or73 other schools for which full results not published, for reasons including being too small.2. Significant differences in bold: ** at 0.01% level, * at 0.05% level, negative correlations in bold italics.
5.5 This important difference requires confirmation, but if it holds it is further evidence that the recruitment and retention in the primary and secondary phases should be treated differently. Correlations reveal linear relationships. In order to see if there might be more complex associations and to get a better idea of the magnitude of any effects on teacher loss we have compared schools grouped on each of the four pupil characteristic variables. In each case we have formed a band about the national average for the characteristic with a band above and a band below.
Test and Examination Performance 5.6 Table 5.3 shows the pupil performance data treated in this way. For example, the
national average for the percentage by school of pupils achieving five GCSEs at grades A*-C is 51, so we have taken as an average band 40-60, which yields three groups of reasonably similar size.
5.7 Analysed in this way the data confirm the correlations and show that the loss of teachers from secondary schools with poor academic performance was four percentage points higher than that from the better performing schools. Expressed as a percentage of the rate in those schools, turnover in the schools with the poorer results was 35.4 per cent higher, and the teachers were mainly leaving to go to other schools. In line with the correlation data no statistically significant pattern emergesfor the primary phase, but there is some suggestion of lower turnover and wastage in the schools with the better results. It could be that the more challenging primaryschools like their secondary counterparts find it harder to retain staff but the effect is less marked.
25
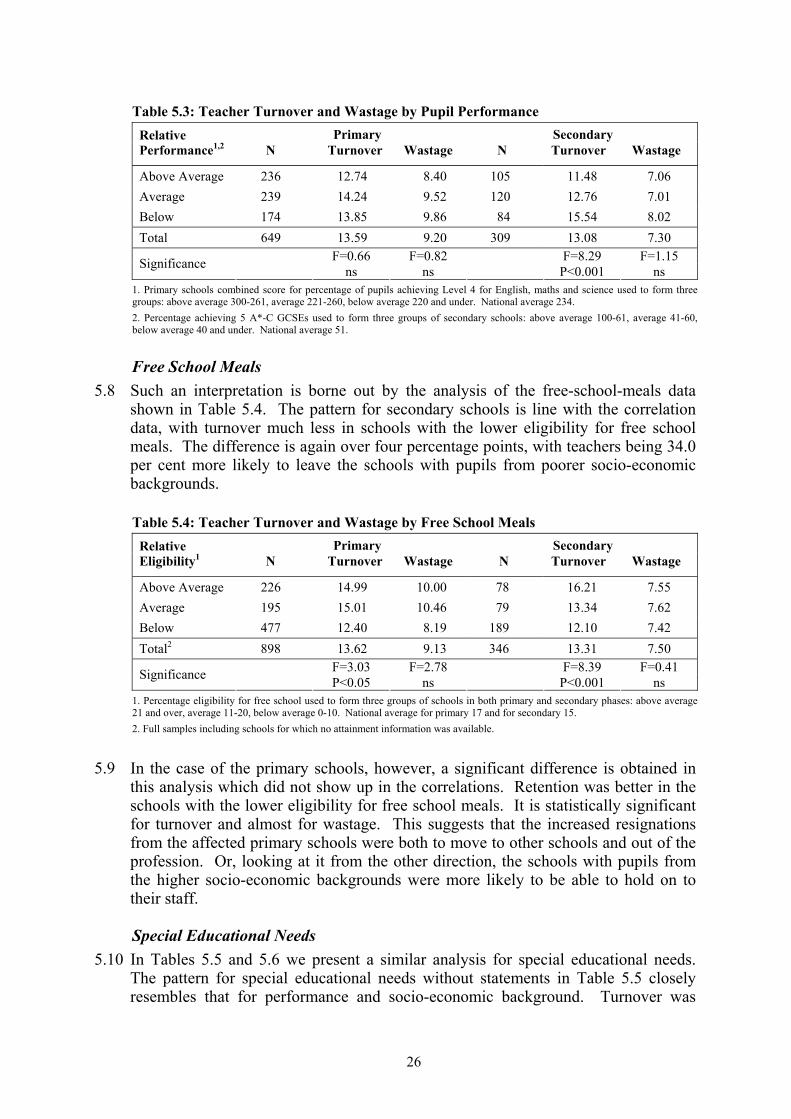
Table 5.3: Teacher Turnover and Wastage by Pupil PerformancePrimary SecondaryRelative
Performance1,2 N Turnover Wastage N Turnover Wastage
Above Average 236 12.74 8.40 105 11.48 7.06Average 239 14.24 9.52 120 12.76 7.01Below 174 13.85 9.86 84 15.54 8.02Total 649 13.59 9.20 309 13.08 7.30
F=0.66 F=0.82 F=8.29 F=1.15Significance ns ns P<0.001 ns1. Primary schools combined score for percentage of pupils achieving Level 4 for English, maths and science used to form threegroups: above average 300-261, average 221-260, below average 220 and under. National average 234.2. Percentage achieving 5 A*-C GCSEs used to form three groups of secondary schools: above average 100-61, average 41-60,below average 40 and under. National average 51.
Free School Meals 5.8 Such an interpretation is borne out by the analysis of the free-school-meals data
shown in Table 5.4. The pattern for secondary schools is line with the correlation data, with turnover much less in schools with the lower eligibility for free school meals. The difference is again over four percentage points, with teachers being 34.0 per cent more likely to leave the schools with pupils from poorer socio-economicbackgrounds.
Table 5.4: Teacher Turnover and Wastage by Free School MealsPrimary SecondaryRelative
Eligibility1 N Turnover Wastage N Turnover Wastage
Above Average 226 14.99 10.00 78 16.21 7.55Average 195 15.01 10.46 79 13.34 7.62Below 477 12.40 8.19 189 12.10 7.42Total2 898 13.62 9.13 346 13.31 7.50
F=3.03 F=2.78 F=8.39 F=0.41Significance P<0.05 ns P<0.001 ns1. Percentage eligibility for free school used to form three groups of schools in both primary and secondary phases: above average21 and over, average 11-20, below average 0-10. National average for primary 17 and for secondary 15.2. Full samples including schools for which no attainment information was available.
5.9 In the case of the primary schools, however, a significant difference is obtained in this analysis which did not show up in the correlations. Retention was better in the schools with the lower eligibility for free school meals. It is statistically significant for turnover and almost for wastage. This suggests that the increased resignations from the affected primary schools were both to move to other schools and out of the profession. Or, looking at it from the other direction, the schools with pupils fromthe higher socio-economic backgrounds were more likely to be able to hold on to their staff.
Special Educational Needs 5.10 In Tables 5.5 and 5.6 we present a similar analysis for special educational needs.
The pattern for special educational needs without statements in Table 5.5 closely resembles that for performance and socio-economic background. Turnover was
26
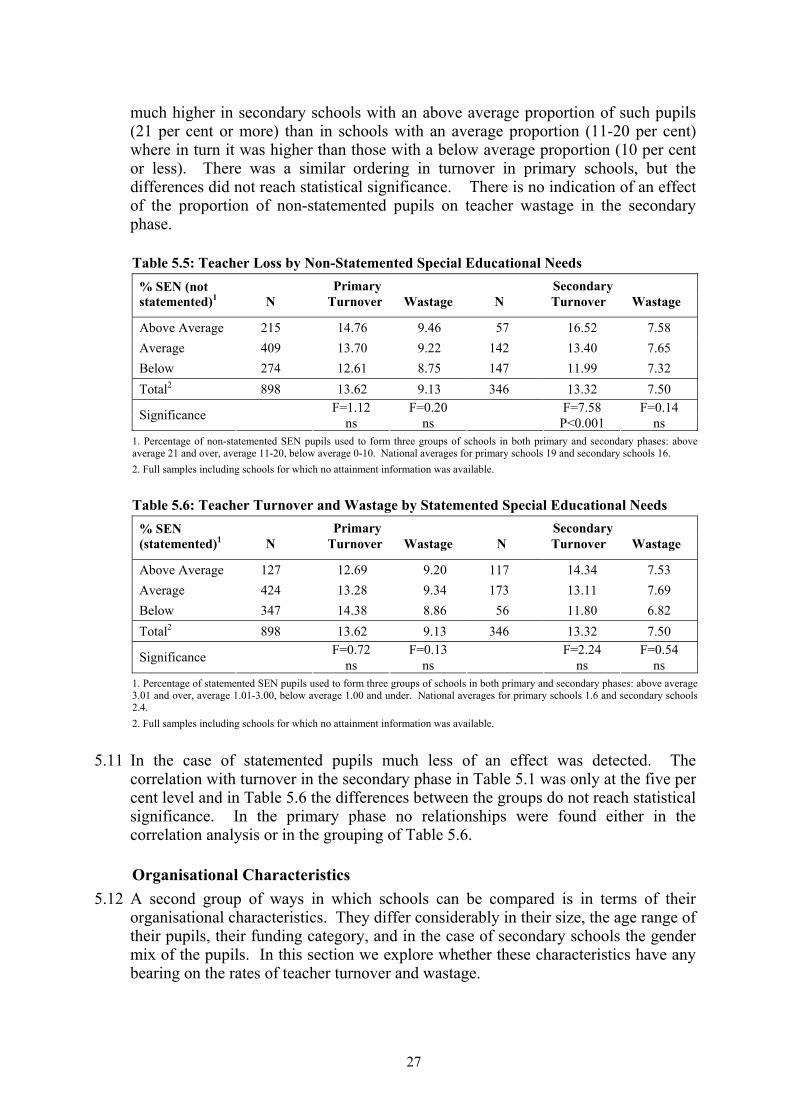
much higher in secondary schools with an above average proportion of such pupils (21 per cent or more) than in schools with an average proportion (11-20 per cent) where in turn it was higher than those with a below average proportion (10 per cent or less). There was a similar ordering in turnover in primary schools, but the differences did not reach statistical significance. There is no indication of an effect of the proportion of non-statemented pupils on teacher wastage in the secondary phase.
Table 5.5: Teacher Loss by Non-Statemented Special Educational NeedsPrimary Secondary% SEN (not
statemented)1 N Turnover Wastage N Turnover Wastage
Above Average 215 14.76 9.46 57 16.52 7.58Average 409 13.70 9.22 142 13.40 7.65Below 274 12.61 8.75 147 11.99 7.32Total2 898 13.62 9.13 346 13.32 7.50
F=1.12 F=0.20 F=7.58 F=0.14Significance ns ns P<0.001 ns1. Percentage of non-statemented SEN pupils used to form three groups of schools in both primary and secondary phases: above average 21 and over, average 11-20, below average 0-10. National averages for primary schools 19 and secondary schools 16.2. Full samples including schools for which no attainment information was available.
Table 5.6: Teacher Turnover and Wastage by Statemented Special Educational NeedsPrimary Secondary% SEN
(statemented)1 N Turnover Wastage N Turnover Wastage
Above Average 127 12.69 9.20 117 14.34 7.53Average 424 13.28 9.34 173 13.11 7.69Below 347 14.38 8.86 56 11.80 6.82Total2 898 13.62 9.13 346 13.32 7.50
F=0.72 F=0.13 F=2.24 F=0.54Significance ns ns ns ns1. Percentage of statemented SEN pupils used to form three groups of schools in both primary and secondary phases: above average3.01 and over, average 1.01-3.00, below average 1.00 and under. National averages for primary schools 1.6 and secondary schools2.4.2. Full samples including schools for which no attainment information was available.
5.11 In the case of statemented pupils much less of an effect was detected. The correlation with turnover in the secondary phase in Table 5.1 was only at the five per cent level and in Table 5.6 the differences between the groups do not reach statistical significance. In the primary phase no relationships were found either in the correlation analysis or in the grouping of Table 5.6.
Organisational Characteristics 5.12 A second group of ways in which schools can be compared is in terms of their
organisational characteristics. They differ considerably in their size, the age range of their pupils, their funding category, and in the case of secondary schools the gender mix of the pupils. In this section we explore whether these characteristics have any bearing on the rates of teacher turnover and wastage.
27
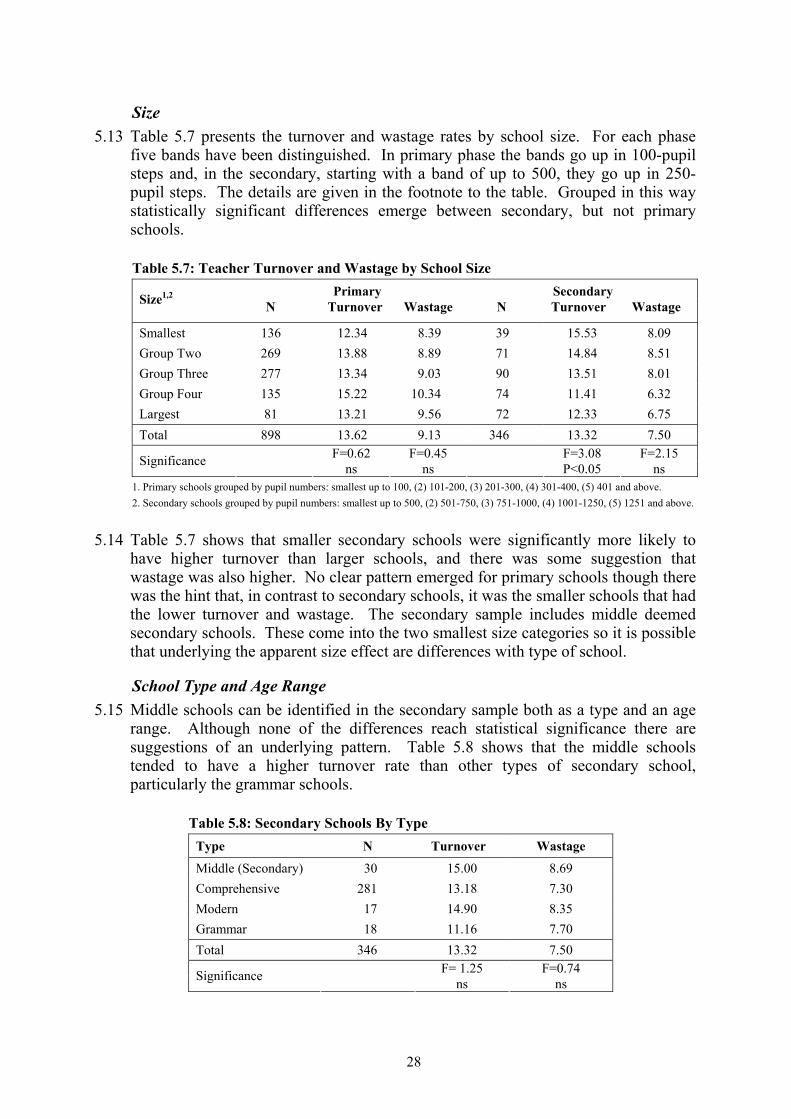
Size5.13 Table 5.7 presents the turnover and wastage rates by school size. For each phase
five bands have been distinguished. In primary phase the bands go up in 100-pupil steps and, in the secondary, starting with a band of up to 500, they go up in 250-pupil steps. The details are given in the footnote to the table. Grouped in this way statistically significant differences emerge between secondary, but not primaryschools.
Table 5.7: Teacher Turnover and Wastage by School SizePrimary SecondarySize1,2
N Turnover Wastage N Turnover Wastage
Smallest 136 12.34 8.39 39 15.53 8.09Group Two 269 13.88 8.89 71 14.84 8.51Group Three 277 13.34 9.03 90 13.51 8.01Group Four 135 15.22 10.34 74 11.41 6.32Largest 81 13.21 9.56 72 12.33 6.75Total 898 13.62 9.13 346 13.32 7.50
F=0.62 F=0.45 F=3.08 F=2.15Significance ns ns P<0.05 ns1. Primary schools grouped by pupil numbers: smallest up to 100, (2) 101-200, (3) 201-300, (4) 301-400, (5) 401 and above.2. Secondary schools grouped by pupil numbers: smallest up to 500, (2) 501-750, (3) 751-1000, (4) 1001-1250, (5) 1251 and above.
5.14 Table 5.7 shows that smaller secondary schools were significantly more likely to have higher turnover than larger schools, and there was some suggestion that wastage was also higher. No clear pattern emerged for primary schools though there was the hint that, in contrast to secondary schools, it was the smaller schools that had the lower turnover and wastage. The secondary sample includes middle deemedsecondary schools. These come into the two smallest size categories so it is possible that underlying the apparent size effect are differences with type of school.
School Type and Age Range 5.15 Middle schools can be identified in the secondary sample both as a type and an age
range. Although none of the differences reach statistical significance there are suggestions of an underlying pattern. Table 5.8 shows that the middle schools tended to have a higher turnover rate than other types of secondary school, particularly the grammar schools.
Table 5.8: Secondary Schools By TypeType N Turnover Wastage
Middle (Secondary) 30 15.00 8.69Comprehensive 281 13.18 7.30Modern 17 14.90 8.35Grammar 18 11.16 7.70Total 346 13.32 7.50
F= 1.25 F=0.74Significance ns ns
28
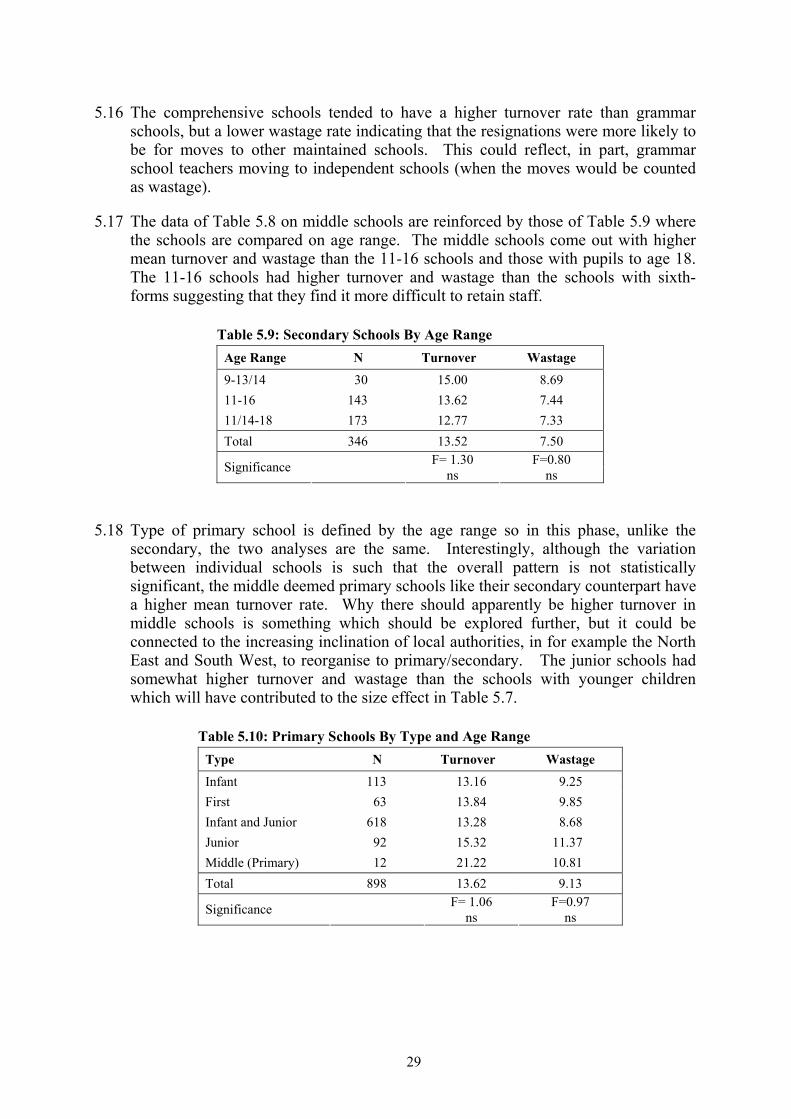
5.16 The comprehensive schools tended to have a higher turnover rate than grammarschools, but a lower wastage rate indicating that the resignations were more likely to be for moves to other maintained schools. This could reflect, in part, grammarschool teachers moving to independent schools (when the moves would be counted as wastage).
5.17 The data of Table 5.8 on middle schools are reinforced by those of Table 5.9 where the schools are compared on age range. The middle schools come out with higher mean turnover and wastage than the 11-16 schools and those with pupils to age 18. The 11-16 schools had higher turnover and wastage than the schools with sixth-forms suggesting that they find it more difficult to retain staff.
Table 5.9: Secondary Schools By Age RangeAge Range N Turnover Wastage
9-13/14 30 15.00 8.6911-16 143 13.62 7.4411/14-18 173 12.77 7.33Total 346 13.52 7.50
F= 1.30 F=0.80Significance ns ns
5.18 Type of primary school is defined by the age range so in this phase, unlike the secondary, the two analyses are the same. Interestingly, although the variation between individual schools is such that the overall pattern is not statistically significant, the middle deemed primary schools like their secondary counterpart have a higher mean turnover rate. Why there should apparently be higher turnover in middle schools is something which should be explored further, but it could be connected to the increasing inclination of local authorities, in for example the North East and South West, to reorganise to primary/secondary. The junior schools had somewhat higher turnover and wastage than the schools with younger children which will have contributed to the size effect in Table 5.7.
Table 5.10: Primary Schools By Type and Age RangeType N Turnover Wastage
Infant 113 13.16 9.25First 63 13.84 9.85Infant and Junior 618 13.28 8.68Junior 92 15.32 11.37Middle (Primary) 12 21.22 10.81Total 898 13.62 9.13
F= 1.06 F=0.97Significance ns ns
29
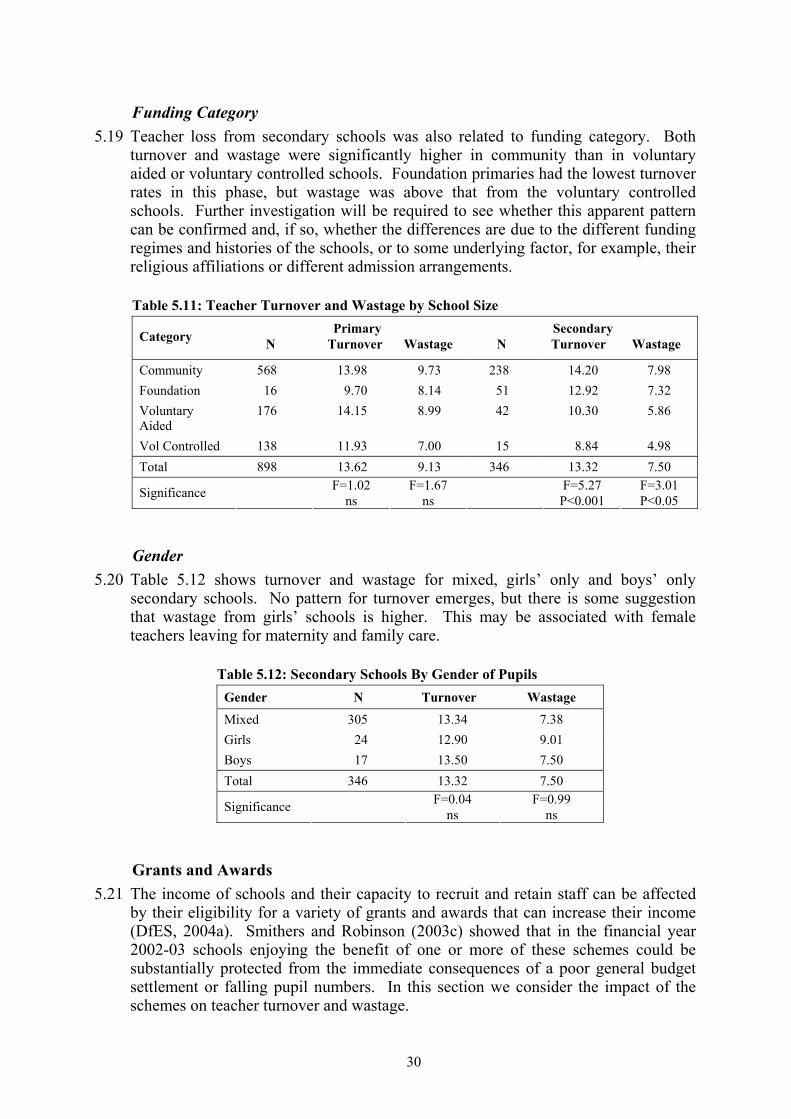
Funding Category 5.19 Teacher loss from secondary schools was also related to funding category. Both
turnover and wastage were significantly higher in community than in voluntary aided or voluntary controlled schools. Foundation primaries had the lowest turnover rates in this phase, but wastage was above that from the voluntary controlled schools. Further investigation will be required to see whether this apparent pattern can be confirmed and, if so, whether the differences are due to the different funding regimes and histories of the schools, or to some underlying factor, for example, their religious affiliations or different admission arrangements.
Table 5.11: Teacher Turnover and Wastage by School SizePrimary SecondaryCategory N Turnover Wastage N Turnover Wastage
Community 568 13.98 9.73 238 14.20 7.98Foundation 16 9.70 8.14 51 12.92 7.32VoluntaryAided
176 14.15 8.99 42 10.30 5.86
Vol Controlled 138 11.93 7.00 15 8.84 4.98Total 898 13.62 9.13 346 13.32 7.50
F=1.02 F=1.67 F=5.27 F=3.01Significance ns ns P<0.001 P<0.05
Gender5.20 Table 5.12 shows turnover and wastage for mixed, girls’ only and boys’ only
secondary schools. No pattern for turnover emerges, but there is some suggestion that wastage from girls’ schools is higher. This may be associated with femaleteachers leaving for maternity and family care.
Table 5.12: Secondary Schools By Gender of PupilsGender N Turnover Wastage
Mixed 305 13.34 7.38Girls 24 12.90 9.01Boys 17 13.50 7.50Total 346 13.32 7.50
F=0.04 F=0.99Significance ns ns
Grants and Awards 5.21 The income of schools and their capacity to recruit and retain staff can be affected
by their eligibility for a variety of grants and awards that can increase their income(DfES, 2004a). Smithers and Robinson (2003c) showed that in the financial year 2002-03 schools enjoying the benefit of one or more of these schemes could be substantially protected from the immediate consequences of a poor general budget settlement or falling pupil numbers. In this section we consider the impact of the schemes on teacher turnover and wastage.
30
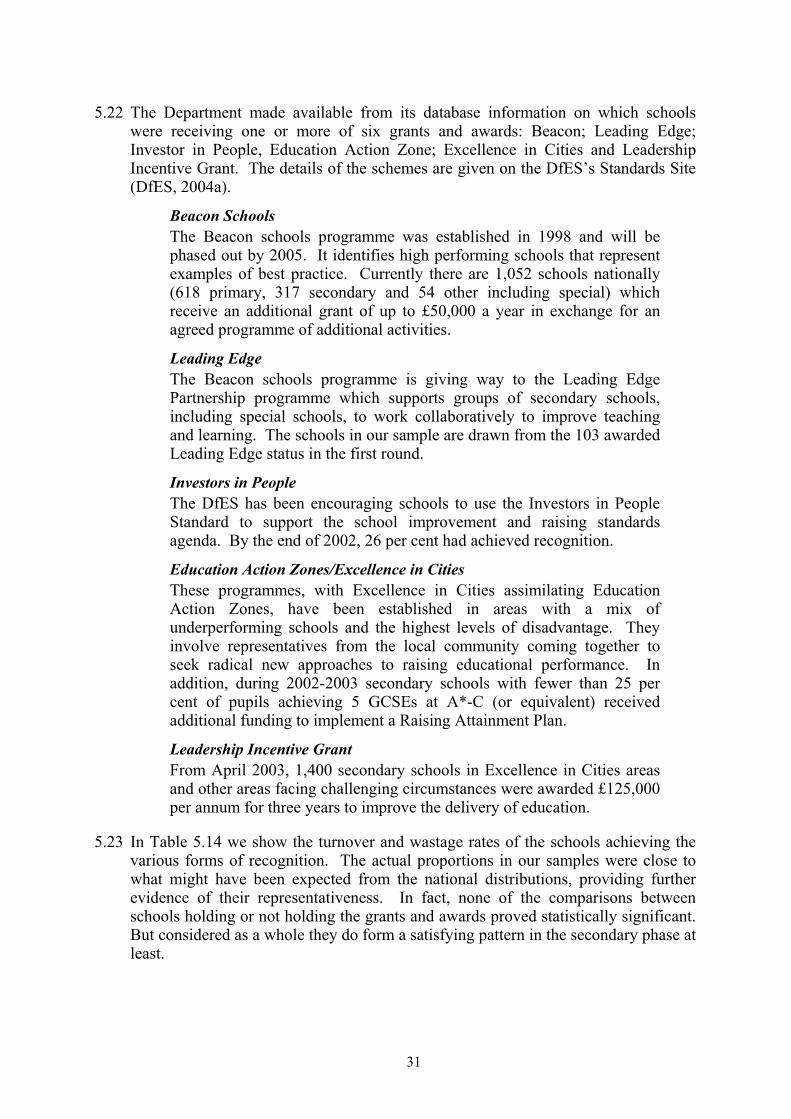
5.22 The Department made available from its database information on which schools were receiving one or more of six grants and awards: Beacon; Leading Edge; Investor in People, Education Action Zone; Excellence in Cities and Leadership Incentive Grant. The details of the schemes are given on the DfES’s Standards Site (DfES, 2004a).
Beacon Schools The Beacon schools programme was established in 1998 and will be phased out by 2005. It identifies high performing schools that represent examples of best practice. Currently there are 1,052 schools nationally (618 primary, 317 secondary and 54 other including special) which receive an additional grant of up to £50,000 a year in exchange for an agreed programme of additional activities.
Leading Edge The Beacon schools programme is giving way to the Leading Edge Partnership programme which supports groups of secondary schools, including special schools, to work collaboratively to improve teaching and learning. The schools in our sample are drawn from the 103 awarded Leading Edge status in the first round.
Investors in People The DfES has been encouraging schools to use the Investors in People Standard to support the school improvement and raising standards agenda. By the end of 2002, 26 per cent had achieved recognition.
Education Action Zones/Excellence in Cities These programmes, with Excellence in Cities assimilating Education Action Zones, have been established in areas with a mix of underperforming schools and the highest levels of disadvantage. They involve representatives from the local community coming together to seek radical new approaches to raising educational performance. In addition, during 2002-2003 secondary schools with fewer than 25 per cent of pupils achieving 5 GCSEs at A*-C (or equivalent) received additional funding to implement a Raising Attainment Plan.
Leadership Incentive Grant From April 2003, 1,400 secondary schools in Excellence in Cities areas and other areas facing challenging circumstances were awarded £125,000 per annum for three years to improve the delivery of education.
5.23 In Table 5.14 we show the turnover and wastage rates of the schools achieving the various forms of recognition. The actual proportions in our samples were close to what might have been expected from the national distributions, providing further evidence of their representativeness. In fact, none of the comparisons between schools holding or not holding the grants and awards proved statistically significant. But considered as a whole they do form a satisfying pattern in the secondary phase at least.
31
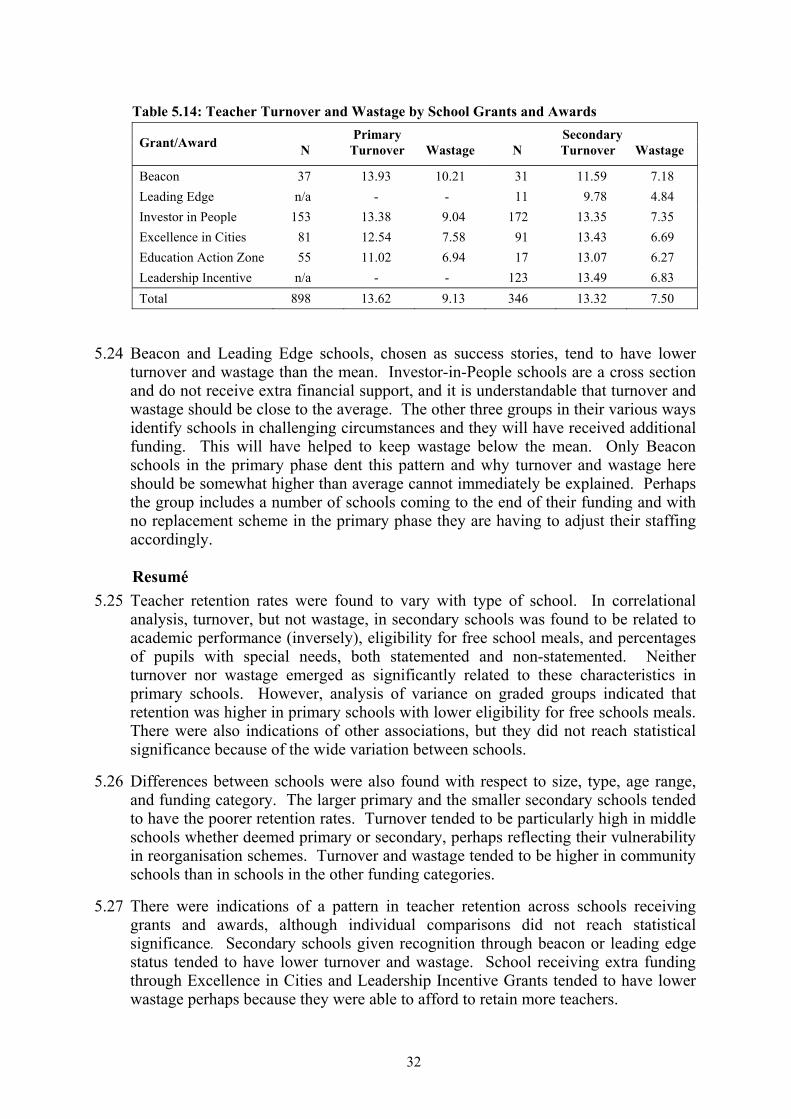
Table 5.14: Teacher Turnover and Wastage by School Grants and AwardsPrimary SecondaryGrant/Award N Turnover Wastage N Turnover Wastage
Beacon 37 13.93 10.21 31 11.59 7.18Leading Edge n/a - - 11 9.78 4.84Investor in People 153 13.38 9.04 172 13.35 7.35Excellence in Cities 81 12.54 7.58 91 13.43 6.69Education Action Zone 55 11.02 6.94 17 13.07 6.27Leadership Incentive n/a - - 123 13.49 6.83Total 898 13.62 9.13 346 13.32 7.50
5.24 Beacon and Leading Edge schools, chosen as success stories, tend to have lower turnover and wastage than the mean. Investor-in-People schools are a cross section and do not receive extra financial support, and it is understandable that turnover and wastage should be close to the average. The other three groups in their various ways identify schools in challenging circumstances and they will have received additional funding. This will have helped to keep wastage below the mean. Only Beacon schools in the primary phase dent this pattern and why turnover and wastage here should be somewhat higher than average cannot immediately be explained. Perhaps the group includes a number of schools coming to the end of their funding and with no replacement scheme in the primary phase they are having to adjust their staffing accordingly.
Resumé5.25 Teacher retention rates were found to vary with type of school. In correlational
analysis, turnover, but not wastage, in secondary schools was found to be related to academic performance (inversely), eligibility for free school meals, and percentages of pupils with special needs, both statemented and non-statemented. Neither turnover nor wastage emerged as significantly related to these characteristics in primary schools. However, analysis of variance on graded groups indicated that retention was higher in primary schools with lower eligibility for free schools meals.There were also indications of other associations, but they did not reach statistical significance because of the wide variation between schools.
5.26 Differences between schools were also found with respect to size, type, age range, and funding category. The larger primary and the smaller secondary schools tended to have the poorer retention rates. Turnover tended to be particularly high in middleschools whether deemed primary or secondary, perhaps reflecting their vulnerability in reorganisation schemes. Turnover and wastage tended to be higher in communityschools than in schools in the other funding categories.
5.27 There were indications of a pattern in teacher retention across schools receiving grants and awards, although individual comparisons did not reach statistical significance. Secondary schools given recognition through beacon or leading edge status tended to have lower turnover and wastage. School receiving extra funding through Excellence in Cities and Leadership Incentive Grants tended to have lower wastage perhaps because they were able to afford to retain more teachers.
32
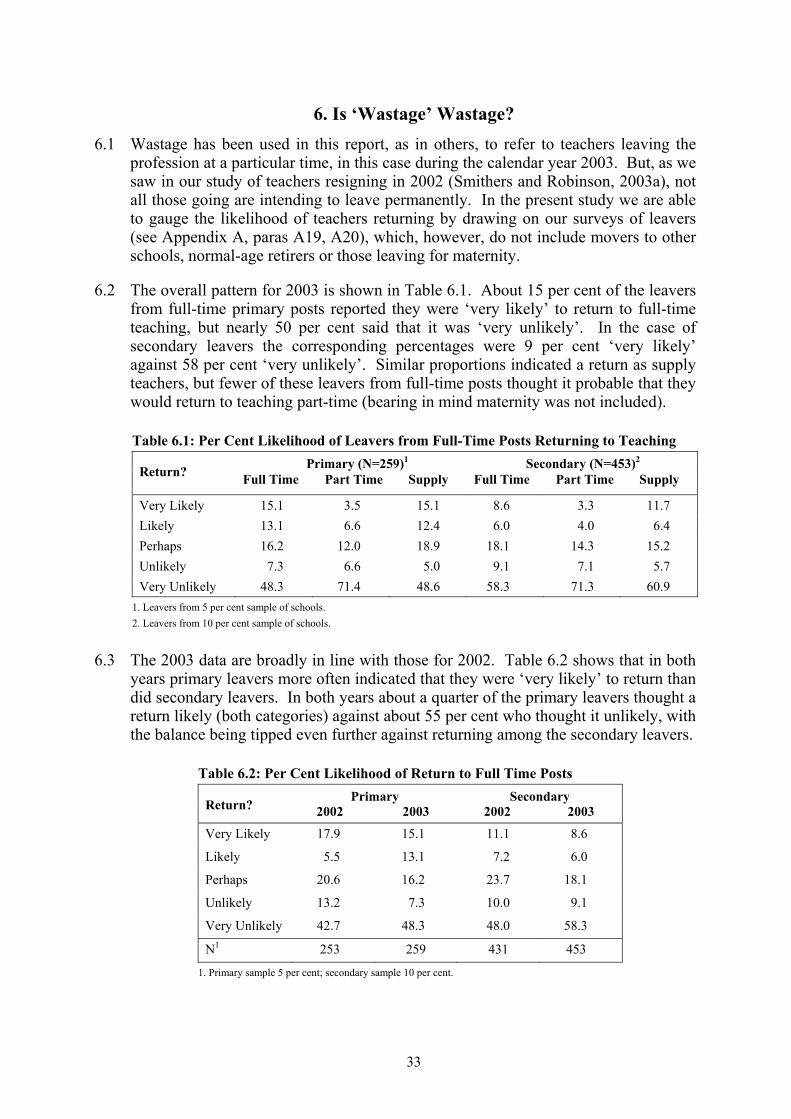
6. Is ‘Wastage’ Wastage? 6.1 Wastage has been used in this report, as in others, to refer to teachers leaving the
profession at a particular time, in this case during the calendar year 2003. But, as we saw in our study of teachers resigning in 2002 (Smithers and Robinson, 2003a), not all those going are intending to leave permanently. In the present study we are able to gauge the likelihood of teachers returning by drawing on our surveys of leavers (see Appendix A, paras A19, A20), which, however, do not include movers to other schools, normal-age retirers or those leaving for maternity.
6.2 The overall pattern for 2003 is shown in Table 6.1. About 15 per cent of the leavers from full-time primary posts reported they were ‘very likely’ to return to full-timeteaching, but nearly 50 per cent said that it was ‘very unlikely’. In the case of secondary leavers the corresponding percentages were 9 per cent ‘very likely’ against 58 per cent ‘very unlikely’. Similar proportions indicated a return as supply teachers, but fewer of these leavers from full-time posts thought it probable that they would return to teaching part-time (bearing in mind maternity was not included).
Table 6.1: Per Cent Likelihood of Leavers from Full-Time Posts Returning to TeachingPrimary (N=259)1 Secondary (N=453)2
Return? Full Time Part Time Supply Full Time Part Time Supply
Very Likely 15.1 3.5 15.1 8.6 3.3 11.7Likely 13.1 6.6 12.4 6.0 4.0 6.4Perhaps 16.2 12.0 18.9 18.1 14.3 15.2Unlikely 7.3 6.6 5.0 9.1 7.1 5.7Very Unlikely 48.3 71.4 48.6 58.3 71.3 60.9
1. Leavers from 5 per cent sample of schools.2. Leavers from 10 per cent sample of schools.
6.3 The 2003 data are broadly in line with those for 2002. Table 6.2 shows that in both years primary leavers more often indicated that they were ‘very likely’ to return than did secondary leavers. In both years about a quarter of the primary leavers thought a return likely (both categories) against about 55 per cent who thought it unlikely, with the balance being tipped even further against returning among the secondary leavers.
Table 6.2: Per Cent Likelihood of Return to Full Time PostsPrimary SecondaryReturn? 2002 2003 2002 2003
Very Likely 17.9 15.1 11.1 8.6
Likely 5.5 13.1 7.2 6.0
Perhaps 20.6 16.2 23.7 18.1
Unlikely 13.2 7.3 10.0 9.1
Very Unlikely 42.7 48.3 48.0 58.3
N1 253 259 431 453
1. Primary sample 5 per cent; secondary sample 10 per cent.
33
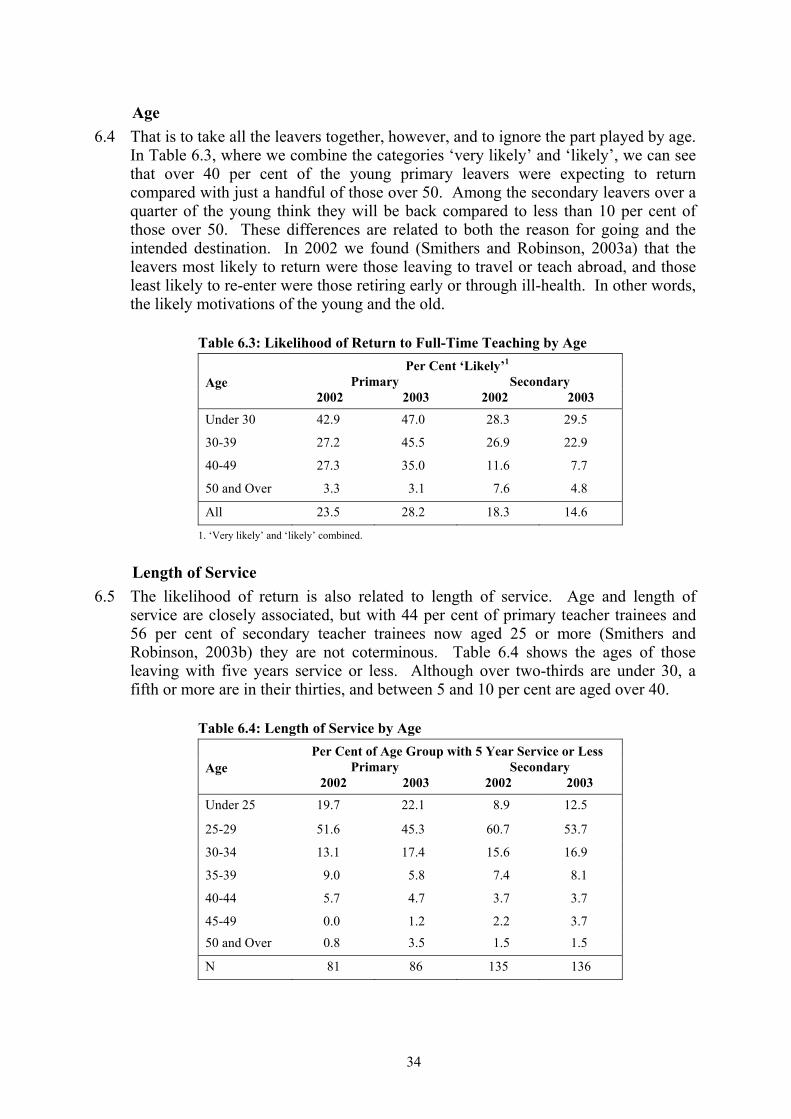
Age6.4 That is to take all the leavers together, however, and to ignore the part played by age.
In Table 6.3, where we combine the categories ‘very likely’ and ‘likely’, we can see that over 40 per cent of the young primary leavers were expecting to return compared with just a handful of those over 50. Among the secondary leavers over a quarter of the young think they will be back compared to less than 10 per cent of those over 50. These differences are related to both the reason for going and the intended destination. In 2002 we found (Smithers and Robinson, 2003a) that the leavers most likely to return were those leaving to travel or teach abroad, and those least likely to re-enter were those retiring early or through ill-health. In other words, the likely motivations of the young and the old.
Table 6.3: Likelihood of Return to Full-Time Teaching by AgePer Cent ‘Likely’1
Primary SecondaryAge2002 2003 2002 2003
Under 30 42.9 47.0 28.3 29.5
30-39 27.2 45.5 26.9 22.9
40-49 27.3 35.0 11.6 7.7
50 and Over 3.3 3.1 7.6 4.8
All 23.5 28.2 18.3 14.6
1. ‘Very likely’ and ‘likely’ combined.
Length of Service 6.5 The likelihood of return is also related to length of service. Age and length of
service are closely associated, but with 44 per cent of primary teacher trainees and 56 per cent of secondary teacher trainees now aged 25 or more (Smithers and Robinson, 2003b) they are not coterminous. Table 6.4 shows the ages of those leaving with five years service or less. Although over two-thirds are under 30, a fifth or more are in their thirties, and between 5 and 10 per cent are aged over 40.
Table 6.4: Length of Service by AgePer Cent of Age Group with 5 Year Service or Less
Primary SecondaryAge2002 2003 2002 2003
Under 25 19.7 22.1 8.9 12.5
25-29 51.6 45.3 60.7 53.7
30-34 13.1 17.4 15.6 16.9
35-39 9.0 5.8 7.4 8.1
40-44 5.7 4.7 3.7 3.7
45-49 0.0 1.2 2.2 3.750 and Over 0.8 3.5 1.5 1.5
N 81 86 135 136
34
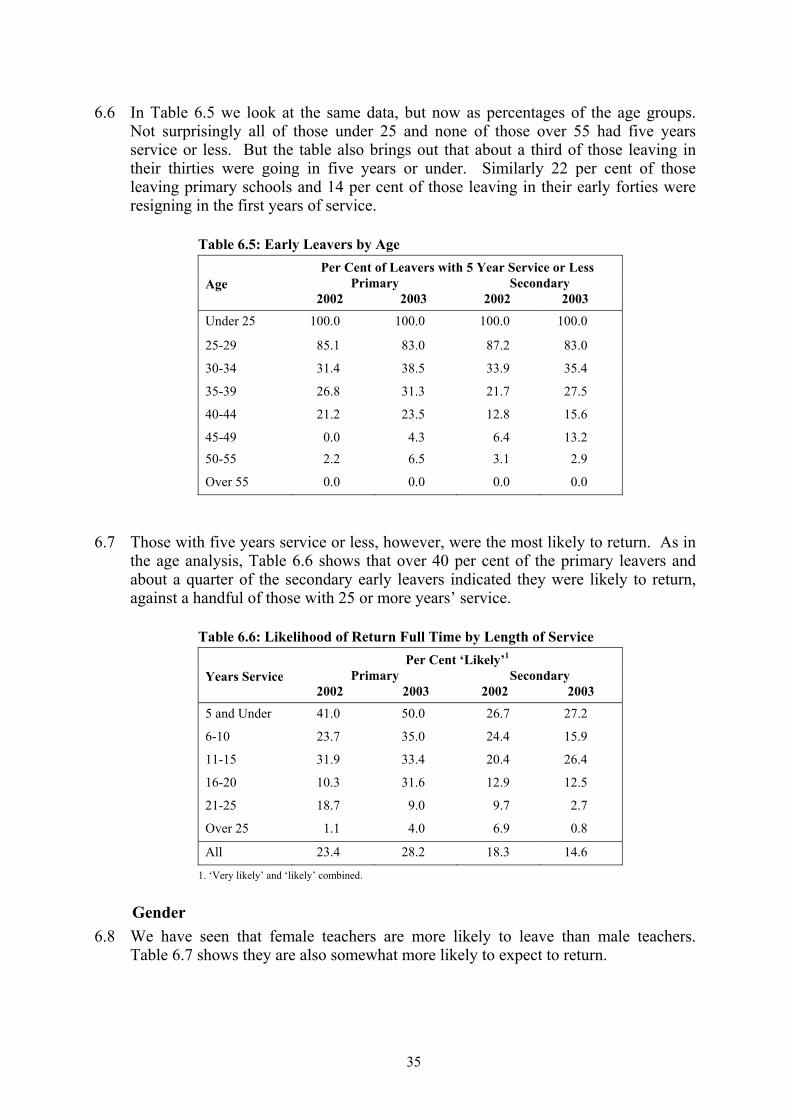
6.6 In Table 6.5 we look at the same data, but now as percentages of the age groups. Not surprisingly all of those under 25 and none of those over 55 had five years service or less. But the table also brings out that about a third of those leaving in their thirties were going in five years or under. Similarly 22 per cent of those leaving primary schools and 14 per cent of those leaving in their early forties were resigning in the first years of service.
Table 6.5: Early Leavers by AgePer Cent of Leavers with 5 Year Service or Less
Primary SecondaryAge2002 2003 2002 2003
Under 25 100.0 100.0 100.0 100.0
25-29 85.1 83.0 87.2 83.0
30-34 31.4 38.5 33.9 35.4
35-39 26.8 31.3 21.7 27.5
40-44 21.2 23.5 12.8 15.6
45-49 0.0 4.3 6.4 13.250-55 2.2 6.5 3.1 2.9
Over 55 0.0 0.0 0.0 0.0
6.7 Those with five years service or less, however, were the most likely to return. As in the age analysis, Table 6.6 shows that over 40 per cent of the primary leavers and about a quarter of the secondary early leavers indicated they were likely to return, against a handful of those with 25 or more years’ service.
Table 6.6: Likelihood of Return Full Time by Length of ServicePer Cent ‘Likely’1
Primary SecondaryYears Service 2002 2003 2002 2003
5 and Under 41.0 50.0 26.7 27.2
6-10 23.7 35.0 24.4 15.9
11-15 31.9 33.4 20.4 26.4
16-20 10.3 31.6 12.9 12.5
21-25 18.7 9.0 9.7 2.7
Over 25 1.1 4.0 6.9 0.8
All 23.4 28.2 18.3 14.6
1. ‘Very likely’ and ‘likely’ combined.
Gender6.8 We have seen that female teachers are more likely to leave than male teachers.
Table 6.7 shows they are also somewhat more likely to expect to return.
35
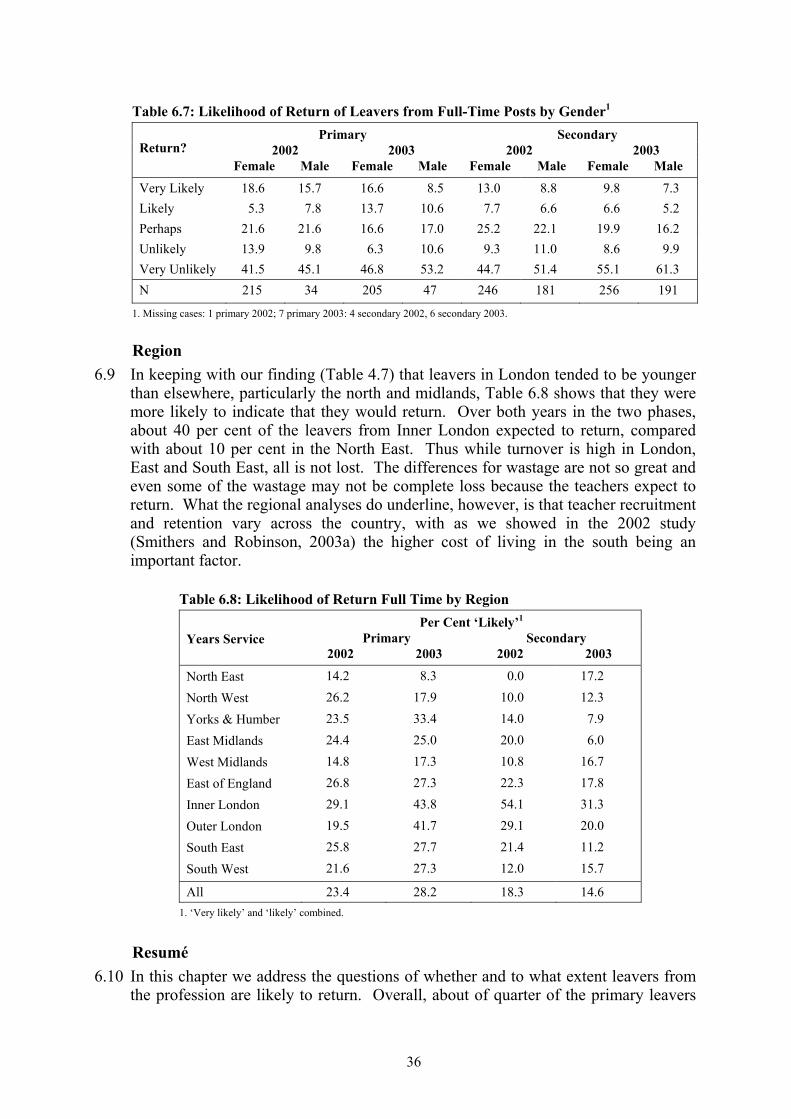
Table 6.7: Likelihood of Return of Leavers from Full-Time Posts by Gender1
Primary Secondary2002 2003 2002 2003Return?
Female Male Female Male Female Male Female Male
Very Likely 18.6 15.7 16.6 8.5 13.0 8.8 9.8 7.3Likely 5.3 7.8 13.7 10.6 7.7 6.6 6.6 5.2Perhaps 21.6 21.6 16.6 17.0 25.2 22.1 19.9 16.2Unlikely 13.9 9.8 6.3 10.6 9.3 11.0 8.6 9.9Very Unlikely 41.5 45.1 46.8 53.2 44.7 51.4 55.1 61.3N 215 34 205 47 246 181 256 191
1. Missing cases: 1 primary 2002; 7 primary 2003: 4 secondary 2002, 6 secondary 2003.
Region6.9 In keeping with our finding (Table 4.7) that leavers in London tended to be younger
than elsewhere, particularly the north and midlands, Table 6.8 shows that they were more likely to indicate that they would return. Over both years in the two phases, about 40 per cent of the leavers from Inner London expected to return, comparedwith about 10 per cent in the North East. Thus while turnover is high in London, East and South East, all is not lost. The differences for wastage are not so great and even some of the wastage may not be complete loss because the teachers expect to return. What the regional analyses do underline, however, is that teacher recruitmentand retention vary across the country, with as we showed in the 2002 study (Smithers and Robinson, 2003a) the higher cost of living in the south being an important factor.
Table 6.8: Likelihood of Return Full Time by RegionPer Cent ‘Likely’1
Primary SecondaryYears Service 2002 2003 2002 2003
North East 14.2 8.3 0.0 17.2
North West 26.2 17.9 10.0 12.3
Yorks & Humber 23.5 33.4 14.0 7.9
East Midlands 24.4 25.0 20.0 6.0
West Midlands 14.8 17.3 10.8 16.7
East of England 26.8 27.3 22.3 17.8
Inner London 29.1 43.8 54.1 31.3
Outer London 19.5 41.7 29.1 20.0
South East 25.8 27.7 21.4 11.2
South West 21.6 27.3 12.0 15.7
All 23.4 28.2 18.3 14.61. ‘Very likely’ and ‘likely’ combined.
Resumé6.10 In this chapter we address the questions of whether and to what extent leavers from
the profession are likely to return. Overall, about of quarter of the primary leavers
36

and about 16 per cent of the secondary leavers thought it likely they would return to teach full-time. Within those broad phase groupings, it was the younger leavers, those with five years’ service or under, female leavers, and those leaving schools in London who were most likely to expect to return.
37
7. Policy Pointers 7.1 The 2003 survey provides a strong confirmation of the 2002 study. It finds again
that teacher resignations are falling from the high levels reached in 2001 after three years of steep increases. In part, this can be claimed as a success for policies aimedat improving retention. But most of the reduction in 2003 is due to fewer movesbetween schools, not fewer leaving the profession. This is likely to be associated with fewer posts becoming available. It is most obvious in the primary phase where pupil numbers have been falling sharply. With per pupil funding this means that schools can afford fewer teachers. The latest data on teachers in service (DfES, 2004b) show that some 2,800 fewer full-time qualified regular teachers were employed in primary schools in 2004 compared with 2003, and that comes on top of a reduction of some 2,400 the previous year. Falling rolls is something which is currently affecting mainly primary schools, but pupil numbers in the secondary phase are set to fall in the next few years.
7.2 An emerging aspect of teacher loss is, therefore, what might be called ‘enforced wastage’. The 2003 study has revealed a small, but increasing number of teacher redundancies. In some cases, the staffing issue for a school has not been how to hold on to those who might want to leave, but who to let go. More expensive staff irrespective of their quality can find themselves vulnerable. Many of those teachers could valuably serve in other schools and perhaps suitably helped would want to. But, at present, most seem to lapse into early retirement taking on some occasional supply work.
Pointer 1: An emerging aspect of teacher wastage is the loss of potentially valuable teachers through redundancy or non-renewal of fixed-term contracts. Consideration should be given to developing a strategy for managing redundancy, in particular, how best to support those wishing to find new posts.
7.3 The main purpose of the present study has been to investigate turnover and wastage by school. It found that there is, indeed, a polarity in the system, particularly in the secondary phase, whereby teachers move to schools in what they perceive to be the more favourable circumstances. Schools with higher proportions of pupils who perform poorly, are eligible for free school meals, or have special needs, tend to find it more difficult to hold on to staff. This is understandable in terms of teachers’ career progression since they can find themselves judged on the academicperformance and behaviour of their pupils. It is arguable, however, that pupils who find learning more difficult deserve the better teachers. It becomes an issue, therefore, how and to what extent to attempt to counteract the polarity.
Pointer 2: Schools, particularly in the secondary phase, with low achieving pupils, with high eligibility for free schools meals, and with an above average proportion with special needs, tend to find it more difficult to retain staff. Further consideration should be given as to how to attract and retain good teachers in those schools.
7.4 Some schools are already receiving extra support through the Education Action Zone/Excellence in Cities programmes and Leadership Incentive Grants, and the evidence of this study, while not conclusive, points to lower wastage from them.
38
Elsewhere, we have shown how the extra funding from these schemes helped to protect schools from the ‘enforced wastage’ experienced by some schools as a result of the 2003-2004 budget settlement (Smithers and Robinson, 2003c).
7.5 We are also aware that the School Teachers’ Review Body has been asked by the Secretary of State to consider “whether there should be further changes in relation to local and regional pay”. It has interpreted this to mean “introducing new flexibilities or arrangements which could be adopted on a discretionary basis at a local level to deal with local problems.” In the first part of the Thirteenth Report (STRB, 2003), it recommended that, in order to increase the flexibility in recruitment and retention incentives, the fixed allowance scale should be abolished from 1 April 2004. That has now led to a modification of the School Teachers Pay and Conditions Document.In the second part of the Thirteen Report (STRB, 2004), the STRB has proposed a more flexible approach to the bands by which teachers in London and the surrounding areas are paid more. It has suggested that schools should be able to apply to move to a higher band on “evidence of persistent labour market difficulties, which should include data over the past three to five years”. This proposal is currently out to consultation till September 2004 with a view to implementation fromSeptember 2006.
7.6 It may be, therefore, that the disparities between schools and different parts of the country noted in this report are already being addressed through extra funding and more flexibility, but there is case for reviewing the progress made in the light of the new evidence and policies.
Pointer 3: Progress towards recruiting and retaining teachers in schools which have found it persistently difficult to maintain a full complement of good staff should be reviewed in the light of the new evidence and policies.
7.7 The 2002 study offered 17 policy pointers, many of which are being taken forward. It provided further evidence that workload is the main reason teachers quit at a timewhen a policy to address the demands on teachers was already unfolding (DfES, 2002a). The study also found that wastage was age related with many teachers over 50 tending to go early in anticipation of the retirement age of 60. We suggested that the impact of encouraging teachers to serve for a few more years should be assessed. This has been subsumed by a decision to raise the retirement to age 65 for new entrants from 1 September 2006 and for existing staff with effect from 1 September2013 (DfES 2002b). We also understand that the DfES and the Employers’Organisation for Local Government have been in discussion over their respective characterisations of turnover and wastage as suggested in the report.
7.8 Some of the 2002 pointers have served their purpose, but others are worth restating. The present research confirmed the earlier finding that wastage tends to be higher among the younger and older teachers than those in the middle years of 30-49. In fact, when moves to other schools are taken into account about a quarter of young teachers - whose induction will have represented an investment by the school - are leaving each year, and this probably more than anything is responsible for the impression that teacher retention is in crisis. Moves to other schools are, in the mainpart, of career development, but in some cases the cost of housing is too high to
39
allow young people easily to settle. Affordable housing for key workers is being addressed through schemes supported by the Starter Homes Initiative (Office of the Deputy Prime Minister, 2004), but there is more to be done. Not all teachers train at a young age and mature entrants also leave during the first three to five years. Wastage, therefore, is also related to length of service.
Pointer 4: Wastage is related to age and length of service with those at the two ends of the spectrum more likely to go, but for different reasons. Could more be done to retain these teachers?
7.9 The 2003 research, like the earlier study, found indications of higher turnover in the shortage subjects, but it was not possible to be sure because of limited informationon the national distribution. Since the first survey, the results from the 2002 Secondary Schools Curriculum and Staffing have been published (DfES, 2003d), but only percentages, not numbers, have been made available. We, therefore, reiterate a pointer from 2002:
Pointer 5: There are suggestions of higher turnover rates in the shortage subjects, but conclusive comparisons await better national statistics on school staffing by subject.
7.10 Not all teachers leaving the maintained sector envisage doing so permanently. In 2003, as in 2002, it was the younger leavers, those with five years’ service or less, female leavers and those leaving schools in London, who were most likely to expect to return to teaching in the maintained sector. It is, therefore, worth making the point again that schemes to encourage leavers to return are more likely to be successful if directed towards particular groups.
Pointer 6: In seeking to encourage re-entry, there are some groups who should be targeted, for example, young people coming back to this country from travelling or teaching abroad, or mothers looking for flexible part-time posts, or resignees looking to move from one part of the country to another.
7.11 Results from the 2003 study further underlined the differences between the primaryand secondary phases of maintained education. On virtually every aspect of teacher provision they differ. There is, for example, no difficulty in recruiting to primaryteacher training, but there are significant shortfalls in some subjects for secondary. In the case of primary, the number of trainees is limited by the allocation of places, but in secondary the constraint is often the quality of the applicants (Smithers and Robinson, 2000). On the other hand, teacher retention is higher in the secondary phase, partly due to the gender balance and maternity rates. But primary leavers are more likely to return and to be more interested in working part-time. Schools in the two phases are very different in size, and small primary schools are particularly vulnerable to per pupil funding since the loss of a teacher will have proportionally greater impact. The administrative load on senior staff in primary schools is also proportionally greater making it more difficult to recruit and retain deputy headteachers (Smithers and Robinson 2003a and 2003c).
Pointer 7: The considerable differences between the primary and secondary phases should be recognised and consideration should be given to explicitly developing separate policies for them.
40
7.12 But this report is not about promoting particular policies; its purpose is investigation, description and analysis. Nevertheless, it has seemed important to list the implications as we see them. The evidence on turnover, wastage and destinations in 2003 - including the new findings at the school level - and the policy pointers are offered as contributions to understanding the undoubtedly complex processes involved in bringing the demand for, and supply of, good teachers into balance.
41
ReferencesBlackwell, L, Lynch, K, and Jones, S. (2001). ‘Science teaching: the demographic
squeeze’. Labour Market Trends 485-493.
Cockburn, A. D. and Haydn, T. (2004). Recruiting and Retaining Teachers. London:RoutledgeFalmer.
Coolahan, J. (2002) Teacher Education and The Teaching Career in an Era of Lifelong Learning. OECD Education Working Paper No. 2. Paris: OECD.
Cunningham, P. (2000). Push and Pull Factors in Teacher Retention: the Perceptions of Teachers. London: Institute for Policy Studies in Education.
DfES (2001). Professionalism and Trust – The Future of Teachers and Teaching. ASpeech by Rt Hon Estelle Morris M P, Secretary of State for Education and Skills to the Social Market Foundation. London: DfES and Social Market Foundation.
DfES (2002a). Time for Standards: Reforming the School Workforce. London: DfES.
DfES (2002b). Simplicity, Security and Choice: Working and Saving for Retirement.Pensions Green Paper. London: The Stationery Office.
DfES (2002c) Statistics of Education. Schools in England 2002 Edition. London: The Stationery Office.
DfES (2003a) Written Evidence from the Department for Education and Skills to the School Teachers’ Review Body, Statistical Annex, July 2003.
DfES (2003b). Statistics of Education. School Workforce in England. London: The Stationery Office.
DfES (2003c) Statistics of Education. Schools in England 2003 Edition. London: The Stationery Office.
DfES (2003d) Secondary Schools Curriculum and Staffing Survey, November 2002 (Provisional). Statistical First Release 25/2003. London: DfES.
DfES (2004a). www.standards.dfes.gov.uk.
DfES (2004b) School Workforce in England, January 2004 (Provisional). Statistical First Release 09/2004. London: DfES.
Dolton, P. J. and Van der Klaauw, W. (1995). ‘Leaving teaching in the UK – a duration analysis’. Economic Journal 105 (429), 431-444.
Dolton, P. J. and Van der Klaauw, W. (1999). ‘The turnover of teachers: a competingrisks explanation’. Review of Economics and Statistics. 81 (3), 543-550.
Dolton, P., Tremayne, A. and Chung T-P. (2003). The Economic Cycle and Teacher Supply. Paris: OECD.
Edmonds, S., Sharp, C. and Benefield, P (2002). Recruitment to and Retention on Initial Teacher Training: A Systematic Review. Windsor: NFER.
Employers’ Organisation for Local Government (2002). Survey of Teacher Resignations and Recruitment 1885/6 –2001. London: Employers’ Organisation for Local Government.
42
Employers’ Organisation for Local Government (2004). Survey of Teacher Resignations and Recruitment 1885/6 –2002. London: Employers’ Organisation for Local Government.
Eurydice (2002a). The Teaching Profession in Europe: Profile, Trends and Concerns. Report I. Initial Training and Transition to Working Life of Teachers in General Lower Secondary Education. Brussels: Eurydice European Unit.
Eurydice (2002b). The Teaching Profession in Europe: Profile, Trends and Concerns. Report II. Teacher Supply and Demand at General Lower Secondary Level. Brussels: Eurydice European Unit.
Eurydice (2003). The Teaching Profession in Europe: Profile, Trends and Concerns.Report III. Working Conditions and Pay in General Lower Secondary Education.Brussels: Eurydice European Unit.
General Teaching Council (2003). ‘Teacher Survey’. The Guardian, 14 January 2003.
Graduate Teacher Training Registry (2004) Accepted Applicant Statistics.www.gttr.ac.uk/stats.html.
Gooding, J. (1989). Voices from the PIT. London: Froebel Institute College.
Hutchings, M., Menter, I., Ross, A. and Thomson, D., with Bedford, D. (2000). TeacherSupply and Retention: A Study of Six London Boroughs 1998-99. London: TTA.
Ingersoll, R. M. (2003). Is There Really a Teacher Shortage? A Research Report for The Centre for the Study of Teaching and Policy and The Consortium for Policy Research in Education. University of Washington: CTP.
Mulford, B (2003). School Leaders: Changing Roles and Impact on Teacher and School Effectiveness. Paris:OECD.
National Commission on Teaching and America’s Future. (2003). No Dream Denied. APledge to America’s Children. Washington: NCTAF.
OECD (2002). Attracting, Developing and Retaining Effective Teachers. Design and Implementation Plan for the Activity. Directorate for Education, Employment,Labour and Social Affairs, Education and Training Division. Paris: OECD.
Office of the Deputy Prime Minister (2004). Key Worker Living. Settle for More. Wetherby: ODPM.
Pachler, N. (2001). ‘Those who can teach? Issues and challenges in the recruitment,training and retention of teachers of German in the UK’. German as a Foreign Language February, 2001, 60-92.
Robinson, P. and Smithers, A. (1991). Teacher Turnover. Report to the Leverhulme Trust.Manchester: School of Education.
Ross, A. and Hutchings, M. (2003). Attracting, Developing and Retaining Effective Teachers in the United Kingdom of Great Britain and Northern Ireland. OECD Country Background Report. London: Institute for Policy Studies in Education, London Metropolitan University.
43
Santiago, P. (2002) Teacher Demand and Supply: Improving Teacher Quality and Addressing Teacher Shortages. OECD Education Working Paper No.1. Paris: OECD.
School Teachers’ Review Body (2003). Thirteen Report – Part 1. Cm 5987. London: The Stationery Office.
School Teachers’ Review Body (2004). Thirteen Report – Part 2. Cm 6164. London: The Stationery Office.
Scott, C. (1999). A Study of Teacher Satisfaction, Motivation and Health. Nottingham:Trent University.
Smithers, A. and Robinson, P. (2000). Attracting Teachers: Past Patterns, Present Policies, Future Prospects. Liverpool: Carmichael Press.
Smithers, A. and Robinson, P. (2003a). Factors Affecting Teachers’ Decisions to Leave the Profession. Research Report 430. London: DfES.
Smithers, A. and Robinson, P. (2003b). Teacher Training Profiles 2003, Liverpool:CEER.
Smithers, A. and Robinson, P. (2003c). The Reality of School Staffing. London: NUT.
Sturman, L. (2002). ‘Contented and committed: a survey of quality of working life amongst teachers’. National Foundation for Educational Research News, Autumn 2002, 6-7.
Troman, G. and Woods, P. (2001). Primary Teacher Stress. London: Routledge Falmer.
Varlaam, A., Nuttall, D. and Walker, A. (1992). What Makes Teachers Tick? Clare Market Papers No 4. London: Centre for Educational Research, London School of Economics.
White, B., See, B. H. and Gorard, S. and Robert, K. (2003) Review of TeacherRecruitment, Supply and Retention in Wales. Working Paper Series No 41. School of Social Sciences, Cardiff University.
Wilkins, R and Head, M. (2002) How to Retain and Motivate Experienced Teachers.Canterbury Christ Church University College: Centre for Education Leadership and School Improvement.
44
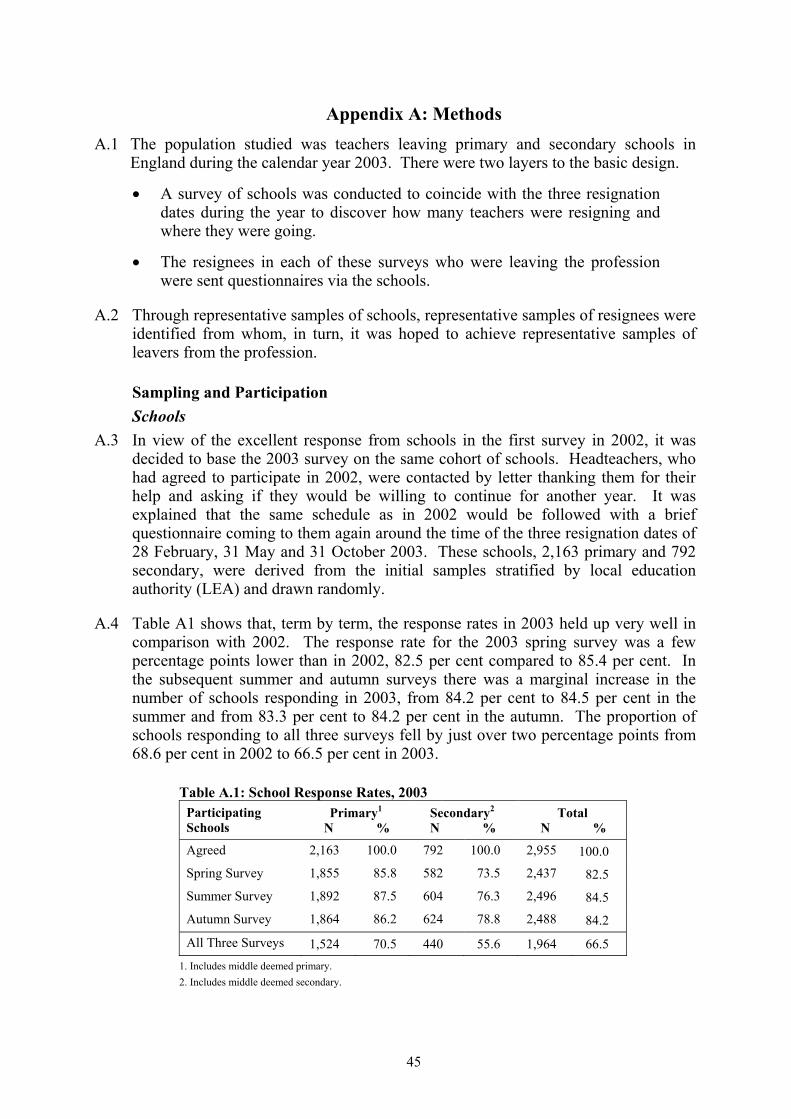
Appendix A: MethodsA.1 The population studied was teachers leaving primary and secondary schools in
England during the calendar year 2003. There were two layers to the basic design.
A survey of schools was conducted to coincide with the three resignation dates during the year to discover how many teachers were resigning and where they were going.
The resignees in each of these surveys who were leaving the profession were sent questionnaires via the schools.
A.2 Through representative samples of schools, representative samples of resignees were identified from whom, in turn, it was hoped to achieve representative samples of leavers from the profession.
Sampling and Participation Schools
A.3 In view of the excellent response from schools in the first survey in 2002, it was decided to base the 2003 survey on the same cohort of schools. Headteachers, who had agreed to participate in 2002, were contacted by letter thanking them for their help and asking if they would be willing to continue for another year. It was explained that the same schedule as in 2002 would be followed with a brief questionnaire coming to them again around the time of the three resignation dates of 28 February, 31 May and 31 October 2003. These schools, 2,163 primary and 792 secondary, were derived from the initial samples stratified by local education authority (LEA) and drawn randomly.
A.4 Table A1 shows that, term by term, the response rates in 2003 held up very well in comparison with 2002. The response rate for the 2003 spring survey was a few percentage points lower than in 2002, 82.5 per cent compared to 85.4 per cent. In the subsequent summer and autumn surveys there was a marginal increase in the number of schools responding in 2003, from 84.2 per cent to 84.5 per cent in the summer and from 83.3 per cent to 84.2 per cent in the autumn. The proportion of schools responding to all three surveys fell by just over two percentage points from68.6 per cent in 2002 to 66.5 per cent in 2003.
Table A.1: School Response Rates, 2003 Primary1 Secondary2 TotalParticipating
Schools N % N % N %
Agreed 2,163 100.0 792 100.0 2,955 100.0Spring Survey 1,855 85.8 582 73.5 2,437 82.5Summer Survey 1,892 87.5 604 76.3 2,496 84.5Autumn Survey 1,864 86.2 624 78.8 2,488 84.2
All Three Surveys 1,524 70.5 440 55.6 1,964 66.51. Includes middle deemed primary.2. Includes middle deemed secondary.
45
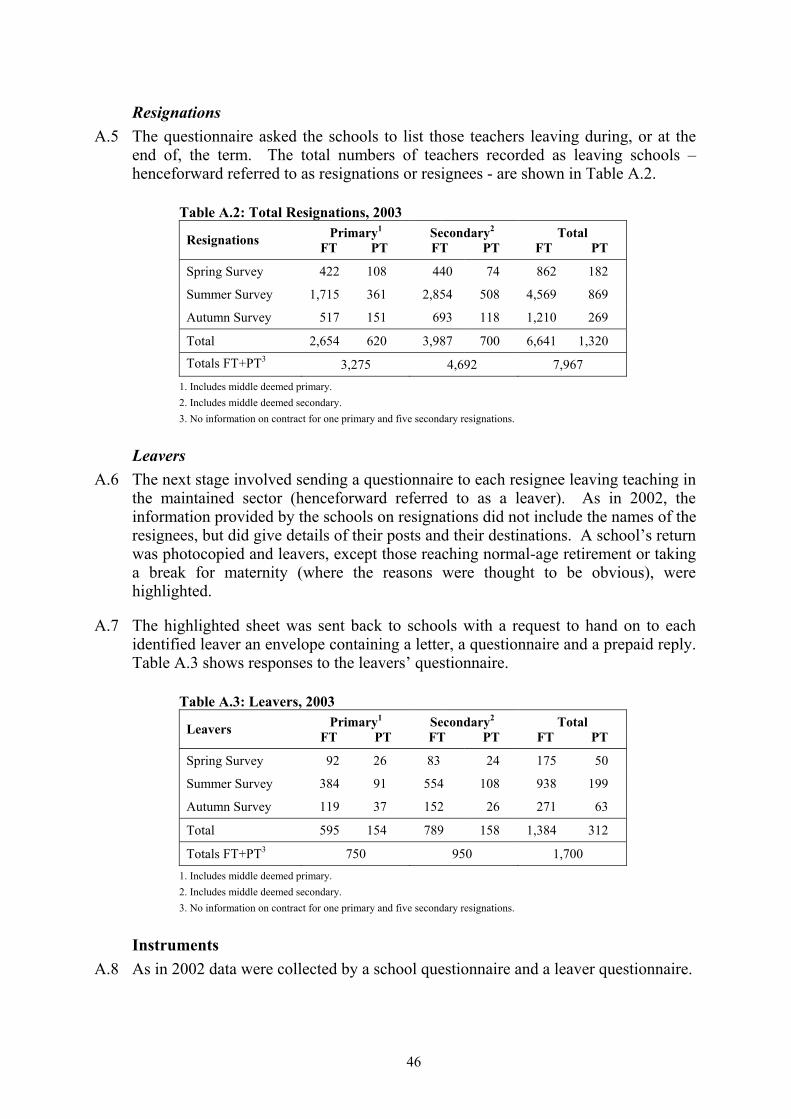
ResignationsA.5 The questionnaire asked the schools to list those teachers leaving during, or at the
end of, the term. The total numbers of teachers recorded as leaving schools – henceforward referred to as resignations or resignees - are shown in Table A.2.
Table A.2: Total Resignations, 2003 Primary1 Secondary2 TotalResignations FT PT FT PT FT PT
Spring Survey 422 108 440 74 862 182
Summer Survey 1,715 361 2,854 508 4,569 869
Autumn Survey 517 151 693 118 1,210 269
Total 2,654 620 3,987 700 6,641 1,320
Totals FT+PT3 3,275 4,692 7,9671. Includes middle deemed primary.2. Includes middle deemed secondary.3. No information on contract for one primary and five secondary resignations.
LeaversA.6 The next stage involved sending a questionnaire to each resignee leaving teaching in
the maintained sector (henceforward referred to as a leaver). As in 2002, the information provided by the schools on resignations did not include the names of the resignees, but did give details of their posts and their destinations. A school’s return was photocopied and leavers, except those reaching normal-age retirement or taking a break for maternity (where the reasons were thought to be obvious), were highlighted.
A.7 The highlighted sheet was sent back to schools with a request to hand on to each identified leaver an envelope containing a letter, a questionnaire and a prepaid reply. Table A.3 shows responses to the leavers’ questionnaire.
Table A.3: Leavers, 2003 Primary1 Secondary2 TotalLeavers FT PT FT PT FT PT
Spring Survey 92 26 83 24 175 50
Summer Survey 384 91 554 108 938 199
Autumn Survey 119 37 152 26 271 63
Total 595 154 789 158 1,384 312
Totals FT+PT3 750 950 1,7001. Includes middle deemed primary.2. Includes middle deemed secondary.3. No information on contract for one primary and five secondary resignations.
InstrumentsA.8 As in 2002 data were collected by a school questionnaire and a leaver questionnaire.
46
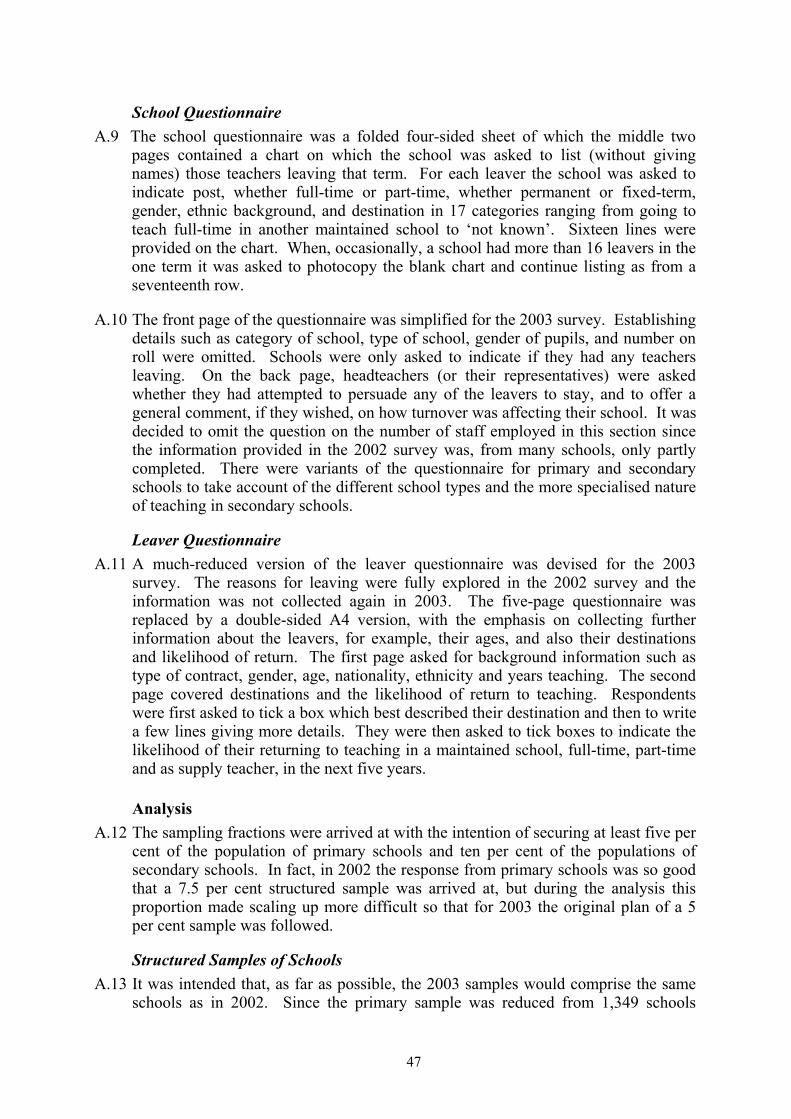
School QuestionnaireA.9 The school questionnaire was a folded four-sided sheet of which the middle two
pages contained a chart on which the school was asked to list (without giving names) those teachers leaving that term. For each leaver the school was asked to indicate post, whether full-time or part-time, whether permanent or fixed-term,gender, ethnic background, and destination in 17 categories ranging from going to teach full-time in another maintained school to ‘not known’. Sixteen lines were provided on the chart. When, occasionally, a school had more than 16 leavers in the one term it was asked to photocopy the blank chart and continue listing as from a seventeenth row.
A.10 The front page of the questionnaire was simplified for the 2003 survey. Establishing details such as category of school, type of school, gender of pupils, and number on roll were omitted. Schools were only asked to indicate if they had any teachers leaving. On the back page, headteachers (or their representatives) were asked whether they had attempted to persuade any of the leavers to stay, and to offer a general comment, if they wished, on how turnover was affecting their school. It was decided to omit the question on the number of staff employed in this section since the information provided in the 2002 survey was, from many schools, only partly completed. There were variants of the questionnaire for primary and secondary schools to take account of the different school types and the more specialised nature of teaching in secondary schools.
Leaver QuestionnaireA.11 A much-reduced version of the leaver questionnaire was devised for the 2003
survey. The reasons for leaving were fully explored in the 2002 survey and the information was not collected again in 2003. The five-page questionnaire was replaced by a double-sided A4 version, with the emphasis on collecting further information about the leavers, for example, their ages, and also their destinations and likelihood of return. The first page asked for background information such as type of contract, gender, age, nationality, ethnicity and years teaching. The second page covered destinations and the likelihood of return to teaching. Respondents were first asked to tick a box which best described their destination and then to write a few lines giving more details. They were then asked to tick boxes to indicate the likelihood of their returning to teaching in a maintained school, full-time, part-timeand as supply teacher, in the next five years.
AnalysisA.12 The sampling fractions were arrived at with the intention of securing at least five per
cent of the population of primary schools and ten per cent of the populations of secondary schools. In fact, in 2002 the response from primary schools was so good that a 7.5 per cent structured sample was arrived at, but during the analysis this proportion made scaling up more difficult so that for 2003 the original plan of a 5 per cent sample was followed.
Structured Samples of SchoolsA.13 It was intended that, as far as possible, the 2003 samples would comprise the same
schools as in 2002. Since the primary sample was reduced from 1,349 schools
47
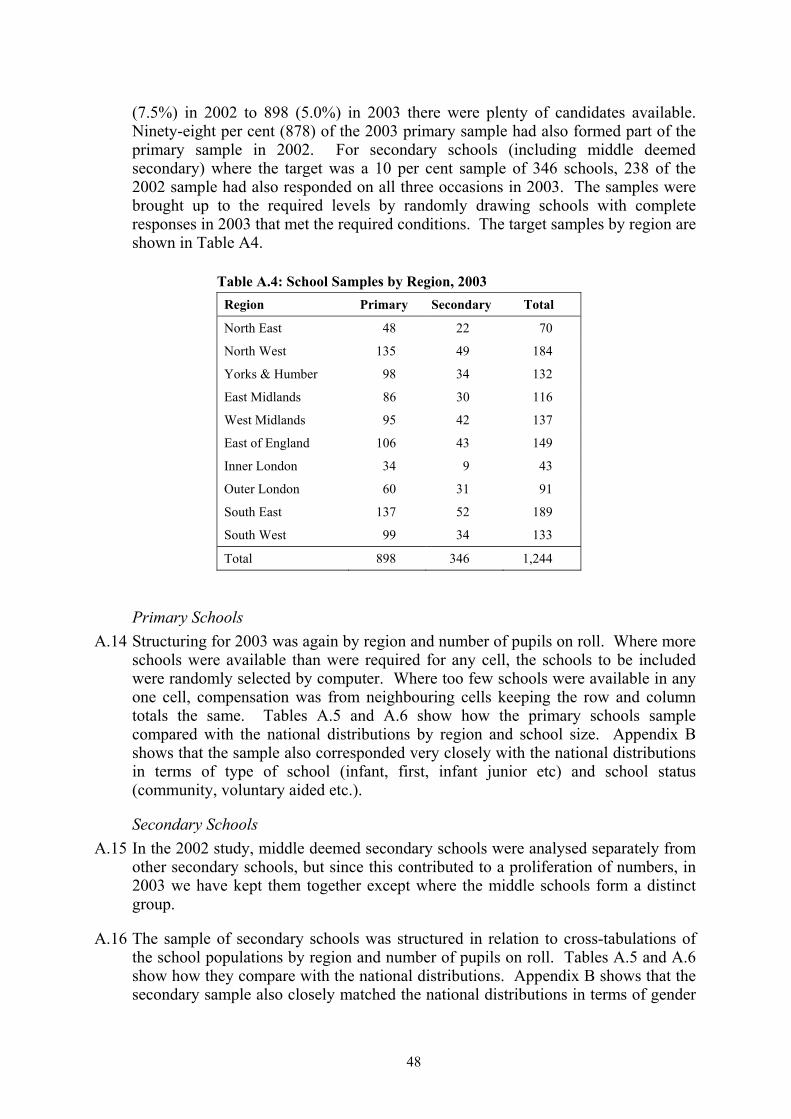
(7.5%) in 2002 to 898 (5.0%) in 2003 there were plenty of candidates available. Ninety-eight per cent (878) of the 2003 primary sample had also formed part of the primary sample in 2002. For secondary schools (including middle deemedsecondary) where the target was a 10 per cent sample of 346 schools, 238 of the 2002 sample had also responded on all three occasions in 2003. The samples were brought up to the required levels by randomly drawing schools with completeresponses in 2003 that met the required conditions. The target samples by region are shown in Table A4.
Table A.4: School Samples by Region, 2003Region Primary Secondary Total
North East 48 22 70
North West 135 49 184
Yorks & Humber 98 34 132
East Midlands 86 30 116
West Midlands 95 42 137
East of England 106 43 149
Inner London 34 9 43
Outer London 60 31 91
South East 137 52 189
South West 99 34 133
Total 898 346 1,244
Primary Schools A.14 Structuring for 2003 was again by region and number of pupils on roll. Where more
schools were available than were required for any cell, the schools to be included were randomly selected by computer. Where too few schools were available in any one cell, compensation was from neighbouring cells keeping the row and columntotals the same. Tables A.5 and A.6 show how the primary schools samplecompared with the national distributions by region and school size. Appendix B shows that the sample also corresponded very closely with the national distributions in terms of type of school (infant, first, infant junior etc) and school status (community, voluntary aided etc.).
Secondary Schools A.15 In the 2002 study, middle deemed secondary schools were analysed separately from
other secondary schools, but since this contributed to a proliferation of numbers, in 2003 we have kept them together except where the middle schools form a distinct group.
A.16 The sample of secondary schools was structured in relation to cross-tabulations of the school populations by region and number of pupils on roll. Tables A.5 and A.6 show how they compare with the national distributions. Appendix B shows that the secondary sample also closely matched the national distributions in terms of gender
48
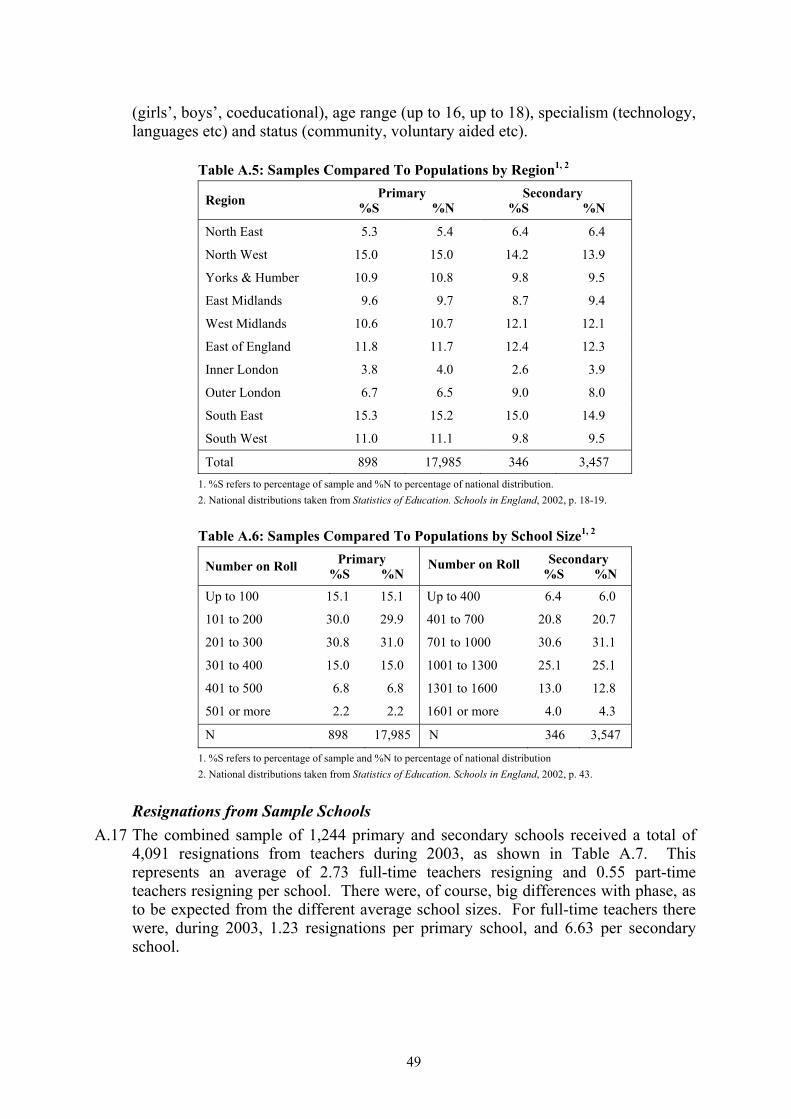
(girls’, boys’, coeducational), age range (up to 16, up to 18), specialism (technology, languages etc) and status (community, voluntary aided etc).
Table A.5: Samples Compared To Populations by Region1, 2
Primary SecondaryRegion %S %N %S %N
North East 5.3 5.4 6.4 6.4
North West 15.0 15.0 14.2 13.9
Yorks & Humber 10.9 10.8 9.8 9.5
East Midlands 9.6 9.7 8.7 9.4
West Midlands 10.6 10.7 12.1 12.1
East of England 11.8 11.7 12.4 12.3
Inner London 3.8 4.0 2.6 3.9
Outer London 6.7 6.5 9.0 8.0
South East 15.3 15.2 15.0 14.9
South West 11.0 11.1 9.8 9.5
Total 898 17,985 346 3,4571. %S refers to percentage of sample and %N to percentage of national distribution.2. National distributions taken from Statistics of Education. Schools in England, 2002, p. 18-19.
Table A.6: Samples Compared To Populations by School Size1, 2
Primary SecondaryNumber on Roll %S %NNumber on Roll
%S %N
Up to 100 15.1 15.1 Up to 400 6.4 6.0
101 to 200 30.0 29.9 401 to 700 20.8 20.7
201 to 300 30.8 31.0 701 to 1000 30.6 31.1
301 to 400 15.0 15.0 1001 to 1300 25.1 25.1
401 to 500 6.8 6.8 1301 to 1600 13.0 12.8
501 or more 2.2 2.2 1601 or more 4.0 4.3
N 898 17,985 N 346 3,547
1. %S refers to percentage of sample and %N to percentage of national distribution2. National distributions taken from Statistics of Education. Schools in England, 2002, p. 43.
Resignations from Sample SchoolsA.17 The combined sample of 1,244 primary and secondary schools received a total of
4,091 resignations from teachers during 2003, as shown in Table A.7. This represents an average of 2.73 full-time teachers resigning and 0.55 part-timeteachers resigning per school. There were, of course, big differences with phase, as to be expected from the different average school sizes. For full-time teachers there were, during 2003, 1.23 resignations per primary school, and 6.63 per secondary school.
49
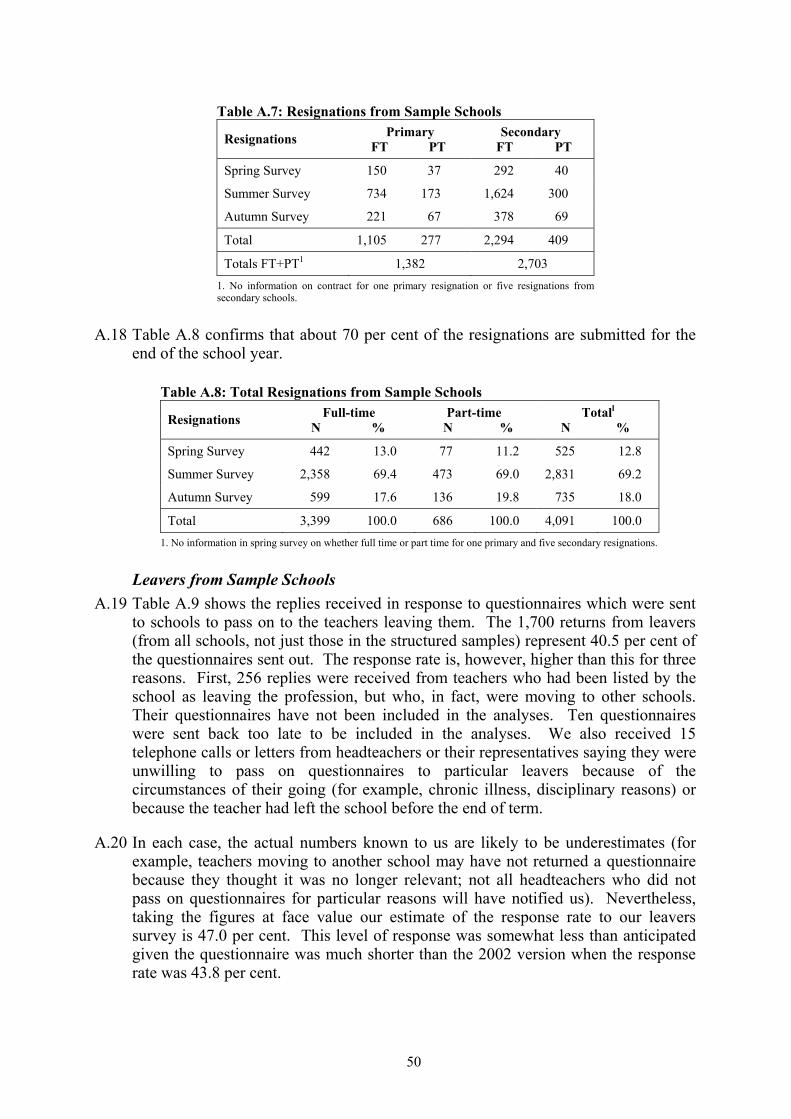
Table A.7: Resignations from Sample Schools Primary SecondaryResignations FT PT FT PT
Spring Survey 150 37 292 40
Summer Survey 734 173 1,624 300
Autumn Survey 221 67 378 69
Total 1,105 277 2,294 409
Totals FT+PT1 1,382 2,7031. No information on contract for one primary resignation or five resignations fromsecondary schools.
A.18 Table A.8 confirms that about 70 per cent of the resignations are submitted for the end of the school year.
Table A.8: Total Resignations from Sample Schools Full-time Part-time Totall
Resignations N % N % N %
Spring Survey 442 13.0 77 11.2 525 12.8
Summer Survey 2,358 69.4 473 69.0 2,831 69.2
Autumn Survey 599 17.6 136 19.8 735 18.0
Total 3,399 100.0 686 100.0 4,091 100.01. No information in spring survey on whether full time or part time for one primary and five secondary resignations.
Leavers from Sample Schools A.19 Table A.9 shows the replies received in response to questionnaires which were sent
to schools to pass on to the teachers leaving them. The 1,700 returns from leavers (from all schools, not just those in the structured samples) represent 40.5 per cent of the questionnaires sent out. The response rate is, however, higher than this for three reasons. First, 256 replies were received from teachers who had been listed by the school as leaving the profession, but who, in fact, were moving to other schools. Their questionnaires have not been included in the analyses. Ten questionnaires were sent back too late to be included in the analyses. We also received 15 telephone calls or letters from headteachers or their representatives saying they were unwilling to pass on questionnaires to particular leavers because of the circumstances of their going (for example, chronic illness, disciplinary reasons) or because the teacher had left the school before the end of term.
A.20 In each case, the actual numbers known to us are likely to be underestimates (for example, teachers moving to another school may have not returned a questionnaire because they thought it was no longer relevant; not all headteachers who did not pass on questionnaires for particular reasons will have notified us). Nevertheless, taking the figures at face value our estimate of the response rate to our leavers survey is 47.0 per cent. This level of response was somewhat less than anticipated given the questionnaire was much shorter than the 2002 version when the response rate was 43.8 per cent.
50
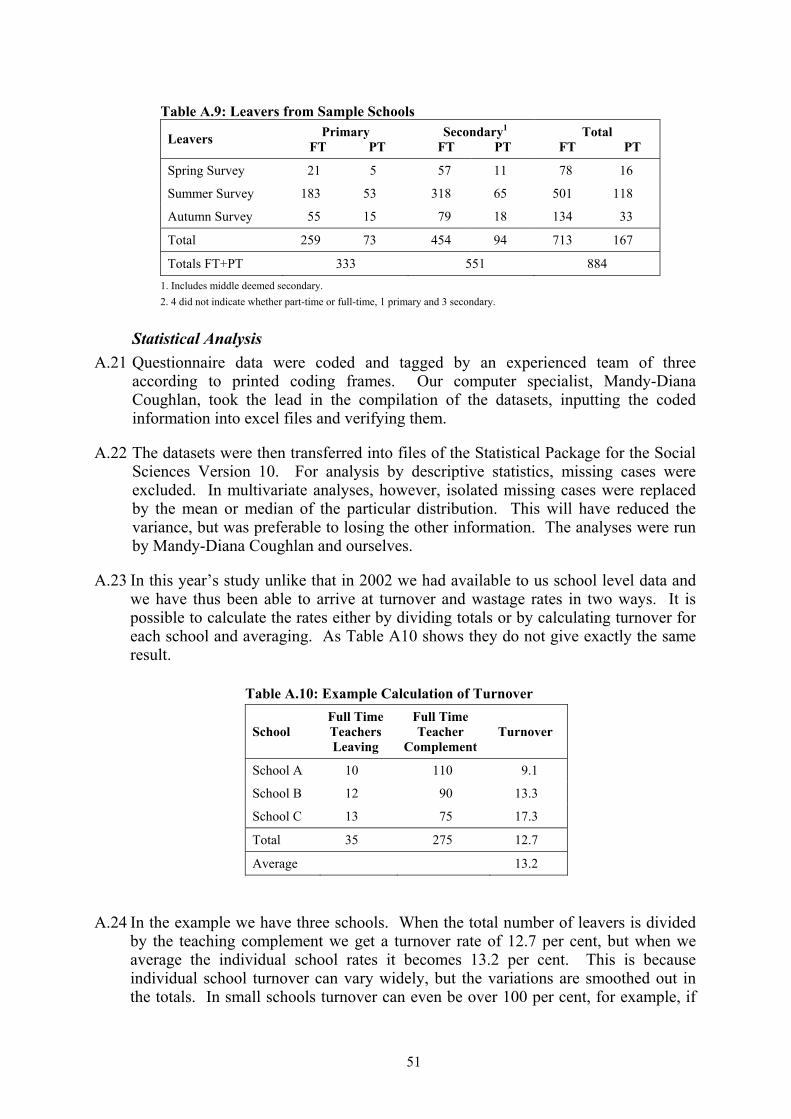
Table A.9: Leavers from Sample Schools Primary Secondary1 TotalLeavers FT PT FT PT FT PT
Spring Survey 21 5 57 11 78 16
Summer Survey 183 53 318 65 501 118
Autumn Survey 55 15 79 18 134 33
Total 259 73 454 94 713 167
Totals FT+PT 333 551 8841. Includes middle deemed secondary.2. 4 did not indicate whether part-time or full-time, 1 primary and 3 secondary.
Statistical Analysis A.21 Questionnaire data were coded and tagged by an experienced team of three
according to printed coding frames. Our computer specialist, Mandy-Diana Coughlan, took the lead in the compilation of the datasets, inputting the coded information into excel files and verifying them.
A.22 The datasets were then transferred into files of the Statistical Package for the Social Sciences Version 10. For analysis by descriptive statistics, missing cases were excluded. In multivariate analyses, however, isolated missing cases were replaced by the mean or median of the particular distribution. This will have reduced the variance, but was preferable to losing the other information. The analyses were run by Mandy-Diana Coughlan and ourselves.
A.23 In this year’s study unlike that in 2002 we had available to us school level data and we have thus been able to arrive at turnover and wastage rates in two ways. It is possible to calculate the rates either by dividing totals or by calculating turnover for each school and averaging. As Table A10 shows they do not give exactly the sameresult.
Table A.10: Example Calculation of Turnover
SchoolFull Time TeachersLeaving
Full Time Teacher
ComplementTurnover
School A 10 110 9.1
School B 12 90 13.3
School C 13 75 17.3
Total 35 275 12.7
Average 13.2
A.24 In the example we have three schools. When the total number of leavers is divided by the teaching complement we get a turnover rate of 12.7 per cent, but when we average the individual school rates it becomes 13.2 per cent. This is because individual school turnover can vary widely, but the variations are smoothed out in the totals. In small schools turnover can even be over 100 per cent, for example, if
51
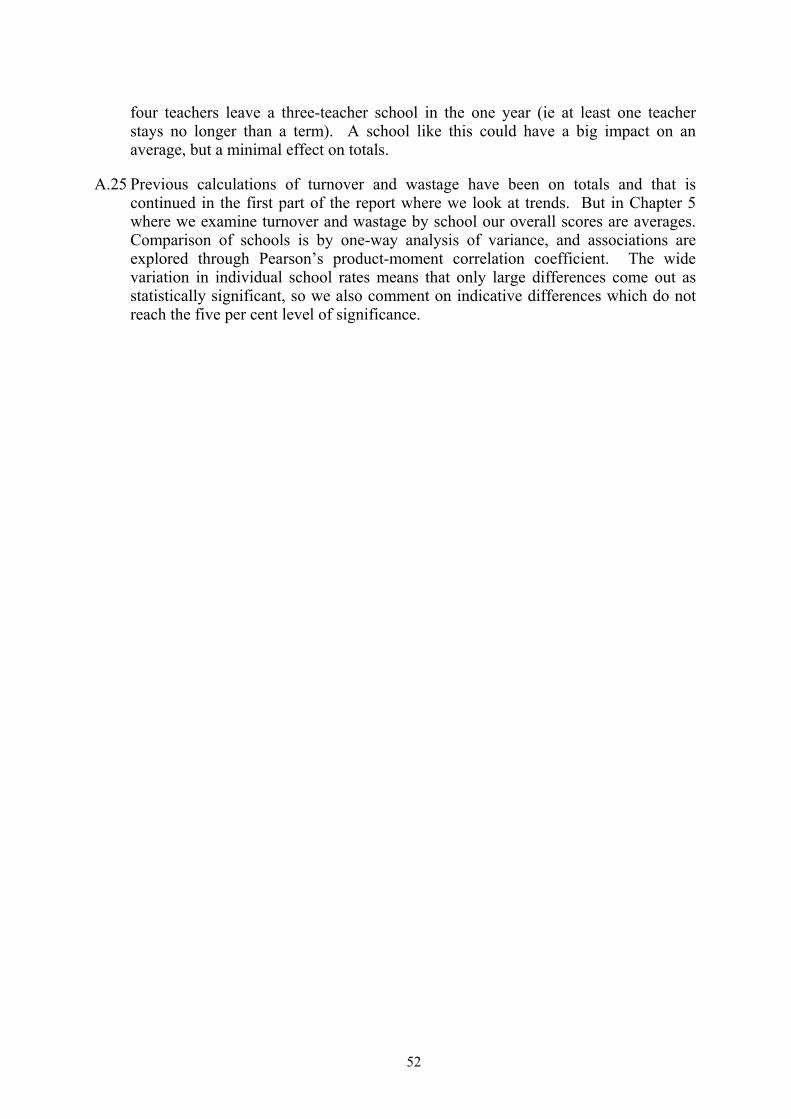
four teachers leave a three-teacher school in the one year (ie at least one teacher stays no longer than a term). A school like this could have a big impact on an average, but a minimal effect on totals.
A.25 Previous calculations of turnover and wastage have been on totals and that is continued in the first part of the report where we look at trends. But in Chapter 5 where we examine turnover and wastage by school our overall scores are averages. Comparison of schools is by one-way analysis of variance, and associations are explored through Pearson’s product-moment correlation coefficient. The wide variation in individual school rates means that only large differences come out as statistically significant, so we also comment on indicative differences which do not reach the five per cent level of significance.
52
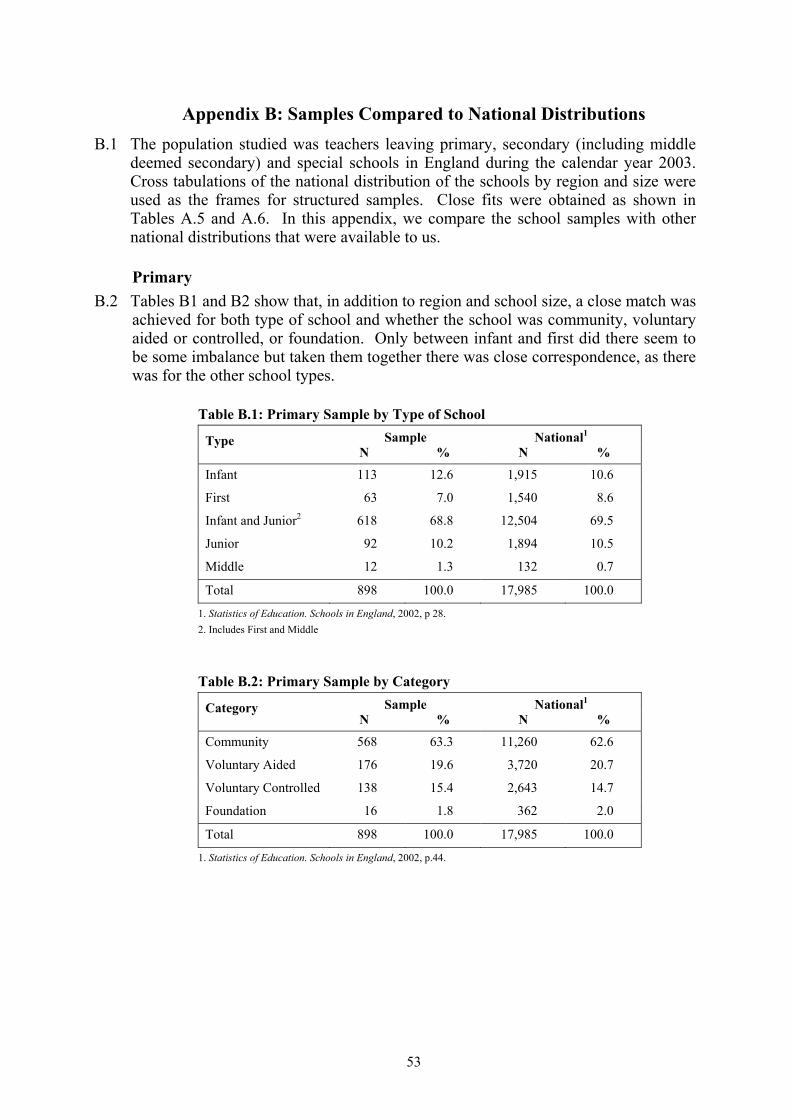
Appendix B: Samples Compared to National DistributionsB.1 The population studied was teachers leaving primary, secondary (including middle
deemed secondary) and special schools in England during the calendar year 2003. Cross tabulations of the national distribution of the schools by region and size were used as the frames for structured samples. Close fits were obtained as shown in Tables A.5 and A.6. In this appendix, we compare the school samples with other national distributions that were available to us.
PrimaryB.2 Tables B1 and B2 show that, in addition to region and school size, a close match was
achieved for both type of school and whether the school was community, voluntary aided or controlled, or foundation. Only between infant and first did there seem to be some imbalance but taken them together there was close correspondence, as there was for the other school types.
Table B.1: Primary Sample by Type of SchoolSample National1
TypeN % N %
Infant 113 12.6 1,915 10.6
First 63 7.0 1,540 8.6
Infant and Junior2 618 68.8 12,504 69.5
Junior 92 10.2 1,894 10.5
Middle 12 1.3 132 0.7
Total 898 100.0 17,985 100.0
1. Statistics of Education. Schools in England, 2002, p 28.2. Includes First and Middle
Table B.2: Primary Sample by CategorySample National1
CategoryN % N %
Community 568 63.3 11,260 62.6
Voluntary Aided 176 19.6 3,720 20.7
Voluntary Controlled 138 15.4 2,643 14.7
Foundation 16 1.8 362 2.0
Total 898 100.0 17,985 100.0
1. Statistics of Education. Schools in England, 2002, p.44.
53
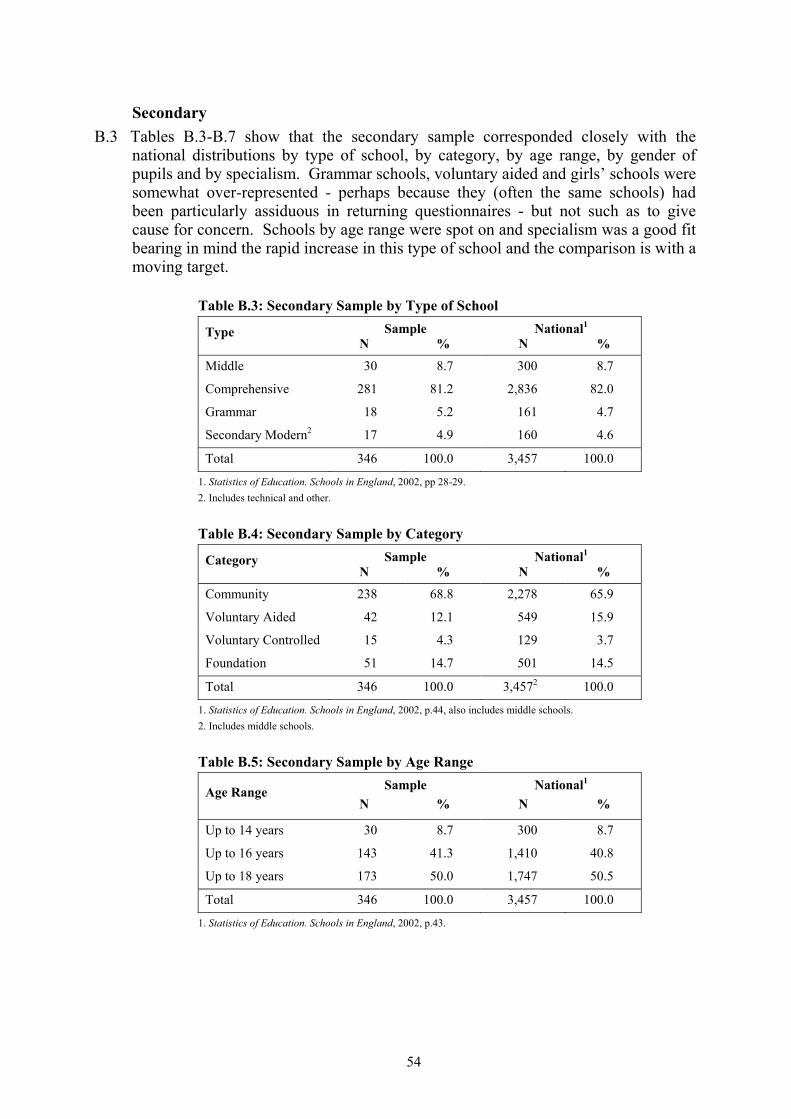
SecondaryB.3 Tables B.3-B.7 show that the secondary sample corresponded closely with the
national distributions by type of school, by category, by age range, by gender of pupils and by specialism. Grammar schools, voluntary aided and girls’ schools were somewhat over-represented - perhaps because they (often the same schools) had been particularly assiduous in returning questionnaires - but not such as to give cause for concern. Schools by age range were spot on and specialism was a good fit bearing in mind the rapid increase in this type of school and the comparison is with a moving target.
Table B.3: Secondary Sample by Type of SchoolSample National1
TypeN % N %
Middle 30 8.7 300 8.7
Comprehensive 281 81.2 2,836 82.0
Grammar 18 5.2 161 4.7
Secondary Modern2 17 4.9 160 4.6
Total 346 100.0 3,457 100.0
1. Statistics of Education. Schools in England, 2002, pp 28-29.2. Includes technical and other.
Table B.4: Secondary Sample by CategorySample National1
CategoryN % N %
Community 238 68.8 2,278 65.9
Voluntary Aided 42 12.1 549 15.9
Voluntary Controlled 15 4.3 129 3.7
Foundation 51 14.7 501 14.5
Total 346 100.0 3,4572 100.0
1. Statistics of Education. Schools in England, 2002, p.44, also includes middle schools.2. Includes middle schools.
Table B.5: Secondary Sample by Age RangeSample National1
Age Range N % N %
Up to 14 years 30 8.7 300 8.7
Up to 16 years 143 41.3 1,410 40.8
Up to 18 years 173 50.0 1,747 50.5
Total 346 100.0 3,457 100.0
1. Statistics of Education. Schools in England, 2002, p.43.
54
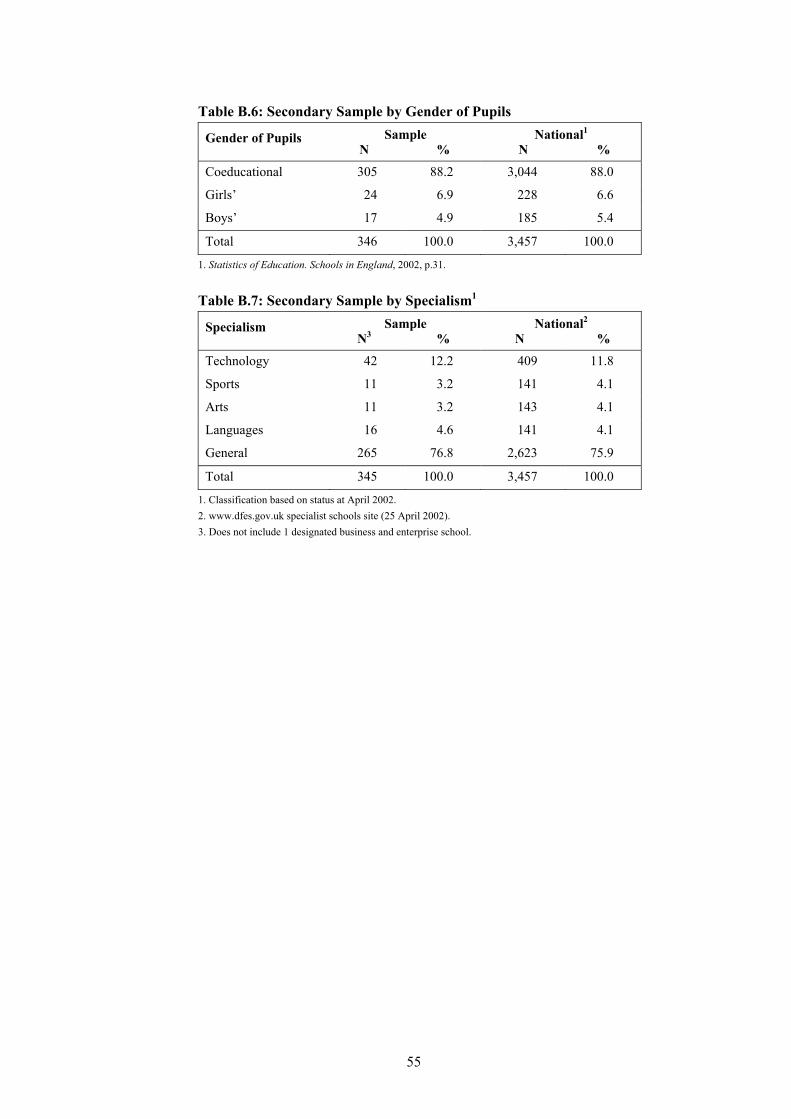
55
Table B.6: Secondary Sample by Gender of PupilsSample National1
Gender of Pupils N % N %
Coeducational 305 88.2 3,044 88.0
Girls’ 24 6.9 228 6.6
Boys’ 17 4.9 185 5.4
Total 346 100.0 3,457 100.0
1. Statistics of Education. Schools in England, 2002, p.31.
Table B.7: Secondary Sample by Specialism1
Sample National2Specialism
N3 % N %
Technology 42 12.2 409 11.8
Sports 11 3.2 141 4.1
Arts 11 3.2 143 4.1
Languages 16 4.6 141 4.1
General 265 76.8 2,623 75.9
Total 345 100.0 3,457 100.0
1. Classification based on status at April 2002. 2. www.dfes.gov.uk specialist schools site (25 April 2002). 3. Does not include 1 designated business and enterprise school.