Embed Size (px)
Citation preview
Teacher’s Guide to
Sampling Protocols
W A :
E . .
E‐ C
Arizona State University
Global Ins tute of Sustainability
480‐965‐2975

2
Teacher’s Guide
This material is based upon work supported by the National Science Foundation under the Long-Term Ecological Research program , award # DEB-0423704. Opinions, findings, conclusions or recommendations expressed in this material are those of the authors and do not necessarily reflect the views of the National Science Foundation.
©2000 Ecology Explorers, Arizona State University. All rights reserved.
Updated March 2010
3
Teacher’s Guide
Table of Contents
About this PDF file .............................................................................. 4
About CAP LTER ................................................................................. 4
Mapping Research Site ....................................................................... 5 Background ................................................................................ 5 Webpages ................................................................................... 7 Ground Arthropod Study .................................................................. 10 Background .............................................................................. 10 Webpages ................................................................................. 11 Describing Habitat Structure ..................................................... 15 Data Sheets ............................................................................... 16 Key ........................................................................................... 19 Bird Survey ...................................................................................... 20 Background .............................................................................. 20 Web pages ................................................................................ 22 Describing Habitat Structure ..................................................... 25 Data Sheets ............................................................................... 26 Key ........................................................................................... 29 Plant/Insect Interaction .................................................................... 31 Background .............................................................................. 31 Web pages ................................................................................ 32 Describing Habitat Structure ..................................................... 35 Data Sheets ............................................................................... 36 Key ........................................................................................... 37 Vegetation Survey Background .............................................................................. 39 Web pages ................................................................................ 40 Describing Habitat Structure ..................................................... 45 Data Sheets ............................................................................... 46 Key ........................................................................................... 51 Entering and Downloading Data ........................................................ 58
Other Resources .............................................................................. 63
Ecology Explorers and the AZ State Standards ................................. 64

4
Teacher’s Guide
Notes Teachers:
These PDF Files include all of the basic protocols needed to begin the Ecology Explorers program. We’ve added: 1) brief descriptions of the Central Arizona—Phoenix Long-Term Ecological Research project, 2) background information on each of the protocols, 3) how to enter and download data, and 4)how Ecology Explorers meets the State of Arizona Academic Standards.
The CAP LTER project
is a multi-year research program funded by the National Science Foundation
is one of only two urban LTER’s in the country; there are a total of 26 Long-Term Ecological Research sites (http://www.lternet.edu/) around the country
is administered by the ASU International Institute for Sustainability
involves over 50 scientists throughout ASU (Tempe, East & West campuses), community colleges, and several community and education partners
website address is: http://caplter.asu.edu
CAP LTER Research
How does urban development of the Phoenix area alter ecological conditions?
In what ways do ecological conditions alter urban development?
These two overarching questions are reflected in more specific questions that CAP LTER scientists ask as they carry out long-term monitoring and short-term investigations. Teams of scientists are investigating the following questions about our urban ecosystem:
What controls growth of plants?
How do plant and animal populations vary over time and space?
What is the fate of organic matter?
How do inorganic nutrients move through the water and the soil?
How do disturbances affect the ecosystem?
By building a better understanding of the environment of the city, LTER research will provide sound scientific information to the community and policy makers working together to ensure a healthy future of the Phoenix area. Data is being made available on our internet
5
Teacher’s Guide
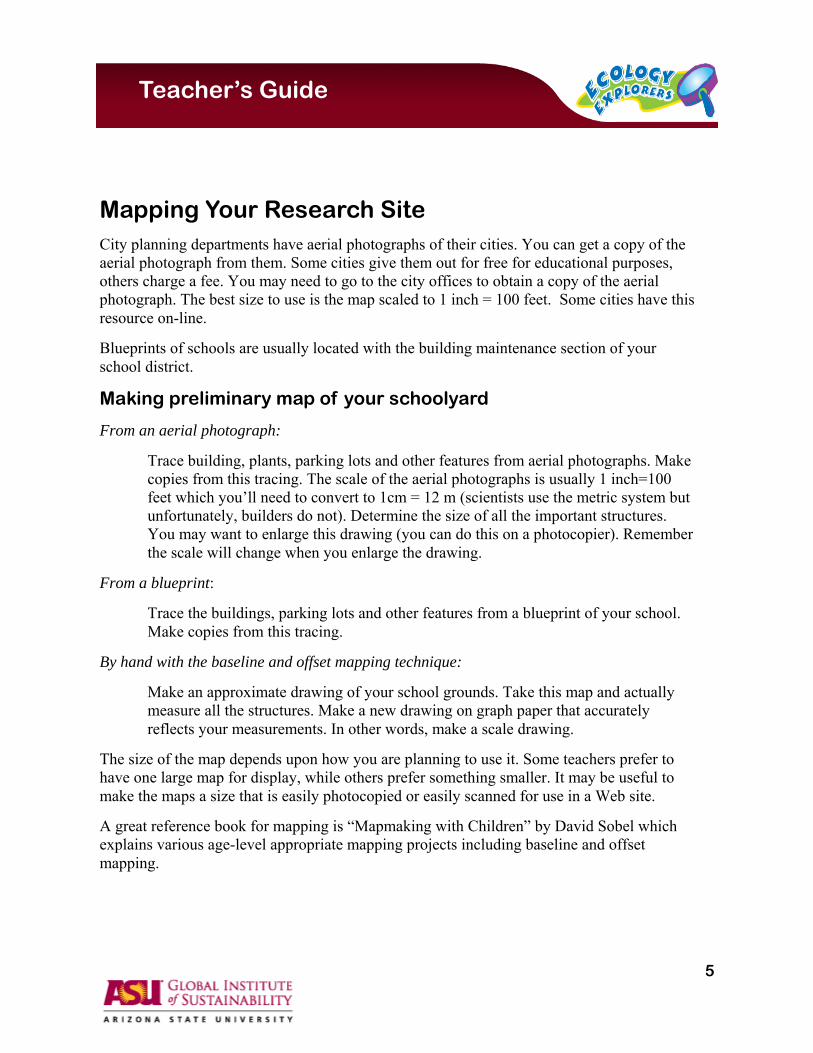
Mapping Your Research Site City planning departments have aerial photographs of their cities. You can get a copy of the aerial photograph from them. Some cities give them out for free for educational purposes, others charge a fee. You may need to go to the city offices to obtain a copy of the aerial photograph. The best size to use is the map scaled to 1 inch = 100 feet. Some cities have this resource on-line.
Blueprints of schools are usually located with the building maintenance section of your school district.
Making preliminary map of your schoolyard
From an aerial photograph:
Trace building, plants, parking lots and other features from aerial photographs. Make copies from this tracing. The scale of the aerial photographs is usually 1 inch=100 feet which you’ll need to convert to 1cm = 12 m (scientists use the metric system but unfortunately, builders do not). Determine the size of all the important structures. You may want to enlarge this drawing (you can do this on a photocopier). Remember the scale will change when you enlarge the drawing.
From a blueprint:
Trace the buildings, parking lots and other features from a blueprint of your school. Make copies from this tracing.
By hand with the baseline and offset mapping technique:
Make an approximate drawing of your school grounds. Take this map and actually measure all the structures. Make a new drawing on graph paper that accurately reflects your measurements. In other words, make a scale drawing.
The size of the map depends upon how you are planning to use it. Some teachers prefer to have one large map for display, while others prefer something smaller. It may be useful to make the maps a size that is easily photocopied or easily scanned for use in a Web site.
A great reference book for mapping is “Mapmaking with Children” by David Sobel which explains various age-level appropriate mapping projects including baseline and offset mapping.

6
Teacher’s Guide
Grade Level
Middle school and high school students should be able to make accurate measurements of plant locations in their schoolyards. Teachers may want students to actually measure the structures as well, although this information can be taken directly from the aerial photos/blueprints.
Approximate locations of plants is adequate for elementary school students. One method of doing this is to divide a specific location to be mapped into quadrants and have groups of students map each quadrant. Students are supplied with stickers representing different types of vegetation (green for leaf trees, brown for pine trees, red for bushes, etc.) and the students place the stickers on their maps using their estimation skills. Then the quadrants can be put together for a larger map of one area.
Past and Present:
It is important for students to have some idea of the history of their research site. In the valley some schools actually rest on archaeological sites and so the history of human interactions with the environment at their school site can be quite long. Basic information about maintenance schedules and schoolyard use may be used in determining study sites or when to do collection (for example, if the school uses pesticides this may affect the arthropod sampling). This information may also be useful when students are developing hypotheses and experiments.
Grade Level:
Students at all levels can participate in conducting surveys and researching the site history

7
web page content
Teacher’s Guide
Mapping Your Research Site
Ecologists map research sites as a first step in documenting the living and non-living aspects of an ecosystem. The map also establishes the boundaries of the research site. You’ll use your map for a variety of projects: showing your data collection locations; comparing features of your schoolyard to other schoolyards; and comparing changes to the schoolyard over time.
Obtain a preliminary map from your teacher
If an aerial photograph of your school is available, compare it to your map.
Ground verification
Make sure your preliminary map contains the major structures (buildings, parking lots, etc.) and vegetation (trees, shrubs, etc.) at your school. You’ll need to go outside and verify that the structures and vegetation included on the preliminary map still exist and whether new ones have been added.
Try to include the following information on your map:
Direction (usually north)
Human-made structures (sidewalks, playing fields)
Water sources
Topography
Traffic patterns of wildlife, people, and vehicles
Path of sun and wind exposure
Plant locations
Scale
For a detailed map, carefully measure the distance from known locations to new objects and then plot the new objects on your map.

8
web page content
Teacher’s Guide
Your Research Site
Describe the past and the present condition of your research site
Why think about the past?
Ecologists study the history of a research site as they investigate why current ecological conditions exist. For example, knowing when the last fire occurred would explain certain vegetation patterns.
Urban ecologists also investigate the impact of past human decisions on current ecological conditions. For example, few mature saguaro cacti are found on ASU's “A” mountain. Without considering past human influence, you might base your explanation on natural phenomena (like soil type or exposure). By ignoring human factors, you would overlook the main reason for the lack of mature saguaro cacti—they were removed by people.
Historic events you might document
What was at your site before it became a school?
Is there a written site history?
When was your site transformed from native desert to some other use?
When did it become a schoolyard?
Who decided what vegetation to plant?
Have parts of the schoolyard changed from the original design?
Next, think about the present
Why should you look at how your schoolyard is used and maintained? Your answers to these questions will be useful a you decide when to collect data. For example, you’ll want to schedule data collection at times when pesticides are not used. The answers to your question will also be useful when you start analyzing data.
When you describe your schoolyard, include both physical descriptions (most of these will be on your map) as well as how the schoolyard is used.

9
web page content
Teacher’s Guide
What should you know about the present?
Who takes care of the schoolyard?
Can you describe your school’s maintenance schedule?
How often is the grass watered and mowed?
How often are herbicides/pesticides used?
Which teachers currently use the schoolyard for class projects?
What areas are used by the students at recess and/or breaks?
Which areas are used more during specific times of school year?
How do the staff and faculty use part of the schoolyard during their breaks?
What after-school activities use part of the schoolyard?
How is the schoolyard used over the school vacations?
10
Teacher’s Guide
Arthropod Protocol & CAP LTER
The primary goals of the CAP LTER arthropod project are to determine how communities of insects and arachnids vary among different habitat types within Phoenix, and how these patterns change over time. Arthropods are logical choices for long-term monitoring because 1) they are diverse and thus provide a fairly quick picture of biological diversity, 2) they respond quickly to habitat/disturbance/soil/vegetation changes and hence fit well with monitoring by other groups, 3) they are fairly easy to collect, 4) they represent a spectrum of feeding (trophic) levels, including decomposers, herbivores, predators, and parasites and 5) they are important sociological, economical and agricultural components of human altered habitats. Although several sampling methods can be used to collect arthropods, CAP LTER scientists settled on pitfall traps for ground/litter insects since they are relatively low tech and easy to use. The CAP LTER scientists have selected 28 study sites within and around the metropolitan Phoenix area, with the goal of monitoring arthropod communities in representative habitat types. Four sites have been selected in each of the following habitat categories: desert outside city boundaries, desert parks (remnants), xeric (dry) urban yards, mesic (heavily irrigated) urban yards, combination xeric and mesic yards, agricultural fields, and industrial/commercial sites. This project generates a large number of samples (>1000 sample jars per year), each with an enormous diversity and abundance of arthropods (frequently >1000 individuals of >20 species in each sample pitfall trap). The results from this study lend insight into the implications of transforming native Sonoran Desert into a major metropolitan area for an important group of animals.
Comments on the Protocol:
The K-12 Ground Arthropod sampling protocol is consistent with the design being used by the CAP LTER researchers--yes, they use Solo© cups too!!! The students are asked to identify spiders, scorpions, and insects and then to order within the insects classification group. The key is fairly limited but represents the most common insect orders.
Insects should be handled with forceps and not by hand. Place the collected samples in a freezer or ice chest to make sure that the insects are dead before allowing students to handle them.
Grade Level:
Collecting insects appeals to many children although being able to use the key requires reading and sorting skills. Earlier grades may benefit from being paired with older students when trying to identify the insects.
11
web page content
Teacher’s Guide
Arthropods
What Bugs Are Crawling Around Your Schoolyard?
What are arthropods?
Arthropods are insects and arachnids, including spiders, ants, ticks, beetles, flies, scorpions. They are important components of our desert and urban food webs.
What do arthropods tell us about our urban ecosystem?
By comparing arthropod populations among different types of land use, we may see how different human activities (farming, industry, building residential communities, watering lawns) affect biological diversity.
How are CAP LTER scientists studying arthropods?
First scientists ask questions, such as:
•How has urbanization affected the number and diversity of arthropod species?
•Are there areas within urban Phoenix that attract more arthropods?
Next, to answer these and other questions, CAP LTER scientists are investigating ground arthropod populations (number and diversity) at several different habitats:
desert remnant (inside the city)
desert outside city boundaries
industrial
xeric (dry) residential yards
mesic (heavily irrigated) residential yards
xeric/mesic combination residential yards
agricultural fields
Your research adds another habitat type: schoolyards (and/or a wider variety of backyards). Because not all schoolyards are the same, your schoolyard map will be REALLY important when you begin to analyze your data. The vegetation survey also will be important.
12
web page content
Teacher’s Guide
Study Arthropods
What are arthropods?
Arthropods are insects and arachnids, including spiders, ants, ticks, beetles, flies, scorpions . . .
Why study arthropods?
• They are important components of any food web.
• There are many different kinds and in a single collection you can find arthropods which are decomposers, herbivores, predators, and parasites.
• Because they have short life cycles, they respond quickly to habitat disturbance and changes in soil and vegetation
• They are fairly easy to collect.
What kinds of scientific investigations can be developed from this protocol?
Using the protocol, you will record the arthropods collected in your schoolyard. From your observations you can investigate how the population compares to those found at other landscape types where CAP LTER scientists are collecting data. You can also investigate what characteristics of the schoolyard are attracting the kinds of arthropods you are finding.
What materials will you need?
- Bulb planter -Metric measuring tape
- Metric ruler -Tweezers
- Magnifying glass -Pencils
- 16-ounce Solo© cups and lids -Data sheets
- Ziplock© bags
- Cooler with blue ice (if you have a freezer in which to store samples, you’ll only use the cooler when you’re outside. If you don’t have a freezer or you don’t want to put your samples in it, then be sure to check the ice periodically).
13
web page content
Teacher’s Guide
Arthropod Protocols
How to survey ground arthropods
1. Use pitfall traps to collect arthropods once a month. The pit traps consist two 16-ounce Solo© cups, one inside the other, buried in the ground so that the top of the cup is ever so slightly below the surface of the soil. (If the top of the cup is above the ground, the bugs will walk around your trap instead of into it.)
2. Use a trowel to dig 10 holes in a line, 5 meters apart.
If the area in your schoolyard is not long enough for this kind of arrangement, use a grid pattern, but be sure to keep 5 meters between the traps. And be sure to indicate the arrangement on your data sheet. Don't worry if the line goes from lawn to shrubs or by trees.
Assign a number to each trap. Let’s say that you’re collecting 10 samples from the northeast area and 10 others from the west end of the schoolyard at Jone’s Middle School. You could name the first 10 traps Jone’s NE1 - Jone’s NE10 and the second 10 Jone’s W1 - Jone’s W10.
3. Complete a habitat description for each of your traplines. Record your findings on the site description data sheet. You will need to do this before entering data into the CAP LTER database. YOU ONLY NEED TO DO THIS ONCE PER TRAP LINE.
4. Place the pit traps (Solo© cups) in the ground. Remember to use two cups, one inside the other.
5. Leave the traps alone for 72 hours.
Why so long? Imagine how long it takes a bug to crawl 5 meters. If you want to get a good picture of arthropod diversity, you need to give the critters time to fall in.
continued...
14
web page content
Teacher’s Guide
6. After 72 hours, empty the traps into resealable plastic bags. Use a different bag for each trap (all arthropods collected in one trap is called a “sample”) and include a label indicating the collected sample's corresponding trap site number.
To empty the pit trap, take the inside cup out of the second cup, leaving the second cup in the ground (to preserve the hole you dug). Empty the contents of this cup into the Ziplock© bag then replace it in the ground cup. Cover it with a plastic lid or fill it with rocks until you start the next collection cycle.
Once the sample is bagged and sealed, place it in the freezer or ice chest. This will kill any organisms that may have survived the fall into the cup. Leave the samples in the freezer to preserve the arthropods until you have finished identifying them. (As you’re identifying the samples, you may decide to pin and display a collection of some of the larger arthropods.)
7. Take the collected arthropods to your indoor workspace for identification.
8. Download the data sheet and identification key and use them to record your observations.

15
Teacher’s Guide
Describing Habitat Structure: Estimating Land Cover Along Your Trap Line The following technique can be used to estimate the habitat structure around your trap line: 1. Take a piece of 50 m-long string and mark every 2.5 meters. Lay the string across the trap line. * 2. Starting at 0m, at each point place a meter stick. In the first column of the data table, record the type of cover beneath your feet and less than 0.15m. Also, in the appropriate column, record the vegetation that is between 0.15m to 1.5m tall and/or is taller than 1.5m. Only write down the type of land cover that is at that point and touching your meter stick. The land cover type can be “building” or “cement” as well as plants. 3. For each type of ground cover, add the number of times it was recorded, divide by the total number of points and multiply by 100. For example if you recorded “shrubs” at 5 of the points and there were 20 points, then shrubs would be 25% of the land cover (5/20 times 100). *Your trap line is actually 45m, so you will have 5 m of string left a the end of the line. Measuring from the first cup every 2.5 meteres to the last cup will give you 19 points, you can take one more measurement 2.5 m after the last cup to give you a total of 20 points.

16
Teacher’s Guide
Data Table for Describing Land cover Along Your Trap Line
Point 0 - 0.15 m
0.15m – 1.5m
Shrubs
>1.5m
Tree Canopy
1
2
3
4
5
6
7
8
9
10
11
12
13
14
15
16
17
18
19
20
Lawn Gravel Pavement or
Building Other
Vegetation
TOTALS: Lawn _______ x 100 = ________% Other Vegetation _______ x 100 = ________% 20 20 Gravel/Soil _______ x 100 = ________% Pavement/Building ______ x 100 = ________% 20 20 Shrubs ______ x 100 = ________% Tree Canopy _______ x 100 = ________% 20 20

17
Teacher’s Guide
Site and Habitat Description
Protocol: Ground Arthropods
Provide a site and habitat description of your pitfall trap line. For example, if you are collecting data at seven pitfall trap lines on your campus, you will enter seven different sites. The description includes the amount and type of vegetation (or non-vegetation) at different heights in your trap line area.
SITE DESCRIPTION
Teacher: ________________________________ Class:________________________
School: _____________________________
Street Address: ____________________________________________________
City: _______________________ Zip code: _______________
Site Name: _______________________________
Create a name to identify the trap line for which you are collecting data. (e.g. Playground South Corner)
Site ID: _____________________________
Create a 3 – 5 letter and/or number code to identify this site. (e.g. Playground South Corner – PGSC)
Site Location Write a brief description of where your site is located. (i.e. SW Corner of playground):___________________________________________________________________________________
________________________________________________________________________________________________
Description Write a description of your site so that a visitor to your school would be able to find your trap
line:__________________________________________________________________________________
______________________________________________________________________________________________________
__________________________________________________________________________________________
HABITAT DESCRIPTION Recording Date: ______________ Area surveyed (m2): _________________________
Number of traps: ________ Trap arrangement: ___________________________________
Vegetation >1.5 m _________% Tree Canopy
Vegetation 0.15m—1.5 m _________%Shrub
Vegetation and non-Vegetation <1.5m
(should be equal to 100%)
_________% Gravel or soil
_________% Lawn
_________% Paved or Building
_________% Other Vegetation

18
Teacher’s Guide
Arthropod Data Sheet
Teacher: ________________________________ Class:________________________
Site ID: __________________
Collection Date: ________________________
Observer’s Name: ____________________________________
Comments/Observations: ______________________________________________
________________________________________________________________________________________________________________________________________________
Survey Data
Trap ID Order Tally Number
19
Teacher’s Guide
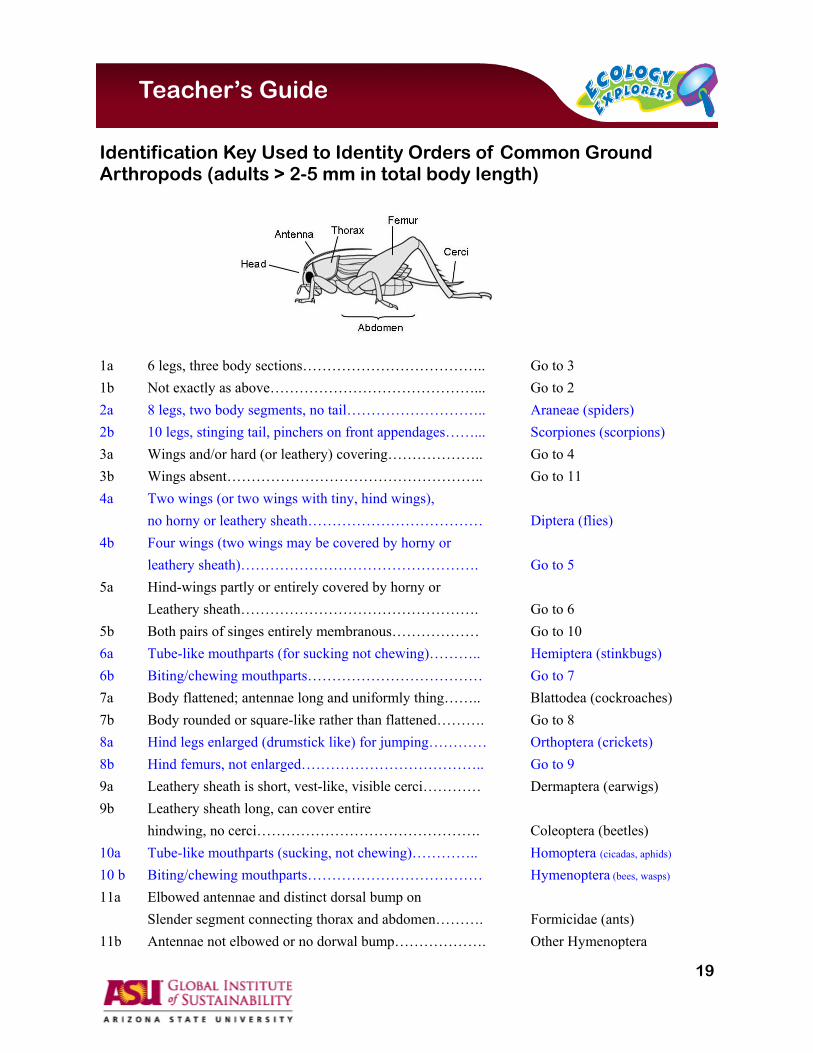
Identification Key Used to Identity Orders of Common Ground Arthropods (adults > 2-5 mm in total body length)
1a 6 legs, three body sections……………………………….. Go to 3
1b Not exactly as above……………………………………... Go to 2
2a 8 legs, two body segments, no tail……………………….. Araneae (spiders)
2b 10 legs, stinging tail, pinchers on front appendages……... Scorpiones (scorpions)
3a Wings and/or hard (or leathery) covering……………….. Go to 4
3b Wings absent…………………………………………….. Go to 11
4a Two wings (or two wings with tiny, hind wings),
no horny or leathery sheath……………………………… Diptera (flies)
4b Four wings (two wings may be covered by horny or
leathery sheath)…………………………………………. Go to 5
5a Hind-wings partly or entirely covered by horny or
Leathery sheath…………………………………………. Go to 6
5b Both pairs of singes entirely membranous……………… Go to 10
6a Tube-like mouthparts (for sucking not chewing)……….. Hemiptera (stinkbugs)
6b Biting/chewing mouthparts……………………………… Go to 7
7a Body flattened; antennae long and uniformly thing…….. Blattodea (cockroaches)
7b Body rounded or square-like rather than flattened………. Go to 8
8a Hind legs enlarged (drumstick like) for jumping………… Orthoptera (crickets)
8b Hind femurs, not enlarged……………………………….. Go to 9
9a Leathery sheath is short, vest-like, visible cerci………… Dermaptera (earwigs)
9b Leathery sheath long, can cover entire
hindwing, no cerci………………………………………. Coleoptera (beetles)
10a Tube-like mouthparts (sucking, not chewing)………….. Homoptera (cicadas, aphids)
10 b Biting/chewing mouthparts……………………………… Hymenoptera (bees, wasps)
11a Elbowed antennae and distinct dorsal bump on
Slender segment connecting thorax and abdomen………. Formicidae (ants)
11b Antennae not elbowed or no dorwal bump………………. Other Hymenoptera
20
Teacher’s Guide
Bird Protocol & CAP LTER:
The goals of the CAP LTER bird project are (1) to document the changes in avian richness and abundance over time and space, and (2) to determine the biotic/abiotic and socio-economic/political factors that cause these changes to occur. To accomplish these goals, the CAP LTER scientists are conducting bird censuses in four key habitats in the CAP LTER study area. The scientists are sampling bird diversity using the point count method. This is the same method Ecology Explorers recommends for schoolyards and backyards. Locations for 40 of the CAP LTER point count sites were randomly selected from 200 sties that CAP LTER had previously studies. An additional 10 riparian habitat sites were chosen for their ecological importance and accessibility. Counting birds allows CAP LTER scientists to directly relate bird densities to other environmental variables being monitored. The point count surveys are conducted 4 times a year (January, April, July and October) to document the abundance and distribution of birds in 4 habitats in 51 sites: urban (18), desert (15), riparian (11), and agricultural (7). During each session each point is visited by 3 birders who count all birds seen or heard for 15 minutes. Our goal is to study how different land-use forms affect bird abundance, distribution and diversity in the greater Phoenix area. From this information we may be able to predict and preserve high bird species diversity as urban development is proceeding. Satellite images, high aerial photography, and vegetative ground surveys will also be used to study the effects of landscape structure on avian populations. In addition, research will be coordinated with that of the land-use change team to analyze how zoning ordinances and city regulations in and around the point counts influence bird abundance and richness.
The CAP LTER scientists are particularly interested in learning the abundance of the seven common birds: House Finches, Starlings, House Sparrows, Mourning Doves, Inca Doves, Rock Doves (pigeons) and Great-tailed Grackles. One hypothesis that they are investigating is whether the number of these birds in an area is a useful indicator of species diversity. For example they might find that an area with large numbers of these 7 bird species will have fewer native bird species. Of these seven common species, House Sparrows, Starlings and Rock Doves (pigeons) were brought to this country from Europe, the other species are native to America.

21
Teacher’s Guide
Comments on the Protocol:
The Ecology Explorers Bird Survey protocol uses the point count method because it is more appropriate for smaller areas such as schoolyards and backyards. Bird surveys done in schoolyards reflects the desire of the LTER Project to sample many urban habitats. Schools are located throughout differently landscaped neighborhoods in the Phoenix metropolitan area and consequently each school may find different bird communities in their location.
If one of the areas you select to do a point count is a large grassy area, then you should randomly select the point count site within that area. The easiest way to do this is to face away from the grassy area and then toss a coin/rock over your back. The center of the point count will be where the coin/rock landed in the grassy area.
Grade Level:
Identifying birds may be most appropriate for grades 4 and up. Younger children might find it too difficult to count and identify small moving objects. All students should practice identifying birds before doing bird counts. Learning to identify silhouettes, size, beak shape and habits are key characteristics for identifying birds.
22
web page content
Teacher’s Guide
Birds
What birds are flying around your neighborhood?
The Sonoran Desert has one of the most diverse native plant and animal species of any desert in the world. Many birds are uniquely adapted to living here and they are part of food webs that include animals and plants that also are adapted to desert living.
Phoenix is an ever-expanding urban area located in the Sonoran Desert. CAP LTER scientists are studying the impact of this urbanization on bird communities.
Questions CAP LTER scientists are asking about our urban birds:
• Which birds are living in the Phoenix metropolitan area?
• Which landscape designs attract which types of birds?
• Are there different kinds of birds in different urban landscapes (residential,
commercial, parks)?
To answer these questions ecologists are conducting surveys of bird populations throughout the Phoenix metropolitan area. Your school can be part of this process by conducting your own bird surveys within your schoolyard and sending that information to CAP LTER scientists at ASU.

23
web page content
Teacher’s Guide
Bird Study
What birds are flying around your school yard?
Why study birds?
• Birds play important roles in many ecosystems.
• Birds are relatively easy to identify.
• The disappearance and/or appearance of certain species may reflect major habitat changes.
• Some birds are considered pests, others beneficial and each may be attracted to different habitats.
Which birds should we study?
Bird researchers have found over 50 bird species in the Phoenix metropolitan area. The most numerous of these bird species are the: House Finch, Starling, House Sparrow, Mourning Dove, Inca Dove, Pigeon (Rock Dove) and Great-tailed Grackle. (see identification key)
After you become familiar with these 7 bird species and any other birds that are common in your area, you can begin making scientific observations.
What do they tell us about our urban ecosystem?
Data from the bird surveys, as well as experiments you design, will help CAP LTER scientists identify which urban areas attracts what types of birds. This information may help people living in Phoenix design landscapes that attract a wider variety of bird species. CAP LTER scientists will be able to analyze how city zoning ordinances and regulations might influence bird abundance and diversity.
CAP LTER scientists will also be able to create a data base of the number and kinds birds in the Phoenix area. They can use this data to document changes over time and space and to investigate why these changes occur.
What Materials Will You Need?
- Meter Sticks
- String
- Location Markers
- Timer
- Binoculars (useful, but not necessary)
- Data Sheets
- Pencil
24
web page content
Teacher’s Guide
Bird Survey Protocol
Ecologists use Point Counts as one method for surveying birds. In a Point Count, one person counts all the birds located within a circle with the radius of 20 meters for 10 minutes. Follow these steps before can actually do a Point Count survey:
1. Decide on a location or several locations in your schoolyard to conduct the survey. Assign a number to each location. Position the sampling points in different areas, such as in the middle of a lawn, near trees and bushes, near asphalt, near the edge of the property, etc.
2. Mark out a circle with a 20-meter radius at each of the points you intend to survey. Make sure there are no large obstructions within the circle. For example, if a block wall were near the center of the circle you might not be able to see over it to count birds on the other side. You could position the circle so the block wall was near the perimeter of the circle. If you just don’t have enough space for a 20-meter radius cir-cle, then you need to note the size of the study area on the data sheet.
3. Complete a habitat description for each of your point count locations. Record your findings on the habitat description datasheet. You will need to do this before entering data into the CAP LTER database. YOU ONLY NEED TO DO THIS ONCE PER POINT COUNT SITE.
4. Become familiar with the most common bird species (see the identification key).
5. Decide on a time of day to do the survey and always do it at the same time of day. The best time of day is in the early morning (before 9:30 am), but if several classes are doing it throughout the day they can see how time of day affects the census.
6. Census the point twice per week for at least 4 consecutive weeks.
7. Have only 1 person count the birds in a point count (nobody else should help locate birds). This person will count all the birds within the survey area for 10 minutes.
Other students can help by keeping time and recording the counts on the data sheet.
8. Use the data sheet to record the number of individuals from each species that you have seen. Count each bird only once.

25
Teacher’s Guide
Describing Habitat Structure: Estimating Land Cover in Your Point Count Circle The following technique can be used to estimate the coverage in your 20m radius circular study area: 1. Take two pieces of string and divide the plot into 4 equal sections, so the strings cross in the middle. 2. Mark the string every four meters. Start marking the first string at meter zero, and the second string at meter 1. 3. At each point place a meter stick. In the first column of the data table, record the type of cover beneath your feet and less than 0.15m. Also, in the appropriate column, record the vegetation that is between 0.15m to 1.5m tall and/or that which is taller than 1.5m. Only write down the type of land cover that is at that point and touching your meter stick. The land cover type can be “building” or “cement” as well as plants. 4. For each type of ground cover, add the number of times it was recorded, divide by the total number of points and multiply by 100. For example if you recorded “shrubs” at 5 of the points and there were 20 points, then shrubs would be 25% of the land cover (5/20 times 100).

26
Teacher’s Guide
Data Table for Describing Land Cover in your Point Count Circle
Point 0 - 0.15 m
0.15m – 1.5m
Shrubs
>1.5m
Tree Canopy
1
2
3
4
5
6
7
8
9
10
11
12
13
14
15
16
17
18
19
20
Lawn Gravel Pavement or
Building Other
Vegetation
TOTALS: Lawn _______ x 100 = ________% Other Vegetation _______ x 100 = ________% 20 20 Gravel/Soil _______ x 100 = ________% Pavement/Building ______ x 100 = ________% 20 20 Shrubs ______ x 100 = ________% Tree Canopy _______ x 100 = ________% 20 20

27
Teacher’s Guide
Site and Habitat Description
Protocol: Birds
Provide a site and habitat description of your point count location. For example, if you are collecting data at seven locations on your campus, you will enter seven different sites. The description includes the amount and type of vegetation (or non-vegetation) at different heights in your point count circle.
SITE DESCRIPTION
Teacher: ________________________________ Class:________________________
School: _____________________________
Street Address: ____________________________________________________
City: _______________________ Zip code: _______________
Site Name: _______________________________
Create a name to identify the point count for which you are collecting data. (e.g. Playground South Corner)
Site ID: _____________________________
Create a 3 – 5 letter and/or number code to identify this site. (e.g. Playground South Corner – PGSC)
Site Location Write a brief description of where your site is located. (i.e. SW Corner of playground):___________________________________________________________________________________
_______________________________________________________________________________________________
Description Write a description of your site so that a visitor to your school would be able to find your point count
location:__________________________________________________________________________________
_______________________________________________________________________________________________
_______________________________________________________________________________________________
HABITAT DESCRIPTION Recording Date: ______________ Percent Observed: _________________________
Radius (m):_______________
Vegetation >1.5 m _________% Tree Canopy
Vegetation 0.15m—1.5 m _________%Shrub
Vegetation and non-Vegetation <1.5m
(should be equal to 100%)
_________% Gravel or soil
_________% Lawn
_________% Paved or Building
_________% Other Vegetation

28
Teacher’s Guide
Bird Data Sheet
Teacher: ________________________________ Class:________________________
Site ID: __________________
Observer’s Name: ____________________________________ Date of Survey: _________________________ Comments/Observations: ______________________________________________ ________________________________________________________________________________________________________________________________________________ Cloud Cover: none scattered overcast Temperature: _______ºC Start Time: ____:_______ AM PM End Time: ____:_______ AM PM Survey Data
Species Name Number of Birds
29
web page content
Teacher’s Guide
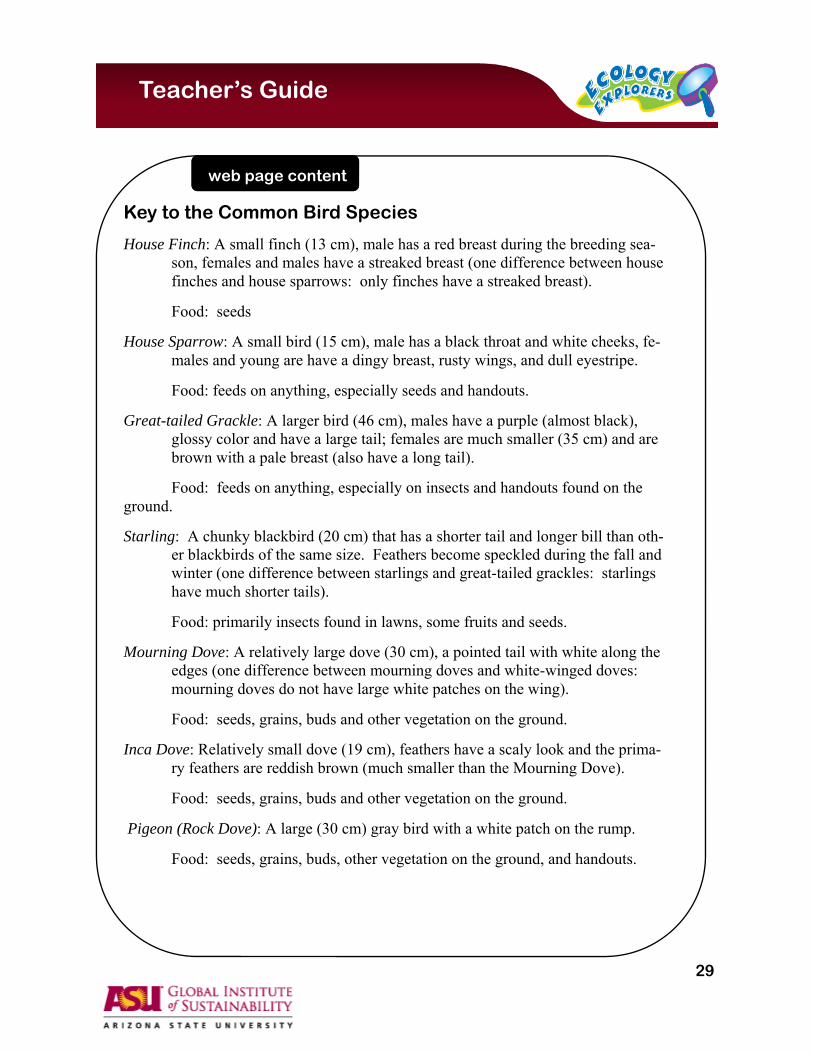
Key to the Common Bird Species
House Finch: A small finch (13 cm), male has a red breast during the breeding sea-son, females and males have a streaked breast (one difference between house finches and house sparrows: only finches have a streaked breast).
Food: seeds
House Sparrow: A small bird (15 cm), male has a black throat and white cheeks, fe-males and young are have a dingy breast, rusty wings, and dull eyestripe.
Food: feeds on anything, especially seeds and handouts.
Great-tailed Grackle: A larger bird (46 cm), males have a purple (almost black), glossy color and have a large tail; females are much smaller (35 cm) and are brown with a pale breast (also have a long tail).
Food: feeds on anything, especially on insects and handouts found on the ground.
Starling: A chunky blackbird (20 cm) that has a shorter tail and longer bill than oth-er blackbirds of the same size. Feathers become speckled during the fall and winter (one difference between starlings and great-tailed grackles: starlings have much shorter tails).
Food: primarily insects found in lawns, some fruits and seeds.
Mourning Dove: A relatively large dove (30 cm), a pointed tail with white along the edges (one difference between mourning doves and white-winged doves: mourning doves do not have large white patches on the wing).
Food: seeds, grains, buds and other vegetation on the ground.
Inca Dove: Relatively small dove (19 cm), feathers have a scaly look and the prima-ry feathers are reddish brown (much smaller than the Mourning Dove).
Food: seeds, grains, buds and other vegetation on the ground.
Pigeon (Rock Dove): A large (30 cm) gray bird with a white patch on the rump.
Food: seeds, grains, buds, other vegetation on the ground, and handouts.
30
web page content
Teacher’s Guide
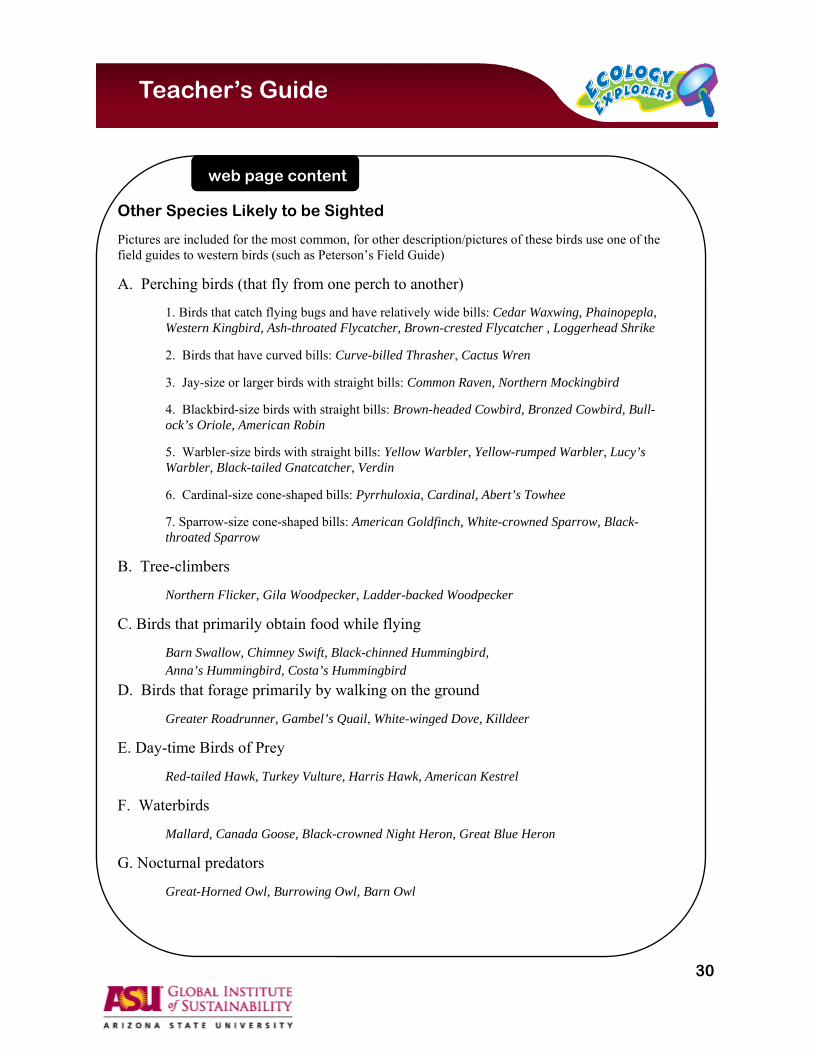
Other Species Likely to be Sighted
Pictures are included for the most common, for other description/pictures of these birds use one of the field guides to western birds (such as Peterson’s Field Guide)
A. Perching birds (that fly from one perch to another)
1. Birds that catch flying bugs and have relatively wide bills: Cedar Waxwing, Phainopepla, Western Kingbird, Ash-throated Flycatcher, Brown-crested Flycatcher , Loggerhead Shrike
2. Birds that have curved bills: Curve-billed Thrasher, Cactus Wren
3. Jay-size or larger birds with straight bills: Common Raven, Northern Mockingbird
4. Blackbird-size birds with straight bills: Brown-headed Cowbird, Bronzed Cowbird, Bull-ock’s Oriole, American Robin
5. Warbler-size birds with straight bills: Yellow Warbler, Yellow-rumped Warbler, Lucy’s Warbler, Black-tailed Gnatcatcher, Verdin
6. Cardinal-size cone-shaped bills: Pyrrhuloxia, Cardinal, Abert’s Towhee
7. Sparrow-size cone-shaped bills: American Goldfinch, White-crowned Sparrow, Black-throated Sparrow
B. Tree-climbers
Northern Flicker, Gila Woodpecker, Ladder-backed Woodpecker
C. Birds that primarily obtain food while flying
Barn Swallow, Chimney Swift, Black-chinned Hummingbird, Anna’s Hummingbird, Costa’s Hummingbird
D. Birds that forage primarily by walking on the ground
Greater Roadrunner, Gambel’s Quail, White-winged Dove, Killdeer
E. Day-time Birds of Prey
Red-tailed Hawk, Turkey Vulture, Harris Hawk, American Kestrel
F. Waterbirds
Mallard, Canada Goose, Black-crowned Night Heron, Great Blue Heron
G. Nocturnal predators
Great-Horned Owl, Burrowing Owl, Barn Owl
31
Teacher’s Guide
Plant/Insect Interaction and CAP LTER
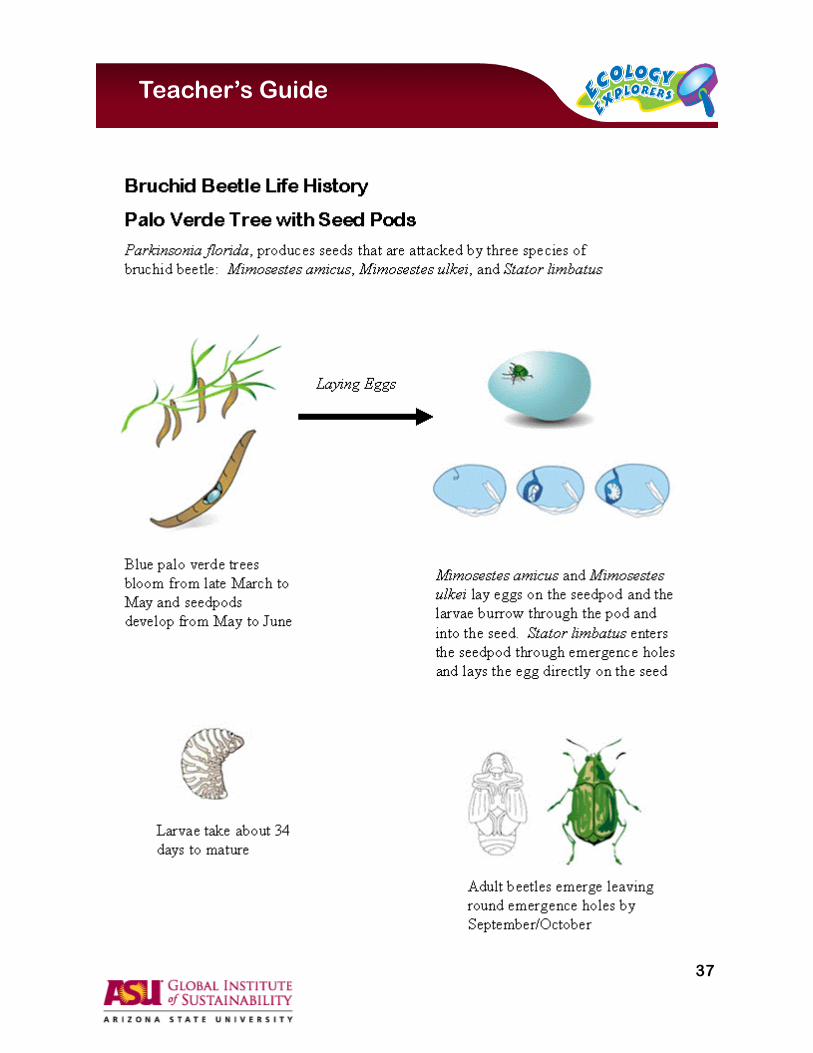
The Bruchid Beetle/Palo Verde tree insect interaction study was initially started by Dr. Tim Craig at ASU-West and John Wallace at Deer Valley Middle School. Palo Verde trees are native to the desert and are now common in urban desert landscaping. Bruchid beetles lay eggs on the pods, and their larvae feed on the seeds. Urban Palo Verde trees are watered and fertilized, often isolated from other Palo Verde trees, and mixed together with other non-native tree species. All these variables can influence bruchid beetles populations. Through this study, students can compare how beetle populations in urban vs. desert settings respond to these variations.
Comments on the Protocol:
Why collect 30 pods?
This number should be large enough to give you a good random sample, anything smaller might skew the data
Ensuring random pod collection
It’s very important to sample the seedpods in an unbiased way. You want your students to collect seedpods that are typical of those at the site. If students pick pods that were particularly interesting to them, such as the largest seedpods, then they would have a biased sample and it would not be useful to compare to the samples from other sites. One way to ensure randomness is to have one student walk around the tree and have a second student who is not looking at the tree tell the first student to “collect a pod” (repeat 5 times per tree)
Why collect more than one pod from each tree?
If students collect only a single pod from each tree it might not be typical of the pods on that tree. For example, students might collect the only pod that does not have evidence of bruchid beetles even if there are lots of bruchid beetles feeding on the tree.
Grade Level:
Although originally designed for middle school children, this project can be used by both high school and elementary school children
32
web page content
Teacher’s Guide
Beetles/Seeds
Do you know who is feasting on the seedpods?
Phoenix is an expanding urban area located within the Sonoran Desert. Many trees are uniquely adapted to living here and they are part of food webs that include animals and insects also are adapted to desert living.
One Sonoran Desert plant that has found its way into urban landscapes is the palo verde tree. In the desert, this tree supports a community of animals including bruchid beetles. These insects lay their eggs on palo verde seedpods and the larvae feed on the seeds.
Palo verde seedpods and beetles are connected
The interactions between plants and animals can provide vital information on the health of an ecosystem. Ecologists are interested in determining whether the interactions between urban palo verde trees and bruchid beetles is similar or different than their interactions in undisturbed Sonoran Desert communities.
You can provide important data by investigating the palo verde trees and bruchid beetle populations in your schoolyard.
33
web page content
Teacher’s Guide
Beetles/Seeds Study
What is feasting on those seed pods?
What are they? Bruchid beetles eat the seeds produced by palo verde trees. Palo verde trees are native to Arizona’s Sonoran Desert. They also are common in landscaped areas including parks, schoolyards and backyards.
Female bruchid beetles lay their eggs on palo verde seedpods. After they hatch, beetle larvae eat the seeds, pupate and emerge as adult beetles through little holes they create in the seedpods.
Why study them? Plants are at the base of food webs and any change in a plant community can have
an impact on all organisms that feed higher up the food web.
We don’t really know whether palo verde trees growing in a city have different seedpod development as compared to those in the Sonoran Desert.
We also don’t know how (or even if!) urbanization of the trees has changed the interaction between bruchid beetles and palo verde trees.
There might be many reasons that urban trees will grow differently than desert trees. For example, trees in yards and parks may receive more water and fertilizer which could increase the number of seeds produced.
What do they tell us about our urban ecosystem? Whether or not a seed will be eaten by a beetle depends on many different things. If a female beetle finds a seed, it must lay an egg on it, and then the beetle larvae must be able to eat the seed and survive. All these factors could be different in the city versus the desert. For example, the city seeds might be more or less attractive to the beetle, just as food prepared in different ways might be more or less appealing to you. Even if the beetle likes the seed the larva may not be able to survive feeding on it. For example a particular seed might be too small or too tough to eat.
CAP LTER ecologists are interested in the impact humans have had on native plants growing in cities and the insects that feed upon them. Your investigations might contribute to this understanding.
What Materials Will You Need? Bags (paper, plastic) Data Sheet Pencil Magnifying Glass

34
web page content
Teacher’s Guide
Beetle/Seeds
What is feasting on those seedpods?
Bruchid Beetles and Seedpods Protocol
1. Choose a site with blue palo verde (Parkinsonia florida) trees. Make sure they are blue palo verde trees and not foothill palo verde (Parkinsonia microphylla.).
2. Identify your collecting site as either desert or urban. Complete a habitat description data sheet for each site where you are collecting pods. You will need to do this before entering data into the CAP LTER database. YOU ONLY NEED TO DO THIS ONCE PER COLLECTING SITE.
3. Collect 30 pods from each site. Pods should be collected directly from the trees.
4. Collect 5 pods from 6 different trees. (If you cannot find 6 trees then collect an equal number of pods from each tree for a total of 30.)
Be sure to collect the 5 pods from different locations and different heights on the tree.
5. Assign a number to each tree.
6. Put all the pods from one tree in one bag. If you collect 5 pods from 6 trees then you will need 6 bags (one for each tree) and each bag will have five pods. Put a label in the bag with the site and tree number on it.
7. Once inside your classroom, examine each pod, give it a number, and then
a) count the number of bruchid beetle emergence holes on the pod.
Bruchid beetle holes are round and 1-2 mm in diameter;
b) count the number of seeds each pod contains.
8. Enter all the information on the data sheet.

35
Teacher’s Guide
Site and Habitat Description
Protocol: Bruchid Beetle and Desert Legume
Provide a site description of where you collected Palo Verde Pods. For example, if you are collecting data at seven locations, you will enter seven different sites.
SITE DESCRIPTION
Teacher: ________________________________ Class:________________________
School: _____________________________
Street Address: ____________________________________________________
City: _______________________ Zip code: _______________
Site Name: _______________________________
Create a name to identify the site for which you are collecting data. (e.g. Playground South Corner)
Site ID: _____________________________
Create a 3 – 5 letter and/or number code to identify this site. (e.g. Playground South Cor-ner – PGSC)
Site Location Write a brief description of where your site is located. (i.e. SW Corner of playground:_____________________________________________________________
________________________________________________________________________
Description Write a description of your site so that a visitor to your study area would be
able to find your site:
________________________________________________________________________
________________________________________________________________________
________________________________________________________________________
_____________________________________________________________________

36
Teacher’s Guide
Bruchid Beetle and Desert Legume Data Sheet
Teacher: ________________________________ Class:________________________
School: _____________________________ Site ID:_________________
Street Address: ____________________________________________________
City: _______________________ Zip code: _______________
Type of tree: Blue Palo Verde Tree habitat/Site Type: Urban Desert Collection Date: _________________________ Observer’s name: ____________________________________ Comments/Observations: ______________________________________________ ________________________________________________________________________________________________________________________________________________ Survey Data
Tree # Pod # Number of Holes Number of Seeds
37
Teacher’s Guide
38
web page content
Teacher’s Guide
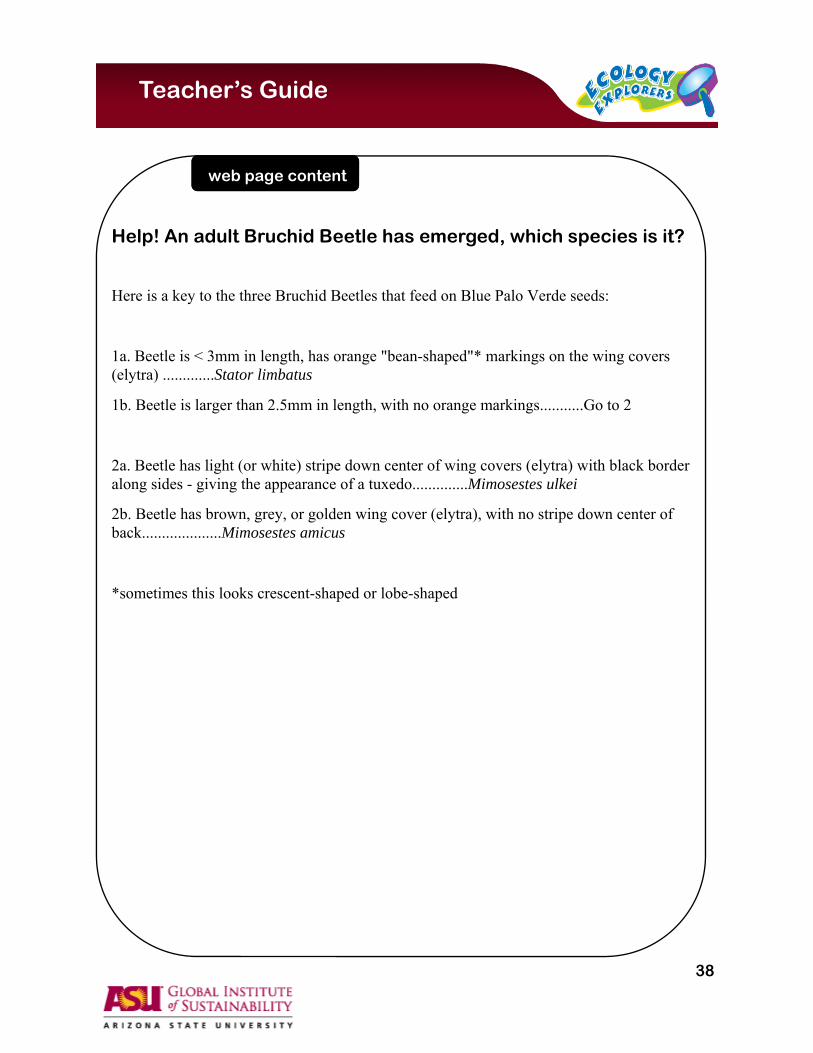
Help! An adult Bruchid Beetle has emerged, which species is it?
Here is a key to the three Bruchid Beetles that feed on Blue Palo Verde seeds:
1a. Beetle is < 3mm in length, has orange "bean-shaped"* markings on the wing covers (elytra) .............Stator limbatus
1b. Beetle is larger than 2.5mm in length, with no orange markings...........Go to 2
2a. Beetle has light (or white) stripe down center of wing covers (elytra) with black border along sides - giving the appearance of a tuxedo..............Mimosestes ulkei
2b. Beetle has brown, grey, or golden wing cover (elytra), with no stripe down center of back....................Mimosestes amicus
*sometimes this looks crescent-shaped or lobe-shaped

39
Teacher’s Guide
Vegetation Protocol & CAP LTER
Many of the questions CAP LTER vegetation researchers are interested in are centered around the human influence on plants. How do people choose the plants for their landscapes, how do they take care of them, and what effect does all this have on plant growth? In combination with other monitoring efforts questions are asked about how plant diversity and plant growth affect other populations in the city such as birds and bugs.
At CAP LTER we distinguish between long-term monitoring, one time observations and manipulative experiments. All of which are applied to vegetation research. We monitor changes in vegetation structure at 200 sites randomly located throughout the city and surrounding desert and agricultural lands every five years (2000, 2005, 2010, etc.). In this project, the Survey 200, size and exact location of every plant in a 900 square meter plot is recorded. At a subset of these sites a more intensive monitoring of plant growth takes place. One time observations have been used to re-survey plant communities in desert remnants that were described 20 year earlier. Concentrations of elements in leaves and lichens have been measured throughout the area to document distribution of air pollututants. In manipulative experiments the effect of different landscape practices on plant performance is being tested. Popular landscaping plants are treated with different amounts of irrigation, different ways of pruning and different mulching materials. All of which influences the growth and the water needs of these plants. Your schoolyards will another site that can be used for long-term monitoring or even manipulative experiments.
Information about your schoolyard vegetation can be used in conjunction with other Ecology Explorer protocols. For example the type of vegetation may influence the kinds of arthropods students find in the arthropod survey protocol. Schools which are installing a native habitat in their schoolyard should keep careful measurements of the vegetation. CAP LTER scientists also encourage you to do vegetation surveys in vacant lots, parks and golf courses.
Comments on the Protocol:
The method for surveying plants in a schoolyard is different than using a transect method to survey plants in a desert remnant. The methods described for measuring plant attributes are similar to those used by CAP LTER scientists conducting our Survey 200.
Grade Level:
Identifying plant types can be done with the early grades, identifying them to species requires reading and sorting skills. Measuring circumferences and areas can also be done by all grades, but calculations of tree height and areas need students with higher math skills (>4th).
40
web page content
Teacher’s Guide
Phoenix Vegetation
Adapted to desert living
Over the past 100 years, people have removed a lot of native vegetation and planted non-native plants, trees, and shrubs. However, some desert remnants remain within the Phoenix metropolitan areas, for example, Papago Park near the Phoenix Zoo and Desert Botanical Garden.
CAP LTER scientists are conducting plant surveys across the Phoenix metropolitan area. They will be comparing the survey results to studies done 20 years ago. They also are interested in comparing vegetation in desert remnants to that in residential areas, parks, golf courses and vacant lots.
You can help preserve our natural environment
You can participate in this study by comparing schoolyard and/or backyard data to desert remnant data and sharing this information with CAP LTER scientists. You may also decide to correlate your vegetation studies with the Ecology Explorers’ bird and insect studies.

41
web page content
Teacher’s Guide
Vegetation Study
Why study vegetation?
Plants form the basic foundation of food webs and support other life forms.
Native plants have unique adaptations for living in desert environments.
Non-native plants have different requirements (soil, water, nutrients) than native plants.
The vegetation can influence the kinds of animals that are attracted to the area.
Vegetation can be a sensitive indicator of change in local or regional environments.
What vegetation should we study?
The items most commonly found in a schoolyard include grass, trees, shrubs, cacti, and ground cover.
What does vegetation tell us about the urban environment?
Vegetation tells us about other environmental factors such as nutrient or water availability. Differences between residential areas and desert remnants tell us about human behavior and decisions to alter the landscape. Identifying non-native vegetation contributes to understanding similarities and differences between animal populations in desert remnants and residential areas. There may be many factors that help to explain why certain types of vegetation are planted in particular areas.Not all residential areas are alike, so it is also worthwhile to compare differences among schoolyards and/or backyards.
What materials will you need?
- Map of Your School
- Pencil
- Data Sheet
- Protractor
- Ruler
- Metric Tape Measure
- Metric Measuring Wheel (optional)

42
web page content
Teacher’s Guide
Vegetation Protocol
How to survey schoolyard vegetation
Measure (see methods below) and identify (see identification keys)
a). Size of yard: measure perimeter, use geometry to calculate area.
b). Estimate percentage of landcover in your study area. Record your findings in the habitat description data sheet. You will need to do this before entering data into the CAP LTER database. YOU ONLY NEED TO DO THIS ONCE PER AREA OF STUDY.
c). Record the number, identity and size of trees:
1. count trees, give ID numbers to the trees you will be measuring
2. identify species (mesquite) or category (palm)
3. measure circumference at breast height (CBH)
4. estimate height
5. estimate size of canopy
d). Record the number, identity and size of cacti
1. count cacti, give ID numbers to the cacti you will be measuring
2. identify species
3. measure CBH for tall cacti and area covered for smaller cacti
4. measure height: for small cactus use a tape measure, for large cactus esti-mate following procedure for trees
e). Record the number and size of shrubs:
1. count shrubs, give ID numbers to shrubs you will be measuring
2. identify species
3. use tape measure to measure height and canopy

43
web page content
Teacher’s Guide
Methods (website contains illustrations) a & b: To measure area:
use either a long tape measure or a measuring wheel to measure the length and width to get the area
c3 and d3: To measure the circumference of trees and tall cacti:
Use a tape measure and wrap around the trunk of the tree. Measure at the same height for each tree/cacti. Typically this height is about 1.35m from the ground (if your students are short, than use a lower height, but make sure it is the same for all measurements)
c4 and d4: To estimate the height of trees and tall cacti:
Method 1: Attach a plumbline at right angles to an isosceles right triangle made of cardboard.
Move until you can sight the top of the tree along the sloping edge of the triangle. Keep the upright edge vertical using plumbline. Measure the distance from the tree. Add your eye height to give you the tree’s height.
Method 2: Measure your shadow. Measure the tree’s shadow (make your shadow measurement during the same time of day). Calculate the tree’s height using the following:
Height of tree = Your height
Tree’s shadow Your shadow
Alternatively, you can place a meter stick upright and measure it’s shadow in place of measuring the student’s shadow.

44
web page content
Teacher’s Guide
c5: To estimate the size of the tree canopy:
Method 1: Measure the perimeter of the canopy and use geometry to cal-culate area.
Method 2: Measure the diameter of the canopy, assume it is a circle and calculate the area.
Formulas for Geometric Shapes:
Area of a square or rectangle = length x width
Area of a circle = π r2 (r = radius, π = 3.14)
Area of a triangle = 1/2 base x height
45
Teacher’s Guide
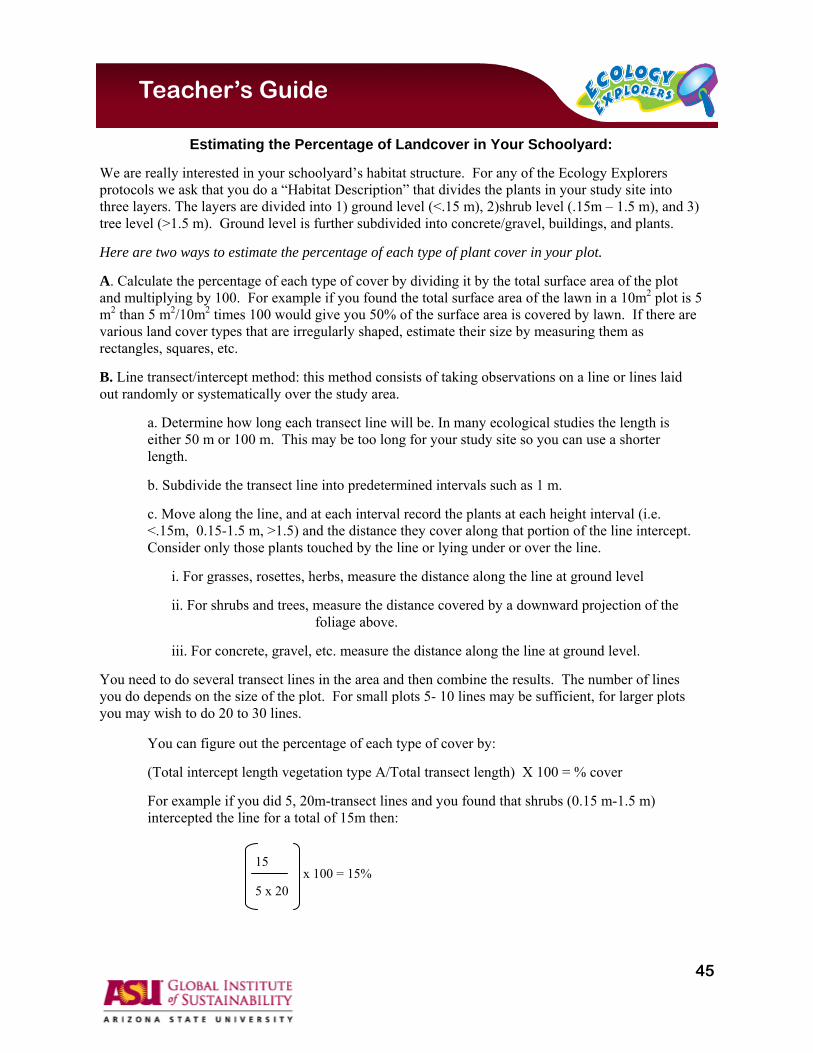
Estimating the Percentage of Landcover in Your Schoolyard:
We are really interested in your schoolyard’s habitat structure. For any of the Ecology Explorers protocols we ask that you do a “Habitat Description” that divides the plants in your study site into three layers. The layers are divided into 1) ground level (<.15 m), 2)shrub level (.15m – 1.5 m), and 3) tree level (>1.5 m). Ground level is further subdivided into concrete/gravel, buildings, and plants.
Here are two ways to estimate the percentage of each type of plant cover in your plot.
A. Calculate the percentage of each type of cover by dividing it by the total surface area of the plot and multiplying by 100. For example if you found the total surface area of the lawn in a 10m2 plot is 5 m2 than 5 m2/10m2 times 100 would give you 50% of the surface area is covered by lawn. If there are various land cover types that are irregularly shaped, estimate their size by measuring them as rectangles, squares, etc.
B. Line transect/intercept method: this method consists of taking observations on a line or lines laid out randomly or systematically over the study area.
a. Determine how long each transect line will be. In many ecological studies the length is either 50 m or 100 m. This may be too long for your study site so you can use a shorter length.
b. Subdivide the transect line into predetermined intervals such as 1 m.
c. Move along the line, and at each interval record the plants at each height interval (i.e. <.15m, 0.15-1.5 m, >1.5) and the distance they cover along that portion of the line intercept. Consider only those plants touched by the line or lying under or over the line.
i. For grasses, rosettes, herbs, measure the distance along the line at ground level
ii. For shrubs and trees, measure the distance covered by a downward projection of the foliage above.
iii. For concrete, gravel, etc. measure the distance along the line at ground level.
You need to do several transect lines in the area and then combine the results. The number of lines you do depends on the size of the plot. For small plots 5- 10 lines may be sufficient, for larger plots you may wish to do 20 to 30 lines.
You can figure out the percentage of each type of cover by:
(Total intercept length vegetation type A/Total transect length) X 100 = % cover
For example if you did 5, 20m-transect lines and you found that shrubs (0.15 m-1.5 m) intercepted the line for a total of 15m then:
15
5 x 20 x 100 = 15%

46
Teacher’s Guide
Area Covered(m2)
Area Covered
Total Area Surveyed
Percentage
<0.15 m
Lawn
Other Vegetation
Gravel/Soil
Pavement/Building
0.15-1.5 m
>1.5 m
Data Sheet for Estimating the Percentage of Landcover in Your Schoolyard
Total Surface Areas Surveyed________________(m2)
Method A

47
Teacher’s Guide
Data Table for Estimating the Percentages of Landcover in Your Schoolyard
Point 0 - 0.15 m
0.15m – 1.5m
Shrubs
>1.5m
Tree Canopy
1
2
3
4
5
6
7
8
9
10
11
12
13
14
15
16
17
18
19
20
Lawn Gravel Pavement or
Building Other
Vegetation
TOTALS:: Total length along transect line x 100 = % coverage Total length of transect line Lawn _______ x 100 = ________% Other Vegetation _______ x 100 = ________% Gravel/Soil _______ x 100 = ________% Pavement/Building ______ x 100 = ________% Shrubs ______ x 100 = ________% Tree Canopy _______ x 100 = ________%
Method B
48
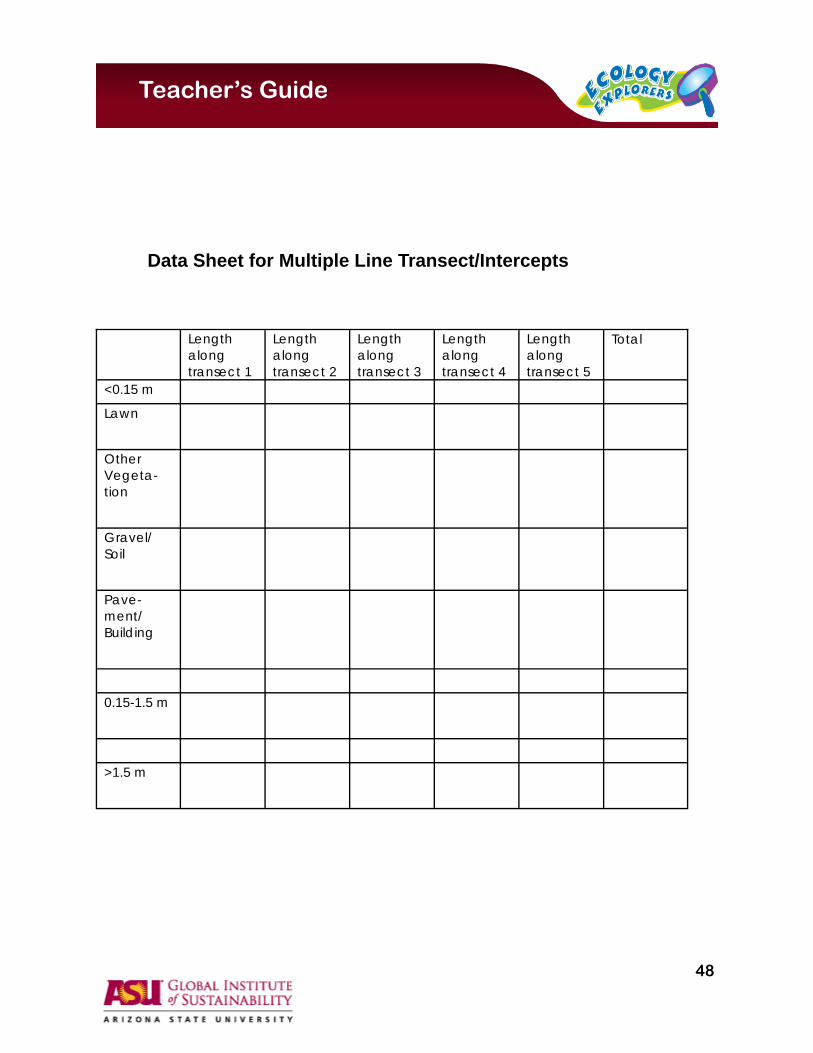
Teacher’s Guide
Length along transect 1
Length along transect 2
Length along transect 3
Length along transect 4
Length along transect 5
Total
<0.15 m
Lawn
Other Vegeta-tion
Gravel/Soil
Pave-ment/Building
0.15-1.5 m
>1.5 m
Data Sheet for Multiple Line Transect/Intercepts

49
Teacher’s Guide
Site and Habitat Description
Protocol: Vegetation
Provide a site and habitat description of your research site. For example, if you are collecting data at seven locations on your campus, you will enter seven different sites. The description includes the amount and type of vegetation (or non-vegetation) at different heights in your research.
SITE DESCRIPTION
Teacher: ________________________________ Class:________________________
School: _____________________________
Street Address: ____________________________________________________
City: _______________________ Zip code: _______________
Site Name: _______________________________
Create a name to identify the research site for which you are collecting data. (e.g. Playground South Corner)
Site ID: _____________________________
Create a 3 – 5 letter and/or number code to identify this site. (e.g. Playground South Corner – PGSC)
Site Location Write a brief description of where your site is located. (i.e. SW Corner of playground):___________________________________________________________________________________
_______________________________________________________________________________________________
Description Write a description of your site so that a visitor to your school would be able to find your research
site:__________________________________________________________________________________
_______________________________________________________________________________________________
_______________________________________________________________________________________________
HABITAT DESCRIPTION Recording Date: ______________
Radius (m):_______________
Vegetation >1.5 m _________% Tree Canopy
Vegetation 0.15m—1.5 m _________%Shrub
Vegetation and non-Vegetation <1.5m
(should be equal to 100%)
_________% Gravel or soil
_________% Lawn
_________% Paved or Building
_________% Other Vegetation

50
Teacher’s Guide
Typ
e of
Veg
e-ta
tion
(Tre
e, C
actu
s or
S
hrub
)
I.D
. No.
(Cre
ate
an I
D #
)
Sp
ecie
s N
ame
CB
H (
m)
Hei
ght
(m)
Can
opy
Siz
e or
ar
ea c
over
ed
(m2 )
Com
men
ts/
Loc
atio
n
Typ
e of
Veg
etat
ion
Cou
nt
Typ
e of
Veg
etat
ion
Cou
nt
Typ
e of
Veg
etat
ion
Cou
nt
Tre
es
S
hru
bs
C
actu
s
Veg
etat
ion
Dat
a S
heet
Tea
cher
: ___
____
____
____
____
____
_
Cla
ss:_
____
____
____
____
____
____
__
Site
ID
:___
____
____
____
___
C
olle
ctio
n D
ate:
____
____
_
Obs
erve
rs N
ame:
____
____
____
____
____
____
____
____
___
Veg
atat
ion
Cou
nt
Su
rvey
Dat
a
51
Teacher’s Guide
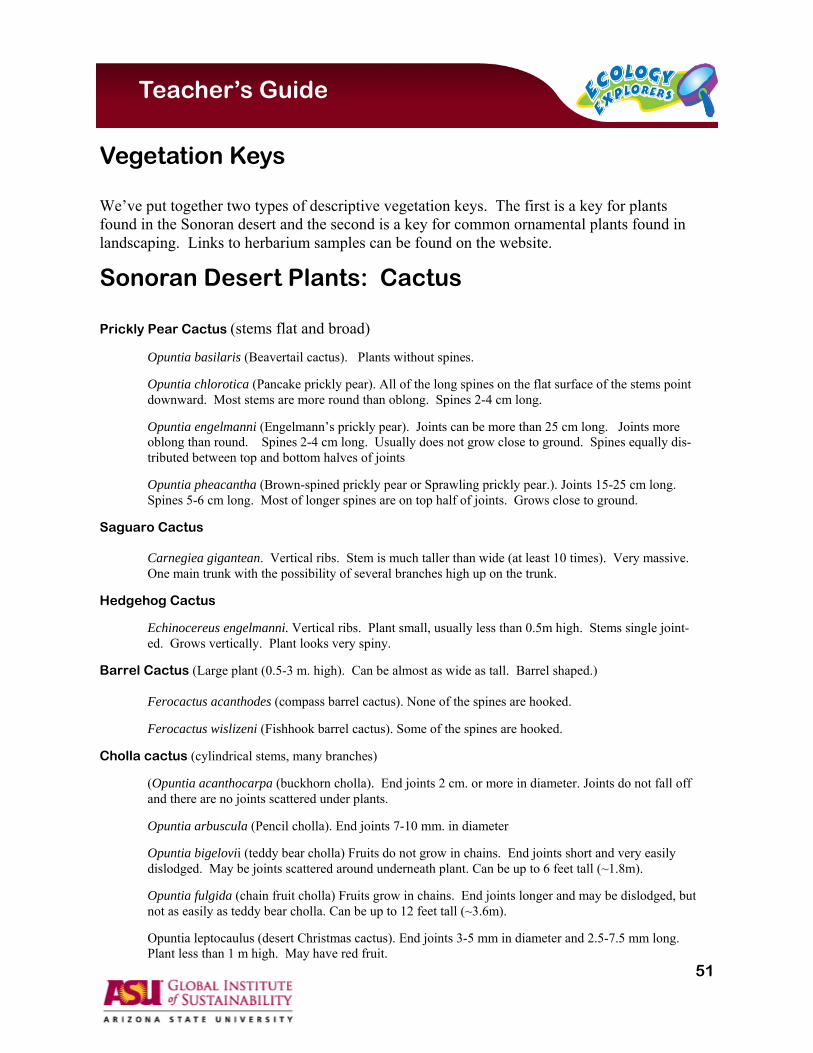
Vegetation Keys
We’ve put together two types of descriptive vegetation keys. The first is a key for plants found in the Sonoran desert and the second is a key for common ornamental plants found in landscaping. Links to herbarium samples can be found on the website.
Sonoran Desert Plants: Cactus Prickly Pear Cactus (stems flat and broad)
Opuntia basilaris (Beavertail cactus). Plants without spines.
Opuntia chlorotica (Pancake prickly pear). All of the long spines on the flat surface of the stems point downward. Most stems are more round than oblong. Spines 2-4 cm long.
Opuntia engelmanni (Engelmann’s prickly pear). Joints can be more than 25 cm long. Joints more oblong than round. Spines 2-4 cm long. Usually does not grow close to ground. Spines equally dis-tributed between top and bottom halves of joints
Opuntia pheacantha (Brown-spined prickly pear or Sprawling prickly pear.). Joints 15-25 cm long. Spines 5-6 cm long. Most of longer spines are on top half of joints. Grows close to ground.
Saguaro Cactus
Carnegiea gigantean. Vertical ribs. Stem is much taller than wide (at least 10 times). Very massive. One main trunk with the possibility of several branches high up on the trunk.
Hedgehog Cactus
Echinocereus engelmanni. Vertical ribs. Plant small, usually less than 0.5m high. Stems single joint-ed. Grows vertically. Plant looks very spiny.
Barrel Cactus (Large plant (0.5-3 m. high). Can be almost as wide as tall. Barrel shaped.)
Ferocactus acanthodes (compass barrel cactus). None of the spines are hooked.
Ferocactus wislizeni (Fishhook barrel cactus). Some of the spines are hooked.
Cholla cactus (cylindrical stems, many branches)
(Opuntia acanthocarpa (buckhorn cholla). End joints 2 cm. or more in diameter. Joints do not fall off and there are no joints scattered under plants.
Opuntia arbuscula (Pencil cholla). End joints 7-10 mm. in diameter
Opuntia bigelovii (teddy bear cholla) Fruits do not grow in chains. End joints short and very easily dislodged. May be joints scattered around underneath plant. Can be up to 6 feet tall (~1.8m).
Opuntia fulgida (chain fruit cholla) Fruits grow in chains. End joints longer and may be dislodged, but not as easily as teddy bear cholla. Can be up to 12 feet tall (~3.6m).
Opuntia leptocaulus (desert Christmas cactus). End joints 3-5 mm in diameter and 2.5-7.5 mm long. Plant less than 1 m high. May have red fruit.
52
Teacher’s Guide
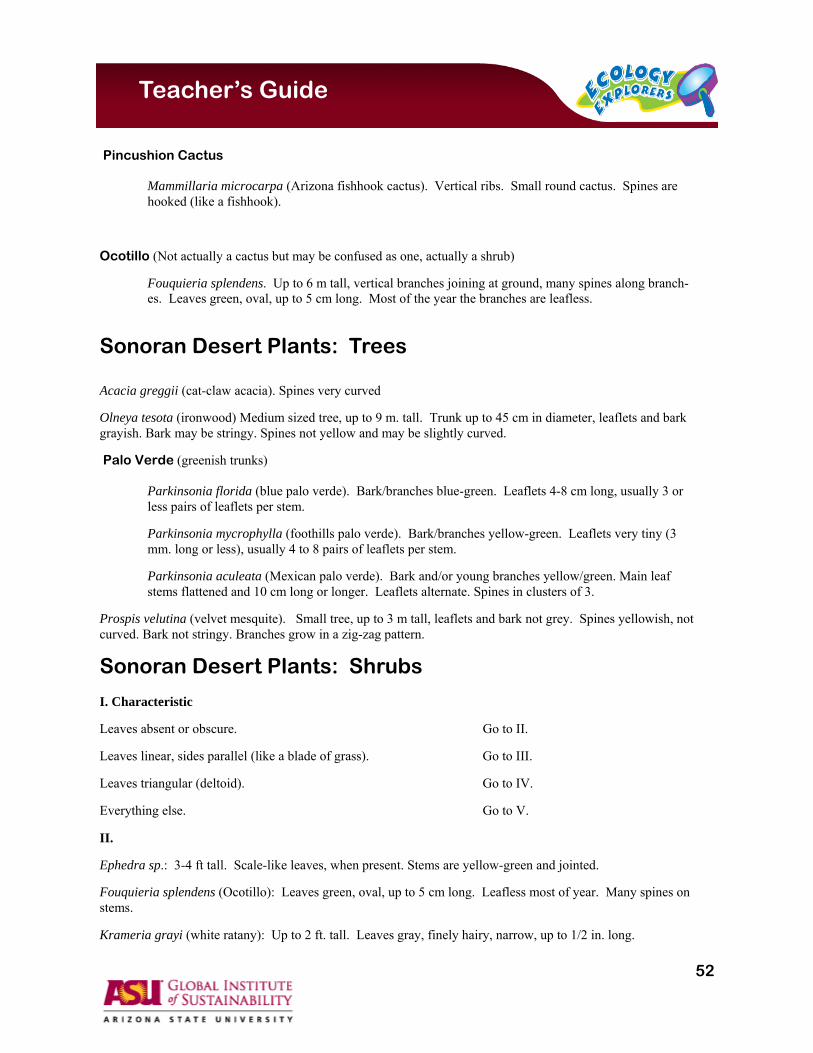
Pincushion Cactus
Mammillaria microcarpa (Arizona fishhook cactus). Vertical ribs. Small round cactus. Spines are hooked (like a fishhook).
Ocotillo (Not actually a cactus but may be confused as one, actually a shrub)
Fouquieria splendens. Up to 6 m tall, vertical branches joining at ground, many spines along branch-es. Leaves green, oval, up to 5 cm long. Most of the year the branches are leafless.
Sonoran Desert Plants: Trees Acacia greggii (cat-claw acacia). Spines very curved
Olneya tesota (ironwood) Medium sized tree, up to 9 m. tall. Trunk up to 45 cm in diameter, leaflets and bark grayish. Bark may be stringy. Spines not yellow and may be slightly curved.
Palo Verde (greenish trunks)
Parkinsonia florida (blue palo verde). Bark/branches blue-green. Leaflets 4-8 cm long, usually 3 or less pairs of leaflets per stem.
Parkinsonia mycrophylla (foothills palo verde). Bark/branches yellow-green. Leaflets very tiny (3 mm. long or less), usually 4 to 8 pairs of leaflets per stem.
Parkinsonia aculeata (Mexican palo verde). Bark and/or young branches yellow/green. Main leaf stems flattened and 10 cm long or longer. Leaflets alternate. Spines in clusters of 3.
Prospis velutina (velvet mesquite). Small tree, up to 3 m tall, leaflets and bark not grey. Spines yellowish, not curved. Bark not stringy. Branches grow in a zig-zag pattern.
Sonoran Desert Plants: Shrubs I. Characteristic
Leaves absent or obscure. Go to II.
Leaves linear, sides parallel (like a blade of grass). Go to III.
Leaves triangular (deltoid). Go to IV.
Everything else. Go to V.
II.
Ephedra sp.: 3-4 ft tall. Scale-like leaves, when present. Stems are yellow-green and jointed.
Fouquieria splendens (Ocotillo): Leaves green, oval, up to 5 cm long. Leafless most of year. Many spines on stems.
Krameria grayi (white ratany): Up to 2 ft. tall. Leaves gray, finely hairy, narrow, up to 1/2 in. long.

53
Teacher’s Guide
III.
Leaves hairy. Go to A
Leaves not hairy. Go to B
A
Hymenoclea salsoa (burro brush, cheeseweed): Leaves dark green, very slender, lower leaves have 3 or more threadlike divisions, up to 7.6 cm, long. Foliage has cheesy odor when crushed.
B
Atriplex canescens (four-wing saltbush): Up to 2.5m but mostly 1.2 m. Leaves gray-green, narrow, up to 5 cm long.
Baccharis salicifolia (seep willow): Up to 3.5 m high. Leaves dark green, shiny, waxy, sticky, lance-shaped, toothed, up to 15 cm long and 12 mm wide.
Baccharis sarothroides (desert broom): Up to 3 m tall. Leaves bright green, smooth, sticky, up to 4 cm long and 3 mm wide. Growth resembles a broom.
Bebbia juncea (chuckwalla's delight): Up to 1.2 m tall. Leaves (when present) dark green, sparse, line-ar to lance shaped, lobed, rough, hairy, up to 5 cm long.
Gutierrezia sarothrae (broom snakeweed): Up to 1.2 m tall. Leaves dark green, very narrow, up to 3 mm wide and 6.4 cm long.
IV.
Ambrosia deltoidea (triangle bursage): Up to 1.2 m tall. Leaves gray-green above, white and hairy underneath, finely toothed, up to 3 cm long.
Viguiera deltoidea (parish viguiera): Up to 1.2 m tall. Leaves dark green, hairy, toothed, crinkled, up to 4 cm long. Grayish bark.
V.
Leaves serrate (toothed) or divided/compound AND hairy. Go to A
Leaves serrate (toothed) or divided/compound and NOT hairy. Go to B
Leaves simple and entire (not toothed) AND hairy. Go to C
Leaves simple and entire (not toothed) and NOT hairy. Go to D
A
Ambrosia ambrosoides (canyon ragweed): Up to 1 m tall. Leaves green, hairy, elongated to lance shaped, toothed, up to 13 cm long and 2.5 cm wide.
Hibiscus denudatus (rock hibiscus): Up to 1 m long. Leaves yellow-green, densely hairy, oval to ellip-tical shaped, toothed, and up to 3 cm long.
Hyptis emori (desert lavender): Up to 4.5 m tall. Leaves gray-green, oval shaped, hairy, toothed, up to 6 cm long.
54
Teacher’s Guide
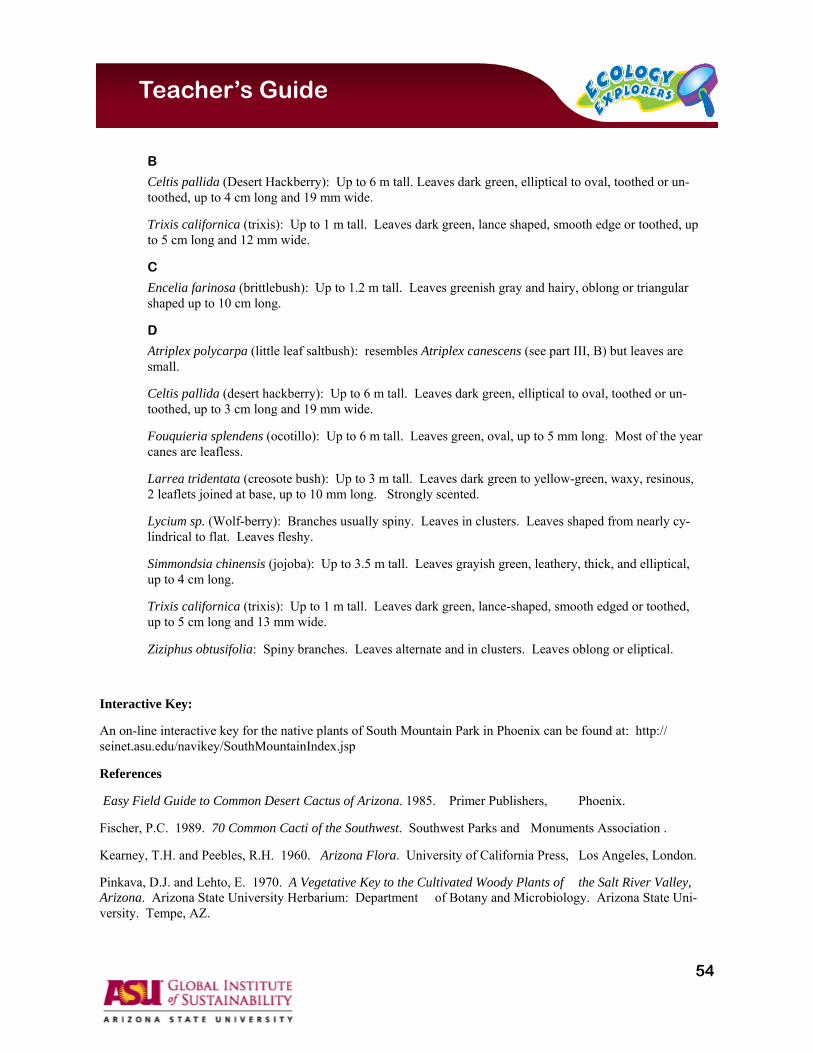
B
Celtis pallida (Desert Hackberry): Up to 6 m tall. Leaves dark green, elliptical to oval, toothed or un-toothed, up to 4 cm long and 19 mm wide.
Trixis californica (trixis): Up to 1 m tall. Leaves dark green, lance shaped, smooth edge or toothed, up to 5 cm long and 12 mm wide.
C
Encelia farinosa (brittlebush): Up to 1.2 m tall. Leaves greenish gray and hairy, oblong or triangular shaped up to 10 cm long.
D
Atriplex polycarpa (little leaf saltbush): resembles Atriplex canescens (see part III, B) but leaves are small.
Celtis pallida (desert hackberry): Up to 6 m tall. Leaves dark green, elliptical to oval, toothed or un-toothed, up to 3 cm long and 19 mm wide.
Fouquieria splendens (ocotillo): Up to 6 m tall. Leaves green, oval, up to 5 mm long. Most of the year canes are leafless.
Larrea tridentata (creosote bush): Up to 3 m tall. Leaves dark green to yellow-green, waxy, resinous, 2 leaflets joined at base, up to 10 mm long. Strongly scented.
Lycium sp. (Wolf-berry): Branches usually spiny. Leaves in clusters. Leaves shaped from nearly cy-lindrical to flat. Leaves fleshy.
Simmondsia chinensis (jojoba): Up to 3.5 m tall. Leaves grayish green, leathery, thick, and elliptical, up to 4 cm long.
Trixis californica (trixis): Up to 1 m tall. Leaves dark green, lance-shaped, smooth edged or toothed, up to 5 cm long and 13 mm wide.
Ziziphus obtusifolia: Spiny branches. Leaves alternate and in clusters. Leaves oblong or eliptical.
Interactive Key:
An on-line interactive key for the native plants of South Mountain Park in Phoenix can be found at: http://seinet.asu.edu/navikey/SouthMountainIndex.jsp
References
Easy Field Guide to Common Desert Cactus of Arizona. 1985. Primer Publishers, Phoenix.
Fischer, P.C. 1989. 70 Common Cacti of the Southwest. Southwest Parks and Monuments Association .
Kearney, T.H. and Peebles, R.H. 1960. Arizona Flora. University of California Press, Los Angeles, London.
Pinkava, D.J. and Lehto, E. 1970. A Vegetative Key to the Cultivated Woody Plants of the Salt River Valley, Arizona. Arizona State University Herbarium: Department of Botany and Microbiology. Arizona State Uni-versity. Tempe, AZ.
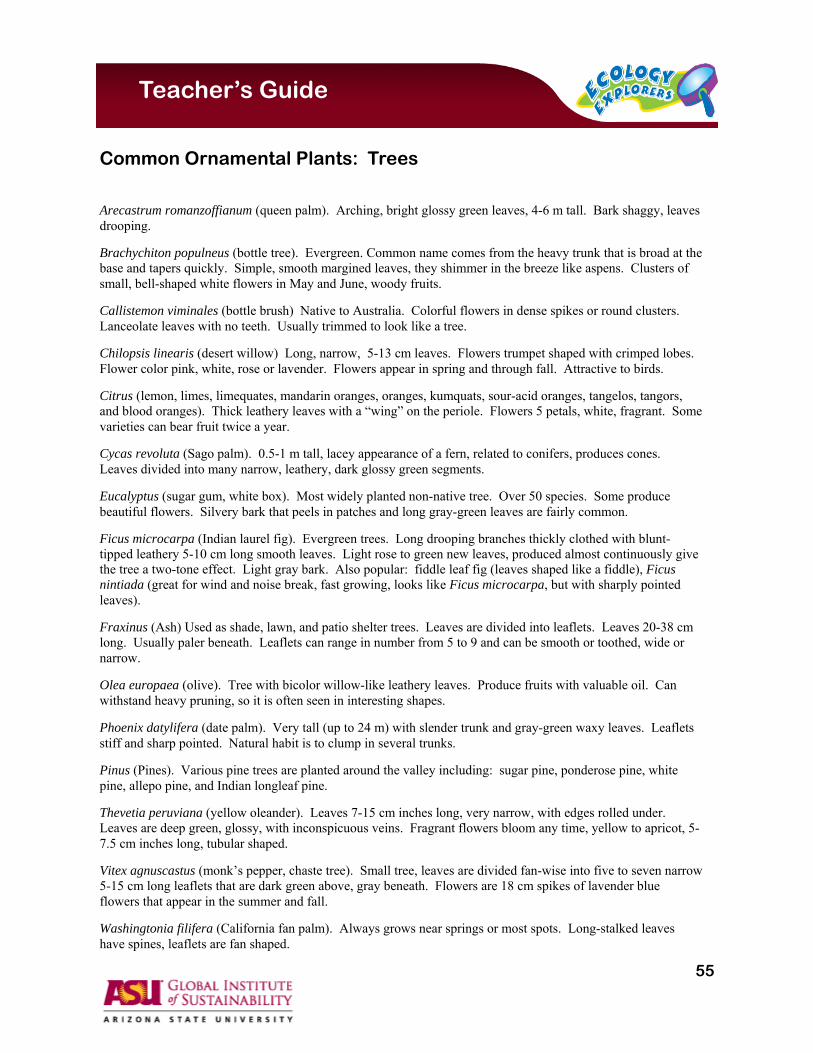
55
Teacher’s Guide
Common Ornamental Plants: Trees
Arecastrum romanzoffianum (queen palm). Arching, bright glossy green leaves, 4-6 m tall. Bark shaggy, leaves drooping.
Brachychiton populneus (bottle tree). Evergreen. Common name comes from the heavy trunk that is broad at the base and tapers quickly. Simple, smooth margined leaves, they shimmer in the breeze like aspens. Clusters of small, bell-shaped white flowers in May and June, woody fruits.
Callistemon viminales (bottle brush) Native to Australia. Colorful flowers in dense spikes or round clusters. Lanceolate leaves with no teeth. Usually trimmed to look like a tree.
Chilopsis linearis (desert willow) Long, narrow, 5-13 cm leaves. Flowers trumpet shaped with crimped lobes. Flower color pink, white, rose or lavender. Flowers appear in spring and through fall. Attractive to birds.
Citrus (lemon, limes, limequates, mandarin oranges, oranges, kumquats, sour-acid oranges, tangelos, tangors, and blood oranges). Thick leathery leaves with a “wing” on the periole. Flowers 5 petals, white, fragrant. Some varieties can bear fruit twice a year.
Cycas revoluta (Sago palm). 0.5-1 m tall, lacey appearance of a fern, related to conifers, produces cones. Leaves divided into many narrow, leathery, dark glossy green segments.
Eucalyptus (sugar gum, white box). Most widely planted non-native tree. Over 50 species. Some produce beautiful flowers. Silvery bark that peels in patches and long gray-green leaves are fairly common.
Ficus microcarpa (Indian laurel fig). Evergreen trees. Long drooping branches thickly clothed with blunt-tipped leathery 5-10 cm long smooth leaves. Light rose to green new leaves, produced almost continuously give the tree a two-tone effect. Light gray bark. Also popular: fiddle leaf fig (leaves shaped like a fiddle), Ficus nintiada (great for wind and noise break, fast growing, looks like Ficus microcarpa, but with sharply pointed leaves).
Fraxinus (Ash) Used as shade, lawn, and patio shelter trees. Leaves are divided into leaflets. Leaves 20-38 cm long. Usually paler beneath. Leaflets can range in number from 5 to 9 and can be smooth or toothed, wide or narrow.
Olea europaea (olive). Tree with bicolor willow-like leathery leaves. Produce fruits with valuable oil. Can withstand heavy pruning, so it is often seen in interesting shapes.
Phoenix datylifera (date palm). Very tall (up to 24 m) with slender trunk and gray-green waxy leaves. Leaflets stiff and sharp pointed. Natural habit is to clump in several trunks.
Pinus (Pines). Various pine trees are planted around the valley including: sugar pine, ponderose pine, white pine, allepo pine, and Indian longleaf pine.
Thevetia peruviana (yellow oleander). Leaves 7-15 cm inches long, very narrow, with edges rolled under. Leaves are deep green, glossy, with inconspicuous veins. Fragrant flowers bloom any time, yellow to apricot, 5-7.5 cm inches long, tubular shaped.
Vitex agnuscastus (monk’s pepper, chaste tree). Small tree, leaves are divided fan-wise into five to seven narrow 5-15 cm long leaflets that are dark green above, gray beneath. Flowers are 18 cm spikes of lavender blue flowers that appear in the summer and fall.
Washingtonia filifera (California fan palm). Always grows near springs or most spots. Long-stalked leaves have spines, leaflets are fan shaped.

56
Teacher’s Guide
Common Ornamental Plants: Shrubs Bougainvillea. Bougainvillea’s vibrant colors come not from its small flowers, but from the three large colored bracts that surround them. This plant can be found in shrub or wall cover/vine form. It has large triangular smooth leaves and spines.
Caesalpinia pulcherima (red bird of paradise). Dark green leaves with many long leaflets. Orange-red blooms throughout warm weather.
Calliandra eriophylla (fairy duster, false mesquite). Leaves finely cut into leaflets. Flower clusters show pink or red stamens in puffy balls about 2.5 cm across. Blooms in Feb. or March.
Carissa grandiflora (Natal Plum). Fast-growing, strong, rounding shrub with lustrous, leathery, green, 7.6 cm oval leaves. White fragrant flowers with five-petal star shape, appear throughout the year followed by fruit.
Cassia (senna). Flowers may be yellow, bright yellow, egg-yolk yellow, deep yellow, or gold. Leaves are usually divided into leaflets and different species range from dark green to gray leaves. Feathery Cassia is one of the most common landscape plants; leaves are gray, divided into six to eight needlelike 2.5 cm inch long leaflets.
Hibiscus rosa-sinensis (tropical hibiscus). Evergreen shrub. One of the showiest flowering shrubs. Glossy leaves varies somewhat in size and texture depending on variety. Summer flowers can be single or double ranging from 10-20 cm wide. Colors range from white/red/yellow/apricot/orange.
Leucophyllum frutescens (Texas ranger, Texas sage, White Cloud). Compact slow-growing, silvery soft leaves with bell-shaped flowers blooming various times of the year (depending on rainfall)
Nerium oleander (oleander) very common shrub, simple, dark green, leathery glossy, leaves. Flowers 5-7 cm across white/pink/salmon/red. Can be trimmed to look like a tree.
Pittosporum tobira (mock orange). Broad dense shrub or small tree. Leaves leathery, shiny, dark green, rounded at edges with a ridge down the middle vein. Clusters of creamy white flowers form at branch tips in early spring and smell like orange blossoms.
Ruellia (ruellia). Shrub with opposite, toothed, purplish leaves that drop if it becomes too dry. Flaring bell-shaped flowers, usually deep purple.
Tecoma capensis (cape honeysuckle). Leaves divided into many glistening, dark green leaflets. Brilliant orange-red tubular, 5 cm blossoms that grow in compact clusters from October through winter. Can have yellow flowers and lighter green foliage.

57
Teacher’s Guide
Ornamental Plants: Ground Cover
Dalea greggii (trailing indigo bush). Fast-growing evergreen shrub with pearl gray foliage. Clusters of tiny purple flowers in spring and early summer. Found as ground cover in many desert landscapes because it tolerates heat and lack of water once established.
Hesperaloe parviflora (hesperaloe). Makes a dense yucca-like clump of very narrow, sword shaped leaves, 1.22 m long to 2.54 cm wide. Pink to rose red, 3 cm nodding flowers in slim 1-1.2 m high clusters bloom in early summer. Leaves usually have slender thread peeling back at edges which looks like curled up dental floss.
Lantana. Fast growing, valued for profuse show of color over long season. Yellow, orange, red, pink, lilac flowers form 2.5-4 cm clusters. Dark green leaves 2.5 cm long with coarsely toothed edges. Grows in vining pattern usually seen as a ground cover.
Myoporum parvifolium (Myoporum). Bright green, 2.5 cm leaves completely cover plant. White summer flowers are followed by purple berries. Does not recover well from foot traffic.
Rosmarinus officinalis (rosemary). Narrow, aromatic leaves, glossy dark green above, grayish white beneath. Small clusters of light lavender blue flowers attract birds and bees. Used frequently for ground or bank covers.

58
Teacher’s Guide
Steps to Entering and Downloading Data
Before you start, have the following with you: Completed data forms for the protocol you conducted If you are entering a new site: Completed Habitat and Site Description Forms If you are updating your sites: Completed Habitat Description Forms General Recommendations and Tips for the Data Center: Teachers should enter classes and complete the site and habitat descriptions before students enter their data. Students will not have User Id’s. The teacher’s User ID and password should be used to log in.
Students can enter their names in the observer’s name field on the data entry pages. Microsoft Internet Explorer is the preferred browser for using this site. If you are having trouble viewing a page, click the “Refresh” button on your browser. Do not use the “back” button on your browser, it can lead to data being entered more than once. Students will need to know their class name and site ID for their data sheets and in order to enter data. Logging In: Registered Ecology Explorer Teachers
Enter your User ID, Password, and Log In! Students will not have User ID’s – Teacher’s should either log-in for their students or
share their User ID and Password with their students. Ecology Explorer Teachers who have not registered
Click "Register” (see below for directions) Just Browsing
Click "Guest" Registering (For teachers that do not have a User ID): USER ID
Choose something you will remember (e.g. jwsmith). People often choose their first initial combined with their last name. You will use this ID when logging into the Data Center.
E-MAIL ADDRESS Enter the e-mail address you check most often. The address will not be used for any other
purpose other than sending you your password or any other relevant information related to the Data Center.
SCHOOL Click on the down arrow on the right hand side of the box. Your school name should appear
in the drop down list. Highlight the name of your school. If your school is not on the drop down list, please contact [email protected].
TEACHER’S NAME Enter the name you would like your students to see (e.g. Mr. Smith or John Smith. This is
the name that will appear on the data pages your students will be using while entering data. Click “Submit” – the next page will be a confirmation of the information you entered. Check that
all the information is correct. If any information is incorrect, register again and send an e-mail to [email protected] referencing the changes.

59
Teacher’s Guide
Registration Confirmation You will receive an e-mail from Ecology Explorers within 48 hours containing your password. The
password will allow you to enter data. You do not need a password to view data, so you can enter the Data Center as a guest until you receive your password.
Submitting vs. Downloading Data Submitting Data - allows you to submit data from your Ecology Explorers research project. This is
only available to registered Ecology Explorers teachers. Downloading Data – allows you to search for and view data from other Ecology Explorers and some
of the CAP-LTER research projects. This is available to both guests and registered Ecology Explorers teachers.
Click on your choice of what you would like to do. If you are downloading data, skip the
following steps and go to the Downloading Data directions. SUBMITTING DATA Select your Protocol Click on the down arrow on the right hand side of the box. Highlight the protocol for which you will
be entering data. Click “Continue.” Site ID Select the site you are entering data for and the class you are in. If you need to create a new site, click on "Create a new site." If you need to enter new classes, click on "Create a new class." Creating a New Site
Click on "Create a new site.” The next window will contain the fields of data you need to enter in order to create a new site.
You will need your completed Site and Habitat Description Data Sheet for this step! We recommend that teachers complete the site and habitat descriptions before students enter
data about the sites. Enter all the fields with the data from your data sheet. Click “Submit My New Site.” You will then be sent to the page where you will select your site ID. The site you just
created should appear in the box under “Select your site ID.” If your site is not in that box, click on the down arrow on the right hand side of the box and your new site should be in the drop down list.
If your site is not in the drop down list, contact [email protected]. Each site you have will need to be entered separately! All sites should be entered before
students enter data. Choosing an Existing Site
Click on the down arrow on the right hand side of the box. Highlight the site from which you will be entering data.
Next, choose your class (see below for directions)

60
Teacher’s Guide
Class ID Creating a New Class
Click on "Create a new class.” The next window will contain the fields of data you need to enter in order to create a new class.
Enter the relevant information (grade level and name) of the classes that will be entering data.
Click “ Submit My New Class.” You will then be sent to the page where you will select your class. The class you just
created should appear in the box under “Select the class you are in.” If your class is not in the box, click on the down arrow on the right hand side of the box and your new class should be in the drop down list.
If your class is not in the drop down list, contact [email protected]. Each class you have will need to be entered separately! All classes should be entered
before students enter data. Teachers can choose to lump everyone by entering only one class – 8th Biology. You can
also create a class name for each of your classes – e.g. Biology 1, Biology 2, Biology 3, etc..
Choosing an Existing Class Click on the down arrow on the right hand side of the box. Highlight the name of the class
that collected the data. Click “Enter My Data” to continue.
Habitat Description (For all protocols, except Bruchid Beetles! If you are entering Bruchid Beetle Data you will be on the Data Submission Page - proceed to Data Submission directions) One of two windows will appear next….. 1. A page notifying you that a Habitat Description has not been entered about the site. You will need to
click on “Update Habitat Description” and enter the habitat description for the site (This should be recorded on your Habitat and Site Description Data Sheet).
2. A page that will display a habitat description of the site.
If all the information is correct, click “Habitat Description OK – Continue Entering Data.”
If the information is incorrect or needs updating – click “Update Habitat Description.”
Data Submission You will need your completed protocol data sheets for this section. Please read information relevant to the protocol you are entering data for:
Ground Arthropods One form needs to be completed for each trap line. This is very important for
the accurate entering and retrieval of data. The date is the date the sample was collected. Students can enter their own names for the observer field. Include any relevant information in the comments section (Did it rain? Were
any of the cups stolen? Etc..) Enter data from your completed Arthropod Data Sheet. Check your work before submitting your data.

61
Teacher’s Guide
If you want a print out of what you entered, print the page before you click to submit your data. Never go back after you have clicked “Submit My Arthropod Data” – your data will be entered twice!
Birds
One form needs to be completed for each point count circle. This is very important for the accurate entering and retrieval of data.
The date is the date the sample was collected. Students can enter their own names for the observer field. Enter data from your completed Bird Data Sheet. Check your work before submitting your data. If you want a print out of what you entered, print the page before you click to
submit your data. Never go back after you have clicked “Submit My Bird Data” – your data will be entered twice!
Bruchid Beetles
Enter data from your completed Bruchid Beetle Data Sheet. The date is the date the pods were collected. Students can enter their own names for the observer field. Check your work before submitting your data. If you want a print out of what you entered, print the page before you click to
submit your data. Never go back after you have clicked “Submit My Bruchid Data” – your data will be entered twice!
Vegetation
Enter data from your completed Vegetation Data Sheet. The date is the date the sample was collected. Students can enter their own names for the observer field. Check your work before submitting your data. If you want a print out of what you entered, print the page before you click to
submit your data. Never go back after you have clicked “Submit My Vegetation Data” – your data will be entered twice!
When you have completed entering data, click “Submit My Data” Never go back after you have clicked “Submit My Data” – your data will be entered twice!
Your Data Has Been Submitted The display will confirm your data has been submitted, you now have three choices:
Click “Enter more data” (Submit Data Icon) This will take you to a page where you can continue entering data about the same
protocol at the same or a different site. Click “ Return to Data Center” (View Data Icon)
This will take you to the Data Center where you can choose to submit or download data.
Close the browser window and end your session

62
Teacher’s Guide
Downloading Data Select the data set
Select the data set you would like to work with by clicking on the down arrow on the right hand side of the box. Highlight the dataset you want. You can work with one of the following:
Ecology Explorers Bird Survey Ecology Explorers Arthropod Survey Ecology Explorers Bruchid Beetle Survey Ecology Explorers Vegetation Survey
Click “Continue” Select the dates and locations for the dataset
Selecting dates Click on the down arrow on the right hand side of the box and highlight your
choices.
Selecting the location(s) Click on the down arrow on the right hand side of the box and highlight your
choice. You can choose more than one location by holding down the Control or Option
key while highlighting the locations you want.
Click “Go Get Data” Viewing your Data You have three choices to view your data.
1. To view the data as a web page, click on the “View Data” icon The next page will display your data in a table
2. To save the data depends on the computer you are using:
If you use a PC 1. Right click on the icon and choose "save link as"
(in Netscape) or "save target as" (in Internet Explorer). 2. Save the file on your computer or on a disk. 3. Open up the file in your spreadsheet program (i.e. EXCEL) and follow the directions for converting it to a spreadsheet file.
If you use a Mac 1. Right click (or press the Control button while clicking) on the icon and choose "save link as" (in Netscape) or "download link to disk" (in Internet Explorer). 2. Save the file on your computer or on a disk. 3. Open up the file in your spreadsheet program (i.e. EXCEL) and follow the directions for converting it to a spreadsheet file.
3. To asks questions and view graphs of your data, go to: http://caplter.asu.edu/eeAnalysis/ and use the Ecology Explorers Data Analysis Tool.

63
Teacher’s Guide
Other Resources The “Resources” page of the Ecology Explorers Web Site (http://ecologyexplorers.asu.edu/resources/) provides the following links: Contact Us Contact us to find out how Ecology Explorers can be a resource to you and your classroom Available for Checkout A list of resources you can check our from Ecology Explorers to assist you in your classroom. Field trips Take your students to permanent Ecology Explorer bird monitoring sites. Printed Material Books and other curriculum resources that offer extensions to our protocols. Web links Links to other web-based resourced that offer extensions to our protocols. Site map Browse every page on our website Slide Sets http://ecologyexplorers.asu.edu/get-started/slide-sets/ Historical Aerial Photos, Land Use Changes from 1912-2000, Bird and Insect Identification Cards, Arthropod Id. Interactive Games http://ecologyexplorers.asu.edu/get-started/interactive-games/ Land Use Changes, Bird Identification and Arthropod Protocol Simulation Lesson Plans:http://ecologyexplorers.asu.edu/overview/lesson-plans/ Ecology Explorer lessons that are extensions to our protocols

64
Teacher’s Guide
AZ Science Standards:
Including Ecology Explorers in your science curriculum may help you to fulfill many of the requirements as outlined in the Arizona Department of Education Science Standards. Since ecology is the study of the interactions between living and non-living components in the biosphere, it is one field of scientific study that easily combines the life sciences, physical sciences and earth sciences. The study of urban ecology makes your schoolyard an easily accessible scientific laboratory. Urban ecology also touches on human interactions with the environment and students will be able to see the interplay between science and society as they ask questions about their local environment.
The following are selected standards taken directly from the Arizona Department of Education Science Standards that may be met by incorporating Ecology Explorer into your curriculum. The fulfillment of some of these standards, while not directly addressed by this Ecology Explorer Web site are logical extensions that teachers will make while teaching ecological concepts.

65
Teacher’s Guide
Science as Inquiry: Participation in Ecology Explorers fulfills many of the requirements for the Inquiry Process (Strand 1), History and Nature of Science (Strand 2) and Science in Personal and Social Perspectives (Strand 3) because this program is designed to allow students to be active participants in on-going and active research projects at ASU. Ecology Explorer Project can fulfill: K-4
S1C1-K-4: observe, ask questions, and make predictions
S1C2-K-4: participate in planning and conducting investigations and recording data
S1C3-K-4: organize and analyze data; compare to predictions
S1C4-K-4: communicate results of investigations
S1C4-K-4: communicate results of investigations
S2C2-K-4: understand how science is a process for generating knowledge
S2C1-K-4: identify individual and cultural contributions to scientific knowledge
S3C1-K-4: describe the interactions between human populations, natural hazards, and the environment
S3C2-K-4: understand the impact of technology
5-8
S1C1-5-8: formulate predictions, questions, or hypotheses based on observations; locate appropriate resources
S1C2-5-8: design and conduct controlled investigations
S1C3-5-8: analyze and interpret data to explain correlations and results; formulate new questions
S1C4-5-8: communicate results of investigations
S2C2-5-8: understand how science is a process for generating knowledge
S2C1-5-8: identify individual, cultural, and technological contributions to scientific knowledge
S3C1-5-8: describe the interactions between human populations, natural hazards and the environment
S3C2-5-8: develop viable solutions to a need or problem
HS
S1C1-HS: formulate predictions, questions, or hypotheses based on observations; evaluate appropriate resources
S1C2-HS: design and conduct controlled investigations
S1C3-HS: evaluate experimental design, analyze data to explain results and to propose further investigations; design models
S1C4-HS: communicate results of investigations
S2C2-HS: understand how scientists evaluate and extend scientific knowledge
S2C1-HS: identify individual, cultural, and technological contributions to scientific knowledge
S3C1-HS: describe the interactions between human populations, natural hazards, and the environment
S3C2-HS: develop viable solutions to a need or problem
S3C3-HS: analyze factors that affect human populations
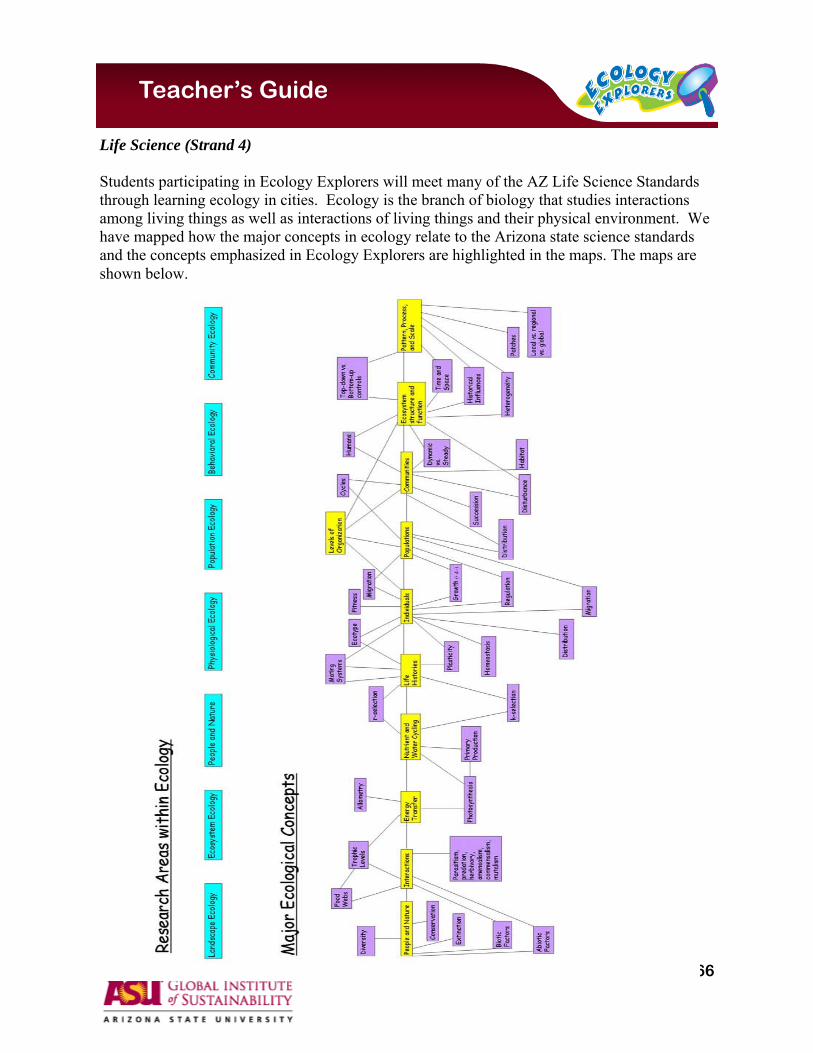
66
Teacher’s Guide
Life Science (Strand 4) Students participating in Ecology Explorers will meet many of the AZ Life Science Standards through learning ecology in cities. Ecology is the branch of biology that studies interactions among living things as well as interactions of living things and their physical environment. We have mapped how the major concepts in ecology relate to the Arizona state science standards and the concepts emphasized in Ecology Explorers are highlighted in the maps. The maps are shown below.
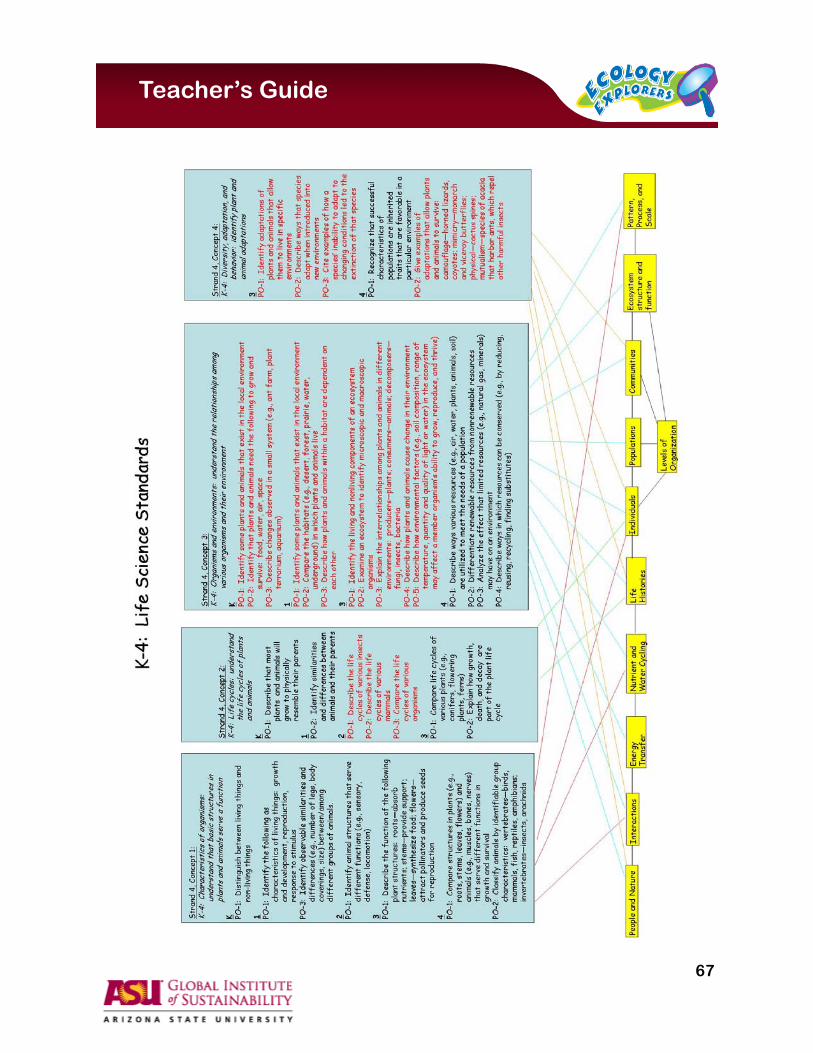
67
Teacher’s Guide
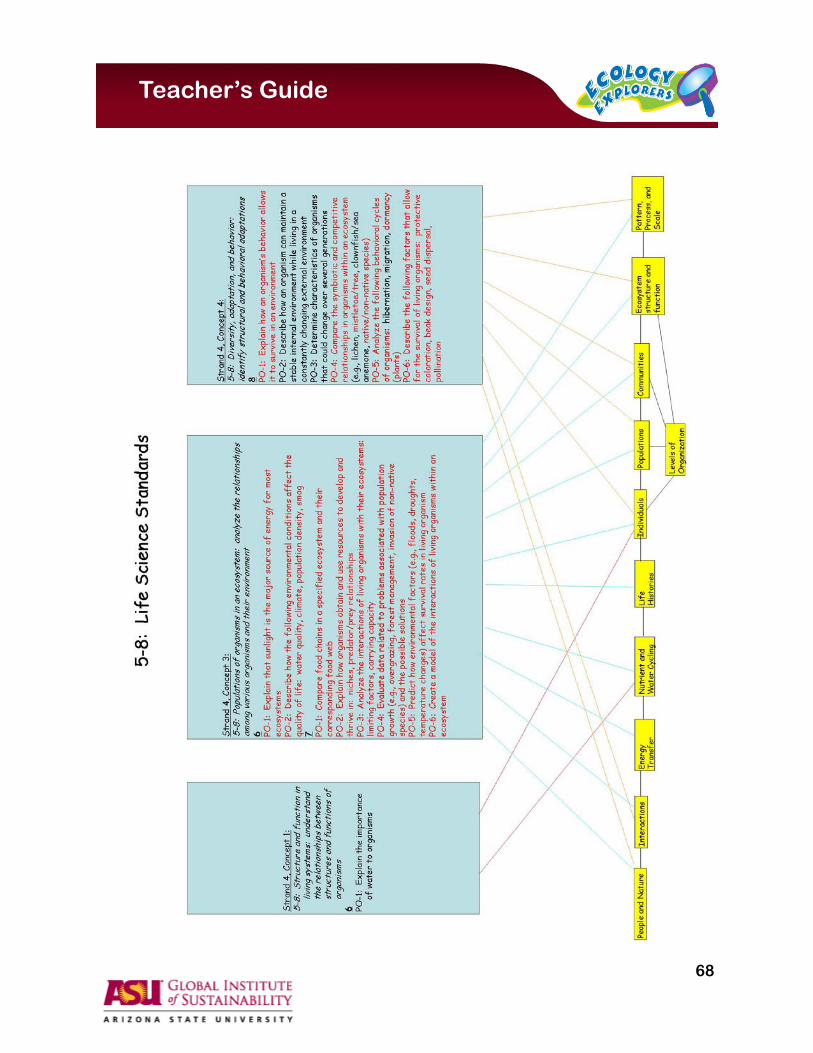
68
Teacher’s Guide
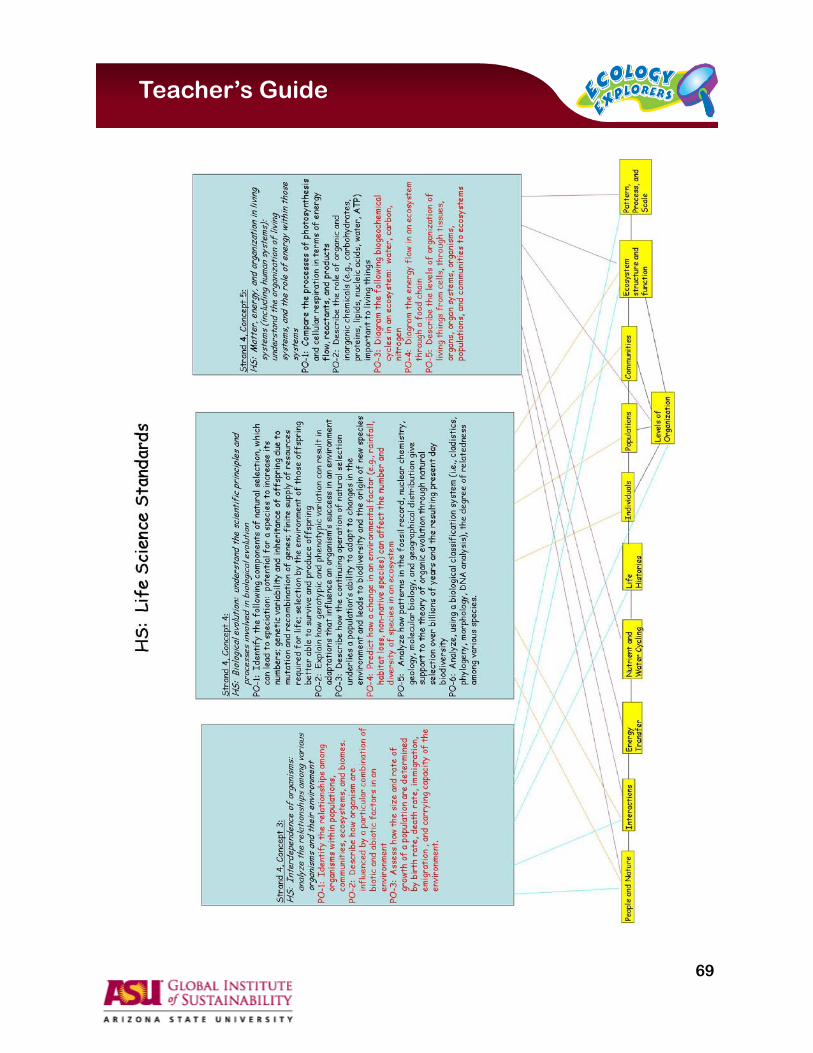
69
Teacher’s Guide

70
Teacher’s Guide
Physical Science (Strand 5) Although the physical sciences are used extensively to understand ecosystems, these standards are specific to understanding the underlying structure of matter. In Ecology Explorers, students need to be comfortable with many of the characteristics of chemical compounds, but they are not part of this curriculum. For example, understanding conservation of energy and matter are key components to understanding ecosystems. Ecology Explorers is a way for students to see how these basic physical concepts are applied in biological systems.

71
Teacher’s Guide
Earth and Space Science (Strand 6) Since Ecology is the interaction between the living and non-living components, knowing some-thing about the earth is very important. Ecology Explorer project can fulfill: K-4 S6.C2.G1.PO1: Identify evidence that the Sun is the natural source of heat and light on the Earth (e.g., warm surfaces, shadows, shade). S6.C3.GRK.PO1: Identify the following aspects of weather: temperature, wind, precipitation, storms. S6.C3.GR1.PO1: Identify the following characteristics of seasonal weather patterns: temperature, type of precipitation, wind. S6.C3.GR1.PO2: Analyze how the weather affects daily activities. S6.C3.GR2.PO1: Measure weather conditions (e.g., temperature, precipitation). S6.C3.GR2.PO2: Record weather conditions (e.g., temperature, precipitation). S6.C3.GR4.PO1: Identify the sources of water within an environment (e.g., ground water, surface water, atmospheric water, glaciers). S6.C3.GR4.PO6: Compare weather conditions in various locations (e.g., regions of Arizona, various U.S. cities, coastal vs. interior geographical regions). 5 - 8 S6.C1.GR7.PO3: Explain the following processes involved in the formation of the Earth’s structure: erosion, deposition·, plate tectonics, volcanism S6.C1.GR7.PO4: Describe how the rock and fossil record show that environmental Conditions have changed over geologic and recent time S6.C2. GR4.PO1: Identify the earth processes that cause erosion S6.C2. GR4.PO2: Describe how currents and wind cause erosion and land changes. S6.C2. GR4.PO4: Compare rapid and slow processes that change the Earth’s surface,
including: rapid – earthquakes, volcanoes, floods; slow – wind, weathering S6.C2. GR4.PO5: Identify the earth events that cause changes in atmospheric conditions (e.g., volcanic eruptions, forest fires). S6.C2. GR4.PO6: Analyze evidence that indicates life and environmental conditions
have changed (e.g., tree rings, fish fossils in desert regions, ice cores). S6.C2. GR6.PO1: Explain how water is cycled in nature. S6.C2. GR6.PO-3: Analyze the effects that bodies of water have on the climate of a region. S6.C2. GR6.PO 4. Analyze the following factors that affect climate: ocean currents, elevation, location

72
Teacher’s Guide
HS S6.C1.HS.PO1: Identify ways materials are cycled within the earth system (i.e., carbon cycle, water cycle, rock cycle). S6.C1.HS.PO2: Demonstrate how dynamic processes such as weathering, erosion, sedimentation, metamorphism, and orogenesis relate to redistribution of materials within the earth system. S6.C1.HS.PO5: Describe factors that impact current and future water quantity and quality including surface, ground, and local water issues. S6.C1.HS.PO6: Analyze methods of reclamation and conservation of water. S6.C2.HS.PO3: Distinguish between weather and climate. S6.C2.HS.PO9: Explain the effect of heat transfer on climate and weather. S6.C2.HS.PO12: Describe the conditions that cause severe weather (e.g., hurricanes, tornadoes, thunderstorms). S6.C2.HS.PO14: Analyze how weather is influenced by both natural and artificial earth features (e.g., mountain ranges, bodies of water, cities, air pollution) S6.C2.HS.PO15: List the factors that determine climate (e.g., altitude, latitude, water bodies, precipitation, prevailing winds, topography). S6.C2.HS.PO16: Explain the causes and/or effects of climate changes over long periods of time (e.g., glaciation, desertification, solar activity, greenhouse effect). S6.C2.HS.PO17: Investigate the effects of acid rain, smoke, volcanic dust, urban development, and greenhouse gases, on climate change over various periods of time. S6.C3.HS.PO6: Investigate scientific theories of how life originated on Earth (high temperature, low oxygen, clay catalyst model). S6.C3.HS.PO7: Describe how life on Earth has influenced the evolution of the Earth’s systems. S6.C3.HS.PO8: Sequence major events in the Earth’s evolution (e.g., mass extinctions, glacial episodes) using relative and absolute dating data. S6.C3.HS.PO9: Analyze patterns in the fossil record related to the theory of organic evolution.
73
Teacher’s Guide
Ecology Explorers and the AZ Standards (other than Science) Reading, Writing, Listening & Speaking: Language Arts Standards & CAP LTER Arizona Standards stress the interdependency or reading, writing, listening and speaking. Inter-disciplinary projects such as CAP LTER protocols and their associated extensions (reading sci-ence information, interpreting keys, presenting and sharing data) offer a cross disciplinary method for integration of many language arts skills. Reading Comprehension: identifying cause and effect (R-F3, PO4) Structural analysis skills: identify root words, infer meaning from knowledge of prefixes and suffixes, and confirm meaning by context clues (R-E1, PO1,2,3) Evaluate an instructional manual: identify components in the manual, incorporate informa tion from illustrations, identify the sequence of activities needed to carry out a procedure (R-E5, PO1,2,4) Writing Gather, organize and accurately, clearly and sequentially report information gained from
personal observations and experiences such as science experiments, field trips and class-room visitors: record observations, write an introductory statement, report events sequen-tially, write a concluding statement (W-F4, PO1 – 4)
Locate, acknowledge and use several sources to write an informational report in their own words: use resources (W-F5,PO1)
Write a persuasive essay (W-P2) Listening and Speaking Prepare and deliver an oral report: grades 4 – 8 Communicate information expressively, informatively, and analytically through a variety of
media to audiences inside or outside of the school: grades 9 -12. Viewing and Presenting Plan, develop and produce a visual presentation, using a variety of media such as videos,
films, newspapers, magazines and computer images: grades 4 – 8.

74
Teacher’s Guide
Mathematics Standards and CAP LTER Arizona Mathematics Standards Rationale “Whenever possible, mathematical learning should be placed in a broader, problem-solving context and evaluated through performance assessments. In this setting, students discover ques-tions involving numbers or equations from a real-world context which lead to answers that have meaning. Ultimately, all problems should be application problems; more ideally, problems should be presented in the broader context of an investigation or project. This way the students use problem solving, reasoning, communication and connections in every mathematical activi-ty. The spirit of these four goals is a mathematical apprenticeship in which the students solve problems on a daily basis, much as mathematics is used in the real world.” CAP LTER projects offer students real world applications of numerous problem-solving and computational skills required by the Arizona Department of Education. Strand One: Number Sense and Operations S1C1 (GR 3-12): Understand and apply numbers, ways of representing numbers, the relation- ships among numbers and different number systems S1C2 (GR K-12): Understand and apply numerical operations and their relationships to one another S1C3 (GR 3-12): Use estimation strategies reasonably and fluently Strand Two: Data Analysis, Probability, and Discrete Mathematics S2C1 (GR K-12): Understand and apply data collection, organization and representation to analyze and sort data Strand Three: Patterns, Algebra and Functions S3.C2.GR8.PO4: Identify independent and dependent variables for a contextual situation. S3.C2.HS: Describe and model functions and their relationships Strand Four: Geometry and Measurement S4C1.HS.PO14: Solve contextual situations using angles and side length relationships S4C4 (GR 3-12): Understand and apply appropriate units of measure, measurement techniques, and formulas to determine measurements Strand Five: Structure and Logic S5C1 (GR 1-12): Use reasoning to solve mathematical problems in contextual situations

75
Teacher’s Guide
Social Studies Standards & CAP LTER
Human interactions play a large role in Urban Ecology and are an integral component of the research being done as part of CAP LTER. Studying Urban Ecology with your students not only addresses science standards, but social studies as well. The following are selected standards taken directly from the Arizona Social Studies Standards that may be met by incorporating Ecology Explorer into your curriculum. Standard 1: History “Students analyze the human experience through time, recognize the relationship of events and people, and interpret significant patterns, themes, ideas, beliefs, and turning points in Arizona, America, and world history.” Essentials 1SS-E1: Understand and apply basic tools of historical research, including chronology and how to collect, interpret, and employ information from historical materials. 1SS-E8: Demonstrate and apply the basic tools of historical research, including how to construct timelines, frame questions that can be answered by historical study and research, and analyze and evaluate historical materials offering varied perspectives, with emphasis on: PO 1. constructing and interpreting graphs and charts using historical data PO 3. framing questions that can be answered by historical study and research PO 8. recognize the difference between cause and effect and a mere sequence of historical events Proficiency 1SS-P1: Apply chronological and spatial thinking to understand the meaning, implications, and import of historical and current events. 1SS-P2: Demonstrate knowledge of research sources and apply appropriate research methods, including framing open-ended questions, gathering pertinent information, and evaluating the evidence and point of view contained with primary and secondary sources. 1SS-P3: Develop historical interpretations in terms of the complexity of cause and effect and in the context in which ideas and past events unfold. 1SS-P12: Analyze the development of the American West and specifically Arizona, with emphasis on:
PO 2. the development of resources and the resulting population and economic patterns, including mining, ranching, and agriculture.

76
Teacher’s Guide
Standard 3: Geography “Students analyze locations, regions, and spatial connections, recognizing the natural and cultural processes that impact the way in which people and societies live and interact with each other and their environment.” Essentials 3SS-E1: Demonstrate understanding of the physical and human features that define places and regions in Arizona, including the geographic tools to collect, analyze, and interpret data… 3SS-E2: Describe the impact of interactions between people and the natural environment on the development of places and regions in Arizona, including how people have adapted to and modified the environment…. 3SS-E4: Demonstrate understanding of the characteristics, purposes, and use of geographic tools to locate and analyze information about people, places and environments…. 3SS-E6: Describe the economic, political, cultural, and social processes that interact to shape patterns of human populations, interdependence, and cooperation and conflict…. 3SS-E7: Explain the effects of interactions between human and natural systems, including the changes in meaning, use, and distribution of natural resources…. 3SS-E8: Use geographic knowledge, skills, and perspectives to explain past, present, and future issues… Proficiency 3SS-P1: Acquire, process, and analyze geographic information about people, places, and environments by constructing, interpreting, and using geographic tools… 3SS-P2: Analyze natural and human characteristics of places in the world studied to define regions, their relationships, and their patterns of change… 3SS-P3: Analyze how economic, political, cultural, and social processes interact to shape patterns and characteristics of human populations, interdependence, and cooperation and conflict…. 3SS-P5:Apply geographic knowledge of people, places, and environments to understand the past and present and plan for the future

77
Teacher’s Guide
Technology Standards & CAP LTER The technology standards are designed to “help students live, learn and work successfully and responsibly in an increasingly complex, technology-driven society.” Technology Standard 3: Productivity Tools “Students use technology tools to enhance learning, to increase productivity and creativity, and to collaboratively construct technology-enhanced models, prepare publications, and produce other creative works” Using technology tools for data collection and analysis including spreadsheets and data probes (3T-F2, 3T-E2, 3T-P2) Technology Standard 4: Communication Tools “Building on productivity tools, students will collaborate, publish, and interact with peers, experts and other audiences using telecommunications and media” Using technology to access remote information and online resources and collaborate with peers, and experts (4T-E1, 4T-E3, 4T-P1, 4T-P3) Technology Standard 6: Tool for Problem Solving and Decision Making “Students use technology to make and support decision in the process of solving real-world problems” Determine when technology is useful and select and use the appropriate tools and technology resources to solve problems (6T-E1, 6T-P2)

78
Teacher’s Guide
Notes: