Embed Size (px)
Citation preview
University of South FloridaScholar Commons
Graduate Theses and Dissertations Graduate School
January 2011
Teacher's Perception of their Principal's LeadershipStyle and the Effects on Student Achievement inImproving and non-improving schoolsBrenda Kay HardmanUniversity of South Florida, [email protected]
Follow this and additional works at: http://scholarcommons.usf.edu/etd
Part of the American Studies Commons, Educational Administration and SupervisionCommons, Other Education Commons, and the Teacher Education and Professional DevelopmentCommons
This Dissertation is brought to you for free and open access by the Graduate School at Scholar Commons. It has been accepted for inclusion inGraduate Theses and Dissertations by an authorized administrator of Scholar Commons. For more information, please [email protected].
Scholar Commons CitationHardman, Brenda Kay, "Teacher's Perception of their Principal's Leadership Style and the Effects on Student Achievement inImproving and non-improving schools" (2011). Graduate Theses and Dissertations.http://scholarcommons.usf.edu/etd/3726
Teacher’s Perception of their Principal’s Leadership Style and the Effects on
Student Achievement in Improving and Non-improving Schools
by
Brenda Kay Hardman
A dissertation submitted in partial fulfillment
of the requirements for the degree of
Doctor of Education
Department of Education Leadership and Policy Studies
College of Education
University of South Florida
Major Professor: Darlene Bruner, Ed. D.
Valerie J. Janesick, Ph.D.
Yi-Hsin Chen, Ph. D.
William Young, Ed. D.
Date of Approval:
November 7, 2011
Key words: Principalship, teacher-focused, situational leadership theory, school culture
Copyright © 2011, Brenda Kay Hardman
Dedication
This paper is dedicated to my husband, Rick, and my children, Tyler Malone and
Christina May. Our family is the heartbeat of my soul. You have nurtured me and
supported me through the pursuit of this goal with patience, and perseverance.
To my husband, I thank you for walking beside me and believing in me as I
strived to meet my own expectations. Your support, patience, and friendship made this
accomplishment possible.
To my son, whose heart is as big as my love for him. Your future is yours to
create by believing in yourself and taking action toward reaching your goals. Remember,
a goal is a dream with a deadline.
To my daughter, whose beautiful spirit is captured in her sweet look at life. Your
journey has only begun. The world needs to know your wisdom and perspective. All is
possible; just take one step forward each day.
Acknowledgements
Thank you to Dr. Darlene Bruner, the chair of my committee, who gave of her
time and energy to gently lead me through this process. Her wisdom supersedes all
others. I will sincerely miss our frequent talks but I am counting on our friendship to
continue. Thank you to my committee member and methodologist, Dr. Yi-Hsin Chen. His
expertise and support has made this process possible. Thank you to, Dr. William Young
and Dr. Valerie Janesick for their guidance, support, and wisdom throughout the process.
I also want to thank those who have influenced my journey as an educational
leader through their models of leadership practices. Buddy Thomas has given me a sound
example of a dedicated leader with a great heart. Ernest Joe has provided an example of a
leader who has unyielding energy for meeting student needs. I look forward to drawing
from your examples as I continue my journey in education. And most dear to my heart, I
thank my father, Dr. Donald McInnis, who gave me my vision for reaching toward this
goal. His ethical leadership, sound reasoning, patience, and keen humor runs through my
veins and will carry me to through my future challenges.
Lastly, I acknowledge Delta Kappa Gamma for their financial support through the
awarding of the International Scholarship.
i
Table of Contents
List of Tables ..................................................................................................................... iv List of Figures .................................................................................................................... vi Abstract ............................................................................................................................. vii Chapter One Introduction ....................................................................................................1
Background of the Study. .......................................................................................... 1 The school Leader’s Role in Student Achievement ....................................... 2 The importance of Teacher-Focused Leadership .......................................... 2 Conceptual Framework of the Study .................................................................. 3
Statement of the Research Problem ...................................................................... 4 Purpose of the Study ................................................................................................... 6 Research Questions ..................................................................................................... 7 Methodology of the Study .......................................................................................... 9 Data Gathering Instruments.................................................................................. 11 Assumptions, Delimitations, and Limitations of the Study ........................ 13
Assumptions .............................................................................................................. 13 Delimitations ............................................................................................................. 13 Limitations ................................................................................................................. 14
Definition of Key Terms .......................................................................................... 14 Significance of the Study ......................................................................................... 17 Organization of the Study ....................................................................................... 18
Chapter Two Literature Review .........................................................................................19 Purpose ......................................................................................................................... 19 Conceptual Framework ........................................................................................... 21 Administrative Leadership Styles within Situational Leadership Theory ........................................................................................................................... 22
Situational Leadership Theory ........................................................................... 23 Transformational Leadership Style ................................................................. 25 Transactional Leadership Style ......................................................................... 29
Building School Capacity through Leadership Styles ................................... 32 Elements of Teacher-Focused Principal Behaviors that Build Teacher Capacity ....................................................................................................................... 35 School Capacity and Teacher Capacity............................................................ 36 Principal Role Modeling to Build School Capacity ...................................... 38 Leadership Decisions and Building School Capacity ................................. 40
ii
Leadership Style and School Capacity impacts Student Learning Gains .............................................................................................................................. 43
Leadership Styles and Student Learning Gains ........................................... 45 School Capacity and Student Learning Gains ............................................... 47 The Elements of School Capacity and Student Learning Gains ............. 48
Conclusion ................................................................................................................... 51
Chapter Three Research Method .......................................................................................55 Problem and Purpose of the Study ..................................................................... 55 Research Questions .................................................................................................. 56 Research Population ................................................................................................ 57 Design of the Study ................................................................................................... 62 Design of the Instrument ........................................................................................ 66
Multifactor Leadership Questionnaire (5x-Short) .................................... 69 Validation of the Multiple Leadership Questionnaire (5x-Short)......... 72 Validation of the Florida Comprehensive Assessment Test ................... 77
Pilot Study .................................................................................................................... 79 Research Variables ................................................................................................... 83 Data Collection Procedures ................................................................................... 84 Data Analysis .............................................................................................................. 85 Role of the Researcher and Ethical Considerations ...................................... 89 Summary ...................................................................................................................... 90
Chapter Four Research Results ..........................................................................................91 Descriptive Statistics ............................................................................................... 91 Leadership Styles in Improving and Non-improving Schools ................... 94 Leadership Style and Student Achievement in Improving and Non-improving Schools ........................................................................................... 96 Transformational, Transactional, and Passive Avoidant Leader
Subscales and Student Achievement ....................................................................... 98 Teacher Demographics and their Perception of Leadership Styles ............. 102 Behaviors of Leaders as Perceived by Teachers ......................................... 107 Emerging Themes .................................................................................................. 108
Principal Role Modeling Theme ...................................................................... 110 School Culture Theme ......................................................................................... 112 Leadership Decisions Theme ............................................................................ 114
Leadership Outcomes and Principal Leadership Style ................................... 115 Summary of Results ............................................................................................... 119
Chapter 5 Summary and Discussion ................................................................................122 Purpose of the Study ............................................................................................. 123

iii
Research Questions ............................................................................................... 123 Context of the Study .............................................................................................. 124 Discussion of the Findings .................................................................................. 126
Leadership Styles and Improving and Non-improving Schools .......... 126 Principal Leadership Styles and Student Achievement .......................... 130 Principal Leadership Style ................................................................................. 131 Transformational .................................................................................................. 132 Transactional .......................................................................................................... 133 Passive-avoidant.................................................................................................... 134 Demographic Variables and Leadership Styles ......................................... 135
Teacher Perspectives on Leadership Behaviors ......................................... 135 Principal Role Modeling ...................................................................................... 135 Building School Capacity .................................................................................... 137 Leadership Decisions ........................................................................................... 138
Leadership s Styles and Leadership Outcomes ........................................... 138 Limitations of the Study ....................................................................................... 140 Implications for Future Research .................................................................... 142 Conclusion ................................................................................................................ 143
References ........................................................................................................................149 Appendices .......................................................................................................................166
Appendix A: Sample MLQ Items and 5-Point Likert Scale ........................ 167 Appendix B: Eliminated School Samples and Qualified School Samples ...................................................................................................................... 168 Appendix C: Email to Teachers with Survey Monkey Link ...................... 168 Appendix D: Demographic Survey - Professional Descriptions for 2010-2011 ................................................................................................................. 171 Appendix E: Teacher Responses to Open-Response Questions ............. 172
About The Author ................................................................................................................1

iv
List of Tables
Table 1: Identifying 16 Sample Schools ............................................................................60
Table 2: Population Response of the Study Sample ..........................................................61
Table 3: Summary of Instruments: MLQ (5x-Short) and FCAT .......................................68
Table 4: Types of Questions for Grade Level on the Florida Comprehensive
Assessment Test. ................................................................................................................76
Table 5: Bass & Avolio’s MLQ, Pilot and Researcher’s Study: Means, Standard
Deviation, and Reliabilities ................................................................................................81
Table 6: Summary Research Questions and Data Analysis ...............................................87
Table 7: Descriptive Statistics for Teacher Perception of Principal Leadership
Styles (N=143) ..................................................................................................................93
Table 8: Independent t-test results for Transformational Leadership Style of the
Principal in Improving and Non-improving schools (N=143) ...........................................95
Table 9: Independent t-test results for Transactional Leadership Style of
Principals in Improving and Non-improving schools (N=143) .........................................96
Table 10: Independent t-test results for Passive Avoidant Leadership Style of
Principals in Improving and Non-improving schools (N=143) .........................................96
Table 11: Regression Explaining Effect on Achievement Outcomes by Leadership
Styles and Improvement Status of Schools (N=143) .........................................................98
Table 12: Transformational Leadership Style subscales and Improvement status as
Predictors of Student Achievement (N = 143) .................................................................100
Table 13: Transactional Leadership Style Subscales and Improvement Status as
Predictors of Student Achievement (N = 143) .................................................................101
Table 14: Passive Avoidant Leadership Style Subscales and Improvement Status
as Predictors of Student Achievement (N = 143) ............................................................102
v
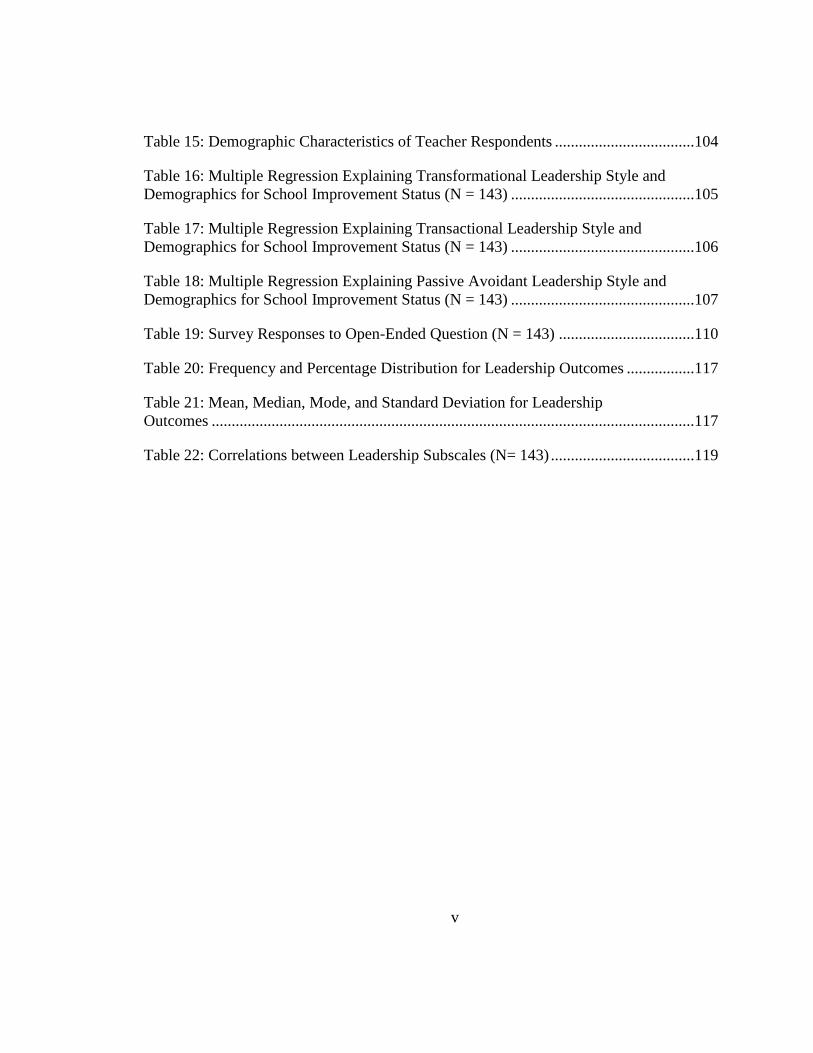
Table 15: Demographic Characteristics of Teacher Respondents ...................................104
Table 16: Multiple Regression Explaining Transformational Leadership Style and
Demographics for School Improvement Status (N = 143) ..............................................105
Table 17: Multiple Regression Explaining Transactional Leadership Style and
Demographics for School Improvement Status (N = 143) ..............................................106
Table 18: Multiple Regression Explaining Passive Avoidant Leadership Style and
Demographics for School Improvement Status (N = 143) ..............................................107
Table 19: Survey Responses to Open-Ended Question (N = 143) ..................................110
Table 20: Frequency and Percentage Distribution for Leadership Outcomes .................117
Table 21: Mean, Median, Mode, and Standard Deviation for Leadership
Outcomes .........................................................................................................................117
Table 22: Correlations between Leadership Subscales (N= 143) ....................................119
vi
List of Figures
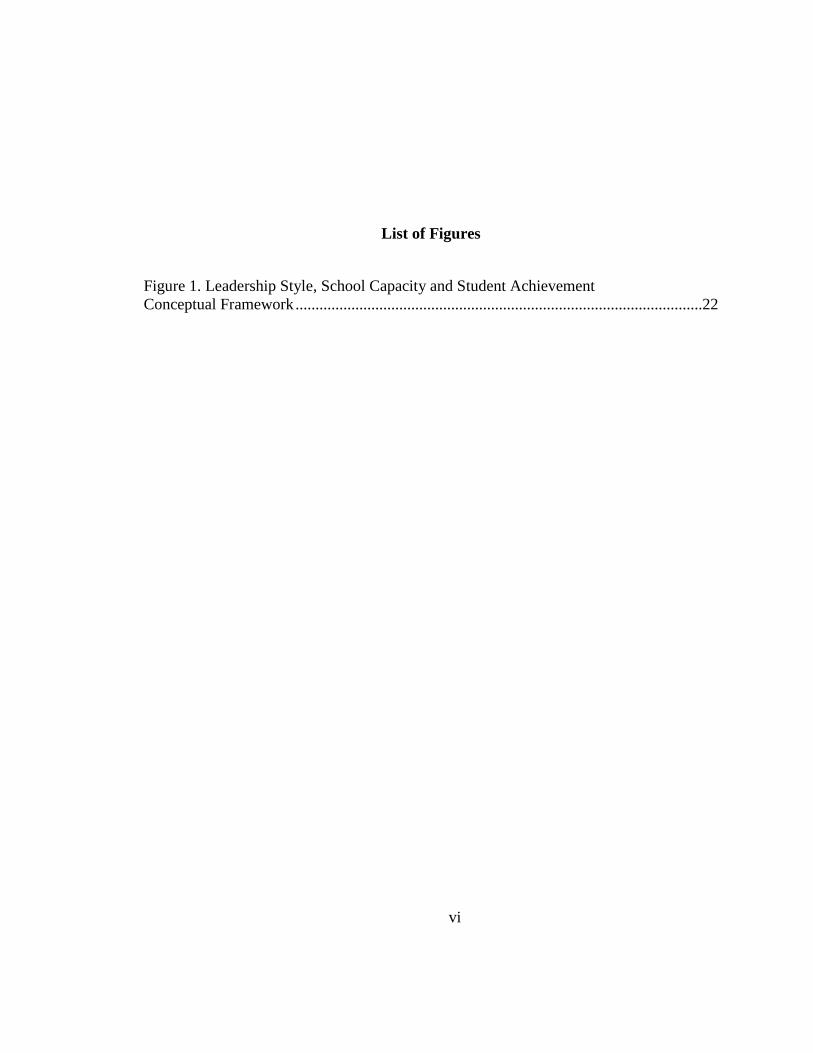
Figure 1. Leadership Style, School Capacity and Student Achievement
Conceptual Framework ......................................................................................................22
vii
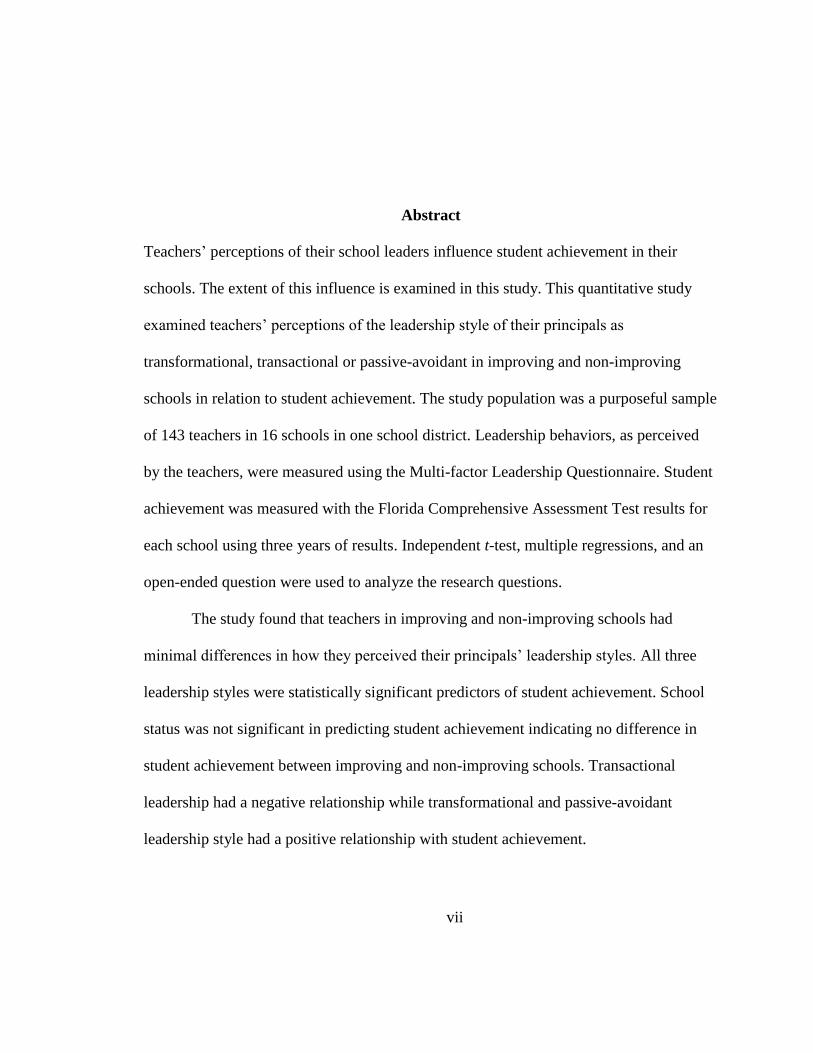
Abstract
Teachers’ perceptions of their school leaders influence student achievement in their
schools. The extent of this influence is examined in this study. This quantitative study
examined teachers’ perceptions of the leadership style of their principals as
transformational, transactional or passive-avoidant in improving and non-improving
schools in relation to student achievement. The study population was a purposeful sample
of 143 teachers in 16 schools in one school district. Leadership behaviors, as perceived
by the teachers, were measured using the Multi-factor Leadership Questionnaire. Student
achievement was measured with the Florida Comprehensive Assessment Test results for
each school using three years of results. Independent t-test, multiple regressions, and an
open-ended question were used to analyze the research questions.
The study found that teachers in improving and non-improving schools had
minimal differences in how they perceived their principals’ leadership styles. All three
leadership styles were statistically significant predictors of student achievement. School
status was not significant in predicting student achievement indicating no difference in
student achievement between improving and non-improving schools. Transactional
leadership had a negative relationship while transformational and passive-avoidant
leadership style had a positive relationship with student achievement.
viii
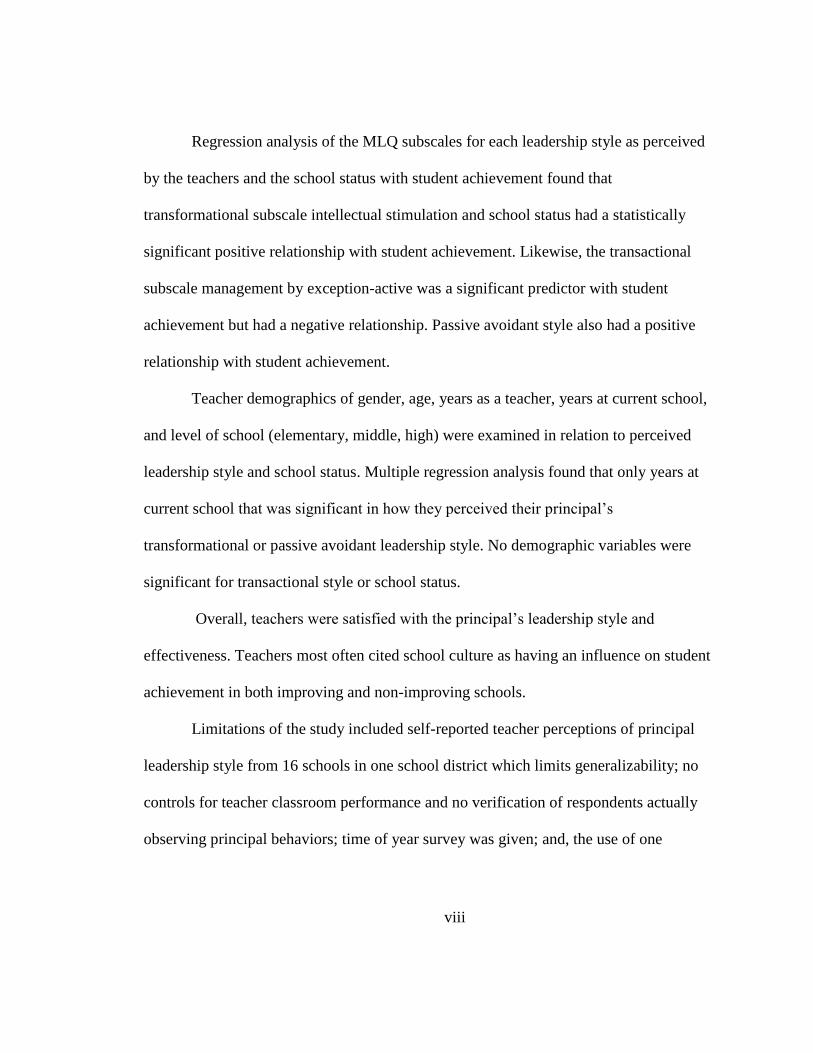
Regression analysis of the MLQ subscales for each leadership style as perceived
by the teachers and the school status with student achievement found that
transformational subscale intellectual stimulation and school status had a statistically
significant positive relationship with student achievement. Likewise, the transactional
subscale management by exception-active was a significant predictor with student
achievement but had a negative relationship. Passive avoidant style also had a positive
relationship with student achievement.
Teacher demographics of gender, age, years as a teacher, years at current school,
and level of school (elementary, middle, high) were examined in relation to perceived
leadership style and school status. Multiple regression analysis found that only years at
current school that was significant in how they perceived their principal’s
transformational or passive avoidant leadership style. No demographic variables were
significant for transactional style or school status.
Overall, teachers were satisfied with the principal’s leadership style and
effectiveness. Teachers most often cited school culture as having an influence on student
achievement in both improving and non-improving schools.
Limitations of the study included self-reported teacher perceptions of principal
leadership style from 16 schools in one school district which limits generalizability; no
controls for teacher classroom performance and no verification of respondents actually
observing principal behaviors; time of year survey was given; and, the use of one

ix
instrument to measure leadership style may not reflect the actual leadership style of the
principal.
1
Chapter One
Introduction
Chapter One presents the overview of the study. The areas addressed in the
chapter are the conceptual framework, statement of the research problem, purpose of the
study, research questions, methodology of the study, data gathering instruments,
assumptions, and definition of key terms. The chapter concludes with the significance of
the study and the organization of the chapters that follow.
Background of the Study.
Federal education initiatives are holding each state accountable for the education
of all children through close monitoring of individual student data at the district and
school level. The No Child Left Behind Act of 2001 (NCLB) amends the Elementary and
Secondary Education Act of 1965 to include requirements for states to meet Adequate
Yearly Progress objectives and performance standards set by federal policy (No Child
Left Behind Act, Public Law 107-110, 2001, Baker, Betebenner & Linn, 2002). This
pervasive accountability system places statewide student testing results as one of the final
determinations of school improvement efforts. It is only with a shift in the focus from a
managerial style of school leadership to a teacher-focused style of leadership that school
improvement will increase and student achievement will rise (Bredson, 2005, Lazaridou,
2006).
2
The school leader’s role in student achievement. The actions of school leaders
impact school capacity and may either enhance or diminish student achievement. School
capacity is defined as the collective power of a school staff to raise student achievement
(King & Youngs, 2002). The effective educational leader is one who has the ability to
develop a school’s capacity to enhance student learning through the motivation of
teachers, staff and students (Daley, Guarino & Santibanez, 2006). Such leadership is
determined by the followers, not the leaders (Bhindi, Hansen, Rall, Riley, & Smith,
2008). Therefore, it may be claimed that student achievement is effected by the teacher’s
perception of school leadership.
The importance of teacher-focused leadership. School administrators who
build school capacity through an effective leadership style may influence student
achievement through teachers (Christie, Thompson, & Whiteley, 2009). The school
leader must have or be able to develop the capacity to work with staff to focus on
curriculum, instruction and student learning gains (Fullen, 2001). The perception of the
school administrator is often as a person who manages a school and not as a person who
is an instructional leader. The leader’s daily activities and decisions reflect the pervasive
focus and style of the school’s leadership (Noonan & Walker, 2008). A teacher-focused
leader works toward the development of school capacity which builds upon positive
teacher capacity with the end results increasing student achievement.
The outcome of a student’s education as evidenced through test scores is often
determined by the focus and effectiveness of a school’s leadership (Leithwood, 2005 &
3
2008). The educational leader’s role is to hire and motivate teachers to raise student
learning gains (Hoy & Woolfolk, 1993, Janzi & Leithwood, 1996). Students reveal their
ability to learn through their measured achievement, attendance, and participation in
school activities. However, it is the students’ perception of their teachers that sets the
daily learning process in motion. Further, it is the teacher’s perception of how they are
valued and supported by their school’s leadership that often has an influence on their
daily decisions to motivate students (Bandura, 2003, Demir, 2008).
Conceptual framework of the study. Authentic leadership is defined by
followers, not the leaders (Bhindi, Hansen, Rall, Riley, & Smith, 2008). This study used a
postpositivist philosophical paradigm to support the use of situational leadership theory
as the conceptual framework. Postpositivism philosophy helps define the elusiveness of
leadership by suggesting the teacher’s realities are based on their personal experiences
(Knipp & Mackenzie, 2006). This philosophical paradigm supports the need for leaders
to know how teachers define their leadership within the school culture.
Postpositivism is the lens used to view situational leadership. This theory provides
the researcher with a critical realism which allows for principals to use their independent
reality that is based on a multiple of measures they apply in their everyday situations
when making leadership decisions (Trochim, 2008). Effective leadership is determined
by the selection of the leadership style in daily leadership decisions. Educational leaders
have multiple roles which require the freedom of choice, or adaptability of their own
behaviors (Blanchard & Hershey, 2001). As a result, student learning gains may react to
4
school capacity as influenced by the teacher-focused leadership decisions within the
conceptual framework of situational leadership theory.
Statement of the Research Problem
This study's research problem examined how school leadership style, as perceived
by teachers, impacted student achievement. The leadership styles of principals are
interpreted and defined through their teachers. It is assumed that principal leadership
behaviors influence teacher engagement with students which results in a measured impact
on student performance. The framework of situational leadership theory maintains that
leaders have the opportunity to select the style which positively influences their effective
practices, role modeling and high expectations to enhance school improvement (Blase &
Blase, 1999).
Does a principal’s leadership style as perceived by teachers as transactional,
transformational, or passive-avoidant impact school capacity and ultimately student
achievement? As a result of their decisions, effective school leaders develop an
environment that builds or destroys school capacity. School capacity is raised through the
administrative role modeling of effective practices and consistent teacher-focused
decisions that ultimately impacts student learning gains (Demir & Kamile, 2008).
Consequently, the improvement of teacher capacity directly relates to the selected style
when a teacher witnesses a leader’s belief system that supports them professionally
(Barnett, Craven & Marsh, 2005).

5
There is a knowledge gap in education research studies on teacher-focused
leadership styles that effect student achievement. To help close this gap, the variables of
this study identified the principal’s of leadership styles, as perceived by their teachers, the
status of schools as improving or non-improving, and the school’s student achievement.
A close model to this study was a similar 2008 study completed by international authors,
Koford, Krejsler, and Moos who conducted multiple studies on transactional leadership
that found leadership drives student learning gains when leaders are aware of their impact
on teacher self-efficacy (2008). Bredson’s research supported that school leadership must
seek to increase teacher capacity due to the accelerated accountability for increased
student achievement created by the 2001 No Child Left Behind Act (2005).
Leithwood, a leading researcher on transformational leadership, advocated the
need for additional research on the impact of leadership style on student achievement.
Leithwood conducted studies which found transformational and transactional styles of
leadership encourage staff collaboration, teacher improvement, and a higher teacher
perception of leadership which impacts the overall school culture. This author espoused
that the most powerful strategy to drive teacher actions is principal visibility while
carrying out actions toward increasing student achievement (Leithwood, 1992, 2005 &
2008). Hence, this study offers supplementary and expanded research on the examination
of the leadership style of the principal, as perceived by the teachers in improving and
non-improving schools on student achievement.
6
Purpose of the Study
The purpose of this study was to examine the relationship between leadership
styles as perceived by teachers as determined by the MLQ (5x-Short) survey (Bass &
Avolio, 2004) and the school’s student achievement data on the Florida Comprehensive
Assessment Test (FCAT). The variables of the study were determined by the research
questions reflecting the purpose of the study: principal’s leadership style, status of the
schools as either improving or non-improving and student achievement. These variables
were determined based on the conviction that principals do not have a direct impact on
student achievement since they are not responsible for instructing students. Principals
affect student achievement through teachers. The premise of this research was that the
principal's leadership behaviors influenced teachers who, in turn, are directly responsible
for student achievement. Therefore, teacher perception of leadership behaviors and
school performance on FCAT may identify effective leadership styles and behaviors that
influence student achievement.
This study sought to contribute to the research that examines a principal’s
leadership style and its influence on student academic performance. Situational
leadership has been prominent in previous research and contributed to the study’s
framework. For example, Blase and Blase (1999) found that leaders have the opportunity
to select the style that positively influences effective practices, role modeling and their
high expectations as instructional leaders who enhance school improvement.

7
Additionally, improving schools exhibit a culture with a focus on student achievement,
good communication, and high expectations of teachers and students (Bruner, 1997).
Research literature substantiates the study and presents a pattern of support for
additional research due to knowledge gaps (Blanchard & Hersey, 1979; Halinger & Beck,
1998, 2005; Lazaridou, 2006). Few existing studies established a link between the impact
of leadership decisions on teachers and student achievement. Research on educational
leadership is extensive. However, current studies fail to concentrate on specifically
teacher-focused leadership styles that effect student achievement through the building of
school capacity. This study attempted to identify the relationship between the style of
school leadership, as perceived by the teachers in improving and non-improving schools,
and the effect on student achievement.
The current demand for increased school accountability to raise student
achievement has added pressure on school leaders to change from a managerial leader to
an instructional leader. As a result, the importance of demonstrating a leadership style
that positively influences school improvement is paramount to their success. This study
serves to contribute to the foundation of knowledge and understanding of how leadership
styles influence teachers and ultimately student achievement.
Research Questions

8
Is there a relationship between the leadership style of a principal as perceived by
their teachers and student test scores? The research questions were developed in
accordance with the purpose of the study and the statement of the research problem.
1. How do teachers in improving and non-improving schools perceive the leadership
styles of their school principals?
2. What is the relationship between transformational, transactional, and passive-
avoidant leadership styles of the school principal as perceived by their teachers
and improving and non-improving schools defined by the achievement of
students as measured by the FCAT over a three year period?
3. What is the relationship between the school principal’s leadership style as perceived by
their teachers on the on the five transformational, three transactional and one
passive-avoidant leadership subscales and student achievement in improving and
non-improving schools to the FCAT?
4. What is the relationship of teacher gender, age, years of experience as a teacher, and
years of experience at their current school to their perception of the principal’s
leadership style in improving and non-improving schools?
5. What are the behaviors of school principals that influence student achievement as
perceived by the teachers? Teachers are asked “What are the behaviors of your
principal that engage teachers and improve student performance?”
6. How do teachers perceive the leadership styles of their school principals as leadership
outcomes of satisfaction, effectiveness, and extra effort?
9
Methodology of the Study
This study examined the relationship between school leadership as perceived by
teachers, student achievement, and the demographics of teacher gender, years of
experience in education, and years experience at their current school. The principal’s
leadership style was determined by their teachers as measured by the Multifactor
Leadership Questionnaire (5x Short) survey (Avolio & Bass, 2004) (Appendix A) and
correlated with the school’s student achievement data as measured by the Florida
Comprehensive Assessment Test (FCAT). The demographic data was collected with the
MLQ (5x Short) survey. In addition, an open-ended question asked teachers to describe
the principal’s behaviors that supported their work in increasing student achievement.
The purposeful sample consisted of sixteen schools selected from a pool of
qualifying elementary, middle and high schools in one school district. Nontraditional
schools were removed from the sample to ensure a comparative sample. The schools not
included were designated as charter, private, detention and specialty centers. Overall,
twenty percent of the elementary, middle and high schools in the district were included in
the study. The sample of schools generated sufficient data to determine the answer to the
research questions with rich descriptions (Kemper et al., 2003; Huberman & Miles, 1994)
and increased the descriptive validity and interpretive validity (Maxwell, 1992).
Statistical inferences about a population can be made from information obtained from a
single sample drawn from a population (Saldanha & Thompson, 2002).
10
To meet the purpose of the study and answer the research questions, the school
samples were divided by school improvement status: improving or non-improving.
Improving and non-improving schools were selected by school level and matched with
similar demographics and size to obtain the needed numbers and ensure a comparative
sample. An improving school was defined as having a 1% increase for each of the three
consecutive years used in the study for their FCAT Reading and Mathematics scores. A
non-improving school had less than a 1% increase for each of the three consecutive years
used in the study for their FCAT Reading and Mathematics scores. The score increase
and decrease percentages were based on the FCAT’s scoring scale from 1 to 5 with
student non-passing scores of a 1 or 2 and passing scores of a 3, 4 or 5.
The MLQ survey, plus five additional questions developed by the researcher, was
emailed to 865 teachers at the 16 sample schools (Appendix B). If an individual survey
had less than 50% completion the survey was eliminated. The final number of surveys
used was 143.
A nonexperimental descriptive and correlational research design was used in this
study to determine the relationship of the teacher perception of school leadership and
student achievement in improving and non-improving schools. The data analysis relied
upon the tools of both descriptive and correlational research designs. A detailed
numerical and graphical summary of the survey data was provided through the use of
these two research methods. An examination of the variables of leadership style, school
improvement status and student achievement provided for an analysis of the relationship

11
between them in order to provide a richer description of how perceived leadership style
influences student performance.
Data Gathering Instruments
This study used the Multifactor Leadership Questionnaires (5x-Short) Rater Form
as the measurement tool to determine the leadership styles of principals as perceived by
their teachers. The transformational, transactional, and passive-avoidant leadership styles
are identified through the selection of a sequence of questions designed to define the
leader’s style (Antonakis, Avolio, and Sivasubramaniam, 2003). The three leadership
styles and nine subscales are defined and measured with the MLQ survey through a
Likert-type scale.
On the MLQ the first leadership style, transformational leadership, has five
subscales and describes a leader who motivates followers to excel based on their original
level of confidence towards accomplishing desired outcomes. The transformational
leadership subscales address the perceived influences, behaviors, motivational abilities,
and support of teachers by the principal. The 5 subscales are: idealized influence
(attributed), idealized influence (behavior), inspirational motivation, intellectual
stimulation, and individualized consideration.
The next leadership style assessed on the MLQ, transactional, describes leaders
who work within the structure of an organization to identify the skills of followers to
assign roles and responsibility to achieve the desired outcomes. The achieved outcomes
12
are a result of this leader negotiating with followers in an exchange relationship of
rewards for compliance (Bass, 1985). The three transactional subscales measure the
leader's perceived exchange of ideas with followers, criticism and negative reinforcement
when correcting, and monitoring for immediate feedback or when standards are not being
met. The three subscales are contingent reward, management by exception (active) and
management by exception (passive).
The final leadership style is passive avoidant. One subscale identified as “passive
avoidant,” reflects a leader who chooses to delay or not make decisions and abdicates
responsibilities to others. This leader provides little feedback and pursues little change in
their environment. This style is generally recognized as the least effective in the
literature.
In addition, the MLQ includes three outcome factors: extra effort, effectiveness,
and satisfaction (Avolio et al., 1999, Bass, 1990, 1998). There are three questions for
Extra, four questions for Effectiveness and two questions for Satisfaction. Each of these
factors reflects the resultant effects of leadership decisions as perceived the follower.
Data published in from the Florida Comprehensive Assessment Test (FCAT) for
the 2008, 2009, and 2010 school years was accessed to determine the school
improvement status of each sample school. This criterion-referenced test measures the
achievement of third through eleventh graders based on the Sunshine State Standard
benchmarks in mathematics, reading, science, and writing.
13
Lastly, the survey instrument included items identifying the teacher’s
demographics. These items aided the researcher in the analysis of correlations that may
have affected the teacher’s perceptions of their principal’s leadership style. The survey
included items regarding the teacher’s years at the present school, years as a classroom
teacher, gender, and age.
Assumptions, Delimitations, and Limitations of the Study
Assumptions. It is assumed the participants in the study completed the
questionnaire as a volunteer with honesty and without bias. Teachers from each school
were volunteer participants in the study. Additionally, it was assumed the participants
understood the questions used in the surveys and that they were a representative sample
of their school population. It is also assumed the survey respondents had observed the
leadership behaviors of principals in schools. The last assumption is that the instruments
were appropriate measures of the styles of leadership and student achievement. There
was the possibility of a negative bias by the teachers.
Delimitations. Leadership style data collection in this study was restricted to one
instrument: the Multifactor Leadership Questionnaire (MLQ 5x-short) with additional
demographic data of the participants. The study's targeted sample was selected based on
access to the target population, cost of surveys for the researcher and time allotted to
complete the study. The study was limited to the findings derived from the survey
instruments. The student achievement outcomes were limited to the FCAT scores in

14
reading and math for a three year period. To determine broader achievement outcomes it
would be necessary to administer multiple tests throughout a student’s academic career.
Such longitudinal research was beyond the scope of this study.
Limitations. This study relied upon the teachers perceptions of their principal’s
leadership style. The teachers may be limited by their understanding of the scope of the
principal’s duties. How the sample teachers gained their teaching certifications was not
reported. Their path toward certification may have influenced the teacher’s perceptions of
their school leaders. Further, it is a limitation that the perceived style of the school leader
was an accurate perception of all the teachers within the school. The researcher
investigated the leadership styles of principals in one district out of sixty-seven in the
state. Inferences from the results limit generalizability to that school district. The district
was under corrective action by the State of Florida at the time the study was carried out.
All schools in the district are under the Differentiated Accountability Matrix (DAM)
established by the Florida Department of Education in the prevent, correct or intervene
categories. The decisions made by school leaders may have been influenced by the
school’s DAM category which places mandatory school district and state interventions
and accountability structures within the school. Lastly, sampled schools were limited to
only traditional public schools.
Definition of Key Terms
The following terms are defined for the purpose of this study:

15
Adequate Yearly Progress (AYP): AYP indicates the minimum percentage of students
who must be proficient in reading and mathematics for a school to meet the federal
standards for the year based on NCLB.
Elementary School: Schools with grades from Pre-K or Kindergarten through grade 5.
Florida Comprehensive Assessment Test (FCAT): The FCAT is given annually to
students in language arts, math, science and social science and used to determine school
and student achievement.
High School: Schools with grades from ninth to twelfth.
Leadership Style: A process in which an individual influences the thoughts and actions of
another’s behavior (Northouse, 2007; Yukl, 2002).
Middle School: Schools with grades from 6 through eighth.
Multifactor Leadership Questionnaire (MLQ): A survey instrument used to gather
quantitative data through the Multifactor Leadership Questionnaire. This instrument
provides feedback based on the self-perception of the school leaders as well as how
followers rate their leaders (Avolio & Bass, 1995). There are 3 leadership constructs and
9 subscales in this MLQ instrument.
Passive-avoidant Leadership: A leadership style in the MLQ instrument that refers to the
passive and reactive forms of leadership.
Positivism Philosophical Paradigm: The postpositivism philosophical paradigm supports
the use of situational leadership theory in the conceptual framework of this review to help
16
define the elusiveness of leadership. Postpositivism philosophy suggests teacher realities
are based on their personal experiences (Knipe & Mackenzie, 2006).
Principal: This term was used interchangeably with administrator to refer to the leader of
the elementary, middle and high school.
School Capacity: The collective influence of a school staff, including teachers and
support personnel, to improve student performance (King & Youngs, 2002).
Situational Leadership Theory: This theory provides the leader with a combination of
leadership styles which establishes a myriad of tools from which to select depending on
the current situation. Situational leadership theory presents the principal with the tools to
proceed in the best interest of the school that is focused on teacher effectiveness (Blase &
Blase, 1999).
Student Achievement: Achievement is defined by a predetermined scale that indicates the
cut-off point established to determine the passing or failing on an individual student
assessment. This study used the Florida Comprehensive Assessment Test and its scale of
achievement.
Student Learning Gain: An increase or decrease in an individual student’s baseline test
data from one school year to the next determines the measurement of student learning
gains.
Teacher-focused Leadership: The author defines teacher-focused leadership as the
decisions and actions of school-based leaders who in directing their organization and
curricular decisions, impact the effect of teacher capacity on student learning gains.
17
Teacher Capacity: Teacher capacity is defined as the teacher’s belief in their own ability
to raise student learning gains as influenced by their administrators (Bredson, 2005).
Transactional Leadership Style: A transactional leaders communicates specific standards
of conformity while monitoring for deviance and rewarding compliance (Avolio, Bass,
Berson, & Jung, 2003). A review of the literature studying transactional leadership
reveals frequent comparisons to transformational leadership (Burns, 2003). Transactional
leadership style promotes followers to recognize what needs to be done and gives them
the authority to complete tasks thereby enhancing their self-efficacy.
Transformational Leadership Style: A transformational leader motivates and educates
subordinates toward making decisions without interaction with supervisors. Followers
experience a higher level of self-efficacy when experiencing such transformational
leadership (Barnett, Marsh, Craven, 2005). The transformational leader develops a
widely shared vision with the school and builds a consensus regarding school goals and
expectations, provides individualized support and intellectual stimulation within a
collaborative culture (Fernandez, Jantzi, & Leithwood, 1993)
Significance of the Study
This study was designed to examine the influence of leadership style on student
achievement as perceived by teachers. The body of research was supplemented with data
reporting the impact of leadership style on school capacity and student learning gains.
Teacher variables of gender, age, experience as a teacher and experience under the
current school principal were examined. Programs for the professional development of
18
seated principals and courses for aspiring principals may include curriculum that
enhances the leadership style effect on student achievement.
Organization of the Study
This study is organized into five chapters. Chapter One introduced the study and
presented the reason for the research and the research questions of the study. Chapter
Two introduces the relevant literature regarding leadership styles and student learning
gains. Chapter Three describes the methodology used to investigate how leadership styles
influence teachers and ultimately student achievement. Chapter Four lists the data and
outlines the findings and the analysis of the data. Chapter Five provides a summary of the
results and discusses the significance of the data while providing recommendations for
future studies on how leadership styles influence student achievement.
19
Chapter Two
Literature Review
Over the past decade school-based leadership accountability has assumed
increased importance. The principal’s role as a school manager has shifted toward a
direct responsibility for classroom results as measured by student academic improvement.
In turn, school leaders are obligated to positively influence the school’s capacity to raise
student learning gains. It is this paradigm shift that generates a school wide need to focus
on school improvement. Teachers experience direct contact with students and control
over content and the climate of the classroom (King & Newmann, 2001). Consequently,
administrators must seek methods to raise student achievement by building school
capacity through their leadership influence.
Purpose
It is the purpose of this chapter to review the literature exploring the effects of
leadership styles on school capacity and the impact on student learning gains. The
conceptual framework is seen through the lens of situational leadership theory and
transformational and transactional leadership styles. Newmann, King and Youngs (2000)
define school capacity as the collective power of a school staff to increase student

20
learning gains. Teacher capacity is defined as the teacher’s belief in their own ability to
raise student learning gains as influenced by their administrators (Bredson, 2005).
For the purpose of this research study, teacher-focused leadership is defined as the
decisions and actions of school-based leaders who in directing their organization and
curricular decisions, impact the effect of teacher capacity on student learning gains. The
researcher contends that school leaders select leadership styles to carry out school
directives. The style of leadership influences school capacity. Teachers react to
leadership styles through the decisions they make in the classroom. An effective school
leader selects the leadership style that positively influences school capacity to ultimately
increase student learning gains.
The content of this literature review is the examination of the relationship
between leadership style, school capacity and student achievement. An analysis of the
literature discusses the relationship between transformational and transactional leadership
styles and the school’s reaction to the style. The review then examines how principals
build school capacity through organizational decisions and actions. Lastly, the elements
of principal behaviors that build school capacity to advance student learning gains are
studied. These elements include the school culture, principal role modeling and
leadership decisions.

21
Conceptual Framework
The postpositivism philosophical paradigm supports the use of situational
leadership theory in the conceptual framework of this review to help define the
elusiveness of leadership. Postpositivism philosophy suggests teacher realities are based
on their personal experiences (Knipp & Mackenzie, 2006). Situational leadership theory
is part of the conceptual framework as seen through the lens of postpositivism. This
philosophical paradigm supports the need for leaders to know how teachers define reality
in the school culture. Authentic leadership is determined by the followers, not the leaders
(Bhindi, Hansen, Rall, Riley, & Smith, 2008). With this knowledge, a school leader can
take actions to impact school capacity which in turn, may result in student learning gains.
What follows is research on situational leadership theory as applied to
transformational and transactional leadership styles. Effective leadership is determined by
the selection of the leadership style appropriate to the needs of the followers. School
capacity is impacted by the style of leadership. Student learning gains are a result of
school capacity, teacher capacity and teacher-focused leadership within the conceptual
framework of situational leadership theory.
22
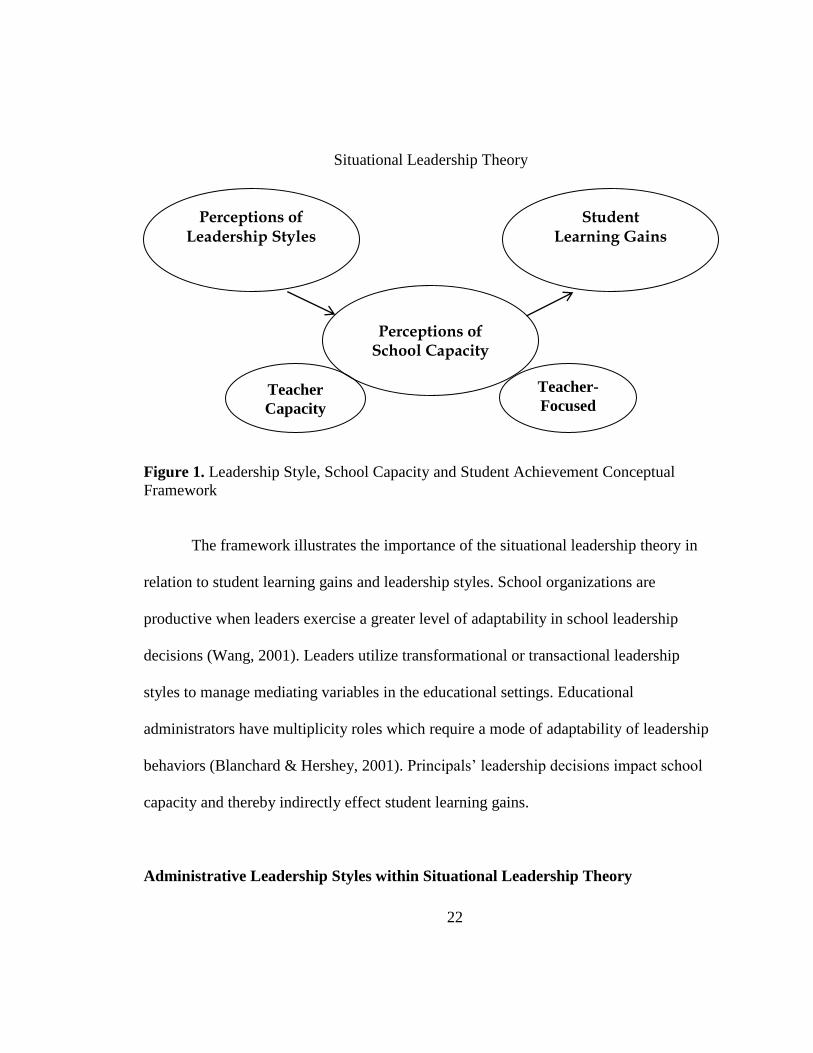
Situational Leadership Theory
Figure 1. Leadership Style, School Capacity and Student Achievement Conceptual
Framework
The framework illustrates the importance of the situational leadership theory in
relation to student learning gains and leadership styles. School organizations are
productive when leaders exercise a greater level of adaptability in school leadership
decisions (Wang, 2001). Leaders utilize transformational or transactional leadership
styles to manage mediating variables in the educational settings. Educational
administrators have multiplicity roles which require a mode of adaptability of leadership
behaviors (Blanchard & Hershey, 2001). Principals’ leadership decisions impact school
capacity and thereby indirectly effect student learning gains.
Administrative Leadership Styles within Situational Leadership Theory
Perceptions of Leadership Styles
Student Learning Gains
Perceptions of School Capacity
Teacher-
Focused Teacher
Capacity
23
The administrative role is essential in improving student learning gains through
leadership style and school capacity. As reported in the literature, school leadership
drives student learning gains while purposely providing society with independent and
enlightened adults (Moos, Krejsler & Koford, 2008). Lazaridou (2006) found leadership
strategies directing improvement must be relevant to the school culture and addressed
through appropriate leadership actions. The literature reviewed within the conceptual
framework of situational leadership theory explored studies of administrative behaviors
within two leadership styles: transformational and transactional leadership styles. Each
style is presented as it relates to a teacher-focused principal’s decisions that recognize
school capacity and its effect on student learning gains.
Situational leadership theory. In this section a review of the synthesis of
leadership styles defined as situational theory was conducted to illustrate the flexibility of
the principal’s choices. The use of a combination of leadership styles creates a myriad of
tools for the leader. Situational leadership theory presents the principal with the
transformational and transactional tools to proceed in the best interest of the school that is
focused on teacher effectiveness (Blase & Blase, 1999). Teacher relationships with
administrators are of low consideration until an internal change is implemented which
requires authoritative monitoring and accountability (Blanchard & Hersey, 1979). As
purveyors of situational leadership, Blanchard & Hersey depict situational leadership as
less dependent on the level of management and more dependent on the maturity of the
teachers supervised.
24
On the contrary, the acceptance of leadership behavior flexibility that coincides
with the situation is accepted as a theory, yet countered as a practice due to the
dependence on the maturity of the subordinate. A study of Blanchard & Hersey’s
research reveals their prescriptive model of measurement of leadership style is
conceptually ambiguous. It does not accurately measure the correlation between the
maturity of the subordinate and the task-relevant maturity of high performance initiated
by the leadership (Graeff, 1983).
Teacher perception of school leadership as researched by Blase and Blase is
determined by the situation presented. Their 1999 qualitative study focused on the
analysis of the administrative leadership styles as related to teacher perception. Their
pragmatic presentation of analytical data leads the reader toward an understanding of the
role of the principal in a teacher-focused school environment. This study of more than
800 teachers throughout the United States found the situational strategies used by
principals often reveal exemplary instructional leadership (Blase & Blase, 1999). Their
open-ended questionnaire provided a platform for teachers to express details of their
opinions on how a principal’s actions helped or hindered their professional goals.
Hallinger and Heck presented a caution present in situational leadership theory
through their findings in a meta-analysis of 42 studies. Only after the principal establishes
a culture of accountability and control, should the level of engagement change toward the
transfer of leadership (Hallinger & Heck, 1998). Nevertheless, the authors found no
25
positive results in a school leaders push for increasing student achievement without
seeking to improve teacher capacity.
Within leadership literature the laissez-faire leadership style is the least effective
style of leadership when comparing it with transformational and transactional leadership
styles (Barnett, Marsh, Craven, 2005). The avoidance or delaying of important decisions
coupled with the attitude of acceptance of no change defines a laissez-faire leader
(Avolio & Bass, 2005). Laissez-faire leadership style predictably held the most negative
effect on the teachers’ perceptions of global satisfaction of leadership. Teachers have a
desire to be led by their school leaders (Barnett, Marsh, Craven, 2005). Teachers who are
abandoned to teach independently without knowledge or accountability to the school’s
mission experience a negative perception of their leader. Glover (2007) encourages the
capitalization of strategies to actively engage teachers and to avoid a laissez-faire attitude
through active listening, respect, the suspension of assumptions, and relating personal
truths.
Transformational leadership style. This section of the literature review
examined transformational leadership in relation to school capacity and student learning
gains. The transformational leadership style produces an outcome that defines the
management culture. As the originator of transformational leadership, Burns reported
there was not a central leadership concept even with the abundance of relevant literature.
Generalizations are only possible through the study of humanistic psychology (Burns,
1978). In transformational leadership, the leader motivates and educates subordinates
26
toward making decisions without interaction with supervisors. Followers experience a
higher level of self-efficacy when experiencing such transformational leadership (Barnett,
Craven & Marsh, 2005).
Leithwood’s research reported that transformational leaders pursue three goals:
helping staff collaborate, encouraging teachers’ improvement, and helping staff solve
problems effectively. Such practices were complementary to the leader’s vision and the
teachers’ talents and are essential to conduct a school’s daily operations (Leithwood,
1992). As a contrary response, Leithwood’s suggestions for improving school leadership
have resulted in little evidence of improving leadership quality. However, Stewart finds
Leithwood’s research has expanded the knowledge base within our epistemological views
and emerging paradigms. (Stewart, 2006)
In an attempt to develop a theoretical account of how a teacher’s perception of
transformational leadership is formed, Janzi and Leithwood conducted a viable five-year
qualitative study with over 3,000 participants. These authors found being seen as a leader
is as important as making leadership decisions. The leader exhibits leadership
characteristics with their everyday behaviors and practices (Burke, 2009). More
importantly, the study found that want-to-be leaders should model leadership traits to
gain leadership credibility and influence teacher perceptions of their leadership capability
(Janzi & Leithwood, 1996).
The state of education’s accountability system influences the emergence of shared
leadership. Principals who actively listened to their followers to gain different

27
perspectives of school improvement were significantly more successful due to
collaboration. Demir and Kamile (2008) collected data from 218 teachers in Edirne,
Turkey and used a five-point Likert scale to quantitatively measure the teacher’s
perception of transformational leadership, collective efficacy, self-efficacy and
collaboration climate. The findings suggested transformational leadership contributes to
teachers’ self-efficacy (Demir & Kamile, 2008).
The supportive literature in the previous paragraphs is contradicted by studies
indicating transformational leadership cannot stand on its own without a blend of
effective instructional leadership. Teachers in productive schools have leaders who insist
their decisions have an educational meaning. Such focus on teacher and student success
allows the principal to model a positive attitude to teachers prior to implementing
transformational leadership (Marks & Printy, 2003). A national quantitative study of
teachers in 24 nationally selected restructured schools found that the transformational
leader insisted on higher levels of commitment from the teachers and developed a culture
and organization toward school improvement (Marks & Printy, 2003).
Leithwood (1992) argued transformational leadership starts a collaborative
practice but defeats the need for a principal to be an instructional leadership. The author
claimed school leaders needed to focus on the delegation of power to make the most
changes in student achievement (Leithwood, 1992). Such group organization and
collaboration builds school capacity.
28
Marks and Printy counter Leithwood’s research and declared that
transformational leadership was necessary for schools in need of improvement and
reform. The authors declared there are few studies which empirically study how
transformational leadership and instructional leadership overlap to raise student learning
gains. Teacher-focused instructional leadership is necessary in schools to present a
collaborative and trusting environment. Teachers exhibit more professionalism and
commitment to the organization if the leadership duties are shared (Marks & Printy,
2003, Burke, 2009).
Student learning gains are the final result of the leadership style. A review of the
literature on the effects of transformational leadership on student learning gains found
this style created an innovative staff, but no increase in student achievement. The
findings indicated transformational leadership decisions look different than transactional
decisions and have an indirect impact on student achievement outcomes (Hallinger &
Heck, 1998). This qualitative meta-analysis of 40 published articles between 1980 and
1995 found no universal paradigms for examining the leadership’s organizational
behaviors within a school. The studies were selected based on their inclusion of the
examination of the principal’s beliefs and included a measurement of school achievement
data. However, a more current quantitative analysis of the types of leadership within
three high-poverty urban elementary schools in New York State, explores the
ramifications of transformational leadership on their school test scores. The achievement
scores improved after the outgoing principals were replaced with principals who
29
incorporated a form of transformational as well as transactional leadership styles. Each
principal modeled high expectations. Transactional leadership led to limited
empowerment of the staff to make decisions to improve student achievement (Brooks,
Giles, Jacobson, Johnson, Ylimaki, 2007).
As a warning to leaders, Leithwood and Mascall’s 2008 study focused on this risk
of creating a transformational style of leadership that negatively influences student
learning gains. These authors exposed the arguments against a style relating to an
unrealistic need to coordinate active teacher-leaders. Transformational leadership style
can lead to hints of anarchy from teachers. The unrealistic time demands on over-worked
teachers who accept the collective responsibilities of leadership may eventually lead to
negative perceptions of administration and negative self-efficacy (Leithwood & Mascall,
2008).
As a caution, Barnett, Craven and Marsh (2005) advised that distributive or
transformational leadership style is welcome within a school but only as a limited
strategy closely followed by the more traditional hierarchal leadership. The end result of
the leadership style preferred by teachers is transactional. These authors theorized that
teachers respond most favorably to the principal’s personalized attention and less to a
transformational style of leadership (Barnett, Craven & Marsh, 2005).
Transactional leadership style. Transactional leadership style takes place when
a leader communicates specific standards of conformity while monitoring for deviance
and rewarding compliance (Avolio, Bass, Berson, & Jung, 2003). A review of the
30
literature studying transactional leadership reveals frequent comparisons to
transformational leadership (Burns, 2003). Transactional leadership style promotes
followers to recognize what needs to be done and gives them the authority to complete
tasks thereby enhancing their self-efficacy. Leithwood (1992) cautioned that though
transactional leadership builds school capacity, it does not have the critical push of
transformational leadership to make extreme school improvements.
A more recent study, with students as subjects, researched transactional leadership
as it applied to collaborations between students and teachers. The transactional style
created a more effective learning environment for students as they explored the influence
and impact on combining school personnel and students in leadership roles. The 2,570
written samples were gathered from teachers and students at 90 elementary and
secondary schools over a three-year period. Data were collected through websites and
analyzed using a path-analytic technique. The results provided a viable quantitative data
set that determined the impact of transactional leadership opportunities within a school
raise and student achievement (Leithwood & Mascall, 2008).
Two foundational themes claim positive teacher response to transactional
leadership style. The first theme provides teachers with consistent and frequent
opportunities to reflect on their experiences in the classroom. The findings from a
qualitative study of more than 800 teachers surveyed through an open-ended
questionnaire indicated principals who built up their teachers’ reflective behaviors found
the instructional staff reported a high degree of self-efficacy, sense of security, and self
31
motivation (Blase & Blase, 1999). The second theme found positive results from teachers
who were provided constant professional growth activities. Such collegial interaction
with respect to better teaching methods, data exploration, and implementing action
research created a positive professional growth atmosphere within the school.
Additionally, the study found the second theme also helped encourage reflective teacher
behavior and higher self-efficacy (Blase & Blase, 1999).
Furthermore, a 2007 study claimed the use of transactional leadership is necessary
due to the demands of the No Child Left Behind Act for accountability. School capacity
is even more important due to the excessive administrative responsibilities that have led
to more collective site-based management (Brooks, Giles Jacobson, Johnson, & Ylimaki,
2007). Leadership pressures are leveraged into using staff with expertise on school
improvement and program implementation.
Regardless of the demands of the No Child Left Behind Act, school leaders
frequently lack the instructional knowledge of content and pedagogy to assist teachers
and provide a transactional leadership environment. There is a daily balancing act
diverting the principal’s attention from the management of the school. These
administrative issues often distract the leader from creating a system to lead others in
areas of curriculum and pedagogy (Stewart, 2006)
This section of the literature review addressed transformational and transactional
leadership styles through the lens of situational leadership theory. The introduction
defined transformational and transactional leadership styles as the types of decisions

32
made by school-based leaders who seek to positively impact school capacity and student
learning gains. The following sections review the literature to analyze how leadership
style influences the success of a school through the elements of leadership that build
school capacity.
Building School Capacity through Leadership Styles
The past decade of accountability accelerated by No Child Left Behind (2001) has
held educational leaders responsible for school improvement strategies directed toward
improving student learning gains. School leaders are called upon to use school-based
decision making to increase student learning gains through school capacity (Bredeson,
2005, Burke, 2009). The question is how can teacher-focused school leaders raise student
learning outcomes through the building of teacher capacity as well as school capacity?
School leadership has a direct effect on teacher behavior and classroom practices
(Alt, Beltranena, & Hoachlander, 2001). The effects of school leadership on student
learning gains were studied in a quantitative meta-analysis on 37 research studies
published between 1986 and 1996. The authors found an association between individual
leadership behaviors and the school culture. The study found a negative relationship
when principals focused only on student learning gains and not in conjunction with
teacher improvement. This positive reciprocal relationship between teachers and
administrators effected student achievement (Bosker, Kruger, & Witziers, 2003).
33
Leaders build teacher capacity by involving teachers in school improvement
decisions. To link teacher empowerment with school capacity, Marks and Louis (1999)
gathered data for a mixed-methods study from 24 schools equally distributed between
elementary, middle and high schools that were under mandated restructuring. Their
survey of 910 teachers reported that empowerment is a factor in the determination of a
school’s capacity for organizational learning which ultimately affects student learning
gains. Through an analysis using a hierarchical linear model, these findings encourage a
collaborative decision-making body that determines school-wide actions on school
improvement (Marks & Louis, 1999).
School success through school capacity involves leadership decisions that include
teachers in the process of problem-solving. The schools in which teachers collaborate in
problem-solving to aid student success have an influence on student outcomes and how
teachers meet student needs (King & Newmann, 2001). An international study explored
the problem-solving school culture presented in the leadership interactions with teachers.
The study published case-studies of eight different countries and determined school
systems that include teacher input can impact student achievement. A successful leader
creates the problem-solving school culture that reflects a school-wide belief system in the
school goals (Koford, Krejsler & Moos, 2008).
Building school capacity is a challenge in an era of the standardization of
curriculum and student testing. Teachers are individually accountable for higher student
achievement with fewer resources (Burke, 2009). A four year longitudinal qualitative
34
study of two urban secondary schools reported the negative impact of educational
mandates on teachers who were asked to produce higher learning gains without an
increase in resources. The participants reported that innovative schools who raise teacher
activism build school capacity by reaching out to defeat unwanted standardization (Giles,
2007). The author advised leaders to build school capacity through teacher collaboration
and empowerment that challenged the outside influences of school practices driven by
standardized tests.
Blase and Blase (2002) provided an argument for the importance of principals to
gain the trust of their teachers to build school capacity. Their qualitative study of ten
principals and 50 teachers used a grounded theory method to focus on leadership’s
mistreatment of staff in an attempt to garner school success. Their findings stressed the
importance of the principal’s role in creating a culture for open, honest, and reflective
exchanges between leaders and teachers (Blase & Blase, 2002). Further support for a
“trust” component in effective leadership was researched in a qualitative study of 25
Canadian principals, hand-selected by their superintendents, to determine the value of
personal interactions with principals. It is worth noting that the authors concluded that a
principal can only raise the trust and openness of their school by achieving trust outside
ordinary school conversations. These exchanges include sharing information related to
family, travel, and other personal issues (Kutsyuruba, Noonan, & Walker 2008). The
teacher-focused leader can create a trusting work culture by enhancing the school’s
capacity to meet the needs of their students.
35
As indicated in this section of the literature review, research frequently focused
on the impact of school-based leadership decisions that affect school capacity and student
learning gains. Good leadership advances beyond knowing the actions to take in raising
student achievement and toward knowing when and why to take action. This balance of
leadership indicated when and why a leader should take action and that a leader should
make a change while still protecting the schools culture and vision (Marzano, McNulty,
& Waters, 2003). The next section of this review explores the principal decision making
that builds school capacity with the inclusion of the elements of school culture, leadership
role modeling, and leadership decisions.
Elements of teacher-focused principal behaviors that build teacher capacity.
There is broad perspective that principals have a powerful influence on teacher
actions and student academic achievement (Darling-Hammond, Davis, LaPointe, and
Meyerson, 2005). The first element that builds teacher capacity through teacher-focused
leadership is the establishment of a positive school culture. School leaders are responsible
for creating a work culture without roadblocks to student engagement and without
interference in the building of teacher capacity (Bason & Frase, 2004). Second, the
modeling of expectations by school leadership builds teacher capacity (Brooks, Giles,
Jacobson, Johnson, Yimaki, 2007). The last element builds teacher capacity through the
impact of the teacher’s perception of leadership decisions (Noonan & Walker, 2008,
O’Donnell & White, 2005).

36
School capacity and teacher capacity. School leaders are the driving force of
sustainable education reforms (Fullan, 2002). School capacity is the first element of
building teacher capacity through leadership style. Principals who make teacher support,
and not authority, a center of their campus culture build leadership capacity among the
instructional staff resulting in eventual student learning gains (Williams, 2006). There
must be a link between a common purpose of educators and principal decisions to avoid
the “managerialism” stress on procedures and not students (Bush, 2007, p. 393). An
improving school with quality leadership exhibit traits that include good communication,
high expectations of staff and students, plus a focus on raising student achievement
(Bruner, 1997).
A culture of leadership support influences school capacity. School culture is not
accidental, but intentionally developed by the leadership (Smith, 2008). Four strategies
for influencing school capacity were found as a result of a focus-group and interview
study designed to examine the teacher perceptions of school policies. Using a nested case
study design of multi-levels, the principals in the study identified four effective strategies.
First, the staff was appreciated through an award ceremony. Second, a hospitality
committee honored the birthday and significant event of each staff member. Third,
classroom management systems were created to give student discipline to the
administrative team. Last, teachers were given common planning times to integrate
instruction. This qualitative study found that teachers met leadership expectations when
they perceived that they worked in a culture of support and value (Rice & Roelike, 2008).
37
Teachers in a culture established by a teacher-focused leader participate in the
school wide decisions as expected under a transactional style of leadership. The Director
of the Center for Teacher Leadership at Virginia Commonwealth at the University School
of Education, Terry Dozier, recommended consulting with teachers on school issues.
Culture building started with the inclusion of teacher experts in training as well as the
process of school improvement (Dozier, 2007). Both administrators and teachers need to
see themselves as learners to create a culture that is likely to create the best choices for
students (LSS, 2002).
The literature suggested that teachers perceive their leaders as supportive when
they are given opportunities to collaborate. Through a mixed-methods case study design
involving two years of data collection, Camacho and Eilers (2007) found links between
the principal’s leadership style and the school’s involvement in collaborative learning.
Professional learning communities created a culture of trust by offering a chance to
consult with other teachers. These purposeful meetings were most effective when there
was an established routine of collaborative discussion (Huebner, 2009). Conversely,
teachers who considered themselves abused by the administration had a low overall
involvement in collaborative opportunities (Blase & Blase, 2002).
A controversial finding from a quantitative mixed-methods study of 52 schools in
Australia found that a visionary leadership style of principals had no statistically
significant relation to building a positive school culture. Their results implied that the
vision of a principal is less significant than each teacher’s opinion of their leader. The
38
authors found that teachers want a leader who validated their efforts and cared about
them as individuals. The teachers wanted their principal present and confident in decision
making when important issues arise (Barnett, Craven & Marsh, 2002).
Principal role modeling to build school capacity. As the second element of
building school capacity through leadership style, recent studies explored the impact of
professional role modeling. Fulelan (2001) claims principals who affect change see the
big picture and model energy, enthusiasm, and hope. Leadership role modeling provides
staff and students with motivation to continue to support leadership initiatives (Alt,
Beltranena & Hoachlander, 2001). A 2007 research study involving case studies
conducted at the University of Buffalo, State University of New York, found student
achievement scores improved as a result of the arrival of new principals at 3 elementary
schools. Each leader built school capacity by making decisions that produced immediate
change based on a transformational leadership style. The findings suggested each leader
focused on safe learning environments, high behavior and attitude expectations, and
accountability. Role modeling was an important component in building capacity and
making these changes (Brooks, Giles, Jacobson, Johnson, Yimaki, 2007).
Principals are committed to raising school improvement through their actions
(Leithwood and Riehl, 2005). A principal’s daily actions impact staff perspectives of the
school’s leadership. A study found the modeling of effective actions that reflected
instructional leadership knowledge had an influence on the teachers overall perspective
of the school culture. This qualitative study included the perceptions of over 800 teachers
39
and how their school leadership influenced their classroom instruction as enhancing or
diminishing school improvement (Blase & Blase, 1999).
In a study of 8 countries that participated in the International Successful School
Principal Project (ISSPP), the authors found a tight system creates a tendency for
principals to focus on “telling.” Leaders with less structured accountability systems and
active participation in every day school functions focus on the power of “selling”
(Koford, Krejsler & Moos, 2008). The modeling of leadership expectations was
supported in the ISSPP quantitative study using a thematic cross-cutting text analysis to
suggest the need for a loosely structured accountability system. Little logic is present in
holding teachers accountable for elements they cannot control or for leaders to give
direction without communicating and monitoring an effective accountability system
(Ingersoll, 2007).
Leadership consistency impacts the effects of leadership role modeling. A study
exploring the relationship between leadership styles and school climate in 31 elementary
schools found that leaders who consistently modeled their directives improved school
climate. However, this study was limited to small schools in rural settings and the self-
assessments completed by the principals did not relate to the teacher’s analysis of
principal competency. The study referred to this lack of consistency in leadership as a
“blind spot” in management. Any inconsistency among discipline procedures,
communication or delegated projects is noticed immediately by teachers (Daugherty,
Kelley, Thornton, 2005).

40
Leadership decisions and building school capacity. As the third element of
building school capacity through leadership style, this section reviews literature which
ties leadership choices with the leadership styles within the framework of school
capacity. The focus is primarily on studies and articles related to the teachers’ reactions
to the principals’ leadership choices. Success in motivating teachers depends on how
leaders gauge the magnitude of their requests and if they can adapt their leadership
strategies appropriately (Marzano, McNulty & Waters, 2003, Gray & Ross 2006).
Teacher self-efficacy within the school culture has a direct relationship to the
principal’s actions. The type of leadership which leads to high teacher self-efficacy was
studied in a mixed methods design by the SELF Research Centre in Sydney, Australia.
The quantitative phase of the study surveyed 458 secondary teachers and 49 principals at
52 schools throughout New South Wales. It was evaluated through a multilevel modeling
analysis to determine the relationship between principal leadership styles and teacher
self-efficacy. The results gathered from the Multifactor Leadership Questionnaire and the
School Learning Environment Questionnaire determined that between transformational
and transactional leadership styles, it was the transactional style that had the most
positive effect on teacher self-efficacy. The researchers found the teachers wanted to be
led by a principal who affirms their belief system and supports them professionally
(Barnett, Craven & Marsh 2005).
The qualitative phase of the study found that of the 52 schools surveyed, teacher
capacity was centered on the leadership’s acknowledgement of teacher opinions and
41
efforts. The teachers indicated their highest displeasure with extrinsic factors, such as an
increasing workload, pacing of the curriculum, and low public views of the education
profession. The authors concluded that the teachers’ perception of their leadership was
based on the principal’s individualized considerations and not the principal’s visionary
directives (Barnett, Craven & Marsh 2005). School leaders who are aware that teacher
self-efficacy is positively impacted by a feeling of partnership will include teachers in a
variety of decision making. Such transactional leadership supports the acknowledgement
of teacher opinions and allows teachers to be involved in the decisions that affect their
professional (Koford, Krejsler & Moos, 2008).
A meta-analysis of linkage research helped school leaders define the importance
of the teacher in a school as opposed to the importance of student achievement. This
business-oriented study reported that linkage research emphasizes the importance of the
internal string of day to day business decisions as opposed to the importance of the end
product. Organizations with the highest positive outcomes supported workers throughout
the decision making process. Similar practices are applicable by principals in the support
of teachers sustaining high self-efficacy. The authors noted that such internalization of
this model calls for reflection on the communication systems within the work
environment as well as an open culture of attitudes created by the management (Brooks,
Dietz, Pugh & Wiley 2002).
Teacher resources include time, administrative information, teaching assignment,
duty assignment, acknowledgement, and materials. Effective principals, like experts in
42
business-related fields, take time to distribute resources through a pragmatic process that
is perceived as equitable (Lazaridou, 2006). School leaders who align their resource
priorities through a teacher-focused lens know which policies, practices, resources, and
incentives to promote among their staff to raise overall school capacity.
A study addressing the principal’s selection of teacher models to drive their
instructional leadership programs suggested teachers thought such practices were
detrimental to teachers and school culture. This 2008 article reported how teacher leaders
contradicted the school hierarchy and caused stress within a school. The study explored
teacher views on how establishing their identity as a teacher leader forces them into
working outside their contracted duties. The study found the school capacity and core
goals impacted the positive or negative outcome of how teacher leaders improved the
school system (Fitzgerald & Gunter, 2008).
Principal actions perceived as negative toward teachers resulted in a lower quality
of instruction and a lack of student engagement. Blase and Blase (2002) surveyed 50
teachers in a qualitative study that reported their feelings as paranoid, stressful, insecure,
and fearful due to principal actions. This negative perception of the leadership caused
harmful outcomes in the professional and personal lives of staff. Curiously, the research
found the teachers suffering the most professional abuse were the most competent veteran
teachers. The authors surmised the administration may have felt threatened by the
advanced teachers’ curriculum knowledge (Blase & Blase, 2002).

43
A principal’s leadership style is a powerful agent of change that influences school
capacity and impacts student learning gains (Marks & Printy, 2003). The studies included
in this section of the literature review provide evidence of critical principal decisions
made by the principals who build school capacity through the inclusion of the three
elements of school culture, leadership role modeling, and leadership decisions. The
following literature explores the ultimate impact of leadership style and school capacity
on student learning gains.
Leadership Style and School Capacity impacts Student Learning Gains
Leadership style correlates with teacher absences in determining a leader’s impact
on student learning gains. The results of a recent study indicated schools with weak
leadership had a negative school capacity, teachers with low self-efficacy, and lower
student achievement. Electronic data was gathered and analyzed from 106 schools over 4
years from 130,747 absences taken by 5,189 teachers in the northern states. Absences that
were discretionary, or optional, comprised of fifty-six percent of the total absences. The
author found teacher-focused actions improved the accountability of the staff and led to
higher students’ learning gains. Miller (2008) recommended effective principals
implement local policies to dissuade absences and reward exemplary attendance.
Higher teacher perceptions of principal leadership lead to higher student
achievement according to a quantitative correlational Pennsylvania study of 325
randomly selected middle school educators. Hallinger’s Principal Instructional

44
Management Scale (1987) assessed the teacher and principal responses related to the
importance of the school mission, management of pedagogy, and the promotion of a
learning environment. The study found a significant relationship between how teachers
perceive a principal’s promotion of the school learning climate and student learning gains
in math and reading (O’Donnell & White, 2008).
The teachers’ perception of their leader’s desire to create a positive school culture
can lead to high student learning gains (Rice & Roelike, 2008). This qualitative nested
case study design of Rice and Roelike (2008) explored teacher perceptions of leadership
decisions as influenced by the mandates required through the No Child Left Behind Act.
The small sample of 111 veteran teachers in three states reported that their school
leadership should hold all teachers accountable for their classroom actions regardless of
national policy. Additionally, the teachers recommended that incentives to excel should
come from within the school and not from the national or the district level (Rice &
Roelike, 2008). Such opinions support the actions of an effective selection of leadership
style as opposed to depending on a district, state or national program to increase student
achievement.
Student learning gains are lowered when the quality of instruction collapses from
the teachers’ perception of mistreatment from school leaders who are not teacher-
focused. A study using a mixed-methods design of fifty teachers found poor leadership
caused emotional low self-efficacy self-doubt, insecurity, fear, dread and paranoia. The
non teacher-focused leadership in these schools was described as autocratic and
45
tyrannical with an overt, directive style. The data reported principals employed a wide
variety of actions against targeted teachers ranging from innuendos to extreme aggression
(Blase & Blase, 2002).
Leadership styles and student learning gains. Leadership style was strongly
correlated with student learning gains through a style of integrated or transactional
leadership (Marks & Printy, 2003). Teachers benefited from a distribution of power that
gives them a voice in school wide decisions (Ingersoll, 2007). Marks and Printy (2003)
used a mixed-method designed study of 910 teacher surveys from 24 schools with
multiple grade levels and found that student achievement was at its highest when quality
pedagogy resulted from integrated leadership. These authors claim that sharing leadership
responsibilities enhanced student achievement and caused less burnout in the
principalship (Marks & Printy, 2003). Actual actions of the principal with the teachers
were not explored.
Leithwood and Mascall’s (2008) quantitative study found collective or
transactional leadership has an impact on student learning gains. Schools with high
student achievement experienced a higher degree of leadership roles of teachers, parents
and students. The authors analyzed 2,570 teacher surveys from 90 schools to find
motivation was highest when administration shares leadership roles with teachers who
give input on school improvement. On the contrary, this phenomenon could be dependent
on a variable other than collective leadership. The authors found students with high
achievement may experience more active parents throughout their school years in
46
addition to their willingness to participate in school leadership opportunities (Leithwood
& Mascall, 2008).
A leader’s attempt at transformational or transactional leadership can cause a
negative impact on teachers and student achievement. In a three-year quantitative study
of 2,570 teachers in 90 elementary and secondary schools the teachers were promised,
but noticed few changes toward, shared school leadership. The data was analyzed using a
path-analytic technique which provided data indicating teachers viewed the promise of
shared leadership as rhetoric and not a reality when their leaders seek the appearance of
change more than actually changing (Leithwood & Mascall, 2008). The results of this
study were unfortunate because schools are conveniently set up for collaboration with
interconnected committees, grade level and cross-grade level teaming opportunities and
shared planning time. Principals have access to meet their teacher’s collaborative needs
to make quality conversations possible which could lead to student learning gains
(Koford, Krejsler & Moos, 2008).
A leadership style that includes daily visibility and frequent direct teacher contact
impacts the motivation of teachers and students and builds school capacity. A
quantitative study using a stratified random sampling procedure to select 180 schools in
nine states focused on the teacher’s perception of the leadership and the flexible
conditions of a school. Teacher responses to the survey were analyzed using Pearson
product correlations, standard multiple regression, hierarchical multiple regression, and a
t-test. The results indicated the extent of these perceptions determined the willingness of
47
the teacher to be led by their principal (Janzi & Leithwood, 1996). Janzi and Leithwood
(1996) found three implications as a result of their study. First, the most powerful
strategy to drive teacher actions was principal visibility while carrying out actions toward
increasing student achievement. Second, opportunities to directly lead individual teachers
must be set up to encourage high self-efficacy relationships. Last, policies which require
the movement of school leaders from school to school inhibit the creation of relationships
needed to influence school success (Janzi & Leithwood, 1996).
School capacity and student learning gains. School capacity has been defined
as the staff’s belief in their own ability to raise student learning gains as influenced by
their administrators. Many studies have been designed to explore how teacher and other
staff perceptions affect student learning gains. One such study by Wayne Hoy and Anita
Woolfolk (1993) examined the relationship between teacher self-efficacy and school
capacity. Their findings from 179 teachers in 37 schools in New Jersey indicated school
capacity positively influences student achievement only when teachers perceive
themselves as supported by the administration. The authors warned that principals need
to protect the teachers from demands outside their schools, such as unreasonable district
expectations (Hoy & Woolfolk, 1993).
School leaders can have a negative impact on student learning gains if they
miscalculate the magnitude of their requests on teachers. Leaders were ineffective when
they inaccurately identified the need for changes to improve student achievement. These
results were from a meta-analysis conducted through McREL using a balanced leadership

48
framework to determine the negative and positive impact of leadership decisions on
student achievement (Marzano, McNulty & Waters, 2003). Thirty years of research
studies were compiled to determine the effect of leadership practices on student learning
gains. The authors criticized the lack of large sample sizes within the published studies
and the limited quantitative data as theoretical without the needed empirical evidence to
produce practical guidance for leadership improvement (Marzano, McNulty & Waters,
2003).
The measurement of teacher-efficacy and student learning gains are subjective.
Hoy, Hoy and Tschannen-Moren, (1998) found that three decades of teacher-efficacy
research presented limitations in its use as a measurement for leadership and student
success. Efficacy is altered with the introduction of novel tasks, a change of environment,
and self-perception. The measurement of teacher self-efficacy is influenced by the years
of experience, peer attitudes and forced changes in teacher assignments or curriculum.
The authors determined only a longitudinal teacher self-efficacy study is viable (Hoy,
Hoy & Tschannen-Moren, 1998).
The elements of school capacity and student learning gains. As illustrated in
this review’s conceptual framework, student learning gains are impacted by school
capacity through the elements of school culture, principal role modeling, and leadership
decisions. Brady (2008) found that administrative actions or inactions indirectly impacted
student learning gains, while teachers had a direct impact on student learning gains. In an
attempt to develop a model of effective school culture, Brady (2008) conducted an

49
analysis of literature and found school cultures are influenced by a framework of the
leader’s communicated vision and mission. Good schools depend on the creation of a
culture where teachers have the capacity needed to change their actions to improve
student achievement (Alsaker, Kallestad & Olweus, 1998).
School capacity is created by a principal who monitors his or her actions to insure
student learning gains. A random voluntary sample of 100 teachers with less than ten
years of classroom experience was surveyed to determine the possible reason for leaving
the teaching profession. Two-thirds of the teachers agreed that a lack of professional
respect would cause them to exit the classroom (Inman & Marlow, 2004). Observant
principals canvass their campuses for teacher dissent and seek to create the culture
needed for positive changes that increase student learning gains. Leaders should
encourage a career ladder by using their professional insight of the individual teacher’s
intrinsic motivation for a change in assignment, entrance into leadership, or even
retirement (Hardman, 2006).
The principal’s ability to encourage teachers to reflect on their own abilities is a
contributing factor to higher student achievement. A qualitative study limited to middle
schools conducted by O’Donnell and White (2005) included 75 principals and 250
teachers. These authors found that principals who helped teachers identify their own
weaknesses related to the learning environment increased their students’ achievement.
Principals in schools with high poverty who modeled and repeated high expectations
experienced high student learning gains (O’Donnell & White, 2005).
50
An effective leader impacts student learning gains by making decisions that
encourage school capacity through a collaborative school environment. Goddard, Hoy,
and Woolfolk (2004) reported that collective teacher efficacy provided opportunities for a
positive impact on student learning gains after studying both teachers and students in 47
elementary schools. Their data revealed a positive correlation between student
achievement and schools with a positive collective teacher efficacy (Goddard, Hoy, &
Woolfolk, 2004). Achievement rises when teachers believe they are part of a competent
staff with the ability to overcome educational obstacles. School leaders model positive
behavior with their frequency of classroom visits, campus visibility, relevant evaluations
and opportunities for leadership (Basom & Frase, 2004, Louis & Wahlstrom, 2008).
Hallinger and Heck (1998) conducted a meta-analysis of empirical research
articles published between 1980 and 1995 to explore the impact of principal decisions on
student learning gains. The thematic cross-cutting text analysis found case studies
revealed schools as independent communities with contrived value structures and culture.
Their findings indicated a principal must adapt to the condition of a school by making
changes over time that address student outcomes and staff morale. The authors found
flexibility was important in a leader’s decision to increase student achievement by
changing curriculum and pedagogy (Hallinger & Heck, 1998).
A discrepancy was found in the values and teaching practices of teachers when
they were asked to judge the management practices of their principals (MacBeath &
Pedder, 2008). The study included 1,397 teachers in primary and 17 in secondary
51
schools in England who revealed they did not submit to the administration changes even
if they agreed with the value of a school’s vision. The authors proposed a good
articulation between school policy changes and nationally-based mandates would provide
an understanding and consistency in school changes (MacBeath & Pedder, 2008). The
studies reinforce the need for a leadership style that creates a positive school capacity and
accountability within teacher expectations.
Conclusion
As this review has illustrated, a positive correlation was supported between a
leadership style, school capacity and student learning gains. The research selected
represented a sample of the research available to define impact of leadership and its
effectiveness through transformational and transactional leadership styles within the
framework of situational leadership theory. Research revealed the importance of utilizing
the style of leadership which most directly influences school capacity and student
achievement.
Both the conceptual and empirical literature supported the theory that school
capacity that has teachers with high self-efficacy who perceive their leader as teacher-
focused experience higher student learning gains. As the researchers noted, principals’
actions within their schools are an important part of the many dimensions effecting
student achievement. Open communication and the protection of the teacher’s trust in
52
their administration built school capacity (Caltabiano, Graham, Timms, 2006, Glover,
2007, Noonan & Walker, 2008,). Actions by trusted principals are visibility, stabilization,
and delegation of responsibilities (Louis, Mayrowetz, Murphy & Smylie, 2007).
As supported by the literature, a leader’s style impacts the professional choices of
teachers and a school’s learning gains (Daley, Guarino & Santibanez, 2006). The culture
established by school leaders presents teachers with perceptions of leadership that can be
measured through their choice to stay at a school and work toward meeting the needs of
their students (Kelly, 2004). Teachers may support leadership decisions they find
objectionable if their leader is perceived as ethically righteous (Noonan & Walker, 2008).
Effective leadership includes positive instructional suggestions including the
encouragement of reflection and experimental classroom techniques (Blase & Blase,
1999). The social cognitive theory of self-efficacy that leads to a positive teacher capacity
was defined as the teachers’ belief in their own abilities as either self-enhancing or self-
debilitating (Bandura, 2003). Albert Bandura (2003) claimed that reflection is an impetus
for motivation and perseverance through life’s difficulties and choices. School capacity
impacts student achievement when teachers learn self-reflection strategies (Huebner,
2009). Leaders must use a variety of tools to promote teacher reflection and opportunities
to build on professional knowledge that results in a positive school culture (Blase &
Blase, 1999, Lazaridou, 2006).
Within situational leadership theory the leadership styles of the principal, whether
transformational or transactional, directly influence school capacity. As this review has

53
illustrated, teachers are the pivotal factor in orchestrating change toward student
achievement (Demir, 2008). Hoy and Woolfolk (1993) concisely presented the premise
of this research study in their findings indicating that leaders impact a teacher’s belief in
their own ability to teach students through a supportive administration (Hoy & Woolfolk,
1993).The self-efficacy of teachers’ impacts student achievement. The studies examined
through situational leadership theory suggested that principals arrive at their positions
with different styles of leadership. The literature suggested leaders need training and
information on how to conduct research to facilitate more effective decision making
(Christie, Thompson, Whitely, 2009). The flexibility of leadership decisions plus
principal training on how to make the best research-based decisions provides
opportunities to raise student learning gains through their actions. There is a movement
toward a more uniform model of school leadership that is designed to improve student
learning gains (Kofod, Krejsler & Moos, 2008).
Present and future criteria will define effective school-based leadership as related
to the policy demands of the No Child Left Behind Act. Consequently, the high stakes
testing required to measure student learning gains will continue to drive principal
decisions (Johnson & Johnson, 2006). The pressing goal of frequent measurable
academic gains brings out the motivational strategies of leaders to entice teachers to
follow directives. However, school leaders should only implement mandates while
protecting school capacity (Burke, 2009).

54
55
Chapter Three
Research Method
Chapter Three introduces the methodology used to investigate the potential
relationship between school principal leadership style, student achievement and teacher
demographic variables. This study utilized data collected through surveys and the Florida
Department of Education databases. The chapter is organized into the following sections:
the problem and purpose of the study, research questions, research population, design of
the study, design of the instruments, validity and reliability of the instruments, data
collection, data analysis, limitations and delimitations of the study, role of the researcher
and ethical considerations and summary.
Problem and Purpose of the Study
The review of literature on school leadership decisions revealed extensive
evidence of the critical impact of school capacity on student achievement (Blase & Blase,
1999; Koford, et al, 2008, Lazaridou, 2006). School leaders use different styles of
leadership to make decisions that may influence the success of their teachers who in turn
influence student achievement (Barnett, et al; Avolio & Bass, 2005; Blase & Blase,
1999). More research is needed to explore the school wide impact of leadership style on
56
student achievement test results (Demir & Kamile, 2008; Hallinger & Heck, 1998;
Leithwood & Mascall, 2008; Stewart, 2006).
In addition, current pressures to produce higher test scores for every student as
demanded by the federal evaluation of schools have necessitated a study on effective
leadership styles. While a plethora of research is available on education leadership, the
examination of the relationship between the leadership styles of school principals and
their students’ academic performance has not been fully explored. Teacher demographics
including gender, age, years of experience as a teacher and years at their current school
were included as variables. The purpose of this study was to identify the relationship
between the teachers’ perception of their principal’s leadership styles and student
achievement in improving and non-improving schools.
Research Questions
The following research questions guided this dissertation study. The research
questions were developed based on the objectives of the research and previously
published literature.
1. How do teachers perceive the leadership styles of their school principal in improving
and non-improving schools?
2. What is the relationship between transformational, transactional, and passive-
avoidant leadership styles of the school principal as perceived by their teachers
57
and improving and non-improving schools as defined by the achievement of
students as measured by the FCAT over a three year period.
3. What is the relationship between the school principal’s leadership style as perceived by
their teachers on the five transformational, three transactional and one
passive-avoidant leadership scale and student achievement in the improving and
non-improving schools to the FCAT?
4. What is the relationship of teacher gender, age, years of experience as a teacher, and
years of experience at their current school to their perception of the principal’s
leadership style in improving and non-improving schools?
5. What are the behaviors of school principals that influence student achievement as
perceived by the teachers? Teachers are asked “What principal behaviors
influence teachers and student achievement?”
6. How do teachers perceive the leadership styles of their school principals as leadership
outcomes of satisfaction, effectiveness, and extra effort?
Research Population
The school district had 602,095 residents in its 1,797 square miles at the time of
the study. The district demographics are 75% white, 12.8% black and 17.7% Hispanic.
The percent of residents holding a bachelor’s degree are 18% with 82% graduating from
high school. The median per household income is $41,913 (US Census, 2011). At the
time of the study, the sample school district had 93,000 students and over 12,000
58
employees. This centrally located Florida school district had a 63% poverty rate and a
74.7% graduation rate in 2009 (FDOE). A purposeful sampling method was utilized to
determine the research participants. The researcher was able to identify the participants
that were the best qualified to provide the information needed for the intended purpose of
the study with this method of sampling (Creswell, 2005; Fraenkel & Wallen, 1990).
The selected schools represented a convenience sample since the researcher is
employed in the same district. The first criteria used to determine the purposeful sample:
1) The school was in existence for the three school years of the study. 2) The school had
the same principal for the three years of the study. 3) The school had three years of FCAT
test data. 4) The school must not be a charter, combination, private, or alternative school
(Appendix B). This selection process identified 58 qualifying schools prior to the second
elimination based on improvement status criteria.
Following the purpose of the study, each qualified school was than divided into
groups of elementary, middle, and high schools and then into subgroups of improving
and non-improving schools (Table 1). The criterion for defining a school as improving
and non-improving was based on the Florida school grading model for 2009-2010
(FDOE, Grading Public Schools, 2009). To be designated as an improving school, the
school must have a 1% growth in either FCAT Reading or Mathematics within three
years. A non-improving school is defined as having less than a 1% increase in FCAT
Reading or Mathematics over a three year period. The data was gathered for each school
for academic years 2007, 2008 and 2009.

59
The last criteria used to determine the research sample was to select the schools
based on their similar school size and poverty level. There were four qualified improving
elementary schools and all were used as sample schools. Out of the 36 qualified non-
improving elementary schools, four were selected as sample schools based on their
similarity in size and poverty level to the four improving elementary schools (Table 1).
Of the 11 qualified middle schools, to gain three improving and three non-
improving middle schools an additional computation had to take place. Elementary and
high schools had the required amount of sample schools based on the 50 percent or more
of lowest 25 percent of readers making learning gains. The middle school aggregate did
not differentiate between the improving and non-improving schools. All middle schools
reached the 50 percent or more students making gains in reading and math for the sample
years. An additional ranking was computed: the percent making reading plus the percent
making math gains for the sample years were added and ranked. The top three were used
as improving schools. The bottom 3 schools were used as non-improving schools.
Out of the six qualified high schools, the researcher’s formula identified one high
school as improving. The non-improving high school was selected out of the six qualified
schools based on a similar size of student population and student poverty rate. The
improving high school had 1,860 students and a 56% poverty rate. The non-improving
school had 2,090 students and a 58% poverty rate. The size and poverty rate of the other
five non-improving high schools had a larger margin of difference from the improving
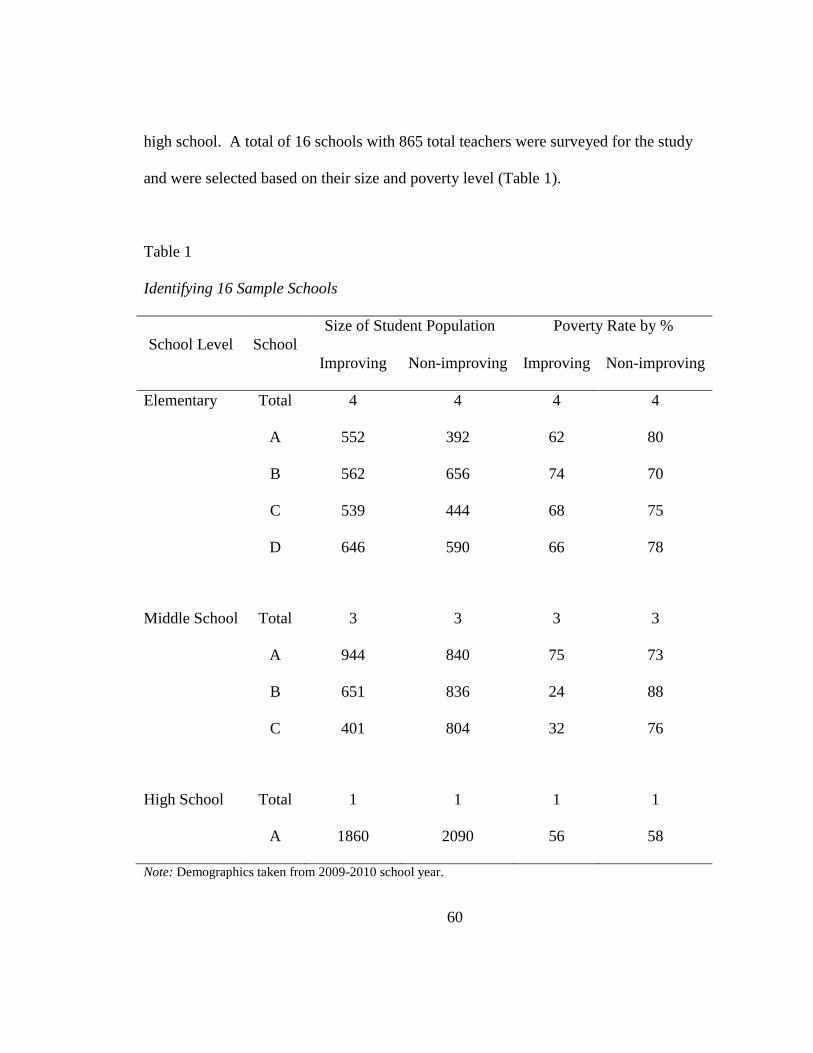
60
high school. A total of 16 schools with 865 total teachers were surveyed for the study
and were selected based on their size and poverty level (Table 1).
Table 1
Identifying 16 Sample Schools
School Level School
Size of Student Population Poverty Rate by %
Improving Non-improving Improving Non-improving
Elementary Total 4 4 4 4
A 552 392 62 80
B 562 656 74 70
C 539 444 68 75
D 646 590 66 78
Middle School Total 3 3 3 3
A 944 840 75 73
B 651 836 24 88
C 401 804 32 76
High School Total 1 1 1 1
A 1860 2090 56 58
Note: Demographics taken from 2009-2010 school year.
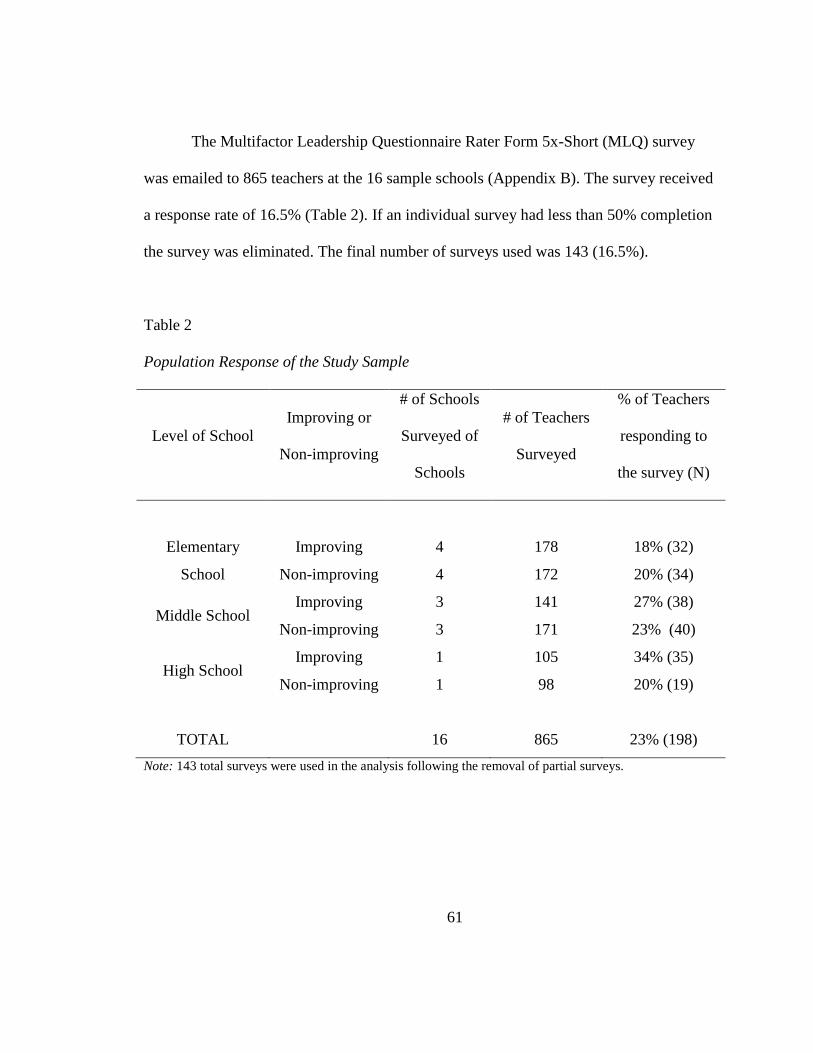
61
The Multifactor Leadership Questionnaire Rater Form 5x-Short (MLQ) survey
was emailed to 865 teachers at the 16 sample schools (Appendix B). The survey received
a response rate of 16.5% (Table 2). If an individual survey had less than 50% completion
the survey was eliminated. The final number of surveys used was 143 (16.5%).
Table 2
Population Response of the Study Sample
Level of School
Improving or
Non-improving
# of Schools
Surveyed of
Schools
# of Teachers
Surveyed
% of Teachers
responding to
the survey (N)
Elementary
School
Improving 4 178 18% (32)
Non-improving 4 172 20% (34)
Middle School Improving 3 141 27% (38)
Non-improving 3 171 23% (40)
High School Improving 1 105 34% (35)
Non-improving 1 98 20% (19)
TOTAL 16 865 23% (198)
Note: 143 total surveys were used in the analysis following the removal of partial surveys.
62
Design of the Study
This research study is an exploratory, nonexperimental, correlational study
(Mertens, 2005) that examined the relationship between the principal’s leadership style
and the student achievement in improving and non-improving schools in one school
district. The classification of the study as nonexperimental is due to the inability of the
researcher to control any factors influencing the responders, in addition to only having
the capability to uncover the relationships between the variables (McMillan, 2004). The
correlational design allows the exploration of relationships between the variables of the
study (Fraenkel & Wallen, 1990). These design models were utilized to provided for an
in depth analysis.
The design of this study utilized a quantitative survey instrument to collect data
from teachers to identify their perception of the leadership style of their principal. This
electronic survey was selected for the advantages of rapid response, anonymity, and the
ease of data aggregation and analysis (Dillman & Schaefer, 1998). Disadvantages were
curtailed by emailing a web link to the surveys through the school district's electronic
mail system. The email invitation to complete the survey was then opened by teachers
using their district issued computers (Appendix C). Teacher confidentiality was kept
through the identification of the school only and not the individual teacher on the
returned surveys.
Survey research was first accepted by researchers during World War II as a data
gathering procedure for the social sciences that combined interviewing, sampling and

63
content analysis (Withey, 1953). Both paper based and electronic survey research allows
participants to freely express opinions without fear of reprisal (Roche, 1999). However,
statisticians warned that electronic surveys are under the same requirements to include
valid questions relevant to the research goals, strategies and situation (Zatz, 2004).
The research community has increased the use of electronic surveys as computers
become more accessible to the general population. The growing comfort level of internet
users provides researchers with an efficient alternative medium of data collection. A
recent study analyzing the buying practices of 416 customers with 60% using paper
surveys and 40% using online surveys found online surveys had notably fewer missing
responses (Boyer, Calantone, Jackson & Olson 2010).
In a 2001 study exploring the effectiveness of electronic surveys versus paper
surveys, researchers found their subjects responded more accurately to the electronic
survey. The 60% of the 1,000 customers surveyed were provided with a traditional paper
survey. The remaining respondents received a disc to open and respond to questions on
their own computers. Boyer, Jackson and Olson (2001) found their response rate
improved by carefully targeting the sample, including a clarifying purpose, making the
survey simple to complete, and following up with participants. The authors also found the
written responses to open-ended questions were longer and easier to read.
Drawbacks to online surveys can be found in technical incompatibility with the
some of the target population’s software. The return rates may decrease due to concerns
with a lack of confidentiality and computer comfort levels (Baker, Reynolds, & Woods,
64
2007). A limited requirement of technical ability is necessary and electronic surveys are
more likely to experience technical problems than written surveys (SurveyMonkey,
2010). The assurance of anonymity may encourage the honesty of respondents (Zatz,
2004). Web surveys on a secure server with a link embedded into emails with a written
promise of confidentiality will increase trust (Zatz, 2004). Boyer, et.al recommends the
researcher target and control for this factor to make the respondent comfortable with the
electronic medium (2001).
Studies exploring the most effective use of electronic surveys found the timing of
the survey distribution is important. In a study of over 30,000 manufacturing firms,
Faught (2004) found sending the email survey in the early morning and late afternoon
provided busy managers with a more relaxed opportunity to respond. As a result of this
research, the researcher sent the surveys for this study on a Wednesday morning as
recommended in Faught’s study (2004).
Schools in the study were selected from each group (improving and non-
improving) and subgroup (high, middle, elementary) until the sample needed to obtain
the required effect size was reached (Table 1). A total of 104 schools were eliminated to
acquire the 16 schools needed for the sample study. The sample size was determined as
adequate based on the consideration of the alpha level, effect size and power. Adequate
power for the study was determined by conducting an a priori power analysis using
Cohen’s PowerPrimer table. The sample size with a power value 0.08 is statistically
recommended for educational research (Cohen, 1992). The sample size was large enough

65
to conduct a multiple regression analysis on the research questions to determine the
relationships between the independent and dependent variable.
The original research plan for determining the criteria for schools to be
designated as an improving and non-improving school was altered to include a higher
number of schools for the sample. The researcher wanted to determine if a school was
high or low based on a 1% gain or loss for each of the three years of test data. However
using these criteria for Reading or Mathematics, there were zero elementary schools, two
middle schools, and one high school designated as high achieving in the school district in
the study.
The researcher changed the criteria for the study to determine if a school was
improving based on a 1% gain for the time span of three years. Consequently, a school
could drop a percentage or more in the first or second year and still be considered
improving if they raised a percentage or more in Reading or Math by the third year of the
study. With these criteria the potential numbers of improving schools were 4 elementary
schools, 8 middle schools and 1 high school (Table 1).
The validity of the study results are threatened by missing data which may lead to
a misinterpretation of the data and erroneous conclusions (Tannenbaum, 2010). One
method of avoiding missing data is to eliminate incomplete surveys which lead to a
reduced sample size. Surveys with more than 50 percent of the survey missing were
eliminated. For the remaining surveys with less missing data an alternate solution was
used to estimate the missing data by plugging the group mean into the missing data sets
66
(Borg, Gall, & Gall, 2007). The method used to address missing data to avoid statistical
discrepancies was the multiple imputations (MI) as recommended by Tannenbaum
(2010). The MI is statistically effective with more adaptability than the listwise deletion
which removes the entire record from the sample and pairwise deletion which removes
groups or cases of missing data. Steps were taken through the survey directions to avoid
missing data. Each teacher was asked to review the entire survey for skipped questions or
pages following the completion.
Design of the Instrument
The instrument in this study was a survey designed to measure the teacher’s
perception of their principal’s leadership style and provide teacher demographic data.
Leadership styles were examined within defined leadership behaviors on the Multifactor
Leadership Questionnaire (5x-short) and characterized as transformational, transactional,
and passive avoidant (Avolio, Bass, and Jung, 2004). This 45 item instrument had four
questions added to provide the researcher with the teacher demographics (Appendix D)
that may influence perceptions of leadership styles (Table 3). Lastly, one open-ended
question was included in the survey to provide an opportunity for teachers to include
information not asked in the survey. As illustrated in Table 3, the instrument had a total
of 50 survey items that provided an aggregate of the principal’s leadership style as
perceived by the teachers in each school.
67
Following the purpose of the study, student achievement data for each school was
taken from the Florida Comprehensive Assessment Test that is published by the Florida
Department of Education. This existing data from the state’s standardized assessment was
selected for this study as a representation of school performance (Bhindi, Hansen, Rall,
Riley, & Smith, 2008, King & Youngs, 2002). Each public school student in grades 3, 8
and 10 take the FCAT.
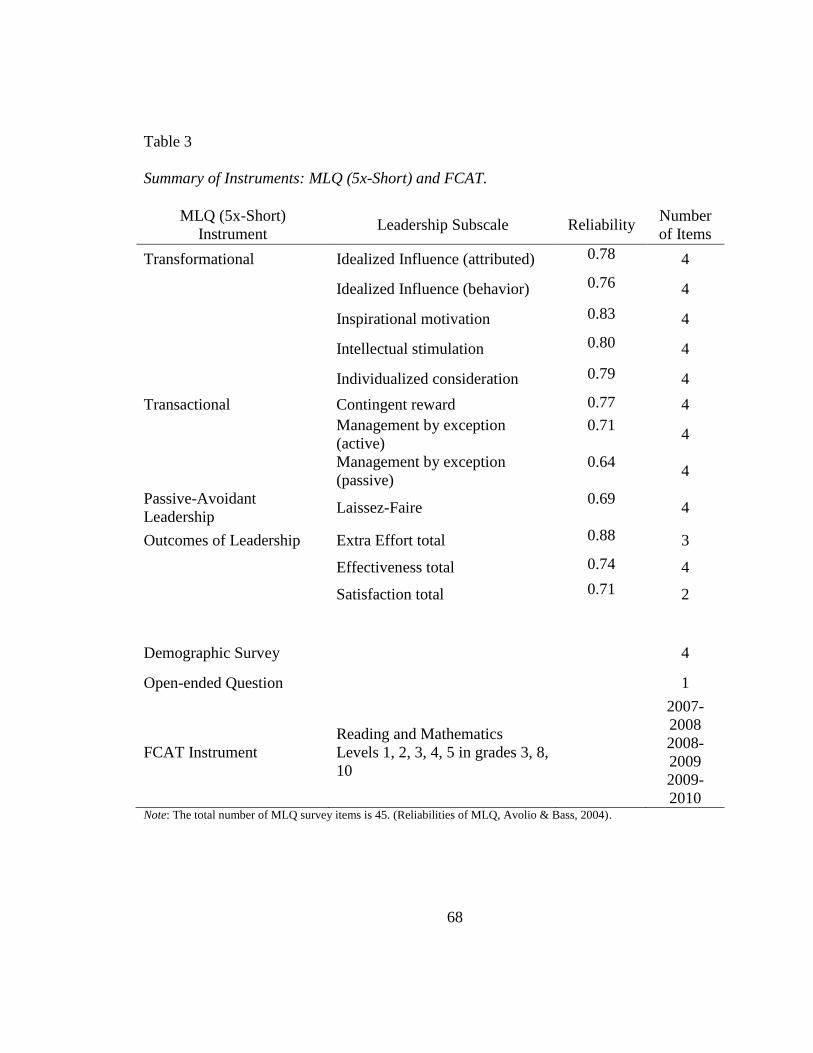
68
Table 3
Summary of Instruments: MLQ (5x-Short) and FCAT.
MLQ (5x-Short)
Instrument Leadership Subscale Reliability
Number
of Items
Transformational Idealized Influence (attributed) 0.78 4
Idealized Influence (behavior) 0.76 4
Inspirational motivation 0.83 4
Intellectual stimulation 0.80 4
Individualized consideration 0.79 4
Transactional Contingent reward 0.77 4
Management by exception
(active)
0.71 4
Management by exception
(passive)
0.64 4
Passive-Avoidant
Leadership Laissez-Faire
0.69 4
Outcomes of Leadership Extra Effort total 0.88 3
Effectiveness total 0.74 4
Satisfaction total 0.71 2
Demographic Survey 4
Open-ended Question 1
FCAT Instrument
Reading and Mathematics
Levels 1, 2, 3, 4, 5 in grades 3, 8,
10
2007-
2008
2008-
2009
2009-
2010 Note: The total number of MLQ survey items is 45. (Reliabilities of MLQ, Avolio & Bass, 2004).

69
Multifactor leadership questionnaire (5x-Short). The MLQ was selected to
measure the leadership styles due to its broad acceptance as a reliable instrument by
researchers (Metcalf & Metcalfe, 2001). This instrument measures the leader’s use of the
three leadership styles: transformational, transactional and passive-avoidant. The
copyrighted MLQ was used in its entirety after being purchased from Mind Garden, Inc.
This instrument was developed by Bernard Bass in 1985 with the last revision with Bruce
Avolio in 2004.
The MLQ is a 45-item instrument containing nine leadership subscales: idealized
influence (attributed), idealized influence (behavior), inspirational motivation, intellectual
stimulation, individualized consideration, contingent reward, management-by-exception
(active), management-by-exception (passive), and laissez-faire measures (Avolio, 1999,
Avolio & Bass, 2004, Bass, 1990, Rowold, 2005). The nine leadership subscales in the
MLQ (5x-short) are divided by five transformational, three transactional and one laissez-
faire or passive-avoidant leadership style. The MLQ manual estimates a fifteen minute
completion time for respondents.
The transformational leadership style scores resulted from averaging the scores
from 20 survey items encompassing five subscales. The first two subscales measured the
influence the leader has on followers as Idealized Influence (Attributed) or Idealized
Influence (Behavior) (Barnett, Craven, Marsh, 2005). This leadership style shares
successes and rewards with followers while serving as a role model (Bass & Riggio,
2006). Bass and Avolio (2004) defined leaders with Idealized Attributes as instilling
70
pride in others, displaying power with confidence and putting the group’s good above
their own. The authors consider leaders with Idealized Behaviors as sharing values while
establishing a sense of mission defined conveyed by the consideration of ethical decisions
(Avolio & Bass, 2004).
Inspirational Motivation reflects the third scale of transformational leadership and
defines the leader who motivates followers by providing a compelling mission that
encourages them to achieve. The fourth subscale, Intellectual Stimulation, gives the
follower freedom to solve problems in a safe environment. Individualized Consideration
is the last subscale and characterizes the leader as a coach who mentors followers by
encouraging them to meet their personal challenges.
Transactional leadership style scores resulted from averaging the scores from the
12 items involved in the three subscales. Contingent Reward characterizes leadership that
offers recognition and rewards for goals that are achieved. The second subscale is into
Management-by-Exception (Active) and the last is Management-by-Exception (Passive).
These management styles define acceptable subordinate behavior. The “active”
Management-by-Exception leader monitors the accountability system closely and
punishes those who do not meet the prescribed criteria. The “passive” Management-by-
Exception defines the leader who does not clarify expectations or standards but waits for
unacceptable performance and corrects the follower (MLQ Manual, 2004).
The last subscale with the remaining four survey items measures the leadership
style of passive-avoidant or laissez-faire leadership. This leader does not have the
71
characteristics found in either transformation or transactional leadership styles. The
passive-avoidant leader is absent, avoids responsibilities and clarifying questions, and
fails to make important decisions (Avolio & Bass, 2004; Bass & Riggio, 2006).
The MLQ includes three outcome factors: extra effort, effectiveness, and
satisfaction (Avolio et al., 1999, Bass, 1990, 1998). Each of these factors reflects the
resultant effects of leadership decisions as perceived the follower. The three questions for
Extra Effort reflect a leader who heightens the desire for others to succeed. The four
questions for Effectiveness define a leader who is effective in meeting organizational
requirements and represents their group to a higher authority. The two questions for
Satisfaction reflect the leader who uses methods of leadership that are satisfying to the
followers.
The MLQ uses a 5-point Likert-type scale from 0 (Not at all) to 4 (Frequently, if
not always). The scoring of the MLQ used an average of the Likert-type scores on each
of the nine leadership subscales. There were four items for each of the nine leadership
subscales. The overall score for the principals as perceived by their teachers in improving
and non-improving schools was identified based on summing the scores of each
leadership scale and outcome scale, then dividing by the number of items on the scale to
find the mean of each scale.
The leadership styles of the principals in the study were identified based on the
overall mean of the leadership subscale items on the MLQ. All teachers in the sample
schools were sent the surveys. The MLQ scoring key was provided to the researcher as
72
part of the instrument manual. The score for each of the 9 scale items was computed by
averaging the results of the 4 survey questions for each of the 9 subscales (Table 3). Each
subscale had a score ranging from 0 to 4 as indicated by the participant’s selection on the
Likert-type scale (MLQ Manual). The inclusion of only three representative survey
questions was included in the appendix due to copyright restrictions (Appendix A).
The open-ended question, added by the researcher, was the final item on the
survey. This question provided the teachers with an opportunity to expand on their
perceptions of their school leader. The question was: What principal behaviors influence
teachers and student achievement? These data were entered into a Microsoft Excel
Spreadsheet. The data sheet included the level of the school, the improvement status of
the school and the responses from each person surveyed (Appendix B). The responses
were coded and analyzed based on the themes to clarify findings and produce predictable
responses (Creswell, 2007).
Three readings of the open-ended responses assured the fidelity of the data. The
first reading analyzed the responses for completeness to verify their usability in the study.
The second reading was to obtain a central sense of the participant views of the
principals’ behaviors that support the study. The third reading narrowed the focus of the
responses, identified the themes and broke down the data into manageable segments for
comparisons, contrasts, and categories (Schwandt, 1997).
Validation of the multiple leadership questionnaire (5x-Short). Validity is
defined as “the judgment of the appropriateness of a measure for the specific inferences

73
that result from the scores generated by the measures” (McMillan, 2004, p. 136).
Reliability is defined as how consistent the scores are from one administration to the next
(McMillan, 2004). The validation process for the MLQ has occurred over the past 20
years of revisions, enhancements and trials (Rowold, 2005). Conger and Kanungo (1994)
raised concerns regarding the validity of the original MLQ instrument. As a result, the
reliability and validity have been strengthened through multiple revisions and refinements
(Northouse, 2004).
The validation process of the MLQ indicates both factorial and convergent
validity, internal consistency, test-retest-reliability, and interrater agreement (Fox, 2009).
The factor analysis of multiple studies has supported the construct validity of the
instrument (Yuki, 2006). Confirmatory Factory Analysis (CFA) has been used to validate
the MLQ. Pallant (2004) defines CFA as the practice of reducing a large set of variables
to a smaller set of factors or components. The scales of the transformational and
transactional leadership styles have been analyzed through the CFA process to determine
the Comparative Fit Index (CFI = >. 95, RMSEA = < .05) for the MLQ (Holahan,
Medsker & Williams & 1994).
Additional studies have tested the reliability and validity of the MLQ. The
construct validity of the MLQ was established by Antonakis’s (2001) review of 18
independent studies through convergent, divergent and criterion that used raters in
multiple organizations in the United States. Structural validity of the MLQ was supported
by Armstrong and Muenjohn (2008) who concluded through their examination of various
74
organizations in England and Thailand that the MLQ was successful in adequately
portraying the full leadership factor constructs of transformational leadership.
Education research conducted by Eshbach and Henderson (2010) found the MLQ
was valid in determining the relationship between the leadership style of first year
elementary principals and the relationship of the organizational climate of the school.
Barnett and McCormick conducted a similar 2004 study with 373 teachers in elementary,
middle school and high school in Australia and their results suggested a relationship
between leadership style as defined by the MLQ and the school learning culture. The
confirmatory factor analysis identified the three leadership constructs and leadership
variables: vision, individual concern, and passive leadership (Barnett & McCormick,
2004). The authors found empirical evidence to support the dimensions of
transformational leadership and transactional leadership were consistent with Bass and
Avolio’s research (Barnett & McCormick, 2004, Bass & Avolio, 1997).
MLQ authors, Bernard Bass and Bruce Avolio (2000), have continued to establish
the instrument’s validity and reliability. They report their reliabilities for each subscale to
range from .74 to .91 (Table 3). The MLQ has used 14 samples for a total of 3,786
respondents to validate and cross-validate the instrument (Avolio & Bass, 2000). The
construct validation process has also been documented for the instrument. Factor
Analysis of numerous studies has supported the construct validity of the MLQ. The MLQ
manual reports the instrument’s use by education, business and military personnel in
more than 300 research programs and master’s and doctoral theses. The subscale
75
reliabilities were generally high and exceeded the standard for internal consistency
recommended in literature.
Criticism of the MLQ cites the lack of discriminate validity due to the factor
structure not replicated in every case of empirical research (Hunt, 1991). Carless (1998)
found the MLQ more accurate for a single higher order model then for a multi-factor
model in her sampling of 1440 from a single organization. Pillai, Scandura and Tejeda,
(2001) agreed with this finding based on their study of over 1300 samples gathered
through multiple organizations. Their research resulted in the recommendation of
reducing the MLQ to only 27 items with a limitation of the transactional components of
the survey to a three-item subscale for factor analysis.
Florida Comprehensive Assessment Test
The results of the Florida Comprehensive Assessment Test (FCAT) for each
school in the sample were obtained from the Florida Department of Education and were
used as a measure of student achievement in each school. This criterion-reference test
measures the achievement of third through eleventh graders based on the Sunshine State
Standard benchmarks in mathematics, reading, science, and writing. With limited
exceptions, all public school students in Florida are required to take the FCAT and pass
the Reading and Mathematics tests to graduate from high school.
The FCAT questions and performance tasks are designed to promote thinking and
problem-solving skills that correspond with the complexities of the Sunshine State
Standard assessed. The FCAT instrument consists of mostly multiple choice questions
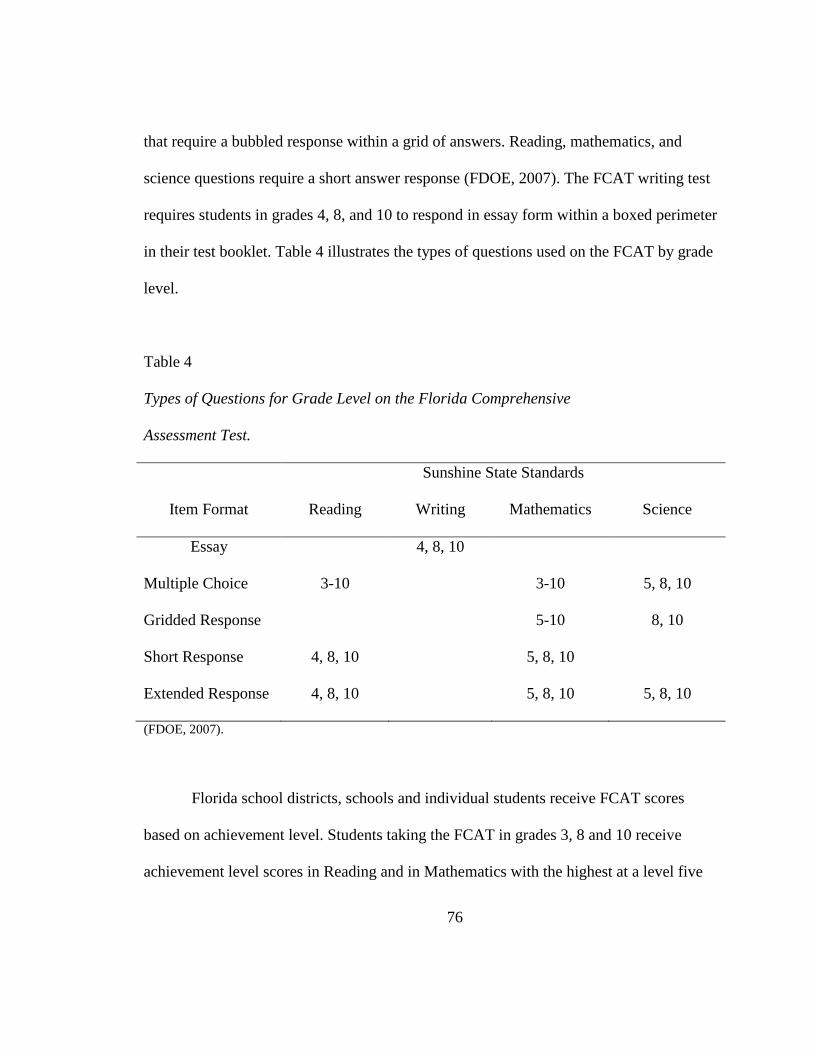
76
that require a bubbled response within a grid of answers. Reading, mathematics, and
science questions require a short answer response (FDOE, 2007). The FCAT writing test
requires students in grades 4, 8, and 10 to respond in essay form within a boxed perimeter
in their test booklet. Table 4 illustrates the types of questions used on the FCAT by grade
level.
Table 4
Types of Questions for Grade Level on the Florida Comprehensive
Assessment Test.
Sunshine State Standards
Item Format Reading Writing Mathematics Science
Essay 4, 8, 10
Multiple Choice 3-10 3-10 5, 8, 10
Gridded Response 5-10 8, 10
Short Response 4, 8, 10 5, 8, 10
Extended Response 4, 8, 10 5, 8, 10 5, 8, 10
(FDOE, 2007).
Florida school districts, schools and individual students receive FCAT scores
based on achievement level. Students taking the FCAT in grades 3, 8 and 10 receive
achievement level scores in Reading and in Mathematics with the highest at a level five
77
and the lowest at a level one. Florida defines a level three in Reading and Mathematics as
the passing score indicating the student is performing at grade-level (FDOE, 2010).
For the purpose of this study, the student achievement scores utilized for the study
were the FCAT results for students in both Reading and Mathematics in grades 3, 8 and
10 were utilized. An aggregate of each sample school’s FCAT reading and mathematics
percentages for 2007, 2008, and 2009 were used in this study to identify improving and
non-improving schools. The current FCAT data for 2010-11 was used to answer the
research question for needed current data for comparison.
Validation of the Florida Comprehensive Assessment Test. The Florida
Department of Education (2009) reported that the validity and reliability of the Florida
Comprehensive Assessment Test were checked through a series of statistical analyses
performed after field testing, test construction and operational testing. Items not meeting
established criteria are rejected or excluded from the calculation of student scores. A
variety of statistical indicators were used to determine the difficulty of the item,
likelihood of success, estimated gains in guessing, identity bias, measure reliability, and
verification of achievement level classification accuracy and consistency .
FCAT achievement levels are identified as 1 through 5 with a level 1 and 2
indicating the student is performing below their current grade level. Achievement levels
3, 4 and 5 indicate the student has tested at or above their current grade level. The
classification consistency and accuracy of the grade levels are based on the determination
of the equitable difficulty level of the forms of the test. There are three types of accuracy
78
and consistency measures present in the development of the FCAT: overall, conditional-
on-level, and by cut point. The student’s performance is tested against a parallel test form
and against a statistically modeled alternate to determine consistency (FDOE, 2005).
Accuracy is determined by examining the agreement between the statistically constructed
true score and an actual student performance.
Reliability measures ensure the FCAT provides a consistent measurement of a
student’s knowledge. The ratio between the variation of a student’s true achievement and
the variation of observed test scores are subject to error. A high reliability helps
researchers generalize results for other populations. However, trends on state tests are not
always reliable as indicators of student learning (Linn, 2000). Reliability indicators
reviewed on FCAT statistical characteristics are conditional standard error of
measurement, marginal reliability, and Cronbach’s alpha (FCAT Assessment &
Accountability, 2004).
The purpose of reliability measures is to determine if a test provides consistent
measurement that can be generalized from one time to another. The FCAT reliability uses
four kinds of reliability coefficients: internal consistency, test-retest reliability, inter-rater
reliability, and reliability of classifications. The coefficient for the four types of reliability
is represented from zero to one, with zero representing a lack of reliability and
inconsistent scores (FLDOE, 2007). The reliability measures for the FCAT exceed
.90.for the concurrent validity estimates that range from .70 to .81 (FL DEPT of EDU
2004).
79
Pilot Study
To assess the validity and reliability of the MLQ instrument for use in this
research, a pilot study was conducted with the addition of demographics and an open-
ended question. A convenience sample of ten teachers was taken from one school in the
district based on their availability and willingness to volunteer for the pilot study.
Participants received the survey through a link on an email. An interview with the
participants determined the amount of time needed to complete the survey, the clarity of
the directions and questions and if the open ended question was effectively worded.
Additionally, the first test determined if the hyper link to the survey operated correctly
and if the cover letter and the demographic survey directions were clear. A second test
was given to the same teachers after 10 days to compute the test-retest reliability since
the previous test.
The pilot study added to the reliability of study as compared in the MLQ
reliability (Table 5). Following the first administration, modifications were made on the
survey to identify the principal as the leader to be rated and correcting a numerical error
on the demographic survey. Test and retest reliability was completed by giving the same
measure to the same teachers after 10 days.
Cronbach’s alpha was computed to determine the internal consistency of the
measurement of the leadership scales and subscales from the pilot study sample (Table
3). Reliability estimates were computed for the survey items used to measure each
subscale as suggested by Bass and Avolio (2004). Overall, the reliability coefficients for
80
the variables in this sample were similar to those reported by Bass and Avolio (2004).
The pilot test results (Table 5) indicated the survey is reliable except for Management by
Exception- Active with a reliability of .56 for the test and retest. The data taken from the
pilot study were not used in the final study but was compiled and analyzed to aid the
researcher in the organization of the final study.
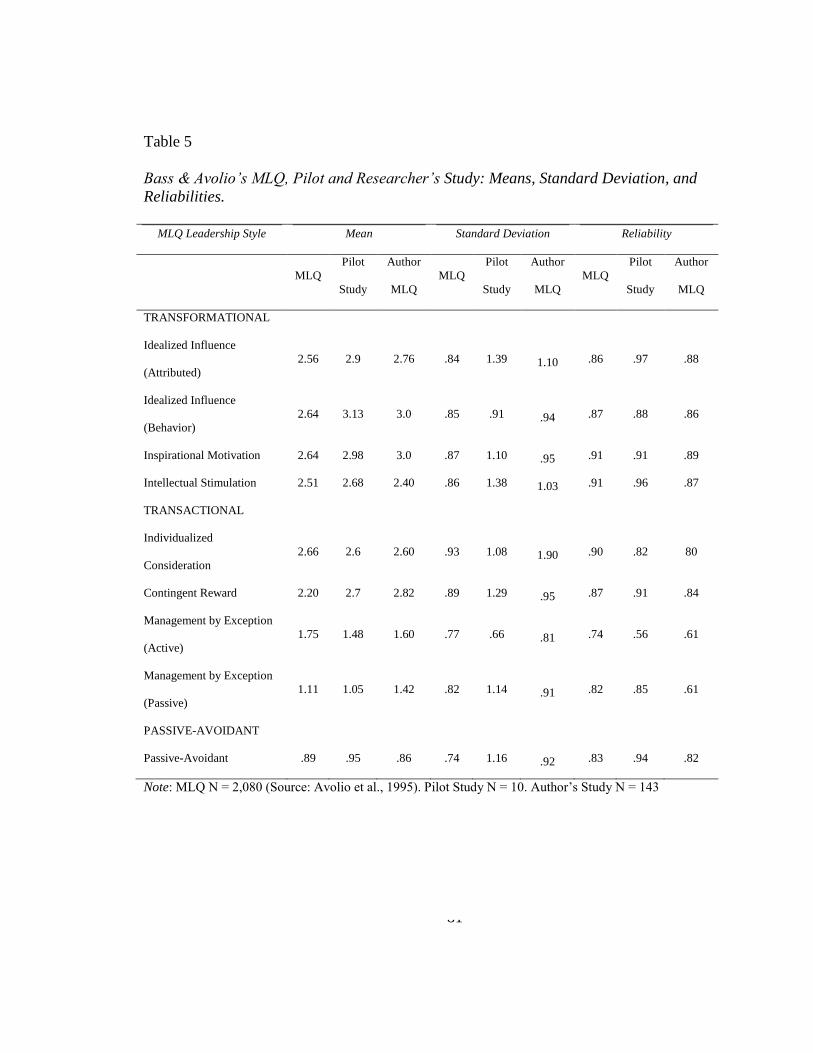
81
Table 5
Bass & Avolio’s MLQ, Pilot and Researcher’s Study: Means, Standard Deviation, and
Reliabilities.
MLQ Leadership Style Mean Standard Deviation Reliability
MLQ
Pilot
Study
Author
MLQ
MLQ
Pilot
Study
Author
MLQ
MLQ
Pilot
Study
Author
MLQ
TRANSFORMATIONAL
Idealized Influence
(Attributed)
2.56 2.9 2.76 .84 1.39 1.10 .86 .97 .88
Idealized Influence
(Behavior)
2.64 3.13 3.0 .85 .91 .94 .87 .88 .86
Inspirational Motivation 2.64 2.98 3.0 .87 1.10 .95 .91 .91 .89
Intellectual Stimulation 2.51 2.68 2.40 .86 1.38 1.03 .91 .96 .87
TRANSACTIONAL
Individualized
Consideration
2.66 2.6 2.60 .93 1.08 1.90 .90 .82 80
Contingent Reward 2.20 2.7 2.82 .89 1.29 .95 .87 .91 .84
Management by Exception
(Active)
1.75 1.48 1.60 .77 .66 .81 .74 .56 .61
Management by Exception
(Passive)
1.11 1.05 1.42 .82 1.14 .91 .82 .85 .61
PASSIVE-AVOIDANT
Passive-Avoidant .89 .95 .86 .74 1.16 .92 .83 .94 .82
Note: MLQ N = 2,080 (Source: Avolio et al., 1995). Pilot Study N = 10. Author’s Study N = 143

82
Following the collection of the data for the study, Cronbach’s alpha coefficients
for the nine subscales were completed to measure the internal consistency of the study as
compared to those of the Bass and Avolio’s MLQ instrument (2004). The reliability of
the 9 factor leadership subscales were measured by Cronbach’s alpha reliability
coefficient (a). A Cronbach’s alpha reliability coefficient score at or above .70 indicates
each item is closely related to the other item (Nunnally, 1978). Simply, a higher
Cronbach’s alpha score implies a higher reliability for that leadership style scale. The
reliability for the subscales of the leadership styles in the MLQ for this study was
between .61 and .89 (Table 5). Seven out of nine subscales have the reliability over .80.
These reliability scores indicate that the leadership style subscales in the MLQ were
consistent with the reliably scores reported by the authors of the MLQ (Table 5). Avolio
and Bass (2004) report that the higher the score, the greater the specific leadership
behavior or outcome.
Teachers answered the survey questions within a range on the Likert-type scale
from not at all = 0; once in awhile = 1; sometimes = 2; fairly often = 3; and frequently if
not always = 4. The leadership behavior subscales had score ranging from a mean of 0.95
to 2.98. This indicated the teachers perceived their principals as using each of the
leadership behaviors but in varying degrees. To increase the internal validity potential
the confounding variables are controlled by limiting the response selections presented in
the survey. Participants could only select from available responses. Options for not
answering the questions with “none of the above” or “not relevant” were not included.
83
Research Variables
Dependent variables measure any change as a result of the influence of the
independent variable. Independent variables measure what is manipulated by the
researcher through experimental methods to discover the relationship with the dependent
variable. The first research question measured the relationship between the principal’s
leadership style in improving and non-improving schools. The dependent variable was
the leadership style as transformational, transactional or passive-avoidant. The
independent variable for research question one was the performance level of the school
defined as improving or non-improving.
Research questions two and three had dependent variables that were a composite
measure of student achievement results in Reading and Mathematics on the FCAT for
each school over a three year period. This study used the student achievement test results
as the outcome data to measure the relationship to the teacher perceived leadership styles
of school leadership in building school capacity (King & Youngs, 2002). The
independent variables for questions two and three were the teacher perceived leadership
styles of their principals as defined as transformational, transactional and passive-
avoidant.
The fourth research question measured the change of the dependent variable,
leadership style, when influenced by multiple independent variables identifying the
teachers taking the survey: gender, age, years of teaching experience, and years at the
current school. The last research question measured the effect of the leadership styles on
84
the leadership outcomes of satisfaction, effectiveness and extra effort. The dependent
variable was the leadership style and the independent variables were the leadership
outcomes.
Leadership research identifies potential confounding variables in role clarity, staff
cooperation and cohesiveness, organization and delegation of assignments, resources and
support services, and external influences. There was no instrument to measure these
confounding variables in this study. The magnitude of the influence of these variables can
be enhanced in schools with stressful environments regardless of the performance level of
the school (Yuki, 2006).
Data Collection Procedures
The instruments used to collect the data on leadership style were the MLQ and a
demographic survey that addressed gender, age, years of teaching experience, and years
at the current school. School reading and math archival data from the Florida
Comprehensive Assessment Test was accessed through the Florida Department of
Education website for each school in the study. The publishers and copyright holders of
the MLQ survey granted permission to use the instrument in this study. The school
district procedure for conducting research was followed by submitting the application
outlining the study to the Assessment, Accountability and Evaluation (AAE) department.
The researcher provided the district with assurances their policies and procedures would
be followed. The university Institutional Review Board (IRB) procedures for permission

85
to conduct the survey in the schools as part of a graduate dissertation were followed prior
to and during the implementation of the study.
An email was sent to the teachers at the sample schools with the embedded survey
link to the MLQ survey through SurveyMonkey. The email included the nature of the
study and directions for completing the questionnaire (Appendix C). The survey cover
letter informed the teachers that the school district and the university had granted
permission to conduct the survey and their individual privacy was protected.
For the electronic survey administered by the researcher, the teachers at the
sample schools were given two weeks for submission. The expedient electronic surveys
provided anonymity, convenience to the participant and reduce the fear of reprisal
(Portney & Watkins, 2000). Each teacher received the original email invitation, a
reminder email after one week and a final encouraging email the last day of the two-week
completion window. The study needed a total of 16 sample schools with a balance of
improving and non-improving schools represented at each level (elementary, middle,
high).
Data Analysis
Descriptive statistics were used to analyze the numeric data to understand and
explain the results (Ary, Jacobs, & Razavieh, 2002). Hopkins described quantitative
research as having a goal to determine the relationship between an independent variable
and a dependent variable or outcome variable of a population (2007). Inferential statistics
86
were used to study the relationship between the leadership style and student achievement.
A regression analysis was used to determine if there was a relationship between the
variable of leadership styles and scales, and the variable of student assessments on the
FCAT over a three year period.
The quantitative survey results provided data to analyze based on the study’s
research questions. The questions were analyzed to determine the prevalence of the
leadership style for each improving and non-improving school. Each of the nine
dimensional scales had an average of the four questionnaire items linked to the
dimension. The data from the MLQ Rater Form was compiled and reported by Survey
Monkey, the demographic survey and improving and non-improving schools data was
compiled and entered into a Microsoft Office Excel 2007 spreadsheet. The data was
imported into Statistical Package for the Social Sciences (SPSS) analysis software
version 19 for disaggregation and analysis. The bivariate numerical data gathered was
organized in a scatter plot to determine trends in the relationship between the two
variables (Rumsey, 2003). The association between the two variables was reported to
determine if the outcome variable is predictable.
Descriptive statistics were used to analyze the data as the method needed to
tabulate, depict and describe sets of data (Glass & Hopkins, 1996). Descriptive statistics
were used to analyze the demographic variables and were presented in tabular form. The
MLQ included five subscales for transformational leadership, three subscales for
transactional leadership and one scale for passive-avoidant. This data was correlated with
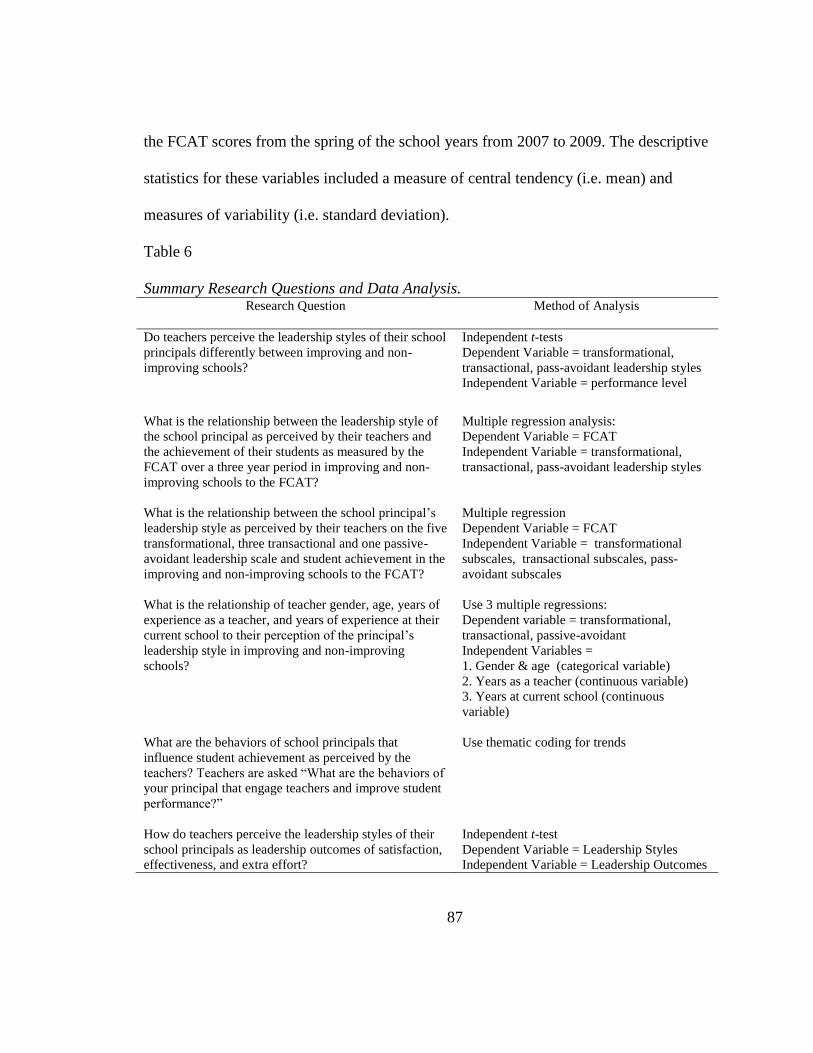
87
the FCAT scores from the spring of the school years from 2007 to 2009. The descriptive
statistics for these variables included a measure of central tendency (i.e. mean) and
measures of variability (i.e. standard deviation).
Table 6
Summary Research Questions and Data Analysis. Research Question Method of Analysis
Do teachers perceive the leadership styles of their school
principals differently between improving and non-
improving schools?
Independent t-tests
Dependent Variable = transformational,
transactional, pass-avoidant leadership styles
Independent Variable = performance level
What is the relationship between the leadership style of
the school principal as perceived by their teachers and
the achievement of their students as measured by the
FCAT over a three year period in improving and non-
improving schools to the FCAT?
Multiple regression analysis:
Dependent Variable = FCAT
Independent Variable = transformational,
transactional, pass-avoidant leadership styles
What is the relationship between the school principal’s
leadership style as perceived by their teachers on the five
transformational, three transactional and one passive-
avoidant leadership scale and student achievement in the
improving and non-improving schools to the FCAT?
Multiple regression
Dependent Variable = FCAT
Independent Variable = transformational
subscales, transactional subscales, pass-
avoidant subscales
What is the relationship of teacher gender, age, years of
experience as a teacher, and years of experience at their
current school to their perception of the principal’s
leadership style in improving and non-improving
schools?
Use 3 multiple regressions:
Dependent variable = transformational,
transactional, passive-avoidant
Independent Variables =
1. Gender & age (categorical variable)
2. Years as a teacher (continuous variable)
3. Years at current school (continuous
variable)
What are the behaviors of school principals that
influence student achievement as perceived by the
teachers? Teachers are asked “What are the behaviors of
your principal that engage teachers and improve student
performance?”
Use thematic coding for trends
How do teachers perceive the leadership styles of their
school principals as leadership outcomes of satisfaction,
effectiveness, and extra effort?
Independent t-test
Dependent Variable = Leadership Styles
Independent Variable = Leadership Outcomes
88
Regression models include the influence of these demographic variables on the
leadership styles. Multiple regressions were used to determine the correlation between the
criterion variable and a combination of two or more predictor variables for the research
questions (Borg, Gall & Gal, 1996). Tables were produced to reveal the frequency of
selection for each item through the SPSS software. The mean, median and mode were
also calculated through the SPSS program. The results of this sampling provided the
researcher with data from a sample population to address the research questions.
Statistical significance was tested by the independent t-tests and multiple
regressions. The MLQ used a Likert-type scale from zero to four to measure leadership
styles. The FCAT used a scale from one to five to measure student achievement. The
open-ended question responses were analyzed to answer the fifth research question
(Table 7). The teacher’s answers to the open response question were compared to the
quantitative survey data to produce a correlation between leadership styles and student
learning gains (Appendix E). This data analysis provided the researcher with an
opportunity to interpret the research findings. Transferability of the findings was
supported by the effective collection and analysis of the data.
The responses generated from the open-ended question were coded and divided
into themes to clarify findings and produce predictable responses as recommended in
Creswell’s (2007) process of qualitative data analysis. Each theme was a result of the
findings and effectively illustrates the style of leadership within the situational leadership
framework. To maintain the fidelity of the teacher’s responses, the researcher read the
89
responses once for completeness to verify their usability in the study. The subsequent
readings identified the themes and broke down the data into manageable segments for
comparisons, contrasts, and categories (Schwandt, 1997).
The data gathered for the study was checked for accuracy prior to analysis. To
avoid inaccurate data, the researcher defined ranges, formats and data type. Standard
procedures were used for checking for data that is out-of-range, missing and or received
in an incorrect format (DeMatteo, Festinger, Marczyk, 2005). Great care was taken to
impute missing values that would skew the statistical results.
Role of the Researcher and Ethical Considerations
The completion of the questionnaires was voluntary and anonymous. All
precautions were taken to ensure the privacy of the participants. The instruments were
administered with care to account for all communication electronic and written. All
participants were assured of ethical treatment through their voluntary consent to complete
the survey. The risks associated with the participation in the study were minimal and
participants were advised that they may withdraw from the survey at any time. The data
gathering, analysis and reporting involved no deception. Permission to survey the
participants with the MLQ (5x-Short) was given by the school district and the university.
The researcher is an assistant principal in the sample school district. The pilot
study was conducted in the researcher’s school but the data and the school was not used
in the final research study. The electronic communication identified the researcher as a
90
university doctoral student and not an employee of the school district. The researcher was
not present during the survey administration. No risks to the participants were identified
in this study since participation was anonymous and voluntary.
The researcher followed the eIRB guidelines for the University of South Florida
involving all research participants. The data gathered from participants was available for
review and will remain protected for five years after the completion of the study.
Following this date, all participant data will be destroyed to ensure the privacy of all
participants.
Summary
This chapter explained the methodology used to address the research questions
that examined if there is a relationship between the teachers’ perceived leadership style of
the principal and student learning. The research focused on the problem of determining if
student achievement is effected positively or negatively by leadership style. The building
of school capacity through an effective leadership style will increase student achievement
(Christie, Thompson, & Whiteley, 2009). The purpose of this study was to examine how
situational leadership choices influence students and their teachers. Chapter Four presents
the results of the research through the data analysis.
91
Chapter Four
Research Results
Chapter four reports the results of the survey and describes the statistical analysis
of the resulting data. The purpose of this study is to examine the relationship between
leadership styles as perceived by teachers and the school’s student achievement data.
The first part of the chapter reintroduces each research question and reports the statistical
outcomes from the data collection. The analyses of the data include independent t-tests,
multiple regressions, and thematic coding. The results of the leadership style survey are
presented with the statistical analysis of the resulting correlations with student
achievement. This chapter concludes with a summary of the chapter and the findings of
the research study.
Descriptive Statistics
Mean scores of the nine leadership subscales measured by the teacher’s
perception of their principals on the MLQ are presented in Table 8. The mean, standard
deviation, minimum and maximum score, as well as the skewness and kurtosis are
presented for each leadership subscale for improving and non-improving schools.
Improving schools are identified with having a one-percent increase in student
92
achievement in 2007, 2008, and 2009. Non-improving schools have less than a one-
percent increase in student achievement over the same 3 years.
The teachers in improving and non-improving schools identified transformational
leadership style subscales with similar means. Among the five transformational
subscales, idealized influence-behavior and inspirational motivation had the highest
means for improving and non-improving schools. In contrast, the individualized
consideration subscale had the lowest score for the improving and non-improving schools
with the separation of the mean at .05 between improving and non-improving schools.
Intellectual stimulation had the second lowest mean with a separation of .02 between the
improving and non-improving schools.
Contingent reward was the transactional leadership style subscale with the highest
mean for improving and non-improving schools. This subscale also had the least variance
of the mean between the improving (2.80) and the non-improving (2.84) schools. There
was a larger mean variance between the management by exception-active subscale with
the improving schools and the non-improving schools. In addition, the management by
exception-passive had a .15 difference with the non-improving schools experiencing a
higher mean then the improving schools. Overall, the lowest mean scores came from the
teachers who identified their principals as having a passive-avoidant leadership style in
both improving and non-improving schools (Table 7).

93
Table 7
Descriptive Statistics for Teacher Perception of Principal Leadership Styles (N=143)
Leadership Scales
and Subscales School Status M SD Min Max
Skewness Kurtosis
Static
Std
Error
Static
Std
Error
TRANSFORMATIONAL
SUBSCALES
Idealized Influence - Attributed Improving 2.80 1.02 0.00 4.00 -0.70 0.30 -0.44 0.57
Non-improving 2.72 1.20 0.00 4.0 -0.90 0.29 -0.26 0.56
Idealized Influence - Behavior Improving 3.01 0.90 0.50 4.00 -0.80 0.29 -0.03 0.57
Non-improving 3.00 1.00 0.00 4.00 -1.10 0.30 0.41 0.56
Inspirational Motivation Improving 3.00 0.90 1.00 4.00 -0.78 0.29 -0.40 0.57
Non-improving 3.00 1.03 0.25 4.00 -1.04 0.29 0.20 056
Intellectual Stimulation Improving 2.40 0.94 0.25 4.00 -0.32 0.29 -0.47 0.57
Non-improving 2.42 1.11 0.00 4.00 -0.50 .029 -0.54 0.56
Individualized Consideration Improving 2.30 1.05 0.00 4.00 -0.50 0.29 -0.50 0.57
Non-improving 2.25 1.13 0.00 4.00 -0.34 0.30 -0.99 0.56
TRANSACTIONAL
SUBSCALES
Contingent Reward Improving 2.80 0.89 0.25 4.00 -0.79 0.29 0.58 0.57
Non-improving 2.84 1.02 0.00 4.00 -0.83 0.28 0.05 0.56
Management by Exception -
Active Improving 1.50 0.73 0.00 3.00 -0.08 0.29 -0.52 0.57
Non-improving 1.96 0.83 0.00 4.00 0.20 0.29 0.17 0.56
Management by Exception -
Passive Improving 1.50 0.83 0.00 3.25 0.21 0.30 -0.82 0.57
Non-improving 1.35 0.97 0.00 3.75 0.49 0.28 -0.72 0.56
PASSIVE-AVOIDANT
SUBSCALES
Passive-Avoidant Improving 0.85 0.87 0.00 3.75 1.07 0.29 0.88 0.57
Non-improving 0.86 0.98 0.00 3.50 1.24 0.28 0.50 0.56
Note: Scale: 0 = not at all, 1 = once in a while, 2 = sometimes, 3 = fairly often, 4=frequently, if not always.
94
Leadership Styles in Improving and Non-improving Schools
The first research question ascertained whether there was a significant difference
in how teachers perceive the leadership styles of their school principals differently
between improving and non-improving schools. To answer this question the data were
analyzed using an independent t-test to measure the differences between the principal’s
leadership styles, as transformational, transactional and passive avoidant, and the schools
performance level classified as improving and non-improving. The Bonferroni procedure
was used to control for a type I error due to the 3 t-tests (α = .017).
The transformational leadership style of the principal in improving schools had a
mean of 2.67, while the non-improving school had a mean of 2.66 (Table 8). The
independent transformational t-test indicated that there was no statistically significant
difference in the teacher’s perception of their principal’s transformational leadership style
between improving and non-improving schools, t (141) = -.21, p = .83. This indicated
there was a minimal mean difference between the improving schools and non-improving
schools with teacher perceptions of transformational leadership style of the principals. In
addition, the effect size of .03 was small between the improving and non-improving
schools with transformational leaders.
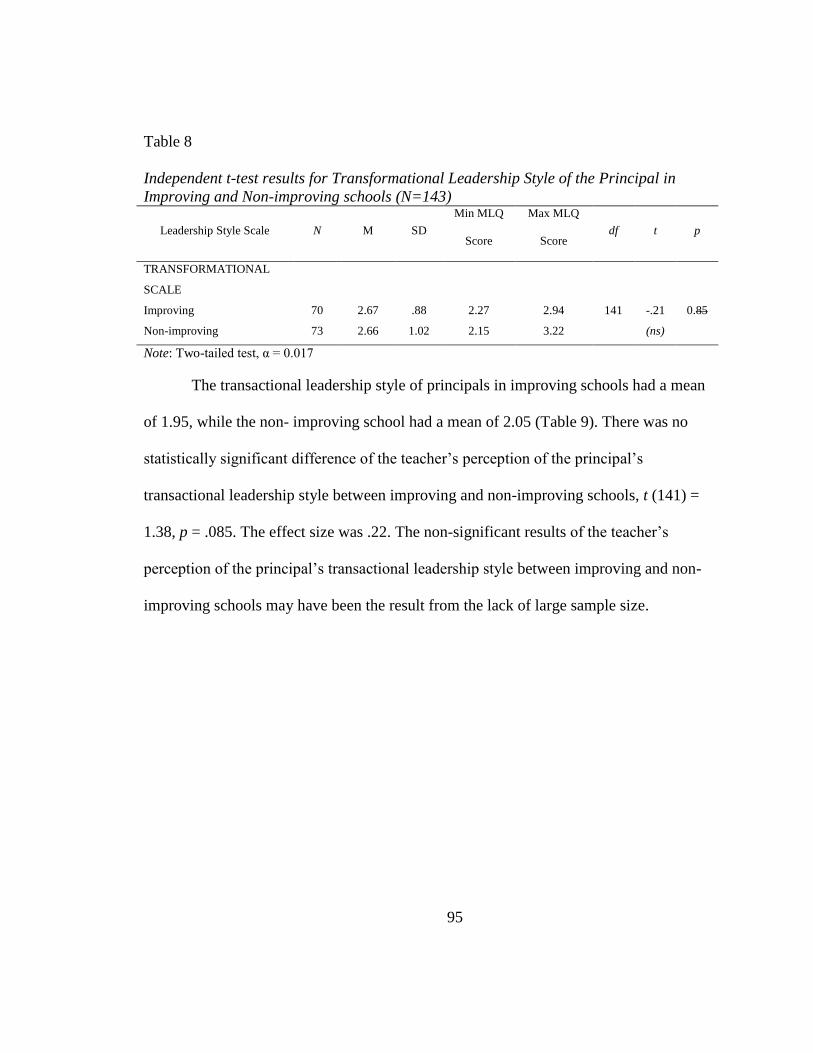
95
Table 8
Independent t-test results for Transformational Leadership Style of the Principal in
Improving and Non-improving schools (N=143)
Leadership Style Scale N M SD
Min MLQ
Score
Max MLQ
Score df t p
TRANSFORMATIONAL
SCALE
Improving 70 2.67 .88 2.27 2.94 141 -.21
(ns)
0.85
Non-improving 73 2.66 1.02 2.15 3.22
Note: Two-tailed test, α = 0.017
The transactional leadership style of principals in improving schools had a mean
of 1.95, while the non- improving school had a mean of 2.05 (Table 9). There was no
statistically significant difference of the teacher’s perception of the principal’s
transactional leadership style between improving and non-improving schools, t (141) =
1.38, p = .085. The effect size was .22. The non-significant results of the teacher’s
perception of the principal’s transactional leadership style between improving and non-
improving schools may have been the result from the lack of large sample size.
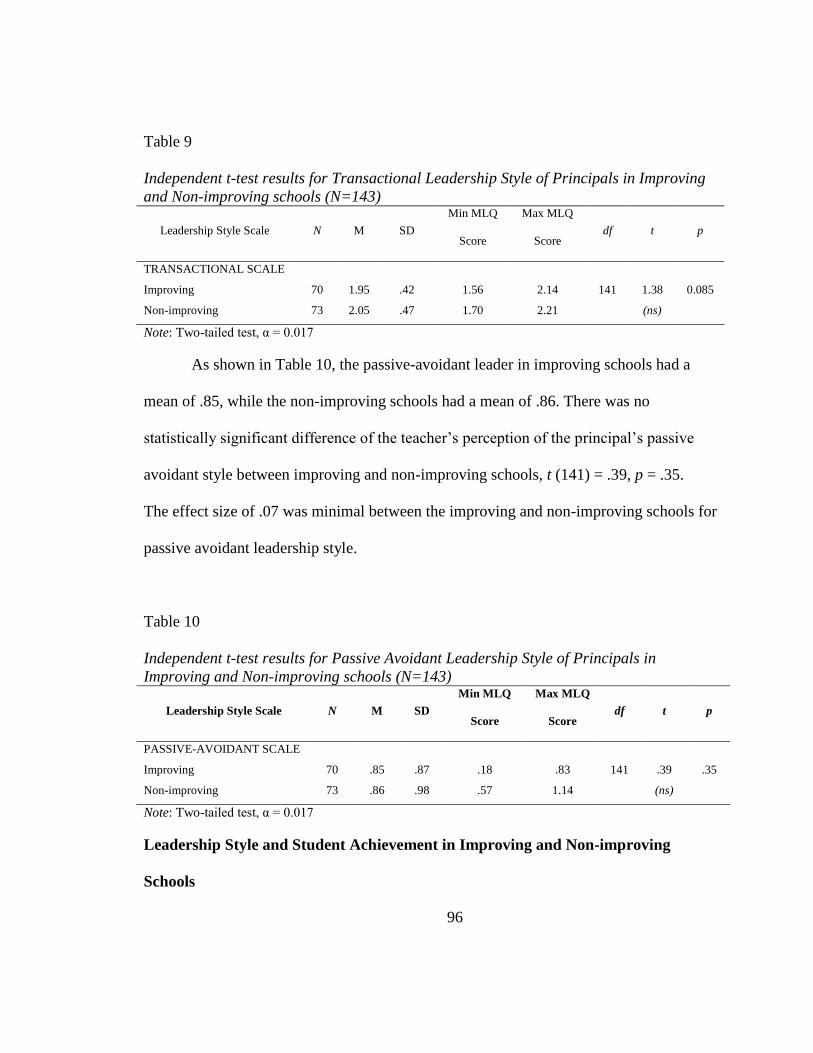
96
Table 9
Independent t-test results for Transactional Leadership Style of Principals in Improving
and Non-improving schools (N=143)
Leadership Style Scale N M SD
Min MLQ
Score
Max MLQ
Score df t p
TRANSACTIONAL SCALE
Improving 70 1.95 .42 1.56 2.14 141 1.38
(ns)
0.085
Non-improving 73 2.05 .47 1.70 2.21
Note: Two-tailed test, α = 0.017
As shown in Table 10, the passive-avoidant leader in improving schools had a
mean of .85, while the non-improving schools had a mean of .86. There was no
statistically significant difference of the teacher’s perception of the principal’s passive
avoidant style between improving and non-improving schools, t (141) = .39, p = .35.
The effect size of .07 was minimal between the improving and non-improving schools for
passive avoidant leadership style.
Table 10
Independent t-test results for Passive Avoidant Leadership Style of Principals in
Improving and Non-improving schools (N=143)
Leadership Style Scale N M SD
Min MLQ
Score
Max MLQ
Score df t p
PASSIVE-AVOIDANT SCALE
Improving 70 .85 .87 .18 .83 141 .39
(ns)
.35
Non-improving 73 .86 .98 .57 1.14
Note: Two-tailed test, α = 0.017
Leadership Style and Student Achievement in Improving and Non-improving
Schools
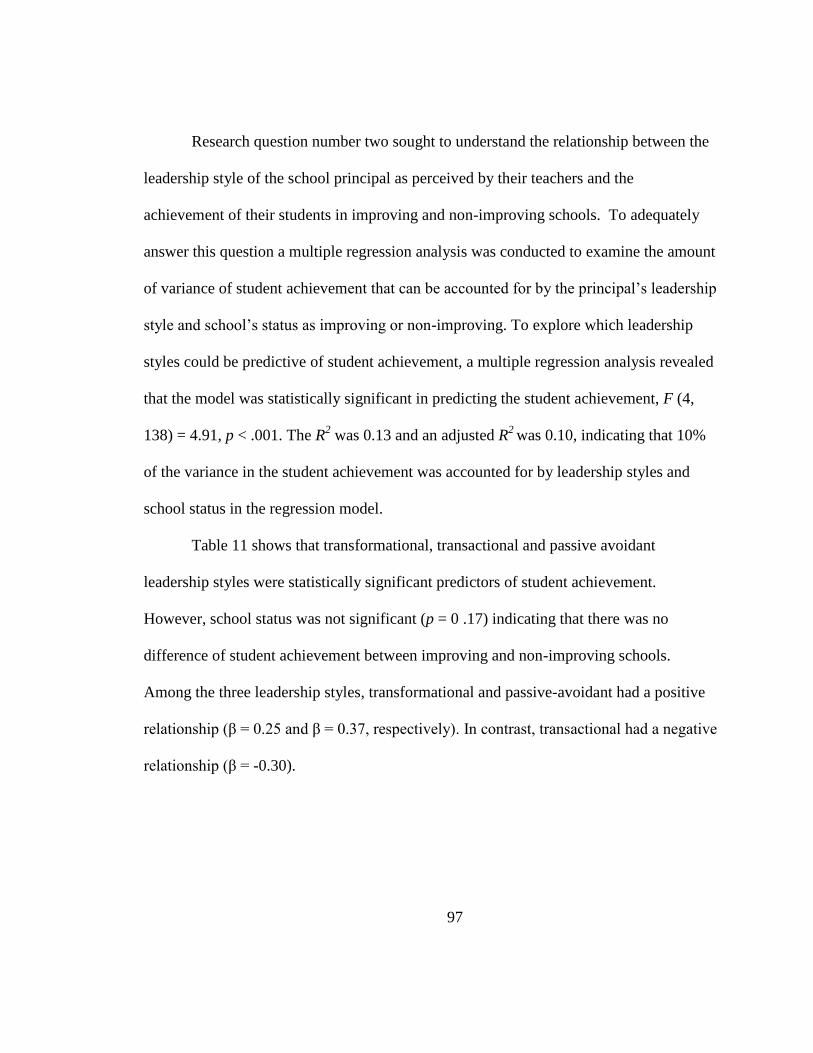
97
Research question number two sought to understand the relationship between the
leadership style of the school principal as perceived by their teachers and the
achievement of their students in improving and non-improving schools. To adequately
answer this question a multiple regression analysis was conducted to examine the amount
of variance of student achievement that can be accounted for by the principal’s leadership
style and school’s status as improving or non-improving. To explore which leadership
styles could be predictive of student achievement, a multiple regression analysis revealed
that the model was statistically significant in predicting the student achievement, F (4,
138) = 4.91, p < .001. The R2 was 0.13 and an adjusted R
2 was 0.10, indicating that 10%
of the variance in the student achievement was accounted for by leadership styles and
school status in the regression model.
Table 11 shows that transformational, transactional and passive avoidant
leadership styles were statistically significant predictors of student achievement.
However, school status was not significant (p = 0 .17) indicating that there was no
difference of student achievement between improving and non-improving schools.
Among the three leadership styles, transformational and passive-avoidant had a positive
relationship (β = 0.25 and β = 0.37, respectively). In contrast, transactional had a negative
relationship (β = -0.30).
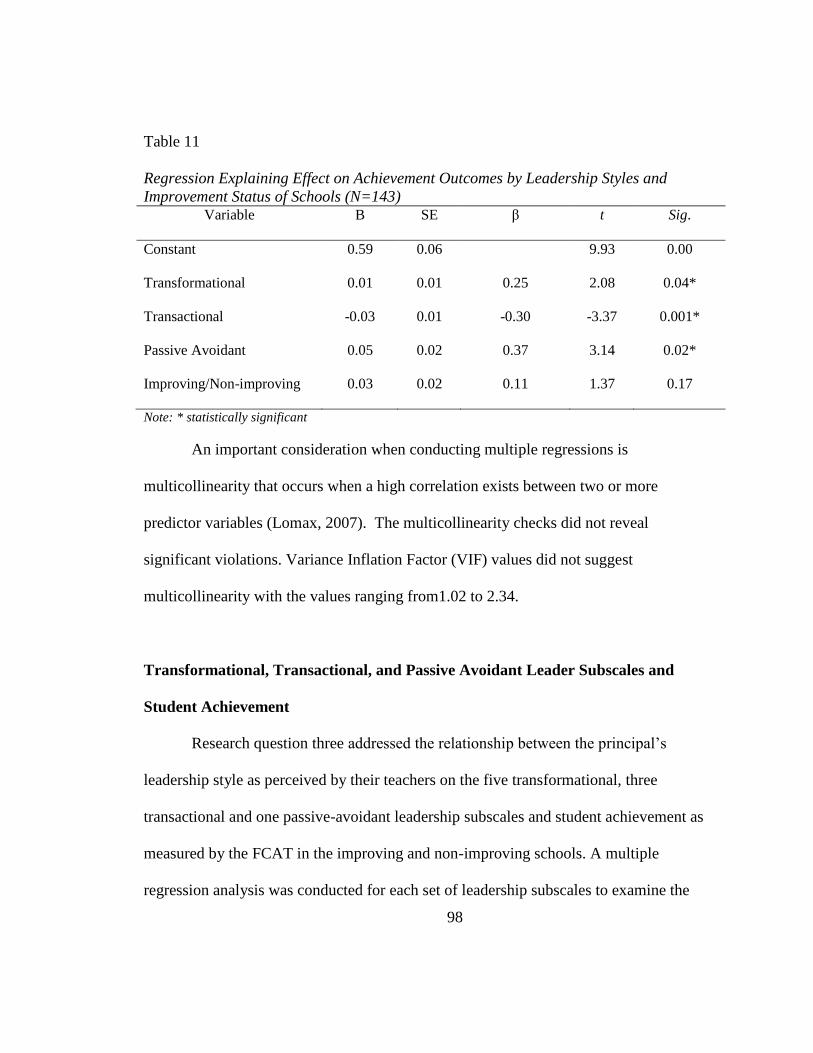
98
Table 11
Regression Explaining Effect on Achievement Outcomes by Leadership Styles and
Improvement Status of Schools (N=143) Variable B SE β t Sig.
Constant 0.59 0.06 9.93 0.00
Transformational 0.01 0.01 0.25 2.08 0.04*
Transactional -0.03 0.01 -0.30 -3.37 0.001*
Passive Avoidant 0.05 0.02 0.37 3.14 0.02*
Improving/Non-improving 0.03 0.02 0.11 1.37 0.17
Note: * statistically significant
An important consideration when conducting multiple regressions is
multicollinearity that occurs when a high correlation exists between two or more
predictor variables (Lomax, 2007). The multicollinearity checks did not reveal
significant violations. Variance Inflation Factor (VIF) values did not suggest
multicollinearity with the values ranging from1.02 to 2.34.
Transformational, Transactional, and Passive Avoidant Leader Subscales and
Student Achievement
Research question three addressed the relationship between the principal’s
leadership style as perceived by their teachers on the five transformational, three
transactional and one passive-avoidant leadership subscales and student achievement as
measured by the FCAT in the improving and non-improving schools. A multiple
regression analysis was conducted for each set of leadership subscales to examine the

99
relationship of the teacher’s perceptions of their principal’s leadership style and the
school’s status as improving or non-improving with student achievement.
The regression analysis demonstrated that there was a significant relation between
the transformational subscales and school status and student achievement, F (6,136) =
2.22, p < 0.01. The R2 was .09 and the adjusted R
2 was .05, indicating that 5% of the
variance in student achievement was accounted for by the transformational leadership
styles and school status in the regression model. In terms of relationships of the
transformational subscales and school status with student achievement,iIntellectual
stimulation and school status had a significant relationship with student achievement, t =
2.50, p < .05 and t = 2.70, p < .05, respectively. Both intellectual stimulation and school
status had positive relationship with student achievement (β = 0.42 and β = 0.18,
respectively).
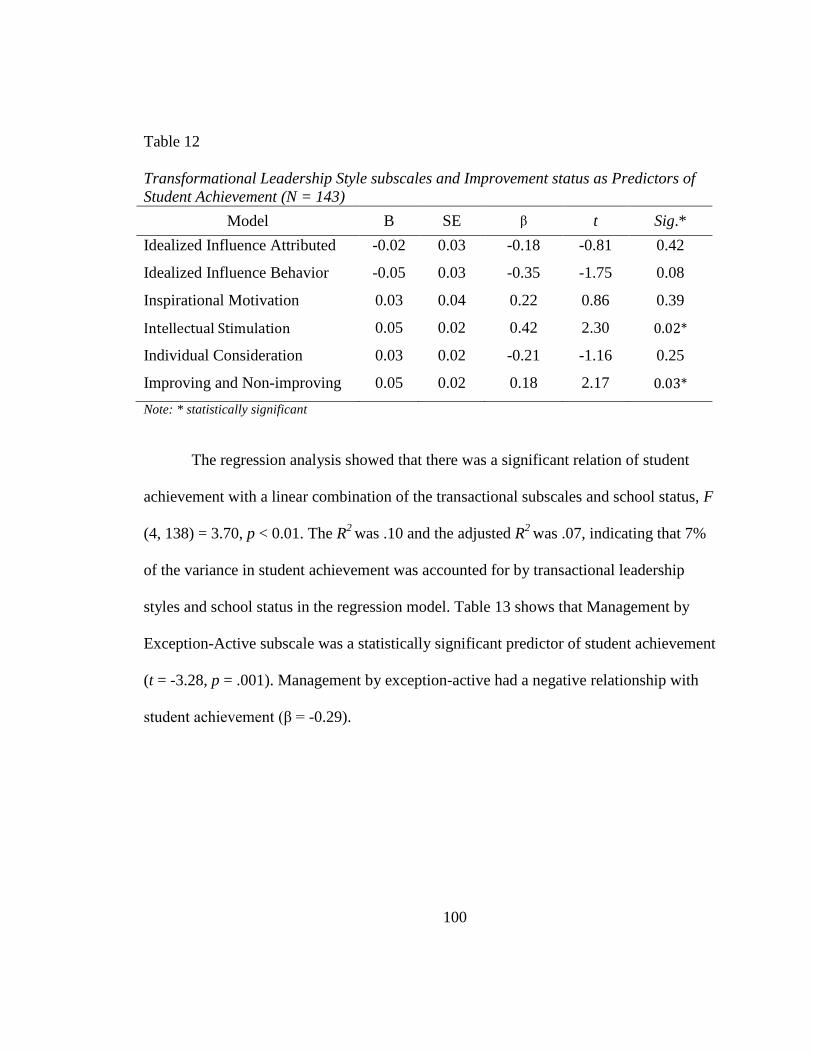
100
Table 12
Transformational Leadership Style subscales and Improvement status as Predictors of
Student Achievement (N = 143)
Model B SE β t Sig.*
Idealized Influence Attributed -0.02 0.03 -0.18 -0.81 0.42
Idealized Influence Behavior -0.05 0.03 -0.35 -1.75 0.08
Inspirational Motivation 0.03 0.04 0.22 0.86 0.39
Intellectual Stimulation 0.05 0.02 0.42 2.30 0.02*
Individual Consideration 0.03 0.02 -0.21 -1.16 0.25
Improving and Non-improving 0.05 0.02 0.18 2.17 0.03*
Note: * statistically significant
The regression analysis showed that there was a significant relation of student
achievement with a linear combination of the transactional subscales and school status, F
(4, 138) = 3.70, p < 0.01. The R2
was .10 and the adjusted R2
was .07, indicating that 7%
of the variance in student achievement was accounted for by transactional leadership
styles and school status in the regression model. Table 13 shows that Management by
Exception-Active subscale was a statistically significant predictor of student achievement
(t = -3.28, p = .001). Management by exception-active had a negative relationship with
student achievement (β = -0.29).

101
Table 13
Transactional Leadership Style Subscales and Improvement Status as Predictors of
Student Achievement (N = 143)
Model B SE β t Sig.*
Contingent Reward 0.002 0.01 0.02 0.18 0.86
Management by Exception -
Passive 0.002 0.01 0.01 0.15 0.89
Management by Exception -
Active -0.05 0.01 -0.29 -3.28 0.001*
Improving and Non-improving 0.02 0.02 0.08 0.89 0.38
Note: * statistically significant
For passive avoidant leadership style, overall regression analysis showed a
significant result, F (2, 140) = 3.70, p < 0.05. The finding indicated that there was a
significant relation of student achievement with a linear combination of the passive
avoidant leadership style and school status. The R2
was .05 and the adjusted R2
was .034,
indicating that only 3% of the variance in student achievement were accounted for by the
passive avoidant leadership style and school status. Table 15 shows the passive-avoidant
subscale was a statistically significant predictor of student achievement (t = 2.03, p <
.05). There was a positive relation between the passive-avoidant leadership and student
achievement (β = 0.17).
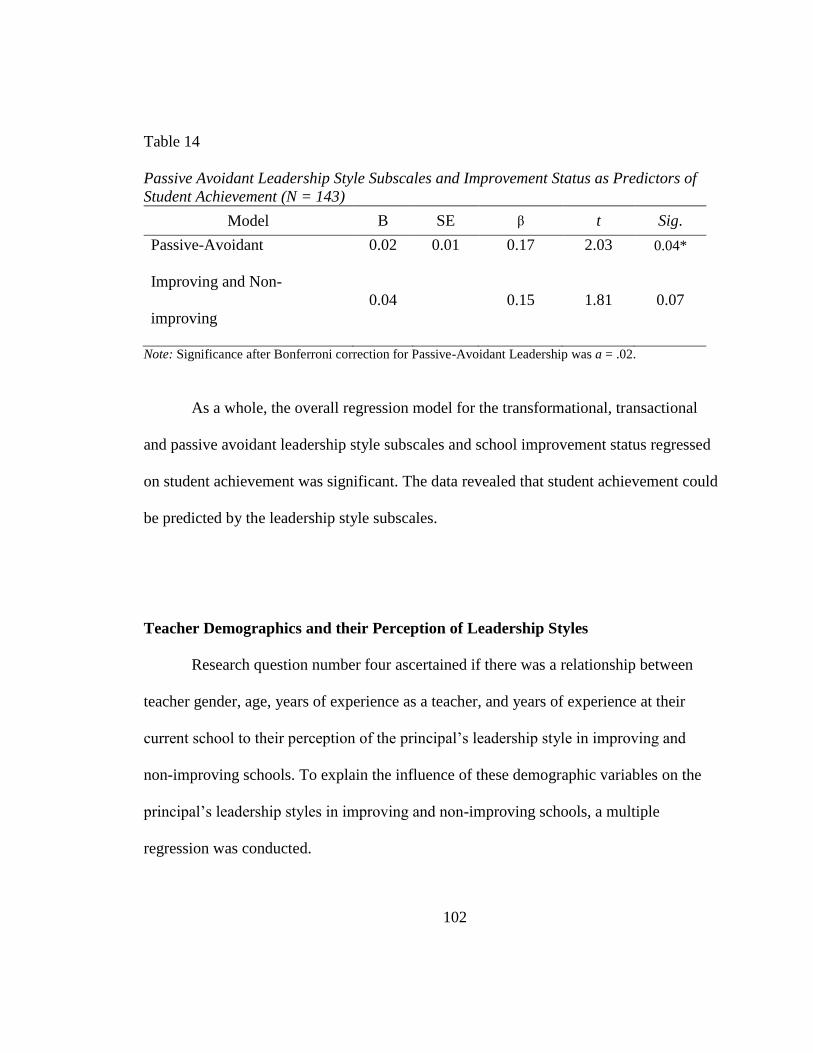
102
Table 14
Passive Avoidant Leadership Style Subscales and Improvement Status as Predictors of
Student Achievement (N = 143)
Model B SE β t Sig.
Passive-Avoidant 0.02 0.01 0.17 2.03 0.04*
Improving and Non-
improving
0.04 0.15 1.81 0.07
Note: Significance after Bonferroni correction for Passive-Avoidant Leadership was a = .02.
As a whole, the overall regression model for the transformational, transactional
and passive avoidant leadership style subscales and school improvement status regressed
on student achievement was significant. The data revealed that student achievement could
be predicted by the leadership style subscales.
Teacher Demographics and their Perception of Leadership Styles
Research question number four ascertained if there was a relationship between
teacher gender, age, years of experience as a teacher, and years of experience at their
current school to their perception of the principal’s leadership style in improving and
non-improving schools. To explain the influence of these demographic variables on the
principal’s leadership styles in improving and non-improving schools, a multiple
regression was conducted.
103
As shown in Table 15, the demographic characteristics of the respondents were
predominately female (80.4%). The majority of the teachers reported their ages between
51 and 60 years old (29.4%). The average teacher had over 16 years of experience
(40.6%) years of experience with an average of 3 to 6 years at their current school
(35.7%).
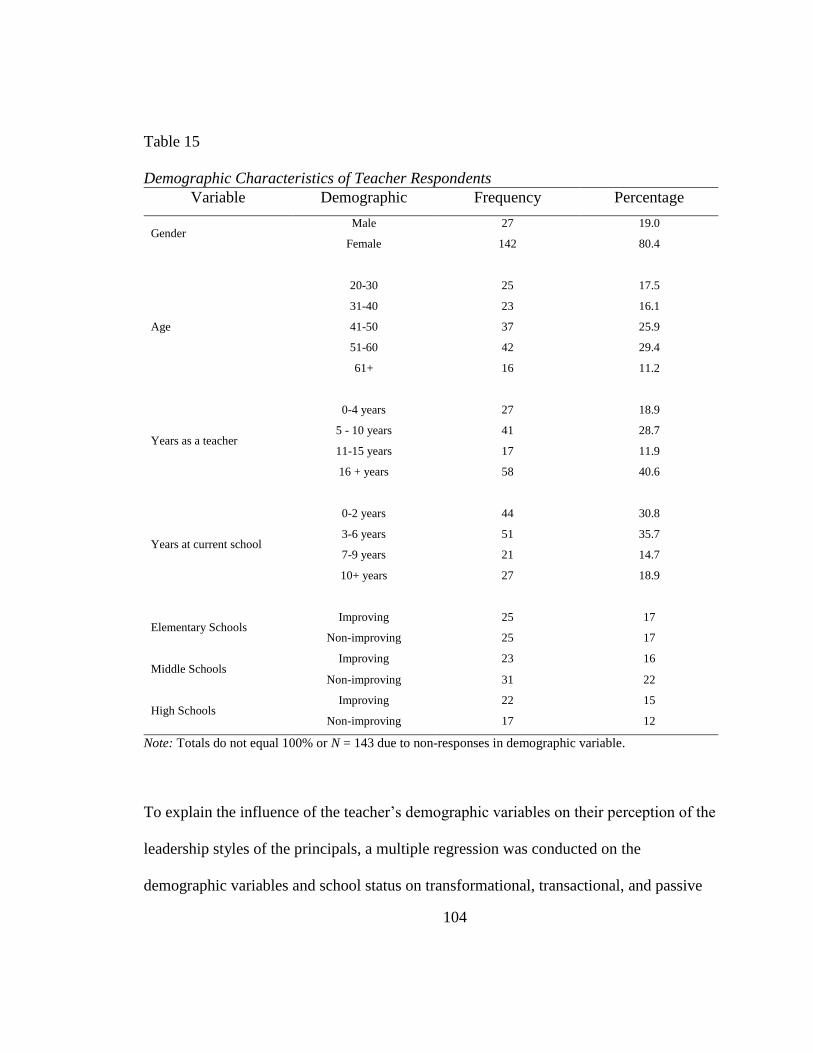
104
Table 15
Demographic Characteristics of Teacher Respondents
Variable Demographic Frequency Percentage
Gender Male 27 19.0
Female 142 80.4
Age
20-30 25 17.5
31-40 23 16.1
41-50 37 25.9
51-60 42 29.4
61+ 16 11.2
Years as a teacher
0-4 years 27 18.9
5 - 10 years 41 28.7
11-15 years 17 11.9
16 + years 58 40.6
Years at current school
0-2 years 44 30.8
3-6 years 51 35.7
7-9 years 21 14.7
10+ years 27 18.9
Elementary Schools Improving 25 17
Non-improving 25 17
Middle Schools Improving 23 16
Non-improving 31 22
High Schools Improving 22 15
Non-improving 17 12
Note: Totals do not equal 100% or N = 143 due to non-responses in demographic variable.
To explain the influence of the teacher’s demographic variables on their perception of the
leadership styles of the principals, a multiple regression was conducted on the
demographic variables and school status on transformational, transactional, and passive

105
avoidant leadership styles. Table 16 shows that the teacher’s demographic variable of
“years in current school” was the only variable that was significant (t = -1.17, p < 0.05),
indicating that the years in the current school of the teacher had a significant impact on
how they perceived their principal’s leadership style as transformational. However, the
overall linear combination of predictors was not significant in predicting teachers’
perceptions of their principals’ leadership style as transformational, F (5,136) = 1.34, p =
.25. The R2
was .05 and the adjusted R2
was .02. The four remaining predictors were not
significant.
Table 16
Multiple Regression Explaining Transformational Leadership Style and Demographics
for School Improvement Status (N = 143)
B SE β t Sig.
(Constant) 15.31 2.21 6.94 0.00
Years in current school -1.05 0.47 -0.24 -1.17 0.03*
Years as a teacher -0.02 0.54 -0.01 -0.01 1.00
Gender -0.40 1.02 -0.03 -0.39 0.70
Age 0.29 0.46 0.08 0.63 0.53
Improving & Non-improving 0.50 0.81 0.05 0.61 0.54
Note: * statistically significant
None of the teachers’ demographic variables and school status was a significant
predictor for teachers’ perceptions of their principals’ transaction leadership style (all the
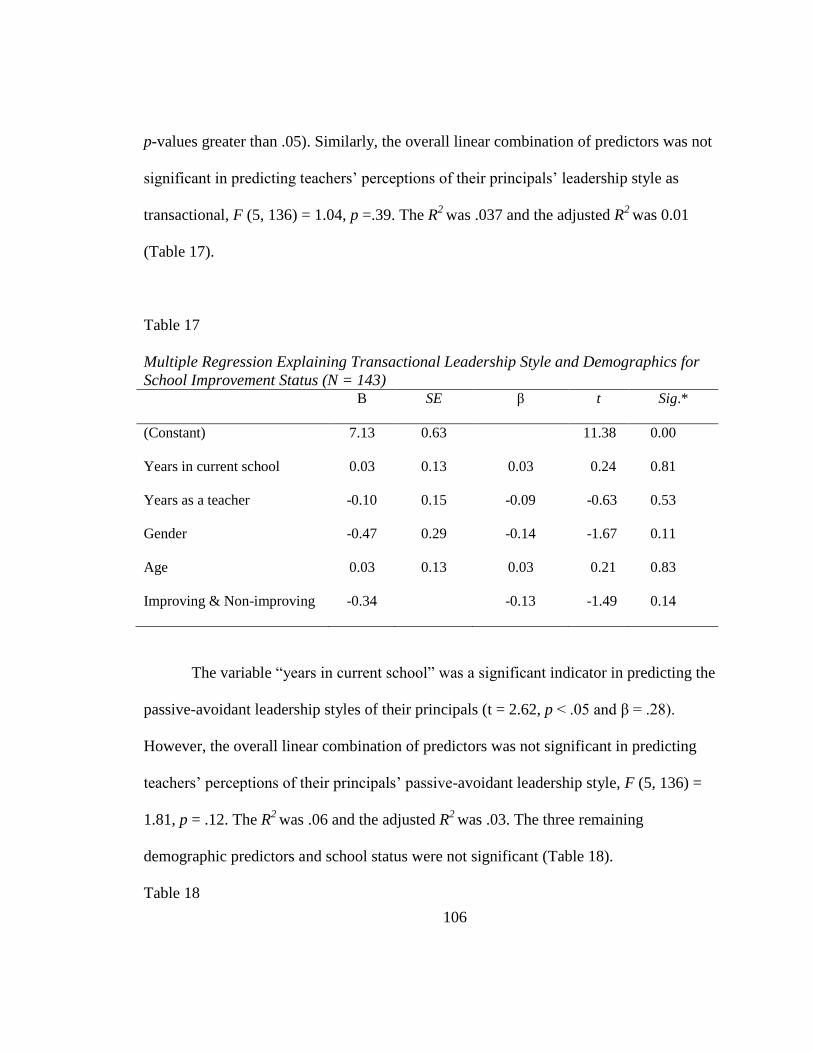
106
p-values greater than .05). Similarly, the overall linear combination of predictors was not
significant in predicting teachers’ perceptions of their principals’ leadership style as
transactional, F (5, 136) = 1.04, p =.39. The R2
was .037 and the adjusted R2
was 0.01
(Table 17).
Table 17
Multiple Regression Explaining Transactional Leadership Style and Demographics for
School Improvement Status (N = 143) B SE β t Sig.*
(Constant) 7.13 0.63 11.38 0.00
Years in current school 0.03 0.13 0.03 0.24 0.81
Years as a teacher -0.10 0.15 -0.09 -0.63 0.53
Gender -0.47 0.29 -0.14 -1.67 0.11
Age 0.03 0.13 0.03 0.21 0.83
Improving & Non-improving -0.34 -0.13 -1.49 0.14
The variable “years in current school” was a significant indicator in predicting the
passive-avoidant leadership styles of their principals (t = 2.62, p < .05 and β = .28).
However, the overall linear combination of predictors was not significant in predicting
teachers’ perceptions of their principals’ passive-avoidant leadership style, F (5, 136) =
1.81, p = .12. The R2
was .06 and the adjusted R2
was .03. The three remaining
demographic predictors and school status were not significant (Table 18).
Table 18
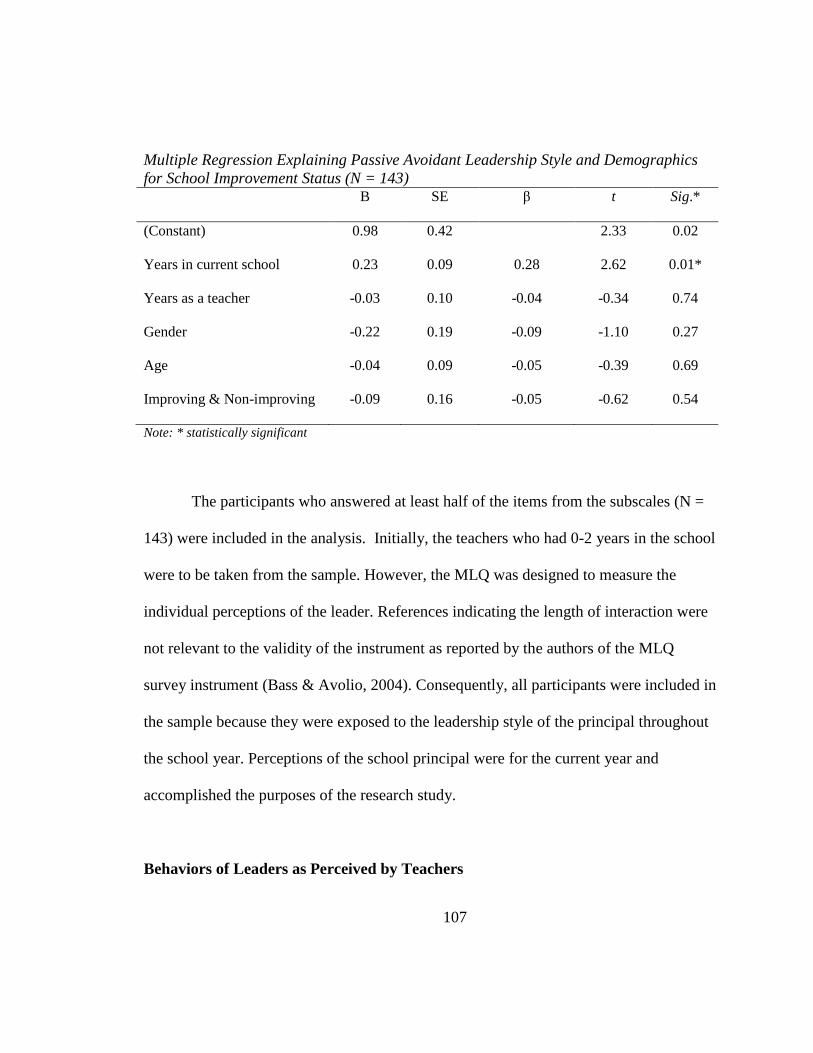
107
Multiple Regression Explaining Passive Avoidant Leadership Style and Demographics
for School Improvement Status (N = 143)
B SE β t Sig.*
(Constant) 0.98 0.42 2.33 0.02
Years in current school 0.23 0.09 0.28 2.62 0.01*
Years as a teacher -0.03 0.10 -0.04 -0.34 0.74
Gender -0.22 0.19 -0.09 -1.10 0.27
Age -0.04 0.09 -0.05 -0.39 0.69
Improving & Non-improving -0.09 0.16 -0.05 -0.62 0.54
Note: * statistically significant
The participants who answered at least half of the items from the subscales (N =
143) were included in the analysis. Initially, the teachers who had 0-2 years in the school
were to be taken from the sample. However, the MLQ was designed to measure the
individual perceptions of the leader. References indicating the length of interaction were
not relevant to the validity of the instrument as reported by the authors of the MLQ
survey instrument (Bass & Avolio, 2004). Consequently, all participants were included in
the sample because they were exposed to the leadership style of the principal throughout
the school year. Perceptions of the school principal were for the current year and
accomplished the purposes of the research study.
Behaviors of Leaders as Perceived by Teachers
108
Research question five explored the behaviors of school principals that influence
student achievement as perceived by the teachers. The teachers were asked “What
principal behaviors influence teachers and student achievement?” As related in Chapter
Three, a Microsoft Excel database divided the responses by theme, school level and
improving and non-improving schools. The response analysis found emerging themes to
clarify findings and produce predictable responses (Creswell, 2007). Each theme
represented the findings and effectively illustrated the style of leadership within the
situational leadership framework. To maintain the fidelity of the teachers' open-ended
responses, the researcher analyzed the responses by reading the answers initially for
completeness to verify their usability in the study. Subsequent readings narrowed the
focus of the responses, identified the themes and broke down the data into manageable
segments for comparisons, contrasts, and categories (Schwandt, 1997).
Emerging Themes
The researcher color coded the responses by common cues found in the responses.
Three themes emerged from the teacher’s beliefs about principal leadership style:
principal role modeling, school culture, and leadership decisions (Table 19). The
framework used to identify and define the themes consisted of an assessment of the
teacher responses describing how their leader influences student achievement through
principal role modeling, school culture, or leadership decisions. Overall, teachers selected
school culture as the theme having the most significant impact on student achievement in
109
both improving and non-improving schools. All comments from participants can be
found in Appendix E.
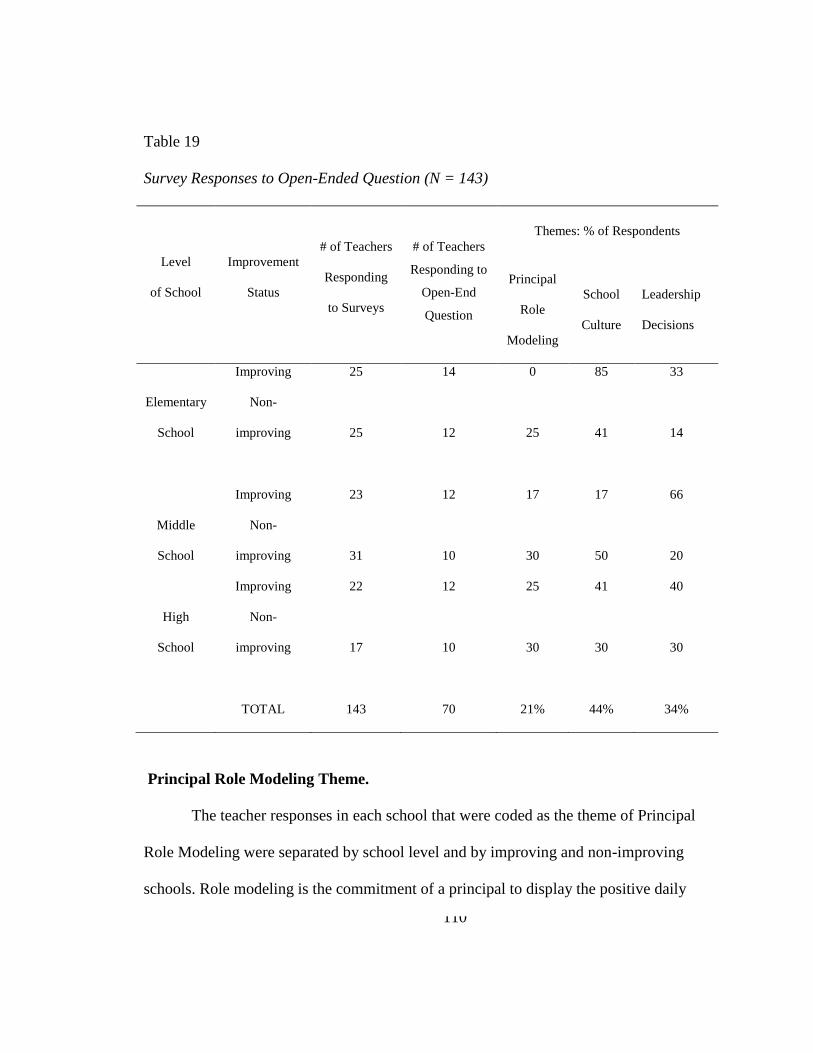
110
Table 19
Survey Responses to Open-Ended Question (N = 143)
Level
of School
Improvement
Status
# of Teachers
Responding
to Surveys
# of Teachers
Responding to
Open-End
Question
Themes: % of Respondents
Principal
Role
Modeling
School
Culture
Leadership
Decisions
Elementary
School
Improving 25 14 0 85 33
Non-
improving 25 12 25 41 14
Middle
School
Improving 23 12 17 17 66
Non-
improving 31 10 30 50 20
High
School
Improving 22 12 25 41 40
Non-
improving 17 10 30 30 30
TOTAL 143 70 21% 44% 34%
Principal Role Modeling Theme.
The teacher responses in each school that were coded as the theme of Principal
Role Modeling were separated by school level and by improving and non-improving
schools. Role modeling is the commitment of a principal to display the positive daily
111
actions that impact staff perspectives of the school’s leadership (Leithwood & Riehl,
2005). An aggregate of the responses to the question “What principal behaviors influence
teachers and student achievement?” produced the percentage of the teacher responses
identified as the theme by school and by level.
The improving elementary schools had no teacher responses coded as Principal
Role Modeling. The non-improving elementary schools had 25% of their teachers report
that Principal Role Modeling influenced them and student achievement. A teacher
responded with “she challenges me to think beyond the surface. She expects me to have
depth of knowledge in my profession and will do what she has to do to get me that
knowledge if I don't have it.”
The improving middle schools experienced a 17% response from their teachers
reflecting the theme. A survey response from a teacher in an improving school indicated
“She is very positive and sets a good example. She has high standards and expectations.”
The non-improving middle schools had 30% of their teachers respond to the question
indicating that Principal Role Modeling impacted their teaching. A teacher from a non-
improving middle school wrote: “She is accessible to teachers and visits classrooms
regularly.”
Of the three school levels, the high schools had the least difference between
improving and non-improving schools for the Principal Role Modeling theme. Twenty-
five percent of the improving high school teachers reported comments supportive of this
theme. A teacher at the improving school wrote “Our principal has a strong sense of
112
purpose and inspires us to do the same.” The teachers at the non-improving high schools
reported Principal Role Modeling as influential on their teaching at a rate of 30%. A
teacher from a non-improving high school responded: “She shows how she wants us to
teach, she is an excellent role model.”
School culture theme. The teacher responses in each school that were coded
under the theme of school culture were separated by school level and by improving and
non-improving schools. Effective school leaders create a work culture without roadblocks
to student engagement and without interference in the building of teacher capacity (Bason
& Frase, 2004). A positive school culture is built through teacher-focused leaders who
build teacher capacity. School culture had the highest percentage of teachers indicating
that this theme had an impact on their teaching when answering the open-response
question.
The improving elementary schools had 85% of their teacher responses coded as
indicating school culture had an impact on their teaching and student achievement as seen
in Table 20. This was the highest percent reported for the three themes, the three school
levels and between the improving and non-improving schools. A teacher from an
improving elementary school indicated her leader provided a positive school culture:
“She encourages us to believe that we may be the only person that tells a child they are
loved and that we may be the only motivation that they have. We have to remain a
positive force in all children’s lives.” Another teacher in an improving elementary school
responded: “She is approachable and responds quickly to legitimate concern voice by
113
staff member, parents, and students.” The non-improving elementary schools had 41% of
their teachers report that school culture influenced their teaching and student
achievement. A teacher in a non-improving school wrote: “(Our Principal) is always
positive and complimentary towards the faculty in emails and demeanor. She's always
complimentary towards the students and supports teachers to the parents.”
The non-improving middle schools had 50% of their teachers respond to the
question indicating that school culture influenced their teaching. The improving middle
schools experienced a 17% response from their teachers reflecting the theme. A teacher
in a non-improving school stated about the principal that, “She has positive, friendly
attitude. She seems to have the belief that we are all doing our job and are all capable of
achieving student success.” A teacher from a non-improving middle school wrote: “He is
an effective "coach" and is upbeat and positive.” Another teacher from a non-improving
middle school acknowledged the teacher’s responsibility as they wrote: “It's not the
principal's responsibility to engage teachers to improve student performance. It is the
teacher's role and personal responsibility.”
School culture was the highest reported theme by both the improving and non-
improving high schools. The improving high school teachers reported a 41% rate for this
theme. A teacher from an improving high school wrote, “She uses data, establishes
relationships and builds community.” Another high school teacher from an improving
school wrote, “Our principal has a strong sense of purpose and inspires us to do the
same.” Thirty percent of teachers at the non-improving high schools reported School
114
Culture as impacting their teaching. A teacher from a non-improving high school
commented that the principal “Addresses all and reminds all. Recognizes success and
says thank you. For some people, he says good-bye and good luck.”
Leadership decisions theme. The improving elementary schools had 14% of
their teacher responses coded as Leadership decisions (Table 20). Leaders make daily
decisions that impact the motivation of teachers who constantly gauge the magnitude of
their principal’s requests and whether or not to respect their decisions (Marzano,
McNulty & Waters, 2003, Gray & Ross 2006). This theme had the smallest percentage of
teacher responses among all school levels in both improving and non-improving schools.
A teacher from an improving elementary school indicated on her survey: “Our principal
is always on task and enthusiastic to direct attention to anything that will benefit the
students in the long run.”
The non-improving elementary schools had 33% of their teachers report that
leadership decisions made by the principal influenced their teaching environment. A
teacher responded with “She is willing to go into the classroom and assist in teaching,
such as she did before FCAT writing. She wants the best from everyone at all times. She
is amazing with the kids. They respect her and are able to relate to her. She is someone
who can listen to you without judgment and wants the best for the students, school and
fellow teachers.”
The improving middle schools experienced a 66% response from their teachers
reflecting the theme. This percent was the highest for all three levels of schools of both

115
improving and non-improving schools for this category. A teacher from an improving
middle school responded to the open-ended survey question with, “She has strong
leadership skills and says we are in this together.” The non-improving middle schools had
20% of their teachers respond to the question indicating that Leadership Decisions
affected their teaching. One of the teachers in the 20% wrote: “Our principal is fair and
objective when dealing with issues and encourages staff and students to work to their
potential.” Another teacher from a non-improving middle school wrote, “Our principal is
fair and objective when dealing with issues and encourages staff and students to work to
their potential.”
The improving high school teachers reported a 33% rate for this theme. A teacher
at the improving school wrote, “He is a motivator! He really assesses what needs to
happen on campus for the good of the majority and does his best to follow through with
his 'Vision' so we can be successful as a school.” The teachers at the non-improving high
schools reported Leadership Decisions as influential on their teaching at a rate of 40%. A
teacher from a non-improving high school wrote “Our principal engages in strong,
decisive leadership and attempts to engage students on the basis of their potential
success.” Another teacher from a non-improving high school expressed, “She engages in
strong, decisive leadership and attempts to engage students on the basis of their potential
success.”
Leadership Outcomes and Principal Leadership Style
116
Research question number six seeks to measure the leadership outcomes of job
satisfaction, effectiveness, and extra effort evidenced by the teacher’s perceived
leadership styles of their principals. Avolio and Bass (2004) define a successful outcome
as one that pertains to the leader’s motivational influence on the follower’s effectiveness
and extra efforts that lead to individual satisfaction. The survey instrument had three
items for extra effort, four items for effectiveness and two items for satisfaction.
The largest frequency was reported for each leadership outcome on the Likert
type scale as “frequency, if not always.” As related in Table 20, 45% of the teachers
viewed the leadership of their principals with satisfaction. Effectiveness as an outcome of
leadership was the next most frequent response with over 41% of the respondents.
Teachers indicated their principals put forth an Extra Effort in their leadership with the
lowest frequency and 33.6%.
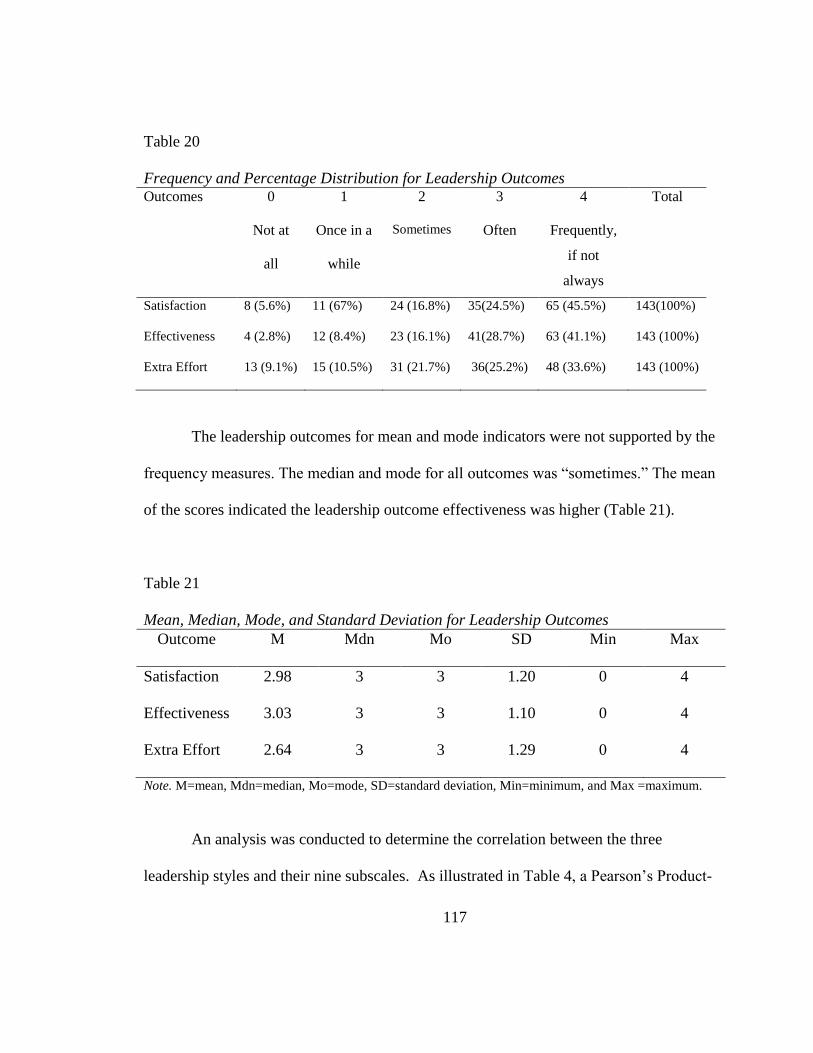
117
Table 20
Frequency and Percentage Distribution for Leadership Outcomes Outcomes 0
Not at
all
1
Once in a
while
2
Sometimes
3
Often
4
Frequently,
if not
always
Total
Satisfaction 8 (5.6%) 11 (67%) 24 (16.8%) 35(24.5%) 65 (45.5%) 143(100%)
Effectiveness 4 (2.8%) 12 (8.4%) 23 (16.1%) 41(28.7%) 63 (41.1%) 143 (100%)
Extra Effort 13 (9.1%) 15 (10.5%) 31 (21.7%) 36(25.2%) 48 (33.6%) 143 (100%)
The leadership outcomes for mean and mode indicators were not supported by the
frequency measures. The median and mode for all outcomes was “sometimes.” The mean
of the scores indicated the leadership outcome effectiveness was higher (Table 21).
Table 21
Mean, Median, Mode, and Standard Deviation for Leadership Outcomes
Outcome M Mdn Mo SD Min Max
Satisfaction 2.98 3 3 1.20 0 4
Effectiveness 3.03 3 3 1.10 0 4
Extra Effort 2.64 3 3 1.29 0 4
Note. M=mean, Mdn=median, Mo=mode, SD=standard deviation, Min=minimum, and Max =maximum.
An analysis was conducted to determine the correlation between the three
leadership styles and their nine subscales. As illustrated in Table 4, a Pearson’s Product-

118
moment Correlation Coefficient (r) was used to determine the correlation between each
leadership subscale and the three outcomes of leadership.
Statistically significant correlations (p < 0.01) were found between the all five of
the transformational leadership subscales (IIA, IIB, IM, IS, and IC) (Table 22). As
expected, they were strongly correlated with each other (r = .74 to .91). There was one
transactional scale, management by exception- active (MBEA) that did not have
statisticlly significant results. There were no significant correlations between the three
transactional leadership subscales (CR, MBEA and MBEP). There was a statisticlly
significant correlation (p < 0.01) between the transactional leadership subscale of
contingent reward (CR) and the five transformational leadership subscales. In addition,
statistically significant correlations (p < 0.01) existed between passive-avoidant (PA) and
the five transformational leadership subscales and one transactional leadership subscale
of contingent reward (CR).

119
Table 22
Correlations between Leadership Subscales (N= 143)
IIA IIB IM IS IC CR
MBE
A MBEP PA EE EFF
S
A
T
IIA 1
IIB .86** 1
IM .91** .90** 1
IS .89** .76** .84** 1
IC .84** .74** .82** .86** 1
CR .87** .79** .89** .85** .84** 1
MBEA .02 .05 .02 -.04** -.03** .03** 1
MBEP -.60** -.49** -.59** -.54** -.52** -.53** .20** 1
PA -.69** -.61** -.67** -.61** -.61** -.62** .09** .74** 1
EE .86** .76** .84** .81** .80** .80** .01 .56** .63** 1
EFF .90** .79** .66** .65** .82** .84** .02 .55** .68* .88** 1
SAT .91** .80** .85** .85* .84** .87 .05 .60** .70** .90** .91** 1
Note: IIA=Idealized Influence Attributes, IIB=Idealized Influence Behaviors, IM=Inspirational Motivation,
IS=Intellectual Stimulation, IC=Individualized Consideration, CR=Contingent Reward, MBEA=Management-by-
exception: active, MBEP=Management-by-exception: PA=Passive-Avoidant, EE=Extra Effort, EFF=Effectiveness,
SAT=Satisfaction, ** Correlation is significant at the 0.01 level (2-tailed). *Correlation is significant at the 0.05 level
(2-tailed).
Summary of Results
Chapter 4 examined the relationship between student achievement and principal
leadership styles in one school district in Florida. The perceived leadership style of the
principals’ was identified using the Multifactor Leadership Questionnaire survey. State
assessment scores, and demographic data were also analyzed to determine their
relationship to student achievement in improving and non-improving schools.
Correlational statistics were used with multiple regression analyses to examine these
relationships.
120
The results indicated that teachers who perceived their principals as having a
transformational, transactional or passive-avoidant leadreship styles demonstrated a
significant predictability of student achievement. However, these leadership styles were
not significant in predicting a school’s status as improving or non-improving. The
transformational and passive-avoidant leadership styles in this study had a positive
relationship with student achievement. After further breakdown of the leadership styles
into subscales, it was found that the transactional subscale of management-by-exception-
active had a negative influence on student achievement. The transformational subscale of
intellectual stimulation was statistically significant in predicting school improvement
status.
The statistical correlations with the leadership outcomes of satisfaction,
effectiveness, and extra effort found the transactional subscale of contingent reward had a
positive influence with leaders who use the transformational leadership style. The
leadership outcomes, as perceived by teachers, was seen as satisfying and effective some
of the time. While 88% of the respondents indicated a level of “sometimes” to
“frequently if not always” for their leader’s effectiveness, a comparable percentage of
84% perceived their leaders as putting forth extra effort for the schools. 68% of the
respondents indicated their were often satisfied with their leadrship. The teacher’s
demographic variable of “years in current school” was the only variable that had a
significant impact on how teachers perceived their principal’s leadership style as
transformational.
121
Overall, the teachers selected School Culture (85% of elementary, 41% of high
school, and 17% of middle school teachers) as the theme having the most signifcant
impact on student achievement in improving and non-improving schools. Teacher’s
indicated the leadership decisions theme (14% elementary teachers) had the least impact
on student approvment.
Chapter Four provided the reseacher with information to allow for conclusions on
the principal’s impact on student achievement. This data provides information for
discussions and conclusions to be made on the relationship between principal leadership
styles as perceived by teachers and student learning gains. Chapter Five will present
conclusions, implications, and recommendatons for future research.

122
Chapter 5
Summary and Discussion
As the literature suggested, the daily activities and decisions of a leader reflect the
pervasive focus and culture of a school and its leadership (Noonan & Walker, 2008).
Citizens outside the field of education often view school-based administrators as school
managers and not as instructional leaders. Due to the increasing pressures of the data
driven accountability that began with the inception of the No Child Left Behind Act of
2001, school leaders are taking a different path from the one taken by past educators. The
waning educational funding and the increasing competition to receive grants through the
private sector and the national Race To The Top initiatives have impacted how schools
function. School leaders are shifting their focus from a managerial style of school
leadership to a teacher-focused style to meet the challenges of increasing student
achievement (Bredson, 2005, Lazaridou, 2006).
How does a leader change the focus of followers? By increasing human capacity,
leaders have the ability to utilize personnel strengths and to excel in meeting the goals of
the school. Furthermore, school capacity is increased through the collective power of a
school staff to reach a common goal. For educators, the goal is universal and is simply
defined as increasing student achievement. A teacher-focused leader develops school
capacity thereby enhancing the teacher’s capacity to increase student achievement.
123
Purpose of the Study
The purpose of this research was to study how leadership styles impact student
achievement. The researcher asked teachers to provide their perspective of their
principals through an anonymous survey. Teachers from 16 schools received emails at
their public school in one central Florida district. An aggregate of the teacher survey
results was used to define principals’ leadership style in improving and non-improving
schools. The trends from three years of the statewide FCAT assessment data were used to
determine if a school was improving or not improving student achievement.
The relationship between principal leadership style and school student
achievement was analyzed to answer the research questions. The empirical results from
the study indicated there was a relationship between how teachers perceived principals
leadership style and student achievement. The teacher’s gender, age, years of experience,
and years with their current principal were studied to find the relation to their
interpretation of the principal’s leadership style.
Research Questions
Consistent with the purpose of this study, the research questions that guided the
investigation of the relationship between principal leadership styles and student
achievement were:
1. How do teachers in improving and non-improving schools perceive the leadership
styles of their school principals?

124
2. What is the relationship between the leadership style of the school principal as
perceived by their teachers and the achievement of their students as measured by
the FCAT over a three year period in improving and non-improving schools to the
FCAT?
3. What is the relationship between the school principal’s leadership style as
perceived by their teachers on the on the five transformational, three transactional
and one passive-avoidant leadership scale and student achievement in improving
and non-improving schools to the FCAT?
4. What is the relationship of teacher gender, age, years of experience as a teacher,
and years of experience at their current school to their perception of the
principal’s leadership style in improving and non-improving schools?
5. What are the behaviors of school principals that influence student achievement as
perceived by the teachers? Teachers were asked “What are the behaviors of your
principal that engage teachers and improve student performance?”
6. How do teachers perceive the leadership styles of their school principals as
leadership outcomes of satisfaction, effectiveness, and extra effort?
Context of the Study
This study examined the relationship between the principal leadership styles,
student achievement and teacher demographic variables in improving and non-improving
125
schools. School leaders influence student achievement through the leadership styles they
exhibit that influence their teachers (Barnett, et al; Avolio & Bass, 2005; Blase & Blase,
1999). The current federal and state demands to produce high student test scores have
necessitated further study of effective leadership styles.
The study was conducted in a Florida school district with 93,000 students and
over 12,000 employees. The school district is the 40th
largest school district in the nation
and the eighth largest school district in Florida. The district was under corrective action
as identified by the Florida Department of Education through the No Child Left Behind
criteria at the time of this study. The district poverty rate is 63% with a graduation rate of
74.7% in 2009 (FDOE).
In order to be included in the sample, the school had to be in existence for at least
three school years with the same principal during that time. The school also had to have
at least three years of FCAT test data and not be a charter, combination, private, or
alternative school (Appendix B). This selection process identified 58 qualifying schools
prior to the second elimination based on improvement status criteria.
This research study design was exploratory, nonexperimental and correlational
that examined the relationship between the principal’s leadership style and the student
achievement in improving and non-improving schools. The use of a commercially
available quantitative survey instrument, the MLQ (5x-Short) collected data from
teachers to identify their perceptions of the leadership style of their principal. The MLQ
has been revised and validated for over 30 years and is used to investigate leadership
126
styles through educational, military, business, and other industries (Avolio & Bass,
2004). The state assessment test, FCAT, was utilized as the measure of student
achievement. Purposeful sampling was used to qualify and select a total of 16
elementary, middle and high schools in the school district.
Discussion of the Findings
Leadership styles and improving and non-improving schools. The definition
of an improving school has changed throughout the last half century. No longer is a
principal responsible for determining what makes their school successful. A nationwide
data-driven focus on school improvement has taken the reigns by defining school success
through student test scores and other data within a complex system of differentiated
accountability. This top – down accountability filters through the school districts and
takes the form of pervasive district mandates for principals to bring up student test scores.
As the principal receives directives from the school districts and states, it is their
responsibility to infuse the mandates within their schools. How principals respond to
these mandates and implement needed changes is a reflection of their leadership styles.
Brooks, et al (2002) found the internal string of day to day leadership decisions had a
higher impact on the final product than direct mandates to improve from outside of the
school.
Building school capacity to increase student test scores starts with teacher
efficacy. Principal actions perceived as negative toward teachers may result in a lower
127
quality of instruction and a lack of student engagement. Teachers who feel stressed,
paranoid, insecure or fearful may lack the self-efficacy necessary to contribute to school
improvement. Effective principals take the time to communicate changes, answer
questions and work toward a pragmatic system of allocating scarce resources to help
teachers cope. Teachers who considered themselves abused by the administration had a
low overall involvement in collaborative opportunities (Blase & Blase, 2002).
This study demonstrated that a principal’s leadership style may influence school
capacity and student learning gains. As discussed in the literature review, leadership style
drives the critical decisions that develop school capacity which can impact student
achievement. O’Donnell & White (2008) found a significant relationship between how
teachers perceive a principal’s decision making in regard to the school learning climate
and student achievement. Further, the teachers’ perception of their leader’s desire to
create a positive school culture may lead to high student learning gains (Rice & Roelike,
2008). Not surprisingly, teachers will use their talents and time to support new mandates
designed to bring up test scores only if they feel supported by their principal.
This study found that transformational, transactional and passive-avoidant
leadership styles were statistically significant predictors of student achievement;
however, school status was not significan,t indicating little difference in student
achievement between improving and non-improving schools. This was not surprising
since the school district was in corrective status.

128
Transformational leadership style had a significant relationship with school status
and student achievement. Intellectual stimulation, a subscale of transformational
leadership style, had positive relationships with school status and student achievement.
To review, the transformational leader motivates and educates subordinates toward
making decisions without interaction with supervisors. This leader delegates
responsibilities with frequent inspections for compliance. The intellectual stimulation
subscale describes a leader who is willing to help others think of new solutions to old
problems. As with idealized influence and inspirational motivation, these leaders
encourage the questioning of a belief system and assumptions when appropriate (Bass &
Riggio, 2006). The intellectual stimulation subscale describes a leader who provides a
school culture for followers that encourages alternative solutions and the freedom to use
their own talents to solve problems. The teachers in this study also rated school culture as
the highest of the three themes identified in the open-ended question on the survey. The
teachers’ comments indicate they associate positive leadership behaviors with positive
school culture and support the work of Alt, Beltranena, & Hoachlander (2001).
The transactional leadership style was also a significant predictor of student
achievement. To review, the transactional leader is a “hands on” leader. This leader
delegates responsibilities with frequent inspections for compliance. This research finding
supports Leithwood (1992) who cautioned that transactional leadership builds school
capacity but does not have the critical push of transformational leadership to instigate
extreme school improvements. As reported in the literature review, teachers respond
129
positively to transactional leadership style if they are provided with frequent
opportunities to reflect on classroom experiences and are provided with quality
professional development (Marks & Printy, 2003).
Contingent reward, in this study, was the transactional leadership style subscale
with the highest mean for improving and non-improving schools and the least variance of
the mean. The transactional leader using contingent reward behaviors clarifies
expectations and offers recognition and rewards when goals are achieved. Many of the
participants in this study have had their teaching career under the NCLB reform act and
its predecessors where contingent reward systems continue to be the norm.
The Management by Exception-Active subscale had a negative relationship with
student achievement. Management by Exception-Active would be representative of a
principal that specifies the standards for compliance and may punish followers for being
out of compliance of set standards. Corrective action is taken as quickly as possible for
deviances and mistakes. This type of leadership, where corrective action is taken in an
expedient manner, may be viewed as more prevalent in today’s high stakes accountability
era, particularly in schools in corrective action.
It is the researcher’s opinion that teachers are fearful of the constant state
mandates and district directives. This insecurity may lead teachers to look to their leader
for more direction than in previous years. It was supported in this study that principals
may need to develop more skills in and different types of leadership behaviors in this
climate of increased accountability.
130
Principal leadership styles and student achievement. The need for data to
determine the effectiveness of a child’s education has taken on a new life through test
scores for all ages. Students are tested upon entering kindergarten to record a baseline for
future instruction or remediation, which ever fits the child’s academic abilities. This early
definition of a student’s ability shadows them through their school years in a quest to
create a homogeneous population of young scholars. The practice of using social
promotion to advance students with their age group is now viewed as malpractice by
some educators and most politicians. What is the cause of this societal push for
quantitative proof of student achievement? The 2001 implementation of NCLB and 2010
implementation of Race to the Top tie dollars and other valuable educational resources to
student achievement.
By starting with the end in mind, it is evident that student scores are directly
influenced by their teachers. The principals serve in an indirect capacity in improving
student achievement. School administrators are charged to improve the student
performance in their school within a limited time. However, it is the teacher who directly
influences the student performance of a school as they work with the students on a daily
basis. Obviously influencing the actions of teachers is a vital component in raising test
scores. How does a leader control the actions and decision made by a staff member in a
closed classroom? Open communication and earning and maintaining the teacher’s trust
in their administration will build school capacity (Caltabiano, Graham, Timms, 2006,
Glover, 2007, Noonan & Walker, 2008).
131
The transactional leadership style subscales of contingent reward and
management by exception-active were found to predict student achievement in both
improving and non-improving schools as indicated by the regression correlation (r) score
of .31. Considered a micro-managing option, transactional leaders promote followers to
recognize what needs to be accomplished and gives them the authority to complete tasks
thus enhancing their self-efficacy. Effective principals adapt to the condition of a school
by making changes over time that address student outcomes and staff morale. Hallinger
and Heck (1998) found flexibility is important in a leader’s decision to increase student
achievement by changing curriculum and pedagogy. In the end, the principal has to create
a school wide environment that provides him or her with the figurative x-ray glasses that
see into classrooms and effectively guide teacher actions that raise student achievement.
Principal leadership style. Principals spend their days making multiple decisions
on finance, law, curriculum, personnel, discipline and other areas. In fact, there is no
routine a principal can follow to manage a school. Each decision is made in a fishbowl
and judged by the principal’s staff, supervisors, students and community. The end result
of their decisions and efforts are published in the form of student standardized test scores
that represent each of the 180 days of instruction for that school year. As supported in the
literature review, there are combinations of leadership styles that create a myriad of tools
for the leader. Situational leadership provides the principal with the opportunity to select
right choice for the school situation. As expressed in the last section, teachers are pivotal
in raising test scores. Blanchard and Hersey (1979) stated that situational leadership is not
132
necessarily as important to the level of management as it is to the maturity level of the
teacher.
In general, teachers have a desire to be led by their principals (Barnett, Craven &
Marsh, 2005). The feeling of abandonment in an environment of merit pay and teacher
cuts fosters insecurity and creates an atmosphere that can inhibit good teaching and effect
student achievement. Further, teachers experience a negative perception of their leader if
they feel abandoned to teach independently without knowledge or accountability to the
school’s mission (Glover, 2007). School leaders have the responsibility to create a work
environment conducive to raising student achievement or pay the price of published
negative test results.
For this study, the leadership styles of the principals, as perceived by their
teachers, were identified as transformational, transactional and passive-avoidant through
the MLQ survey instrument. Each style had subgroups which provided further data to
define the principal’s style. The following section provides the results of the research for
each leadership style.
Transformational. An efficient system of management would involve training
subordinates to make their own decisions based on the common goal of the group. This is
the definition of transformational leadership. Interaction with supervisors is lessened by
competent delegated authority. Although this leadership style increases a follower’s self-
efficacy, straying off the leaders designated path is the risk. It is a dichotomous pull
between a principal’s need to utilize a transformational leadership style to allow for the
133
time needed to meet the demands of the NCLB accountability and the transactional style
which demands a constant monitoring of directives on how to increase student test scores.
As indicated in this study, the school leader frequently makes decisions that fall
within a leadership style that has transformational leadership subscales defined by the
MLQ survey instrument as: Idealized Influence (attributed), Idealized influence
(behavior), Inspirational, Motivation, Intellectual Stimulation, and Individual
Consideration. Not only were these factors identified on the MLQ but was indicated in
the comments of the teachers in response to the open-ended question (Appendix E).
The results of the study also indicated that principals who had leadership styles identified
on the transformational subscale intellectual stimulation had influence on their improving
and non-improving schools.
Transactional. Transactional leadership style has been identified as having the
most significant impact on teachers and student achievement in this study. The subscales
are Contingent Reward, Management by Exception – Passive, and Management by
Exception – Active. Transactional leadership style was significant in relation to
improving and non-improving schools. The subscale with the highest negative influence
on leadership style and student achievement was Management by Exception – Active.
The MLQ manual describes this subscale as a leader’s focus on monitoring task
execution for any problems and correcting problems to maintain current performance
levels.
134
The transactional leader is a front line, hands on leader. The style is not as
comfortable for some leaders due to the time it takes to monitor leadership directives.
Plus, there can be a discomfort between leaders and subordinates when there is a lack of
leadership skill or knowledge to actively lead a school. This study made evident that
contingent reward was dominate in non-improving schools. This subscale usually
characterizes a frequently ineffective leadership style that offers recognition and rewards
for goals that are achieved (Avolio & Bass, 2004). However in the context of this study,
transactional leadership style had a positive relationship between both improving and
non-improving schools and leadership style. This may not be surprising since teachers
with less than fifteen years of experience have mainly worked in the NCLB era where the
use rewards and punishments is the norm.
Passive-avoidant. The principal who does not participate in the daily decisions
made in a school is defined as passive-avoidant. This leader works behind a desk and
abdicates responsibility as the instructional leader of the school who supports teachers.
This leader does not have the characteristics found in either transformation or
transactional leadership styles. This type of leader is absent, avoids responsibilities and
clarifying questions, and fails to make important decisions (Avolio & Bass, 2004; Bass &
Riggio, 2006).
The results of this study indicated that principals in both improving and non-
improving schools had a low percentage of passive-avoidant leadership characteristics.
However, the data is not significant due to low effective size (.07). The passive-avoidant
135
or laissez-faire leadership style had only one subscale. This is not surprising as today’s
school principals must act to improve their student achievement as called for in NCLB.
Demographic variables and leadership styles. The variables were years as a
teacher, years at their current school their gender and age. According to this study,
overall linear combination of predictors was not significant for years as a teacher, gender,
age, and school status of their principals' leadership styles. Only one of the demographic
variables, “years in current school,” was related to the teacher’s perception of the
principal’s leadership style as transformational. The longer teachers were at their current
school, the less likely they perceived their principal as a transformation al leader.
The results of research question number four does not support the body of
literature which reports teacher demographics impact their opinions of their leaders
(Daugherty, Kelley, Thornton, 2005). The data in this study did not support age or gender
as a factor in the perception of the principal’s leadership style. Consequently, the
researcher believes a more expanded demographic survey questions may have yielded
different results.
Teacher perspectives on leadership behaviors
Principal role modeling. A visitor to any school campus can feel the presence of
an active principal. By watching the staff work and move throughout the campus it

136
becomes apparent that the principal has either been through the halls very recently or has
never darkened the teacher’s doors. A principal is a role model for active student
engagement or for apathy. As reported in the literature review, Fullan (2001) claimed
principals who affect change see the big picture and model energy, enthusiasm, and hope.
Leadership role modeling provides staff and students with motivation to continue to
support leadership initiatives (Alt, Beltranena & Hoachlander, 2001).
The results of this study supported these assertions through the teacher responses
to the open-ended survey question: “What are the behaviors of your principal that engage
teachers and improve student performance?” The aggregate data from the non-improving
elementary schools reported that 25% of their teachers indicated that Principal Role
Modeling influenced them and student achievement. 30% of the teachers in non-
improving middle and high schools indicated the role modeling of the principal was
important. It is the researcher’s belief that the teachers in this study wanted their principal
present and confident in decision making when important issues arise (Barnett, Craven &
Marsh, 2002).
Interestingly, the teachers responding to the survey from improving schools did
not have a large percentages in the area of Principal Role Modeling. It is the researcher’s
opinion that the principal may have set a precedent of visibility on campus; therefore,
teachers do not consider this action unique or noteworthy in their interpretation of how
their principal actively raises student achievement. The literature review reported the first
and most powerful strategy to drive teacher actions is principal visibility while carrying

137
out actions toward increasing student achievement. The second most powerful strategy is
the principal’s direct lead of individual teachers to encourage high self-efficacy
relationships (Janzi & Leithwood, 1996).
Building school capacity. Fullan (2002) stated that school leaders are the driving
force of sustainable education reforms. Success starts with switching from a managerial
style of leadership that stresses procedures and the implementation of past doctrine to a
leadership style that embraces a common purpose to increase student achievement (Bush,
2007). The active and knowledgeable principal exemplifies the role of instructional
leader. Teachers influence the school culture by working together on a principal-driven
path toward increasing student achievement to make it possible to excel beyond a system
built on top-down mandates.
The results of this study supported the literature and confirmed the importance of
building school capacity that facilitates student achievement. Improving elementary
schools had 85% of their teachers indicate positive school capacity or culture was the
priority of their principal. This had the highest percentage reported for the three themes
and the three school levels. The non-improving high schools had only 30% of the
teachers that indicated school capacity was important. All other levels in non-improving
and improving schools had higher percentages in this area. The results of this study
indicated that the teachers are aware when their principal strives to build capacity or is
apathetic to the needs of the school culture. To extend this point, the open-ended
138
question responses were written with more concrete examples and passionate claims for
this theme than the other two themes: Principal Role Modeling and Leadership Decisions.
Leadership decisions. The plethora of leadership literature fosters successful
change in business, as well as educational institutions. It is apparent that necessity drives
invention. Education is no exception to being influenced by the latest leadership trends
and ideas. The need for quantitative data to demonstrate student growth requires
principals to make effective leadership decisions daily. A principal’s leadership style is a
powerful agent of change that influences school capacity and impacts student learning
gains (Marks & Printy, 2003). To succeed, a principal must be aware of and adapt to the
culture of the school by making changes over time that address student outcomes and
staff morale. Hallinger and Heck (1998) found flexibility was a key component in a
leader’s decision to increase student achievement by changing curriculum and pedagogy.
Each of the school levels had inconsistent percentages of responses. It was found
that improving elementary schools only had 14% of their teachers believe decision
making was important. However, leadership decisions were found as important in 66% of
teachers in improving middle schools and 33% in the improving high schools. This
inconsistency may be attributed to the different levels of schools or to the improving
schools’ principals not being as directive as perhaps the non-improving schools.
Leadership Styles and Leadership Outcomes
139
The principal’s leadership style outcomes were measures as perceived by the
teachers’ satisfaction for their leader’s methods, their judgment of their leader’s
effectiveness, and the extra efforts made to determine the best decision for the school.
These outcome scales of effectiveness, satisfaction and extra effort provided the
researcher with information on how the teachers viewed their principal’s ability to raise
the awareness of the importance of achieving these valued outcomes (Bass & Avolio,
2004). Each of the outcomes was measured against the transformational leadership style
of the principals (Avolio & Bass, 2004). Transformational leaders facilitate a change in
their schools by working to shift the viewpoint of their staff toward what they consider
meaningful learning and achievement.
The authors of the MLQ found the relationship between transformational and
transactional leadership suggested transformational leaders used transactional styles only
when needed to effect the satisfaction of workers (Avolio & Bass, 2004). The majority of
teachers in the study gave their principals a frequency measurement of “often” for
satisfaction, effectiveness and extra effort in their leadership outcomes.
The strongest correlation was between transformational factor of Idealized
Influence Behaviors, satisfaction (.91) and effectiveness (.90). Avolio and Bass (2004)
state Idealized Influence Behaviors include charismatic leadership vision and outgoing
behaviors that inspire others to follow. These transformational leaders create a school
culture with a permeating vision that consistently inspires teachers and other stakeholders
140
throughout their school. This inspiration is said to lead to a more productive and positive
school culture.
Conversely, the weakest correlation was between the transactional leadership
style’s subscale, Management by Exception-Active and leadership extra effort (.006).
Transactional leaders work within the school structure to assign roles and responsibilities
to achieve the desired outcomes. Transactional leaders exhibiting extra effort demonstrate
a heightened desire for others to succeed. These extra effort behaviors were not perceived
by the teachers of their principals in this study.
Limitations of the Study
The limitations of this research study were discussed in Chapter 1. After
completion of the research, there were additional limitations discovered through the data
collection and analysis process. As previously noted, the study has limits on
generalizability due to the use of only public schools from one school district. Private
schools, alternative schools, and charter schools were not included in the research.
Further, a non-randomized selection of the 16 schools served as a restriction of the study.
In addition, the following are also limitations to the current study:
It was assumed the teachers self-reported the items in the questionnaire as a
volunteer with honesty and without bias.
The researcher had no manner in which to verify the accuracy of the responses.
There were no controls for teacher performance in the classroom.
141
How the sample teachers gained their teaching certifications was not sought in this study.
The teacher’s path toward certification may have influenced their perceptions of their
school leaders.
The researcher could not verify the respondents had observed the leadership
behaviors of principals in schools.
The MLQ instrument is a perception of the styles of leadership of the principal
and may not reflect the actual style of the principal. An additional instrument, a
longitudinal study, or simply a retest within one school year would have
generated more accurate results on the teacher’s perception of their principal.
An additional limitation was added following the data collection and analysis. The
timing of the survey may have biased the teacher responses. The teachers were asked to
complete the survey in the last month of their school year. Initially, the researcher
espoused that this month would provide the teacher with a full year of exposure to the
principal’s leadership style, thus resulting in a more accurate assessment. However, this
time of year is fraught with low morale and an escaping attitude. The teacher’s outlook
may have been skewed by their desire to leave for the summer.
Finally, the order of the survey questions used on the emailed survey may have
compromised the study results. The respondents answered the majority of the first 30
questions. However, following this question, the percentage of teachers responding to the
questions waned. The open-ended question was placed at the end of the survey. This
142
placement of a question that demanded more from the teacher than the selection of a
number on the Likert-type scale may have affected the response rate.
Implications for Future Research
Future research is recommended based on the findings of this study.
1. Replicate this study through private and charter schools to obtain a broader
sample of principal leadership styles.
2. Utilize more than one school district in a state. The random selection of districts
in scattered geographic areas would add to the fidelity of the study. This action
would provide for more accurate generalization of the findings.
3. Employ more than one Leadership Style survey instrument to verify and cross
check the leadership styles as perceived by the teachers to obtain a more reliable
picture of principal's leadership styles.
4. Add the principal’s self-rating responses to determine the relationship of the
principal’s data to the teacher’s perceptions and more in depth demographic
survey questions to add to the identification of the teacher.
5. Investigate the teacher’s last professional evaluation to determine bias. Depending
on the evaluation method, the relationship between the teacher and the leader may
be compromised. State law is requiring a strict qualitative evaluation method
based on merit and student test scores. Additionally, a case study can determine
the measure of the contamination of the teacher’s perception of their leader which
may occur before or after the evaluation.

143
6. Investigate the socio-economic conditions and the size of the schools in the study
to determine if the conditions effect the teacher’s perception of the principal’s
leadership style.
7. Add the teacher’s teaching assignment and length of certification in their current
field to create a “qualification” measure for the teacher to the current study
design.
8. Replicate the study and add the student test scores for the individual teacher.
Teachers may perform better for certain principals. Create a foundation or basis
for measuring classroom data. Building a teacher measure, whether reflective or
quantitative will provide a defined type of teacher and a relationship with the
defined type of leader.
9. Add the principal’s demographic information such as years as a leader, awards
and level of education to the current study design.
10. Conduct this study each year for ten years to determine trends in leadership style
as related to state mandates.
11. Add the level of principal pay and teacher pay as compared to peers in school
districts across the state to the study design.
Conclusion
This study explored how teacher perceptions of their principal's leadership style
impacted student achievement. Raising student achievement is the ultimate goal of
educators. Principals are hit with endless requests, demands, and data on how to bring up
144
their school’s achievement levels. In the end, the school leader can only control them
self. Principals have the potential to influence student achievement through their
leadership decisions and the impact of those decisions on the teachers and ultimately the
students.
Situational leadership theory provided a framework for this research by
examining the teachers’ perception of the principals’ leadership style and its influence on
school capacity and student achievement. School leaders have the capacity to select
leadership styles that can positively or negatively influence the practices of their teachers.
Leadership behavior influences student improvement through their teachers (Blase &
Blase, 1999).
This study found that teacher perceptions of principals’ demonstrating
transformational leadership characteristics identified on the MLQ was only by a small
margin. For leaders in the improving schools, the subscale of Intellectual Stimulation had
a positive relationship with student achievement. For leaders identified by their teachers
as transformational leaders in the study and who demonstrated intellectual stimulation
were found to have a positive effect on student achievement in both improving and non-
improving schools. The leaders in the non-improving schools were observed by their
followers to provide intellectual stimulation and exhibit inspirational motivation.
However, it must be noted that the district under study has all of its Title I schools in
Correct I or Correct II for the 2011 school year, meaning that none of the schools has
made AYP. This was reflected in the low achievement criteria for selecting schools as
145
improving or non-improving. However, this indicates that teachers’ perceptions of
principals in low performing schools exhibit some transformational behaviors, as well as
transactional.
Transformational leaders are given the opportunity to lead a staff with a
predetermined direction and frequent monitoring toward attainment of the school goals.
Transformational leaders are effective and develop a strong since of loyalty from their
teachers with their traits of high visibility, consistent role modeling, and good decision
making.
As Leithwood’s research reports, transformational leaders pursue three goals:
helping staff collaborate, encouraging teachers’ improvement, and helping staff solve
problems effectively. Such practices were complementary to the leader’s vision and the
teachers’ talents and are essential to conduct a school’s daily operations (Leithwood,
1992). Principals may note that modeling what they expect from their teachers is much
more valuable than any incentive or professional development training. This study found
the transformational leader who utilized intellectual stimulation had a positive influence
on their teachers. Teachers are watching and judging school leaders based on their
actions. This is a survival skill learned by veteran teachers who have been through years
of new and improved teaching programs. Many are waiting to see if the principal is
passionate and pushes the newest and greatest program or if their leader is simply
checking the box of accountability for the district supervisors. This study supports school
146
leaders who, as perceived by their teachers, set the precedent for action through
intellectual stimulation.
In contrast, Hallinger & Heck (1998) found through a meta-analysis of 40
published research articles that the effects of transformational leadership on student
learning gains created an innovative staff, but no increase in student achievement. The
findings indicated transformational leadership decisions look different than transactional
decisions and have an indirect impact on student achievement outcomes (Hallinger &
Heck, 1998). The unrealistic time demands on over-worked teachers who accept the
collective responsibilities of the transformational leadership may eventually lead to
negative perceptions of administration and negative self-efficacy (Leithwood & Mascall,
2008). This study illustrated how utilizing the transactional leadership style contingent
reward subscale, a leader may offset the negativity with active leadership and positive
reinforcement.
Due to the demands of the No Child Left Behind Act for accountability, school
culture is even more important due to the excessive administrative responsibilities that
have led to more collective site-based management (Brooks, Giles Jacobson, Johnson, &
Ylimaki, 2007). These leadership pressures to lead and reward staff for successes in an
increased accountability era create a need to leverage competent staff resources on school
improvement and program implementation. In addition, the demands of the NCLB Act
only exacerbate the problem of increasing student achievement through leaders who lack
the instructional knowledge of content and pedagogy to assist teachers and provide a
147
transactional leadership environment. These intensifying expectations of teacher-focused
leadership create a daily balancing act that diverts the less instructional-driven
transformational principal’s attention from the other areas of management within a school
(Stewart, 2006).
In this study, contingent reward in improving and non-improving schools, as
indicated by the highest mean in transactional leadership style, may represent proactive
leadership behaviors that link rewards for positive teacher effort through negotiation. The
transactional leader communicates specific standards of conformity while monitoring for
deviance and rewarding compliance (Avolio, Bass, Berson, & Jung, 2003). It may be
that teachers are reacting to more accountability with increased expectations of monitored
and prescriptive instructional practices in school districts such as the one in this study are
working to meet the state standards and work their way out of corrective action.
Another key point is this study was designed to define a leadership style of the
principal through perception of their followers. As Bhindi, et al (2008) points out, it is the
teacher’s perception of how they are valued and supported by their leadership that has an
influence on their daily decisions to motivate students. The concurrence of teacher
support within a school and at the school district level will set the stage for positive
student achievement.
Increasing student achievement in every school is not an unreachable goal. By
supporting and listening to those who impact the students directly, measures of
achievement may improve. It is a system of organized chaos through which state and
148
district politicians direct the business of schools. Educators are notorious for being
nurturers and people pleasers.
This study supports the need for quality school district and state support that
trains principal’s to build their repertoire of leadership styles to successfully build school
capacity that supports effective teaching practices and increases student achievement.
Optimistically, in this era of accountability such state and district leadership will value
the resources of quality school leaders who demonstrate a positive impact on student
achievement through teacher-focused leadership decisions.
“'The conduct of schools, based upon a new order of conception, is so much more
difficult than is the management of schools which walk the beaten path.”
John Dewey
149
References
Aczel, A. D., & Sounderpandian, J. (2002). Complete business statistics, 5th
ed. New
York, NY: McGraw-Hill/Irwin.
Adequate yearly progress (AYP). Retrieved from http://www.aft.org/topics/nclb/ayp.htm.
Alsaker, F., Kallestad, J., & Olweus, D. (1998). School climate reports from Norwegian
teachers: a methodological and substantive study. School Effectiveness and School
Improvement, 9(1), 70-94.
Alt, M., Beltranena, R., & Hoachlander, G. (2001). Leading school improvement: what
research says, Southern Regional Education Board.
Antonakis, J., Avolio, B., & Sivasubramania, N. (2003). Context and leadership: an
examination of the nine-factor full-range leadership theory using the multifactor
leadership questionnaire. The Leadership Quarterly, 14(3), 261-295.
Armstrong, A. & Muenjohn, N. (2008). Evaluating the structural validity of the
Multifactor Leadership Questionaire. MLQ, capturing the leadership factors of
transformational-transactional leadership. Contemporary Management Research,
4(1), 3-14.
Ary, D., Jacobs, L., & Razavieh, A. (2002). Introduction to research in education, 6th ed.
Belmont, CA: Wadsworth/Thomson Publishing.
Avolio, B. J. (1999). Full leadership development: Building the vital forces in
150
organizations. Thousand Oaks, CA: Sage.
Avolio, B. & Bass, B. (1997). The full range leadership development manual for the
Multifactor Leadership Questionnaire. Redwood City, CA: Mindgarden Inc.
Avolio, B. & Bass, B. (2004). Multifactor leadership questionnaire: Third edition manual
and sampler set. Menio Park, CA: Mind Garden, Inc.
Avolio, B., Bass, B. (1995). MLQ Multifactor Leadership Questionnaire. Technical
Report. Redwood City CA.: Mind Garden.
Avolio, B., Bass, B., Berson, Y., & Jung, D. (2003). Predicting unit performance by
assessing transformational transactional leadership. Journal of Applied
Psychology, 88(2), 207-219.
Avolio, B., Bass, B. & Jung, D. (1999). Re-examining the components of
transformational and transactional leadership using the multifactor
leadership questionnaire. The British Psychological Society, 72, 441-462.
Baker, E., Betebenner, D. & Linn, R. (2002) Accountability systems: implications of
requirements of the no child left behind act of 2001. Education Research, 31/6.
Retrieved March 2010 from: http://research.cse.ucla.edu/Reports/TR567.pdf.
Baker, J., Reynolds, R. & Woods, R. (2007). Handbook of Research on Electronic
Surveys and Measurement. Idea Group Reference. Hershey, PA.
Bandura, A. (2003). Observational learning. In J. H. Byrne (Ed.), Encyclopedia of
learning and memory, 2nd ed., p. 482-484. New York: Macmillan.
151
Bandura, A., & Locke, E. (2003). Negative Self-Efficacy and Goal Effects Revisited.
Journal of Applied Psychology, 88(1), 87-99.
Barnett, H., Craven, R. & Marsh, A. (2005). What type of school leadership
satisfies teachers? A mixed method approach to teachers' perceptions of
satisfaction, Australian Association for Research in Education.
Barnet, K. & McCormick, J. (2004) Leadership and individual principal-teacher
relationships in schools. Educational Administration Quarterly, 40, 406.
Bass, B. M. (1990). Bass & Stogdill’s handbook of leadership: Theory, research,
& managerial application (3rd ed.). New York, NY: Simon & Schuster,
Inc.
Bass, B. M. (1998). Transformational leadership: Industry, military, and
educational impact. Mahwah, NJ: Lawrence Erlbaum Associates.
Bass, B. M., & Riggio, R. E. (2006). Transformational leadership (2nd ed.).
Mahwah, NJ: Lawrence Erbaum Associates.
Basom, M., & Frase, L. (2004). Creating optimal work environments: exploring teacher
flow experiences. Mentoring and Tutoring, 12(2), 241-258.
Bhindi, N., Hansen, J., Rall, J., Riley, D., & Smith, R. (2008). Questioning the notion of
“authentic” leadership in education: the perspectives of followers. Paper presented
at the meeting of the Australian Association for Research n Education, Brisbane,
Australia.
152
Biddle, B., & Saha, L. (2006). Principals and research. Education Leadership, 85(5), 32-
33.
Blanchard, K., & Hersey, P. (1979). A leadership theory for educational administrators.
Education, 303-310.
Blanchard, K., Hersey, P., & Johnson, D. (2001). Management of organizational
behavior: leading human resources. 8th ed. Upper Saddle River, NJ: Prentice
Hall.
Blase, J., & Blase, J. (1999). Principals' instructional leadership and teacher development:
teachers' perspectives. Educational Administration Quarterly, 35(3), 349-78.
Blase, J., & Blase, J. (2002). The dark side of leadership: teacher perspectives of
principal mistreatment. Educational Administration Quarterly, 38(5), 671-727.
Bloom, G., Castagna, C., & Warren, B. (2003). More than mentors: principal coaching.
Leadership, 32(5), 20-23.
Borg, W. R., Gall, J. P., & Gall, M. D. (1996). Educational research: an introduction, 6th
ed. White Plains, NY: Longman Publishers, USA.
Bosker, R., Kruger, M., & Witziers, B. (2003). Educational leadership and student
achievement: the elusive search for an association. Educational Administration
Quarterly, 39.
Boyer, K., Jackson, E., Olson, J. (2001). Electronic surveys: advantages and
disadvantages over traditional print surveys. Decision Line, 32(4):4-7.

153
Brady, P. (2008). Working towards a model of secondary school culture. Canadian
Journal of Educational Administration and Policy, 73, 1-26.
Bredson, P. (2005). Building capacity in schools: some ethical considerations for
authentic leadership and learning. Values and Ethics in Educational
Administration, 4(1).
Brooks, S., Dietz, J., Pugh, K., & Wiley, J. (2002). Driving service effectiveness through
employee-customer linkages, The Academy of Management Executive, 16(4),
73(12).
Brooks, S., Giles, C., Jacobson, S., C., Johnson, L., & Yimaki, R. (2007). Successful
leadership in three high-poverty urban elementary schools, Leadership and Policy
in Schools, 6(4), 291-317.
Bruner, D. (1997). The dynamics of work culture of low and high performance schools: a
case study. Doctoral dissertation, University of South Florida, UMI, 9815424.
Burke, K., (2009). The principal’s role in supporting teacher leadership and building
capacity: teacher and administrative perspectives. Doctoral Dissertation, San
Diego State University, San Marcos.
Burns, J. (1978). Leadership. New York: Harper & Row.
Burns, J. (2003). Transforming leadership: a new pursuit of happiness. NY: Atlantic
Monthly Press.
Bush, T. (2007). Educational leadership and management: theory, policy, and practice.
South African Journal of Education, 27(3), 391-406.
154
Caltabiano, M., Graham, D., & Timms, C. (2006). Gender implication of perceptions of
trustworthiness of school administration and teacher burnout. Australian Journal
of Social Issues, 41(3).
Christie, K., Thompson, B., Whiteley, G. (2009) Strong Leaders, Strong Achievement:
model policy for producing the leaders to drive student success, Education
Commission of the States.
Camacho, A., & Eilers, A. (2007). School culture change in the making: leadership
factors that matter. Urban Education, 42(6), 616-37.
Carless, S. (1998), Assessing the discriminant validity of transformational leader
behaviors as measured by the MLQ. Journal of Occupational and Organizational
Psychology, 71, 353-358.
Cohen, J. (1992). Quantitative methods in psychology: A power primer. Psychological
Bulletin, 112(1), 155-159.
Conger, A., Kanungo, R. (1994). Charismatic leadership in organizations. Thousand
Oaks, CA: Sage.
Creswell, J. (2007). Qualitative inquiry and research design: Choosing among five
approaches. (2nd ed.). Thousand Oaks, CA: Sage.
Daley, G., Guarino, C., & Santibanez, L. (2006). Teacher recruitment and retention: a
review of the recent empirical literature. Review of Educational Research, 76(2),
173-208.

155
Darling-Hammond, L., Davis, S., LaPointe, M., & Meyerson, D. (2005). School
leadership study: developing successful principals. Stanford Educational
Leadership Institute.
Daugherty, R., Kelley, R., & Thornton, B. (2005). Relationships between measures of
leadership and school climate. Education, 126(1), 17-25.
Demir, K. (2008). Transformational leadership and collective efficacy: the moderating
roles of collaborative culture and teachers’ self-efficacy. Egitim Arastirmalari-
Eurasian Journal of Educational Research, 8(33), 93-112.
DeMatteo, D., Marczyk, G., Marczyk, G. R., Festinger, D. (2005) Essentials of Research
Design and Methodology. John Wiley and Sons, Hoboken, NJ.
Dillman, D., & Schaefer, D. (1998). Development of a standard e-mail methodology:
Results of an experiment. Public Opinion Quarterly, 62, 378-397. Retrieved June
1, 2009 from http://www/sesrc.wsu.edu/dillman/
District Strategic Plan, (2009). Retrieved January 2011 from http://www.polk-
fl.net/districtinfo/default.htm.
Dozier, T. (2007). Turning good teachers into great leaders. Educational Leadership,
65(1), 54-8.
Eshbach, E. & Henderson, J. (2010). The symbiotic relationship between new principals
and the climate of the schools in which they lead. Journal of Organizational
Learning and Leadership, 8(1).

156
FCAT Assessment & Accountability, (2004). Assessment & accountability briefing book.
Florida Department of Education. Retrieved from
http://fcat.fldoe.org/pdf/fcataabb.pdf
Florida Department of Education (n.d.). Florida School Grades: 2009-10 School Grades
by District. Retrieved March 1, 2011, from http://schoolgrades.fldoe.org/
Florida Department of Education, Grading Public Schools, 2009. Retrieved March 3,
2010 from www.appendix-Guidesheet2010schoolgrades.pdf
Florida Department of Education, (2005). Appendix A: Statistical Indicators used in test
data analysis. FCAT Handbook – A resource For Educators. Retrieved from
http://fcat.fldoe.org/handbk/appendixa.pdf
Florida Department of Education, 2010 Retrieved March 1, 2011 from
http://schoolgrades.fldoe.org/pdf/0910/2010SchoolGradesTAP.pdf
Fitzgerald, T., & Gunter, H. (2008). Contesting the orthodoxy of teacher leadership,
International Journal of Leadership in Education, 11(4), 331-340.
Faught, K. (2004). Doing survey research on the internet: yes, timing does matter. The
Journal of Computer Information Systems. Retrieved March 2011 from
http://www.allbusiness.com/marketing/market-research/914440-1.html
Fox, C. (2009). Analyzing leadership styles of incident commanders. Dissertation.
Northcentral University, Prescott Valley, AZ.
Fullan, M. (2001). Implementing change at the building level. Critical and Emerging
Issues in Education Leadership. August edition, University of Toronto.

157
Fulton, C., & Leech, D. (2008). Faculty perceptions of shared decision making and the
principal's leadership behaviors in secondary schools in a large urban district.
Education, 128(4), 630-44.
Giles, C. (2008). Capacity building: sustaining urban secondary schools as resilient self-
renewing organizations in the face of standardized educational reform. The Urban
Review, 40(2), 137-163.
Gliem, J., & Gliem, R. (2003). Calculating, interpreting, and reporting Cronbach’s
alpha reliability coefficient for Likert-type scales. Paper presented at the
Midwest Research-to Practice Conference in Adult Continuing, and Community
Education, The Ohio State University, Columbus, Ohio, October 8-10, 2003.
Retrieved June 12, 2010 from
http://www.alumniosu.org/midwest/midwest%20papers/Gliem %20&%20Gliem.
Glass, G., & Hopkins, K. (1996). Statistical methods in psychology and education
(3rd ed.). Needham Heights, MA: Allyn & Bacon.
Glover, E. (2007). Real principals listen. Educational Leadership, 65(1), 60-63.
Goddard, J., Hoy, H., & Woolfolk, A. (2000). Collective teacher efficacy: its meaning,
measure, and impact on student achievement. American Education Research
Journal, 37(2), 479-507.
Good, T. (2008). In the midst of comprehensive school reform: principals' perspectives.
Teachers College Record, 110(11).
158
Graeff, C. (1983). The situational leadership theory: a critical review. Academy of
Management Review. 8(2), 285-291.
Gray, P., & Ross, J. (2006). Transformational leadership and teacher commitment to
organizational values: the mediating effects of collective teacher efficacy. School
Effectiveness and School Improvement, 17(2), 179-199.
Greenlee, B. & Bruner, D. (2000). Measures of work culture in high and low
performance schools. Research in the Schools, 7(2), 71-76.
Hallinger, P., & Heck, R. (1998). Exploring the principal’s contribution to school
effectiveness: 1980 – 1999. School Effectiveness and School Improvement, 9(2),
157-191.
Heck, R. H. & Hallinger, P. (2005). The study of educational leadership and
management: Where does the field stand today? Educational Management,
Administration & Leadership, 33(2), 229-244.
Hallinger, P., & Murphy, J. (1987). Assessing and developing principal instructional
leadership. Educational Leadership, 45(1), 54-61.
Huebner, B. (2009). Troubles with stereotypes for our Spinozan psychologies.
Philosophy of the social sciences, 39(1): 63-92.
Huberman, A. M. & Miles, M. (1994). Qualitative data analysis: An expanded
sourcebook (2nd ed.). Thousand Oaks, CA: Sage.
Hardman, B. K. (2006). Career ladder of classroom teachers: all tiers lead upward. The
Delta Kappa Gamma Bulletin. 72(3), 30-33.
159
Hinkin, T., & Schriesheim, C. (2008). A theoretical and empirical examination of the
transactional and non-leadership dimensions of the multifactor leadership
questionnaire (MLQ). The Leadership Quarterly, 19(5), 501-513.
Hopkins, W. (2007). Quantitative Research Design. Sportscience. Perspective: Research
Resources. Retrieved July 19, 2009, from
http://sportssci.org/jour/0001/wghdesign.html
Hoy, A., Hoy, W., & Tschannen-Moran, M. (1998). Teacher efficacy: its meaning and
measure, Review of Educational Research. 68/2, 202-246.
Hoy, H., & Woolfolk, A. (1993). Teachers' sense of efficacy and the organizational
health of schools. The Elementary School Journal, 93, 355-72.
Huberman , A. & Miles, M. (1994). Qualitative Data Analysis (2nd ed.). Thousand
Oaks, CA: Sage Publications.
Huebner, T. (2009). What research says about…the continuum of teacher learning. How
Teachers Learn, 66(5). 88-91.
Hunt, J. (1991). Leadership: A new synthesis. Thousand Oaks, CA: Sage.
Ingersoll, R. (2007). Short on power, long on responsibility. Education Leadership,
65(1), 20-25.
Inman, D., & Marlow, L. (2004). Teacher retention: why do beginning teachers remain in
the profession? Education, 124(4).
Jantzi, D., Fernandez, A. & Leithwood, K. (1994). Transformational leadership
and teachers’ commitment to change. In J. Murphy & K. Seashore Louis (Eds.),
160
Reshaping the principalship: Insights from transformational reform efforts (pp.
77-98 ). Thousand Oaks, California: Corwin Press, Inc.
Jantzi, D., & Leithwood, K. (1996). Toward an explanation of variation in teachers'
perceptions of transformational school leadership. Educational Administration
Quarterly, 32, 512-38.
Johnson, W., & Mullen, C. (2006). Accountability-democracy tensions facing democratic
school leaders. Action in Teacher Education, 28(2), 86-101.
Journal of Education, 108(4), 259-299. Retrieved March 16, 2008 from
http://www.jstor.org/stable/1085442.
Kelly, S. (2004). An event history analysis of teacher attrition: salary, teacher tracking,
and socially disadvantaged schools. The Journal of Experimental Education,
72(3). 195-220.
Kemper, E. A., Stringfield, S., & Teddlie, C. (2003). Mixed methods sampling strategies
in social science research. In A. Tashakkori & C. Teddlie (Eds.), Handbook of
mixed methods in social and behavioral research (pp. 273-296). Thousand Oaks,
CA: Sage.
King, M. B., & Newmann, F. (2001). Building school capacity through professional
development: conceptual and empirical considerations. The International Journal
of Educational Management. 15(2), 86-93.
161
King, M. B., Newmann, F. M., & Youngs, P. (2000). Professional development that
addresses school capacity: Lessons from urban elementary schools. American
Journal of Education, 108, 259-299.
King, M. B., & Youngs, P. (2002). Principal leadership for professional development to
build school capacity. Education Administration Quarterly, 38(5), 643-670.
Knipe, S., & Mackenzie, N. (2006). Research dilemmas: paradigms, methods and
methodology. Issues in Educational Research, 16.
Koford, K., Krejsler, J. & Moos, L. (2008). Successful principals: telling or selling?
International Journal of Leadership in Education, (11)4, 341-352.
Kutsyuruba, B., Noonan, B. & Walker, K. (2008). The fragility of trust in the world of
school principals. Journal of Educational Administration. Nov.
Laboratory for Student Success, (2002). A synthesis of educational leadership literature.
Temple University, 2002.
Lazaridou, A. (2006). How effective principals think while solving problems.
International Electronic for Leadership in Learning, 10(15). Retrieved March,
28, 2009, from http://www.ucalgary.ca/iejll/vol10/lazaridou
Leithwood, K. (1992). Transformational leadership: where does it stand? The Education
Digest, 58, 17-20.
Leithwood, K. (2005) Understanding successful principal leadership: Progress on a
broken front. Journal of Educational Administration, 43(6): 619-629.
162
Leithwood, K., & Mascall, B. (2008). Collective leadership effects on student
achievement. Educational Administration Quarterly, 44(4), 529-561.
Leithwood, K., & Riehl, C. (2005). What we know about successful school leadership, A
New Agenda: Directions for Research on Educational Leadership, New York:
Teacher College Press.
Louis, K., & Marks, H. (1999). Teacher empowerment and the capacity for
organizational learning. Educational Administration Quarterly, 35, 707-750.
Louis, K., Mayrowetz, D., Murphy, J., & Smylie, M. (2007). Trust and the development
of distributed leadership. Journal of School Leadership, 17(4), 469-503.
Louis, K., & Wahlstrom, K. (2008). How teachers experience principal leadership: the
roles of professional community, trust, efficacy, and shared responsibility.
Education Administration Quarterly, 44(4).
MacBeath, J., & Pedder, D. (2008). Organizational learning approaches to school
leadership and management: teacher’s values and perceptions of practice. School
Effectiveness and School Improvement, 19(2), 207-224.
Marks, H., & Printy, S. (2003). Principal leadership and school performance: An
integration of transformational and instructional leadership. Educational
Administration Quarterly,39(3), 370-97.
Marzano, R., McNulty, B., & Waters, J. (2003). Balanced leadership: what 30 years of
research tells us about the effect of leadership on student achievement. Mid-
Continent Research for Education and Learning. Aurora, CO.
163
Maxwell, J. A., & Loomis, D. M. (2003). Mixed methods design: An alternative
approach. In A. Tashakkori and C. Teddlie (Eds.), Handbook of mixed methods in
social and behavioral research (pp. 241-272). Thousand Oaks, CA: Sage.
Metcalfe, B. & Metcalfe, R. J. (2001), The development of a new Transformational
Leadership Questionnaire. Journal of Occupational and Organizational
Psychology, 74: 1–27.
Mertens, D.M. (2005). Research Methods in Education and Psychology: Integrating
Diversity with Quantitative and Qualitative Approaches. (2nd ed). Thousand
Oaks: Sage.
Miller, R. (2008). Tales of teacher absence. Center For American Progress. October.
Washington, DC.
Mind Garden, Inc. (2008). Multifactor Leadership Questionnaire. Menlo Park, CA.
Retrieved February 17, 2010 from http://www.mindgarden.com.
MLQ International. (2008). The Full Range Leadership Model. MLQ International.
Melbourne, Australia. Retrieved February 17, 2010, from www.mlq.com.au.
Noonan, B., & Walker, K. (2008). Trust in the contemporary principalship. Canadian
Journal of Education Administration and Policy, 85.
No Child Left Behind Act of 2001, 20 U.S.C. §6319 (2008). Retrieved: December 20,
2008 from: http://www.ed.gov/legislation/ESEA02/index.html.
Northouse, P. G. (2007). Leadership theory and practice (3rd ed.). Thousand Oaks, CA:
Sage.
164
O'Donnell, R., & White, G. (2005). Behaviors and student achievement within the
accountability era: principals' instructional leadership behaviors and student
achievement. NASSP Bulletin, 89, 56-71.
Pallant, J. (2007). SPSS survival manual (3rd ed.). Open University Press: England.
Pillai, R., & Scandura, T., & Tejeda, M. (2001). The MLQ revisited: psychometric
properties and recommendations. The Leadership Quarterly, 12(1), 31-52.
Portney, L., & Watkins, M. (2000). Foundations of clinical research: applications to
practice (2nd ed.). Upper Saddle River, NJ: Merrill Prentice-Hall.
Rice, J., & Roelike, C. (2008). Responding to teacher quality and accountability
mandates: the perspective of school administrators and classroom teachers,
Leadership and Policy in Schools, (7)3, 264-295.
Roche, K. (1999). Moral and ethical dilemmas in Catholic school settings. Begley (ed)
Values and Educational Leadership. Albany, NY: State University of New York
Press, (p. 255-272).
Rowold, J. (2005). Multifactor leadership questionnaire, psychometric properties of the
German translation by Jen Rowold. Redwood City, CA: Mind Garden.
Rumsey, D. (2003). From the literature on teaching and learning statistics. Journal of
Statistics Education. 11(2).
Saldanha, L. and Thompson, P. (2002) Conceptions of sample and their relationship to
statistical inference, Educational Studies in Mathematics, 51, 257-270.
165
Schwandt, T. (1997). Qualitative inquiry: A dictionary of terms. Thousand Oaks, CA:
Sage.
Stewart, J. (2006). Transformational leadership: an evolving concept examined through
the works of Burns, Bass, Avolio and Leithwood. Canadian Journal of
Educational Administration and Policy, 1.
SurveyMonkey. (2010). Smart Survey Design. Retrieved March 5, 2010 from:
http://s3.amazonaws.com/SurveyMonkeyFiles/SmartSurvey.pdf
Tannenbaum, C. E. (2009). The empirical nature and statistical treatment of missing data.
Dissertations available from ProQuest. Paper AA13381876.
Williams, R. (2006). Leadership for school reform: do principal decision-making styles
reflect a collaborative approach? Canadian Journal of Educational
Administration.
Withey, S. (1953). Survey research methods for the study of communities and
community problems. Review of Educational Research, 123(4), 329-336.
Yukl, G. (2006). Leadership in organizations (6th ed.). Upper Saddle River, NJ:
Prentice Education.
Yukl, G. (2002). Leadership in Organizations (5th ed.). Upper Saddle River, NJ: Prentice
Hall.
Yukl, G. A. (2006). Leadership in organizations (6th ed.). New Jersey: Prentice Hall.
Zatz, D. (2004) Using Electronic Surveys, Toolpack Consulting, Version 1.3, June 2004.
166
Appendices
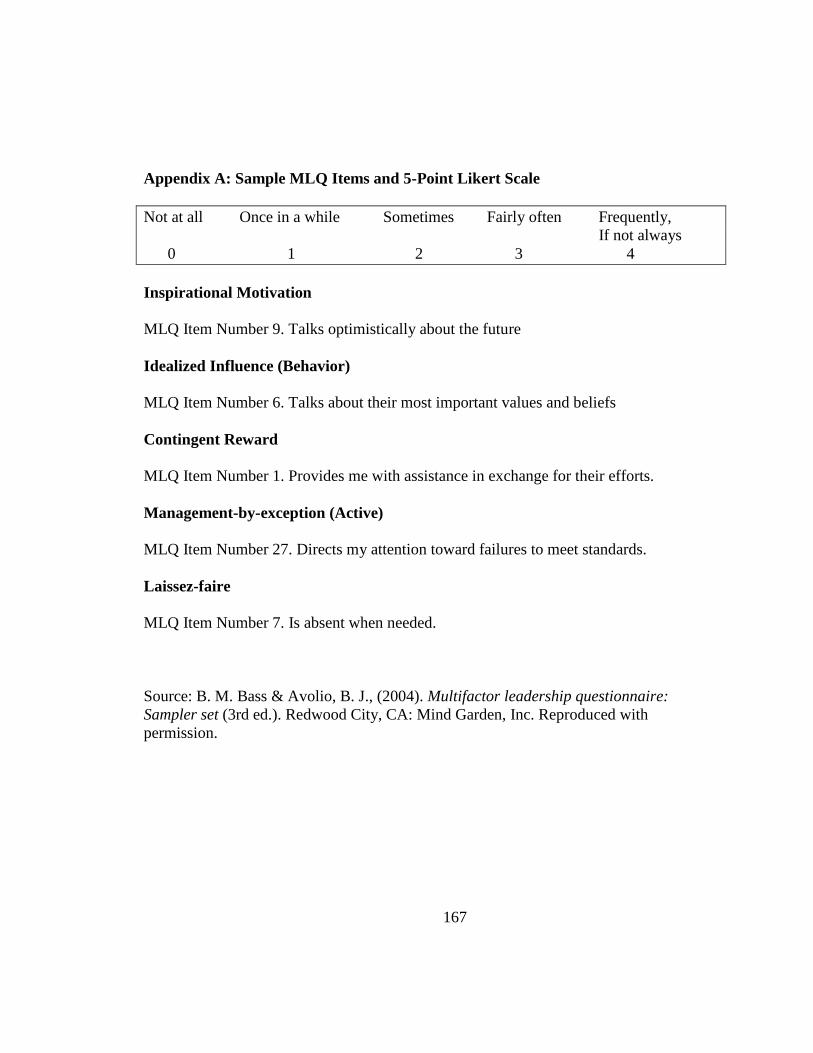
167
Appendix A: Sample MLQ Items and 5-Point Likert Scale
Not at all Once in a while Sometimes Fairly often Frequently,
If not always
0 1 2 3 4
Inspirational Motivation
MLQ Item Number 9. Talks optimistically about the future
Idealized Influence (Behavior)
MLQ Item Number 6. Talks about their most important values and beliefs
Contingent Reward
MLQ Item Number 1. Provides me with assistance in exchange for their efforts.
Management-by-exception (Active)
MLQ Item Number 27. Directs my attention toward failures to meet standards.
Laissez-faire
MLQ Item Number 7. Is absent when needed.
Source: B. M. Bass & Avolio, B. J., (2004). Multifactor leadership questionnaire:
Sampler set (3rd ed.). Redwood City, CA: Mind Garden, Inc. Reproduced with
permission.
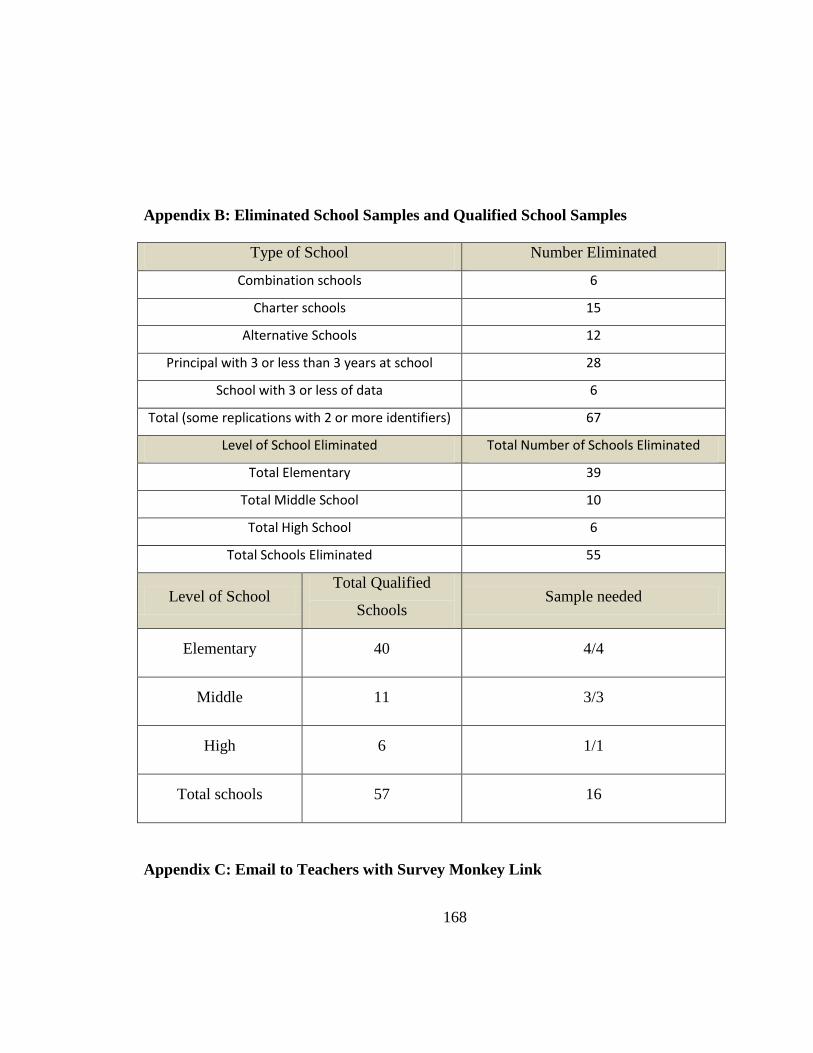
168
Appendix B: Eliminated School Samples and Qualified School Samples
Type of School Number Eliminated
Combination schools 6
Charter schools 15
Alternative Schools 12
Principal with 3 or less than 3 years at school 28
School with 3 or less of data 6
Total (some replications with 2 or more identifiers) 67
Level of School Eliminated Total Number of Schools Eliminated
Total Elementary 39
Total Middle School 10
Total High School 6
Total Schools Eliminated 55
Level of School Total Qualified
Schools Sample needed
Elementary 40 4/4
Middle 11 3/3
High 6 1/1
Total schools 57 16
Appendix C: Email to Teachers with Survey Monkey Link

169
Dear Teachers:
You are asked to participate in a University of South Florida graduate research study on
school leadership and student achievement. This study will attempt to correlate the
teacher’s view of a principal’s leadership style and student achievement. Your school will
be part of a large pool of elementary, middle and high schools. You or your principal will
not be identifiable.
Permission to distribute these surveys has be given by the Polk County School Board and
the USF International Research Board.
Here is the focus of the study:
It is noted that principals do not have a direct impact on student achievement
since they are not responsible for instructing students.
A premise of this research is that the principal leadership behaviors influence
teachers who are directly responsible for student achievement.
Principals affect student achievement through teachers. Therefore, teacher
perception of leadership behaviors and school performance on FCAT may
identify effective leadership styles and behaviors that influence student
achievement.
The survey takes about 20 minutes. Your participation in the survey is voluntary although
I encourage you to participate. You are free to withdraw from the survey at any time.
All research data collected is stored securely and confidentially. This is a federal law.
Participation is anonymous and there are no indicators on any part of the survey that will
reveal your identity. The only persons reviewing the data are the researcher, and the
regulatory entity: USF Institutional Review Board (IRB). Permission has been granted by
the USF IRB #Pro00003178.
170
At the completion of the study, a link will be provided to you for access to the
documentation to assure you of your anonymity. Click the link = surveymonkey
Thank you for your time and opinions!
Brenda K. Hardman
USF Graduate Student

171
Appendix D: Demographic Survey - Professional Descriptions for 2010-2011
Demographic Please circle one item.
Gender Male Female
Age 20-30 30-40 40-50 50-60 60+
Years as a teacher 0-3 years 4 - 9 years 10-14 years 15 + years
Years at current school 0-3 years 4-6 years 7-9 years 10+ years
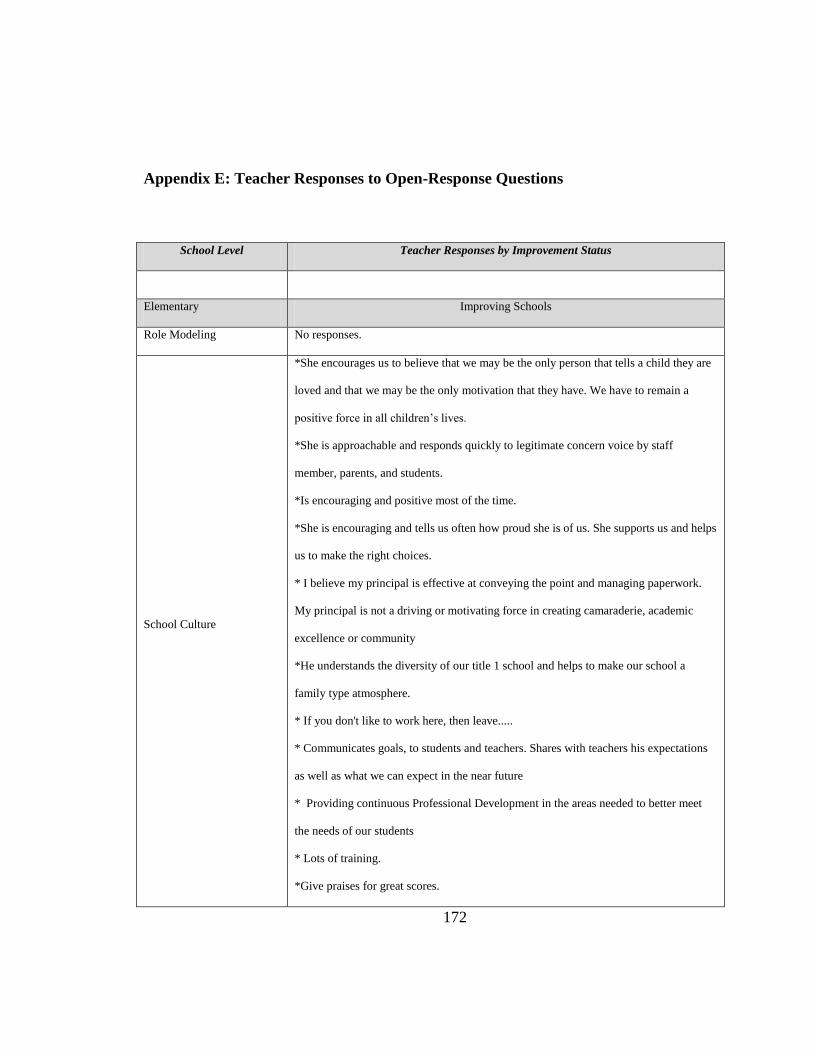
172
Appendix E: Teacher Responses to Open-Response Questions
School Level Teacher Responses by Improvement Status
Elementary Improving Schools
Role Modeling No responses.
School Culture
*She encourages us to believe that we may be the only person that tells a child they are
loved and that we may be the only motivation that they have. We have to remain a
positive force in all children’s lives.
*She is approachable and responds quickly to legitimate concern voice by staff
member, parents, and students.
*Is encouraging and positive most of the time.
*She is encouraging and tells us often how proud she is of us. She supports us and helps
us to make the right choices.
* I believe my principal is effective at conveying the point and managing paperwork.
My principal is not a driving or motivating force in creating camaraderie, academic
excellence or community
*He understands the diversity of our title 1 school and helps to make our school a
family type atmosphere.
* If you don't like to work here, then leave.....
* Communicates goals, to students and teachers. Shares with teachers his expectations
as well as what we can expect in the near future
* Providing continuous Professional Development in the areas needed to better meet
the needs of our students
* Lots of training.
*Give praises for great scores.
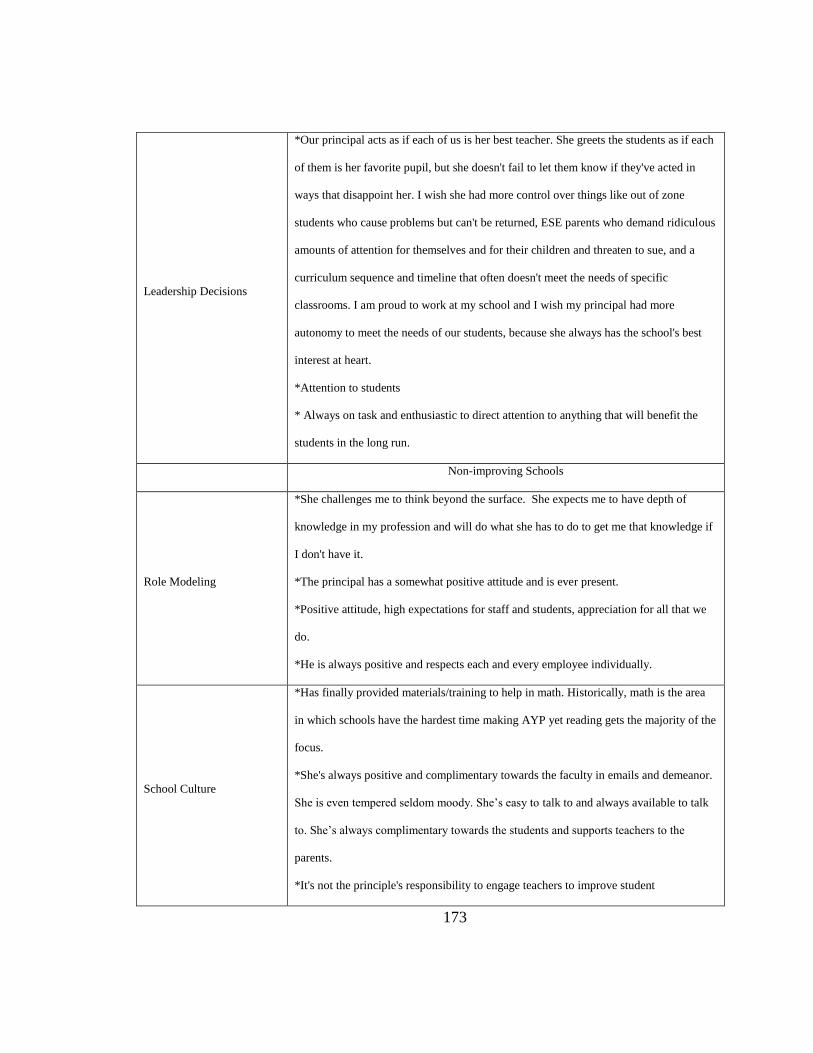
173
Leadership Decisions
*Our principal acts as if each of us is her best teacher. She greets the students as if each
of them is her favorite pupil, but she doesn't fail to let them know if they've acted in
ways that disappoint her. I wish she had more control over things like out of zone
students who cause problems but can't be returned, ESE parents who demand ridiculous
amounts of attention for themselves and for their children and threaten to sue, and a
curriculum sequence and timeline that often doesn't meet the needs of specific
classrooms. I am proud to work at my school and I wish my principal had more
autonomy to meet the needs of our students, because she always has the school's best
interest at heart.
*Attention to students
* Always on task and enthusiastic to direct attention to anything that will benefit the
students in the long run.
Non-improving Schools
Role Modeling
*She challenges me to think beyond the surface. She expects me to have depth of
knowledge in my profession and will do what she has to do to get me that knowledge if
I don't have it.
*The principal has a somewhat positive attitude and is ever present.
*Positive attitude, high expectations for staff and students, appreciation for all that we
do.
*He is always positive and respects each and every employee individually.
School Culture
*Has finally provided materials/training to help in math. Historically, math is the area
in which schools have the hardest time making AYP yet reading gets the majority of the
focus.
*She's always positive and complimentary towards the faculty in emails and demeanor.
She is even tempered seldom moody. She’s easy to talk to and always available to talk
to. She’s always complimentary towards the students and supports teachers to the
parents.
*It's not the principle's responsibility to engage teachers to improve student
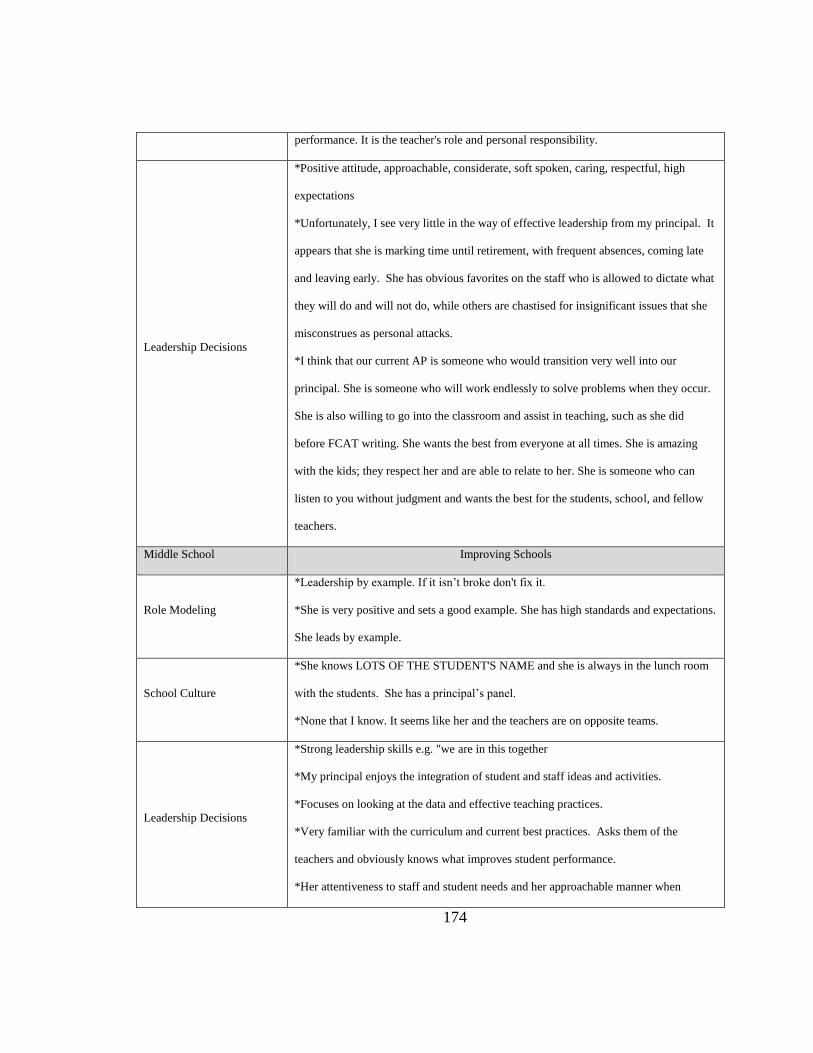
174
performance. It is the teacher's role and personal responsibility.
Leadership Decisions
*Positive attitude, approachable, considerate, soft spoken, caring, respectful, high
expectations
*Unfortunately, I see very little in the way of effective leadership from my principal. It
appears that she is marking time until retirement, with frequent absences, coming late
and leaving early. She has obvious favorites on the staff who is allowed to dictate what
they will do and will not do, while others are chastised for insignificant issues that she
misconstrues as personal attacks.
*I think that our current AP is someone who would transition very well into our
principal. She is someone who will work endlessly to solve problems when they occur.
She is also willing to go into the classroom and assist in teaching, such as she did
before FCAT writing. She wants the best from everyone at all times. She is amazing
with the kids; they respect her and are able to relate to her. She is someone who can
listen to you without judgment and wants the best for the students, school, and fellow
teachers.
Middle School Improving Schools
Role Modeling
*Leadership by example. If it isn’t broke don't fix it.
*She is very positive and sets a good example. She has high standards and expectations.
She leads by example.
School Culture
*She knows LOTS OF THE STUDENT'S NAME and she is always in the lunch room
with the students. She has a principal’s panel.
*None that I know. It seems like her and the teachers are on opposite teams.
Leadership Decisions
*Strong leadership skills e.g. "we are in this together
*My principal enjoys the integration of student and staff ideas and activities.
*Focuses on looking at the data and effective teaching practices.
*Very familiar with the curriculum and current best practices. Asks them of the
teachers and obviously knows what improves student performance.
*Her attentiveness to staff and student needs and her approachable manner when
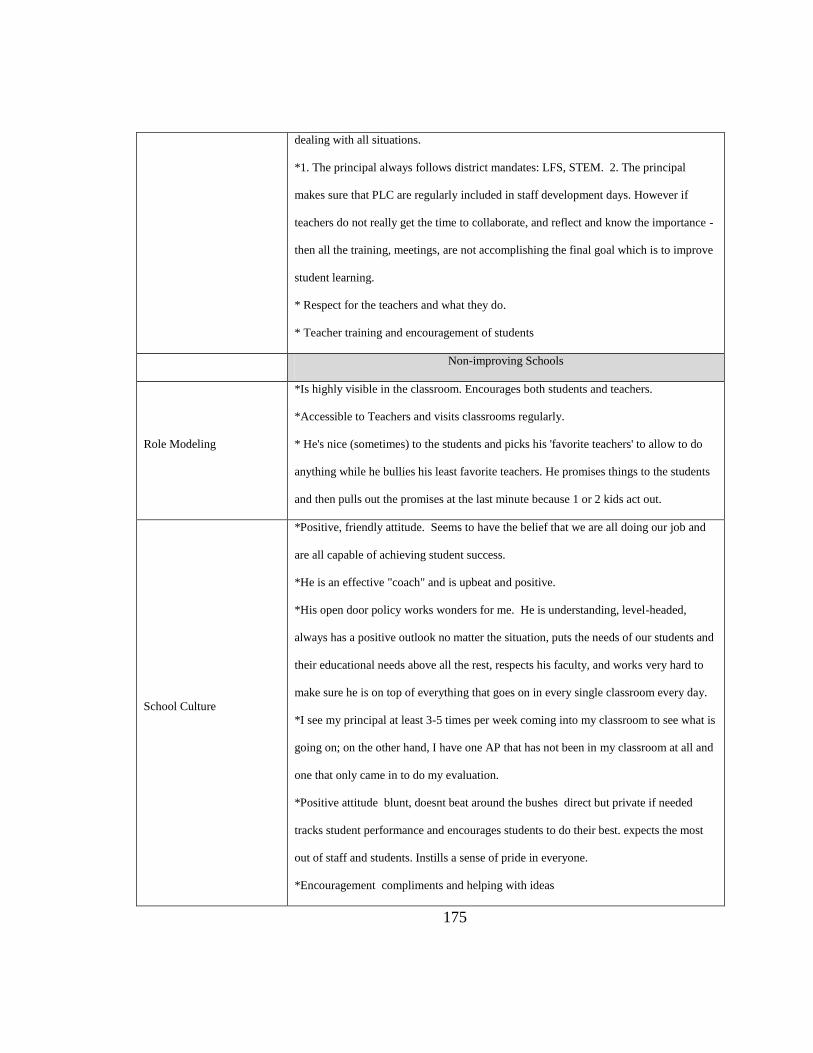
175
dealing with all situations.
*1. The principal always follows district mandates: LFS, STEM. 2. The principal
makes sure that PLC are regularly included in staff development days. However if
teachers do not really get the time to collaborate, and reflect and know the importance -
then all the training, meetings, are not accomplishing the final goal which is to improve
student learning.
* Respect for the teachers and what they do.
* Teacher training and encouragement of students
Non-improving Schools
Role Modeling
*Is highly visible in the classroom. Encourages both students and teachers.
*Accessible to Teachers and visits classrooms regularly.
* He's nice (sometimes) to the students and picks his 'favorite teachers' to allow to do
anything while he bullies his least favorite teachers. He promises things to the students
and then pulls out the promises at the last minute because 1 or 2 kids act out.
School Culture
*Positive, friendly attitude. Seems to have the belief that we are all doing our job and
are all capable of achieving student success.
*He is an effective "coach" and is upbeat and positive.
*His open door policy works wonders for me. He is understanding, level-headed,
always has a positive outlook no matter the situation, puts the needs of our students and
their educational needs above all the rest, respects his faculty, and works very hard to
make sure he is on top of everything that goes on in every single classroom every day.
*I see my principal at least 3-5 times per week coming into my classroom to see what is
going on; on the other hand, I have one AP that has not been in my classroom at all and
one that only came in to do my evaluation.
*Positive attitude blunt, doesnt beat around the bushes direct but private if needed
tracks student performance and encourages students to do their best. expects the most
out of staff and students. Instills a sense of pride in everyone.
*Encouragement compliments and helping with ideas
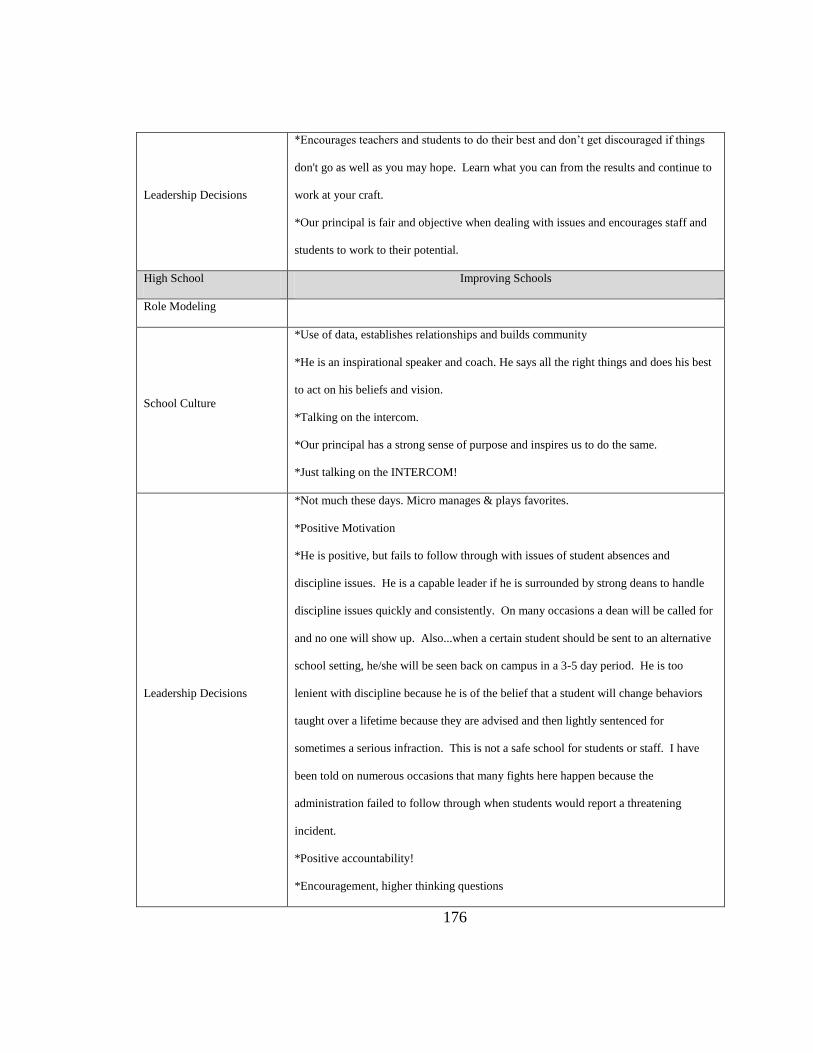
176
Leadership Decisions
*Encourages teachers and students to do their best and don’t get discouraged if things
don't go as well as you may hope. Learn what you can from the results and continue to
work at your craft.
*Our principal is fair and objective when dealing with issues and encourages staff and
students to work to their potential.
High School Improving Schools
Role Modeling
School Culture
*Use of data, establishes relationships and builds community
*He is an inspirational speaker and coach. He says all the right things and does his best
to act on his beliefs and vision.
*Talking on the intercom.
*Our principal has a strong sense of purpose and inspires us to do the same.
*Just talking on the INTERCOM!
Leadership Decisions
*Not much these days. Micro manages & plays favorites.
*Positive Motivation
*He is positive, but fails to follow through with issues of student absences and
discipline issues. He is a capable leader if he is surrounded by strong deans to handle
discipline issues quickly and consistently. On many occasions a dean will be called for
and no one will show up. Also...when a certain student should be sent to an alternative
school setting, he/she will be seen back on campus in a 3-5 day period. He is too
lenient with discipline because he is of the belief that a student will change behaviors
taught over a lifetime because they are advised and then lightly sentenced for
sometimes a serious infraction. This is not a safe school for students or staff. I have
been told on numerous occasions that many fights here happen because the
administration failed to follow through when students would report a threatening
incident.
*Positive accountability!
*Encouragement, higher thinking questions
177
Non-improving Schools
Role Modeling
*Inspiring and effective.
*She shows how she wants us to teach, she is an excellent role model.
*Encouraging, Optimistic, Reliable, Responsible, Trusts, Understands, Relates.
School Culture
*She stays off my back, and lets me help to make the school a great learning
community.
*Encourages you to try innovative ideas in engaging students and showcasing your
efforts.
*Addresses all. Reminds all. Recognizes success, says thank you for some people, and
says good-bye and good luck.
Leadership Decisions
*Encouragement positive reinforcements
*Honest, straight forward, serious, down to earth.
*Encouragement reinforcement for desired performance.
*Engages in strong, decisive leadership and attempts to engage students on the basis of
their potential success.
0.
About The Author
Brenda Kay Hardman received a Bachelor’s of Arts Degree in Communications from the
University of Arizona in 1985. She received her second Bachelor of Arts Degree in
Social Sciences from Florida Southern College in 1997. She received her Masters of
Education in Education Leadership from the University of South Florida in 2003.
At the beginning of her educational career, Ms. Hardman taught middle and high
school courses in both charter and public schools including all academic levels from
students with special needs to students in advanced placement. Her administration career
started at the high school level where she served as an academic dean prior to acquiring
an assistant principal position in 2008. During her administrative capacity she has
pioneered new teacher programs, initiated workforce academies, written and co-authored
several academic grants, planned and delivered multiple parent-student-teacher
informational academic programs in addition to serving on district improvement
committees.