Embed Size (px)
Citation preview
Teachers’ Perceptions of Their Working
Conditions:
How Predictive of Policy-Relevant
Outcomes?
Helen ladd
w o r k i n g p a p e r 3 3 • d e c e m b e r 2 0 0 9

Teachers’ Perceptions of their Working Conditions: How Predictive of Policy-Relevant Outcomes?
Helen F. Ladd Duke University
Corresponding author: Helen Ladd, Duke University, Email: [email protected].
ii
The author is grateful to the Center for the Analysis of Longitudinal Data in Education Research (CALDER), supported by Grant R305A060018 to the Urban Institute from the Institute of Education Sciences, U.S. Department of Education, for funding. The author is also grateful to the North Carolina Education Research Data Center for data and to L. Patten Priestley, Rachel Upton, and Sarah Gordon for superb research assistance. The author also appreciates the input of her Duke colleagues, Jacob Vigdor and Charles Clotfelter on an earlier version of this paper with a different title as well as the helpful comments of Jason Grissom. CALDER working papers have not gone through final formal review and should be cited as working papers. They are intended to encourage discussion and suggestions for revision before final publication.
The Urban Institute is a nonprofit, nonpartisan policy research and educational organization that examines the social, economic, and governance problems facing the nation. The views expressed are those of the authors and should not be attributed to the Urban Institute, its trustees, or any of the funders or organizations. Any errors are attributable to the authors.
CALDER, The Urban Institute 2100 M Street N.W., Washington, D.C. 20037 202-261-5739 • www.caldercenter.org
iii
CONTENTS
Abstract iv Introduction 1
Policy Context and Conceptual Foundation 4
Measuring Working Conditions 6
Survey-Based Measures vs. “Objective” Measures 9
Empirical Model of Planned Departure Rates 10
North Carolina Data 14
Working Conditions Domains and Additional Time Variables 15
Data on School Characteristics 19
Salary Data 20
Characteristics of Individual Teachers and Geographic Indicators 21
Dependent Variables 21
Planned Departures of Survey Respondents 22
Full Linear Probability Models 24
Multinomial Choice Models 27
Other Outcome Measures 29
Actual One-Year Departure Rates 30
Student Achievement – Test Scores 33
Conclusion 34 References 38
Figures 41 Tables 43
iv
Teachers’ Perceptions of their Working Conditions: How Predictive of Policy-Relevant Outcomes? Helen F. Ladd CALDER Working Paper No. 33 December 2009
ABSTRACT
This quantitative study uses data from North Carolina to examine the extent to which
survey based perceptions of working conditions are predictive of policy-relevant
outcomes, independent of other school characteristics such as the demographic mix of the
school’s students. Working conditions emerge as highly predictive of teachers’ stated
intentions to remain in or leave their schools, with leadership emerging as the most
salient dimension. Teachers’ perceptions of their working conditions are also predictive
of one-year actual departure rates and student achievement, but the predictive power is
far lower. These weaker findings for actual outcome measures help to highlight both the
strengths and weaknesses of using teacher survey data for understanding outcomes of
policy interest.
1
INTRODUCTION
Like most other workers, teachers make their decisions about whether to remain in their
current jobs based both on the level of compensation and on the quality of the work
environment. For teachers, the work environment is determined in part by the educational
challenges associated with the economic and racial mix of students in the school–
characteristics of schools that are typically easy for the researcher to measure. In
addition, their work environment includes a number of harder-to-measure factors such as
the quality of the school’s leadership and the extent to which teachers are given the
leeway to make decisions, are supported in their efforts to improve student learning, or
have opportunities to develop professionally. Until recently, little statewide data have
been available on these latter components. That situation is now changing as several
states have begun to invest in large statewide surveys of all teachers that generate rich
data on teachers’ perceptions of their working conditions. One of the leaders in this
movement is the state of North Carolina.
The primary purpose of this study is to examine the extent to which these survey
generated perceptions are predictive of teachers’ intended departures from schools,
independent of other factors, including the school’s racial or socio-economic mix of
students, that may predict departure. A secondary purpose is to raise some general
questions about the usefulness of survey data for predicting both planned departures and
other outcomes of policy interest such as actual one-year departure rates and student
achievement.
This quantitative study is based on two rich data sets for North Carolina. One is
an administrative data set that includes information on all North Carolina students in
2
public schools, teachers and schools that is available through the North Carolina
Education Research Data Center. The other data set includes responses to the surveys
about working conditions that have been administered to all teachers and school
administrators in the state every two years since 2002 (Hirsch and Emerick, 2006). The
analysis is based on the 2006 survey results because that year has far higher response
rates than in previous years and is the most recent year for which information is now
available on the post-survey movement of teachers.
Previous quantitative research on the relationship between teacher working
conditions and teacher mobility based on large administrative data sets – much of which
has been done by economists – has drawn attention to easily measured school
characteristics such as the racial and economic mix of the school’s students or their
achievement levels (Boyd, Lankford, Loeb, and Wyckoff, 2005; Dolton and van der
Klaauw, 1995; Hanushek, Kain, and Rivkin, 2004; Hanushek, Kain, O’Brien, and Rivkin,
2005; Scafidi, Sjoquist, and Stinebrikner, 2007). Other researchers have used teacher
surveys or ethnographic studies to document the importance of the harder-to-measure
elements of teacher working conditions (Buckley, Schneider, and Yang, 2005; Elfers,
Plecki, and Knapp, 2006; Ingersoll, 2001; Johnson, Berg, and Donaldson, 2005, and
citations therein; Stockard and Lehman, 2004). Such researchers emphasize the
importance of the quality of the workplace both as a mediator of the effectiveness of
teachers within classrooms and as a determinant of their willingness to remain in a school
or in teaching more generally.
Much of the present study is in the spirit of two recent quantitative studies of
teacher turnover. The first uses teacher survey data from California to examine how
3
teaching conditions predict teacher turnover at the school level (Loeb, Darling-
Hammond, and Luczak, 2005). Differentiating the present study from the
aforementioned is my focus on the departure decisions of individual teachers, the use of a
far larger and richer survey of teachers, and the separate attention to the three levels of
schooling. A more recent study (Grissom, 2008) addresses similar issues with data from
the national Schools and Staffing Survey. Offsetting the benefits of a national sample are
the limited number of respondents per school and the difficulty of examining the different
forms of departures.
The following sections provide the policy context and conceptual foundation;
describe the North Carolina data with particular attention to the measurement of working
conditions; and present the results, first for teachers’ intentions about leaving their
current schools as reported on the survey, and then for actual departure rates constructed
from administrative data, and for student achievement based on test scores in math and
reading. Working conditions, as perceived by teachers, are highly predictive of teachers’
intended departure rates even after many measurable characteristics of the school are
controlled for. Further, the quality of school leadership emerges as the dominant factor
among those examined in this study. In addition, consistent with the findings of Loeb,
Darling-Hammond and Luczak (2005), the inclusion in the models of teachers’
perceptions of their working conditions attenuates somewhat the negative relationship
between high proportions of minority students and teachers’ plans to leave their current
school.
In addition, teachers’ perceptions of their working conditions are also predictive
of one-year actual departure rates and of student achievement, but the predictive power of
4
these perceptions is far lower than for planned departures. These weaker findings for
actual outcome measures help to highlight both the strengths and weaknesses of using
teacher survey data for understanding outcomes of policy interest.
POLICY CONTEXT AND CONCEPTUAL FOUNDATION
The focus on the desire of teachers to leave schools reflects current policy interest in the
difficulty that many schools, especially those with low-performing students, have in
attracting and retaining teachers. Although departures that reflect a poor fit between the
school and the teacher, or between the teaching profession and the teacher, may be
desirable and appropriate, high rates of departure from particular schools can be
counterproductive. Resources are wasted if teachers who ultimately would have been
good teachers leave the profession. In addition, regardless of the reason for leaving,
schools with high turnover rates face high costs of recruiting and training new teachers
and find it difficult to offer a coherent education program, to the detriment of the students
in those schools (Alliance for Education, 2005).
Sorting out the factors associated with teacher mobility decisions is important for
policy. The standard use of a uniform district-wide salary schedule means that capable
teachers are often reluctant to remain in schools serving large proportions of
disadvantaged students if they are able to move other schools with less challenging-to-
educate students and yet earn the same salary. As a result, compared to other schools,
those serving disadvantaged students often end up with teachers with weaker credentials
and higher rates of turnover. One obvious policy solution – but one that to date has been
politically difficult to implement on a broad scale – is to override the uniform salary
5
schedule and to induce quality teachers to teach in such schools by paying them higher
salaries (Clotfelter, Ladd, and Vigdor, 2008). Another is to spread the disadvantaged
students among schools so no one school would be at a disadvantage relative to another
in its ability to attract and retain quality teachers (Ladd, 2008).
But a third policy option may also be possible. To the extent that teachers are
reluctant to teach in such schools not only because of the characteristics of their students
but also because of poor working conditions, efforts to improve working conditions could
conceivably reduce turnover rates. This policy option could well appeal to administrators
because it is likely to be far less costly, either in terms of dollars or in political costs, than
either of the other two policy options. Furthermore, a broad effort to improve working
conditions in schools could potentially make the teaching profession as a whole more
attractive and also make teachers more productive in the classroom.
The research in this paper should be viewed as analytically descriptive and not
causal. Moreover, the main analysis, which is based on survey responses about teachers’
career intentions to remain in or leave their current schools, provides information about
teacher preferences not about behavior or outcomes. Even the findings related to more
concrete outcomes of policy interest, such as one-year actual departure rates and student
achievement, are at best predictive. Any conclusions about the efficacy of workplace-
related policy interventions to change those outcomes would require evaluation of
specific interventions, ideally in the context of well-designed experiments.
6
Measuring working conditions
At the most general level, working conditions for teachers are influenced by the physical
features of the work place, the organizational structure, and the sociological, political,
psychological and educational features of the work environment (Johnson, 2006;
Johnson, Berg, and Donaldson, 2005). Hence a comprehensive survey of working
conditions could potentially be both extensive and complicated to interpret. In practice,
researchers and designers are forced to focus on those elements of working conditions
that they deem most likely to be relevant to important policy outcomes. I begin with an
introductory discussion of the choices implicit in the North Carolina surveys, the source
of my information on working conditions.
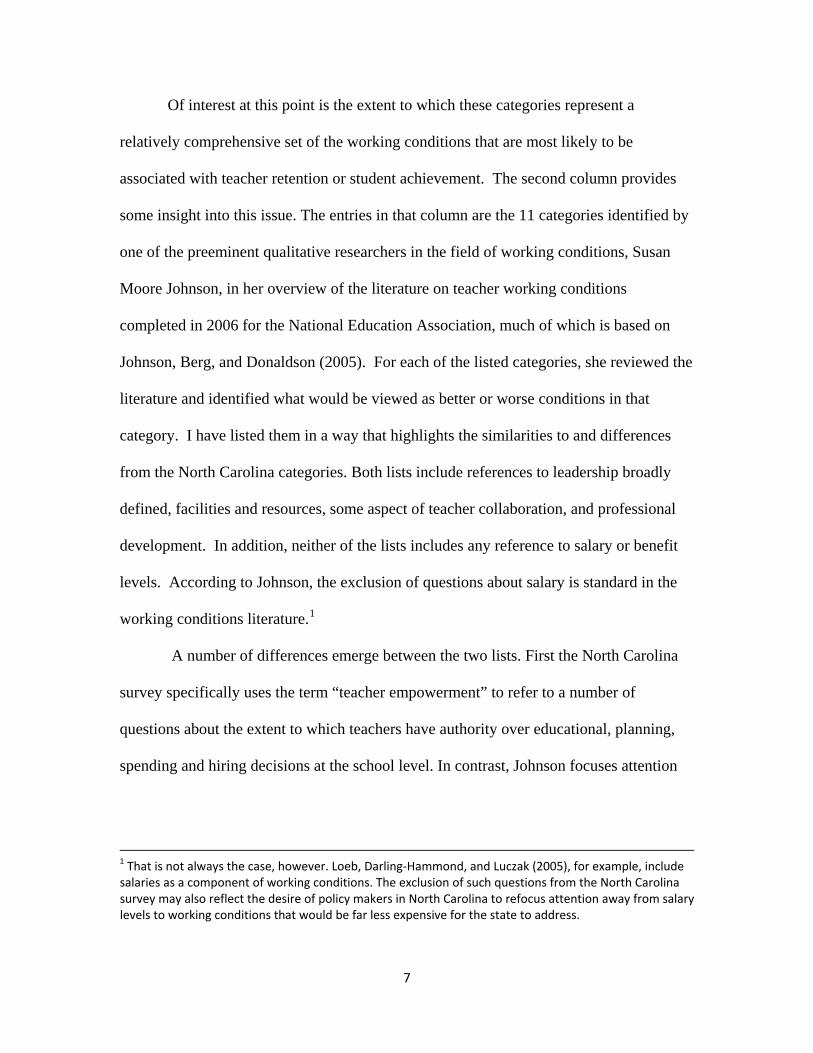
Questions about working conditions on the 2006 survey were divided into the six
categories listed in the left column of Table 1, with the number of questions in each
category in parentheses. The categories are leadership, facilities and resources, teacher
empowerment, professional development, mentoring, and time. As suggested by the fact
that the survey includes 65 questions related to professional development and 40 having
to do with mentoring, state policy makers were particularly interested in using the survey
to identify the details of teachers’ experiences with specific programs in those areas.
Given the specificity of many of those questions, I include only a subset of the
professional development questions and none of the mentorship questions in the current
analysis. Further, as discussed below, I use factor analysis, separately at the elementary,
middle and high school levels, to reclassify a number of questions among the categories
into more coherent domains.
7
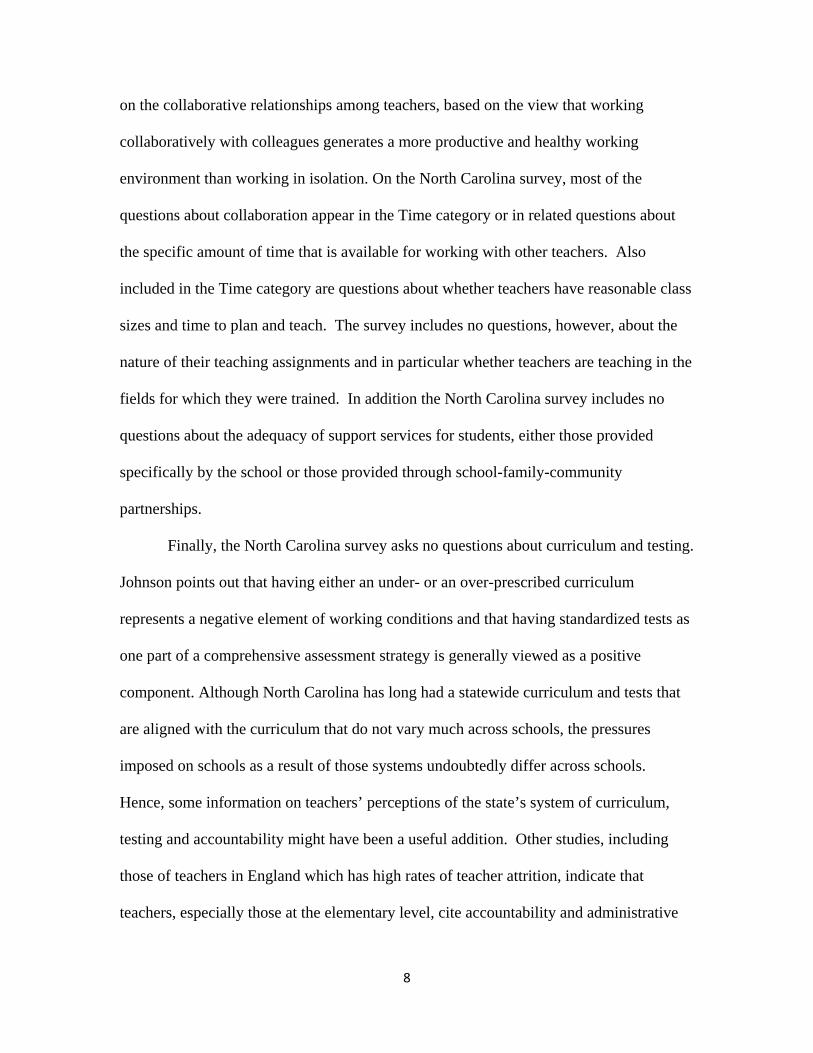
Of interest at this point is the extent to which these categories represent a
relatively comprehensive set of the working conditions that are most likely to be
associated with teacher retention or student achievement. The second column provides
some insight into this issue. The entries in that column are the 11 categories identified by
one of the preeminent qualitative researchers in the field of working conditions, Susan
Moore Johnson, in her overview of the literature on teacher working conditions
completed in 2006 for the National Education Association, much of which is based on
Johnson, Berg, and Donaldson (2005). For each of the listed categories, she reviewed the
literature and identified what would be viewed as better or worse conditions in that
category. I have listed them in a way that highlights the similarities to and differences
from the North Carolina categories. Both lists include references to leadership broadly
defined, facilities and resources, some aspect of teacher collaboration, and professional
development. In addition, neither of the lists includes any reference to salary or benefit
levels. According to Johnson, the exclusion of questions about salary is standard in the
working conditions literature.1
A number of differences emerge between the two lists. First the North Carolina
survey specifically uses the term “teacher empowerment” to refer to a number of
questions about the extent to which teachers have authority over educational, planning,
spending and hiring decisions at the school level. In contrast, Johnson focuses attention
1 That is not always the case, however. Loeb, Darling‐Hammond, and Luczak (2005), for example, include salaries as a component of working conditions. The exclusion of such questions from the North Carolina survey may also reflect the desire of policy makers in North Carolina to refocus attention away from salary levels to working conditions that would be far less expensive for the state to address.
8
on the collaborative relationships among teachers, based on the view that working
collaboratively with colleagues generates a more productive and healthy working
environment than working in isolation. On the North Carolina survey, most of the
questions about collaboration appear in the Time category or in related questions about
the specific amount of time that is available for working with other teachers. Also
included in the Time category are questions about whether teachers have reasonable class
sizes and time to plan and teach. The survey includes no questions, however, about the
nature of their teaching assignments and in particular whether teachers are teaching in the
fields for which they were trained. In addition the North Carolina survey includes no
questions about the adequacy of support services for students, either those provided
specifically by the school or those provided through school-family-community
partnerships.
Finally, the North Carolina survey asks no questions about curriculum and testing.
Johnson points out that having either an under- or an over-prescribed curriculum
represents a negative element of working conditions and that having standardized tests as
one part of a comprehensive assessment strategy is generally viewed as a positive
component. Although North Carolina has long had a statewide curriculum and tests that
are aligned with the curriculum that do not vary much across schools, the pressures
imposed on schools as a result of those systems undoubtedly differ across schools.
Hence, some information on teachers’ perceptions of the state’s system of curriculum,
testing and accountability might have been a useful addition. Other studies, including
those of teachers in England which has high rates of teacher attrition, indicate that
teachers, especially those at the elementary level, cite accountability and administrative
9
pressures as a significant explanation for their departure from the profession (Ladd, 2007;
Tye and O’Brien, 2002). The present study controls for accountability pressures directly
by including binary indicator variables for schools facing particular pressure from either
the state or the federal accountability programs.
Thus, despite its relatively comprehensive coverage, the North Carolina working
conditions survey contains some gaps. Any conclusions about working conditions based
on this survey information speak explicitly to the types of working conditions included in
the survey, but they cannot speak to the components that are not addressed. At the same
time, the survey is sufficiently broad to generate some useful conclusions about their
usefulness for predictive purposes and some insights into which among them are most
important.
Survey based measures vs. “objective” measures
As described in more detail below, I use factor analysis to collapse teachers’ responses to
54 survey questions about their working conditions into five categories and also
aggregate the responses of individual teachers to the school level. This procedure
generates school-level measures of as school’s working conditions as perceived by its
teachers.
An alternative approach would be for a team of external evaluators to do a
systematic evaluation of school working conditions using a protocol that is identical
across schools. Such a protocol could potentially include some quantitative measures
such as the frequency with which principals visit classrooms or the number of
disciplinary incidents in the school but would undoubtedly be based primarily on a
variety of qualitative measures translated into a simple quantitative scale. Even if the
10
categories covered were similar to those in the teacher survey, such an approach could
well generate different conclusions about the quality of the working conditions in a
school than the survey based measures in this study. That is true for several reasons.
One reason for this is teachers’ perceptions of their working conditions may differ
from some objective reality. For example, based on objective data, a school may appear
relatively safe, but for a variety of reasons – perhaps a few specific incidents in the
school – teachers in the school may perceive it to be quite unsafe. Another is that
teachers in any one school may not have enough experience with other schools to
evaluate aspects of their school in a way that would make their judgments comparable
across schools. Third, the teachers who respond to the survey may represent a biased
sample of the full complement of teachers in the school. At the same time, any systematic
external evaluation is likely to generate biases of unknown direction given the difficulty
of assuring consistency among evaluators and the limited information that may be
available to them.
Whether one approach for compiling information on working conditions is
preferred to the other is not clear. Ideally it would be useful to compare the two
approaches in terms of their power to predict policy-relevant outcomes. The absence of
“objective” measures rules out that comparison for this study. All that can be done here
is to examine the predictive power of the survey-generated measures.
Empirical model of planned departure rates
To examine the predictive power of teacher working conditions, I estimate the following
model for each individual teacher i in school j:
11
Planned probabilility of leavingij = f ( WCj , Sj, Wj ,Xi,) (1)
where WCj is a vector of working conditions as perceived by all teachers in the school
based on survey data, Sj is a vector of the objective characteristics of the school, Wj is a
measure of the salary level in the school (or district), and Xi is a vector of characteristics
of the individual teacher.
Although the qualitative literature strongly implicates working conditions as a
determinant of teacher decisions to leave a school (Johnson, Berg, and Donaldson, 2005;
Bulkey, Schneider, and Shang, 2005), survey-based responses about working conditions
could potentially add little additional explanatory power to this empirical model. That
would be the situation if the measured working conditions are irrelevant to the moving
decision, or if they are highly correlated with the measurable characteristics of schools
that predict departure.
For example, survey questions about the extent to which teachers can control the
school budget may elicit differences across schools in teacher control, but teachers may
differ in their views about whether such control of the budget is a good thing. In addition,
regardless of whether they believe that more control is desirable, teachers may not care
enough about the issue for it to influence their desire to remain in or leave the school.
The second possibility is that teachers’ perceptions of working conditions in a
school may be so highly correlated with the measurable characteristics of that school that
the working conditions exert no additional predictive power. That would occur if the
behavior of administrators were so determined by the mix of students in the school that it
is impossible to isolate the effects of the behavior. Further, even very specific questions
about the quality of the principal, for example, need not generate additional independent
12
information because, given the operation of the labor market for educators, there could
be a strong correlation between the quality of the principal at particular schools and the
characteristics of those schools (Clotfelter, Ladd, and Vigdor, 2007).
Two additional concerns complicate the interpretation of the empirical results,
both of which relate to the non-random matching of teachers with their working
conditions. One arises because teachers sort themselves among schools in nonrandom
ways and the second arises because of the nonrandom distribution of “working
conditions” to the various schools.
Across schools with any given set of measurable characteristics, for example,
teachers may gravitate to schools whose working conditions are most consonant with
their own working styles. For example, a teacher who wants some autonomy and
discretionary power might choose to work in a school that values those behaviors rather
than in a school in which the principal maintains full authority. The more extensive is
this type of matching, the less likely it is that teachers’ perceptions of their working
conditions will emerge empirically as an important predictor of teacher movement. That
movement instead would reflect idiosyncratic factors related to the teacher and her
situation. It is worth noting here that the analytic problem in this situation is not that the
working conditions are based on teachers’ perceptions rather than on objective measures,
but rather that teachers sort themselves among schools based on the working conditions
in the school. As a result of that confounding one must be cautious about making causal
statements about the relationship between teacher working conditions, however
measured, and teacher movement.
13
In practice, however, such matching is likely to be quite imperfect and also less
perfect than for the more readily apparent school characteristics, such as the racial mix of
the students or salary levels. As teachers accept their first jobs, they typically often have
far less information about working conditions within the school than about the observable
characteristics of the school. How much information they have will depend on how
extensive the interviewing process is for that school and, in particular, whether they are
hired directly by the principal or by the district (Johnson and Birkeland 2003). Even in
subsequent job placements where the fit is likely to be better, it may still be imperfect
because of the incomplete set of options available to teachers interested in moving to a
new school. Further, teachers who start out in schools with working conditions with
which they are quite comfortable may end up in a disequilibrium situation with the arrival
of a new principal with a different leadership style.
A second form of reverse causation also poses a problem. To the extent that
policy makers compensate schools that have high teacher turnover or low test scores by
efforts to improve their working conditions, such as by upgrading facilities or providing
more professional development opportunities, better working conditions might well
appear to generate higher, rather than lower, teacher departure rates. Within the context
of a cross sectional study of this type, not much can be done to address this issue. At
best, the reader should remain alert to the issue, and once again be careful not to attribute
causation to the reported results.
In summary, whether survey-based measures of working conditions emerge as
predictors of teacher mobility is an empirical question. If they do not, then policy makers
need to be careful about attributing teacher mobility to poor working conditions rather
14
than to other factors related to the more easily measured characteristics of the school. If
teachers’ perceptions of their working conditions do emerge as important, then it would
be useful to design and evaluate policy interventions specifically intended to improve
working conditions within schools and to compare their efficacy with strategies, such as
higher salaries, designed to offset the reluctance of teachers to teach in schools with poor
working environments. Ideally such policy interventions would be based on random
assignment of schools to treatment and control groups so as to isolate the causal impacts
of specific interventions, something that is not possible with the observational data used
in this paper.
NORTH CAROLINA DATA
North Carolina represents an excellent state for this study of working conditions, as
perceived by teachers. Not only is it a large and diverse state, but it also has made
available to researchers extensive administrative data on student, teacher, school and
district characteristics. In addition, it is the first state to have administered a statewide
survey of working conditions to all teachers and administrators. The survey was first
initiated by the governor in 2002 and has been administered to all teachers and
administrators by the Center for Teaching Quality every second year since then. Though
the response rates were below 50 percent for the first two years of the survey, they
exceeded 70 percent in both 2006 and 2008. I focus here on the survey results for 2006,
the most recent year for which we also have teacher departure data.
The surveys are administered electronically, with teachers receiving their access
codes not from the school or state officials, but by teacher representatives within each
15
school. All surveys are anonymous. To encourage participation in 2006, the North
Carolina business community provided financial incentives in the form of weekly
drawings for prizes from among the schools with high response rates, and helped the state
explain to teachers the importance of responding. Provided that the response rate of
teachers in a school is at least 40 percent, the findings from the survey are posted on the
school’s web page. In addition, schools are encouraged to use the survey results for
internal discussions about how to improve working conditions.
Overall response rates and the patterns across schools grouped into poverty
quartiles by level of school are reported in the first panel of Table 2. The poverty
quartiles are based on the percentages of students eligible for free or reduced price lunch,
calculated separately by level of school. The average ranges from 63 percent in high
school to 75 percent in elementary school. The differences across quartiles are largest at
the high school level, where they range from 71 percent in the poorest schools to 69
percent in the more affluent schools. The bottom panel reports the percentages of schools
with teacher response rates greater than 40 percent.
Table 3 provides descriptive information for all the variables used in the planned
departure models, organized into the following groups.
Working conditions domains and additional time variables
Working conditions are divided into five domains, or factors, for each level of schooling
that were derived from the 54 questions to which teachers responded based on a five-
point Likert scale. For some questions the scale is 1) strongly disagree, 2) somewhat
disagree, 3) neither disagree nor agree, 4) somewhat agree or 5) strongly agree. For
others, the scale is 1) no role at all 2) small role, 3) moderate role, 4) large role, and 5) the
16
primary role. Specifically, I use factor analysis with a varimax (orthogonal) rotation
based on to construct the five measures.2 To allow the constructs to differ by level of
school, the analysis was done separately for elementary, middle and secondary schools.
Included in each factor are survey questions that have a factor loading of 0.3 or above,
and each survey question is included in only one factor. Emerging from this analysis are
five quite comparable factors for elementary and middle schools, but a slightly different
set of factors at the high school level. Though I have given names to each of the five
factors that are quite similar to those used in the actual survey, just because a question is
contained in a category such as “Time” in the survey instrument need not mean it is in the
Time domain for this analysis.3 The resulting factors are as follows:
Leadership (all three levels)
In addition to about 20 statements labeled leadership on the survey instrument, this
factor includes several questions categorized on the survey under the teacher
empowerment category. Included in this factor are questions about the overall
quality of school leadership such as “Overall, the school leadership in my school is
effective” or the “School leadership consistently supports teachers” and about the
efforts of the leadership to address teacher concerns about facilities and resources,
professional development or use of time. Also included are statements about whether
2 For this analysis I used only the survey responses of teachers and only those that were complete (that is, those that had responses to all of the relevant questions with the five‐point scale). In addition, the sample was restricted to teachers in traditional public schools. Thus, survey responses of administrators and those of teachers in charter schools were excluded. The use of five factors for each level of schooling was based on the criterion that the eigenvalue for a factor be greater than one. Had we determined the number of factors instead by the criterion of a significant drop in eigenvalue, we would have ended up with a single factor. 3 The complete set of questions by factor for each level of schooling and their loadings are currently included in an appendix table, but upon publication that table could be made available on request.
17
teachers are involved in decision making or trusted to make sound professional
decisions about instruction. The elementary and middle school factors also include
questions related to teacher performance evaluations.
Facilities and resources (all three levels)
This factor includes seven to nine questions, depending on the school level, that are
all listed under facilities in the survey instrument. The questions refer to the
sufficiency of teacher access to appropriate instructional materials, technology, office
supplies, and professional space, and to the cleanliness, and safety of school
environments.
Teacher empowerment (all three levels)
This factor includes seven or eight questions about the role teachers have in selecting
instructional materials, setting grading and assessment practices, hiring new teachers
and school improvement planning.
Professional development (all three levels, with some differentiation by level)
At the elementary level and middle school level, this factor is based on five questions
about the sufficiency of funds, resources and time for teachers to take advantage of
professional development opportunities. At the high school level, this factor also
includes two questions about the time available to collaborate with colleagues.
Time domain (elementary and middle school only)
At the elementary school level, this factor includes five statements about class size,
time available to teachers to meet the needs of their students or to collaborate with
colleagues, and the extent to which teachers are protected from administrative duties.
At the middle school level, only three of the questions are included. The class size
question does not appear in any factor at the middle school level. Time does not
emerge as a separate factor at the high school level.
Teacher evaluation (high school only)
This factor embodies three statements related respectively to the consistency,
usefulness and appropriateness of the evaluation of teachers. These questions fit into
18
the leadership domain at the lower levels of schooling.
Each of these factors were aggregated to the school level and then normalized so
that across teachers in the each of our regression samples, the means of each factor are
equal to zero and the standard deviations are equal to one. Aggregating to the school
level averages out the random elements across teachers and reduces the noise relative to
the signal. In addition, it helps counter the problem of reverse causation that can occur
when both the dependent and the independent variables are based on the survey.
Regardless of the true reason a teacher may want to leave a school, for example, she may
rationalize her decision in part by giving the school a poor rating in terms of working
conditions. In that case, any observed relationship between her perceptions of working
conditions and her desire to leave the school, would be spurious. Averaging responses
about working conditions across all responding teachers within each school, as well as
weighting the regressions by the number of responses, helps to minimize, but does not
eliminate, this problem.4
In addition to these working condition domains, the models include two time-use
questions for which teachers were asked to give more quantitative answers. The first
question reads: “In an average week of teaching, how many hours do you have for non-
instructional time during the regular school day?” Follow-up questions make it clear that
this is time for individual planning or structured collaborative planning. The second
4 In earlier regressions, I also omitted the respondent’ own response when I calculated the average responses at the school level, a procedure that generates teacher‐specific measures of working conditions within each school. I present results for the simpler specifications in this paper so that the working conditions variables are identical at the school level in the planned and actual departure models.
19
question reads: “In any average week of teaching, how many hours do you spend on
school-related activities outside the regular school work day?” Both questions provide
five possible answers ranging from none to more than 10 hours. In each case, I have
collapsed the responses into 0-1 variables, with 0 indicating less than three hours and 1
indicating more than 3 hours. As shown in Table 3, only 38 percent of the responding
elementary school teachers said they had three of more hours of time for planning in an
average work week, which is far below the 62 percent at the middle and high school
levels. At all three levels about 81 to 83 percent of the respondents said they spent more
than 3 hours on school related activities outside the regular work day.
Data on School Characteristics
Information on school characteristics comes primarily from state administrative data
available through the North Carolina Education Research Data Center. The models
include 15 variables intended to measure school characteristics. These variables include
six measures of the characteristics of the students in the school: the fractions of black
students, Hispanic students or students of another race; the fractions of students eligible
for free and reduced price lunch or with limited English proficiency and the fraction of
students whose parents do not have a college degree. No measure of the average
achievement of the students in the school is included because the intent is to measure
student characteristics that are outside the immediate control of the teachers in the school.
In addition, school characteristics include four measures of the qualifications of
all teachers in the school: the fractions of teachers with graduate degrees, teachers with 0-
3 years of experience or with greater than ten years of experience, and the average
teacher test score. Further I include two indicator variables for the age of the school (one
20
denoting a school of average age and the other an old school), and measures of school
size and district size. Also included are two variables indicating how the school fared the
previous year under the federal and state accountability programs to represent the stress
that teachers may be under to improve test scores (Tye and O’Brien, 2002; Darling-
Hammond, and Sykes, 2003). The first variable – Did not meet AYP (05) – indicates
the school did not make the adequate yearly progress requirements under the federal No
Child Left Behind Act , and the second – Did not meet expected growth (05) – indicates
that the school did not meet the achievement growth requirements under the state’s
accountability system.
Salary data
North Carolina has a statewide salary schedule but then allows its local districts to
supplement salaries if they wish, which means the local supplements are the only source
of variation across districts for a teacher with specified characteristics. I estimate a single
salary for each district, based on the statewide salary for a teacher with a master’s degree
and eight years of experience plus my best estimate of the salary supplement, in
logarithmic form.5 Importantly for this analysis, nominal salaries do not differ much
across districts, with the full range being $36,830 to $42,910. Moreover, evidence
suggests that this variation is attributable in part to variation in the cost-of-living and to
salary supplements that are higher in districts with higher proportions of novice teachers,
5 In general information is available only on the total supplemental payments and the number of recipients. For some districts, more detail is available on the web about how the supplements are distributed among teachers. In other cases, we had to make reasonable assumptions about its distribution.
21
presumably as a way to recruit more teachers.6 Adjusting the salaries for cost-of-living
differences would most likely reduce the variation even further, rending it minuscule
compared to the three-to-one differential in adjusted salaries across districts in California
reported in Loeb, Darling-Hammond, and Luczak (2005). Given this small variation, and
the fact that teachers have already made their initial job decision with full knowledge of
the salary, I expect salary differentials are likely to have little or no predictive power in
this cross sectional analysis.
Characteristics of individual teachers and geographic indicators
The data on individual teachers in the planned departure models are all self-reported on
the survey. As shown in Table 3, the 13 variables in the equation denote whether the
teacher is black, Hispanic or “other race”; whether the teacher is male, five experience
categories, whether the teacher currently has a graduate degree or is National Board
Certified, and whether her initial training was in a master’s program or whether she
entered through an alternative entry program. These teacher characteristics control for the
teacher specific characteristics that may be associated with teacher movement.
Finally, the model includes 10 geographic indicator variables. These indicator
variables distinguish schools in each of the four largest districts, other than Charlotte-
Mecklenburg which serves as the base, as well as those in the urban and rural regions of
three main regions in the state – mountain, Piedmont and coastal. These indicator
variables are included to control for the differing labor market conditions across the state,
6 This statement is based on Walden and Sogutlu (2001) and on our own unpublished estimates for a more recent year.
22
as well as policy differences among districts related to teachers.
Dependent variables
I construct planned departure variables from the following survey question: “Which best
describes your future intentions for your professional career?” For the basic models, the
responses are divided into two categories: remain in the school or leave the school. For
the supplemental multinomial choice models the outcomes are split into four categories:
remain in the school, leave “this school”, leave “this district”, and leave the profession.7
As shown in Table 3, the proportion of respondents intending to leave their schools for
any reason is 11 percent in elementary schools and about 14 percent in middle and high
schools. At each level, the proportion of teachers intending to change schools within the
same district is somewhat smaller than the proportions planning to move to another
district or to leave the profession.
PLANNED DEPARTURES OF SURVEY RESPONDENTS
Table 4 presents some initial simple descriptive linear probability regressions to illustrate
the relationship between a respondent’s plans to leave a school and the average working
conditions in the school, as perceived by its teachers ( Panel A) and school demographics
(Panel B). I report basic results from linear probability models because of their ease of
interpretation; the patterns are virtually identical for comparable logit models. All the
7 The five response categories are 1) continue teaching at my current school, 2) continue teaching at my current school until a better opportunity comes along 3) continue teaching but leave this school as soon as I can 4) continue teaching but leave this district as soon as I can 5) leave the profession all together. We coded responses 1 and 2 as remaining in the current school.
23
regressions in this and subsequent tables are limited to the survey respondents in schools
in which at least 40 percent of the teachers responded and are weighted by the number of
responding teachers. In addition, the errors are clustered at the school level.
The equations in each panel of Table 4 include no variables other than those
reported within the relevant panel. Emerging from Panel A is the descriptive finding that
at all three levels of schooling, the probability of departure is negatively correlated with
the perceived quality of school leadership. The coefficients indicate that a one standard
deviation difference in the school leadership measure is associated with about a 5
percentage point difference in the other direction in the probability that a teacher intends
to leave the school at both the elementary and middle school levels, and about half that at
the high school level. At that level, the empowerment of teachers, which some people
interpret as a form of distributive leadership, exhibits a larger coefficient than the
leadership factor. Empowerment also emerges as statistically significant at the
elementary level, but with a very small coefficient. More time for planning and
collaboration is associated with lower departure rates at the middle school level.
Emerging from Panel B for the demographic characteristics of the schools is the
typical finding that teacher departure rates are higher in schools with larger fractions of
black students, and, at the middle school level, also with the fraction of Hispanic
students. The consistently large correlation between departure rates and the fraction of
black students justifies our attention to that specific demographic variable in much of the
discussion below. I emphasize, however, that that the fraction of black students in a
school may be serving as a proxy for a variety of student characteristics that are
correlated with race, such as a high prevalence of single parent families, and need not
24
indicate race alone. Though the coefficients on some of the racial mix variables appear
relatively large they must be multiplied by the standard deviations of the specific variable
to make them comparable to the coefficients for the working conditions variables. Based
on the standard deviations in Table 3, the coefficients for the fraction black translate into
standardized coefficients of 0.031 at the elementary level, 0.025 at the middle school
level, 0.040 at the high school level, and the Hispanic coefficient for middle schools
translates into a standardized coefficient of 0.015. Thus, purely at this descriptive level of
analysis it appears that variation across schools in the perceived quality of leadership is a
potentially important predictor of teachers’ planned departure rates and possibly more
predictive than the racial demographics of the school.
Full linear probability models
To address the research question of whether the working conditions survey information
generates useful predictive power over and above what is available from administrative
data, the working conditions variables must be incorporated into the full models that
include school, district, and respondent characteristics. The results for these models are
reported in Table 5. Of most interest are the findings for the working conditions
variables.
Even with the addition of the control variables, including the student demographic
variables, some of the working conditions variables continue to be predictive of teacher
departures. In particular, school leadership enters with large and statistically coefficients
at all three levels. The coefficients are about 40 percent of the mean intended departure
rates at the two lower levels, and about 30 percent at the high school level. In addition,
the empowerment of teachers appears to protect against teacher departures, but only at
25
the high school level. As indicated by the negative coefficient on the Time factor at the
middle school level, more time for collaboration and planning at that level is associated
with lower departure rates. Although the Time factor itself is not predictive at the
elementary level, the positive coefficient on the indicator variable representing more than
three hours a week spent working outside the school day suggests that time pressures are
predictive of teacher departures at that level as well.
Of interest is that the coefficients on the fraction of black students are now
substantially lower than they were in Table 4, which reflects, as we discuss further below,
not only their correlation with the working conditions variables but also with many of the
other control variables included in the full models. Although only a few of the other
school level variables are statistically significant, most enter with expected signs. One
result is worth highlighting. At the elementary level, the positive coefficient on the state-
specific accountability variable is fully consistent with our previous work on how
accountability affects teachers in low performing schools (Clotfelter, Ladd, Vigdor, and
Diaz, 2004). For teachers to earn bonuses under the state’s program, their school must
achieve its expected growth in student achievement. Hence, the positive coefficient on
that variable, but not on the comparable variable for the federal NCLB program which
includes sanctions but no bonuses, suggests that teachers leave, at least in part, to
increase the chances of getting a bonus. More of the coefficients related to the
respondent characteristics are statistically significant, with most having reasonable signs.
Table 6 provides additional insight into the usefulness of the survey data on
working conditions by comparing estimated coefficients for selected variables, as well as
the explanatory power of the regressions, across four model specifications, by level of
26
school. In all cases, the results are based on the full model with only the indicated
variables deleted. For purposes of comparison, the entries in the first column replicate
those for the selected variables from the previous table. I draw attention here to the
patterns for elementary schools, starting with the explanatory power of the equation.
Though the R2 is very low for each specification – reflecting the fact that I am using
individual data with a linear specification – the working conditions variables appear to
contribute some policy significant explanatory power. In particular, the R2 rises from
0.027 in the model with no working conditions (last column) to 0.044 in the full model
(first column). Moreover, the observation that the absolute value of the coefficient of the
leadership variable is larger in the model that excludes all the school characteristics
(column 2) suggests that perceptions of leadership quality are correlated, at least to some
extent, with those characteristics. The newly statistically significant entries in column 3
in which the leadership domain is excluded suggests that good leadership in elementary
schools is positively correlated with the other working conditions measures.
Finally, I note that the coefficient on the fraction of black students falls about 16
percent -- from (0.061) to (0.051) -- in moving from the model with no working
conditions to the full model. Most of the reduction from the coefficient of 0.132 reported
in Table 4 to the 0.051 in the full model is attributable to the more easily measured school
characteristics, not to the working conditions variables. Thus, I conclude that models
with controls for working conditions attenuate, but only somewhat, the effect of the racial
mix variable on teachers’ plans to leave an elementary school. With some qualifications,
the conclusions for the middle and high school levels are quite comparable to these for
elementary schools.
27
In additional specifications (not reported) I interact the working conditions
variables with the fraction of black students in the school. Consistent with Grissom’s
(2008) finding that leadership is more important in hard-to-staff schools, I find a
statistically significant interaction effect between leadership and the fraction black. In
particular, teachers in schools with higher fractions of black students are even more
responsive to the quality of school leadership than in other schools with respect to their
intended departure decisions.8
Multinomial choice models
So far, all the models focus on the probability of leaving a school regardless of the
destination or reason. Table 7 reports results for the key working conditions and school
demographic variables of a disaggregated competing risks model of the four planned
outcomes: remain in the same school, move to another school in the district, move to
another district, and leave the profession. (See Table 3 for the distributions of these
outcomes.) For each level of schooling, I ran a single multinomial logit model with the
same set of variables as in Table 5. Sample sizes and school clusters are identical to those
in that table. To facilitate the interpretation of the results, they are all reported as relative
risk ratios. Entries less than one indicate that the variable is associated with lower
chances of the specific outcome relative to the base option of remaining in the same
8 I also interact the working conditions separately with variables for inexperienced teachers (those with three or fewer years of experience) and black teachers. A few statistically significant differences emerge. At both the elementary and the middle school levels, in making their departure decisions, inexperienced teachers appear to be more somewhat more responsive to the quality of school leadership than are more experienced teachers. In contrast, black teachers at the elementary school level emerge as somewhat less responsive to the quality of school leadership than their white counterparts.
28
school and coefficients grater than one are associated with higher chances of the specified
outcome.
Consistent with the simpler models, school leadership emerges as the most
consistently relevant measure of working conditions. The table shows that the relative
risk ratio is, as expected, less than one (but not always statistically significant) in all but
one case, and is smallest for moving to another school in the same district, at each level
of schooling. Stated differently, teachers in schools with high quality leadership are not
only less likely to leave the school than are comparable teachers in schools with less good
leadership, but they are also relatively less likely to move to another school within the
same district than to choose either of the other two options. Further there is little
evidence that the quality of school leadership is directly implicated in the departure of
teachers from the profession at the elementary and middle school levels, although that is
not true at the high school level. Also noteworthy is the role of the Time factor (and for
elementary school teachers the Outside Work-Day time variable) at the elementary and
middle school levels.
At the same time, some unexpected results also emerge. These include the
positive risk ratios for switching schools for the facilities factor at the elementary and
middle school levels and the professional development factor at the high school level. .
They also include the empowerment results at the middle school district for moving to
another district. In each case, one can provide possible explanations for the unexpected
ratios – such as the reverse causation that would arise if districts provide compensatory
materials and technology or more extensive professional development in some difficult-
to-staff schools or that the exercise of authority in schools that empower teachers better
29
prepare those teachers to seek alternative situations – but such explanations would be
speculative at best at this point.
Most striking are the patterns of risk ratios based on the racial composition of the
students (final row for each level). Although most of the ratios exceed 1, in no case is a
higher proportion of black students associated with a statistically significantly higher
relative risk that a teacher will switch schools within the district. Instead, the very high
risk ratios of 5.13 at the elementary level and 8.108 and 2.008 at the high school level are
associated with intentions to leave the district, or, in the case of high school teachers, to
leave the profession entirely. Thus, while low-quality leadership in a specific school may
influence teacher movements within a district, the presence of racially segregated schools
appears to be more predictive of cross-district moves than within district moves, all else
held constant.
Not reported in the summary table but also of interest is the finding that the state
accountability variable enters with a coefficient greater than one for all three options, but
is largest and only statistically significant for the option of moving to another school
within the same district.
OTHER OUTCOME MEASURES
The results to this point are clear: teachers’ perceptions of working conditions at the
school level are highly predictive of an individual teacher’s intentions to leave a school,
with the perceived quality of school leadership the most salient factor. It is useful,
however, to extend the analysis to other outcome measures that are based on actual rather
than survey data for several reasons. First, some observers may be concerned that stated
30
intentions are either not believable or not useful unless they ultimately translate into
actions of interest to policy makers. A second is that measuring working conditions at the
school rather than the individual level may not completely eliminate the reverse causation
mentioned earlier that arises when the dependent variable is generated by the survey;
such reverse causation will still be present, for example, if many teachers want to leave a
school and all rationalize it by complaining about working conditions. Third, the intended
departure rates are based only on the respondents to the survey which could, under
certain conditions, generate an overestimate of the role of working conditions.
Hence, I look briefly at two other outcome measures – actual one-year departure
rates at all school levels and student achievement at the elementary level. In both cases,
leadership emerges as a statistically significant predictor but the overall predictive power
of the working conditions variables, as measured by changes in the R2 is far lower than
for the planned departure rates.
Actual one-year departure rates
Using administrative data, I calculated one-year actual departure rates for teachers by
comparing the schools that the teachers were teaching in as of 2005/06 to the schools
they were teaching in the following year. One shortcoming of this approach is that
teachers who leave the profession cannot be distinguished from those who leave the
administrative data set. For example, teachers who remain in teaching but move to
another state, teachers who leave for short periods perhaps to have children, or who do
not appear in the data set because of a data glitch all are treated as leavers of the
profession. As a result, the proportions of teachers categorized as actual leavers are
higher than the comparable proportions of intended departures for survey respondents (18
31
vs. 11 percent in elementary school, 21 vs.15 percent in middle school and 20 vs. 14
percent in high school), with the differential in each case almost entirely attributable to
the larger proportion in the category of leaving the data set. 9
Figures 1A, 1B and 1C depict the relationships between planned and actual
departure rates aggregated to the school level for all schools with at least a 40 percent
response rate. The two departure measures are positively correlated at each level of
schooling, but far from perfectly so. The data concerns just mentioned account for part of
the variation. Another explanation is that actual departure rates represent the outcome
not only of teacher preferences but also of the availability of open positions in any one
year. Finally, the survey asks about career intentions, not intentions for the following
year.10
The full linear probability models for the actual departure rates are reported in
Table 8. The sample sizes in this table are larger for those in table 5 because all teachers
in each school are now included, but the number of school clusters is somewhat smaller
because data problems force me to delete some schools.11
As was the case for the planned departures, the most consistent findings for the
working conditions variables emerge for the leadership factor. The negative coefficients
9 At the elementary level, the proportions in each of the four categories (remain in school, stay in district, move to another district, or leave the profession) are 82,0, 4.4, 2.7, and 10.9. At the middle school level, the proportions are 78.6, 5.4,3.9 and 12.1 and at the high school level, 80.1, 3.50, 3.60 and 12.79 10 Because the question about planned departure rates was not asked on previous waves of the working condition survey it was not possible to use those earlier surveys to look at longer movement patterns. 11 In particular, we deleted some schools because of calculated departure rates of 100 percent. Had these rates reflected school closures, we would have deleted them from the planned regressions as well, but we were not able to confirm that that was the case, so we have just deleted them from the actual regressions.
32
indicate once again that teachers are more likely to leave schools with poor leadership
than those with strong leadership, all else held constant, but the magnitudes are far
smaller than in the planned departure equations in Table 5. At the same time, however,
the coefficients on the fraction of black students in the elementary and middle school
equations are as large as or larger than those in the planned departure equations. This
pattern of coefficients indicates that both absolutely and relative to the school
demographic variables, the working conditions variables are far less important for actual
departures than for intended departures.12
Nonetheless, at the elementary level, the association of the leadership factor with
actual departure rates still remains comparable or slightly higher than the comparable
association for the fraction black variable. More specifically, the 0.018 predicted effect
of a one standard deviation difference in the standardized leadership factor is slightly
higher than 0.016 (= 0.068* 0.236) which is the predicted effect of a one standard
deviation difference in the fraction of black students. Consistent with this parity of
coefficient magnitudes, the addition of the whole set of working conditions controlling
for school characteristic, or the addition of all school characteristics controlling for
working conditions, both increase the explanatory power of the regression by about 15
12 At least two other considerations could account for the fact the smaller coefficients on the working conditions variables but not on the demographic variables. One is the potential upward bias that could emerge for the working conditions variables in the planned regression because of the confounding referring to above‐ namely that teachers who plan to leave may rationalize their decisions by badmouthing the school and the other is the possibility that grumpy teachers may say they want to leave even if they in fact do not actually intend to do so. There is no clear evidence of either possibility. In the first case, the estimates of the working conditions variables in the actual departure rates would most likely be similarly biased upward. For the second case, the departure rates are no higher in the planned departure samples than in the actual departure samples.
33
percent. In contrast, at the middle school level, the racial mix of the students has more
predictive power than the quality of leadership.
Student achievement – test scores
One additional outcome of policy interest is student achievement as measured by test
scores. To analyze the extent to which teachers’ working conditions are predictive of test
scores, I estimated a two- stage model based on standardized test scores in math and
reading for all students in grades 4 and 5. The first stage is a standard value model in
which a student’s achievement in math or reading in the current year is estimated a
function of his/her prior year test score and other characteristics such as race and gender;
teacher characteristics such as experience and graduate education, and school fixed
effects. The second stage models the variation in the school fixed effects across more
than 1070 schools in each case as a function of the working conditions variables and
other school level measures. Of interest are the coefficients of the working conditions
variables in the second stage and their contributions to the explanatory power of those
regressions.
Table 9 reports the results for both math and reading. For math, two of the survey
measures enter with statistically significant positive coefficients: leadership and the
quantitative time variable indicating that teachers have more than three hours of time for
planning. These two variables are also positive for reading but only the latter is
statistically significant, and the coefficient of the leadership factor is less than half the
size of the comparable coefficient for math. For reading, teachers’ perceptions of
facilities are also predictive of positive school effects but, contrary to expectations, a
higher rating for professional development opportunities within the school is predictive
34
of negative achievement effects. This latter finding most likely illustrates one of the
statistical problems noted earlier, namely that policy makers do not distribute resources
randomly across schools. In this case, it appears that more professional development
opportunities are provided to schools that are performing less well in reading than other
schools with the same types of students.
A comparison of the explanatory power of these second-stage regressions with
and without the working conditions variables (the five factors and the two quantitative
time variables) indicates that for math, the survey variables augment the explanatory
power by almost 15 percent and in reading by about 12 percent.13 Thus, teachers’
perceptions of their working conditions contribute modestly to school-specific
differences in student achievement across primary schools, with the contribution
somewhat larger for math achievement than for reading.
CONCLUSION
North Carolina’s statewide working conditions survey provides a potential model for
other states. Before states invest too heavily in such an endeavor, however, it would be
useful to know the extent to which teachers’ perceptions of their working conditions are
13 Among the other determinants of the school fixed effects in Table 9, the positive coefficients on the fraction of students who are black deserve comment. Recall that these coefficients apply to the school effects that remain after taking out the contributions of individual student characteristics including their race. Consistent with other studies, in the first stage regressions (not shown), the coefficients on indicators denoting students are black, Hispanic, limited English dependent, eligible for free or reduced price lunch, or receiving special education all enter with large negative coefficients. The positive coefficients on fraction black in the second stage indicate that concentrations of black students are associated with higher student achievement. Working in the other direction, however, is that large concentrations of students whose parents are not‐college educated are associated with lower levels of student achievement.
35
predictive of outcomes of policy interest, which is the goal of this study. The main
conclusion is that working conditions of the type on the NC survey are highly predictive
of teachers’ career plans to leave schools, but are far less predictive of one-year actual
departure rates and student achievement. Even for actual departure rates at the
elementary school level, however, working conditions taken as a group are as predictive
as the more commonly analyzed school characteristics.
As documented in Table 5, a one standard deviation difference in the perceived
quality of school leadership is associated with planned departure rates that differ by close
to 40 percent of the mean planned departure rates at the elementary and middle school
levels, and about 30 percent at the high school level. Moreover, as shown in Table 6, the
combined contribution of all the working conditions variables to the explanatory power
of the regressions is 40 percent for middle schools, 60 percent for middle schools and 80
percent for high schools. These contributions are large not only absolutely, but also
relative to the contributions of the more easily measured characteristics of the school
such as its demographic mix of students.
Interestingly given current policy interest in empowering teachers, no statistically
significant evidence of lower planned departure rates emerges at the elementary or
middle school levels when teachers have more decision making authority (as measured
by the teacher empowerment factor), after the school’s measurable characteristics have
been controlled for. Only at the high school level does teacher empowerment emerge as a
predictor of lower planned departure rates. Time constraints appear to play a more
important role at the elementary and middle school levels than at the high school level.
Finally, it appears that the quality of leadership in a school is more predictive of planned
36
moves within a district, while the school’s racial mix of students is more predictive of
planned moves out of the district.
Such findings tend to provide strong support for the views of teachers’
organizations that policy makers would do well to pay far more attention to working
conditions than they have to date and to provide a strong rationale for periodic surveys of
teachers. At the same time, however, these results say more about teacher preferences
than about some of the specific behaviors or outcomes in which policy makers may be
interested. Moreover, some nagging concerns remain about potential biases associated
with the fact the teachers’ stated intentions and their perceptions of working conditions
may be confounded on the survey.
Consistent with these concerns, the predictive power of perceived working
conditions are far smaller for the two policy outcomes I was able to analyze: actual one-
year departure rates and student achievement in elementary school, as measured by test
scores in math and reading. Other outcomes of potential interest would include teacher
movements in and out of schools over a longer period of time, as well as the
attractiveness of the teaching profession to potential teachers.
Leadership still emerges as a predictor of actual departure rates, but the
coefficients are much smaller than for planned departures. Even for this outcome,
however, leadership differences across elementary schools are associated with differences
in departure rates that are comparable in magnitude to those associated with differences
in the fraction of black students in those schools. Taken as a group, variation in the
working conditions variables accounts for about 15 percent of the explained variation in
actual departure rates in elementary schools, 13 percent in middle schools, and 10 percent
37
in high schools. The much higher estimated contribution of working conditions reported
in the Loeb et al. (2005) study of teachers at the school level primarily reflects the fact
that those authors include salaries – which vary greatly across California schools—in
their concept of working conditions. In addition, it could well reflect the more limited
data available for that study. The bottom line is that working conditions as defined in the
present study do matter for teacher mobility decisions, but not as much as indicated by
the planned regressions or nor as much as was suggested by the Loeb et al. (2005) study.
The quality of school leadership also emerges as predictive of student
achievement for elementary school students, but only in math. Taken together, the
working conditions variables account for 10 to 15 percent of the explained variation in
math and reading scores across schools, after controlling for individual and school level
characteristics of schools.
38
REFERENCES Alliance for Excellent Education. 2005. Teacher Attrition: A Costly loss to the Nation
and to the States. Retrieved June 1, 2007, from http://www.all4ed.org/publications/TeacherAttrition.pdf.
Boyd, Donald J., Hamilton Lankford, Susanna Loeb, and James H. Wyckoff. 2005.
“Explaining the Short Careers of High-Achievement Teachers in Schools with Low-Performing Students.” American Economic Review 95: 166–71.
Buckley, Jack, Mark Schneider, and Yi Shang. 2005. “Fix It and They Might Stay:
School Facility Quality and Teacher Retention in Washington, D.C.” Teachers College Record 107(5): 1107–1123.
Clotfelter, Charles T, Helen F. Ladd, and Jacob L. Vigdor. 2007. “High Poverty Schools
and the Distribution of Teachers and Principals.” North Carolina Law Review 85(5): 1345–1379.
———. 2008. “Would Higher Salaries Keep Teachers in High-Poverty Schools?
Evidence from a Policy Intervention in North Carolina.” Journal of Public Economics 92: 1352–1370.
Clotfelter, Charles T, Helen F. Ladd, Jacob L. Vigdor, and Roger A. Diaz. 2004 “Do
Teacher Accountability Systems Make it More Difficult for Low Performing Schools to Attract and Retain High Quality Teachers?” Journal of Policy Analysis and Management 23(2):251–71.
Darling-Hammond, Linda, and Gary Sykes. 2003. “Wanted: A National Teacher Supply
Policy for Education: The Right Way to Meet The ‘Highly Qualified Teacher’ Challenge.” Education Policy Analysis Archives 11(33).
Dolton, Peter, and Wilbert von der Klaauw. 1995. “Leaving Teaching in the UK: A
Duration Analysis.” The Economic Journal 105(429): 431–44 Elfers, Ana M., Margaret L. Plecki, and Michael S. Knapp. 2006. “Teacher Mobility:
Looking More Closely at ‘The Movers’ Within a State System.” Peabody Journal of Education 81(3): 94–127.
Grissom, Jason A. 2008. “Simple and Complex School Resources and Teachers’
Turnover Decisions: Implications for Hard-to-Staff Schools.” Unpublished manuscript.
Hanushek, Eric A., John F. Kain, and Steven G. Rivkin. 1999. “Do Higher Salaries Buy Better Teachers? Working Paper No. 7082. Cambridge, Mass.: National Bureau of Economic Research.
39
———. 2004. “Why Public Schools Lose Teachers.” Journal of Human Resources 39(2): 326–54.
Hanushek, Eric A., John F. Kain, Daniel M. O’Brien, and Steven G. Rivkin. 2005. “The
Market for Teacher Quality.” Working Paper 11154. Cambridge, Mass.: National Bureau of Economic Research.
Hirsch, Eric, and Scott Emerick. 2006. Teacher Working Conditions Are Student Learning Conditions: A Report on the 2006 North Carolina Teacher Working Conditions Survey. Chapel Hill, NC: Center for Teaching Quality.
Ingersoll, Richard M. 2001. “Teacher Turnover and Teacher Shortages: An
Organizational Analysis.” American Educational Research Journal 38: 499–534. Johnson, Susan Moore. 2006. “The Workplace Matters: Teacher Quality, Retention and
Effectiveness.” Working Paper. Washington, D.C.: National Education Association. Johnson, Susan Moore, and Sarah E. Birkeland. 2003. “Pursuing a ‘Sense of Success’ :
New Teachers Explain Their Career Decisions.” American Educational Research Association. 40(3): 581–617.
Johnson, Susan Moore, Jill H. Berg, and Morgaen L. Donaldson. 2005. Who Stays in
Teaching and Why: A Review of the Literature on Teacher Retention. Cambridge, Mass.: The Project on the Next Generation of Teachers, Harvard Graduate School of Education.
Johnson, Susan Moore, Susan M. Kardos, David Kauffman, Edward Liu, and Morgaen L. Donaldson. 2004. “The Support Gap: New Teachers’ Early Experiences in High-Income and Low-Income Schools.” Education Policy Analysis Archives 12(61).
Ladd, Helen F. 2007. “Teacher Labor Markets in Developed Countries.” In Excellence in the Classroom, Future of Children 17(1): 201–17.
———. 2008. “School Policies and the Black-White Test Score Gap.” In Steady Gains
and Stalled Progress: Inequality and the Black White Test Score Gap, ed. Katherine Magnuson and Jane Waldfogel, 289–319.
Lankford, Hamilton, Susanna Loeb, and James H. Wyckoff. 2002. “Teacher Sorting and
the Plight of Urban Schools: A Descriptive Analysis.” Educational Evaluation and Policy Analysis 24: 44–70.
Loeb, Susanna, Linda Darling-Hammond, and John Luczak. 2005. “How Teaching
Conditions Predict Teacher Turnover in California Schools.” Peabody Journal of Education 80(3): 44–70.
Scafidi, Benjamin, David L. Sjoquist, and Todd R. Stinebrickner. 2007. “Race, Poverty,
40
and Teacher Mobility.” Economics of Education Review 26: 145–49. Stockard, Jean, and Michael B. Lehman. 2004. “Influences on the Satisfaction and
Retention of 1st-Year Teachers: The Importance of Effective School Management.” Educational Administration Quarterly 40(5): 742–71.
Tye, Barbara B., and Lisa O’Brien. 2002. “Why Are Experienced Teachers Leaving the
Profession?” Phi Delta Kappan 84(1): 24–32. Walden, Michael L., and Zulal Sogutlu. 2001. “Determinants of Interstate Variation in
Teacher Salaries.” Economics of Education Review 20(1): 63–70.
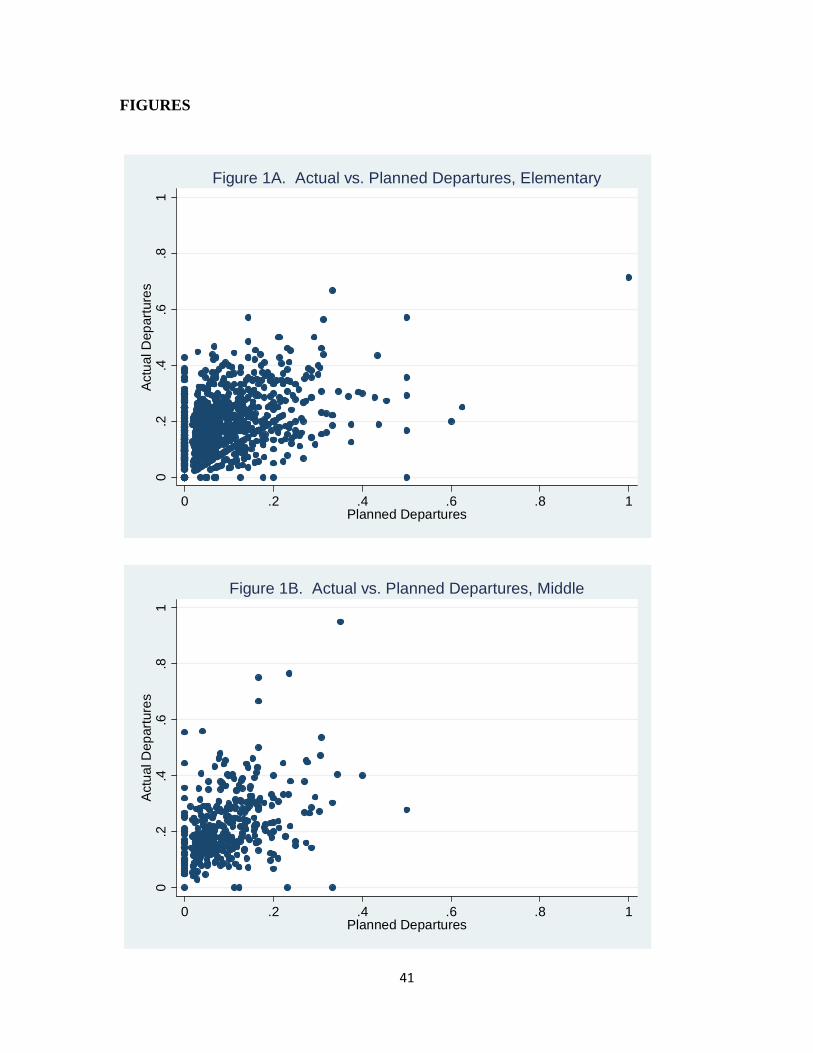
41
FIGURES
0.2
.4.6
.81
Act
ual D
epar
ture
s
0 .2 .4 .6 .8 1Planned Departures
Figure 1A. Actual vs. Planned Departures, Elementary
0.2
.4.6
.81
Act
ual D
epar
ture
s
0 .2 .4 .6 .8 1Planned Departures
Figure 1B. Actual vs. Planned Departures, Middle
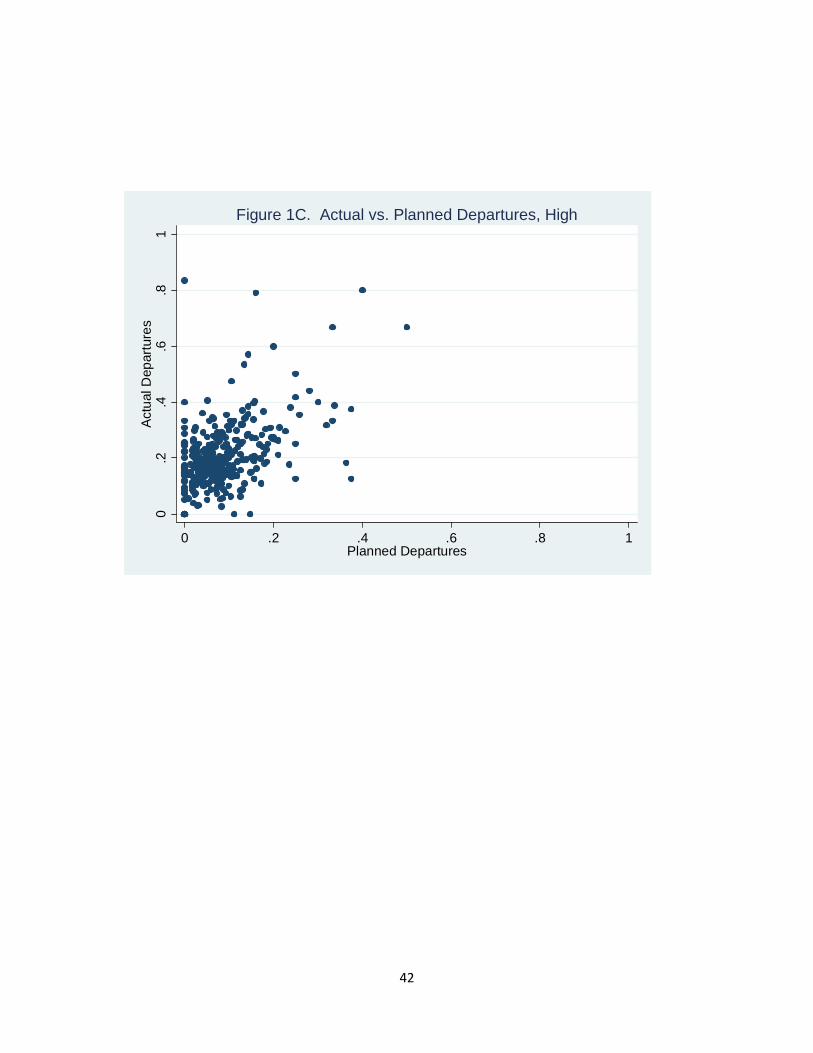
42
0.2
.4.6
.81
Act
ual D
epar
ture
s
0 .2 .4 .6 .8 1Planned Departures
Figure 1C. Actual vs. Planned Departures, High
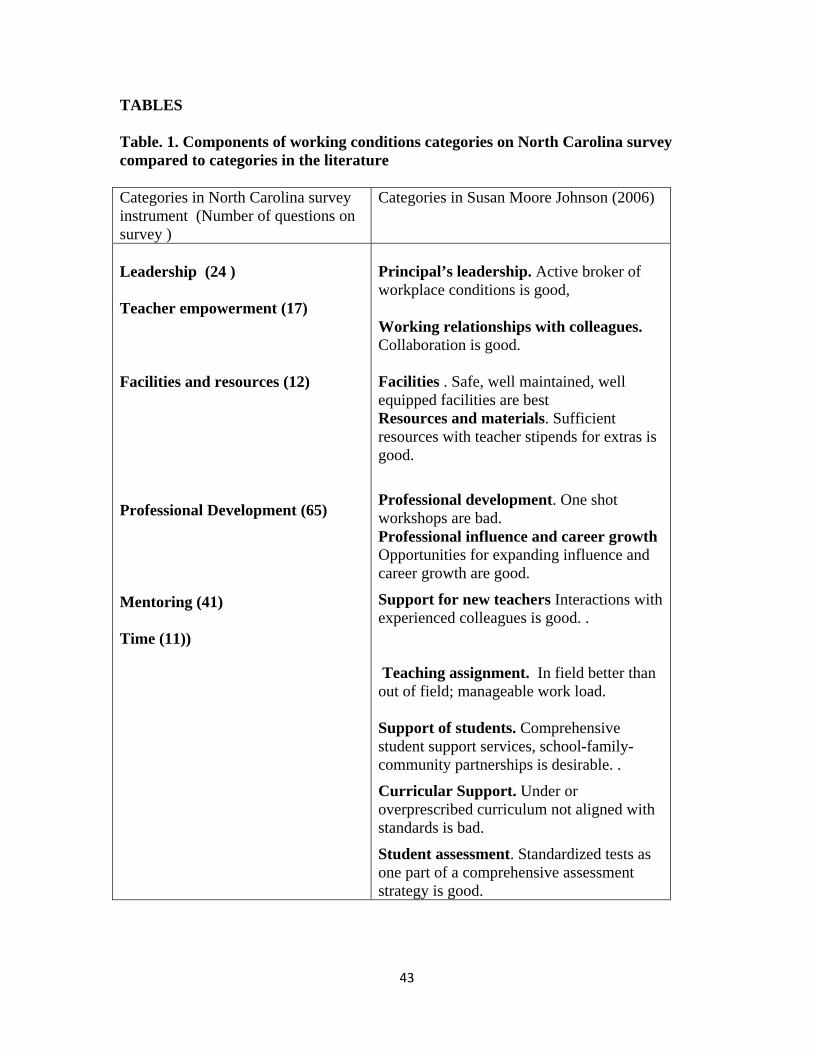
43
TABLES Table. 1. Components of working conditions categories on North Carolina survey compared to categories in the literature Categories in North Carolina survey instrument (Number of questions on survey )
Categories in Susan Moore Johnson (2006)
Leadership (24 ) Teacher empowerment (17) Facilities and resources (12) Professional Development (65) Mentoring (41) Time (11))
Principal’s leadership. Active broker of workplace conditions is good, Working relationships with colleagues. Collaboration is good. Facilities . Safe, well maintained, well equipped facilities are best Resources and materials. Sufficient resources with teacher stipends for extras is good.
Professional development. One shot workshops are bad. Professional influence and career growth Opportunities for expanding influence and career growth are good.
Support for new teachers Interactions with experienced colleagues is good. . Teaching assignment. In field better than out of field; manageable work load. Support of students. Comprehensive student support services, school-family-community partnerships is desirable. .
Curricular Support. Under or overprescribed curriculum not aligned with standards is bad.
Student assessment. Standardized tests as one part of a comprehensive assessment strategy is good.
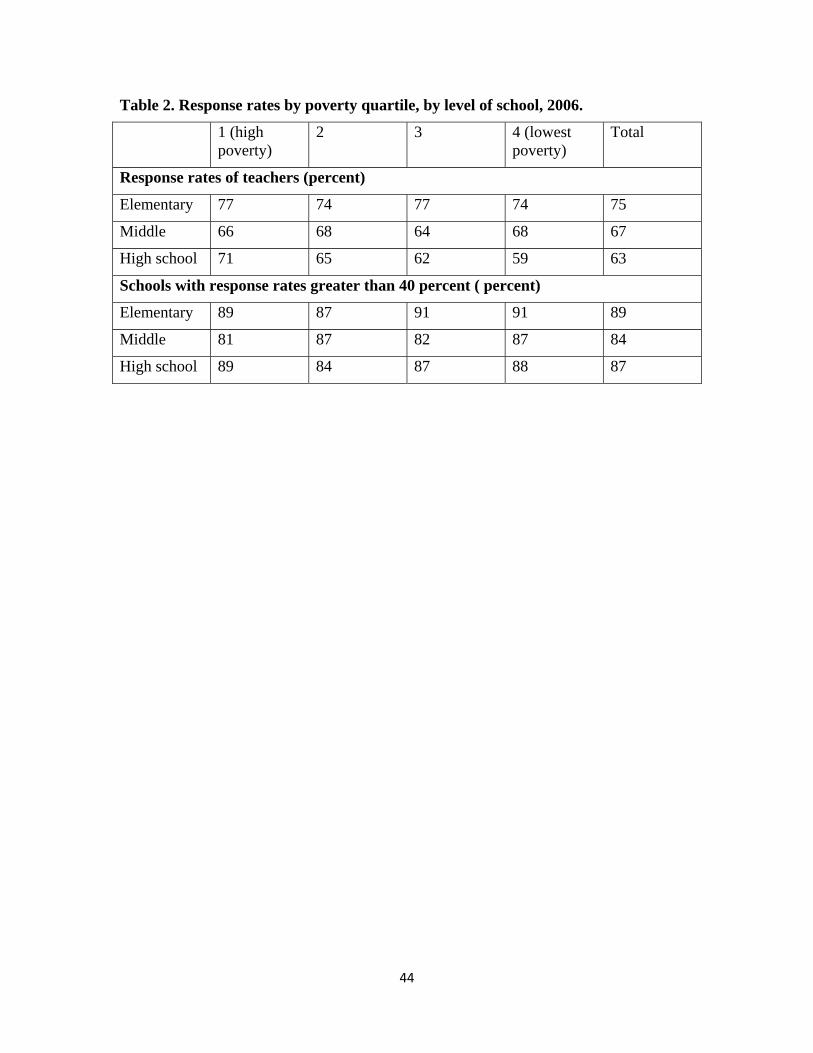
44
Table 2. Response rates by poverty quartile, by level of school, 2006.
1 (high poverty)
2 3 4 (lowest poverty)
Total
Response rates of teachers (percent)
Elementary 77 74 77 74 75
Middle 66 68 64 68 67
High school 71 65 62 59 63
Schools with response rates greater than 40 percent ( percent)
Elementary 89 87 91 91 89
Middle 81 87 82 87 84
High school 89 84 87 88 87
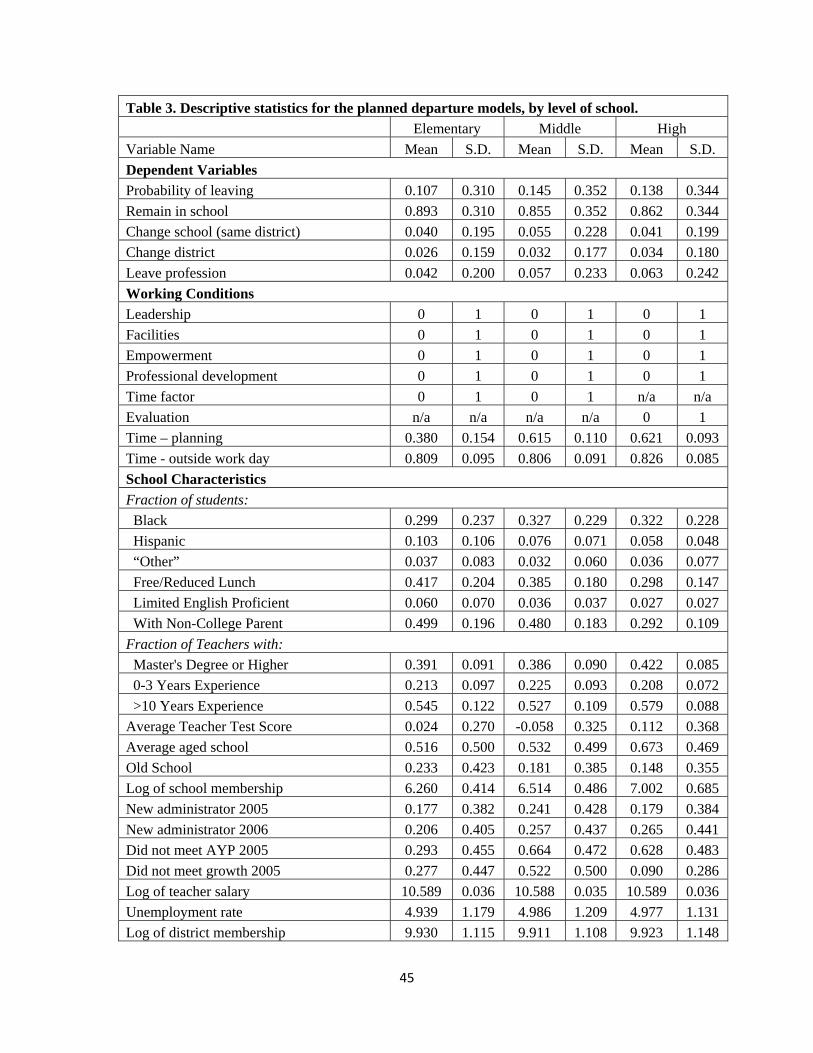
45
Table 3. Descriptive statistics for the planned departure models, by level of school. Elementary Middle High Variable Name Mean S.D. Mean S.D. Mean S.D. Dependent Variables Probability of leaving 0.107 0.310 0.145 0.352 0.138 0.344 Remain in school 0.893 0.310 0.855 0.352 0.862 0.344 Change school (same district) 0.040 0.195 0.055 0.228 0.041 0.199 Change district 0.026 0.159 0.032 0.177 0.034 0.180 Leave profession 0.042 0.200 0.057 0.233 0.063 0.242 Working Conditions Leadership 0 1 0 1 0 1 Facilities 0 1 0 1 0 1 Empowerment 0 1 0 1 0 1 Professional development 0 1 0 1 0 1 Time factor 0 1 0 1 n/a n/a Evaluation n/a n/a n/a n/a 0 1 Time – planning 0.380 0.154 0.615 0.110 0.621 0.093 Time - outside work day 0.809 0.095 0.806 0.091 0.826 0.085 School Characteristics Fraction of students: Black 0.299 0.237 0.327 0.229 0.322 0.228 Hispanic 0.103 0.106 0.076 0.071 0.058 0.048 “Other” 0.037 0.083 0.032 0.060 0.036 0.077 Free/Reduced Lunch 0.417 0.204 0.385 0.180 0.298 0.147 Limited English Proficient 0.060 0.070 0.036 0.037 0.027 0.027 With Non-College Parent 0.499 0.196 0.480 0.183 0.292 0.109 Fraction of Teachers with: Master's Degree or Higher 0.391 0.091 0.386 0.090 0.422 0.085 0-3 Years Experience 0.213 0.097 0.225 0.093 0.208 0.072 >10 Years Experience 0.545 0.122 0.527 0.109 0.579 0.088 Average Teacher Test Score 0.024 0.270 -0.058 0.325 0.112 0.368 Average aged school 0.516 0.500 0.532 0.499 0.673 0.469 Old School 0.233 0.423 0.181 0.385 0.148 0.355 Log of school membership 6.260 0.414 6.514 0.486 7.002 0.685 New administrator 2005 0.177 0.382 0.241 0.428 0.179 0.384 New administrator 2006 0.206 0.405 0.257 0.437 0.265 0.441 Did not meet AYP 2005 0.293 0.455 0.664 0.472 0.628 0.483 Did not meet growth 2005 0.277 0.447 0.522 0.500 0.090 0.286 Log of teacher salary 10.589 0.036 10.588 0.035 10.589 0.036 Unemployment rate 4.939 1.179 4.986 1.209 4.977 1.131 Log of district membership 9.930 1.115 9.911 1.108 9.923 1.148
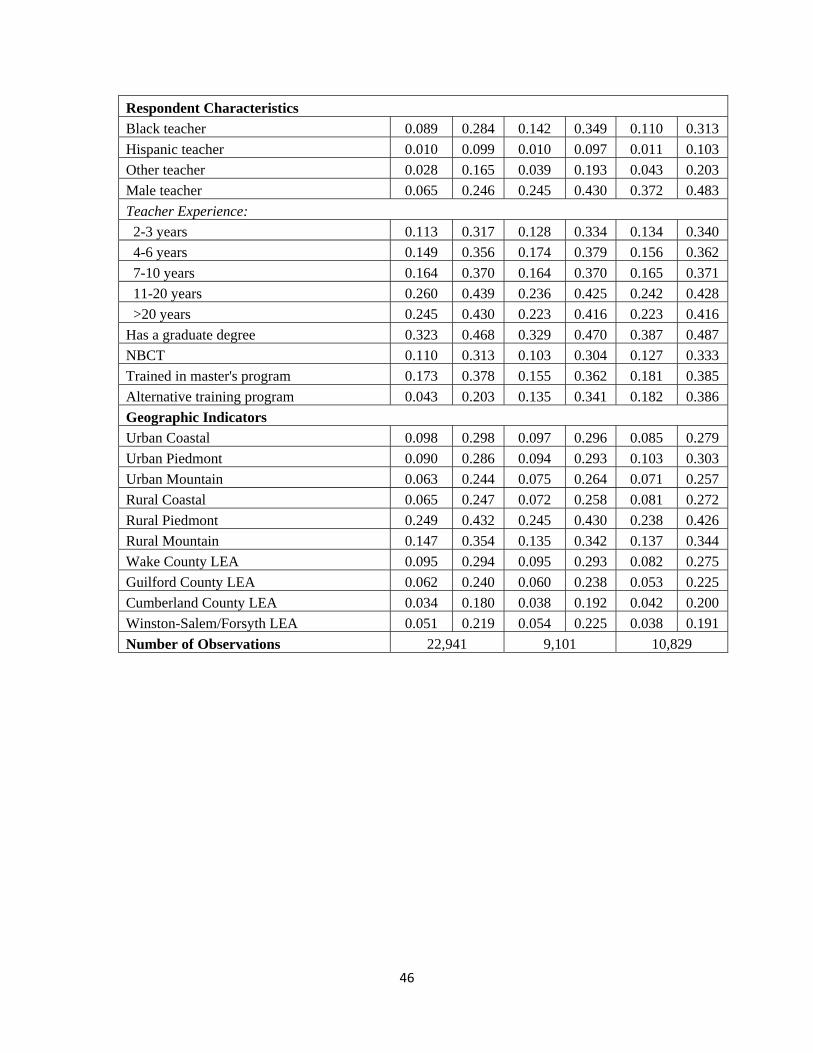
46
Respondent Characteristics Black teacher 0.089 0.284 0.142 0.349 0.110 0.313 Hispanic teacher 0.010 0.099 0.010 0.097 0.011 0.103 Other teacher 0.028 0.165 0.039 0.193 0.043 0.203 Male teacher 0.065 0.246 0.245 0.430 0.372 0.483 Teacher Experience: 2-3 years 0.113 0.317 0.128 0.334 0.134 0.340 4-6 years 0.149 0.356 0.174 0.379 0.156 0.362 7-10 years 0.164 0.370 0.164 0.370 0.165 0.371 11-20 years 0.260 0.439 0.236 0.425 0.242 0.428 >20 years 0.245 0.430 0.223 0.416 0.223 0.416 Has a graduate degree 0.323 0.468 0.329 0.470 0.387 0.487 NBCT 0.110 0.313 0.103 0.304 0.127 0.333 Trained in master's program 0.173 0.378 0.155 0.362 0.181 0.385 Alternative training program 0.043 0.203 0.135 0.341 0.182 0.386 Geographic Indicators Urban Coastal 0.098 0.298 0.097 0.296 0.085 0.279 Urban Piedmont 0.090 0.286 0.094 0.293 0.103 0.303 Urban Mountain 0.063 0.244 0.075 0.264 0.071 0.257 Rural Coastal 0.065 0.247 0.072 0.258 0.081 0.272 Rural Piedmont 0.249 0.432 0.245 0.430 0.238 0.426 Rural Mountain 0.147 0.354 0.135 0.342 0.137 0.344 Wake County LEA 0.095 0.294 0.095 0.293 0.082 0.275 Guilford County LEA 0.062 0.240 0.060 0.238 0.053 0.225 Cumberland County LEA 0.034 0.180 0.038 0.192 0.042 0.200 Winston-Salem/Forsyth LEA 0.051 0.219 0.054 0.225 0.038 0.191 Number of Observations 22,941 9,101 10,829
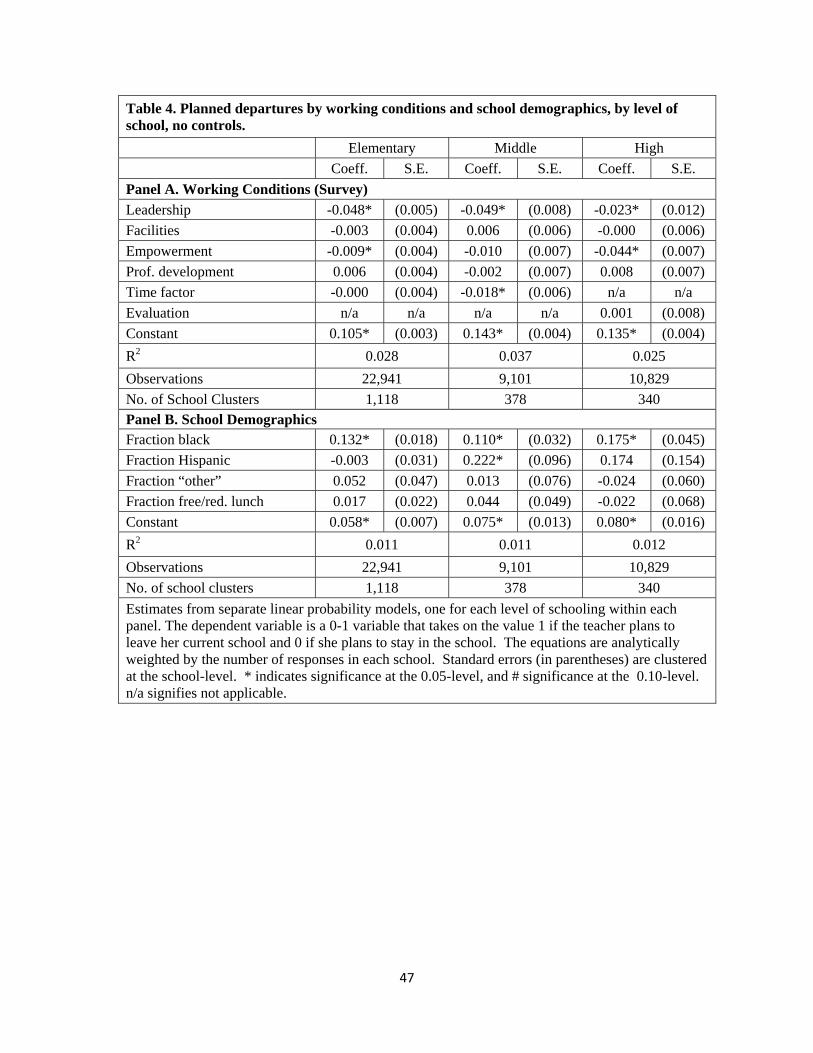
47
Table 4. Planned departures by working conditions and school demographics, by level of school, no controls. Elementary Middle High Coeff. S.E. Coeff. S.E. Coeff. S.E. Panel A. Working Conditions (Survey) Leadership -0.048* (0.005) -0.049* (0.008) -0.023* (0.012) Facilities -0.003 (0.004) 0.006 (0.006) -0.000 (0.006) Empowerment -0.009* (0.004) -0.010 (0.007) -0.044* (0.007) Prof. development 0.006 (0.004) -0.002 (0.007) 0.008 (0.007) Time factor -0.000 (0.004) -0.018* (0.006) n/a n/a Evaluation n/a n/a n/a n/a 0.001 (0.008) Constant 0.105* (0.003) 0.143* (0.004) 0.135* (0.004) R2 0.028 0.037 0.025 Observations 22,941 9,101 10,829 No. of School Clusters 1,118 378 340 Panel B. School Demographics Fraction black 0.132* (0.018) 0.110* (0.032) 0.175* (0.045) Fraction Hispanic -0.003 (0.031) 0.222* (0.096) 0.174 (0.154) Fraction “other” 0.052 (0.047) 0.013 (0.076) -0.024 (0.060) Fraction free/red. lunch 0.017 (0.022) 0.044 (0.049) -0.022 (0.068) Constant 0.058* (0.007) 0.075* (0.013) 0.080* (0.016) R2 0.011 0.011 0.012 Observations 22,941 9,101 10,829 No. of school clusters 1,118 378 340 Estimates from separate linear probability models, one for each level of schooling within each panel. The dependent variable is a 0-1 variable that takes on the value 1 if the teacher plans to leave her current school and 0 if she plans to stay in the school. The equations are analytically weighted by the number of responses in each school. Standard errors (in parentheses) are clustered at the school-level. * indicates significance at the 0.05-level, and # significance at the 0.10-level. n/a signifies not applicable.
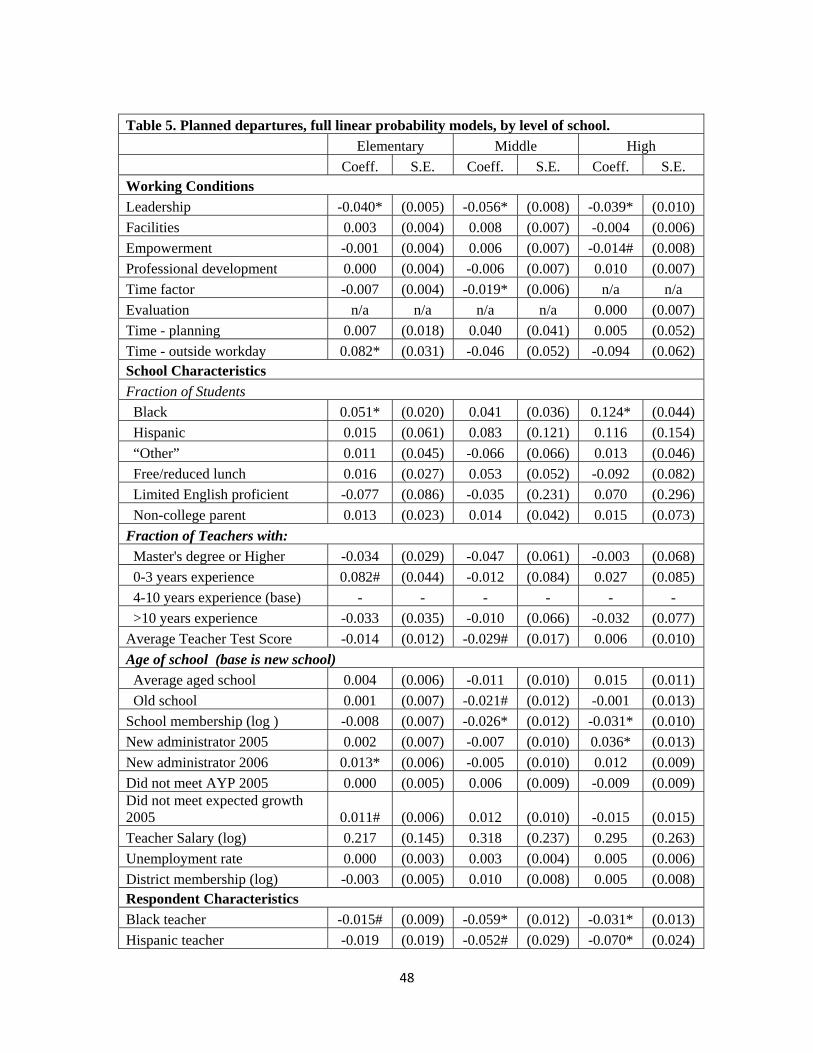
48
Table 5. Planned departures, full linear probability models, by level of school. Elementary Middle High Coeff. S.E. Coeff. S.E. Coeff. S.E. Working Conditions Leadership -0.040* (0.005) -0.056* (0.008) -0.039* (0.010) Facilities 0.003 (0.004) 0.008 (0.007) -0.004 (0.006) Empowerment -0.001 (0.004) 0.006 (0.007) -0.014# (0.008) Professional development 0.000 (0.004) -0.006 (0.007) 0.010 (0.007) Time factor -0.007 (0.004) -0.019* (0.006) n/a n/a Evaluation n/a n/a n/a n/a 0.000 (0.007) Time - planning 0.007 (0.018) 0.040 (0.041) 0.005 (0.052) Time - outside workday 0.082* (0.031) -0.046 (0.052) -0.094 (0.062) School Characteristics Fraction of Students Black 0.051* (0.020) 0.041 (0.036) 0.124* (0.044) Hispanic 0.015 (0.061) 0.083 (0.121) 0.116 (0.154) “Other” 0.011 (0.045) -0.066 (0.066) 0.013 (0.046) Free/reduced lunch 0.016 (0.027) 0.053 (0.052) -0.092 (0.082) Limited English proficient -0.077 (0.086) -0.035 (0.231) 0.070 (0.296) Non-college parent 0.013 (0.023) 0.014 (0.042) 0.015 (0.073) Fraction of Teachers with: Master's degree or Higher -0.034 (0.029) -0.047 (0.061) -0.003 (0.068) 0-3 years experience 0.082# (0.044) -0.012 (0.084) 0.027 (0.085) 4-10 years experience (base) - - - - - - >10 years experience -0.033 (0.035) -0.010 (0.066) -0.032 (0.077) Average Teacher Test Score -0.014 (0.012) -0.029# (0.017) 0.006 (0.010) Age of school (base is new school) Average aged school 0.004 (0.006) -0.011 (0.010) 0.015 (0.011) Old school 0.001 (0.007) -0.021# (0.012) -0.001 (0.013) School membership (log ) -0.008 (0.007) -0.026* (0.012) -0.031* (0.010) New administrator 2005 0.002 (0.007) -0.007 (0.010) 0.036* (0.013) New administrator 2006 0.013* (0.006) -0.005 (0.010) 0.012 (0.009) Did not meet AYP 2005 0.000 (0.005) 0.006 (0.009) -0.009 (0.009) Did not meet expected growth 2005 0.011# (0.006) 0.012 (0.010) -0.015 (0.015) Teacher Salary (log) 0.217 (0.145) 0.318 (0.237) 0.295 (0.263) Unemployment rate 0.000 (0.003) 0.003 (0.004) 0.005 (0.006) District membership (log) -0.003 (0.005) 0.010 (0.008) 0.005 (0.008) Respondent Characteristics Black teacher -0.015# (0.009) -0.059* (0.012) -0.031* (0.013) Hispanic teacher -0.019 (0.019) -0.052# (0.029) -0.070* (0.024)
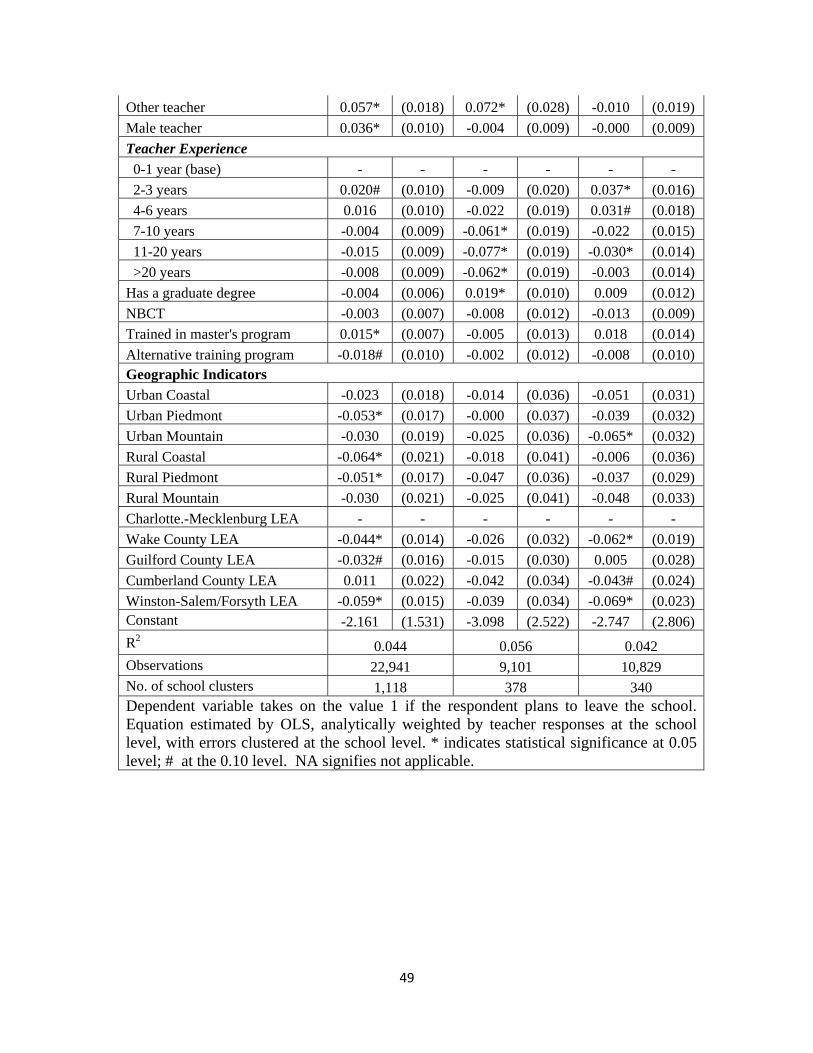
49
Other teacher 0.057* (0.018) 0.072* (0.028) -0.010 (0.019) Male teacher 0.036* (0.010) -0.004 (0.009) -0.000 (0.009) Teacher Experience 0-1 year (base) - - - - - - 2-3 years 0.020# (0.010) -0.009 (0.020) 0.037* (0.016) 4-6 years 0.016 (0.010) -0.022 (0.019) 0.031# (0.018) 7-10 years -0.004 (0.009) -0.061* (0.019) -0.022 (0.015) 11-20 years -0.015 (0.009) -0.077* (0.019) -0.030* (0.014) >20 years -0.008 (0.009) -0.062* (0.019) -0.003 (0.014) Has a graduate degree -0.004 (0.006) 0.019* (0.010) 0.009 (0.012) NBCT -0.003 (0.007) -0.008 (0.012) -0.013 (0.009) Trained in master's program 0.015* (0.007) -0.005 (0.013) 0.018 (0.014) Alternative training program -0.018# (0.010) -0.002 (0.012) -0.008 (0.010) Geographic Indicators Urban Coastal -0.023 (0.018) -0.014 (0.036) -0.051 (0.031) Urban Piedmont -0.053* (0.017) -0.000 (0.037) -0.039 (0.032) Urban Mountain -0.030 (0.019) -0.025 (0.036) -0.065* (0.032) Rural Coastal -0.064* (0.021) -0.018 (0.041) -0.006 (0.036) Rural Piedmont -0.051* (0.017) -0.047 (0.036) -0.037 (0.029) Rural Mountain -0.030 (0.021) -0.025 (0.041) -0.048 (0.033) Charlotte.-Mecklenburg LEA - - - - - - Wake County LEA -0.044* (0.014) -0.026 (0.032) -0.062* (0.019) Guilford County LEA -0.032# (0.016) -0.015 (0.030) 0.005 (0.028) Cumberland County LEA 0.011 (0.022) -0.042 (0.034) -0.043# (0.024) Winston-Salem/Forsyth LEA -0.059* (0.015) -0.039 (0.034) -0.069* (0.023) Constant -2.161 (1.531) -3.098 (2.522) -2.747 (2.806) R2 0.044 0.056 0.042 Observations 22,941 9,101 10,829 No. of school clusters 1,118 378 340 Dependent variable takes on the value 1 if the respondent plans to leave the school. Equation estimated by OLS, analytically weighted by teacher responses at the school level, with errors clustered at the school level. * indicates statistical significance at 0.05 level; # at the 0.10 level. NA signifies not applicable.
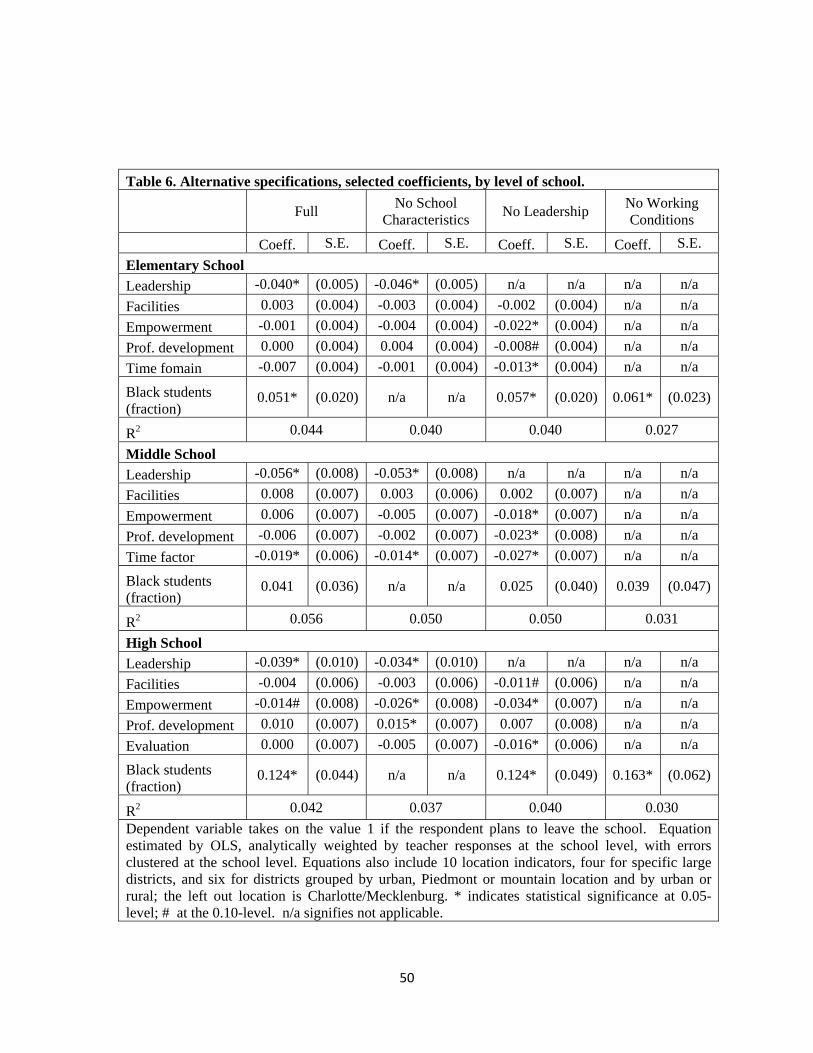
50
Table 6. Alternative specifications, selected coefficients, by level of school.
Full No School
Characteristics No Leadership No Working Conditions
Coeff. S.E. Coeff. S.E. Coeff. S.E. Coeff. S.E. Elementary School Leadership -0.040* (0.005) -0.046* (0.005) n/a n/a n/a n/a Facilities 0.003 (0.004) -0.003 (0.004) -0.002 (0.004) n/a n/a Empowerment -0.001 (0.004) -0.004 (0.004) -0.022* (0.004) n/a n/a Prof. development 0.000 (0.004) 0.004 (0.004) -0.008# (0.004) n/a n/a Time fomain -0.007 (0.004) -0.001 (0.004) -0.013* (0.004) n/a n/a Black students (fraction)
0.051* (0.020) n/a n/a 0.057* (0.020) 0.061* (0.023)
R2 0.044 0.040 0.040 0.027 Middle School Leadership -0.056* (0.008) -0.053* (0.008) n/a n/a n/a n/a Facilities 0.008 (0.007) 0.003 (0.006) 0.002 (0.007) n/a n/a Empowerment 0.006 (0.007) -0.005 (0.007) -0.018* (0.007) n/a n/a Prof. development -0.006 (0.007) -0.002 (0.007) -0.023* (0.008) n/a n/a Time factor -0.019* (0.006) -0.014* (0.007) -0.027* (0.007) n/a n/a Black students (fraction)
0.041 (0.036) n/a n/a 0.025 (0.040) 0.039 (0.047)
R2 0.056 0.050 0.050 0.031 High School Leadership -0.039* (0.010) -0.034* (0.010) n/a n/a n/a n/a Facilities -0.004 (0.006) -0.003 (0.006) -0.011# (0.006) n/a n/a Empowerment -0.014# (0.008) -0.026* (0.008) -0.034* (0.007) n/a n/a Prof. development 0.010 (0.007) 0.015* (0.007) 0.007 (0.008) n/a n/a Evaluation 0.000 (0.007) -0.005 (0.007) -0.016* (0.006) n/a n/a Black students (fraction)
0.124* (0.044) n/a n/a 0.124* (0.049) 0.163* (0.062)
R2 0.042 0.037 0.040 0.030 Dependent variable takes on the value 1 if the respondent plans to leave the school. Equation estimated by OLS, analytically weighted by teacher responses at the school level, with errors clustered at the school level. Equations also include 10 location indicators, four for specific large districts, and six for districts grouped by urban, Piedmont or mountain location and by urban or rural; the left out location is Charlotte/Mecklenburg. * indicates statistical significance at 0.05-level; # at the 0.10-level. n/a signifies not applicable.
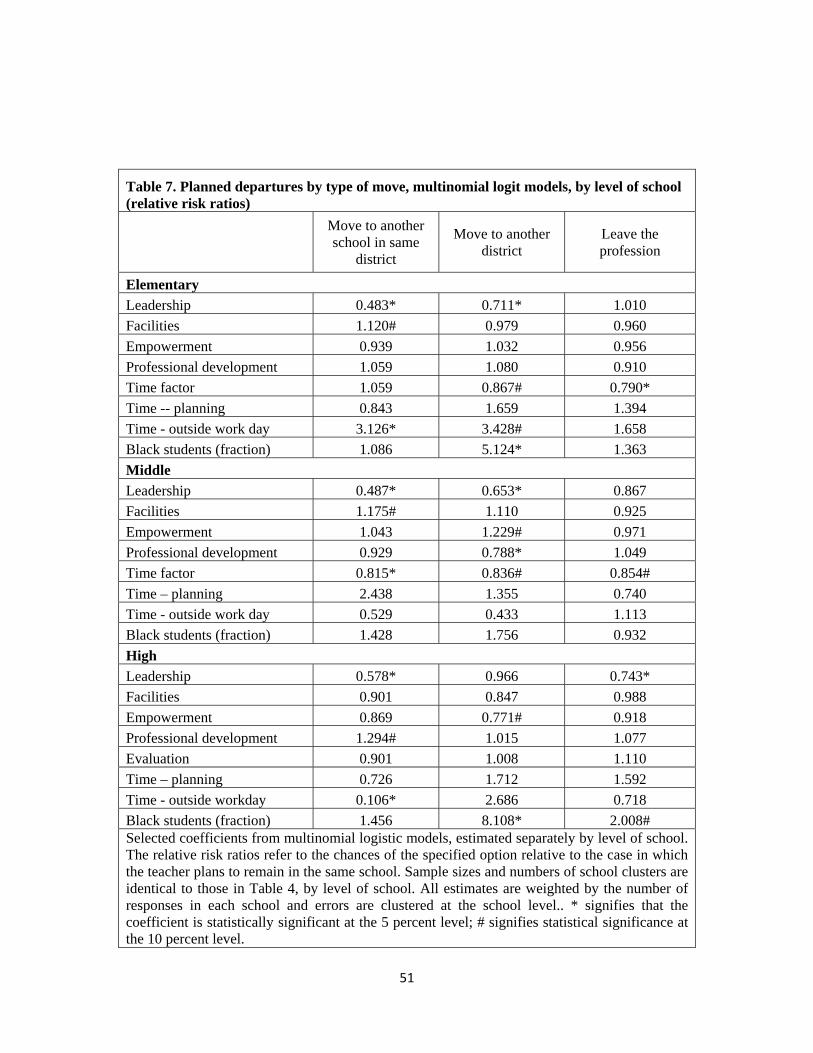
51
Table 7. Planned departures by type of move, multinomial logit models, by level of school (relative risk ratios)
Move to another school in same
district Move to another
district Leave the profession
Elementary Leadership 0.483* 0.711* 1.010 Facilities 1.120# 0.979 0.960 Empowerment 0.939 1.032 0.956 Professional development 1.059 1.080 0.910 Time factor 1.059 0.867# 0.790* Time -- planning 0.843 1.659 1.394 Time - outside work day 3.126* 3.428# 1.658 Black students (fraction) 1.086 5.124* 1.363 Middle Leadership 0.487* 0.653* 0.867 Facilities 1.175# 1.110 0.925 Empowerment 1.043 1.229# 0.971 Professional development 0.929 0.788* 1.049 Time factor 0.815* 0.836# 0.854# Time – planning 2.438 1.355 0.740 Time - outside work day 0.529 0.433 1.113 Black students (fraction) 1.428 1.756 0.932 High Leadership 0.578* 0.966 0.743* Facilities 0.901 0.847 0.988 Empowerment 0.869 0.771# 0.918 Professional development 1.294# 1.015 1.077 Evaluation 0.901 1.008 1.110 Time – planning 0.726 1.712 1.592 Time - outside workday 0.106* 2.686 0.718 Black students (fraction) 1.456 8.108* 2.008# Selected coefficients from multinomial logistic models, estimated separately by level of school. The relative risk ratios refer to the chances of the specified option relative to the case in which the teacher plans to remain in the same school. Sample sizes and numbers of school clusters are identical to those in Table 4, by level of school. All estimates are weighted by the number of responses in each school and errors are clustered at the school level.. * signifies that the coefficient is statistically significant at the 5 percent level; # signifies statistical significance at the 10 percent level.
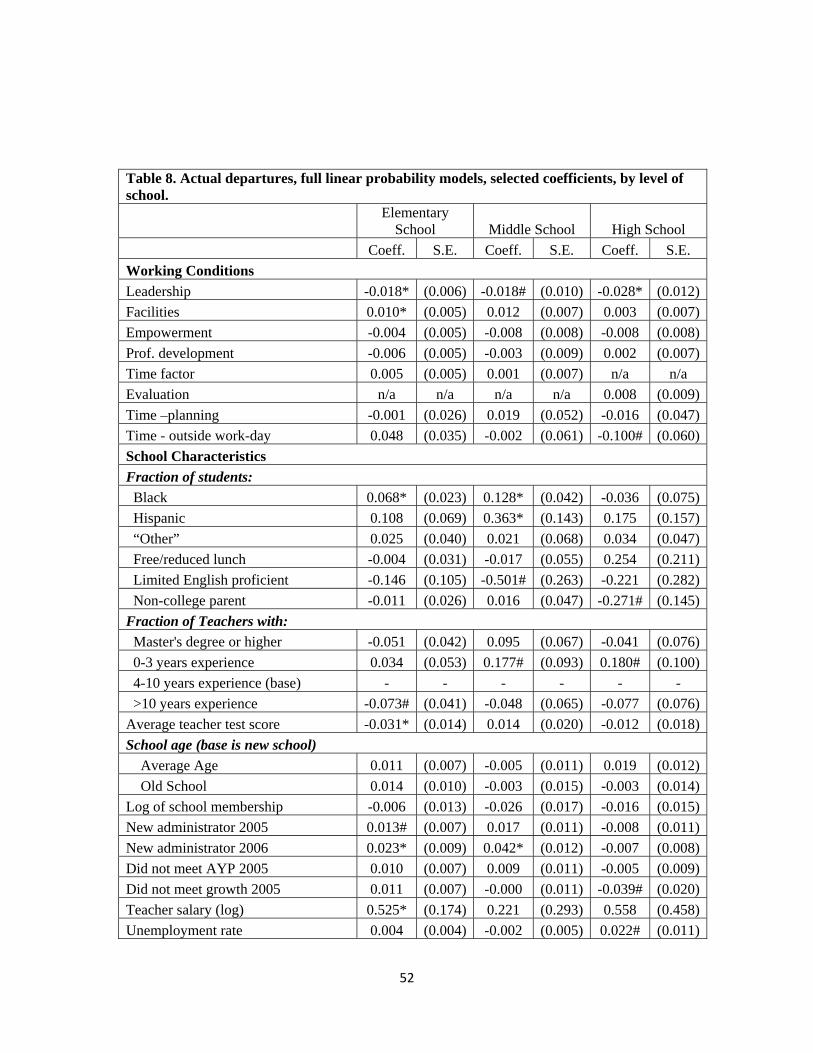
52
Table 8. Actual departures, full linear probability models, selected coefficients, by level of school.
Elementary
School Middle School High School Coeff. S.E. Coeff. S.E. Coeff. S.E. Working Conditions Leadership -0.018* (0.006) -0.018# (0.010) -0.028* (0.012)Facilities 0.010* (0.005) 0.012 (0.007) 0.003 (0.007)Empowerment -0.004 (0.005) -0.008 (0.008) -0.008 (0.008)Prof. development -0.006 (0.005) -0.003 (0.009) 0.002 (0.007)Time factor 0.005 (0.005) 0.001 (0.007) n/a n/a Evaluation n/a n/a n/a n/a 0.008 (0.009)Time –planning -0.001 (0.026) 0.019 (0.052) -0.016 (0.047)Time - outside work-day 0.048 (0.035) -0.002 (0.061) -0.100# (0.060)School Characteristics Fraction of students: Black 0.068* (0.023) 0.128* (0.042) -0.036 (0.075) Hispanic 0.108 (0.069) 0.363* (0.143) 0.175 (0.157) “Other” 0.025 (0.040) 0.021 (0.068) 0.034 (0.047) Free/reduced lunch -0.004 (0.031) -0.017 (0.055) 0.254 (0.211) Limited English proficient -0.146 (0.105) -0.501# (0.263) -0.221 (0.282) Non-college parent -0.011 (0.026) 0.016 (0.047) -0.271# (0.145)Fraction of Teachers with: Master's degree or higher -0.051 (0.042) 0.095 (0.067) -0.041 (0.076) 0-3 years experience 0.034 (0.053) 0.177# (0.093) 0.180# (0.100) 4-10 years experience (base) - - - - - - >10 years experience -0.073# (0.041) -0.048 (0.065) -0.077 (0.076)Average teacher test score -0.031* (0.014) 0.014 (0.020) -0.012 (0.018)School age (base is new school) Average Age 0.011 (0.007) -0.005 (0.011) 0.019 (0.012) Old School 0.014 (0.010) -0.003 (0.015) -0.003 (0.014)Log of school membership -0.006 (0.013) -0.026 (0.017) -0.016 (0.015)New administrator 2005 0.013# (0.007) 0.017 (0.011) -0.008 (0.011)New administrator 2006 0.023* (0.009) 0.042* (0.012) -0.007 (0.008)Did not meet AYP 2005 0.010 (0.007) 0.009 (0.011) -0.005 (0.009)Did not meet growth 2005 0.011 (0.007) -0.000 (0.011) -0.039# (0.020)Teacher salary (log) 0.525* (0.174) 0.221 (0.293) 0.558 (0.458)Unemployment rate 0.004 (0.004) -0.002 (0.005) 0.022# (0.011)
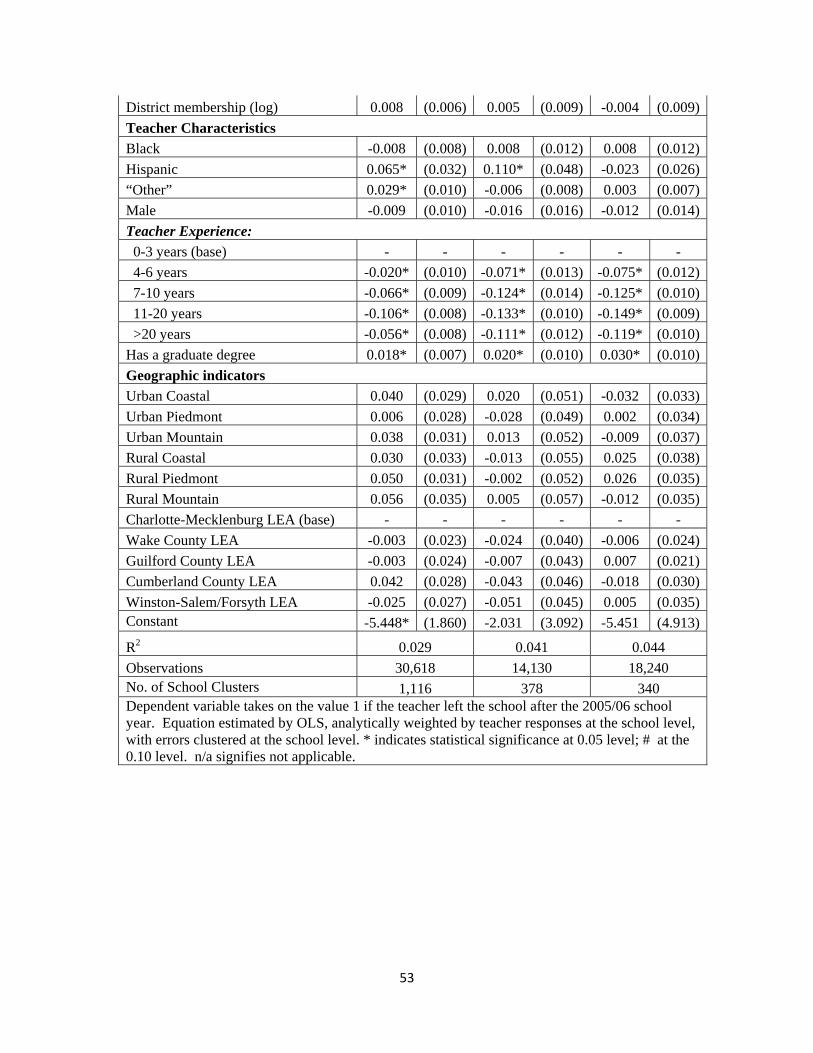
53
District membership (log) 0.008 (0.006) 0.005 (0.009) -0.004 (0.009)Teacher Characteristics Black -0.008 (0.008) 0.008 (0.012) 0.008 (0.012)Hispanic 0.065* (0.032) 0.110* (0.048) -0.023 (0.026)“Other” 0.029* (0.010) -0.006 (0.008) 0.003 (0.007)Male -0.009 (0.010) -0.016 (0.016) -0.012 (0.014)Teacher Experience: 0-3 years (base) - - - - - - 4-6 years -0.020* (0.010) -0.071* (0.013) -0.075* (0.012) 7-10 years -0.066* (0.009) -0.124* (0.014) -0.125* (0.010) 11-20 years -0.106* (0.008) -0.133* (0.010) -0.149* (0.009) >20 years -0.056* (0.008) -0.111* (0.012) -0.119* (0.010)Has a graduate degree 0.018* (0.007) 0.020* (0.010) 0.030* (0.010)Geographic indicators Urban Coastal 0.040 (0.029) 0.020 (0.051) -0.032 (0.033)Urban Piedmont 0.006 (0.028) -0.028 (0.049) 0.002 (0.034)Urban Mountain 0.038 (0.031) 0.013 (0.052) -0.009 (0.037)Rural Coastal 0.030 (0.033) -0.013 (0.055) 0.025 (0.038)Rural Piedmont 0.050 (0.031) -0.002 (0.052) 0.026 (0.035)Rural Mountain 0.056 (0.035) 0.005 (0.057) -0.012 (0.035)Charlotte-Mecklenburg LEA (base) - - - - - - Wake County LEA -0.003 (0.023) -0.024 (0.040) -0.006 (0.024)Guilford County LEA -0.003 (0.024) -0.007 (0.043) 0.007 (0.021)Cumberland County LEA 0.042 (0.028) -0.043 (0.046) -0.018 (0.030)Winston-Salem/Forsyth LEA -0.025 (0.027) -0.051 (0.045) 0.005 (0.035)Constant -5.448* (1.860) -2.031 (3.092) -5.451 (4.913)
R2 0.029 0.041 0.044 Observations 30,618 14,130 18,240 No. of School Clusters 1,116 378 340 Dependent variable takes on the value 1 if the teacher left the school after the 2005/06 school year. Equation estimated by OLS, analytically weighted by teacher responses at the school level, with errors clustered at the school level. * indicates statistical significance at 0.05 level; # at the 0.10 level. n/a signifies not applicable.
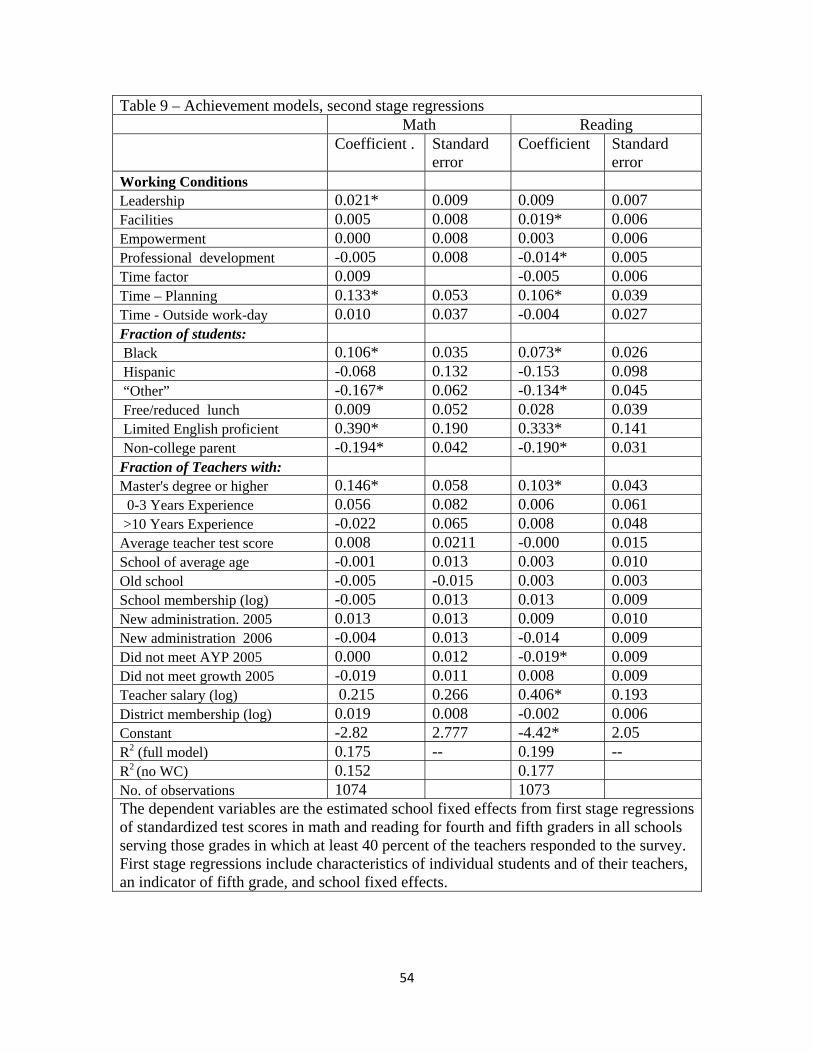
54
Table 9 – Achievement models, second stage regressions Math Reading
Coefficient . Standard
error Coefficient Standard
error Working Conditions Leadership 0.021* 0.009 0.009 0.007 Facilities 0.005 0.008 0.019* 0.006 Empowerment 0.000 0.008 0.003 0.006 Professional development -0.005 0.008 -0.014* 0.005 Time factor 0.009 -0.005 0.006 Time – Planning 0.133* 0.053 0.106* 0.039 Time - Outside work-day 0.010 0.037 -0.004 0.027 Fraction of students: Black 0.106* 0.035 0.073* 0.026 Hispanic -0.068 0.132 -0.153 0.098 “Other” -0.167* 0.062 -0.134* 0.045 Free/reduced lunch 0.009 0.052 0.028 0.039 Limited English proficient 0.390* 0.190 0.333* 0.141 Non-college parent -0.194* 0.042 -0.190* 0.031 Fraction of Teachers with: Master's degree or higher 0.146* 0.058 0.103* 0.043 0-3 Years Experience 0.056 0.082 0.006 0.061 >10 Years Experience -0.022 0.065 0.008 0.048 Average teacher test score 0.008 0.0211 -0.000 0.015 School of average age -0.001 0.013 0.003 0.010 Old school -0.005 -0.015 0.003 0.003 School membership (log) -0.005 0.013 0.013 0.009 New administration. 2005 0.013 0.013 0.009 0.010 New administration 2006 -0.004 0.013 -0.014 0.009 Did not meet AYP 2005 0.000 0.012 -0.019* 0.009 Did not meet growth 2005 -0.019 0.011 0.008 0.009 Teacher salary (log) 0.215 0.266 0.406* 0.193 District membership (log) 0.019 0.008 -0.002 0.006 Constant -2.82 2.777 -4.42* 2.05 R2 (full model) 0.175 -- 0.199 -- R2 (no WC) 0.152 0.177 No. of observations 1074 1073 The dependent variables are the estimated school fixed effects from first stage regressions of standardized test scores in math and reading for fourth and fifth graders in all schools serving those grades in which at least 40 percent of the teachers responded to the survey. First stage regressions include characteristics of individual students and of their teachers, an indicator of fifth grade, and school fixed effects.
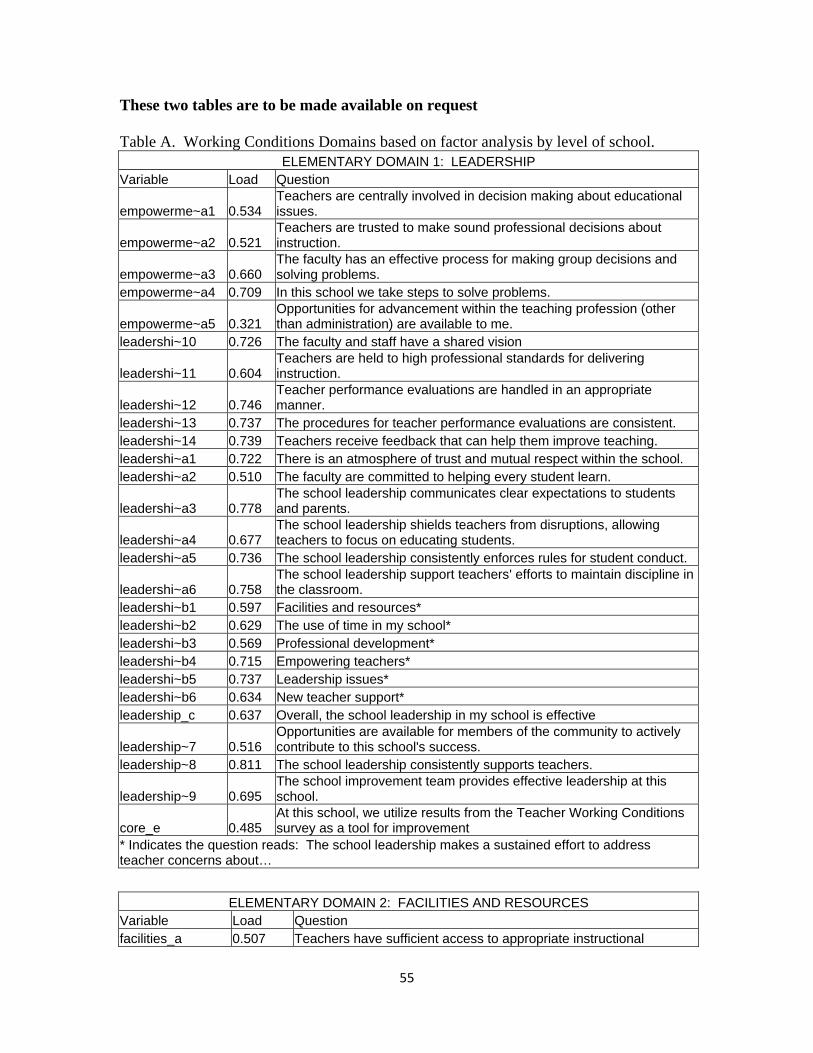
55
These two tables are to be made available on request Table A. Working Conditions Domains based on factor analysis by level of school.
ELEMENTARY DOMAIN 1: LEADERSHIP Variable Load Question
empowerme~a1 0.534 Teachers are centrally involved in decision making about educational issues.
empowerme~a2 0.521 Teachers are trusted to make sound professional decisions about instruction.
empowerme~a3 0.660 The faculty has an effective process for making group decisions and solving problems.
empowerme~a4 0.709 In this school we take steps to solve problems.
empowerme~a5 0.321 Opportunities for advancement within the teaching profession (other than administration) are available to me.
leadershi~10 0.726 The faculty and staff have a shared vision
leadershi~11 0.604 Teachers are held to high professional standards for delivering instruction.
leadershi~12 0.746 Teacher performance evaluations are handled in an appropriate manner.
leadershi~13 0.737 The procedures for teacher performance evaluations are consistent. leadershi~14 0.739 Teachers receive feedback that can help them improve teaching. leadershi~a1 0.722 There is an atmosphere of trust and mutual respect within the school. leadershi~a2 0.510 The faculty are committed to helping every student learn.
leadershi~a3 0.778 The school leadership communicates clear expectations to students and parents.
leadershi~a4 0.677 The school leadership shields teachers from disruptions, allowing teachers to focus on educating students.
leadershi~a5 0.736 The school leadership consistently enforces rules for student conduct.
leadershi~a6 0.758 The school leadership support teachers' efforts to maintain discipline in the classroom.
leadershi~b1 0.597 Facilities and resources* leadershi~b2 0.629 The use of time in my school* leadershi~b3 0.569 Professional development* leadershi~b4 0.715 Empowering teachers* leadershi~b5 0.737 Leadership issues* leadershi~b6 0.634 New teacher support* leadership_c 0.637 Overall, the school leadership in my school is effective
leadership~7 0.516 Opportunities are available for members of the community to actively contribute to this school's success.
leadership~8 0.811 The school leadership consistently supports teachers.
leadership~9 0.695 The school improvement team provides effective leadership at this school.
core_e 0.485 At this school, we utilize results from the Teacher Working Conditions survey as a tool for improvement
* Indicates the question reads: The school leadership makes a sustained effort to address teacher concerns about…
ELEMENTARY DOMAIN 2: FACILITIES AND RESOURCES Variable Load Question facilities_a 0.507 Teachers have sufficient access to appropriate instructional
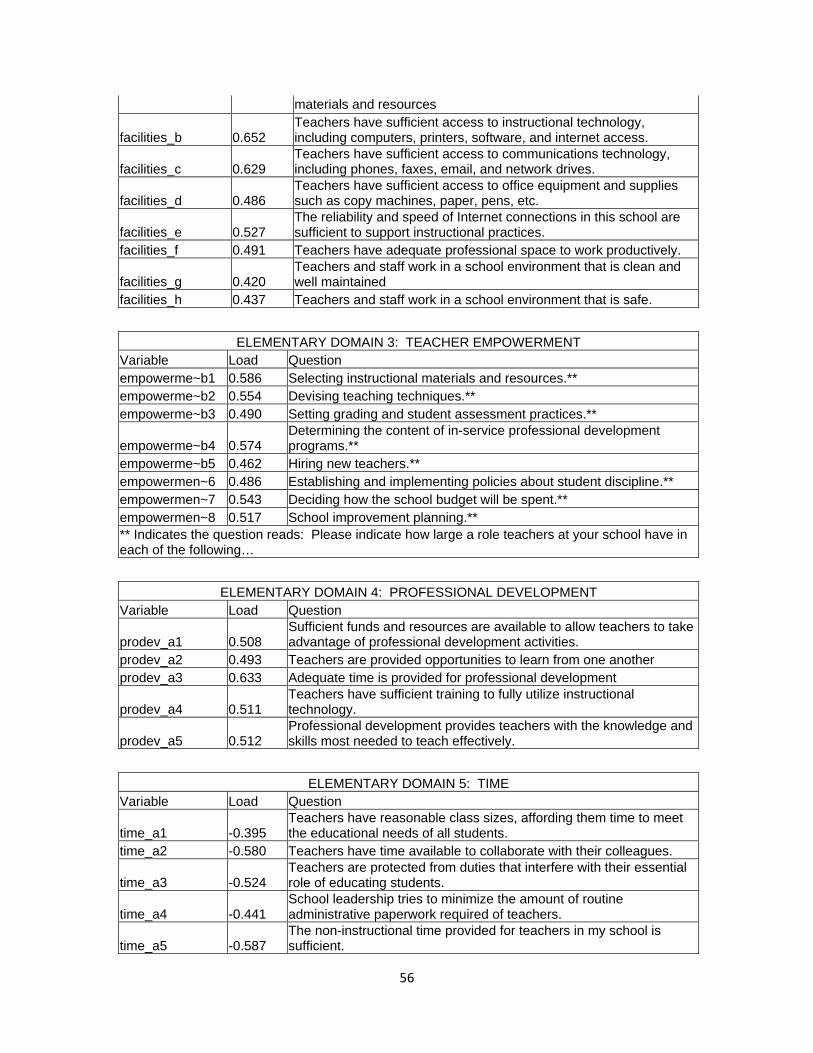
56
materials and resources
facilities_b 0.652 Teachers have sufficient access to instructional technology, including computers, printers, software, and internet access.
facilities_c 0.629 Teachers have sufficient access to communications technology, including phones, faxes, email, and network drives.
facilities_d 0.486 Teachers have sufficient access to office equipment and supplies such as copy machines, paper, pens, etc.
facilities_e 0.527 The reliability and speed of Internet connections in this school are sufficient to support instructional practices.
facilities_f 0.491 Teachers have adequate professional space to work productively.
facilities_g 0.420 Teachers and staff work in a school environment that is clean and well maintained
facilities_h 0.437 Teachers and staff work in a school environment that is safe.
ELEMENTARY DOMAIN 3: TEACHER EMPOWERMENT Variable Load Question empowerme~b1 0.586 Selecting instructional materials and resources.** empowerme~b2 0.554 Devising teaching techniques.** empowerme~b3 0.490 Setting grading and student assessment practices.**
empowerme~b4 0.574 Determining the content of in-service professional development programs.**
empowerme~b5 0.462 Hiring new teachers.** empowermen~6 0.486 Establishing and implementing policies about student discipline.** empowermen~7 0.543 Deciding how the school budget will be spent.** empowermen~8 0.517 School improvement planning.** ** Indicates the question reads: Please indicate how large a role teachers at your school have in each of the following…
ELEMENTARY DOMAIN 4: PROFESSIONAL DEVELOPMENT Variable Load Question
prodev_a1 0.508 Sufficient funds and resources are available to allow teachers to take advantage of professional development activities.
prodev_a2 0.493 Teachers are provided opportunities to learn from one another prodev_a3 0.633 Adequate time is provided for professional development
prodev_a4 0.511 Teachers have sufficient training to fully utilize instructional technology.
prodev_a5 0.512 Professional development provides teachers with the knowledge and skills most needed to teach effectively.
ELEMENTARY DOMAIN 5: TIME Variable Load Question
time_a1 -0.395 Teachers have reasonable class sizes, affording them time to meet the educational needs of all students.
time_a2 -0.580 Teachers have time available to collaborate with their colleagues.
time_a3 -0.524 Teachers are protected from duties that interfere with their essential role of educating students.
time_a4 -0.441 School leadership tries to minimize the amount of routine administrative paperwork required of teachers.
time_a5 -0.587 The non-instructional time provided for teachers in my school is sufficient.
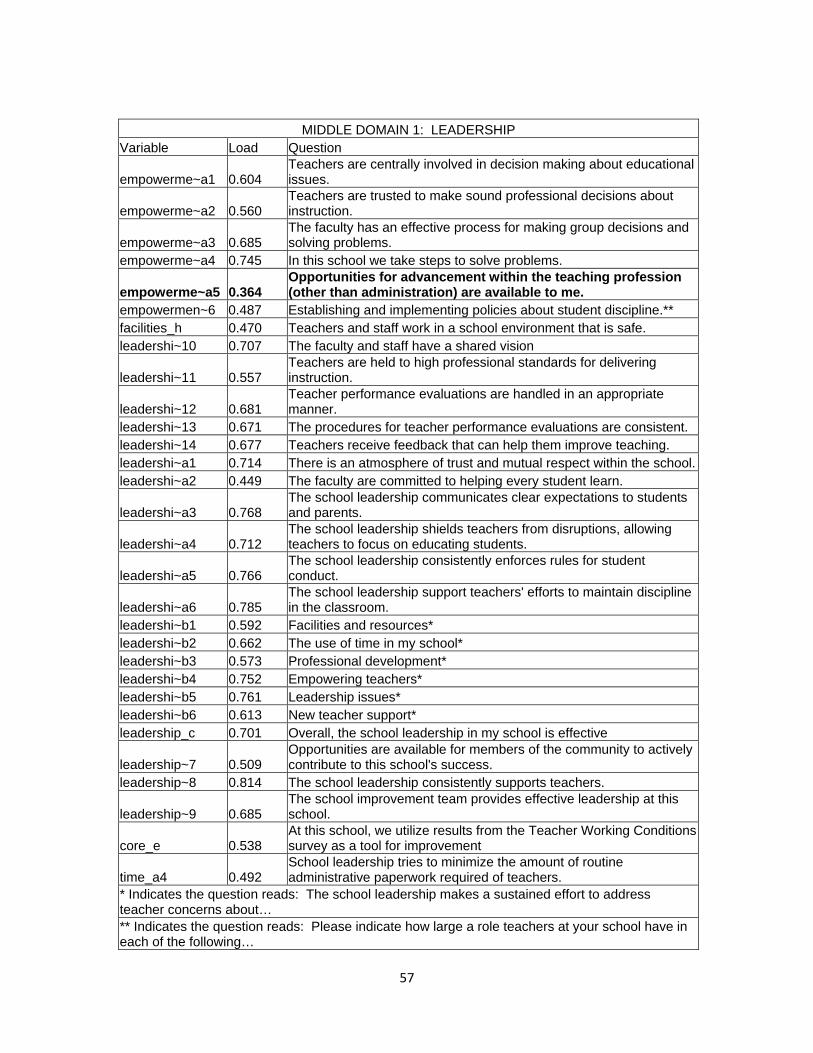
57
MIDDLE DOMAIN 1: LEADERSHIP Variable Load Question
empowerme~a1 0.604 Teachers are centrally involved in decision making about educational issues.
empowerme~a2 0.560 Teachers are trusted to make sound professional decisions about instruction.
empowerme~a3 0.685 The faculty has an effective process for making group decisions and solving problems.
empowerme~a4 0.745 In this school we take steps to solve problems.
empowerme~a5 0.364 Opportunities for advancement within the teaching profession (other than administration) are available to me.
empowermen~6 0.487 Establishing and implementing policies about student discipline.** facilities_h 0.470 Teachers and staff work in a school environment that is safe. leadershi~10 0.707 The faculty and staff have a shared vision
leadershi~11 0.557 Teachers are held to high professional standards for delivering instruction.
leadershi~12 0.681 Teacher performance evaluations are handled in an appropriate manner.
leadershi~13 0.671 The procedures for teacher performance evaluations are consistent. leadershi~14 0.677 Teachers receive feedback that can help them improve teaching. leadershi~a1 0.714 There is an atmosphere of trust and mutual respect within the school.leadershi~a2 0.449 The faculty are committed to helping every student learn.
leadershi~a3 0.768 The school leadership communicates clear expectations to students and parents.
leadershi~a4 0.712 The school leadership shields teachers from disruptions, allowing teachers to focus on educating students.
leadershi~a5 0.766 The school leadership consistently enforces rules for student conduct.
leadershi~a6 0.785 The school leadership support teachers' efforts to maintain discipline in the classroom.
leadershi~b1 0.592 Facilities and resources* leadershi~b2 0.662 The use of time in my school* leadershi~b3 0.573 Professional development* leadershi~b4 0.752 Empowering teachers* leadershi~b5 0.761 Leadership issues* leadershi~b6 0.613 New teacher support* leadership_c 0.701 Overall, the school leadership in my school is effective
leadership~7 0.509 Opportunities are available for members of the community to actively contribute to this school's success.
leadership~8 0.814 The school leadership consistently supports teachers.
leadership~9 0.685 The school improvement team provides effective leadership at this school.
core_e 0.538 At this school, we utilize results from the Teacher Working Conditions survey as a tool for improvement
time_a4 0.492 School leadership tries to minimize the amount of routine administrative paperwork required of teachers.
* Indicates the question reads: The school leadership makes a sustained effort to address teacher concerns about… ** Indicates the question reads: Please indicate how large a role teachers at your school have in each of the following…
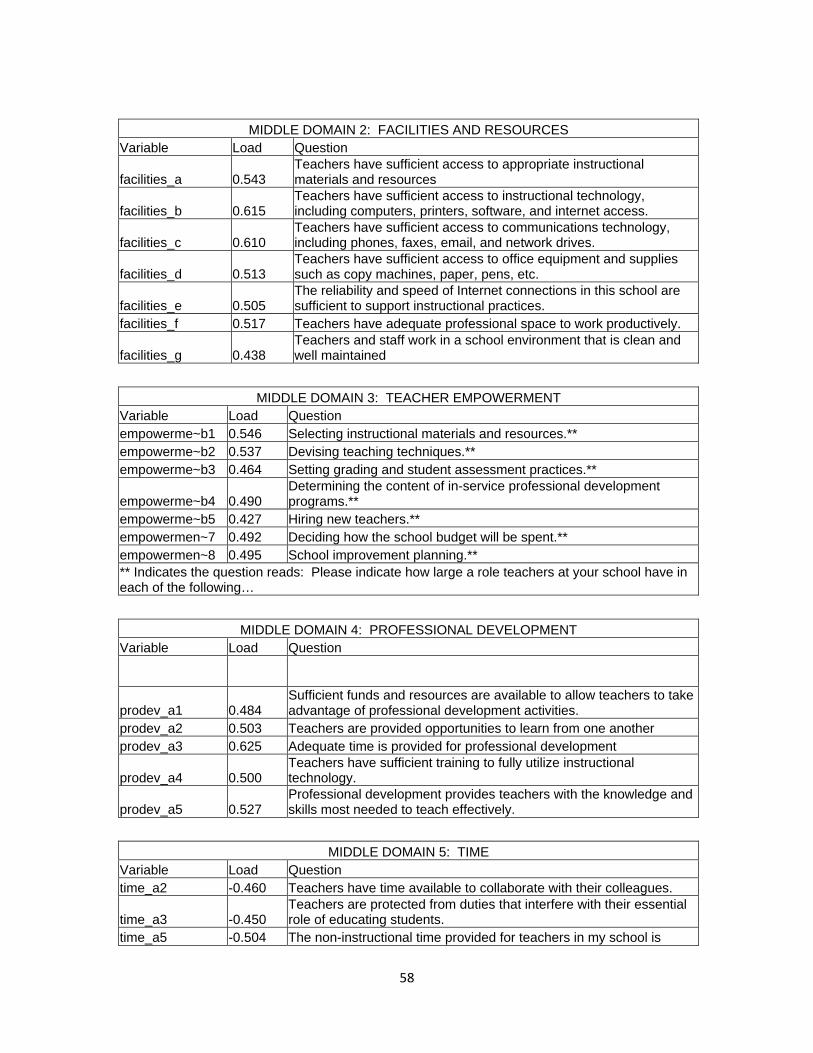
58
MIDDLE DOMAIN 2: FACILITIES AND RESOURCES Variable Load Question
facilities_a 0.543 Teachers have sufficient access to appropriate instructional materials and resources
facilities_b 0.615 Teachers have sufficient access to instructional technology, including computers, printers, software, and internet access.
facilities_c 0.610 Teachers have sufficient access to communications technology, including phones, faxes, email, and network drives.
facilities_d 0.513 Teachers have sufficient access to office equipment and supplies such as copy machines, paper, pens, etc.
facilities_e 0.505 The reliability and speed of Internet connections in this school are sufficient to support instructional practices.
facilities_f 0.517 Teachers have adequate professional space to work productively.
facilities_g 0.438 Teachers and staff work in a school environment that is clean and well maintained
MIDDLE DOMAIN 3: TEACHER EMPOWERMENT Variable Load Question empowerme~b1 0.546 Selecting instructional materials and resources.** empowerme~b2 0.537 Devising teaching techniques.** empowerme~b3 0.464 Setting grading and student assessment practices.**
empowerme~b4 0.490 Determining the content of in-service professional development programs.**
empowerme~b5 0.427 Hiring new teachers.** empowermen~7 0.492 Deciding how the school budget will be spent.** empowermen~8 0.495 School improvement planning.** ** Indicates the question reads: Please indicate how large a role teachers at your school have in each of the following…
MIDDLE DOMAIN 4: PROFESSIONAL DEVELOPMENT Variable Load Question
prodev_a1 0.484 Sufficient funds and resources are available to allow teachers to take advantage of professional development activities.
prodev_a2 0.503 Teachers are provided opportunities to learn from one another prodev_a3 0.625 Adequate time is provided for professional development
prodev_a4 0.500 Teachers have sufficient training to fully utilize instructional technology.
prodev_a5 0.527 Professional development provides teachers with the knowledge and skills most needed to teach effectively.
MIDDLE DOMAIN 5: TIME Variable Load Question time_a2 -0.460 Teachers have time available to collaborate with their colleagues.
time_a3 -0.450 Teachers are protected from duties that interfere with their essential role of educating students.
time_a5 -0.504 The non-instructional time provided for teachers in my school is
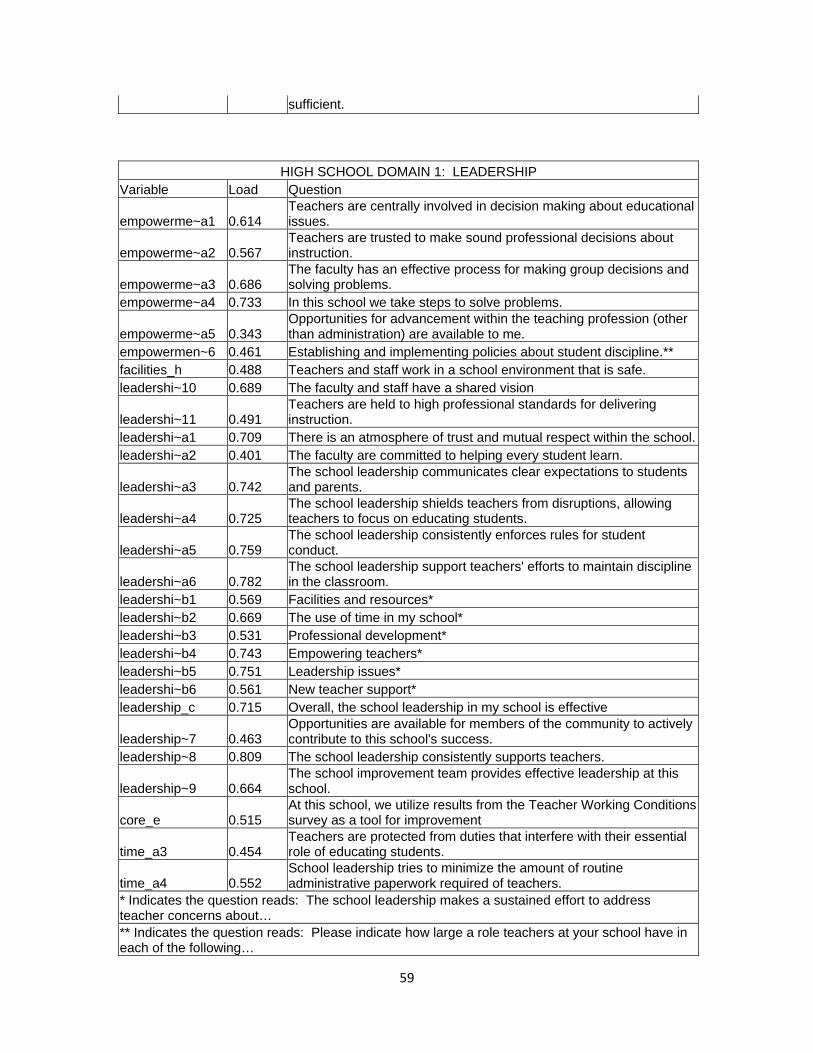
59
sufficient.
HIGH SCHOOL DOMAIN 1: LEADERSHIP Variable Load Question
empowerme~a1 0.614 Teachers are centrally involved in decision making about educational issues.
empowerme~a2 0.567 Teachers are trusted to make sound professional decisions about instruction.
empowerme~a3 0.686 The faculty has an effective process for making group decisions and solving problems.
empowerme~a4 0.733 In this school we take steps to solve problems.
empowerme~a5 0.343 Opportunities for advancement within the teaching profession (other than administration) are available to me.
empowermen~6 0.461 Establishing and implementing policies about student discipline.** facilities_h 0.488 Teachers and staff work in a school environment that is safe. leadershi~10 0.689 The faculty and staff have a shared vision
leadershi~11 0.491 Teachers are held to high professional standards for delivering instruction.
leadershi~a1 0.709 There is an atmosphere of trust and mutual respect within the school.leadershi~a2 0.401 The faculty are committed to helping every student learn.
leadershi~a3 0.742 The school leadership communicates clear expectations to students and parents.
leadershi~a4 0.725 The school leadership shields teachers from disruptions, allowing teachers to focus on educating students.
leadershi~a5 0.759 The school leadership consistently enforces rules for student conduct.
leadershi~a6 0.782 The school leadership support teachers' efforts to maintain discipline in the classroom.
leadershi~b1 0.569 Facilities and resources* leadershi~b2 0.669 The use of time in my school* leadershi~b3 0.531 Professional development* leadershi~b4 0.743 Empowering teachers* leadershi~b5 0.751 Leadership issues* leadershi~b6 0.561 New teacher support* leadership_c 0.715 Overall, the school leadership in my school is effective
leadership~7 0.463 Opportunities are available for members of the community to actively contribute to this school's success.
leadership~8 0.809 The school leadership consistently supports teachers.
leadership~9 0.664 The school improvement team provides effective leadership at this school.
core_e 0.515 At this school, we utilize results from the Teacher Working Conditions survey as a tool for improvement
time_a3 0.454 Teachers are protected from duties that interfere with their essential role of educating students.
time_a4 0.552 School leadership tries to minimize the amount of routine administrative paperwork required of teachers.
* Indicates the question reads: The school leadership makes a sustained effort to address teacher concerns about… ** Indicates the question reads: Please indicate how large a role teachers at your school have in each of the following…
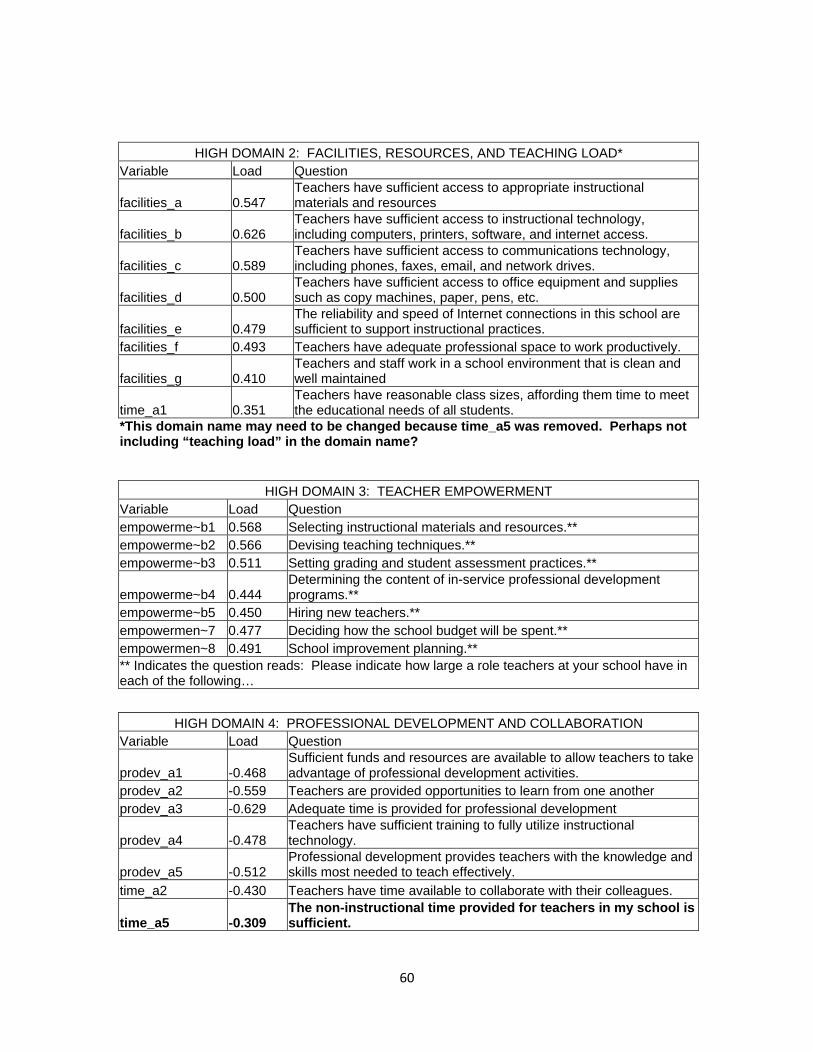
60
HIGH DOMAIN 2: FACILITIES, RESOURCES, AND TEACHING LOAD* Variable Load Question
facilities_a 0.547 Teachers have sufficient access to appropriate instructional materials and resources
facilities_b 0.626 Teachers have sufficient access to instructional technology, including computers, printers, software, and internet access.
facilities_c 0.589 Teachers have sufficient access to communications technology, including phones, faxes, email, and network drives.
facilities_d 0.500 Teachers have sufficient access to office equipment and supplies such as copy machines, paper, pens, etc.
facilities_e 0.479 The reliability and speed of Internet connections in this school are sufficient to support instructional practices.
facilities_f 0.493 Teachers have adequate professional space to work productively.
facilities_g 0.410 Teachers and staff work in a school environment that is clean and well maintained
time_a1 0.351 Teachers have reasonable class sizes, affording them time to meet the educational needs of all students.
*This domain name may need to be changed because time_a5 was removed. Perhaps not including “teaching load” in the domain name?
HIGH DOMAIN 3: TEACHER EMPOWERMENT Variable Load Question empowerme~b1 0.568 Selecting instructional materials and resources.** empowerme~b2 0.566 Devising teaching techniques.** empowerme~b3 0.511 Setting grading and student assessment practices.**
empowerme~b4 0.444 Determining the content of in-service professional development programs.**
empowerme~b5 0.450 Hiring new teachers.** empowermen~7 0.477 Deciding how the school budget will be spent.** empowermen~8 0.491 School improvement planning.** ** Indicates the question reads: Please indicate how large a role teachers at your school have in each of the following…
HIGH DOMAIN 4: PROFESSIONAL DEVELOPMENT AND COLLABORATION Variable Load Question
prodev_a1 -0.468 Sufficient funds and resources are available to allow teachers to take advantage of professional development activities.
prodev_a2 -0.559 Teachers are provided opportunities to learn from one another prodev_a3 -0.629 Adequate time is provided for professional development
prodev_a4 -0.478 Teachers have sufficient training to fully utilize instructional technology.
prodev_a5 -0.512 Professional development provides teachers with the knowledge and skills most needed to teach effectively.
time_a2 -0.430 Teachers have time available to collaborate with their colleagues.
time_a5 -0.309 The non-instructional time provided for teachers in my school is sufficient.
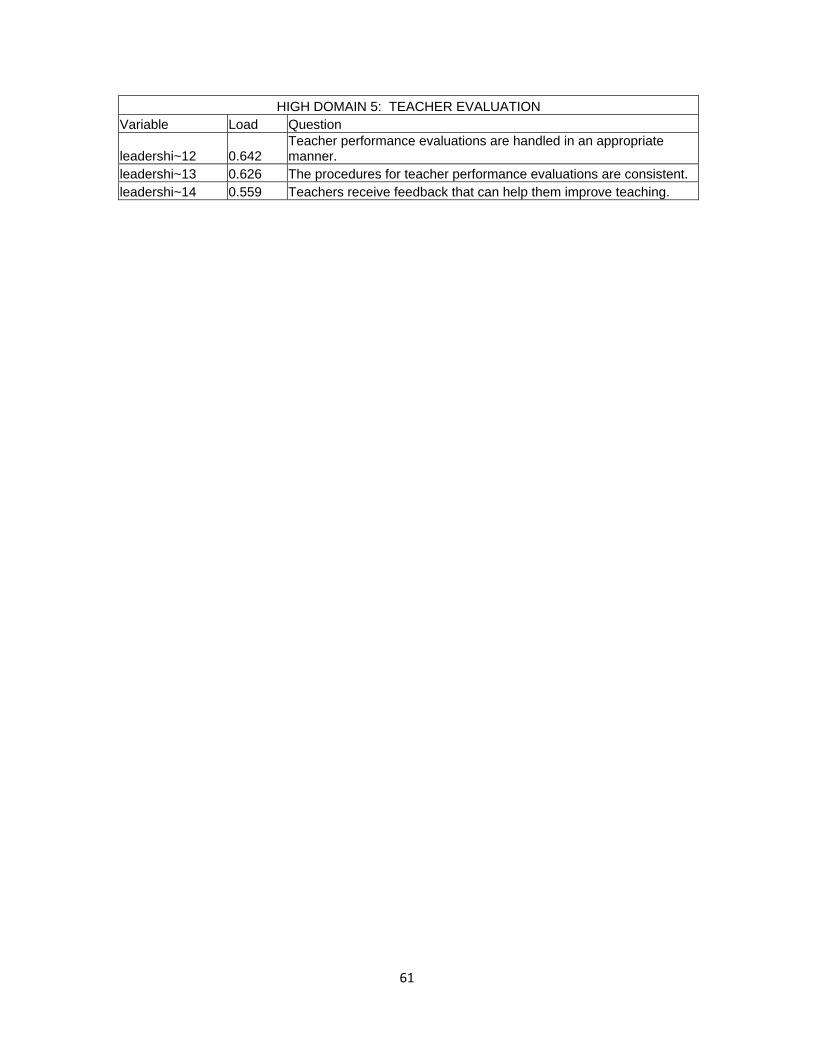
61
HIGH DOMAIN 5: TEACHER EVALUATION Variable Load Question
leadershi~12 0.642 Teacher performance evaluations are handled in an appropriate manner.
leadershi~13 0.626 The procedures for teacher performance evaluations are consistent. leadershi~14 0.559 Teachers receive feedback that can help them improve teaching.
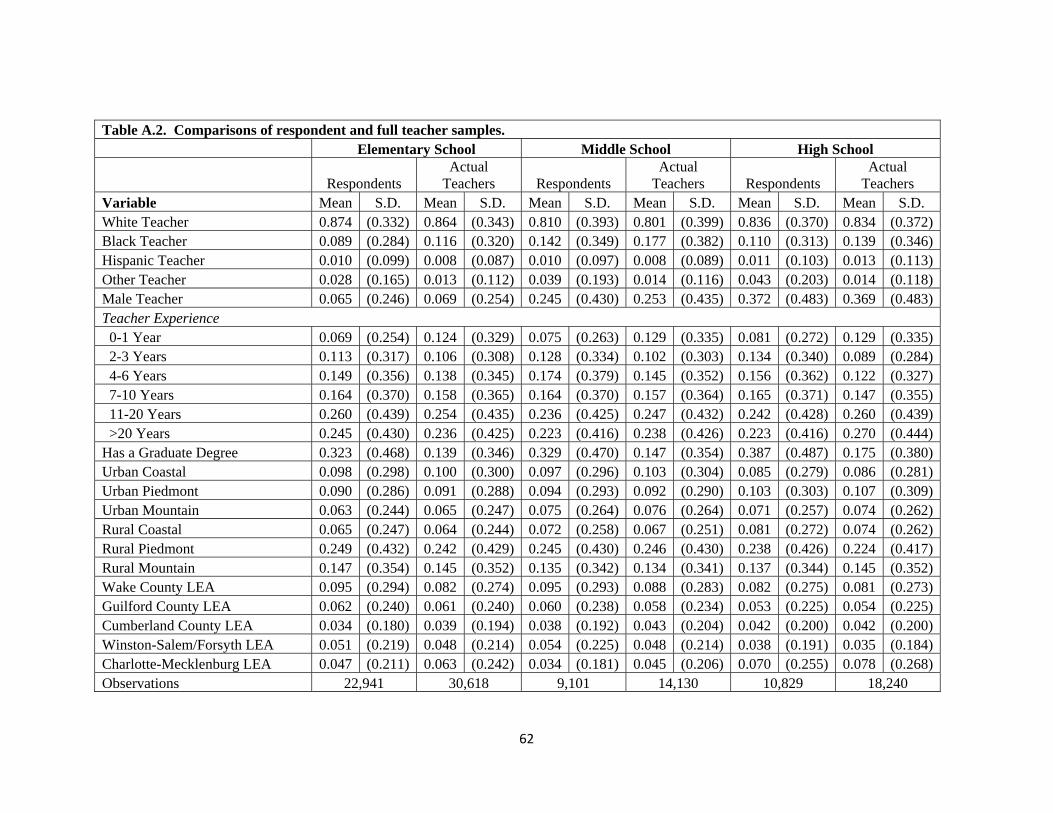
62
Table A.2. Comparisons of respondent and full teacher samples. Elementary School Middle School High School
Respondents Actual
Teachers Respondents Actual
Teachers Respondents Actual
Teachers Variable Mean S.D. Mean S.D. Mean S.D. Mean S.D. Mean S.D. Mean S.D. White Teacher 0.874 (0.332) 0.864 (0.343) 0.810 (0.393) 0.801 (0.399) 0.836 (0.370) 0.834 (0.372)Black Teacher 0.089 (0.284) 0.116 (0.320) 0.142 (0.349) 0.177 (0.382) 0.110 (0.313) 0.139 (0.346)Hispanic Teacher 0.010 (0.099) 0.008 (0.087) 0.010 (0.097) 0.008 (0.089) 0.011 (0.103) 0.013 (0.113)Other Teacher 0.028 (0.165) 0.013 (0.112) 0.039 (0.193) 0.014 (0.116) 0.043 (0.203) 0.014 (0.118)Male Teacher 0.065 (0.246) 0.069 (0.254) 0.245 (0.430) 0.253 (0.435) 0.372 (0.483) 0.369 (0.483)Teacher Experience 0-1 Year 0.069 (0.254) 0.124 (0.329) 0.075 (0.263) 0.129 (0.335) 0.081 (0.272) 0.129 (0.335) 2-3 Years 0.113 (0.317) 0.106 (0.308) 0.128 (0.334) 0.102 (0.303) 0.134 (0.340) 0.089 (0.284) 4-6 Years 0.149 (0.356) 0.138 (0.345) 0.174 (0.379) 0.145 (0.352) 0.156 (0.362) 0.122 (0.327) 7-10 Years 0.164 (0.370) 0.158 (0.365) 0.164 (0.370) 0.157 (0.364) 0.165 (0.371) 0.147 (0.355) 11-20 Years 0.260 (0.439) 0.254 (0.435) 0.236 (0.425) 0.247 (0.432) 0.242 (0.428) 0.260 (0.439) >20 Years 0.245 (0.430) 0.236 (0.425) 0.223 (0.416) 0.238 (0.426) 0.223 (0.416) 0.270 (0.444)Has a Graduate Degree 0.323 (0.468) 0.139 (0.346) 0.329 (0.470) 0.147 (0.354) 0.387 (0.487) 0.175 (0.380)Urban Coastal 0.098 (0.298) 0.100 (0.300) 0.097 (0.296) 0.103 (0.304) 0.085 (0.279) 0.086 (0.281)Urban Piedmont 0.090 (0.286) 0.091 (0.288) 0.094 (0.293) 0.092 (0.290) 0.103 (0.303) 0.107 (0.309)Urban Mountain 0.063 (0.244) 0.065 (0.247) 0.075 (0.264) 0.076 (0.264) 0.071 (0.257) 0.074 (0.262)Rural Coastal 0.065 (0.247) 0.064 (0.244) 0.072 (0.258) 0.067 (0.251) 0.081 (0.272) 0.074 (0.262)Rural Piedmont 0.249 (0.432) 0.242 (0.429) 0.245 (0.430) 0.246 (0.430) 0.238 (0.426) 0.224 (0.417)Rural Mountain 0.147 (0.354) 0.145 (0.352) 0.135 (0.342) 0.134 (0.341) 0.137 (0.344) 0.145 (0.352)Wake County LEA 0.095 (0.294) 0.082 (0.274) 0.095 (0.293) 0.088 (0.283) 0.082 (0.275) 0.081 (0.273)Guilford County LEA 0.062 (0.240) 0.061 (0.240) 0.060 (0.238) 0.058 (0.234) 0.053 (0.225) 0.054 (0.225)Cumberland County LEA 0.034 (0.180) 0.039 (0.194) 0.038 (0.192) 0.043 (0.204) 0.042 (0.200) 0.042 (0.200)Winston-Salem/Forsyth LEA 0.051 (0.219) 0.048 (0.214) 0.054 (0.225) 0.048 (0.214) 0.038 (0.191) 0.035 (0.184)Charlotte-Mecklenburg LEA 0.047 (0.211) 0.063 (0.242) 0.034 (0.181) 0.045 (0.206) 0.070 (0.255) 0.078 (0.268)Observations 22,941 30,618 9,101 14,130 10,829 18,240