Embed Size (px)
Citation preview
Teachers, Race, and Student Achievement in a Randomized ExperimentAuthor(s): Thomas S. DeeSource: The Review of Economics and Statistics, Vol. 86, No. 1 (Feb., 2004), pp. 195-210Published by: The MIT PressStable URL: http://www.jstor.org/stable/3211667 .
Accessed: 28/06/2014 12:21
Your use of the JSTOR archive indicates your acceptance of the Terms & Conditions of Use, available at .http://www.jstor.org/page/info/about/policies/terms.jsp
.JSTOR is a not-for-profit service that helps scholars, researchers, and students discover, use, and build upon a wide range ofcontent in a trusted digital archive. We use information technology and tools to increase productivity and facilitate new formsof scholarship. For more information about JSTOR, please contact [email protected].
.
The MIT Press is collaborating with JSTOR to digitize, preserve and extend access to The Review ofEconomics and Statistics.
http://www.jstor.org
This content downloaded from 185.31.195.178 on Sat, 28 Jun 2014 12:21:10 PMAll use subject to JSTOR Terms and Conditions
TEACHERS, RACE, AND STUDENT ACHIEVEMENT IN A RANDOMIZED EXPERIMENT
Thomas S. Dee*
Abstract.-Recommendations for the aggressive recruitment of minority teachers are based on hypothesized role-model effects for minority stu- dents as well as evidence of racial biases among nonminority teachers. However, prior empirical studies have found little or no association between exposure to an own-race teacher and student achievement. This paper presents new evidence on this question by examining the test score data from Tennessee's Project STAR class-size experiment, which ran- domly matched students and teachers within participating schools. Spec- ification checks confirm that the racial pairings of students and teachers in this experiment were unrelated to other student traits. Models of student achievement indicate that assignment to an own-race teacher significantly increased the math and reading achievement of both black and white students.
I. Introduction
HE economic literature on the policy determinants of student achievement has focused largely on the possible
benefits of new educational resources that reduce class size and improve teacher salaries and training. However, the literature from other social sciences provides provocative evidence that several other contextual factors might also substantively influence the relationships between teachers, students, and student achievement. In particular, the con- ventional wisdom among educators is that minority students are more likely to excel educationally when matched with teachers who share their race or ethnicity. The frequent calls for aggressive recruitment of underrepresented minority teachers are typically motivated by the specific claim that such teachers are better equipped to deal with the special needs of at-risk minority students and that they provide more effective role models (see, for example, U.S. Depart- ment of Education, 1997; Graham, 1987; Ladson-Billings, 1994; NCTAF, 1996). There is also corresponding evidence that the racial pairings of teachers and students influence how teachers allocate their time in the classroom as well as their expectations and evaluations of students (for example, Ferguson, 1998; Casteel, 1998; Zimmerman et al., 1995; Ehrenberg, Goldhaber, & Brewer, 1995). Yet, relatively few studies have attempted to identify the relationship between exposure to own-race teachers and subsequent levels of student achievement. And what evidence is available sug- gests that there is actually little association between student achievement and the racial match between teachers and students (Ehrenberg, Goldhaber, & Brewer, 1995; Ehren- berg & Brewer, 1995).
Received for publication February 28, 2002. Revision accepted for publication May 5, 2003.
* Swarthmore College and NBER. I would like to thank Ronald Ehrenberg, William Evans, Alan Krueger,
Jens Ludwig, Diane Whitmore, two anonymous referees, and seminar participants at Swarthmore College, CUNY, and the 2000 NBER Summer Institute for helpful comments. I would also like to thank Ben Keys for excellent research assistance, and the Smith Richardson Foundation for financial support.
The Review of Economics and Statistics, February 2004, 86(1): 195-210
However, the appropriate specification for econometric models of student achievement is a controversial issue. For example, the contentious literature over whether "money matters" in models of student achievement has in part focused on specification issues like functional form and the role of omitted, endogenous, or poorly measured variables (see, for example, Burtless, 1996). In a recent contribution to this literature, Krueger (1999) examined data from the Project STAR experiment in order to address some of these specification issues as well as the relationship between class size and test scores. Tennessee's Project STAR (Student Teacher Achievement Ratio) was a large-scale randomized experiment on the achievement benefits of small class sizes. It began in the 1985-1986 school year with a group of over 6,000 students from 79 participating schools. The experi- ment continued through the third grade and ultimately included over 11,000 students.1 A key feature of the exper- imental design was the random assignment of both students and teachers to small classes, regular-sized classes and regular-sized classes with teacher aides within each school. Project STAR was not designed to evaluate the relationship between own-race teachers and student achievement. None- theless, this experiment provides a novel and potentially compelling opportunity to do so in that the putatively random pairings of students and teachers should circumvent the nonrandom and possibly confounding assignments in- herent in conventional data on student achievement.2
This study presents such test score evaluations by relying on the recently released Project STAR Public Access Data. I begin by briefly summarizing and discussing the prior evidence on the racial dynamics between students and teachers (section II). I then discuss the Project STAR ex- periment and data in more detail (section III). Next, I present some initial evaluation results and evidence on whether the racial pairing of students and teachers actually satisfies the supposedly randomized experimental design (section IV). This is a relevant concern in that attrition from the experiment and classroom reassignments ("treatment crossover") could have compromised the integrity of the
Not surprisingly with an experiment of this scale and scope, there are a number of important issues with regard to its conduct that could threaten the resulting inferences (most notably, potentially nonrandom attrition and classroom reassignment). Krueger (1999) addressed these concerns in the context of the class-size results and found that the conventional findings linking small classes with higher levels of student achievement were robust. This study presents similar evidence on whether these violations may be confounding in this context.
2 Furthermore, because these students are "treated" and observed in their early stages of their formal schooling, the possible effects of own-race teachers may be more easily detectable in these data. Prior studies have evaluated college matriculation or test score gains among older students (Hess & Leal, 1997; Ehrenberg et al., 1995; Ehrenberg & Brewer, 1995).
? 2004 by the President and Fellows of Harvard College and the Massachusetts Institute of Technology
This content downloaded from 185.31.195.178 on Sat, 28 Jun 2014 12:21:10 PMAll use subject to JSTOR Terms and Conditions
THE REVIEW OF ECONOMICS AND STATISTICS
experimental design (Krueger, 1999; Hanushek, 1999). The empirical results presented here suggest that these issues are not problematic in this context. In particular, auxiliary regressions indicate that the within-school variation in ex- posure to an own-race teacher was uncorrelated with other important student traits (such as small-class assignment, age, and free-lunch status).3 I then present a broader set of empirical evidence on the achievement effects of exposure to an own-race teacher (section V). In brief, these results indicate that assignment to an own-race teacher was asso- ciated with substantive gains in achievement for both black and white students. More specifically, these results suggest that a year with an own-race teacher increased math and reading scores by roughly 2 to 4 percentile points.4 Notably, the estimated achievement gains associated with an own- race teacher exist for nearly all groups of students defined by race and gender. However, these effects also appear to vary in intriguing ways with respect to other student, teacher and classroom characteristics (such as free-lunch status, teacher experience and class size) and to be additive over time.
I also discuss and examine a fundamental ambiguity regarding the strong associations between student achieve- ment and assignment to an own-race teacher. Specifically, a critically important concern is whether inferences about the effects associated with a teacher's race are biased by the unobserved dimensions of teacher quality. The randomized pairing of students and teachers only assured that the stu- dents' unobserved propensity for achievement is uncorre- lated with their teacher's race. However, the variation in unobserved teacher quality could still impart biases to the extent that it varies systematically with a teacher's race. Although it is difficult to address this concern definitively, I examine its empirical relevance in several ways, including evaluating specifications that introduce classroom fixed ef- fects.5 The results suggest that unobserved teacher quality does not impart confounding biases, particularly with re- spect to mathematics achievement and white students. In
3 Furthermore, concerns about the possible biases due to reassignment and attrition are also addressed here in two other ways. One is by evaluating test score equations that include imputed data for students who left the experiment (Krueger, 1999). The other is by generating 2SLS estimates of the effect of own-race teachers where the instrumental variable is a measure of the teacher race a student would have had in the absence of treatment crossover (that is, the "intent to treat"). The unifor- mity of the results based on these models suggests that experimental violations are not confounding in this context.
4 It is difficult to quantify the benefits of these test score gains. However, a comparison with other estimated effects suggests these effects are sizable. More specifically, these estimated effects are often comparable to those associated with a small-class assignment (around 4 percentile points) and are large in comparison with the observed black-white test gap (around 6 to 9 percentile points) as well as the test differences between students who do and do not receive free lunches (around 11 percentile points).
5 I also present qualified, indirect evidence on this issue by discussing the racial variation in teacher observables associated with student achieve- ment and by examining the estimated effects of own-race teachers across schools that may have different abilities to recruit and retain high-quality teachers.
section VI, I conclude by summarizing this study's results and speculating briefly about their implications for policy and further research.
II. Teachers and Race
Three concerns have dominated discussions of educa- tional policy regarding teachers in recent years. First, a shortage of teachers has been observed since the 1980s. This shortage has been exacerbated in recent years by the retire- ment of older baby-boomer teachers while the echo of the baby boom has simultaneously increased school enroll- ments (U.S. Department of Education, 1997). Second, there is evidence that the ability of those choosing to become teachers has been in decline (see, for example, Murnane et al., 1991; Corcoran, Evans, & Schwab, 2002). The third frequently cited concern is a decline in the proportion of teachers who belong to minorities. Minorities have been historically underrepresented among teachers, and with the pattern of projected retirements and the expected relative growth of minority enrollments, this ostensibly problematic situation is expected to worsen. These stylized facts regard- ing teachers have motivated recommendations for renewed efforts at recruiting and retaining teachers, particularly those who belong to racial and ethnic minorities (NCTAF, 1996; U.S. Department of Education, 1997; Graham, 1987; Ladson- Billings, 1994). A maintained assumption underlying these recommendations is that minority teachers would be partic- ularly adept at educating the growing population of minority students. Given that minority students are more likely to be at risk for academic failure, it is perhaps not surprising that less attention has been paid to whether minority teachers might be less effective teachers of nonminority students.6
In a recent survey article, Ferguson (1998) concludes that the racial dynamics between students and teachers do ap- pear to influence educational achievement. However, he also notes that the magnitudes of these effects are uncertain and that the possible structural mechanisms are complicated and sometimes based on thin evidence. The prior literature offers at least two general explanations for why the racial pairing of students and teachers might exert an important influence on student achievement. These explanations are not mutually exclusive. One class of explanations involves what could be called passive teacher effects. These effects are simply triggered by a teacher's racial presence and not by explicit teacher behaviors. For example, one frequently cited reason for the relevance of a teacher's race is that, by its mere presence, a teacher's racial identity generates a sort of role-model effect that engages student effort, confidence, and enthusiasm (see, for example, King, 1993; Clewell & Villegas, 1998). For underprivileged black students, the presence of a black teacher may encourage them to update their prior beliefs about their educational possibilities. Sim-
6 However, because this study presents models of achievement among white and black students separately, it provides evidence on this issue.
196
This content downloaded from 185.31.195.178 on Sat, 28 Jun 2014 12:21:10 PMAll use subject to JSTOR Terms and Conditions
TEACHERS, RACE, AND STUDENT ACHIEVEMENT IN A RANDOMIZED EXPERIMENT
ilarly, students may feel more comfortable and focused in the presence of an own-race teacher regardless of the teacher's actual behavior. Although the existence of such role-model effects is frequently assumed in commentaries on educational policy, there is actually little direct empirical support (Cizek, 1995).
Another possibly relevant sort of passive teacher effect is stereotype threat (Steele, 1997). This hypothesized mecha- nism is based on the assumption that academic identification (that is, seeing self-worth in academic achievement) is critically important for sustaining educational development. Stereotype threat refers to the possibility that, in situations where students perceive stereotypes might attach (for ex- ample, black students with white teachers), they experience an apprehension that retards their academic identification and subsequent achievement. Experimental evidence based on students at a selective university appears to confirm the existence of race-based stereotype threat. For example, black students underperformed relative to white students on items from the verbal Graduate Records Examination (GRE) when told beforehand that the test was diagnostic of ability (Steele, 1997). Furthermore, test score comparisons indicated that stereotype threat was triggered for the black students merely by introducing a pretest demographic ques- tionnaire that recorded race (Steele, 1997). However, it is not yet clear whether this intriguing phenomenon exists among students in elementary and secondary settings (Fer- guson, 1998).
A second class of explanations for the educational bene- fits of own-race teachers points to active teacher effects: race-specific patterns of behavior among teachers. In par- ticular, it may be that in allocating class time, in interacting with students, and in designing class materials, teachers are more oriented towards students who share their racial or ethnic background. The limited amount of evidence from experimental studies suggests that this does occur (Fergu- son, 1998). For example, one study placed white teachers in a teaching environment where they could not observe the student directly and found that they provided less coaching and briefer, less positive feedback when told beforehand that the student was black (Taylor, 1979). Similarly, studies based on observations from actual classrooms often find that black students with white teachers receive less attention, are praised less, and are scolded more than their white counter- parts.7 Unfortunately, the reduced-form test score models presented here cannot meaningfully distinguish between the passive and active hypotheses for why own-race teachers might be educationally relevant. In the concluding section, I argue that our limited understanding of why race might
7 See Casteel (1998) for recent evidence on biases in teacher behavior as well as a brief overview of this literature. Ferguson (1998) is careful to point out that the nonexperimental evidence suggests the absence of unconditional race neutrality but that it is difficult to assess teacher biases conditional on student behaviors.
matter in classrooms implies an important caveat with respect to related policy recommendations.
Although there is a seeming consensus on the importance of race in student-teacher interactions, there is surprisingly little clear evidence on the presumed implications for stu- dent achievement. For example, in a recent study, Hess and Leal (1997) found that the share of minority faculty in urban school districts is positively correlated with college matric- ulation rates. But Hess and Leal (1997) correctly noted that partial correlations linking own-race teachers with im- proved student outcomes may be very misleading. More specifically, they suggested that a high proportion of minor- ity faculty can proxy for important but unobserved district- specific determinants of student achievement. Similarly, Ehrenberg and Brewer (1995), in a study examining the classic Coleman data from the 1960s, demonstrated that black teachers are associated with improved test scores among black students. However, they also recognized the ambiguity of these partial correlations and actually found that these effects are not robust in models that correct for the simultaneous determination of teacher characteristics.8 Ehrenberg et al. (1995) reconsidered these questions using more recent data from the National Education Longitudinal Study of 1988 (NELS-88). As in prior educational studies, they found evidence that subjective teacher evaluations of students are often higher when student and teacher race coincide.9 However, they found almost no evidence that the racial pairings of students and teachers influenced the test score gains among NELS-88 respondents. Because the public- use NELS-88 data do not include geographic identifiers, they did not attempt to address the endogeneity of teacher characteristics. It is important to note that the lack of a partial correlation between racial pairing and student achievement, such as that reported by Ehrenberg et al. (1995), could also reflect a negative bias imparted by omitted or endogenous regressors. For example, if minority faculty sought out or were more likely to be assigned to at-risk minority students, naive estimates of their impact on student outcomes would understate the true effects.10 In the absence of compelling instrumental variables, the uncertain biases inherent in inferences based on observational data represent a seemingly intractable problem for evaluating the
8 But they also find that the evidence of lower score gains among white students with black teachers is more robust. However, in general, the quality of their identification strategy for endogenous teacher character- istics may be suspect, for it relies on variables that could presumably influence student achievement (such as, family traits, county or SMSA variables, and starting teacher salary).
9 Actually, they exhaustively study the influence of interactions between race, gender, and ethnicity. However, the focus of this study is race alone. Almost all Project STAR students and teachers are black or non-Hispanic whites, and almost all teachers are female.
10 This is similar to the potential bias in conventional class-size studies: if at-risk students are more likely to be assigned to small classes, naive evaluations can understate the impact of the smaller classes. Ehrenberg et al. (1995) also note that the use of gains in student test scores (as opposed to test score levels) may exacerbate measurement error and lead to attenuated estimates.
197
This content downloaded from 185.31.195.178 on Sat, 28 Jun 2014 12:21:10 PMAll use subject to JSTOR Terms and Conditions
THE REVIEW OF ECONOMICS AND STATISTICS
educational impact of own-race teachers. For this reason, the putatively random pairings of Project STAR students and teachers provide a unique opportunity to identify the possible links between student and teacher race and student outcomes.
III. Tennessee's Project STAR
In the spring of 1985, the Tennessee Legislature autho- rized $3 million for the first year of a 4-year study of class size that began with kindergarten students that fall (Word et al., 1990). In the first year of the study, 79 schools (and over 6,000 students) participated. Over the 4-year study, roughly 11,600 students participated, approximately 2200, 1600, and 1200 entering in the first, second, and third grades respec- tively (Krueger, 1999).1 The participating schools were drawn from around the state and, by legislative mandate, included inner-city and suburban schools from larger met- ropolitan areas (such as Knoxville, Nashville, Memphis, and Chattanooga) as well as rural schools and urban schools from smaller towns. Recognizing that schools around the state differed in substantive ways that are inherently diffi- cult to quantify, a within-school experimental design was chosen. This implied that smaller schools were necessarily excluded. Participating schools had to have enough students in a given grade so that three class types-a small class of 15 students and two regular-size classes of 22 (one with a teacher's aide)-could be formed (Mosteller, 1995). Stu- dents and teachers within participating schools were ran- domly matched to the three class types. It was originally intended that, once assigned, a student would keep their class type through third grade so that cumulative effects could be identified. However, over the course of the 4-year study, this pure experimental design was potentially com- promised by both class-type reassignment and student attri- tion. The next section discusses these issues in more detail and presents evidence on the extent to which they might confound these evaluations. For more detailed discussions of the Project STAR experiment in general, see Word et al. (1990), Mosteller (1995), and Krueger (1999).
The empirical results presented here are based on the Project STAR public-access data. Given the very limited number of Hispanic, Asian, and American Indian Project STAR participants, these data were edited to include only those observations from black and white non-Hispanic stu- dents with black and white non-Hispanic teachers. The implied reductions in sample size were quite modest. For example, among the 6,325 kindergarten students this elim- inated only 95 observations.12 A small number of observa- tions with missing data on key observed characteristics (for
I The number of first-grade entrants was fairly large, because kinder- garten was not required.
12 Only 30 kindergarten students were neither black nor white; 3 more had missing race/ethnicity data. All the kindergarten teachers for whom data were available were identified as white or black. However, teacher
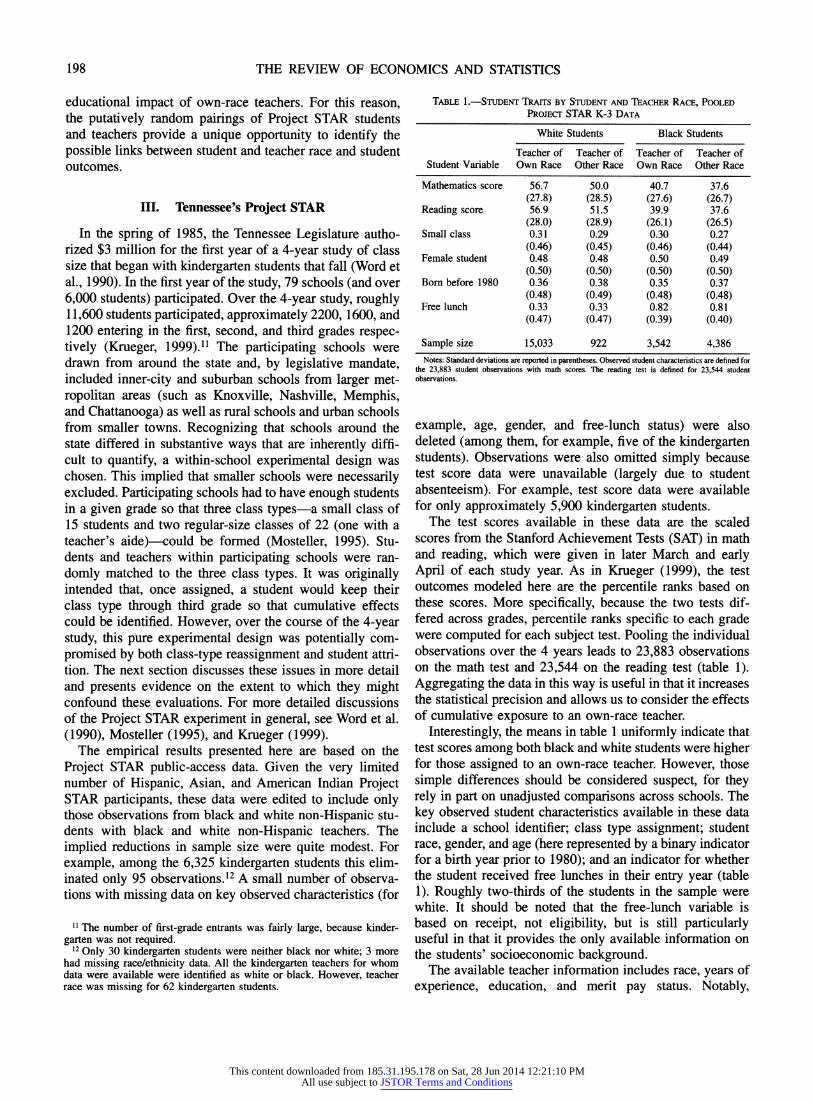
TABLE 1.-STUDENT TRAITS BY STUDENT AND TEACHER RACE, POOLED PROJECT STAR K-3 DATA
White Students Black Students
Teacher of Teacher of Teacher of Teacher of Student Variable Own Race Other Race Own Race Other Race
Mathematics score 56.7 50.0 40.7 37.6 (27.8) (28.5) (27.6) (26.7)
Reading score 56.9 51.5 39.9 37.6 (28.0) (28.9) (26.1) (26.5)
Small class 0.31 0.29 0.30 0.27 (0.46) (0.45) (0.46) (0.44)
Female student 0.48 0.48 0.50 0.49 (0.50) (0.50) (0.50) (0.50)
Born before 1980 0.36 0.38 0.35 0.37 (0.48) (0.49) (0.48) (0.48)
Free lunch 0.33 0.33 0.82 0.81 (0.47) (0.47) (0.39) (0.40)
Sample size 15,033 922 3,542 4,386 Notes: Standard deviations are reported in parentheses. Observed student characteristics are defined for
the 23,883 student observations with math scores. The reading test is defined for 23,544 student observations.
example, age, gender, and free-lunch status) were also deleted (among them, for example, five of the kindergarten students). Observations were also omitted simply because test score data were unavailable (largely due to student absenteeism). For example, test score data were available for only approximately 5,900 kindergarten students.
The test scores available in these data are the scaled scores from the Stanford Achievement Tests (SAT) in math and reading, which were given in later March and early April of each study year. As in Krueger (1999), the test outcomes modeled here are the percentile ranks based on these scores. More specifically, because the two tests dif- fered across grades, percentile ranks specific to each grade were computed for each subject test. Pooling the individual observations over the 4 years leads to 23,883 observations on the math test and 23,544 on the reading test (table 1). Aggregating the data in this way is useful in that it increases the statistical precision and allows us to consider the effects of cumulative exposure to an own-race teacher.
Interestingly, the means in table 1 uniformly indicate that test scores among both black and white students were higher for those assigned to an own-race teacher. However, those simple differences should be considered suspect, for they rely in part on unadjusted comparisons across schools. The key observed student characteristics available in these data include a school identifier; class type assignment; student race, gender, and age (here represented by a binary indicator for a birth year prior to 1980); and an indicator for whether the student received free lunches in their entry year (table 1). Roughly two-thirds of the students in the sample were white. It should be noted that the free-lunch variable is based on receipt, not eligibility, but is still particularly useful in that it provides the only available information on the students' socioeconomic background.
The available teacher information includes race, years of race was missing for 62 kindergarten students. experience, education, and merit pay status. Notably,
198
This content downloaded from 185.31.195.178 on Sat, 28 Jun 2014 12:21:10 PMAll use subject to JSTOR Terms and Conditions
TEACHERS, RACE, AND STUDENT ACHIEVEMENT IN A RANDOMIZED EXPERIMENT
teacher gender is not included on the public-use data. In all likelihood, this was intended to preserve confidentiality, for almost none of the teachers were male.l3 This does limit the generalizability of this study somewhat, because gender may generate some heterogeneity in the race-based interac- tions between students and teachers.
Each student's exposure to an own-race teacher is repre- sented in two ways in this study. The main approach is simply to identify whether each student had an own-race teacher in their current academic year. However, some models will address the cumulative effects of student expo- sure to an own-race teacher through the use of an unrestric- tive set of binary indicators for 1 to 4 years of exposure (with no exposure as the reference). On average, 94% of white students had an own-race teacher in their current academic year, whereas only 45% of black students did (table 1). However, these unconditional means mask an interesting pattern of heterogeneity across schools. For example, in the 16 participating city schools, roughly 97% of the students and half of the teachers were black, whereas in the 7 urban and 38 rural schools, 93% of the students and 97% of the teachers were white. The 18 suburban schools were more integrated with 38% of the students and 26% of the teachers being black.'4
An important specification issue in this study involves the potential bias in the estimated effects associated with a teacher's race due to the unobserved dimensions of teacher quality.15 Therefore, the available data on observed teacher traits typically associated with quality (education, experi- ence, merit pay status) may facilitate important robustness checks. Each teacher's education is measured here by a binary indicator for having some type of graduate degree (for example, MS, MA, EdS, or PhD) with the reference category comprising those who have only a bachelor's degree. Roughly 38% of students were assigned to a teacher with a graduate degree. Teaching experience is measured in years (a quadratic term is also included in regression mod- els). On average, students were assigned to teachers with nearly 12 years of experience. Another binary indicator identifies teachers recognized by Tennessee's contempora- neous merit pay plan, the Career Ladder Evaluation System (Dee & Keys, 2003). Roughly 90% of students were as- signed to teachers who participated in Tennessee's career ladder. Whether such merit pay programs can systematically identify and reward good teachers is actually a controversial issue (Murane & Cohen, 1986; Ballou, 2001). However, Tennessee's program was considered a relatively sophisti- cated one in that it blended pecuniary and professional rewards and relied on several teaching evaluation instru-
13 Krueger (1999, appendix table) reports that none of the kindergarten or first-grade teachers are male, whereas 1% and 3% of the second-grade and third-grade teachers are.
141 discuss and examine how the effects associated with own-race teachers vary across more and less segregated schools.
15 The empirical relevance of this concern is discussed in more detail in
ments (including classroom observation).16 Nonetheless, its usefulness as a proxy for teacher quality appears to be somewhat limited. Dee and Keys (2003) find that Tennes- see's merit pay program had only mixed success in reward- ing teachers who raised the average level of classroom achievement.
IV. Threats to Validity
Project STAR arguably provides a unique and compelling opportunity for making reliable inferences about the deter- minants of student achievement. However, a number of factors could also attenuate the generalizability of infer- ences based on these experimental data. For example, the estimated effects associated with class-size assignments could be biased by the ways students and teachers adjust their behavior in response to the knowledge that they have been assigned to a particular experimental group (the Haw- thorne and John Henry effects). The "external validity" of the experiment may also be limited because the study had almost no male teachers, excluded smaller schools and included only young students in Tennessee. A caveat about the external validity of focusing on Tennessee students may be more relevant in this study than in a class-size study, in that the links between own-race teachers and student achievement could reflect Tennessee-specific cultural fac- tors that to some degree will not generalize to other schools. But perhaps even more important are the possible threats to the internal validity of causal inferences based on the experiment. As noted earlier, like any social experiment, Project STAR had some notable and potentially problematic complications in its execution. For example, because of parental complaints, students in the regular-size classes were randomly reassigned to regular-size classes with and without teacher aides at the beginning of first grade.17 Assignments to small classes were generally unaffected by this rerandomization. However, roughly 10% of students were also moved between small and regular class assign- ments, largely because of complaints or behavioral prob- lems. Furthermore, attrition from the study was fairly high. This attrition could reflect conventional family mobility, grade repeating and advancing, and possibly nonrandom responses to class assignments.18
Fortunately, the threats to the validity of inferences about class-size effects should not be as serious for inferences about the effects associated with a teacher's race. For
16 Brandt (1995) praised Tennessee's approach as "perhaps the country's most comprehensive experiment in summative evaluation."
17 Initial evaluations based on the kindergarten students indicated that the addition of teacher aides had no impact on student achievement.
18 Krueger (1999) concludes that the class-size effects in Project STAR are not compromised by these problems. The effects of sample attrition were addressed through the use of imputed test scores. The implications of reassignment were addressed through the use of IV estimates that employ a student's original assignment as an instrumental variable for current class size. And the existence of class-size effects among those assigned to regular classes suggests the absence of Hawthorne and John Henry effects.
199
section V.
This content downloaded from 185.31.195.178 on Sat, 28 Jun 2014 12:21:10 PMAll use subject to JSTOR Terms and Conditions
THE REVIEW OF ECONOMICS AND STATISTICS
example, nonrandom attrition or class reassignment would seem less likely to be problematic in this context than in a high-profile study of class-size effects. When parents chose a school, they presumably had fairly sound prior expecta- tions regarding the conditional probability that their child would be assigned an own-race teacher. And, because teach- ers and students would be reassigned in the next academic year, the racial pairings in a given year do not provide a particularly strong incentive for attrition. In contrast, a student's assignment to small or large classes was intended to persist through the third grade. Furthermore, the reactive effects associated with the participants' knowledge that they have a particular experimental assignment should not be relevant, for the racial dynamics between students and teachers were not a focus of the study. Nonetheless, it is important to consider whether Project STAR's deviations from an ideal experimental design might confound this study's inferences, which link assignments to an own-race teacher with higher test scores. Notably, the likely direction of biases introduced by nonrandom attrition or class reas-
signment is uncertain a priori. They could plausibly result in estimates that overstate or understate the true effect of an own-race teacher. For example, if the decision to move a child to an own-race teacher partly reflects unobserved family or parental priors that harm student achievement (such as ignorance, intolerance, or poor socialization), the results presented here will understate the academic benefits of an own-race teacher. In contrast, to the extent that parents who tend to provide strong academic support for their child are also more likely to seek out an own-race teacher, the results presented here will overstate the benefits of such teachers. Clearly, the latter of these possibilities is the more relevant given the pattern of results reported here.
These concerns are evaluated here in several ways. One is
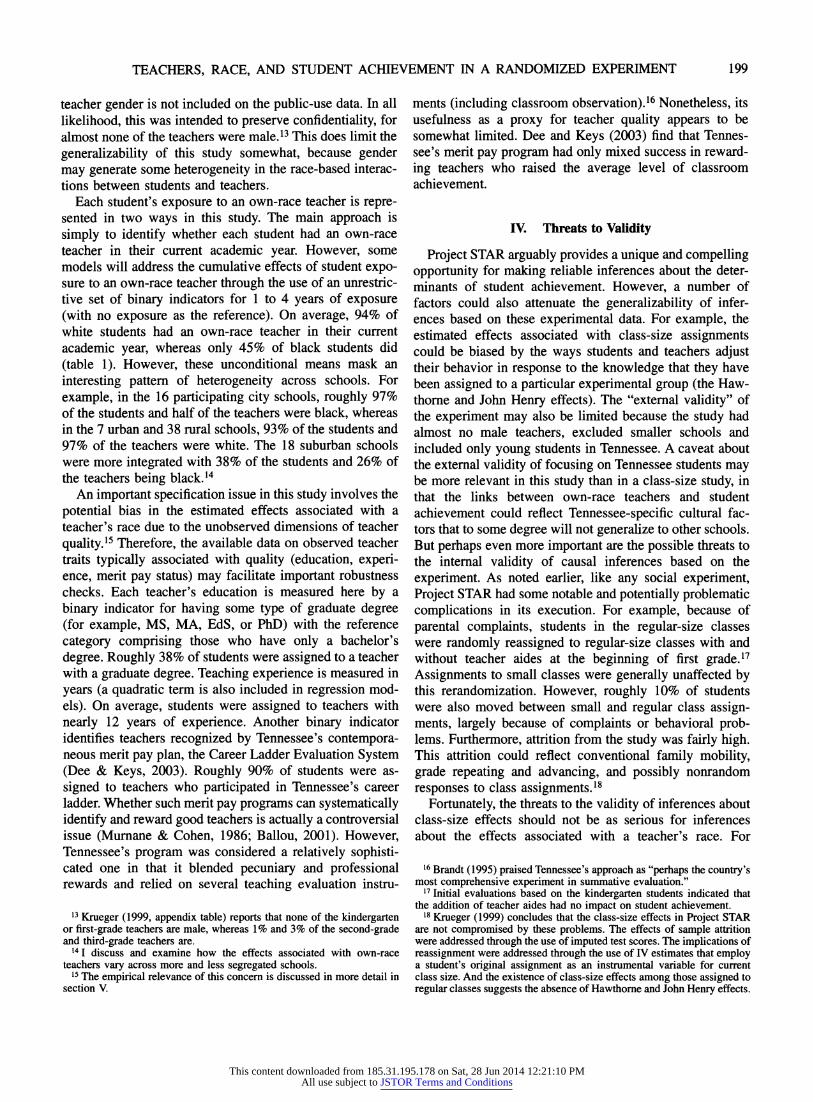
by presenting results based only on the kindergarten data, which were relatively unaffected by these experimental problems (Word et al., 1990; Krueger, 1999). A second approach is based on considering ad hoc regressions that evaluate the randomness of the within-school racial pairings by assessing the association between observed student traits and assignment to an own-race teacher. These approaches are combined in the kindergarten results presented in table 2. The first column of table 2 reports the results of an OLS
regression where the dependent variable is a binary indica- tor for whether the kindergarten student had an own-race teacher.19 The regressors in this model are five basic student traits and school fixed effects. These results indicate that
19 Throughout this study, standard errors that allow for classroom- specific heteroskedasticity are reported. Classroom identifiers were not reported in the public-use data. However, I effectively identified them by concatenating school, grade, class type assignment, merit pay status, and teacher education. The validity of this classroom identifier was confirmed by my ability to replicate the class size distribution reported by Krueger (1999, table 3). The correspondence of these distributions was exact except for the apparent typographical error in the number of students in 22-student regular-size classes with aides. Krueger (1999) reports 329
TABLE 2.-OWN-RACE TEACHERS AND TEST SCORES, KINDERGARTEN
STUDENTS
Dependent Variable
Teacher of Mathematics Reading Variable Own Race Score Score
Teacher of own race - 3.6t 2.9 (1.7) (2.1)
Small class -0.010 4.8: 5.7: (0.028) (1.2) (1.2)
Black student -0.614f -8.41 -6.51 (0.086) (1.8) (2.0)
Female student -0.00003 4.4: 5.51 (0.008) (0.7) (0.7)
Born before 1980 -0.012 5.8: 3.71 (0.007) (0.7) (0.7)
Free lunch -0.012 -12.8: -14.01 (0.010) (0.8) (0.9)
Sample size 5783 5780 5699 R2 .5375 .2795 .3131
Notes: Robust standard errors are reported in parentheses. All models include school fixed effects. Roughly 77% of the kindergarten students have an own-race teacher.
* Statistically significant at 10% level. t Statistically significant at 5% level. t Statistically significant at 1% level.
black students are substantially less likely to have an own- race teacher. This is to be expected, for relatively few black teachers are available among the participating schools. However, if the matching of students and teachers were indeed random, we should find no within-school association between the other observed student traits and exposure to an own-race teacher. The results in table 2 indicate that this is so. For example, poorer students (namely, those receiving free lunches) are actually less likely to have an own-race teacher. However, the estimated effect is both small and statistically indistinguishable from 0. Similarly, gender, age and a small-class assignment all exhibit small and statisti- cally weak relationships with assignment to an own-race teacher. These four variables are jointly insignificant deter- minants as well (p-value of 0.35). But the test score results in table 2 indicate that assignment to an own-race teacher was associated with higher achievement in both math and reading. Kindergarten students assigned to an own-race teacher had math scores that were a statistically significant 3.6 percentile points higher. The estimated increase in
reading scores among these kindergarten students is also large (2.9 percentile points) but not statistically distinguish- able from 0.
The kindergarten results in table 2 provide important evidence that assignment to own-race teachers has been independently given and that this assignment increased math achievement. However, most of the results in this study will instead exploit the pooled data, because those can
generate more statistical precision as well as identify cumu- lative effects. The increase in sample size will also allow us to estimate some models separately by race and gender. The key variable in most models based on the pooled data will again be a binary indicator for whether the student had an own-race teacher in a given year. Other models will exploit
200
students, whereas I identified 330 students in 15 separate classes.
This content downloaded from 185.31.195.178 on Sat, 28 Jun 2014 12:21:10 PMAll use subject to JSTOR Terms and Conditions
TEACHERS, RACE, AND STUDENT ACHIEVEMENT IN A RANDOMIZED EXPERIMENT
a variable that reflects the probability a student would have had an own-race teacher if they hadn't changed their class- room assignment. This type of intent-to-treat variable pro- vides a plausible instrumental variable for the actual race of a student's teacher. However, it should be noted that, be- cause of data limitations, this variable is not an exact measure of intent to treat. In particular, we do not know the exact class each student would have attended in the absence of treatment crossover or attrition. Instead, we know each student's entry school and the classroom type (small, regular- size, regular-size with aide) that they first attended. A measure of intended exposure to an own-race teacher was constructed by matching each student to the race of the teacher they would have had in a particular grade if they remained within their entry school and classroom-type as- signment. This variable takes on the appropriate fractional value in the few cases (15%) where students from a given entry school and classroom type could have had a black or white teacher in subsequent years.20 Another complication is that the classroom assignments that we observe for students in their first year are the actual ones, not necessarily the originally intended ones (which are not available in the data). However, Krueger (1999) compared intended and actual classroom assignments for kindergarten students from 18 schools and found that they differed for only 0.3% of students.
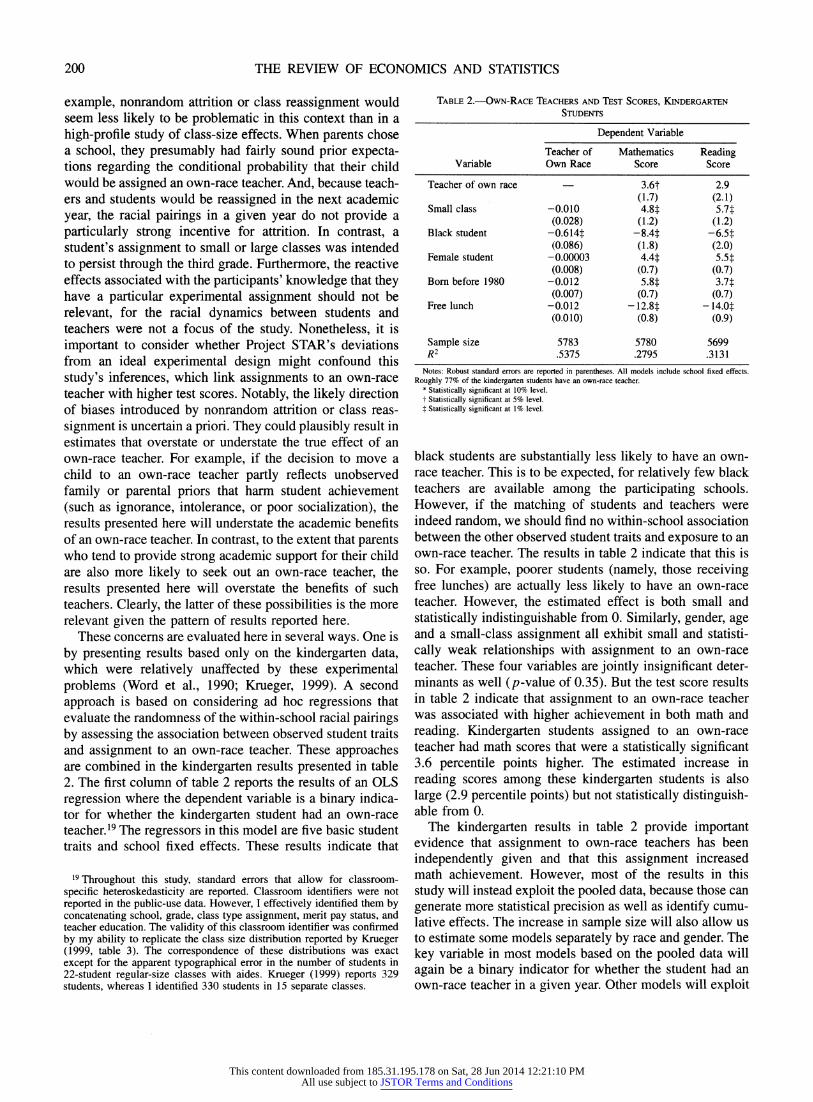
Table 3 presents some critical evidence on whether the within-school variation in these putatively random measures is independent of other student characteristics.21 The results in the top panel relate the within-school variation in current exposure to an own-race teacher to other student traits. In all of these models, we again see small and statistically insig- nificant relationships between the current assignment to an own-race teacher and the observed student characteristics. Furthermore, as the p-values indicate, these variables are jointly insignificant as well. The bottom panel relates the intended assignment to an own-race teacher to these student traits. Again, these models indicate that, within schools and entry waves, there was no association between assignment to an own-race teacher and other student characteristics. These results provide an important validation of the exoge- neity of the experimental assignment to an own-race teacher. However, the subsequent empirical models also examine the relevance of these issues by exploiting an intended assignment to an own-race teacher as an instru- mental variable for their actual assignment and by evaluat- ing reduced-form models that include imputed test scores for students who left the experiment or were absent when a test was given.
20 Also, in the few cases where the class type or grade was not observed for an entry school in later study years, students were assigned the mean value for the school and grade, or just for the school.
21 As is described more formally in the next section, the pooled models include fixed effects for the grade and the interaction of fixed effects for grade of entry and school of entry. Kruger and Whitmore (2001) employ
TABLE 3.-WITHIN-SCHOOL ASSOCIATION BETWEEN STUDENT TRAITS AND ASSIGNMENT TO OWN-RACE TEACHERS, BY STUDENT RACE AND GENDER
Sample
White Black White Black Variable Males Males Females Females
Dependent Variable: Own-Race Teacher
Small class .013 .057 .004 .043 (.013) (.045) (.013) (.048)
Born before 1980 -.004 .002 -.003 .001 (.005) (.015) (.005) (.017)
Free lunch -.005 -.028 -.001 .006 (.004) (.021) (.005) (.021)
R2 .2491 .1952 .2428 .1910 p-value 0.23 0.37 0.94 0.84
Dependent Variable: Intended Own-Race Teacher
Small class .014 .049 .007 .034 (.010) (.033) (.010) (.033)
Born before 1980 .002 -.004 -.002 .007 (.004) (.012) (.004) (.013)
Free lunch .001 -.011 -.001 .019 (.004) (.016) (.004) (.015)
R2 .3173 .2698 .3103 .2577 p-value 0.44 0.42 0.88 0.44
Sample size 8,328 4,024 7,665 3,939 Notes: Robust standard errors are reported in parentheses. All models include grade fixed effects and
the interactions of fixed effects for the entry school and entry wave. The P-value refers to an F-test of the joint significance of the three variables.
* Statistically significant at 10% level. t Statistically significant at 5% level. t Statistically significant at 1% level.
V. Results
A. OLS and 2SLS Estimates
The basic econometric model presented here relates Yisgc, the grade- and subject-specific percentile test rank for stu- dent i in school s, grade g, and class c, to student, teacher, and classroom traits and fixed effects for the grade, entry wave (kindergarten, grades 1 through 3), and school of entry. More specifically, this model takes the following form:
Yisgc = Zi sgc + Xsg g + O s + E?isg
where otg, af, and oa are grade, entry-wave, and school-of- entry fixed effects, and Eisgc is a mean-zero random error. Because randomization occurred in the school of entry upon the year of entry, a full set of interactions between of and ca is included (Krueger & Whitmore, 2001). However, fixed- effects specifications that exclude these interactions return similar results. The matrix Z includes variables that vary at the individual level such as race, gender, age, and free-lunch status. In the long form of this model, Z also includes several student-specific measures of peer-group traits: the percentage of classmates receiving free lunches, the per- centage who are black, the percentage who are female, and
201
a similar specification.
This content downloaded from 185.31.195.178 on Sat, 28 Jun 2014 12:21:10 PMAll use subject to JSTOR Terms and Conditions
THE REVIEW OF ECONOMICS AND STATISTICS
TABLE 4.-ESTIMATED EFFECTS OF AN OWN-RACE TEACHER ON THE MATHEMATICS SCORES OF WHITE STUDENTS BY GENDER
White Males White Females
OLS 2SLS OLS 2SLS OLS 2SLS OLS 2SLS Variable (1) (2) (3) (4) (5) (6) (7) (8)
Teacher of own race 4.6t 5.0t 4.4t 4.7* 4.5t 5.1t 4.0t 4.5* (1.7) (2.4) (1.8) (2.5) (1.9) (2.6) (1.9) (2.7)
Small class 4.5: 4.4: 4.3: 4.3: 3.11 3.0: 2.9: 2.9t (0.9) (0.9) (0.9) (0.9) (0.9) (0.9) (0.9) (0.9)
Born before 1980 -0.3 -0.4 -0.4 -0.4 -0.4 -0.4 -0.5 -0.5 (0.7) (0.7) (0.7) (0.7) (0.7) (0.7) (0.7) (0.7)
Free lunch - 10.0t - 10.0o -10.0t - 10.0: -12.9: -12.9: - 13.0: -13.0t (0.7) (0.7) (0.7) (0.7) (0.7) (0.7) (0.7) (0.7)
Teacher experience -- 0.32t 0.32t - 0.10 0.11 (0.16) (0.16) (0.15) (0.15)
Teacher experience squared - - -.01t -.01t - .004 -.004
(.005) (.005) (.005) (.005) Graduate degree - - -0.7 -0.7 - 1.5* 1.5*
(0.9) (0.9) (0.9) (0.9) Merit pay - - 2.5 2.5 -2.2 2.2
(1.6) (1.6) (1.8) (1.8) Percentage of classmates
on free lunch - - 1.4 1.5 - -5.4 -5.4 (3.7) (3.7) (3.8) (3.8)
Percentage of classmates in kindergarten - - 0.9 0.9 -1.1 1.1
(3.2) (3.3) (3.4) (3.4) Percentage of classmates
black - - -6.0 -6.0 - - - 14.9t - 14.8t (6.6) (6.6) (7.1) (7.0)
Percentage of classmates female - - 0.2 0.2 - -0.6 -0.7
(4.5) (4.6) (4.7) (4.7)
R2 .1729 .1729 .1746 .1746 .1867 .1867 .1896 .1896 Sample size 8,310 8,310 8,310 8,310 7,645 7,645 7,645 7,645
Notes: Robust standard errors are reported in parentheses. All models include grade fixed effects and the interactions of fixed effects for the entry school and entry wave. * Statistically significant at 10% level. t Statistically significant at 5% level. t Statistically significant at 1% level.
the percentage who attended kindergarten.22 The matrix X includes class-specific variables such an assignment to an own-race teacher and assignment to a small class.23 In the long form of this model, X also includes other class-specific measures: the number of years of teaching experience, its square, and binary indicators for whether the teacher has a graduate degree and for whether the teacher is in the merit pay program. The impact of introducing these controls is of particular interest in that it could suggest whether the observed effects of teacher race simply reflect the system- atic racial differences in the background of teachers. As noted earlier, because there is classroom-specific variation in class size and other unobserved determinants, classroom- specific heteroskedasticity is accommodated in this model through the use of Huber-White standard errors.
Tables 4 and 5 present the OLS and 2SLS estimates of the
22 This last measure is subject to measurement error, in that we only know kindergarten attendance for those who were in the experiment at that time.
23 Most of the results presented here are based on race-specific models, so assignment to an own-race teacher varies at the classroom level. However, in models based on pooled data from black and white students, assignment to an own-race teacher varies at the individual level, because it reflects the interaction of a student and a teacher trait.
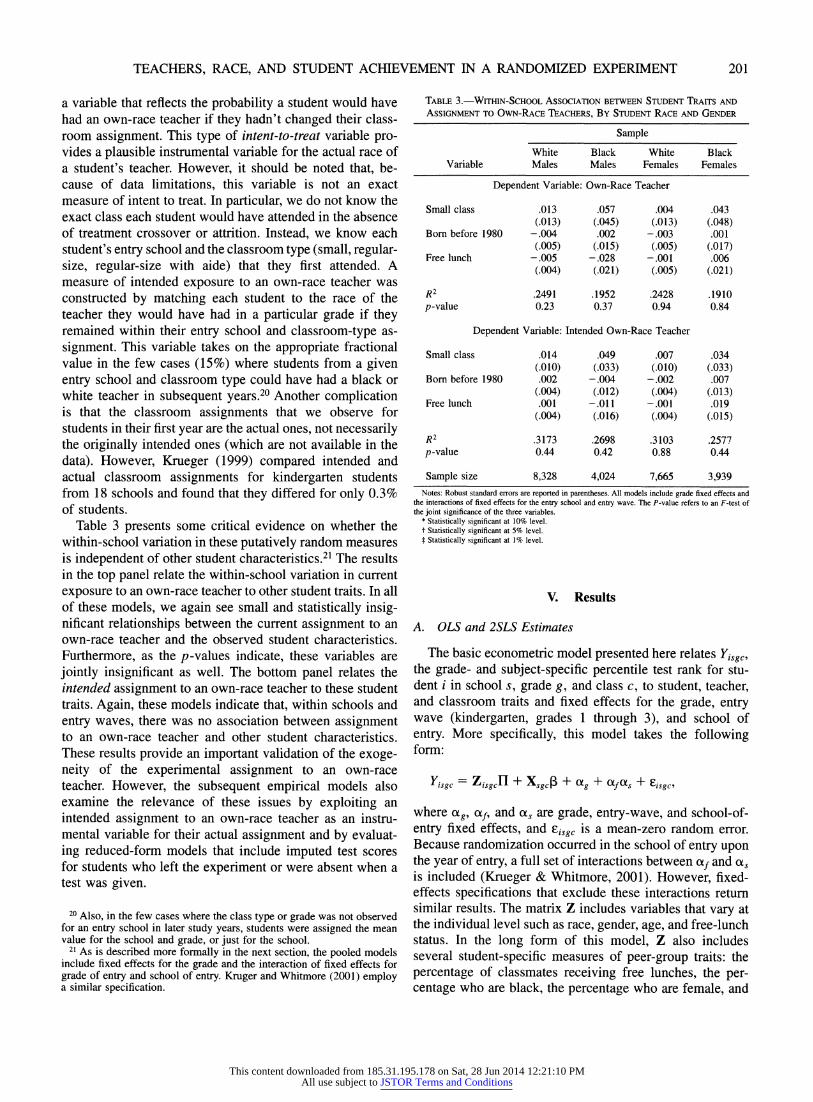
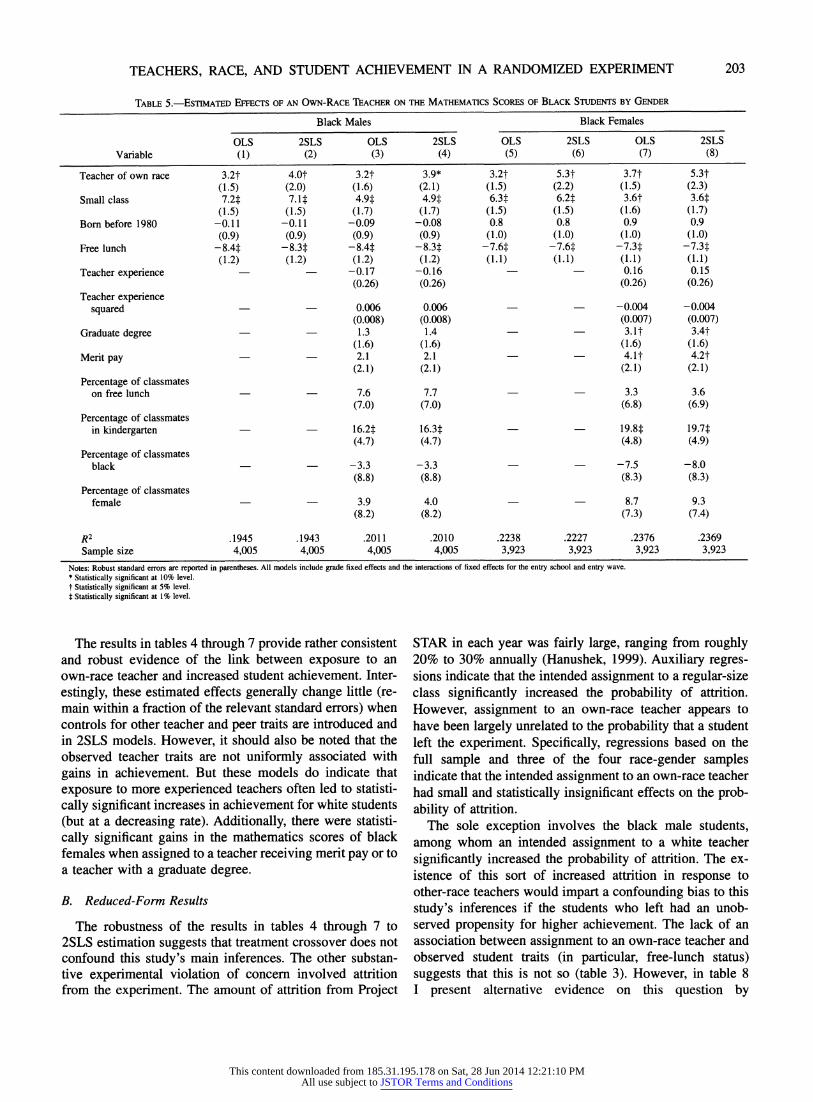
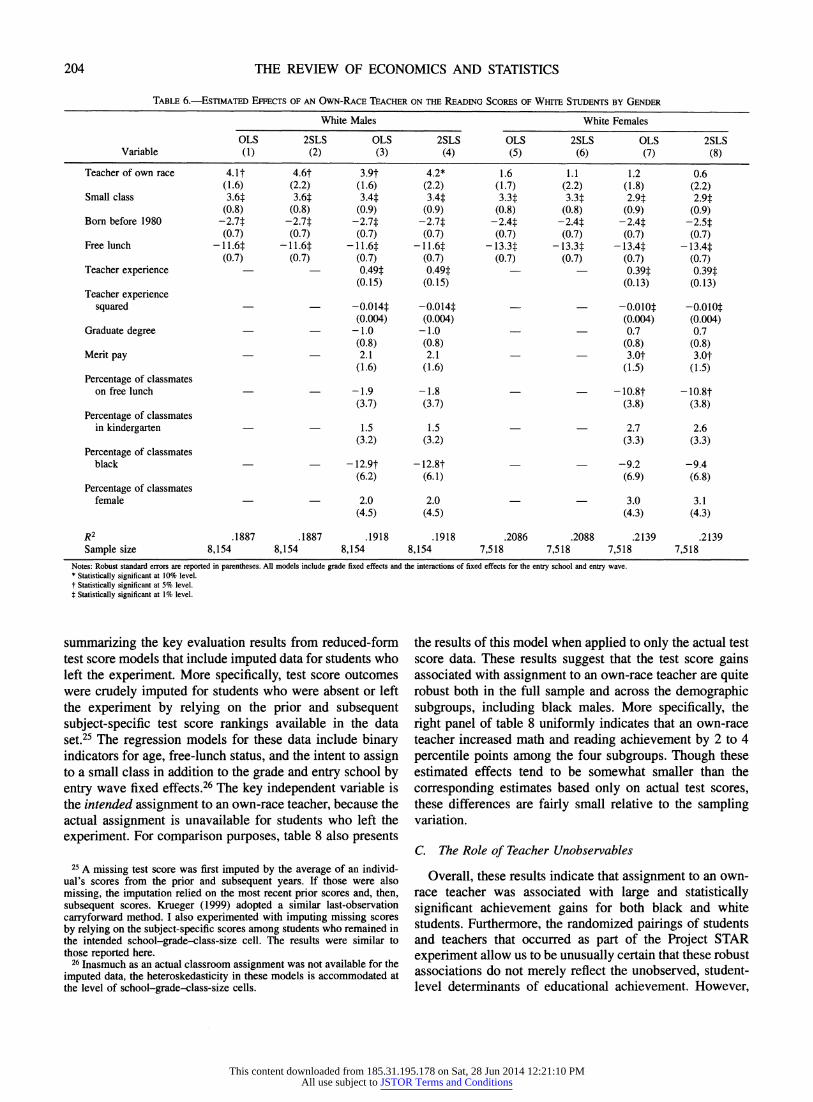
effect of current exposure to an own-race teacher on math scores in models broken out by the race and gender of the students.24 The results in table 4, which are for white males and females, indicate that assignment to an own-race teacher is associated with a statistically significant 4- to 5-percentile-point increase in math scores. These results are quite robust to 2SLS estimation and to the introduction of the other teacher variables. The results in table 5 document similarly robust and statistically precise effects in models of the math scores of black students, male and female.
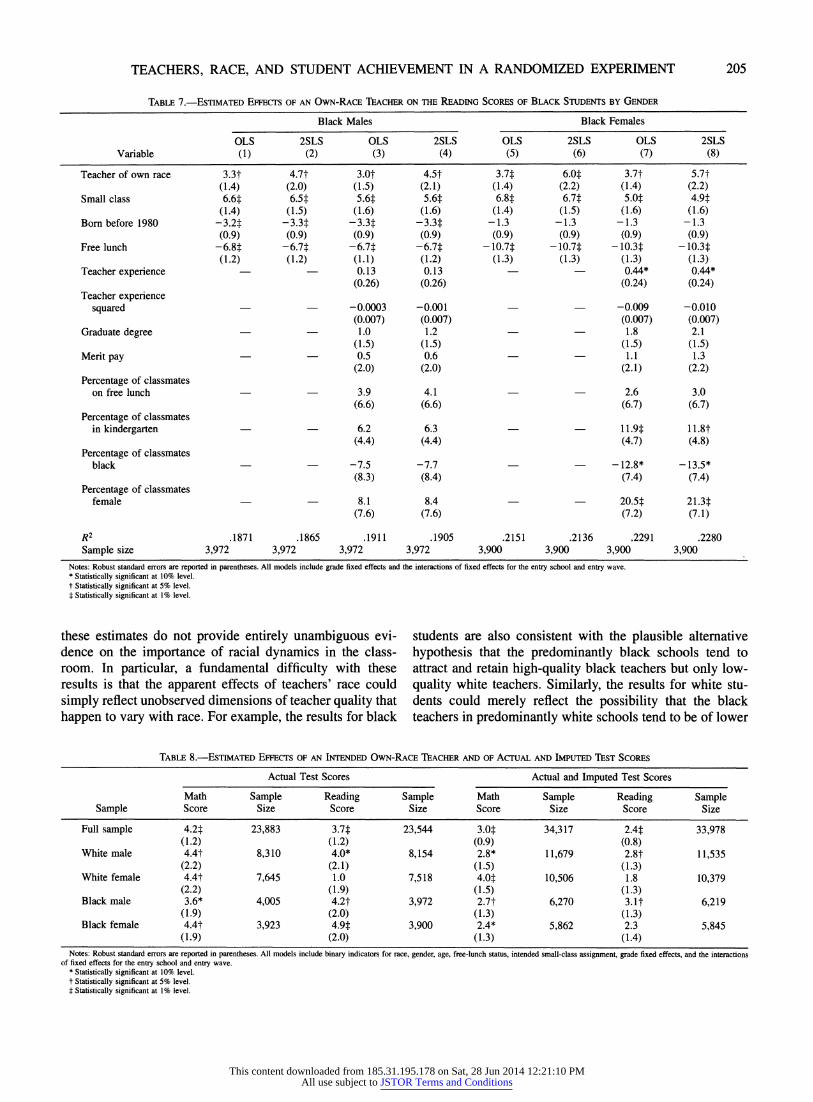
Tables 6 and 7 present the results of similar evaluations for reading scores. For white and black males and black females, assignment to an own-race teacher is associated with a statistically significant 3- to 6-percentile-point in- crease in reading scores. For white females, these effects are positive but not statistically distinguishable from 0.
24 The first-stage effect of an intended assignment to an own-race teacher is not reported. But, not surprisingly, the marginal effect of an intended assignment is quite large and statistically significant. The first-stage coefficient is typically around 0.9, and approximately 20 times larger than its standard error. Because the model is just identified, the orthogonality of this instrumental variable cannot be tested formally. However, the evi- dence of randomized assignments in table 3 suggests its reliability.
202
This content downloaded from 185.31.195.178 on Sat, 28 Jun 2014 12:21:10 PMAll use subject to JSTOR Terms and Conditions
TEACHERS, RACE, AND STUDENT ACHIEVEMENT IN A RANDOMIZED EXPERIMENT
TABLE 5.-ESTIMATED EFFECTS OF AN OWN-RACE TEACHER ON THE MATHEMATICS SCORES OF BLACK STUDENTS BY GENDER
Black Males Black Females
OLS 2SLS OLS 2SLS OLS 2SLS OLS 2SLS Variable (1) (2) (3) (4) (5) (6) (7) (8)
Teacher of own race 3.2t 4.0t 3.2t 3.9* 3.2t 5.3t 3.7t 5.3t (1.5) (2.0) (1.6) (2.1) (1.5) (2.2) (1.5) (2.3)
Small class 7.21 7.11 4.91 4.91 6.3t 6.2: 3.6t 3.6t (1.5) (1.5) (1.7) (1.7) (1.5) (1.5) (1.6) (1.7)
Born before 1980 -0.11 -0.11 -0.09 -0.08 0.8 0.8 0.9 0.9 (0.9) (0.9) (0.9) (0.9) (1.0) (1.0) (1.0) (1.0)
Free lunch -8.4t -8.3: -8.4t -8.3t -7.6: -7.6t -7.3: -7.3t (1.2) (1.2) (1.2) (1.2) (1.1) (1.1) (1.1) (1.1)
Teacher experience -0.17 -0.16 -- 0.16 0.15 (0.26) (0.26) (0.26) (0.26)
Teacher experience squared 0.006 0.006 - -0.004 -0.004
(0.008) (0.008) (0.007) (0.007) Graduate degree -1.3 1.4 - -3. t 3.4t
(1.6) (1.6) (1.6) (1.6) Merit pay -2.1 2.1 - -4.1t 4.2t
(2.1) (2.1) (2.1) (2.1) Percentage of classmates
on free lunch 7.6 7.7 - -3.3 3.6 (7.0) (7.0) (6.8) (6.9)
Percentage of classmates in kindergarten 16.2t 16.3 - 19.8t 19.7:
(4.7) (4.7) (4.8) (4.9) Percentage of classmates
black -3.3 -3.3 - - -7.5 -8.0 (8.8) (8.8) (8.3) (8.3)
Percentage of classmates female - 3.9 4.0 -- 8.7 9.3
(8.2) (8.2) (7.3) (7.4)
R2 .1945 .1943 .2011 .2010 .2238 .2227 .2376 .2369
Sample size 4,005 4,005 4,005 4,005 3,923 3,923 3,923 3,923
Notes: Robust standard errors are reported in parentheses. All models include grade fixed effects and the interactions of fixed effects for the entry school and entry wave. * Statistically significant at 10% level. t Statistically significant at 5% level. $ Statistically significant at 1% level.
The results in tables 4 through 7 provide rather consistent and robust evidence of the link between exposure to an own-race teacher and increased student achievement. Inter- estingly, these estimated effects generally change little (re- main within a fraction of the relevant standard errors) when controls for other teacher and peer traits are introduced and in 2SLS models. However, it should also be noted that the observed teacher traits are not uniformly associated with gains in achievement. But these models do indicate that exposure to more experienced teachers often led to statisti- cally significant increases in achievement for white students (but at a decreasing rate). Additionally, there were statisti- cally significant gains in the mathematics scores of black females when assigned to a teacher receiving merit pay or to a teacher with a graduate degree.
B. Reduced-Form Results
The robustness of the results in tables 4 through 7 to 2SLS estimation suggests that treatment crossover does not confound this study's main inferences. The other substan- tive experimental violation of concern involved attrition from the experiment. The amount of attrition from Project
STAR in each year was fairly large, ranging from roughly 20% to 30% annually (Hanushek, 1999). Auxiliary regres- sions indicate that the intended assignment to a regular-size class significantly increased the probability of attrition. However, assignment to an own-race teacher appears to have been largely unrelated to the probability that a student left the experiment. Specifically, regressions based on the full sample and three of the four race-gender samples indicate that the intended assignment to an own-race teacher had small and statistically insignificant effects on the prob- ability of attrition.
The sole exception involves the black male students, among whom an intended assignment to a white teacher significantly increased the probability of attrition. The ex- istence of this sort of increased attrition in response to other-race teachers would impart a confounding bias to this study's inferences if the students who left had an unob- served propensity for higher achievement. The lack of an association between assignment to an own-race teacher and observed student traits (in particular, free-lunch status) suggests that this is not so (table 3). However, in table 8 I present alternative evidence on this question by
203
This content downloaded from 185.31.195.178 on Sat, 28 Jun 2014 12:21:10 PMAll use subject to JSTOR Terms and Conditions
THE REVIEW OF ECONOMICS AND STATISTICS
TABLE 6.-ESTIMATED EFFECTS OF AN OWN-RACE TEACHER ON THE READING SCORES OF WHITE STUDENTS BY GENDER
White Males White Females
OLS 2SLS OLS 2SLS OLS 2SLS OLS 2SLS Variable (1) (2) (3) (4) (5) (6) (7) (8)
Teacher of own race 4.1t 4.6t 3.9t 4.2* 1.6 1.1 1.2 0.6 (1.6) (2.2) (1.6) (2.2) (1.7) (2.2) (1.8) (2.2)
Small class 3.6t 3.6: 3.4: 3.4: 3.3: 3.3: 2.9: 2.9: (0.8) (0.8) (0.9) (0.9) (0.8) (0.8) (0.9) (0.9)
Born before 1980 -2.7t -2.7: -2.7t -2.7t -2.4: -2.4t -2.4: -2.5: (0.7) (0.7) (0.7) (0.7) (0.7) (0.7) (0.7) (0.7)
Free lunch -11.6: -11.6-1 -11.6: -.6 -13.3: -13.31 -13.4: -13.4: (0.7) (0.7) (0.7) (0.7) (0.7) (0.7) (0.7) (0.7)
Teacher experience - - 0.49 0.49 - 0.39: 0.39: (0.15) (0.15) (0.13) (0.13)
Teacher experience squared - - -0.014t -0.014 - - -0.0101 -0.010:
(0.004) (0.004) (0.004) (0.004) Graduate degree - - 1.0 -1.0 - -0.7 0.7
(0.8) (0.8) (0.8) (0.8) Merit pay - - 2.1 2.1 - -3.0t 3.0t
(1.6) (1.6) (1.5) (1.5) Percentage of classmates
on free lunch - 1.9 -1.8 - - -10.8t -10.8t (3.7) (3.7) (3.8) (3.8)
Percentage of classmates in kindergarten - - 1.5 1.5 - -2.7 2.6
(3.2) (3.2) (3.3) (3.3) Percentage of classmates
black - - -12.9t -12.8t - - -9.2 -9.4 (6.2) (6.1) (6.9) (6.8)
Percentage of classmates female - - 2.0 2.0 -- 3.0 3.1
(4.5) (4.5) (4.3) (4.3)
R2 .1887 .1887 .1918 .1918 .2086 .2088 .2139 .2139 Sample size 8,154 8,154 8,154 8,154 7,518 7,518 7,518 7,518
Notes: Robust standard errors are reported in parentheses. All models include grade fixed effects and the interactions of fixed effects for the entry school and entry wave. * Statistically significant at 10% level. t Statistically significant at 5% level. t Statistically significant at 1% level.
summarizing the key evaluation results from reduced-form test score models that include imputed data for students who left the experiment. More specifically, test score outcomes were crudely imputed for students who were absent or left the experiment by relying on the prior and subsequent subject-specific test score rankings available in the data set.25 The regression models for these data include binary indicators for age, free-lunch status, and the intent to assign to a small class in addition to the grade and entry school by entry wave fixed effects.26 The key independent variable is the intended assignment to an own-race teacher, because the actual assignment is unavailable for students who left the experiment. For comparison purposes, table 8 also presents
25 A missing test score was first imputed by the average of an individ- ual's scores from the prior and subsequent years. If those were also missing, the imputation relied on the most recent prior scores and, then, subsequent scores. Krueger (1999) adopted a similar last-observation carryforward method. I also experimented with imputing missing scores by relying on the subject-specific scores among students who remained in the intended school-grade-class-size cell. The results were similar to those reported here.
26 Inasmuch as an actual classroom assignment was not available for the imputed data, the heteroskedasticity in these models is accommodated at the level of school-grade-class-size cells.
the results of this model when applied to only the actual test score data. These results suggest that the test score gains associated with assignment to an own-race teacher are quite robust both in the full sample and across the demographic subgroups, including black males. More specifically, the right panel of table 8 uniformly indicates that an own-race teacher increased math and reading achievement by 2 to 4 percentile points among the four subgroups. Though these estimated effects tend to be somewhat smaller than the corresponding estimates based only on actual test scores, these differences are fairly small relative to the sampling variation.
C. The Role of Teacher Unobservables
Overall, these results indicate that assignment to an own- race teacher was associated with large and statistically significant achievement gains for both black and white students. Furthermore, the randomized pairings of students and teachers that occurred as part of the Project STAR experiment allow us to be unusually certain that these robust associations do not merely reflect the unobserved, student- level determinants of educational achievement. However,
204
This content downloaded from 185.31.195.178 on Sat, 28 Jun 2014 12:21:10 PMAll use subject to JSTOR Terms and Conditions
TEACHERS, RACE, AND STUDENT ACHIEVEMENT IN A RANDOMIZED EXPERIMENT 205
TABLE 7.-ESTIMATED EFFECTS OF AN OWN-RACE TEACHER ON THE READING SCORES OF BLACK STUDENTS BY GENDER
Black Males Black Females
OLS 2SLS OLS 2SLS OLS 2SLS OLS 2SLS Variable (1) (2) (3) (4) (5) (6) (7) (8)
Teacher of own race 3.3t 4.7t 3.0t 4.5t 3.7: 6.01 3.7t 5.7t (1.4) (2.0) (1.5) (2.1) (1.4) (2.2) (1.4) (2.2)
Small class 6.61 6.5: 5.61 5.6: 6.8t 6.71 5.01 4.9: (1.4) (1.5) (1.6) (1.6) (1.4) (1.5) (1.6) (1.6)
Born before 1980 -3.21 -3.31 -3.31 -3.31 -1.3 -1.3 -1.3 -1.3 (0.9) (0.9) (0.9) (0.9) (0.9) (0.9) (0.9) (0.9)
Free lunch -6.81 -6.7: -6.7t -6.71 -10.71 -10.71 -10.3t -10.3: (1.2) (1.2) (1.1) (1.2) (1.3) (1.3) (1.3) (1.3)
Teacher experience - - 0.13 0.13 - -0.44* 0.44* (0.26) (0.26) (0.24) (0.24)
Teacher experience squared - - -0.0003 -0.001 - -0.009 -0.010
(0.007) (0.007) (0.007) (0.007) Graduate degree - -1.0 1.2 - -1.8 2.1
(1.5) (1.5) (1.5) (1.5) Merit pay - - 0.5 0.6 - -1.1 1.3
(2.0) (2.0) (2.1) (2.2) Percentage of classmates
on free lunch - - 3.9 4.1 - - 2.6 3.0 (6.6) (6.6) (6.7) (6.7)
Percentage of classmates in kindergarten - - 6.2 6.3 - - 11.91 11.8t
(4.4) (4.4) (4.7) (4.8) Percentage of classmates
black -- -7.5 -7.7 - - -12.8* -13.5* (8.3) (8.4) (7.4) (7.4)
Percentage of classmates female - - 8.1 8.4 - - 20.5t 21.3t
(7.6) (7.6) (7.2) (7.1)
R2 .1871 .1865 .1911 .1905 .2151 .2136 .2291 .2280 Sample size 3,972 3,972 3,972 3,972 3,900 3,900 3,900 3,900
Notes: Robust standard errors are reported in parentheses. All models include grade fixed effects and the interactions of fixed effects for the entry school and entry wave. * Statistically significant at 10% level. t Statistically significant at 5% level. t Statistically significant at 1% level.
these estimates do not provide entirely unambiguous evi- students are also consistent with the plausible alternative dence on the importance of racial dynamics in the class- hypothesis that the predominantly black schools tend to room. In particular, a fundamental difficulty with these attract and retain high-quality black teachers but only low- results is that the apparent effects of teachers' race could quality white teachers. Similarly, the results for white stu- simply reflect unobserved dimensions of teacher quality that dents could merely reflect the possibility that the black happen to vary with race. For example, the results for black teachers in predominantly white schools tend to be of lower
TABLE 8.-ESTIMATED EFFECTS OF AN INTENDED OWN-RACE TEACHER AND OF ACTUAL AND IMPUTED TEST SCORES
Actual Test Scores Actual and Imputed Test Scores
Math Sample Reading Sample Math Sample Reading Sample Sample Score Size Score Size Score Size Score Size
Full sample 4.21 23,883 3.7t 23,544 3.0: 34,317 2.4t 33,978 (1.2) (1.2) (0.9) (0.8)
White male 4.4t 8,310 4.0* 8,154 2.8* 11,679 2.8t 11,535 (2.2) (2.1) (1.5) (1.3)
White female 4.4t 7,645 1.0 7,518 4.0f 10,506 1.8 10,379 (2.2) (1.9) (1.5) (1.3)
Black male 3.6* 4,005 4.2t 3,972 2.7t 6,270 3.1t 6,219 (1.9) (2.0) (1.3) (1.3)
Black female 4.4t 3,923 4.9: 3,900 2.4* 5,862 2.3 5,845 (1.9) (2.0) (1.3) (1.4)
Notes: Robust standard errors are reported in parentheses. All models include binary indicators for race, gender, age, free-lunch status, intended small-class assignment, grade fixed effects, and the interactions of fixed effects for the entry school and entry wave.
* Statistically significant at 10% level. t Statistically significant at 5% level. t Statistically significant at 1% level.
This content downloaded from 185.31.195.178 on Sat, 28 Jun 2014 12:21:10 PMAll use subject to JSTOR Terms and Conditions
THE REVIEW OF ECONOMICS AND STATISTICS
TABLE 9.-ESTIMATED EFFECTS OF AN OWN-RACE TEACHER ON MATHEMATICS AND READING SCORES, WITH AND WITHOUT CLASSROOM FIXED EFFECTS
Math Score Reading Score (n = 23,883) (n = 23,544)
Variable (1) (2) (3) (4)
Teacher of own race 3.8t 3.1t 3.1t 1.6* (1.0) (0.9) (0.9) (0.9)
Black student -8.8t -8.9t -5.0t -5.6t (1.0) (1.0) (0.9) (1.0)
Female student 1.2t 1.1 5.7t 5.3t (0.4) (0.3) (0.4) (0.3)
Born before 1980 -0.2 -0.2 -2.6t -2.8t (0.4) (0.4) (0.4) (0.4)
Free lunch -10.6t - 10.5 -11.7t -1 1.5t (0.4) (0.4) (0.4) (0.4)
R2 .2118 .3835 .2449 .3805 Classroom fixed effects No Yes No Yes
Notes: Robust standard errors are reported in parentheses. All models include the interactions of fixed effects for the entry school and entry wave. Models (1) and (3) also include grade fixed effects and the controls for peer, class, and teacher traits.
* Statistically significant at 10% level. t Statistically significant at 5% level. t Statistically significant at 1% level.
quality. Furthermore, given the sharp racial segregation of students across most of these schools, it is also possible that both types of bias (relatively low-quality white teachers in black schools and relatively low-quality black teachers in white schools) occurred simultaneously.
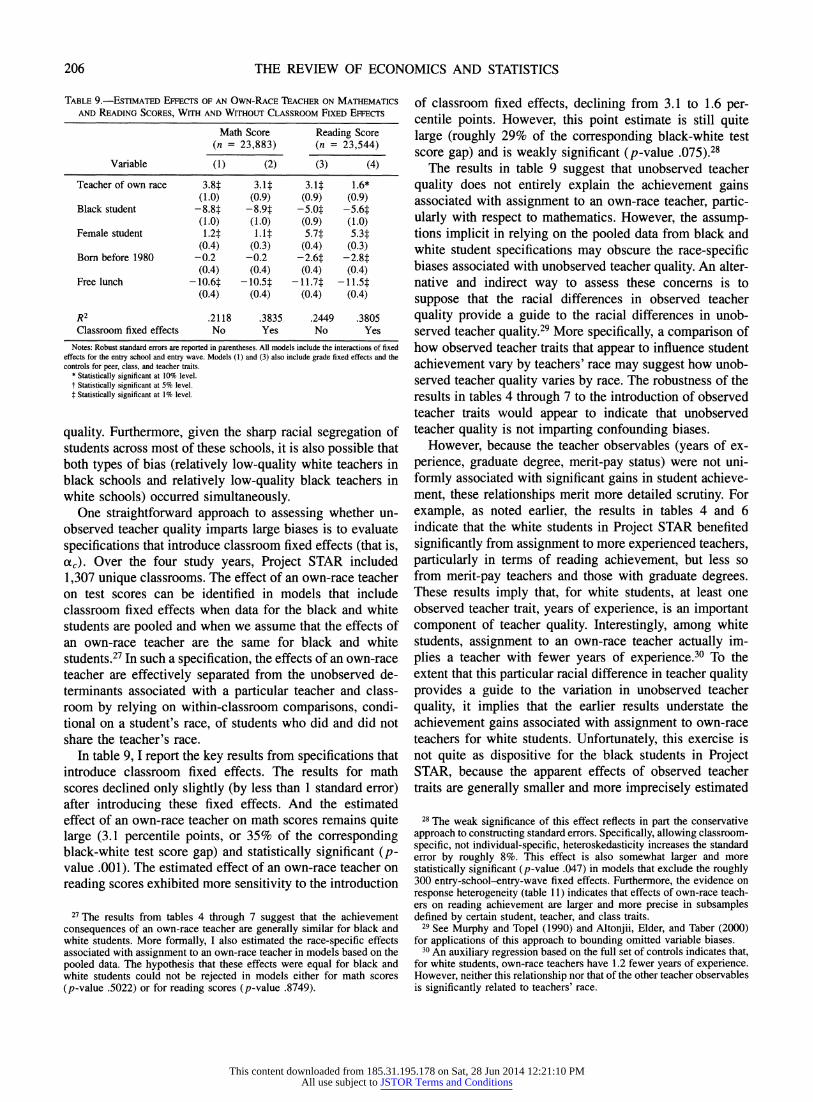
One straightforward approach to assessing whether un- observed teacher quality imparts large biases is to evaluate specifications that introduce classroom fixed effects (that is, ac). Over the four study years, Project STAR included 1,307 unique classrooms. The effect of an own-race teacher on test scores can be identified in models that include classroom fixed effects when data for the black and white students are pooled and when we assume that the effects of an own-race teacher are the same for black and white students.27 In such a specification, the effects of an own-race teacher are effectively separated from the unobserved de- terminants associated with a particular teacher and class- room by relying on within-classroom comparisons, condi- tional on a student's race, of students who did and did not share the teacher's race.
In table 9, I report the key results from specifications that introduce classroom fixed effects. The results for math scores declined only slightly (by less than 1 standard error) after introducing these fixed effects. And the estimated effect of an own-race teacher on math scores remains quite large (3.1 percentile points, or 35% of the corresponding black-white test score gap) and statistically significant (p- value .001). The estimated effect of an own-race teacher on reading scores exhibited more sensitivity to the introduction
27 The results from tables 4 through 7 suggest that the achievement consequences of an own-race teacher are generally similar for black and white students. More formally, I also estimated the race-specific effects associated with assignment to an own-race teacher in models based on the pooled data. The hypothesis that these effects were equal for black and white students could not be rejected in models either for math scores (p-value .5022) or for reading scores (p-value .8749).
of classroom fixed effects, declining from 3.1 to 1.6 per- centile points. However, this point estimate is still quite large (roughly 29% of the corresponding black-white test score gap) and is weakly significant (p-value .075).28
The results in table 9 suggest that unobserved teacher quality does not entirely explain the achievement gains associated with assignment to an own-race teacher, partic- ularly with respect to mathematics. However, the assump- tions implicit in relying on the pooled data from black and white student specifications may obscure the race-specific biases associated with unobserved teacher quality. An alter- native and indirect way to assess these concerns is to suppose that the racial differences in observed teacher quality provide a guide to the racial differences in unob- served teacher quality.29 More specifically, a comparison of how observed teacher traits that appear to influence student achievement vary by teachers' race may suggest how unob- served teacher quality varies by race. The robustness of the results in tables 4 through 7 to the introduction of observed teacher traits would appear to indicate that unobserved teacher quality is not imparting confounding biases.
However, because the teacher observables (years of ex- perience, graduate degree, merit-pay status) were not uni- formly associated with significant gains in student achieve- ment, these relationships merit more detailed scrutiny. For example, as noted earlier, the results in tables 4 and 6 indicate that the white students in Project STAR benefited significantly from assignment to more experienced teachers, particularly in terms of reading achievement, but less so from merit-pay teachers and those with graduate degrees. These results imply that, for white students, at least one observed teacher trait, years of experience, is an important component of teacher quality. Interestingly, among white students, assignment to an own-race teacher actually im-
plies a teacher with fewer years of experience.30 To the extent that this particular racial difference in teacher quality provides a guide to the variation in unobserved teacher quality, it implies that the earlier results understate the achievement gains associated with assignment to own-race teachers for white students. Unfortunately, this exercise is not quite as dispositive for the black students in Project STAR, because the apparent effects of observed teacher traits are generally smaller and more imprecisely estimated
28 The weak significance of this effect reflects in part the conservative approach to constructing standard errors. Specifically, allowing classroom- specific, not individual-specific, heteroskedasticity increases the standard error by roughly 8%. This effect is also somewhat larger and more statistically significant (p-value .047) in models that exclude the roughly 300 entry-school-entry-wave fixed effects. Furthermore, the evidence on response heterogeneity (table 11) indicates that effects of own-race teach- ers on reading achievement are larger and more precise in subsamples defined by certain student, teacher, and class traits.
29 See Murphy and Topel (1990) and Altonjii, Elder, and Taber (2000) for applications of this approach to bounding omitted variable biases.
30 An auxiliary regression based on the full set of controls indicates that, for white students, own-race teachers have 1.2 fewer years of experience. However, neither this relationship nor that of the other teacher observables is significantly related to teachers' race.
206
This content downloaded from 185.31.195.178 on Sat, 28 Jun 2014 12:21:10 PMAll use subject to JSTOR Terms and Conditions
TEACHERS, RACE, AND STUDENT ACHIEVEMENT IN A RANDOMIZED EXPERIMENT
(tables 5 and 7). However, there is evidence that, for black females, assignment to a merit-pay teacher or to a teacher with a graduate degree significantly increased mathematics scores (table 5). And auxiliary regressions indicated that, for black students, assignment to an own-race teacher is actu- ally associated with reduced probabilities of having a teacher with a graduate degree or merit pay. Therefore, like the results for white students, this racial pattern in teacher observables implies that the bias attributable to unobserved teacher quality could be negative.
Another indirect and qualified way to assess the race- specific biases that might be associated with unobserved teacher quality is to consider how the estimated effects associated with own-race teachers vary across particular types of schools. For example, a plausible conjecture is that schools with relatively few disadvantaged students (for example, schools with smaller shares of students receiving free lunches) were more able to recruit teachers of higher and more uniform quality. Similarly, schools whose students are racially homogeneous may only be able to recruit other-race teachers whose unobserved quality is relatively low. If these assumptions are correct, evidence that the apparent effects of own-race teachers are concentrated in schools with more disadvantaged students or in more seg- regated schools would be consistent with the hypothesis that unobserved teacher quality is empirically relevant. How- ever, the existence of this sort of response heterogeneity would not unambiguously suggest the importance of unob- served teacher quality. The achievement gains associated with own-race teachers could be concentrated in more disadvantaged and segregated schools for a number of other plausible reasons. Even so, the extent to which the effects associated with own-race teachers are similar across such schools would point more clearly to the irrelevance of the racial patterns in unobserved teacher quality.
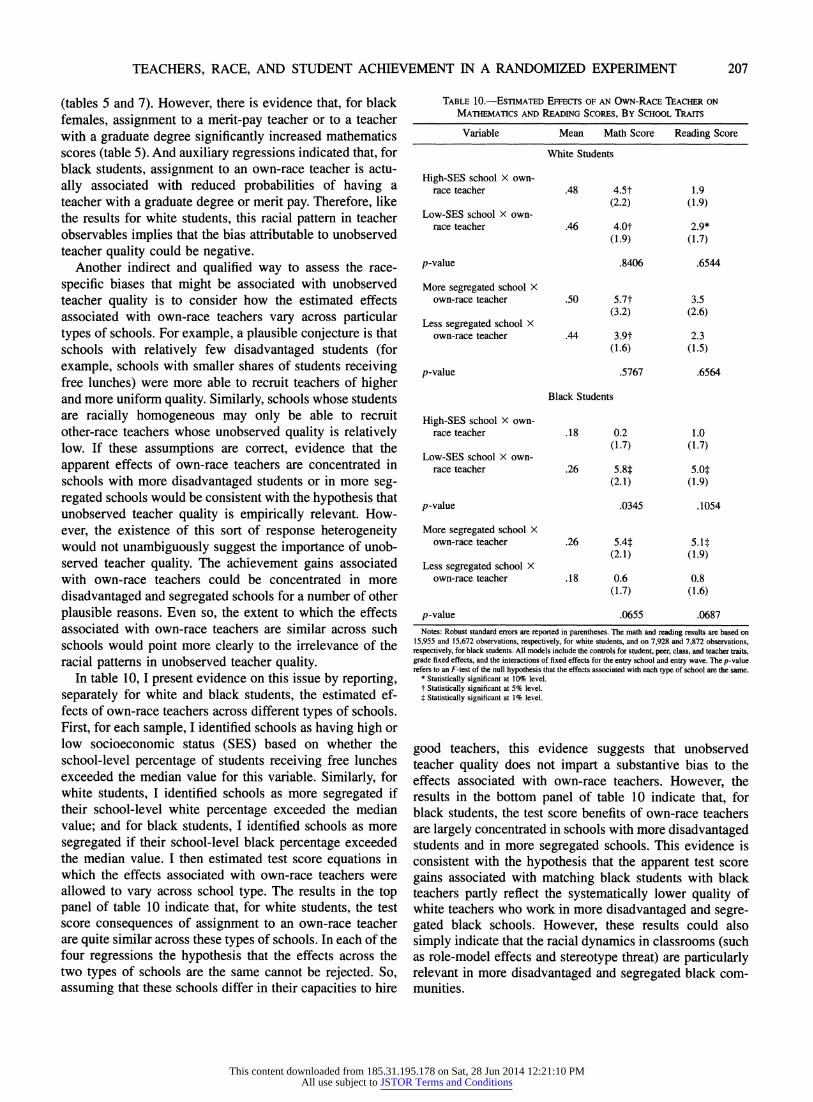
In table 10, I present evidence on this issue by reporting, separately for white and black students, the estimated ef- fects of own-race teachers across different types of schools. First, for each sample, I identified schools as having high or low socioeconomic status (SES) based on whether the school-level percentage of students receiving free lunches exceeded the median value for this variable. Similarly, for white students, I identified schools as more segregated if their school-level white percentage exceeded the median value; and for black students, I identified schools as more segregated if their school-level black percentage exceeded the median value. I then estimated test score equations in which the effects associated with own-race teachers were allowed to vary across school type. The results in the top panel of table 10 indicate that, for white students, the test score consequences of assignment to an own-race teacher are quite similar across these types of schools. In each of the four regressions the hypothesis that the effects across the two types of schools are the same cannot be rejected. So, assuming that these schools differ in their capacities to hire
TABLE 10.-ESTIMATED EFFECTS OF AN OWN-RACE TEACHER ON MATHEMATICS AND READING SCORES, BY SCHOOL TRAITS
Variable Mean Math Score Reading Score
White Students
High-SES school X own- race teacher .48 4.5t 1.9
(2.2) (1.9) Low-SES school x own-
race teacher .46 4.0t 2.9* (1.9) (1.7)
p-value .8406 .6544
More segregated school x own-race teacher .50 5.7t 3.5
(3.2) (2.6) Less segregated school X
own-race teacher .44 3.9t 2.3 (1.6) (1.5)
p-value .5767 .6564
Black Students
High-SES school X own- race teacher .18 0.2 1.0
(1.7) (1.7) Low-SES school X own-
race teacher .26 5.8: 5.0t (2.1) (1.9)
p-value .0345 .1054
More segregated school X own-race teacher .26 5.4: 5.1 $
(2.1) (1.9) Less segregated school X
own-race teacher .18 0.6 0.8 (1.7) (1.6)
p-value .0655 .0687
Notes: Robust standard errors are reported in parentheses. The math and reading results are based on 15,955 and 15,672 observations, respectively, for white students, and on 7,928 and 7,872 observations, respectively, for black students. All models include the controls for student, peer, class, and teacher traits, grade fixed effects, and the interactions of fixed effects for the entry school and entry wave. The p-value refers to an F-test of the null hypothesis that the effects associated with each type of school are the same.
* Statistically significant at 10% level. t Statistically significant at 5% level. t Statistically significant at 1% level.
good teachers, this evidence suggests that unobserved teacher quality does not impart a substantive bias to the effects associated with own-race teachers. However, the results in the bottom panel of table 10 indicate that, for black students, the test score benefits of own-race teachers are largely concentrated in schools with more disadvantaged students and in more segregated schools. This evidence is consistent with the hypothesis that the apparent test score gains associated with matching black students with black teachers partly reflect the systematically lower quality of white teachers who work in more disadvantaged and segre- gated black schools. However, these results could also simply indicate that the racial dynamics in classrooms (such as role-model effects and stereotype threat) are particularly relevant in more disadvantaged and segregated black com- munities.
207
This content downloaded from 185.31.195.178 on Sat, 28 Jun 2014 12:21:10 PMAll use subject to JSTOR Terms and Conditions
THE REVIEW OF ECONOMICS AND STATISTICS
TABLE 11. -ETIMATED EFFECTS OF AN OWN-RACE TACHER ON MATHEMATICS AND READING SCORES, BY CLASS, STUDENT, AND TEACHER TRAITS
Sample Reading Sample Sample Math Score Size Score Size
Full sample 3.1l 23,883 1.6* 23,544 (1.0) (0.9)
Regular-size class 3.6t 16,699 2.0t 16,437 (1.1) (1.0)
Small class 1.1 7,184 0.7 7,107 (1.7) (2.0)
No free lunch 2.8* 12,214 0.9 12,074 (1.4) (1.5)
Free lunch 3.6t 11,669 2.2 11,470 (1.5) (1.4)
Inexperienced teachers 4.5t 12,363 2.2* 12,227 (1.3) (1.2)
Experienced teachers 1.3 11,520 1.0 11,317 (1.3) (1.3)
Graduate degree 2.9* 8,991 1.5 8,855 (1.6) (1.8)
No graduate degree 3.4t 14,892 1.9* 14,689 (1.1) (1.1)
Notes: Robust standard errors are reported in parentheses. All models include the controls for student traits, classroom fixed effects, and the interactions of fixed effects for the entry school and entry wave. Inexperienced teachers are defined as those with 11 or fewer years of experience; experienced teachers have more than 11 years of experience.
* Statistically significant at 10% level. t Statistically significant at 5% level. t Statistically significant at 1% level.
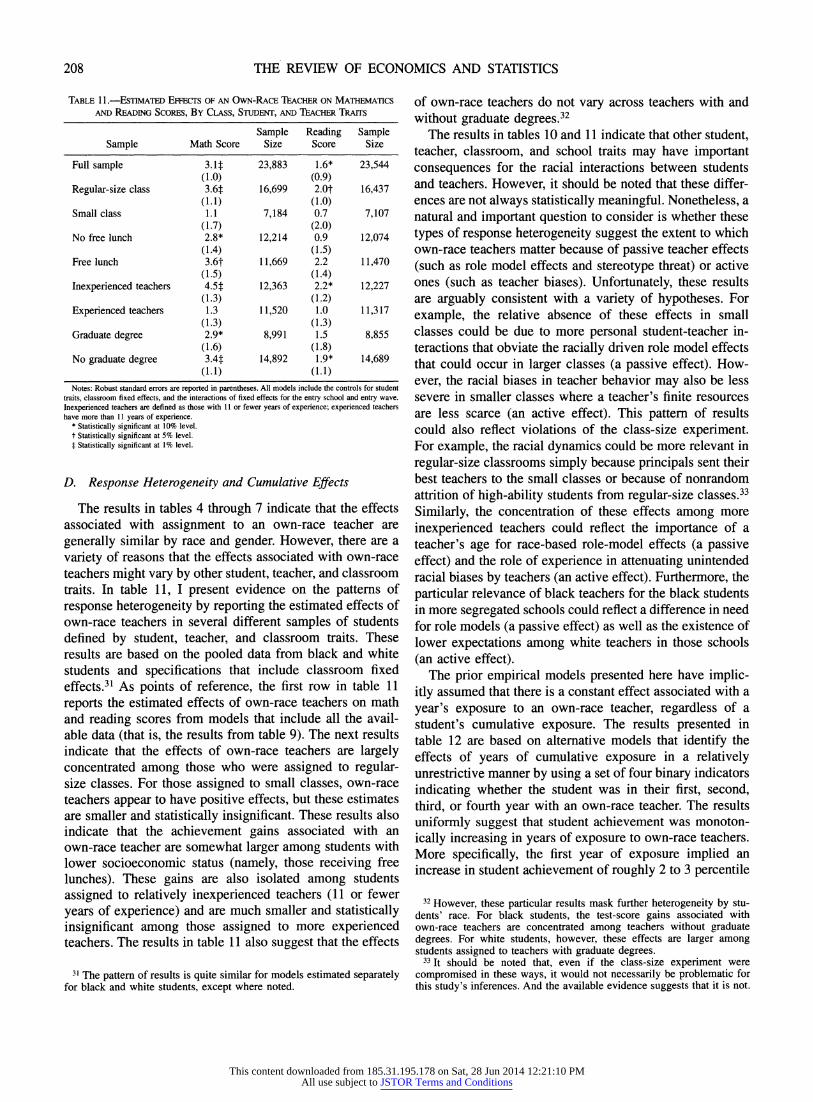
D. Response Heterogeneity and Cumulative Effects
The results in tables 4 through 7 indicate that the effects associated with assignment to an own-race teacher are generally similar by race and gender. However, there are a variety of reasons that the effects associated with own-race teachers might vary by other student, teacher, and classroom traits. In table 11, I present evidence on the patterns of response heterogeneity by reporting the estimated effects of own-race teachers in several different samples of students defined by student, teacher, and classroom traits. These results are based on the pooled data from black and white students and specifications that include classroom fixed effects.31 As points of reference, the first row in table 11 reports the estimated effects of own-race teachers on math and reading scores from models that include all the avail- able data (that is, the results from table 9). The next results indicate that the effects of own-race teachers are largely concentrated among those who were assigned to regular- size classes. For those assigned to small classes, own-race teachers appear to have positive effects, but these estimates are smaller and statistically insignificant. These results also indicate that the achievement gains associated with an own-race teacher are somewhat larger among students with lower socioeconomic status (namely, those receiving free lunches). These gains are also isolated among students assigned to relatively inexperienced teachers (11 or fewer years of experience) and are much smaller and statistically insignificant among those assigned to more experienced teachers. The results in table 11 also suggest that the effects
31 The pattern of results is quite similar for models estimated separately for black and white students, except where noted.
of own-race teachers do not vary across teachers with and without graduate degrees.32
The results in tables 10 and 11 indicate that other student, teacher, classroom, and school traits may have important consequences for the racial interactions between students and teachers. However, it should be noted that these differ- ences are not always statistically meaningful. Nonetheless, a natural and important question to consider is whether these types of response heterogeneity suggest the extent to which own-race teachers matter because of passive teacher effects (such as role model effects and stereotype threat) or active ones (such as teacher biases). Unfortunately, these results are arguably consistent with a variety of hypotheses. For example, the relative absence of these effects in small classes could be due to more personal student-teacher in- teractions that obviate the racially driven role model effects that could occur in larger classes (a passive effect). How- ever, the racial biases in teacher behavior may also be less severe in smaller classes where a teacher's finite resources are less scarce (an active effect). This pattern of results could also reflect violations of the class-size experiment. For example, the racial dynamics could be more relevant in regular-size classrooms simply because principals sent their best teachers to the small classes or because of nonrandom attrition of high-ability students from regular-size classes.33 Similarly, the concentration of these effects among more inexperienced teachers could reflect the importance of a teacher's age for race-based role-model effects (a passive effect) and the role of experience in attenuating unintended racial biases by teachers (an active effect). Furthermore, the particular relevance of black teachers for the black students in more segregated schools could reflect a difference in need for role models (a passive effect) as well as the existence of lower expectations among white teachers in those schools (an active effect).
The prior empirical models presented here have implic- itly assumed that there is a constant effect associated with a year's exposure to an own-race teacher, regardless of a student's cumulative exposure. The results presented in table 12 are based on alternative models that identify the effects of years of cumulative exposure in a relatively unrestrictive manner by using a set of four binary indicators indicating whether the student was in their first, second, third, or fourth year with an own-race teacher. The results uniformly suggest that student achievement was monoton- ically increasing in years of exposure to own-race teachers. More specifically, the first year of exposure implied an increase in student achievement of roughly 2 to 3 percentile
32 However, these particular results mask further heterogeneity by stu- dents' race. For black students, the test-score gains associated with own-race teachers are concentrated among teachers without graduate degrees. For white students, however, these effects are larger among students assigned to teachers with graduate degrees.
33 It should be noted that, even if the class-size experiment were compromised in these ways, it would not necessarily be problematic for this study's inferences. And the available evidence suggests that it is not.
208
This content downloaded from 185.31.195.178 on Sat, 28 Jun 2014 12:21:10 PMAll use subject to JSTOR Terms and Conditions
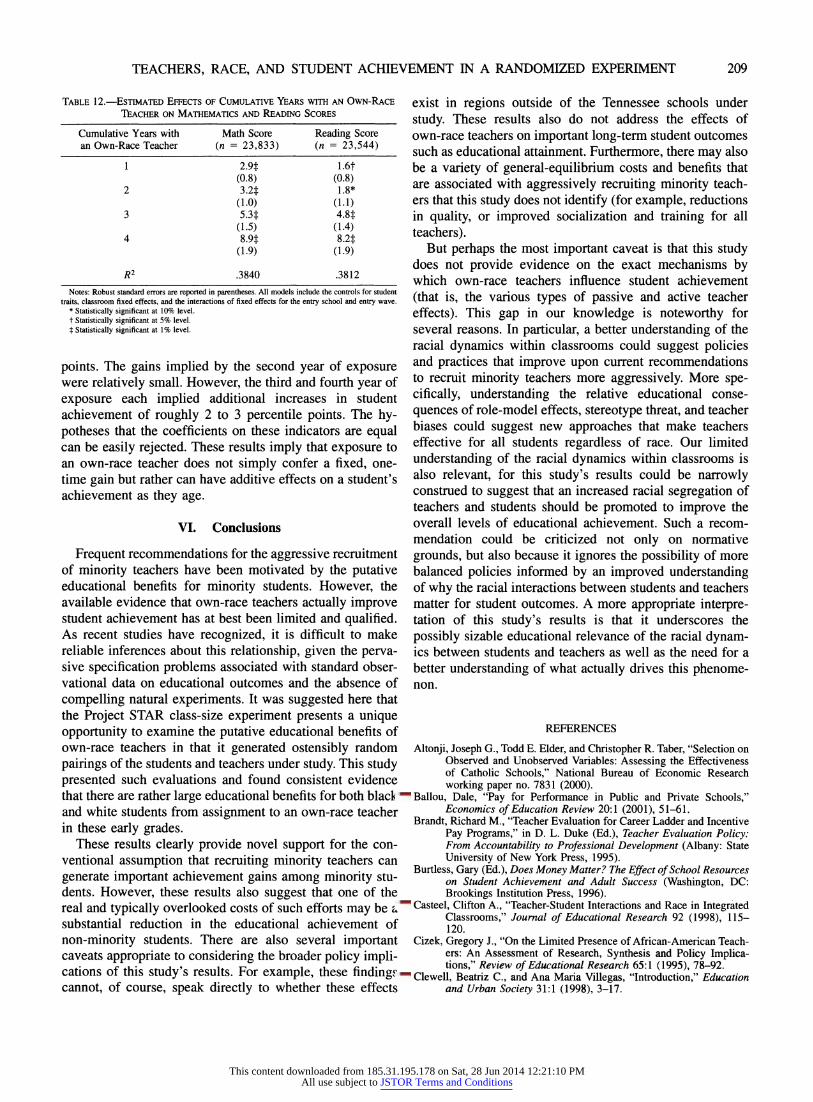
TEACHERS, RACE, AND STUDENT ACHIEVEMENT IN A RANDOMIZED EXPERIMENT
TABLE 12.-ESTIMATED EFFECTS OF CUMULATIVE YEARS WITH AN OWN-RACE TEACHER ON MATHEMATICS AND READING SCORES
Cumulative Years with Math Score Reading Score an Own-Race Teacher (n = 23,833) (n = 23,544)
1 2.9t 1.6t (0.8) (0.8)
2 3.21 1.8* (1.0) (1.1)
3 5.3t 4.8t (1.5) (1.4)
4 8.9t 8.2t (1.9) (1.9)
R2 .3840 .3812
Notes: Robust standard errors are reported in parentheses. All models include the controls for student traits, classroom fixed effects, and the interactions of fixed effects for the entry school and entry wave.
* Statistically significant at 10% level. t Statistically significant at 5% level. $ Statistically significant at 1% level.
points. The gains implied by the second year of exposure were relatively small. However, the third and fourth year of exposure each implied additional increases in student achievement of roughly 2 to 3 percentile points. The hy- potheses that the coefficients on these indicators are equal can be easily rejected. These results imply that exposure to an own-race teacher does not simply confer a fixed, one- time gain but rather can have additive effects on a student's achievement as they age.
VI. Conclusions
Frequent recommendations for the aggressive recruitment of minority teachers have been motivated by the putative educational benefits for minority students. However, the available evidence that own-race teachers actually improve student achievement has at best been limited and qualified. As recent studies have recognized, it is difficult to make reliable inferences about this relationship, given the perva- sive specification problems associated with standard obser- vational data on educational outcomes and the absence of compelling natural experiments. It was suggested here that the Project STAR class-size experiment presents a unique opportunity to examine the putative educational benefits of own-race teachers in that it generated ostensibly random pairings of the students and teachers under study. This study presented such evaluations and found consistent evidence that there are rather large educational benefits for both black and white students from assignment to an own-race teacher in these early grades.
These results clearly provide novel support for the con- ventional assumption that recruiting minority teachers can generate important achievement gains among minority stu- dents. However, these results also suggest that one of the real and typically overlooked costs of such efforts may be a substantial reduction in the educational achievement of non-minority students. There are also several important caveats appropriate to considering the broader policy impli- cations of this study's results. For example, these findings
exist in regions outside of the Tennessee schools under study. These results also do not address the effects of own-race teachers on important long-term student outcomes such as educational attainment. Furthermore, there may also be a variety of general-equilibrium costs and benefits that are associated with aggressively recruiting minority teach- ers that this study does not identify (for example, reductions in quality, or improved socialization and training for all teachers).
But perhaps the most important caveat is that this study does not provide evidence on the exact mechanisms by which own-race teachers influence student achievement (that is, the various types of passive and active teacher effects). This gap in our knowledge is noteworthy for several reasons. In particular, a better understanding of the racial dynamics within classrooms could suggest policies and practices that improve upon current recommendations to recruit minority teachers more aggressively. More spe- cifically, understanding the relative educational conse- quences of role-model effects, stereotype threat, and teacher biases could suggest new approaches that make teachers effective for all students regardless of race. Our limited understanding of the racial dynamics within classrooms is also relevant, for this study's results could be narrowly construed to suggest that an increased racial segregation of teachers and students should be promoted to improve the overall levels of educational achievement. Such a recom- mendation could be criticized not only on normative grounds, but also because it ignores the possibility of more balanced policies informed by an improved understanding of why the racial interactions between students and teachers matter for student outcomes. A more appropriate interpre- tation of this study's results is that it underscores the possibly sizable educational relevance of the racial dynam- ics between students and teachers as well as the need for a better understanding of what actually drives this phenome- non.
REFERENCES
Altonji, Joseph G., Todd E. Elder, and Christopher R. Taber, "Selection on Observed and Unobserved Variables: Assessing the Effectiveness of Catholic Schools," National Bureau of Economic Research working paper no. 7831 (2000).
Ballou, Dale, "Pay for Performance in Public and Private Schools," Economics of Education Review 20:1 (2001), 51-61.
Brandt, Richard M., "Teacher Evaluation for Career Ladder and Incentive Pay Programs," in D. L. Duke (Ed.), Teacher Evaluation Policy: From Accountability to Professional Development (Albany: State University of New York Press, 1995).
Burtless, Gary (Ed.), Does Money Matter? The Effect of School Resources on Student Achievement and Adult Success (Washington, DC: Brookings Institution Press, 1996).
Casteel, Clifton A., "Teacher-Student Interactions and Race in Integrated Classrooms," Journal of Educational Research 92 (1998), 115- 120.
Cizek, Gregory J., "On the Limited Presence of African-American Teach- ers: An Assessment of Research, Synthesis and Policy Implica- tions," Review of Educational Research 65:1 (1995), 78-92.
Clewell, Beatriz C., and Ana Maria Villegas, "Introduction," Education cannot, of course, speak directly to whether these effects
209
and Urban Society 31:1 (1998), 3-17.
This content downloaded from 185.31.195.178 on Sat, 28 Jun 2014 12:21:10 PMAll use subject to JSTOR Terms and Conditions
THE REVIEW OF ECONOMICS AND STATISTICS
Corcoran, Sean P., William N. Evans, and Robert M. Schwab, "Changing Labor Market Opportunities for Women and the Quality of Teach- ers, 1957-1992," National Bureau of Economic Research working paper no. 9180 (2002).
Dee, Thomas S., and Benjamin J. Keys, "Does Merit Pay Reward Good Teachers? Evidence from a Randomized Experiment," Department of Economics, Swarthmore College, unpublished manuscript (2003).
Ehrenberg, Ronald G., and Dominic J. Brewer, "Did Teachers' Verbal Ability and Race Matter in the 1960's? Coleman Revisited," Economics of Education Review 14 (1995), 1-21.
Ehrenberg, Ronald G., Dan D. Goldhaber, and Dominic J. Brewer, "Do Teachers' Race, Gender and Ethnicity Matter? Evidence From the National Educational Longitudinal Study of 1988," Industrial and Labor Relations Review 48 (1995), 547-561.
Ferguson, Ronald F, "Teachers' Perceptions and Expectations and the Black-White Test Score Gap," in C. Jencks and M. Phillips (Eds.), The Black-White Test Score Gap (Washington, DC: Brookings Institution Press, 1998).
Graham, Patricia A., "Black Teachers: A Drastically Scarce Resource," Phi Delta Kappan 68:8 (1987), 598-605.
Hanushek, Eric A., "Some Findings from an Independent Investigation of the Tennessee STAR Experiment and from Other Investigations of Class Size Effects," Educational Evaluation and Policy Analysis 21 (1999), 143-164.
Hess, Frederic M., and David L. Leal, "Minority Teachers, Minority Students, and College Matriculation: A New Look at the Role- Modeling Hypothesis," Policy Studies Journal 25 (1997), 235- 248.
King, Sabrina H., "The Limited Presence of African-American Teachers," Review of Educational Research 63 (1993), 115-149.
Krueger, Alan B., "Experimental Estimates of Education Production Functions," Quarterly Journal of Economics 114:2 (1999), 497- 532.
Krueger, Alan B., and Diane M. Whitmore, "The Effect of Attending a Small Class in the Early Grades on College-Test Taking and Middle School Test Results: Evidence from Project STAR," Eco- nomic Journal 111 (January 2001), 1-28.
Ladson-Billings, Gloria, The Dreamkeepers: Successful Teachers of Afri- can American Children (San Francisco, CA: Jossey-Bass Publish- ers, 1994).
Mosteller, Frederick, "The Tennessee Study of Class Size in Early Grades," Critical Issues for Children and Youth 5 (1995), 113-127.
Murnane, Richard J., and David K. Cohen, "Merit Pay and the Evaluation Problem: Why Most Merit Pay Plans Fail, and a Few Survive," Harvard Educational Review 56:1 (1986), 1-17.
Murnane, Richard J., Judith D. Singer, John Willett, James Kemple, and Randall Olsen, Who Will Teach? Policies That Matter (Cambridge, MA: Harvard University Press, 1991).
Murphy, Kevin M., and Robert H. Topel, "Efficiency Wages Reconsid- ered: Theory and Evidence," in Yoram Weiss and Gideon Fishelson (Eds.) Advances in the Theory and Measurement of Unemployment (New York: St. Martins Press, 1990).
National Commission on Teaching and America's Future (NCTAF), What Matters Most: Teaching for America's Future (New York, 1996).
Steele, Claude M., "A Threat in the Air-How Stereotypes Shape Intel- lectual Identity and Performance," American Psychologist 52:6 (1997), 613-629.
Taylor, Marylee C., "Race, Sex and the Expression of Self-Fulfilling Prophecies in a Laboratory Teaching Situation," Personality and Social Psychology 6 (1979), 897-912.
U.S. Department of Education, National Center for Education Statistics, America's Teachers: Profile of a Profession, 1993-94. NCES 97-460 (Washington, DC, 1997).
Word, Elizabeth, John Johnston, Helen Pate Bain, B. DeWayne Fulton, Jayne Boyd Zaharias, Charles M. Achilles, Martha Nannette Lintz, John Folger, and Carolyn Breda, "The State of Tennessee's Stu- dent/Teacher Achievement Ratio (STAR) Project Final Summary Report 1985-1990" (1990).
Zimmerman, Rick S., Elizabeth L. Khoury, William A. Vega, Andres G. Gil, and George J. Warheit, "Teacher and Parent Perceptions of Behavior Problems among a Sample of African-American, His- panic and Non-Hispanic White Students," American Journal of Community Psychology 23 (1995), 181-197.
210
This content downloaded from 185.31.195.178 on Sat, 28 Jun 2014 12:21:10 PMAll use subject to JSTOR Terms and Conditions