Embed Size (px)
Citation preview

Teachers' Retirement System of Alabama Report of the Actuary on the Annual Valuation Prepared as of September 30, 2014

July 10, 2015
Board of ControlTeachers’ Retirement System of AlabamaMontgomery, Alabama
Members of the Board:
In this report are submitted the results of the annual valuation of the assets and liabilities of the Teachers'Retirement System of Alabama, prepared as of September 30, 2014 in accordance with Section 16-25-19(q)of the act governing the operation of the System.
The purpose of this report is to provide a summary of the funded status of the System as ofSeptember 30, 2014 and to recommend rates of State contribution. While not verifying the data at the source,the actuary performed tests for consistency and reasonability.
On the basis of the valuation, we have determined employer contribution rates of 12.01% of payroll for Tier Imembers and 10.82% of payroll for Tier II members for the fiscal year ending September 30, 2017.
The promised benefits of the System are included in the actuarially calculated contribution rates which aredeveloped using the Entry Age Normal cost method. Five-year smoothed market value of assets is used foractuarial valuation purposes. Gains and losses are reflected in the unfunded actuarial accrued liability that isbeing amortized by regular annual contributions as a level percentage of payroll, on the assumption thatpayroll will increase by 3.25% annually. The assumptions recommended by the actuary and adopted by theBoard are in the aggregate reasonably related to the experience under the System and to reasonableexpectations of anticipated experience under the System. The assumptions and methods used for fundingpurposes meet the parameters set for the disclosures presented in the financial section by GovernmentalAccounting Standards Board (GASB) Statement No. 27 and those outlined in the Board’s funding policy.
We have prepared the Schedule of Funding Progress and Trend Information shown in the financial section ofthe Comprehensive Annual Financial Report, and all supporting schedules including the Schedule of ActiveMember Valuation Data, the Solvency Test and the Analysis of Financial Experience shown in the actuarialsection of the Comprehensive Annual Financial Report.
The necessary GASB Statement No. 67 disclosure information has been provided in a separate supplementalreport.
Off
Cavanaugh Macdonald CC OO NN SS UU LL TT II NN GG,, LL LL CC
The experience and dedication you deserve
3550 Busbee Pkwy, Suite 250, Kennesaw, GA 30144 Phone (678) 388-1700 • Fax (678) 388-1730
www.CavMacConsulting.com Offices in Englewood, CO • Kennesaw, GA • Bellevue, NE

July 10, 2015 Board of Control Page 2
This is to certify that the independent consulting actuary is a member of the American Academy of Actuariesand has experience in performing valuations for public retirement systems, that the valuation was prepared inaccordance with principles of practice prescribed by the Actuarial Standards Board, and that the actuarialcalculations were performed by qualified actuaries in accordance with accepted actuarial procedures, basedon the current provisions of the retirement system and on actuarial assumptions that are internally consistentand reasonably based on the actual experience of the System.
Future actuarial results may differ significantly from the current results presented in this report due to suchfactors as the following: plan experience differing from that anticipated by the economic or demographicassumptions; changes in economic or demographic assumptions; increases or decreases expected as partof the natural operation of the methodology used for these measurements (such as the end of anamortization period or additional cost or contribution requirements based on the plan’s funded status); and changes in plan provisions or applicable law. Since the potential impact of such factors is outside the scopeof a normal annual actuarial valuation, an analysis of the range of results is not presented herein.
In our opinion the System is operating on an actuarially sound basis. Assuming that contributions to theSystem are made by the employer from year to year in the future at the rates recommended on the basis ofthe successive actuarial valuations, the continued sufficiency of the retirement fund to provide the benefitscalled for under the System may be safely anticipated.
The Table of Contents, which immediately follows, outlines the material contained in the report.
Respectfully submitted,
Edward A. Macdonald, ASA, FCA, MAAA Cathy TurcotPresident Principal and Managing Director
EAM/mjn

TABLE OF CONTENTS
Section Item Page No.
I Summary of Principal Results 1
II Membership 3
III Assets 5
IV Comments on Valuation 7
V Contributions Payable by Employer 9
VI Annual Actuarial Certification 11
VII Analysis of Financial Experience 12
VIII Accounting Information 13
Schedule
A Valuation Balance Sheet and Solvency Test 15
B Development of the Actuarial Value of Assets 17
C Summary of Receipts and Disbursements 18
D Smoothed Valuation Interest Rate 19
E Outline of Actuarial Assumptions and Methods 20
F Actuarial Cost Method 24
G Board Funding Policy 25
H Projection of Transitional UAAL and Amortization of Bases 27
I Summary of Main Plan Provisions as Interpreted for Valuation Purposes 31
J Schedule of Membership Data 36

Page 1
TEACHERS' RETIREMENT SYSTEM OF ALABAMA REPORT OF THE ACTUARY ON THE ANNUAL VALUATION
PREPARED AS OF SEPTEMBER 30, 2014
SECTION I - SUMMARY OF PRINCIPAL RESULTS
1. For convenience of reference, the principal results of the valuation and a comparison with the
preceding year's results are summarized below:
VALUATION DATE September 30, 2014 September 30, 2013
Active members Number Annual compensation
135,230 $ 6,214,949,700
133,919 $ 6,065,042,345
Retired members and beneficiaries Number Annual allowances
85,209 $ 1,865,549,629
81,745 $ 1,767,433,849
DROP participants Number 1,748 3,029 Annual compensation $ 120,210,805 $ 198,322,151 Annual allowances 62,162,236 104,007,504
Assets Actuarial value $ 20,809,871,128 $ 19,629,815,869 Market value 22,253,817,957 20,641,739,259
Unfunded actuarial accrued liability $ 10,027,958,472 $ 10,036,026,524
Funded Ratio 67.5% 66.2%
CONTRIBUTIONS FOR FISCAL YEAR ENDING September 30, 2017 September 30, 2016
Tier I (first hired prior to January 1, 2013) Employer contribution rate
Normal 2.00% 1.84% Unfunded actuarial accrued liability 9.65 9.74 Death benefit 0.02 0.02 Term life 0.01 0.01 Administration 0.33 0.33
Total 12.01% 11.94% Tier II (first hired on or after January 1, 2013)
Employer contribution rate Normal 0.81% 0.74% Unfunded actuarial accrued liability 9.65 9.74 Death benefit 0.02 0.02 Term life 0.01 0.01 Administration 0.33 0.33
Total 10.82% 10.84%
Blended Amortization period 29.8 years 29.9 years
Page 2
2. Comments on the valuation results as of September 30, 2014 are given in Section IV and further
discussion of the contribution levels is set out in Section V.
3. Since the previous valuation, the interest smoothing methodology has been modified to add a 1/8%
corridor on the amount that the discount rate can change in any year. Schedule D of this report shows
the development of the smoothed interest rate used for valuation purposes. Schedule B shows the
development of the actuarial value of assets. Schedule E of this report outlines the full set of actuarial
assumptions and methods used in the current valuation. There have been no changes since the
previous valuation. The Board funding policy is shown in Schedule G.
4. Provisions of the System, as summarized in Schedule I, were taken into account in the current
valuation. There have been no changes since the previous valuation. Section VI of this report shows
the certification of the liquidation period used to determine the accrued liability contribution rate.

Page 3
SECTION II - MEMBERSHIP
1. The following table shows the number of active members and their annual compensation as of
September 30, 2014 on the basis of which the valuation was prepared.
TABLE 1
THE NUMBER AND ANNUAL COMPENSATION OF ACTIVE MEMBERS AS OF SEPTEMBER 30, 2014
GROUP NUMBER COMPENSATION
Tier I 119,960 $ 5,700,537,149
Tier II 15,270 514,412,551
Subtotal 135,230 $ 6,214,949,700
DROP 1,748 120,210,805
Total 136,978 $ 6,335,160,505
The table reflects the active membership for whom complete valuation data were submitted. The results of the valuation include an estimated liability for an additional 15,402 inactive members and contribution balances for 29,841 non-vested inactive members who have not contributed for more than 5 years.
2. The following table shows a six-year history of active member valuation data.
TABLE 2
SCHEDULE OF ACTIVE MEMBER VALUATION DATA
Valuation Date Number
Annual Payroll
Annual Average Pay
% Increase in Average Pay
9/30/20141 135,230 $ 6,214,949,700 $ 45,958 1.48% 9/30/20132 133,919 6,065,042,345 45,289 2.06 9/30/20123 133,791 5,936,831,043 44,374 3.74 9/30/20114 135,768 5,807,655,862 42,776 (0.12) 9/30/20105 136,290 5,836,902,762 42,827 (0.01) 9/30/20096 137,935 5,908,098,156 42,832 1.55
1 In addition, there are 1,748 employees with annual compensation of $120,210,805 who are currently participating in the DROP program. Employers of the Retirement System contribute on this payroll.
2 In addition, there are 3,029 employees with annual compensation of $198,322,151 who are currently participating in the DROP program. Employers of the Retirement System contribute on this payroll.
3 In addition, there are 4,436 employees with annual compensation of $285,484,977 who are currently participating in the DROP program. Employers of the Retirement System contribute on this payroll.
4 In addition, there are 5,625 employees with annual compensation of $$351,906,404 who are currently participating in the DROP program. Employers of the Retirement System contribute on this payroll.
5 In addition, there are 5,737 employees with annual compensation of 346,301,313 who are currently participating in the DROP program. Employers of the Retirement System contribute on this payroll.
6 In addition, there are 5,340 employees with annual compensation of $328,823,442 who are currently participating in the DROP program. Employers of the Retirement System contribute on this payroll.

Page 4
3. The following table shows the number and annual retirement allowances payable to retired members
and their beneficiaries on the roll of the Retirement System as of the valuation date.
TABLE 3
THE NUMBER AND ANNUAL RETIREMENT ALLOWANCES OF RETIRED MEMBERS AND BENEFICIARIES ON THE ROLL
AS OF SEPTEMBER 30, 2014
GROUP NUMBER
ANNUAL RETIREMENT
ALLOWANCES
Service Retirements 75,467 $ 1,741,279,376
Disability Retirements 5,338 59,737,231
Beneficiaries of Deceased Members 4,404 64,533,022
Subtotal 85,209 $ 1,865,549,629
DROP Participants 1,748 62,162,236
Total 86,957 $ 1,927,711,865
4. Schedule J shows the distribution by age and service of the number and average annual
compensation of active members included in the valuation and a distribution by age of the number
and benefits of retired members and beneficiaries included in the valuation.

Page 5
SECTION III - ASSETS
1. The current retirement law provides for the maintenance of six funds for the purpose of recording the
fiscal transactions of the System, namely, the Annuity Savings Fund, the Pension Accumulation Fund,
the Deferred Retirement Option Plan Fund, the Pre-Retirement Death Benefit Fund, the Life
Insurance Fund and the Expense Fund.
(a) Annuity Savings Fund
The Annuity Savings Fund is the fund to which are credited all contributions made by members together with regular interest thereon. When a member retires or when a survivor allowance becomes payable the amount of the member's accumulated contributions are transferred from the Annuity Savings Fund to the Pension Accumulation Fund. The market value of assets credited to the Annuity Savings Fund on September 30, 2014, which represent the accumulated contributions of active members to that date, including interest, amounted to $4,589,020,567.
(b) Pension Accumulation Fund
The Pension Accumulation Fund is the fund to which are credited all contributions made by the employer, except those contributions made to the Pre-Retirement Death Benefit Fund, the Life Insurance Fund or the Expense Fund. When a member retires or when a survivor allowance becomes payable, the pension is paid from this fund. In addition, the amount of the member’s accumulated contributions is transferred from the Annuity Savings Fund to the Pension Accumulation Fund and the annuity is paid from this fund. On September 30, 2014 the market value of assets credited to this fund amounted to $17,037,952,400.
(c) DROP Fund
The DROP Fund is the fund to which are credited deferred retirement benefits on behalf of members who elect to participate in the DROP, together with regular interest thereon. In addition, member contributions while participating in the DROP, together with regular interest therein, are credited to the Fund. At the end of the DROP deferral period, the member receives the amount of the deferred retirement benefits and contributions plus interest in the member’s DROP account. The DROP is closed to new participants as of June 1, 2011. On September 30, 2014, the market value of assets credited to this Fund amounted to $626,844,990.
(d) Pre-Retirement Death Benefit Fund
The Pre-Retirement Death Benefit Fund is the fund to which are credited contributions made by the employer for the special pre-retirement death benefit which became effective October 1, 1983. On September 30, 2014, the market value of assets credited to this fund amounted to $49,166,059. These assets are not included in the valuation and the liabilities associated with these death benefits are not included in the valuation.
(e) Life Insurance Fund
The Life Insurance Fund is the fund to which are credited contributions made by the employer for life insurance benefits which became effective October 1, 1987. On September 30, 2014, the market value of assets credited to this fund amounted to $15,311,808. These assets are not included in the valuation and the liabilities associated with these life insurance benefits are not included in the valuation.
Page 6
(f) Expense Fund
The Expense Fund is the fund from which the expenses of the administration of the retirement system are paid. Any amounts credited to the accounts of members withdrawing before retirement and not returnable under the provisions of subsection (g) of Section 16-25-14 are credited to the Expense Fund. Additional contributions required to meet the expenses of the retirement system made by the employer are also credited to this fund. On September 30, 2014, the market value of assets credited to this fund amounted to $30,378,160. These assets are not included in the valuation.
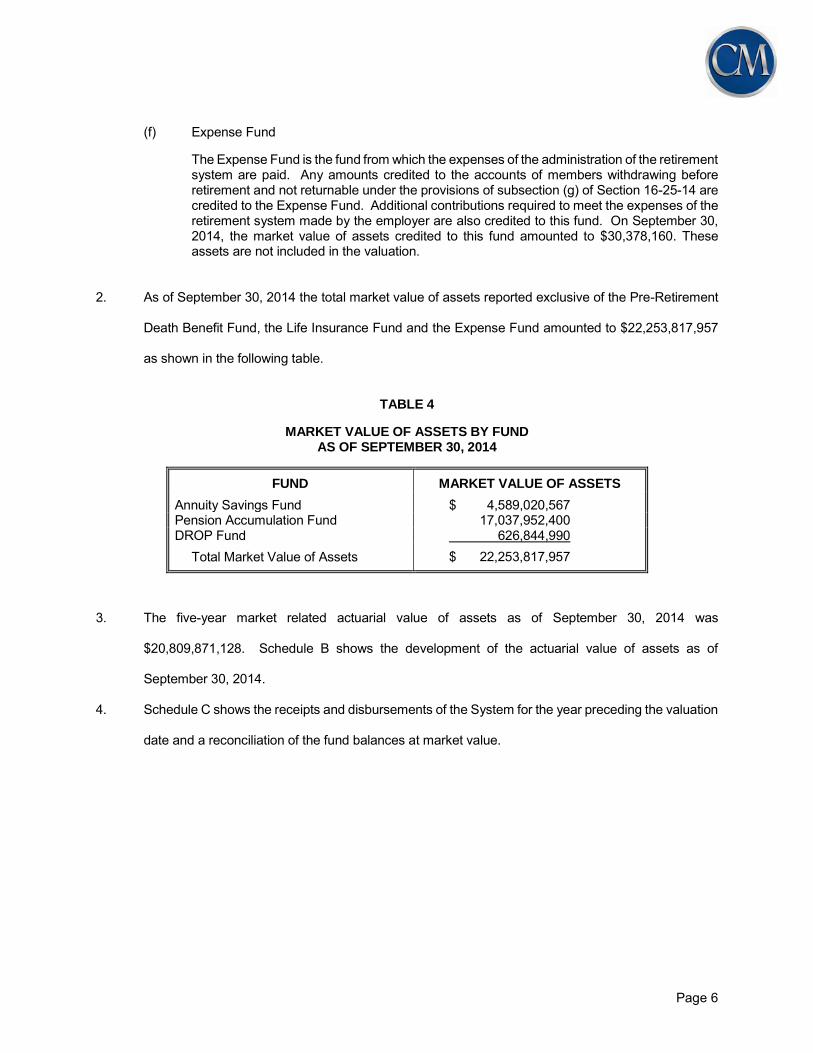
2. As of September 30, 2014 the total market value of assets reported exclusive of the Pre-Retirement
Death Benefit Fund, the Life Insurance Fund and the Expense Fund amounted to $22,253,817,957
as shown in the following table.
TABLE 4
MARKET VALUE OF ASSETS BY FUND AS OF SEPTEMBER 30, 2014
FUND MARKET VALUE OF ASSETS
Annuity Savings Fund $ 4,589,020,567 Pension Accumulation Fund 17,037,952,400 DROP Fund 626,844,990 Total Market Value of Assets $ 22,253,817,957
3. The five-year market related actuarial value of assets as of September 30, 2014 was
$20,809,871,128. Schedule B shows the development of the actuarial value of assets as of
September 30, 2014.
4. Schedule C shows the receipts and disbursements of the System for the year preceding the valuation
date and a reconciliation of the fund balances at market value.

Page 7
SECTION IV - COMMENTS ON VALUATION
1. Schedule A of this report contains the valuation balance sheet which shows the present and
prospective assets and liabilities of the System as of September 30, 2014.
2. The valuation balance sheet shows that the System has total prospective liabilities of
$35,246,089,942. Of this amount, $18,104,369,407 is for the prospective benefits payable on
account of present retired members, beneficiaries of deceased members, and DROP participants,
$590,845,109 is for the prospective benefits payable on account of present inactive members and
$16,550,875,426 is for the prospective benefits payable on account of present active members.
Against these liabilities, the System has total actuarial value of assets, exclusive of the Pre-
Retirement Death Benefit Fund, the Life Insurance Fund and the Expense Fund, of $20,809,871,128
as of September 30, 2014. The difference of $14,436,218,814 between the total liabilities and the
total actuarial value of assets represents the present value of contributions to be made in the future.
Of this amount, $3,497,684,585 is the present value of future contributions expected to be made
by members to the Annuity Savings Fund, and the balance of $10,938,534,229 represents the
present value of future contributions payable by the employer.
3. The employer's regular contributions to the System consist of normal contributions and unfunded
actuarial accrued liability (UAAL) contributions. The valuation indicates that employer normal
contributions at the rate of 2.00% of payroll for Tier I members and 0.81% of payroll for Tier II
members are required to provide the benefits of the System.
4. Prospective normal contributions have a present value of $910,575,757. When this amount is
subtracted from $10,938,534,229 which is the present value of the total future contributions to be
made by the employer, there remains $10,027,958,472 as the amount of future UAAL contributions.
5. The funding policy adopted by the Board, as shown in Schedule G, provides that one-fifteenth of the
unfunded actuarial liability as of September 30, 2012 (Transitional UAAL) will be amortized as a level
percent of payroll over a closed period. The closed period shall be the amortization period for the
September 30, 2012 valuation, not to exceed 30 years. The remaining Transitional UAAL each year
will be amortized over an open period. The open period shall be the amortization period for the
September 30, 2012 valuation, not to exceed 30 years. After 15 years the entire Transitional UAAL

Page 8
will be closed. In each subsequent valuation all benefit changes, assumption and method changes
and experience gains and/or losses that have occurred since the previous valuation will determine a
New Incremental UAAL. Each New Incremental UAAL will be amortized as a level percent of payroll
over a closed 30–year period from the date it is established.
6. The total UAAL contribution rate is 9.65% of payroll determined in accordance with the Board’s
funding policy. The UAAL contribution rate has been calculated on the assumption that the aggregate
amount of accrued liability contribution will increase by 3.25% each year. Schedule H of this report
shows a projection of the open Transitional UAAL and amortization schedules for all closed bases on
September 30, 2014.
7. The following table shows the components of the total unfunded actuarial accrued liability (UAAL)
and the derivation of the accrued liability contribution rate in accordance with the funding policy.
TABLE 5
TOTAL UAAL AND UAAL CONTRIBUTION RATE
UAAL Amortization
Period Amortization
Payment Open Transitional $ 7,814,413,175 30 $501,202,222 Closed Transitional 9/30/2012 650,527,705 28 43,146,203 Closed Transitional 9/30/2013 651,201,098 29 42,450,925 Closed Transitional 9/30/2014 651,201,098 30 41,766,852 New Incremental 9/30/2013 427,199,723 29 27,848,577 New Incremental 9/30/2014 (166,584,327) 30 (10,684,415) $10,027,958,472 $645,730,364 Estimated Payroll $6,689,325,633 UAAL Contribution Rate 9.65%
8. A contribution of 0.02% is required to meet the cost of the pre-retirement death benefit program this
year. The assets and liabilities of this program are not included in the valuation. A contribution of
0.01% is required to meet the cost of life insurance premiums. The assets and liabilities of this
program are not included in the valuation.
9. An additional contribution of 0.33% of payroll is required to cover the expenses of administering the
System.

Page 9
SECTION V - CONTRIBUTIONS PAYABLE BY EMPLOYER
1. The retirement law provides that the employer contributions are to be paid from the same source from
which employees’ salaries are paid.
2. On the basis of the actuarial valuation prepared as of September 30, 2014 it is recommended that
the employer make contributions at the following rates beginning October 1, 2016:
TABLE 6
EMPLOYER CONTRIBUTION RATES AS A PERCENTAGE OF MEMBERS' COMPENSATION*
EMPLOYER CONTRIBUTION
FISCAL YEAR ENDING SEPTEMBER 30, 2017
Tier I Tier II
Normal 2.00% 0.81%
Unfunded Actuarial Accrued Liability 9.65 9.65
Death Benefit 0.02 0.02 Term-Life 0.01 0.01 Administration 0.33 0.33 Total 12.01% 10.82%
* All members initially joining the System on and after January 1, 2013 are Tier II members.

Page 10
3. Contributions at the above rates of payroll are also recommended for payment by the Alabama High
School Athletic Association. The following table shows the rates to be paid by special units of the
System in addition to the rates shown above and the fiscal year through which these additional rates
are required to be paid. These additional rates were determined based on the liabilities for the prior
service of members at the time the unit joined the System, amortized over a fixed number of years.
TABLE 7
ADDITIONAL RATES REQUIRED FOR SPECIAL UNITS OF THE SYSTEM
UNIT
ADDITIONAL EMPLOYER
RATE
THROUGH FISCAL
YEAR ENDING SEPTEMBER 30
Alabama State Employees Association 2.66% 2015 Developing Alabama Youth Foundation 2.74 2017 Alabama Congress of Parents and Teachers 2.15 2020

Page 11
SECTION VI – ANNUAL ACTUARIAL CERTIFICATION
The following is the annual actuarial certification to the Teachers' Retirement System of Alabama required
by Act 2000-732.
1. We hereby certify that there has been a change since the previous valuation in the liquidation period
used to determine the accrued liability contribution rate from 29.9 years to 29.8 years. The unfunded
actuarial accrued liability rate of 9.65% to be paid by employers to the Teachers' Retirement System of
Alabama has been determined in accordance with the Funding Policy adopted by the Board and shown
in Schedule G of this report.
Signed
Edward A. Macdonald, ASA, FCA, MAAA President
Page 12
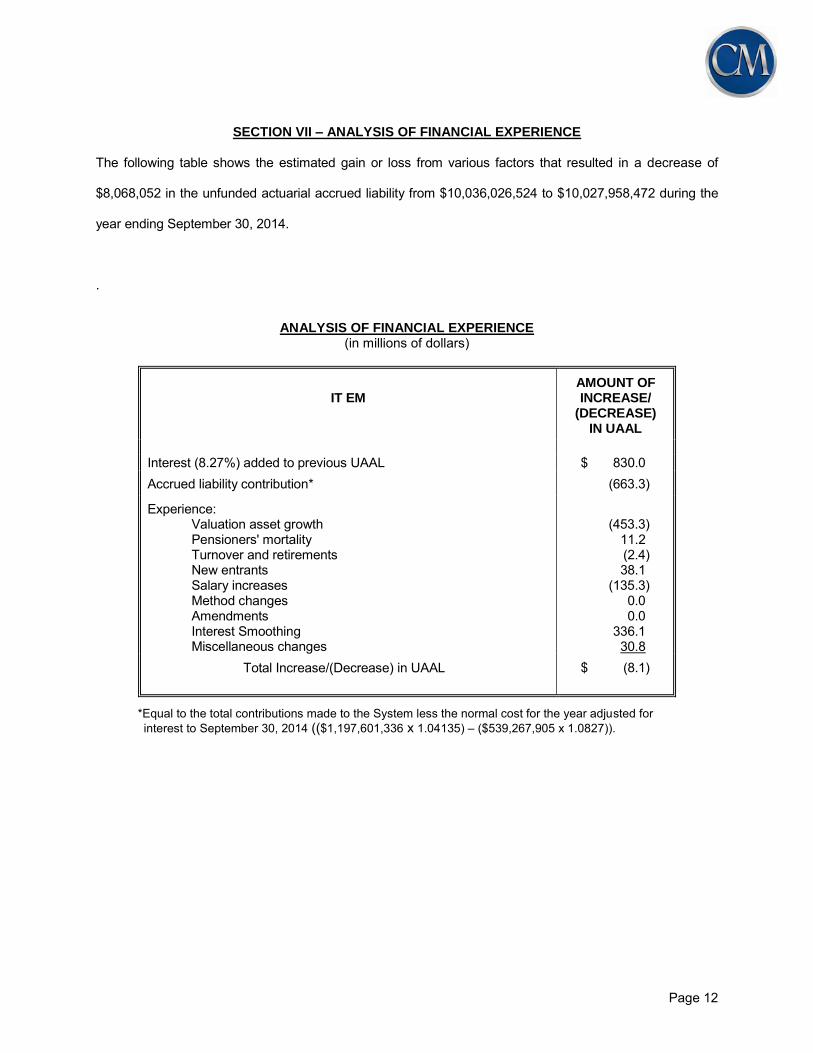
SECTION VII – ANALYSIS OF FINANCIAL EXPERIENCE
The following table shows the estimated gain or loss from various factors that resulted in a decrease of
$8,068,052 in the unfunded actuarial accrued liability from $10,036,026,524 to $10,027,958,472 during the
year ending September 30, 2014.
.
ANALYSIS OF FINANCIAL EXPERIENCE (in millions of dollars)
IT EM
AMOUNT OF INCREASE/
(DECREASE) IN UAAL
Interest (8.27%) added to previous UAAL $ 830.0 Accrued liability contribution* (663.3)
Experience: Valuation asset growth Pensioners' mortality Turnover and retirements New entrants Salary increases Method changes Amendments Interest Smoothing Miscellaneous changes
(453.3) 11.2 (2.4) 38.1 (135.3) 0.0 0.0 336.1 30.8
Total Increase/(Decrease) in UAAL
$ (8.1)
*Equal to the total contributions made to the System less the normal cost for the year adjusted for interest to September 30, 2014 (($1,197,601,336 x 1.04135) – ($539,267,905 x 1.0827)).

Page 13
SECTION VIII - ACCOUNTING INFORMATION
Governmental Accounting Standards Board (GASB) has issued Statement No. 67 which replaces Statement
25 for plan years beginning after June 15, 2013. The information required under GASB 67 was issued in a
separate report. The following information is provided for informational purposes and for disclosure in the
financial statements of the System and the employer under GASB 27. GASB 68 replaces GASB 27 for the
employer’s fiscal year beginning after June 15, 2014.
1. The following is a distribution of the number of employees by type of membership.
NUMBER OF ACTIVE AND RETIRED MEMBERS
AS OF SEPTEMBER 30, 2014
GROUP NUMBER
Retirees and beneficiaries currently receiving benefits
85,209
DROP participants 1,748 Terminated employees entitled to benefits but not yet receiving benefits
15,402
Non-vested inactive members who have not contributed for more than 5 years
29,841
Active members 135,230
Total 267,430
2. The schedule of funding progress is shown below.
SCHEDULE OF FUNDING PROGRESS (Dollar amounts in thousands)
Actuarial Actuarial Accrued Unfunded UAAL as a
Actuarial Value of Liability (AAL) AAL Funded Covered Percentage of Valuation Assets Entry Age (UAAL) Ratio Payroll Covered Payroll
Date ( a ) ( b ) ( b - a ) ( a / b ) ( c ) ( ( b - a ) / c )
9/30/2009 $20,582,348 $27,537,400 $6,955,052 74.7% $6,236,922 111.5% 9/30/2010 20,132,779 28,299,523 8,166,744 71.1 6,183,204 132.1 9/30/20111 19,430,135 28,776,316 9,346,181 67.5 6,159,562 151.7 9/30/20122 18,786,008 28,251,367 9,465,359 66.5 6,222,316 152.1 9/30/2013 19,629,816 29,665,843 10,036,027 66.2 6,263,364 160.2 9/30/2014 20,809,871 30,837,829 10,027,958 67.5 6,335,161 158.3
1Reflects changes in assumptions. 2Reflects changes in methods.

Page 14
3. The information presented above was determined as part of the actuarial valuation at
September 30, 2014. Additional information as of the latest actuarial valuation follows.
Valuation date 09/30/2014
Actuarial cost method Entry Age Normal
Amortization method Level percent closed Single equivalent remaining amortization period 29.8 years
Asset valuation method Five-year market related value Actuarial assumptions:
Ultimate Investment Rate of Return* 8.00%
Projected salary increases* 3.50 - 8.25%
Cost-of-living adjustments None
*Includes price inflation at 3.00%
TREND INFORMATION ($ in 1,000’s)
Period Ending
Annual Pension
Cost (APC)
Percentage Of
APC Contributed
Net Pension
Obligation (NPO)
September 30, 2012 $594,771 100% $0 September 30, 2013 605,465 100 0 September 30, 2014 716,753 100 0

Page 15
SCHEDULE A
VALUATION BALANCE SHEET SHOWING THE PRESENT AND PROSPECTIVE ASSETS AND LIABILITIES OF
THE TEACHERS' RETIREMENT SYSTEM OF ALABAMA AS OF SEPTEMBER 30, 2014
September 30, 2014
ASSETS
Actuarial Value of Assets $ 20,809,871,128 Present value of future members’ contributions to the
Annuity Savings Fund $ 3,497,684,585
Present value of future employer contributions to the Pension Accumulation Fund
Normal contributions $ 910,575,757 Unfunded actuarial accrued liability contributions 10,027,958,472 Total prospective employer contributions $ 10,938,534,229 Total Assets $ 35,246,089,942
LIABILITIES
Present value of benefits payable on account of retired members, beneficiaries of deceased members now drawing retirement allowances, and DROP participants
Service Retirements $ 16,470,032,334 Disability Retirements 503,177,624 Beneficiaries of Deceased Members 504,314,459 DROP Participant Accounts 626,844,990 Total $ 18,104,369,407 Inactive Members $ 539,408,324
Inactive T-Section Accounts $ 51,436,785 Present value of prospective benefits payable on account of present active members:
Service retirement allowances $ 14,908,551,661 Disability retirement allowances 587,525,751 Death Benefits 101,959,794 Termination Benefits 952,838,220 Total $ 16,550,875,426 Total Liabilities $ 35,246,089,942

Page 16
SCHEDULE A (continued)
SOLVENCY TEST
($1000’s)
Aggregate Accrued Liabilities For Portion of Accrued Liabilities Covered by Reported Asset
Valuation Date
(1) Active
Member Contributions
(2) Retirants
and Beneficiaries
(3) Active Members
(Employer Financed Portion)
Reported Assets
(1)
(2)
(3)
9/30/2014 $4,589,021 $18,104,369 $8,144,439 $20,809,871 100% 90% 0.0% 9/30/2013 4,261,269 17,666,932 7,737,642 19,629,816 100 87 0.0 9/30/20121 3,921,179 17,085,972 7,244,216 18,786,008 100 87 0.0 9/30/20112 3,620,301 17,245,088 7,910,927 19,430,135 100 92 0.0 9/30/2010 3,498,959 16,083,293 8,717,271 20,132,779 100 100 6.3 9/30/2009 3,233,664 15,328,508 8,975,228 20,582,348 100 100 22.5
1 Reflects changes in methods. 2 Reflects changes in actuarial assumptions.

Page 17
SCHEDULE B
DEVELOPMENT OF SEPTEMBER 30, 2014 ACTUARIAL VALUE OF ASSETS
(1) Actuarial Value of Assets on September 30, 2013 $ 19,629,815,869 (2) Market Value of Assets on September 30, 2014 22,253,817,957 (3) Market Value of Assets on September 30, 2013 20,641,739,259 (4) Net Cash Flow During the Fiscal Year a. Contributions 1,197,601,336 b. Benefit Payments and DROP Distributions 1,997,877,191 c. Refunds to Members 50,328,497 d. Transfer to Expense Fund 5,815,841 e. Transfer to Plant and Pre-retirement Death Funds 4,652,691 f. Investment Expenses 8,625,819 g. Net Cash Flow: (a. - b. - c. - d. - e. - f.) (869,698,703) (5) Actual Investment Return ((2) - (3) - (4)g.) 2,481,777,401 (6) Assumed Rate of Return on Assets 8.00% (7) Amount for Immediate Recognition ((3) * (6)) + (((4)a. - (4)b. - (4)c. - (4)d. - (4)e.) * .5 * (6)) + (4)f.
1,625,522,044
(8) Investment Gain/(Loss) for the Fiscal Year ((5) - (7)) 856,255,357 (9) Phased-In Recognition of Investment Gain/(Loss) a. Current Fiscal Year: ( .2 * (8)) 171,251,071 b. Prior Fiscal Year 252,980,847 c. Second Prior Fiscal Year 0 d. Third Prior Fiscal Year 0 e. Fourth Prior Fiscal Year 0 f. Total Recognized Investment Gain/(Loss) for Fiscal Year 424,231,918 (10) Actuarial Value of Assets on September 30, 2014 ((1) + (4)g. + (7) + (9)f.)
$ 20,809,871,128
Date Investment Gain/(Loss)
Amount Recognized
Remaining Balance as of September 30, 2014
9/30/2013 $ 1,264,904,237 $ 505,961,694 $ 758,942,543 9/30/2014 $ 856,255,357 $ 171,251,071 $ 685,004,286

Page 18
SCHEDULE C
SUMMARY OF RECEIPTS AND DISBURSEMENTS FOR THE PERIOD ENDING SEPTEMBER 30, 2014
Receipts for the Period
Contributions: Members Employer
$ 480,848,671 716,752,665
Total $ 1,197,601,336
Investment Income 2,478,883,401*
TOTAL $ 3,676,484,737
Disbursements for the Period Benefit Payments Refunds to Members DROP Distributions Miscellaneous: Transfers to Plant Fund Transfers to Expense Fund Transfers to Pre-retirement Death Benefit Fund
$ 194,155 11,547,660 4,458,536
$ 1,766,043,575 50,328,497 231,833,616
Total 16,200,351
TOTAL $ 2,064,406,039
Excess of Receipts over Disbursements $ 1,612,078,698 Reconciliation of Asset Balances
Market Value of Assets as of September 30, 2013 $ 20,641,739,259
Excess of Receipts over Disbursements 1,612,078,698
Market Value of Assets as of September 30, 2014 $ 22,253,817,957
*Net of $2,894,000 in investment expenses.
Page 19
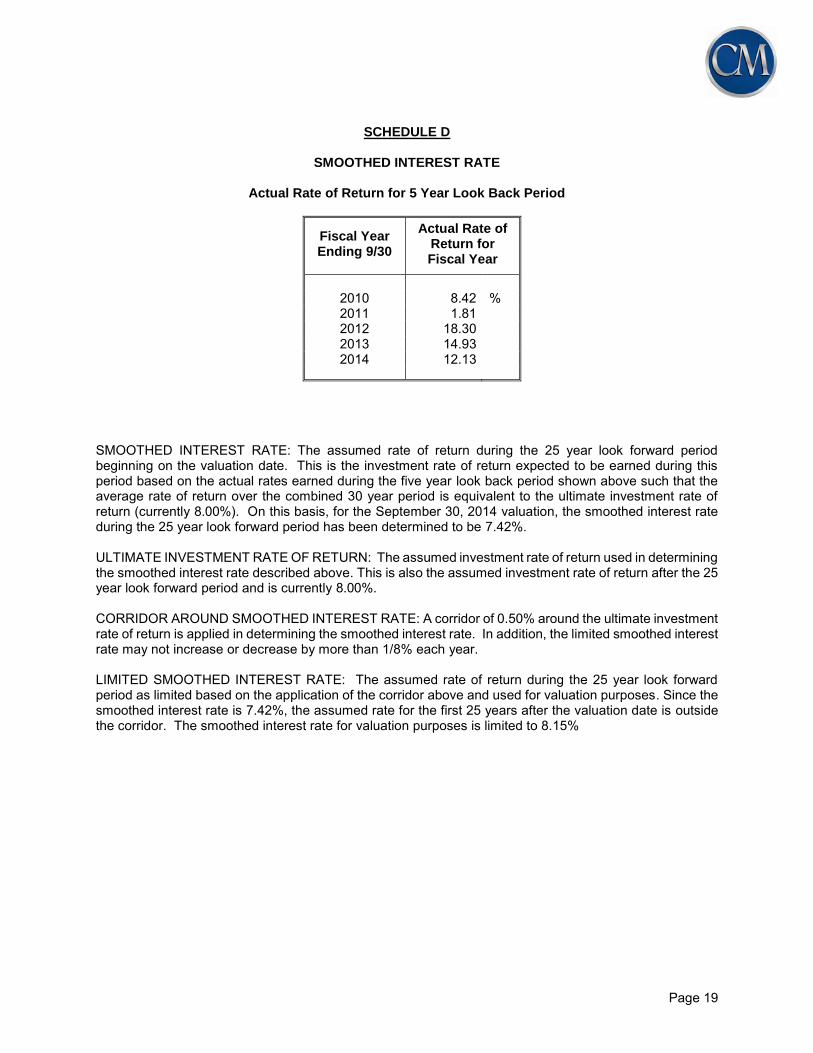
SCHEDULE D
SMOOTHED INTEREST RATE
Actual Rate of Return for 5 Year Look Back Period
Fiscal Year Ending 9/30
Actual Rate of Return for Fiscal Year
2010 8.42 % 2011 1.81 2012 18.30 2013 14.93 2014 12.13
SMOOTHED INTEREST RATE: The assumed rate of return during the 25 year look forward period beginning on the valuation date. This is the investment rate of return expected to be earned during this period based on the actual rates earned during the five year look back period shown above such that the average rate of return over the combined 30 year period is equivalent to the ultimate investment rate of return (currently 8.00%). On this basis, for the September 30, 2014 valuation, the smoothed interest rate during the 25 year look forward period has been determined to be 7.42%. ULTIMATE INVESTMENT RATE OF RETURN: The assumed investment rate of return used in determining the smoothed interest rate described above. This is also the assumed investment rate of return after the 25 year look forward period and is currently 8.00%. CORRIDOR AROUND SMOOTHED INTEREST RATE: A corridor of 0.50% around the ultimate investment rate of return is applied in determining the smoothed interest rate. In addition, the limited smoothed interest rate may not increase or decrease by more than 1/8% each year. LIMITED SMOOTHED INTEREST RATE: The assumed rate of return during the 25 year look forward period as limited based on the application of the corridor above and used for valuation purposes. Since the smoothed interest rate is 7.42%, the assumed rate for the first 25 years after the valuation date is outside the corridor. The smoothed interest rate for valuation purposes is limited to 8.15%

Page 20
SCHEDULE E
OUTLINE OF ACTUARIAL ASSUMPTIONS AND METHODS
The assumptions and methods used in the valuation were selected based on the actuarial experience study prepared as of September 30, 2010, submitted to and adopted by the Board on January 27, 2012. ULTIMATE INVESTMENT RATE OF RETURN: 8.00% per annum, compounded annually, including price inflation at 3%. SALARY INCREASES: Representative values of the assumed annual rates of future salary increases are as follows and include wage inflation at 3.25% per annum:
Service Annual Rate Service Annual Rate
0 8.25 % 6 5.00 % 1 6.50 7 4.75 2 5.75 8 to 13 4.50 3 5.50 14 to 18 4.00 4 5.25 19 & Over 3.50 5 5.00
SEPARATIONS BEFORE SERVICE RETIREMENT: Representative values of the assumed annual rates of death, disability, and withdrawal are as follows:
Annual Rate of Age Death* Disability Withdrawal
Years of Service Years of Service 0-24 25+ 0-4 5-9 10-20 20+
Male
20 25 30 35 40 45 50 55 60 65 69
0.02% 0.02 0.03 0.05 0.07 0.09 0.12 0.20 0.40 0.77 1.20
0.04%
0.10% 0.10 0.10 0.10
30.00% 0.05 15.68 10.00% 0.05 14.25 5.40 5.00% 0.10 14.25 5.40 3.00 0.18 14.00 5.40 2.50 1.00% 0.31 14.00 5.00 2.50 1.00 0.51 12.50 4.50 2.50 1.00 0.96 12.00 4.00 2.50 1.00 0.50 12.00 4.00
12.00 6.00 12.00 6.00
Female
20 25 30 35 40 45 50 55 60 65 69
0.01% 0.01 0.01 0.02 0.03 0.04 0.06 0.11 0.21 0.40 0.62
0.10%
0.15% 0.15 0.15 0.25
28.50% 0.10 14.00 8.00% 0.10 14.00 5.80 4.00% 0.15 14.00 5.00 3.00 0.16 12.00 4.50 2.10 1.10% 0.33 11.50 3.75 2.10 0.75 0.63 11.00 3.75 2.10 0.75 0.99 11.00 3.75 2.50 0.75 0.25 12.00 4.50 14.00 6.00
14.00 6.00 * Rates of pre-retirement mortality are according to the sex distinct RP-2000 Combined Mortality Table Projected with
Scale AA to 2015 set back one year for females with an adjustment of factor of 0.75 for males and 0.50 for females.

Page 21
SERVICE RETIREMENT: The assumed annual rates of service retirement for Tier I members are as follows:
For members first eligible for unreduced benefits upon attaining 25 years of service but before age 65, rates are as follows:
Annual Rate
Age Group Male* Female** 47 & Under
48 49
50 to 52 53 to 54 55 to 59
60 61 62 63 64
20.0% 20.0 20.0 15.0 14.0 15.0 15.0 20.0 35.0 30.0 25.0
25.0% 17.0 16.0 16.0 16.0 20.0 15.0 25.0 35.0 25.0 30.0
*Retirement rates are increased by 7% in the year first eligible for unreduced retirement from age 50 through age 54 and by 10% from age 55 through age 60.
**Retirement rates are increased by 7% in the year first eligible for unreduced retirement from age 50 through age 54 and by 20% from age 55 through age 60.
For members first eligible for unreduced benefits before attaining 25 years of service and all members age 65 and over, the rates are as follows:
Annual Rate
Age Group Male Female 60 61 62 63 64 65 66
13.0% 12.0 28.0 20.0 15.0 30.0 28.0
20.0% 15.0 25.0 20.0 18.0 30.0 30.0
67 20.0 25.0 68 20.0 28.0 69 20.0 22.0 70 20.0 25.0
71 to 74 20.0 22.0 75 & Above 100.0 100.0

Page 22
The assumed annual rates of service retirement for Tier II members are as follows:
Age Group
Annual Rate Male Female
Less than 25 years of service
25 or more years of service
Less than 25 years of service
25 or more years of service
62 50.0% 60.0% 50.0% 65.0% 63 20.0 30.0 20.0 25.0 64 15.0 25.0 18.0 30.0 65 30.0 30.0 30.0 30.0 66 28.0 28.0 30.0 30.0 67 20.0 20.0 25.0 25.0 68 20.0 20.0 28.0 28.0 69 20.0 20.0 22.0 22.0 70 20.0 20.0 25.0 25.0
71 to 74 20.0 20.0 22.0 22.0 75 & above 100.0 100.0 100.0 100.0
DEATHS AFTER RETIREMENT: Rates of mortality for the period after service retirement are according to the sex distinct RP-2000 Combined Mortality Table Projected with Scale AA to 2015 set back one year for females. Rates of mortality for the period after disability retirement are according to the RP-2000 Disabled Mortality Table, adjusted for males by a factor of 0.85. Representative values of the assumed annual rates of death after retirement are as follows:
Annual Rate
After Service Retirement After Disability Retirement
Age Male Female Male Female 35 40 45 50 55 60 65 70 75 80 85 90 95
0.07% 0.10 0.12 0.16 0.27 0.53 1.03 1.77 3.06 5.54 9.97 17.27 25.96
0.04% 0.05 0.08 0.12 0.21 0.41 0.80 1.38 2.26 3.74 6.35 11.39 17.74
1.92% 1.92 1.92 2.46 3.01 3.57 4.26 5.32 6.98 9.30 12.04 15.59 22.74
0.75% 0.75 0.75 1.15 1.65 2.18 2.80 3.76 5.22 7.23 10.02 14.00 19.45
In our opinion, the projection to 2015 of the RP-2000 mortality rates with Scale AA continues to provide a sufficient margin in the assumed rates of mortality to allow for additional improvement in mortality experience. SPOUSE’S BENEFIT: For those eligible for spouse’s benefits, it is assumed that 75% will elect the lump sum death benefit payable from the death benefit fund and 25% will elect the spouse’s benefit payable from the pension accumulation fund and included in the liabilities of the System.
Page 23
BENEFITS PAYABLE UPON SEPARATION FROM SERVICE: For active members who separate from service prior to eligibility for a service retirement allowance, the liability is assumed to be the greater of the value of the refund of contributions and the value of the deferred annuity. Assumed refunds are reduced by 10% to account for interest accumulation adjustments which are less than the “regular” 4% rate adopted by the Board. UNUSED SICK LEAVE: 3% load on service retirement liabilities for active members. (No load for Tier II members) PERCENTAGE MARRIED: 100% of active members are assumed to be married with the husband 3 years older than the wife. VALUATION METHOD: Individual entry age normal cost method. Actuarial gains and losses are reflected in the unfunded actuarial accrued liability. ASSET METHOD: Actuarial value, as developed in Schedule B. The actuarial value of assets recognizes a portion of the difference between the market value of assets and the expected value of assets, based on the assumed valuation rate of return. The amount recognized each year is 20% of the difference between market value and expected market value. In order to reduce short-term volatility in valuation results and because the market value and actuarial value of assets were close in value, the actuarial value of assets was set equal to the market value on September 30, 2012. 5-year smoothing commenced again beginning September 30, 2013. LIABILITY FOR CURRENT INACTIVE MEMBERS: Member Contribution Balance is multiplied by a factor of 2.0. VALUATION INTEREST RATE SMOOTHING: The valuation liabilities are calculated using a smoothed interest rate method. The interest rate assumed during the look forward period (currently 25 years from the valuation date) is the investment rate of return expected to be earned during the look forward period based on the actual rate of return earned during the look back period (currently 5 years) such that the average assumed rate of return over the combined 30 year period is equivalent to the assumed ultimate investment rate of return (currently 8.00%). The interest rate after the 25 year look forward period is the ultimate investment rate of return of 8.00%. CORRIDOR LIMIT ON INTEREST SMOOTHING: A corridor of 0.50% around the ultimate investment rate of return is applied in determining the smoothed interest rate. In addition, the limited smoothed interest rate may not increase or decrease by more than 1/8% each year.

Page 24
SCHEDULE F
ACTUARIAL COST METHOD
1. The valuation is prepared on the projected benefit basis, under which the present value, at the interest
rate assumed to be earned in the future (see Schedules D and E for a description of the interest rate
used), of each member's expected benefit payable at retirement or death is determined, based on his
age, service, sex and compensation. The calculations take into account the probability of a member's
death or termination of employment prior to becoming eligible for a benefit, as well as the probability
of his terminating with a service, disability or survivor's benefit. Future salary increases are also
anticipated. The present value of the expected benefits payable on account of the active members
is added to the present value of the expected future payments to retired members and beneficiaries
to obtain the present value of all expected benefits payable from the System on account of the present
group of members and beneficiaries.
2. The employer contributions required to support the benefits of the System are determined following
a level funding approach, and consist of a normal contribution and an accrued liability contribution.
3. The normal contribution is determined using the "individual entry age normal" method. Under this
method, a calculation is made to determine the uniform and constant percentage rate of employer
contribution which, if applied to the compensation of the each new member during the entire period
of his anticipated covered service, would be required in addition to the contributions of the member
to meet the cost of all benefits payable on his behalf.
4. The unfunded actuarial accrued liability contributions are determined by subtracting the present value
of prospective employer normal contributions and member contributions together with the current
assets held from the present value of expected benefits to be paid from the System.

Page 25
SCHEDULE G
BOARD FUNDING POLICY
The purpose of the funding policy is to state the overall funding objectives for the Teachers’ Retirement System of Alabama (System), the benchmarks that will be used to measure progress in achieving those goals, and the methods and assumptions that will be employed to develop the benchmarks. The funding policy reflects the Board’s long-term strategy for stability in funding of the plan. For that reason, it is critical that this funding policy remain unchanged until its objectives are met. I. Funding Objectives The goal in requiring employer and member contributions to the System is to accumulate sufficient assets during a member’s employment to fully finance the benefits the member is expected to receive throughout retirement. In meeting this objective, the System will strive to meet the following funding objectives:
To maintain an increasing funded ratio (ratio of system actuarial value of assets to actuarial accrued liabilities) that reflects a trend of improved actuarial condition. The long-term objective is to attain a funded ratio which is consistent with the fiscal health and long-term stability of the System.
To maintain adequate asset levels to finance the benefits promised to members and monitor the future demands for liquidity.
To develop a pattern of contribution rates expressed as a percentage of member payroll as measured by valuations prepared in accordance with applicable State laws and the principles of practice prescribed by the Actuarial Standards Board. In no event will the employer contribution rate be negative.
To provide intergenerational equity for taxpayers with respect to System costs.
II. Benchmarks To track progress in achieving the previously outlined funding objectives, the following benchmarks will be measured annually as of the valuation date. The valuation date is the date that the annual actuarial valuation of the System’s assets and liabilities is prepared. This date is currently September 30th each year with due recognition that a single year’s results may not be indicative of long-term trends:
Funded ratio – The funded ratio, defined as the actuarial value of assets divided by the actuarial accrued liability, should increase over time, before adjustments for changes in benefits, actuarial methods, and/or actuarial assumptions. An open amortization period is one for which the amortization period is recalculated on a yearly basis and the ending date of the amortization period is a variable with each recalculation. A closed amortization period is one which is calculated over a fixed period and at the end of that period, the amount is fully amortized.
Unfunded Actuarial Accrued Liability (UAAL) Transitional UAAL - The UAAL established as of the initial valuation date for which this
funding policy is adopted shall be known as the Transitional UAAL (applicable only to employers participating in the System as of the adoption date of the funding policy).
New Incremental UAAL - Each subsequent valuation will produce a New Incremental UAAL consisting of all benefit changes, assumption and method changes and experience gains and/or losses that have occurred since the previous valuation.
UAAL Amortization Period and Contribution Rates In each valuation 1/15th of the Transitional UAAL will be amortized over a closed period.
The closed period shall be the amortization period for the valuation preceding the adoption of the funding policy not to exceed 30 years. The remaining Transitional UAAL each year will be amortized over an open period. The open period shall be the amortization period for the valuation preceding the adoption of the funding policy not to exceed 30 years. After 15 years the entire Transitional UAAL will be closed.
Each New Incremental UAAL shall be amortized over a closed 30 year period. Employer Normal Contribution Rate – the contribution rate determined as of the valuation
date each year based on the provisions of Alabama Code Section 16-25-21. In each valuation subsequent to the adoption of this funding policy the required employer
contribution rate will be determined by the summation of the employer Normal Contribution Rate, a contribution rate for administrative expenses, a contribution rate for the pre-

Page 26
retirement death benefit fund, a contribution rate for the term life insurance fund, the individual amortization rate for each of the New Incremental UAAL bases, the individual amortization rate for each of the 15 closed periods for the Transitional UAAL and the amortization of any remaining open portion of the Transitional UAAL.
UAAL Amortization Period for Employers joining the System after the Implementation of this Funding Policy
For Employers joining the System after the implementation of this Funding Policy, the employer contribution rate shall be computed as the sum of the employer Normal Contribution rate, a contribution rate for administrative expenses, a contribution rate for the pre-retirement death benefit fund, a contribution rate for the term life insurance fund, and the initial UAAL contribution rate. The initial UAAL contribution rate shall be determined by amortizing the initial UAAL over a closed period equal to the expected future working lifetime of the active membership. This initial amortization period shall not be less than 10 years nor greater than 30 years.
In subsequent years the UAAL and employer contribution rate shall be determined in accordance with the rules of the Funding Policy described in the previous section.
III. Methods and Assumptions The actuarial funding method used to develop the benchmarks will be the Entry Age Normal (EAN) actuarial cost method. The actuarial methods and assumptions used will be those last adopted by the Board based upon the advice and recommendation of the actuary including the Interest Smoothing methodology. The actuary shall conduct an investigation into the system’s experience at least every five years and utilize the results of the investigation to form the basis for those recommendations which shall include the Interest Smoothing Methodology. IV. Funding Policy Progress The Board will periodically have projections of funded status performed to assess the current and expected future progress towards the overall funding goals of the System.

Page 27
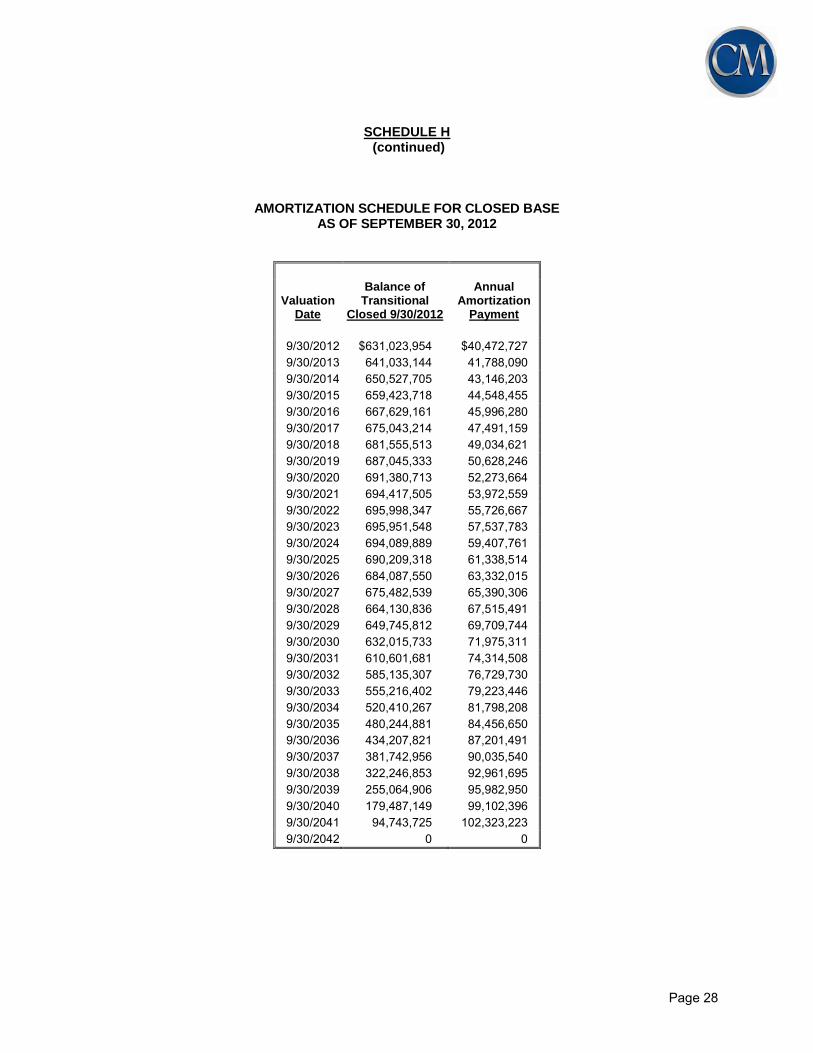
SCHEDULE H
PROJECTION OF TRANSITIONAL UAAL AND AMORTIZATION OF BASES
PROJECTION OF THE OPEN TRANSITIONAL UAAL
Valuation Date
Transitional UAAL
Beginning of Year
Transitional Closed
Transitional Remaining Open 8% Interest
Amortization Payment
Transitional Open UAAL End of Year
(1) (2) (3)=(1)-(2) (4)=(3)*.08 (5) (6)=(3)+(4)-(5)
9/30/2012 $9,465,359,317 $631,023,954 $8,834,335,363 $706,746,829 $566,618,173 $8,974,464,019 9/30/2013 8,974,464,019 641,033,144 8,333,430,875 666,674,470 534,491,072 8,465,614,273 9/30/2014 8,465,614,273 651,201,098 7,814,413,175 625,153,054 501,202,222 7,938,364,007 9/30/2015 7,938,364,007 661,530,334 7,276,833,673 582,146,694 466,722,853 7,392,257,515 9/30/2016 7,392,257,515 672,023,410 6,720,234,104 537,618,728 431,023,570 6,826,829,262 9/30/2017 6,826,829,262 682,682,926 6,144,146,336 491,531,707 394,074,351 6,241,603,692 9/30/2018 6,241,603,692 693,511,521 5,548,092,171 443,847,374 355,844,523 5,636,095,022 9/30/2019 5,636,095,022 704,511,878 4,931,583,144 394,526,652 316,302,757 5,009,807,039 9/30/2020 5,009,807,039 715,686,720 4,294,120,319 343,529,626 275,417,053 4,362,232,892 9/30/2021 4,362,232,892 727,038,815 3,635,194,077 290,815,526 233,154,724 3,692,854,879 9/30/2022 3,692,854,879 738,570,976 2,954,283,903 236,342,712 189,482,386 3,001,144,229 9/30/2023 3,001,144,229 750,286,057 2,250,858,172 180,068,654 144,365,942 2,286,560,884 9/30/2024 2,286,560,884 762,186,961 1,524,373,923 121,949,914 97,770,566 1,548,553,271 9/30/2025 1,548,553,271 774,276,635 774,276,636 61,942,131 49,660,693 786,558,074 9/30/2026 786,558,074 786,558,074 0 0 0 0
Page 28
SCHEDULE H (continued)
AMORTIZATION SCHEDULE FOR CLOSED BASE AS OF SEPTEMBER 30, 2012
Valuation Date
Balance of Transitional
Closed 9/30/2012
Annual Amortization
Payment
9/30/2012 $631,023,954 $40,472,727 9/30/2013 641,033,144 41,788,090 9/30/2014 650,527,705 43,146,203 9/30/2015 659,423,718 44,548,455 9/30/2016 667,629,161 45,996,280 9/30/2017 675,043,214 47,491,159 9/30/2018 681,555,513 49,034,621 9/30/2019 687,045,333 50,628,246 9/30/2020 691,380,713 52,273,664 9/30/2021 694,417,505 53,972,559 9/30/2022 695,998,347 55,726,667 9/30/2023 695,951,548 57,537,783 9/30/2024 694,089,889 59,407,761 9/30/2025 690,209,318 61,338,514 9/30/2026 684,087,550 63,332,015 9/30/2027 675,482,539 65,390,306 9/30/2028 664,130,836 67,515,491 9/30/2029 649,745,812 69,709,744 9/30/2030 632,015,733 71,975,311 9/30/2031 610,601,681 74,314,508 9/30/2032 585,135,307 76,729,730 9/30/2033 555,216,402 79,223,446 9/30/2034 520,410,267 81,798,208 9/30/2035 480,244,881 84,456,650 9/30/2036 434,207,821 87,201,491 9/30/2037 381,742,956 90,035,540 9/30/2038 322,246,853 92,961,695 9/30/2039 255,064,906 95,982,950 9/30/2040 179,487,149 99,102,396 9/30/2041 94,743,725 102,323,223 9/30/2042 0 0

Page 29
SCHEDULE H (continued)
AMORTIZATION SCHEDULE FOR CLOSED BASES AS OF SEPTEMBER 30, 2013
Valuation Date
Balance of Transitional
Closed 9/30/2013
Annual Amortization
Payment
Balance of New Incremental
UAAL 9/30/2013
Annual Amortization
Payment
9/30/2013 $641,033,144 $41,114,698 $420,529,361 $26,971,987 9/30/2014 651,201,098 42,450,925 427,199,723 27,848,577 9/30/2015 660,846,260 43,830,581 433,527,124 28,753,655 9/30/2016 669,883,380 45,255,074 439,455,639 29,688,149 9/30/2017 678,218,976 46,725,864 444,923,941 30,653,014 9/30/2018 685,750,630 48,244,455 449,864,842 31,649,237 9/30/2019 692,366,225 49,812,400 454,204,793 32,677,837 9/30/2020 697,943,124 51,431,303 457,863,339 33,739,867 9/30/2021 702,347,271 53,102,820 460,752,540 34,836,412 9/30/2022 705,432,232 54,828,662 462,776,330 35,968,596 9/30/2023 707,038,149 56,610,593 463,829,841 37,137,575 9/30/2024 706,990,608 58,450,438 463,798,653 38,344,546 9/30/2025 705,099,419 60,350,077 462,557,999 39,590,744 9/30/2026 701,157,296 62,311,454 459,971,894 40,877,443 9/30/2027 694,938,425 64,336,576 455,892,203 42,205,960 9/30/2028 686,196,923 66,427,515 450,157,619 43,577,654 9/30/2029 674,665,162 68,586,409 442,592,574 44,993,928 9/30/2030 660,051,965 70,815,468 433,006,052 46,456,230 9/30/2031 642,040,655 73,116,970 421,190,306 47,966,058 9/30/2032 620,286,936 75,493,272 406,919,473 49,524,955 9/30/2033 594,416,619 77,946,803 389,948,076 51,134,516 9/30/2034 564,023,146 80,480,074 370,009,406 52,796,388 9/30/2035 528,664,923 83,095,677 346,813,771 54,512,270 9/30/2036 487,862,440 85,796,286 320,046,603 56,283,919 9/30/2037 441,095,149 88,584,666 289,366,412 58,113,146 9/30/2038 387,798,095 91,463,667 254,402,579 60,001,824 9/30/2039 327,358,275 94,436,237 214,752,962 61,951,883 9/30/2040 259,110,700 97,505,414 169,981,316 63,965,319 9/30/2041 182,334,142 100,674,340 119,614,502 66,044,192 9/30/2042 96,246,534 103,946,256 63,139,470 68,190,628 9/30/2043 0 0 0 0

Page 30
SCHEDULE H (continued)
AMORTIZATION SCHEDULE FOR CLOSED BASES AS OF SEPTEMBER 30, 2014
Valuation Date
Balance of Transitional
Closed 9/30/2014
Annual Amortization
Payment
Balance of New Incremental
UAAL 9/30/2014
Annual Amortization
Payment
9/30/2014 $651,201,098 $41,766,852 $(166,584,327) $(10,684,415) 9/30/2015 661,530,334 43,124,275 (169,226,658) (11,031,659) 9/30/2016 671,328,486 44,525,813 (171,733,132) (11,390,188) 9/30/2017 680,508,952 45,972,902 (174,081,595) (11,760,369) 9/30/2018 688,976,765 47,467,022 (176,247,754) (12,142,581) 9/30/2019 696,627,885 49,009,700 (178,204,993) (12,537,215) 9/30/2020 703,348,416 50,602,515 (179,924,178) (12,944,674) 9/30/2021 709,013,774 52,247,097 (181,373,439) (13,365,376) 9/30/2022 713,487,779 53,945,128 (182,517,938) (13,799,751) 9/30/2023 716,621,673 55,698,344 (183,319,622) (14,248,243) 9/30/2024 718,253,063 57,508,540 (183,736,949) (14,711,310) 9/30/2025 718,204,768 59,377,568 (183,724,595) (15,189,428) 9/30/2026 716,283,581 61,307,339 (183,233,134) (15,683,084) 9/30/2027 712,278,929 63,299,827 (182,208,701) (16,192,785) 9/30/2028 705,961,415 65,357,072 (180,592,612) (16,719,050) 9/30/2029 697,081,257 67,481,177 (178,320,971) (17,262,419) 9/30/2030 685,366,581 69,674,315 (175,324,229) (17,823,448) 9/30/2031 670,521,592 71,938,730 (171,526,720) (18,402,710) 9/30/2032 652,224,589 74,276,739 (166,846,147) (19,000,798) 9/30/2033 630,125,818 76,690,733 (161,193,041) (19,618,324) 9/30/2034 603,845,150 79,183,182 (154,470,160) (20,255,920) 9/30/2035 572,969,581 81,756,635 (146,571,854) (20,914,237) 9/30/2036 537,050,512 84,413,726 (137,383,365) (21,593,950) 9/30/2037 495,600,827 87,157,172 (126,780,085) (22,295,753) 9/30/2038 448,091,721 89,989,780 (114,626,738) (23,020,365) 9/30/2039 393,949,279 92,914,448 (100,776,512) (23,768,527) 9/30/2040 332,550,774 95,934,167 (85,070,107) (24,541,004) 9/30/2041 263,220,668 99,052,028 (67,334,711) (25,338,587) 9/30/2042 185,226,294 102,271,219 (47,382,902) (26,162,091) 9/30/2043 97,773,179 105,595,033 (25,011,443) (27,012,359) 9/30/2044 0 0 0 0
Page 31
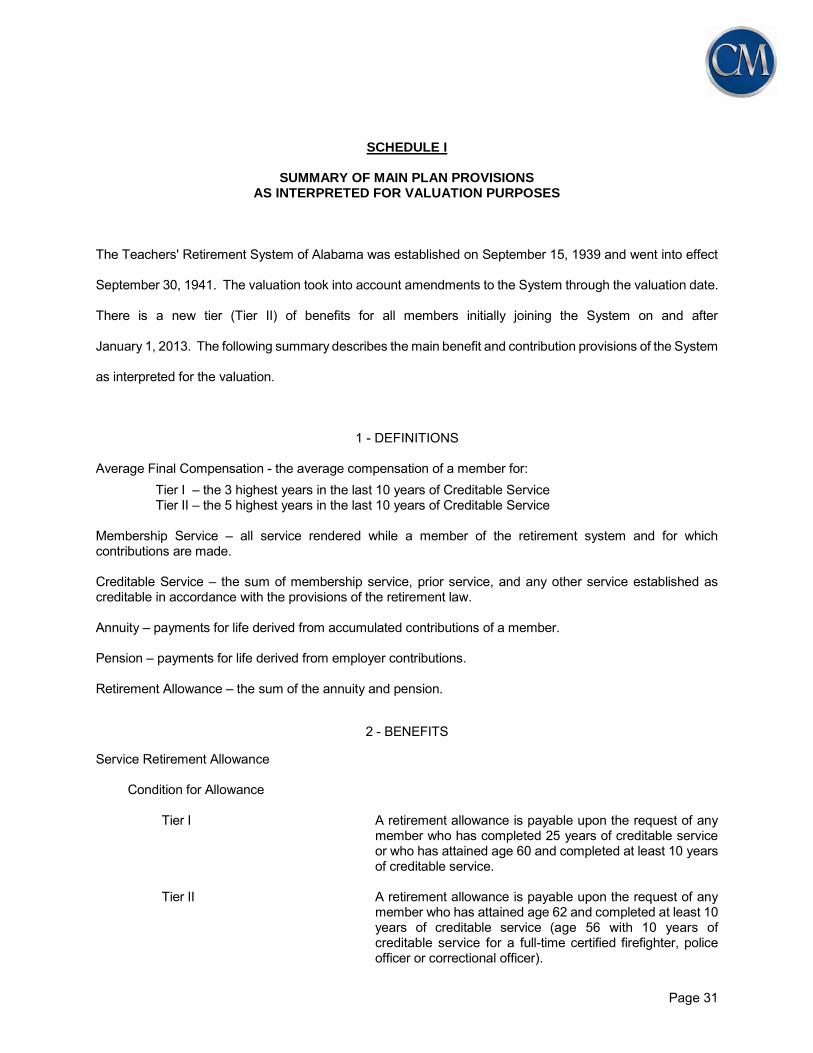
SCHEDULE I
SUMMARY OF MAIN PLAN PROVISIONS
AS INTERPRETED FOR VALUATION PURPOSES
The Teachers' Retirement System of Alabama was established on September 15, 1939 and went into effect
September 30, 1941. The valuation took into account amendments to the System through the valuation date.
There is a new tier (Tier II) of benefits for all members initially joining the System on and after
January 1, 2013. The following summary describes the main benefit and contribution provisions of the System
as interpreted for the valuation.
1 - DEFINITIONS
Average Final Compensation - the average compensation of a member for:
Tier I – the 3 highest years in the last 10 years of Creditable Service Tier II – the 5 highest years in the last 10 years of Creditable Service
Membership Service – all service rendered while a member of the retirement system and for which contributions are made. Creditable Service – the sum of membership service, prior service, and any other service established as creditable in accordance with the provisions of the retirement law. Annuity – payments for life derived from accumulated contributions of a member. Pension – payments for life derived from employer contributions. Retirement Allowance – the sum of the annuity and pension. 2 - BENEFITS Service Retirement Allowance Condition for Allowance Tier I A retirement allowance is payable upon the request of any
member who has completed 25 years of creditable service or who has attained age 60 and completed at least 10 years of creditable service.
Tier II A retirement allowance is payable upon the request of any
member who has attained age 62 and completed at least 10 years of creditable service (age 56 with 10 years of creditable service for a full-time certified firefighter, police officer or correctional officer).

Page 32
Amount of Allowance Tier I Upon service retirement a member receives a retirement
allowance equal to 2.0125% of the member's average final compensation multiplied by the number of years of creditable service. At retirement, a member receives one additional year of creditable service in determining the retirement allowance for each five years of service as a full-time certified firefighter, police officer or correctional officer.
Tier II Upon service retirement a member receives a retirement
allowance equal to 1.65% of the member's average final compensation multiplied by the number of years of creditable service. The benefit is capped at 80% of the member’s average final compensation.
Both The member may elect to receive a reduced retirement
allowance in order to provide an allowance to a designated beneficiary after the member’s death (see “Special Privileges at Retirement” below).
Disability Retirement Allowance Condition for Allowance A disability retirement allowance may be granted to a
member who has 10 years or more of creditable service who becomes totally and permanently incapacitated for duty before reaching eligibility for a service retirement allowance.
Amount of Allowance Tier I On retirement for disability, a member receives a retirement
allowance equal to 2.0125% of the member's average final compensation multiplied by the number of years of creditable service. At retirement, a member receives one additional year of creditable service in determining the retirement allowance for each five years of service as a full-time certified firefighter, police officer or correctional officer.
Tier II Upon disability retirement a member receives a retirement
allowance equal to 1.65% of the member's average final compensation multiplied by the number of years of creditable service. The benefit is capped at 80% of the member’s average final compensation.
Both The member may elect to receive a reduced retirement
allowance in order to provide an allowance to a designated beneficiary after the member’s death (see “Special Privileges at Retirement” below).
Page 33
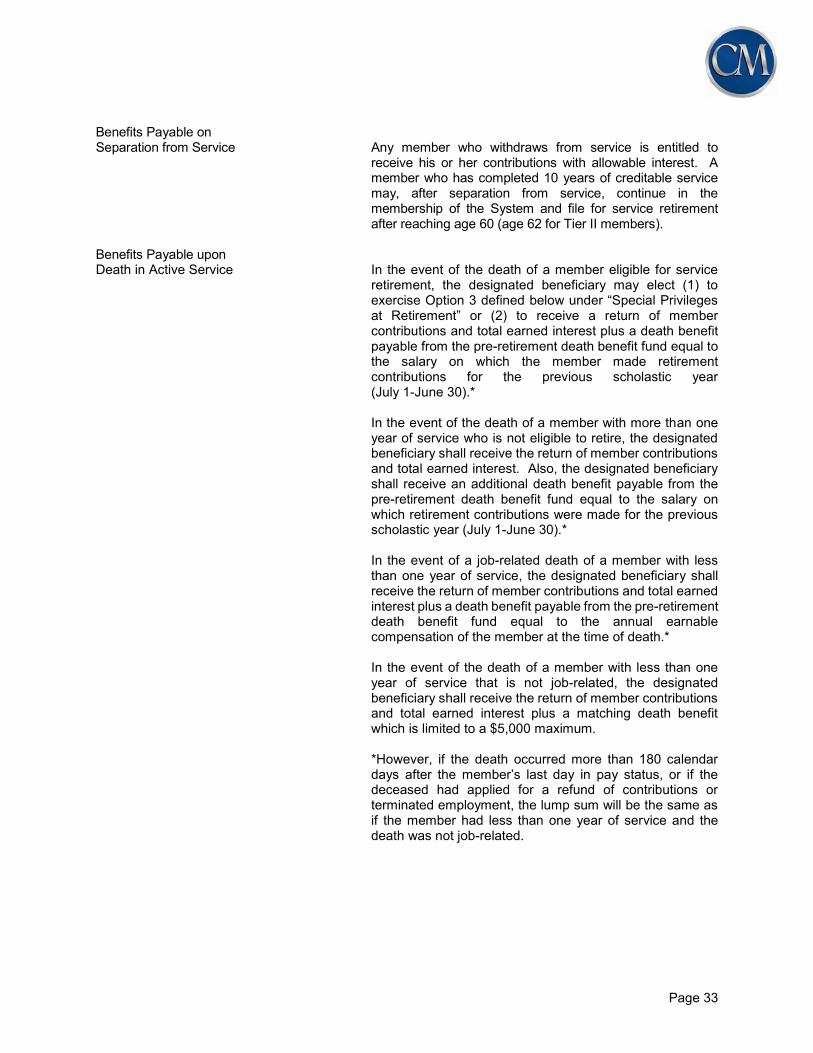
Benefits Payable on Separation from Service Any member who withdraws from service is entitled to
receive his or her contributions with allowable interest. A member who has completed 10 years of creditable service may, after separation from service, continue in the membership of the System and file for service retirement after reaching age 60 (age 62 for Tier II members).
Benefits Payable upon Death in Active Service In the event of the death of a member eligible for service
retirement, the designated beneficiary may elect (1) to exercise Option 3 defined below under “Special Privileges at Retirement” or (2) to receive a return of member contributions and total earned interest plus a death benefit payable from the pre-retirement death benefit fund equal to the salary on which the member made retirement contributions for the previous scholastic year (July 1-June 30).*
In the event of the death of a member with more than one
year of service who is not eligible to retire, the designated beneficiary shall receive the return of member contributions and total earned interest. Also, the designated beneficiary shall receive an additional death benefit payable from the pre-retirement death benefit fund equal to the salary on which retirement contributions were made for the previous scholastic year (July 1-June 30).*
In the event of a job-related death of a member with less
than one year of service, the designated beneficiary shall receive the return of member contributions and total earned interest plus a death benefit payable from the pre-retirement death benefit fund equal to the annual earnable compensation of the member at the time of death.*
In the event of the death of a member with less than one
year of service that is not job-related, the designated beneficiary shall receive the return of member contributions and total earned interest plus a matching death benefit which is limited to a $5,000 maximum.
*However, if the death occurred more than 180 calendar
days after the member’s last day in pay status, or if the deceased had applied for a refund of contributions or terminated employment, the lump sum will be the same as if the member had less than one year of service and the death was not job-related.

Page 34
Special Privileges at Retirement In lieu of the full retirement allowance, any member may, at
retirement, elect to receive a reduced retirement allowance equal in value to the full allowance, with the provision that:
Option 1 - If the member dies before annuity payments have
equaled the present value of the annuity at the date of retirement, the balance is paid to a designated beneficiary or to his estate, or
Option 2 - After the member’s death, the member’s allowance
is continued throughout the life of the designated beneficiary, or
Option 3 - After the member’s death, one-half of the
member’s allowance is continued throughout the life of the designated beneficiary, or
Option 4 - Some other benefit is paid either to the member
or to such other person as the member shall designate provided such benefit, together with the reduced retirement allowance, is of equivalent actuarial value to his retirement allowance and is approved by the Board of Control.
Deferred Retirement Option Plan (DROP) Prior to March 25, 2011, a member may elect to participate
in the Deferred Retirement Option Plan (DROP) upon completion of at least 25 years of creditable service (excluding sick leave) and attainment of at least 55 years of age. Under the DROP, the member may defer receipt of a retirement allowance and continue employment for a period not to exceed five years, nor to be less than three years. At the end of this period, the member will withdraw from active service and receive the retirement benefit calculated at the time of enrollment in the DROP, and also receive a payment for the deferred retirement benefits, employee contributions while participating in the DROP and interest earned on DROP deposits.
The effect of Act 2011-27 is that no new participants will be
allowed to enter DROP with an effective participation date after June 1, 2011.
Term Life Insurance Upon the death of a contributing member there is paid a term
life insurance benefit of $15,000 (pro-rated for part-time members)

Page 35
Member Contributions Tier I Prior to October 1, 2011, regular members contributed 5.0%
of salary and certified police officers, firefighters and correctional officers contributed 6.0% of salary. DROP participants continue to contribute during the DROP period, but receive a refund of these contributions and regular interest upon retirement.
Beginning October 1, 2011, the contribution rates were increased to 7.25% for regular members and 8.25% for police officers, firefighters and correctional officers.
Beginning October 1, 2012, the contribution rates were
increased to 7.50% for regular members and 8.50% for police officers, firefighters and correctional officers.
Tier II Regular members contribute 6% of salary and full-time
certified firefighters, police officers and correctional officers contribute 7% of salary
Both If positive investment performance results in a decrease in
the total contribution rate paid by employers and employees participating in the System, the Retirement System of Alabama shall first reduce the employee contribution rate.
“Regular Interest” is 4% which is the rate adopted by the
Board and applied to the balance in each member’s’ account every year; however, if a member receives a refund of contributions, the interest rate applied to the refund is lower than the 4% regular rate (Based on Section 16-25-14-(g)(1)).

Page 36
SCHEDULE J
SCHEDULE OF MEMBERSHIP DATA AS OF SEPTEMBER 30, 2014
NUMBER OF ACTIVE MEMBERS AND THEIR AVERAGE COMPENSATION BY AGE AND YEARS OF SERVICE
Attained
Age Years of Service
Under 1 1 to 4 5 to 9 10 to 14 15 to 19 20 to 24 25 to 29 30 to 34 35 to 39 > 40 Total
Under 25 1,098 1,417 11 2,526
Avg. Pay 30,926 30,450 33,122 30,668
25 to 29 1,502 7,355 1,741 11 10,609
Avg. Pay 32,380 35,385 42,112 29,736 36,058
30 to 34 1,024 4,761 6,454 1,856 11 14,106
Avg. Pay 34,577 38,325 45,784 48,965 39,571 42,866
35 to 39 837 4,039 4,550 5,711 1,516 13 16,666
Avg. Pay 34,752 40,198 46,141 51,534 54,386 46,753 46,727
40 to 44 761 3,606 4,246 4,037 5,395 1,296 11 19,352
Avg. Pay 33,570 37,035 45,041 49,888 56,163 57,689 52,989 48,061
45 to 49 577 2,934 3,749 3,623 3,816 4,057 945 12 19,713
Avg. Pay 32,397 36,318 43,197 46,148 52,713 59,081 58,939 46,027 48,267
50 to 54 438 2,425 3,220 3,563 3,743 3,010 2,227 533 21 19,180
Avg. Pay 31,437 36,027 41,104 43,069 47,745 56,015 58,267 58,934 45,456 46,735
55 to 59 289 1,794 2,532 2,936 3,414 3,084 1,966 1,071 351 17,437
Avg. Pay 31,712 38,886 40,455 43,261 46,548 52,584 57,816 62,545 60,847 47,684
60 to 64 273 1,499 1,655 1,711 1,893 1,851 1,150 125 57 13 10,227
Avg. Pay 49,211 49,952 41,035 43,524 45,506 51,489 58,022 73,761 65,372 69,293 48,178
65 to 69 79 637 963 700 526 496 343 38 23 11 3,816
Avg. Pay 44,355 51,957 50,001 45,303 45,480 52,883 63,311 76,747 76,295 76,863 50,799
70 & up 37 205 472 339 215 160 109 25 20 16 1,598
Avg. Pay 42,782 47,856 47,240 35,641 41,984 55,876 65,145 56,190 69,916 118,188 47,268
Total 6,915 30,672 29,593 24,487 20,529 13,967 6,751 1,804 472 40 135,230
Avg. Pay 33,663 37,925 44,113 47,080 50,843 55,582 58,547 62,356 61,846 90,933 45,958
Average Age: 45.29 Average Service: 10.98

Page 37
SCHEDULE J (continued)
NUMBER OF SERVICE RETIREMENTS AND THEIR BENEFITS BY AGE
Age
Number of Members
Total Annual Benefits
Average Annual Benefits
Under 50 272 $ 7,835,377 $ 28,807 50 – 54 1,881 54,292,939 28,864 55 – 59 5,272 153,346,913 29,087 60 – 64 14,755 370,238,272 25,092 65 – 69 18,785 437,152,859 23,271 70 – 74 13,389 299,688,136 22,383 75 – 79 9,327 196,803,357 21,100 80 – 84 6,286 124,282,006 19,771 85 – 89 3,568 66,200,582 18,554 90 – 94 1,443 24,134,013 16,725
95 & Over 489 7,304,922 14,938
Total 75,467 $ 1,741,279,376 $ 23,073 Average Age: 69.9
NUMBER OF DROP PARTICIPANTS AND THEIR BENEFITS BY AGE
Age Number
of Members Total
Annual Benefits Average
Annual Benefits
55 – 59 587 $ 21,326,484 $ 36,331 60 – 64 907 31,751,967 35,008 65 – 69 208 7,290,361 35,050 70 – 74 34 1,302,289 38,303 75 – 79 12 491,135 40,928 80 – 84
85 & Over
Total 1,748 $ 62,162,236 $ 35,562 Average Age: 61.3

Page 38
SCHEDULE J (continued)
NUMBER OF BENEFICIARIES AND THEIR BENEFITS BY AGE
Age
Number of Members
Total Annual Benefits
Average Annual Benefits
Under 50 328 $ 3,555,598 $ 10,840 50 – 54 178 1,873,555 10,526 55 – 59 261 3,153,210 12,081 60 – 64 397 5,921,985 14,917 65 – 69 545 8,832,611 16,207 70 – 74 620 10,485,277 16,912 75 – 79 641 10,029,675 15,647 80 – 84 614 9,375,129 15,269 85 – 89 500 7,347,261 14,695 90 – 94 253 3,240,545 12,808
95 & Over 67 718,176 10,719
Total 4,404 $ 64,533,022 $ 14,653 Average Age: 71.7
NUMBER OF DISABLED RETIREES
AND THEIR BENEFITS BY AGE
Age Number
of Members Total
Annual Benefits Average
Annual Benefits
Under 50 367 $ 4,104,546 $ 11,184 50 – 54 542 6,129,332 11,309 55 – 59 983 11,300,583 11,496 60 – 64 1,278 14,582,749 11,411 65 – 69 1,068 11,510,403 10,778 70 – 74 610 6,682,294 10,955 75 – 79 269 3,013,461 11,202 80 – 84 146 1,535,717 10,519 85 – 89 55 621,868 11,307 90 – 94 14 176,384 12,599
95 & Over 6 79,894 13,316
Total 5,338 $ 59,737,231 $ 11,191 Average Age: 62.7