Embed Size (px)
Citation preview
at SciVerse ScienceDirect
Teaching and Teacher Education 28 (2012) 791e805
Contents lists available
Teaching and Teacher Education
journal homepage: www.elsevier .com/locate/ tate
Motivations for choosing teaching as a career: An international comparisonusing the FIT-Choice scale
Helen M.G. Watt a,*, Paul W. Richardson a,1, Uta Klusmann b,1, Mareike Kunter c, Beate Beyer d,Ulrich Trautwein d, Jürgen Baumert e
a Faculty of Education, Monash University, Clayton Campus, Wellington Road, Melbourne, Victoria 3800, AustraliabChristian Albrechts University at Kiel, GermanycGoethe University, Frankfurt am Main, GermanydUniversity of Tübingen, GermanyeMax Planck Institute for Human Development, Germany
a r t i c l e i n f o
Article history:Received 5 February 2011Received in revised form28 February 2012Accepted 5 March 2012
Keywords:Teaching motivationsBeginning teachersSample comparisonsFIT-Choice scaleExpectancy-value theory
* Corresponding author. Tel.: þ613 9905 3276; fax:E-mail address: [email protected] (H.M.G. W
1 These authors contributed equally to the article.
0742-051X/$ e see front matter � 2012 Elsevier Ltd.doi:10.1016/j.tate.2012.03.003
a b s t r a c t
Motivations for preservice teachers’ choice of teaching as a career were investigated using the FactorsInfluencing Teaching Choice scale (FIT-Choice scale; Watt & Richardson, 2007). This scale was initiallydeveloped and validated in the Australian context; our study applied it across international samples fromAustralia, the United States, Germany, and Norway. Support for strong factorial invariance implied thescale functioned similarly, and could fruitfully be employed in different contexts. Sample comparisonsrevealed that motivations for teaching were more similar than they were different across these samples;whereas, perceptions about the teaching profession tended to reflect country differences.
� 2012 Elsevier Ltd. All rights reserved.
International research interest in what motivates people to takeon a teaching career has resulted in a steady flow of studies andreports from many countries, with notably early investigations inBritain during the depression (Valentine, 1934) and at the close ofthe Second World War (Tudhope, 1944). Although teaching wouldappear to be an occupation considered central to a country’sdevelopment and wellbeing, Australia, the U.S., Germany andNorway, among other countries including the U.K. and severalEuropean countries, report difficulties recruiting and retainingteachers (see Johnson & Birkeland, 2003; Liu, Kardos, Kauffman,Preske, & Johnson, 2000; OECD, 2004a,b, 2011; Ofsted, 2001;Preston, 2000; Ramsay, 2000). A pattern of teacher shortages fol-lowed by surpluses is a long cycle in most countries. The onset ofthe global financial crisis since 2008 may be likely to impact thesupply of teachers particularly in countries where they are classi-fied as public servants, who are offered job security and a fundedretirement pension, despite relatively lower salaries to otheroccupations. However, contexts adversely affected by the financialdownturn such as the U.S. and several European countries, are
þ613 9905 5127.att).
All rights reserved.
consequently able to offer fewer teaching positions, or laying offteachers as has begun to be reported in the media in the U.S. Overthe last decade there has been renewed research interest inunderstanding what motivates people to choose teaching asa career and what motivates them to persist in the profession, asteachers’ daily job has become more complex and demanding,contending with increasingly “diverse student populations, highersocial expectations of schools, expanding fields of knowledge, andnew types of responsibilities” (OECD, 2005).
While there have been many studies of teacher motivation indifferent contexts over time, there has not been a reliable measureupon which researchers could draw which would permit compar-isons across different settings and samples, or prediction of variousoutcomes over time. This has resulted in an abundance of findingswhich cannot be directly compared or synthesised. To understandhow initial motivations impact teacher recruitment, retention andeffectiveness, within and across different kinds of samples andsettings, we need first to have a valid and reliable instrumentencompassing comprehensive teaching motivations and groundedin motivational theory. Such an instrument would offer theopportunity to measure and compare motivations for differentindividuals, from varying settings, and to explore correlates andconsequences of motivational dimensions.
H.M.G. Watt et al. / Teaching and Teacher Education 28 (2012) 791e805792
The FIT-Choice (Factors Influencing Teaching Choice) scale wasdeveloped to assess the primary motivations of teachers to teach,and was demonstrated to be psychometrically sound in its initialuse among a sample of 1653 Australian preservice teachers (Watt &Richardson, 2007). Further, it has been shown to predict bothpositive and negative outcome variables among beginningteachers: the motivations that related most strongly to high initialcareer satisfaction included the altruistic-type motivations mostfrequently emphasised in the teacher education literature, theintrinsic value individuals attached to teaching, and self-evaluations of their teaching-related skills (Watt & Richardson,2007). For subsequent planned persistence, planned effort,professional development, leadership aspirations, and careerchoice satisfaction, similar patterns of correlation were observed.Beginning teachers’ ability beliefs, intrinsic value, and social utilityvalues demonstrated significant positive correlations with theselater measures; positive prior teaching and learning motivationsrelated significantly positively to later planned persistence in theprofession; choosing teaching as a fallback career correlatednegatively across all five later measures; personal utility values (jobsecurity, transferability, time for family) related negatively to laterplanned persistence and career choice satisfaction (see Watt &Richardson, 2007). Such findings resonate with earlier untestedclaims that such personal utility motivations are somehow“unworthy” (e.g., Yong, 1995).
We set out to test whether the FIT-Choice scale would functionsimilarly among samples sourced from different settings. For thescale to be useful to researchers from a range of socioculturalcontexts, it is necessary to test whether the instrument performssimilarly across samples and settings; only in this case is it justifiedto compare teaching motivations from different contexts using thesame instrument. We had the opportunity to sample preserviceteachers from the U.S., Australia, Germany, and Norway, to firstlytest the utility of the scale, and secondly obtain first indications ofcontextual differences. Before exploration of sample differencescould be meaningfully undertaken, construct equivalence must beestablished which requires testing for strong factorial invariance.Measurement equivalence indicates that constructs are general-iseable to each of the contexts, that sources of bias and error areminimal, that cultural differences have not differentially affectedthe constructs’ underlying measurement characteristics, and thatbetween-culture differences in construct means, variances andcovariances are quantitative in nature, such that sample differenceson the constructs can be examined in a quantitative manner (Little,1997; Meredith, 1993).
1. Motivations for teaching
Similar reasons for choosing teaching have surfaced in variousforms, combinations, and rankings over the last five decades. Inbrief, a review of this body of research conducted up until the early1990s suggested that “altruistic, service-oriented goals and otherintrinsic motivations are the source of the primary reasons enteringteacher candidates report for why they chose teaching as a career”(Brookhart & Freeman, 1992, p. 46). These researchers highlightedintrinsic, extrinsic and altruistic motivations as the most importantgroups of reasons influencing teachers’ career choice. Identifiedmotivations have included working with children and adolescents,making a social contribution, making a difference, job security, jobbenefits, enjoyment of teaching, compatibility with other interestsand activities, compatibility with family life, and self-education(Organisation for Economic Co-operation and Development[OECD], 2005). According to an OECD report (OECD, 2005), studiesin France, Australia, Belgium (French Community), Canada(Québec), the Netherlands, the Slovak Republic, and the U.K.
suggest that a desire to work with children and adolescents, thepotential for intellectual fulfilment, and a means by which to makea social contribution, are the most frequently nominated reasonsfor choosing teaching as a career. On the other hand, studies con-ducted in very different sociocultural contexts such as in Brunei(Yong, 1995), Zimbabwe (Chivore, 1988), Cameroon (Abangma,1981), and Jamaica (Bastick, 1999), have found what they termextrinsic motives to be more important, in the form of salary, jobsecurity, and career status.
Despite recognition that the demand and supply of teachers iscyclical in many countries, too little systematically collected andanalysed data exists onwhatmotivates people to choose teaching asa career. A significant proportion of the research on teacher moti-vations has been conducted in the U.S., mostly founded on surveysand with some studies incorporating a qualitative component (e.g.,Alexander, Chant, & Cox, 1994; Bastick, 1999; Hanushek & Pace,1995; Jantzen, 1981; Joseph & Green, 1986), although the methodsof analysis and reporting of results have not always been assophisticated as they could have been, frequently utilising single-item indicators, raw frequency counts, and the ranking of themes,resulting in a lack of consistency across studies. Researchers havedeveloped and implemented survey instruments without infor-mation regarding reliability or validity, and results have at timesbeen reported without inclusion of the survey instruments.
The absence of an agreed upon analytical and theoreticalframework has meant researchers have not always concurred onwhat constitutes intrinsic, altruistic, extrinsic, or other motivationsexamined by individual researchers. Various operationalisations ofintrinsic, extrinsic, and altruistic motivations have resulted in a lackof definitional precision and overlapping categorisations from onestudy to another. For example, the desire to work with children hasbeen frequently nominated as a form of intrinsic motivation (e.g.,Young, 1995) and has also often been referred to as a form ofaltruistic motivation (e.g., Yong, 1995). What is needed to investi-gate reasons for becoming a teacher is a scale that encompasses thearray of motivations, which taps the underlying psychologicalprocesses, and that can be used to study different groups of peoplefrom different kinds of settings.
1.1. Theoretical background and initial scale development
Previously identified teachingmotivations can bemapped to themain constructs in the expectancy-value motivational theory(Eccles, 2005; Eccles (Parsons) et al., 1983; Wigfield & Eccles, 2000)on which the FIT-Choice scale is founded, allowing us to locatethem within an integrative and comprehensive motivationalframework to provide a theoretically grounded basis to approachthe question of teaching as a career choice. The FIT-Choice modeltaps both the “altruistic”-type motivations that have beenemphasised in the teacher education literature (e.g., Book &Freeman, 1986; Brown, 1992; Lortie, 1975; Moran, Kilpatrick,Abbott, Dallatt, & McClune, 2001; Serow & Forrest, 1994), as wellas more personally utilitarian motivations, intrinsic motivations,and ability-related beliefs. It also taps individuals’ perceptionsabout the demand and reward aspects of the teaching profession,and contains a measure of career satisfaction and commitment.
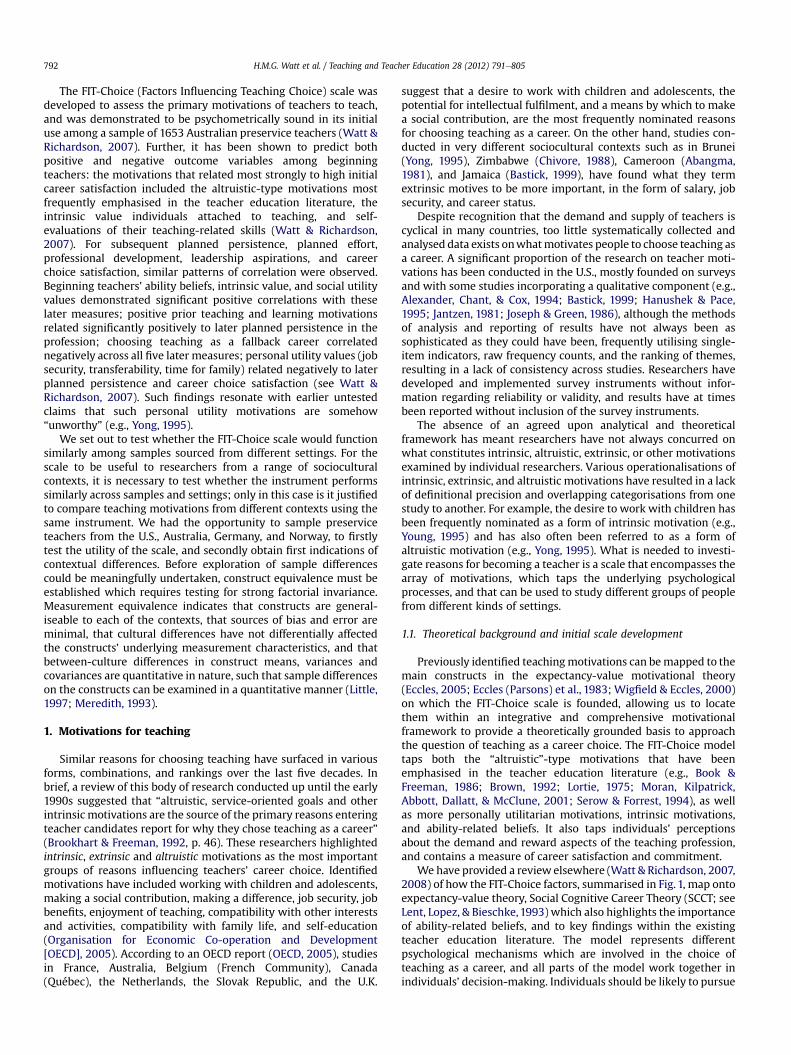
We have provided a review elsewhere (Watt & Richardson, 2007,2008) of how the FIT-Choice factors, summarised in Fig. 1, map ontoexpectancy-value theory, Social Cognitive Career Theory (SCCT; seeLent, Lopez, & Bieschke,1993) which also highlights the importanceof ability-related beliefs, and to key findings within the existingteacher education literature. The model represents differentpsychological mechanisms which are involved in the choice ofteaching as a career, and all parts of the model work together inindividuals’ decision-making. Individuals should be likely to pursue
Fig. 1. The FIT-Choice theoretical model.
H.M.G. Watt et al. / Teaching and Teacher Education 28 (2012) 791e805 793
choices for which they expect they have the requisite abilities, towhich they attach value, and which do not demand too great a cost.The expectancy-value model has been influential in the motivationliterature, with a wealth of empirical work to support its utility andvalidity for explaining students’ achievement-related choices (forreviews see Eccles, 2005; Wigfield & Eccles, 2000). Althoughinitially developed as a framework for explaining students’ choicesto participate in mathematics in high school (Eccles (Parsons) et al.,1983), it has since been fruitfully applied to other academic schooldisciplines, such as English and language arts (Jacobs, Lanza,Osgood, Eccles, & Wigfield, 2002; Watt, 2004) and sport(Fredricks & Eccles, 2002), as well as to specific types of careers(e.g., Watt, 2002, 2006, 2008; Watt et al., in press). Eccles and hercolleagues propose that educational, vocational and otherachievement-related choices are directly related to two sets ofindividual beliefs: one’s ability beliefs and expectations for success,and the value one attaches to the task (Eccles, 2005; Eccles(Parsons) et al., 1983; Wigfield & Eccles, 2000).
Success expectancies depend on beliefs about howmuch abilityone possesses, defined by Eccles et al. as beliefs about howwell onewill perform on an impending task; expectations for success areshaped over time by the individual’s experiences and her or hisinterpretations of them (see Eccles &Wigfield,1995). The value thata person holds for a task is critical, and this is influenced bya number of factors: does the person enjoy the task? does theperson think the task is useful? is the task instrumental for any ofthe person’s own goals? “Intrinsic value” has been likened tointerest and enjoyment, “utility value” taps more instrumentalreasons for task engagement, and “attainment value” refers to thesubjective importance of achieving the task. “Cost” refers to whatthe individual must give up in order to pursue a task, whetherfinancial, psychological, or in terms of time which cannot be spenton other valued activities.
The major identified teaching motives within the teachereducation literature e intrinsic, extrinsic and altruistic (Brookhart& Freeman, 1992) e fit within the expectancy-value “values”component, further differentiated into more nuanced intrinsic,utility, attainment, and cost values. The Eccles et al. expectancy-
value model (1983) thereby provides a comprehensive frameworkinto which previously identified motives can readily be incorpo-rated, while also suggesting others. The sequencing of the FIT-Choice model (Fig. 1) consists of antecedent socialisation influ-ences, followed by more proximal influences of task perceptions,self perceptions, values, and fallback career. Higher-order taskdemand and return constructs in turn contain first-orderconstructs: expertise and high demand comprise the higher-ordertask demand construct; social status and salary comprise thehigher-order task return construct. We expected that highperceptions of task demand would deter people from a teachingcareer, although this may be moderated by perceptions of high taskreturn. The discrepancy between the two also relates conceptuallyto the less researched cost value component of the expectancy-value model (Eccles (Parsons) et al., 1983; Wigfield & Eccles, 2000).
Values constructs in the FIT-Choice model are intrinsic value,personal utility value and social utility value. The last two valuesconstructs contain component first-order constructs: job security,time for family, and job transferability comprise personal utilityvalue; shape future of children/adolescents, enhance social equity,make a social contribution, and work with children/adolescentscomprise the higher-order social utility value construct.
Social utility value factors resemble altruism as variouslydescribed in the teacher education literature (Book & Freeman,1986; Brown, 1992; Fox, 1961; Joseph & Green, 1986; Serow,Eaker, & Ciechalski, 1992). Positive prior teaching and learningexperiences, especially in relation to former influential teachers,have also been linked to choosing a teaching career (Book &Freeman, 1986; Fielstra, 1955; Lortie, 1975; Richards, 1960;Robertson, Keith, & Page, 1983; Wright, 1977), as have variousquality of life issues such as having time for family and job security(Jantzen, 1981; Richardson & Watt, 2006; Tudhope, 1944), whichare assessed by personal utility value factors. Subjective goals whichmay relate to the choice of a teaching career are provided byresearch findings that people entering teaching have frequentlychosen this career for reasons independent of the career content.Rather, they have chosen the career for reasons relating to quality oflife issues, such as permitting more time with family, providing
H.M.G. Watt et al. / Teaching and Teacher Education 28 (2012) 791e805794
a secure income, or opportunities to travel (e.g., Bastick, 1999;Robertson et al., 1983; Yong, 1995). Studies concerning people’sreasons for never considering teaching (see Kyriacou & Coulthard,2000) and for leaving teaching (see Fresko, Kfir, & Nasser, 1997;Liu et al., 2000) provide further insights into how people aredirected away from the teaching profession because it does notprovide for their personal goals. In prior research, such quality oflife reasons have frequently been nominated as extrinsic, althoughthat label obscures the distinction between quality of life issues andother factors that we distinguish as socialisation influences andtask perceptions. Researchers have previously identified “extrinsic”quality of life motivations as detrimental to producing teacherswho are fully engaged with and committed to the profession (e.g.,Sparkes, 1988; Woods, 1981).
Intrinsic value and perceived ability have been less a focus in theteacher education literature, although in the motivation literaturesuch constructs are the main focus of several models, including inthe expectancy-value model, and ability-related beliefs have beenthe focus in the career choice literature more generally. In light ofclaims in the teacher education literature and the public mediaregarding teaching as a “fallback” career, where entrants may havefailed to be accepted into their career of choice or otherwise beenunable to pursue their first-choice career (see Book et al., 1985;Haubrich, 1960; Robertson et al., 1983), we developed the fallbackcareer subscale. This construct reflected the possibility of peoplenot so much having chosen teaching, but rather having defaulted toit. Those items asked whether participants had chosen teaching forreasons related to not being accepted into their university degree ofchoice, or being unsure what career they wanted.
Previous empirical validation of the FIT-Choice model (Watt &Richardson, 2007) has confirmed the importance of a number offactors previously nominated within the teacher education litera-ture. Further, we have shown the relevance and importance ofadditional factors not previously focused on in the teacher educa-tion literature. In particular, intrinsic value and ability beliefs,emphasised as major influences in the expectancy-value frame-work, were found to be among the highest rated motivations forAustralian preservice teachers choosing a teaching career(Richardson & Watt, 2006), rated similarly high to the social utilityfactors which have been the main focus of the teacher educationresearch to date.
1.2. Sample backgrounds
Motivations for career choices are forged from personal valuesand expectancies, experienced in particular sociocultural settingswithin the context of different demand and reward structures.Australia, the U.S., Germany, and Norway each experienced seriousshortages of teachers following World War II, followed by a periodof relative over-supply in the 1980s and early 1990s, and now againface increasing shortages in relation to specific regions and disci-plinary areas, particularly in the sciences despite targeted programsdesigned to recruit qualified teachers (e.g., DEST., 2003; Jones &Sandridge, 1997; Murnane, 1995; Naess, 2002 cited in Lyng &Blichfeldt, 2003; OECD, 2005). Teachers who were recruitedthirty years ago are now eligible to retire, promising to furtherescalate these shortages (MCEETYA, 2002; OECD, 2005, 2011).There is substantial variability in areas of teacher shortage withsome experiencing relative over-supply, particularly settingsexperiencing financial downturn where measures such as schoolclosures, increasing class sizes and cutting some subjects haveresulted in fewer job openings.
Salary scales for teachers vary considerably across the OECDcountries. Comparison of the salary scales in United StatesDollars (converted using Purchasing Power Parities), indicate that
primary/elementary and lower secondary teachers in Germany, theU.S., Australia, and Norway have starting salaries above the meanOECD teaching salary; starting salaries for upper secondaryteachers in Norway fall slightly below, while the U.S. and Australiaare well above, and Germany is highest of all (OECD, 2005). After 15years of teaching experience, salaries for elementary, lowersecondary, and upper secondary teachers in Norway are well belowthe OECD mean; teachers in Germany, the U.S., and Australia arewell above it. German upper secondary teachers are located aheadof their counterparts in the U.S. and Australia; upper secondaryteachers in Norway fall into the bottom quartile of the distribution.
While these variations between the four countries are of someinterest, they are less significant than within country comparisons,for instance, the buying power of a teacher’s salary, comparisonswith salaries of graduates who have similar qualifications, and thepotential for salary increases and career development over time. Inalmost all member countries of the OECD, teacher salaries fellrelative to national income per head during the late 1990s and haveremained less competitive since (OECD, 2011). In Norway, theannual salary and life-span income of teachers has been lowcompared with other professionals who have similar levels ofhigher educational attainment (Lyng & Blichfeldt, 2003). Recentwork in the U.S. (Liu et al., 2000) suggests that the increasing salarygap between teaching and other professions, poor working condi-tions in schools, combinedwith the disappointments and hardshipsfrom teaching are influential in why new teachers leave theprofession. Despite relatively high salaries in Germany, teachersperceive that they have low social prestige (Baumert, Klieme,Oelkers, & Scheerens, 2003), suggesting that salary alone does notresult inperceptions of high status. Not all of the rewards of teachingare accounted for in strictly material terms; differences in rewardstructures exist across the four countries in terms of salary andbenefits such as housing subsidies to attract teachers into hard-to-staff areas. The availability of part-time and casual work, togetherwith defined periods of leave during school vacation times, providea high degree of career flexibility sought perhaps mainly by womenseeking to spend more time with their families. This would appearto be the case in Germany, where of the almost 50% of primaryschool teachers who are employed on a part-time basis, 96% arefemale (Halász, Santiago, Ekholm, Matthews, & McKenzie, 2004).
Norway has a scattered population of 4.3 million, in whicha substantial proportion of primary and lower secondary schools(40%) are small (below 100 students), where children of differentages are frequently taught in the same classroom. Norway has theinteresting dimension of a schooling system that promotes prin-ciples of unity and equality (Lyng & Blichfeldt, 2003, p. 69), havingcompulsory education for ages six to 16 years within which allstudents are integrated. As a result of the reforms during the 1990s,the proportion of young adults who completed upper secondaryeducation is greater than in most other countries at 92% (OECDaverage: 72%).
Germany has invested heavily in education since the 1950s, yet,in 2003 felt the impact of poorer than expected results from theinternational PISA study, termed the “PISA-shock” (Baumert et al.,2003). This had far-reaching implications for educational reformand significant negative impacts on the perceived status of theteaching profession. German teachers were the target of publicblame for the performance of the German students, and suffereda decline in social and community prestige (OECD, 2005), althoughtheir salary scales, working conditions, annual leave entitlements,pensions, allowances, bonuses, job security, and tenure make thecareer competitive with other occupations requiring similar levelsof higher education, such as accountants, nurses, social workersand human resource professionals. Germany has a very differentschooling structure from the other three countries, in that teachers
H.M.G. Watt et al. / Teaching and Teacher Education 28 (2012) 791e805 795
are prepared in different settings for each of the three levels of thetiered school system, in which students are selected for either theacademically-oriented Gymnasium (lower and upper secondaryschool), the general education-oriented Realschule (lowersecondary school), or the more basic skills/vocational-orientedHauptschule (lower secondary school). This leads to teachingsettings in secondary school where learners are much morehomogeneous in terms of their demonstrated academic abilities.
At a time when other careers offer higher salaries, clearerpathways for career development, higher prestige and communityrespect, and more agreeable working conditions (see OECD, 2005;Ramsay, 2000), what is it that attracts people to teaching asa career? It is not obvious nor trivial what kinds of expectancies andvalues we should expect to be most salient, whether results wouldreflect or challenge prevailing stereotypes regarding motives forchoosing teaching, and by extension the kind of people who enterthe profession. Current stereotypes include the choice of teachingas a family-flexible career, for highly altruistic motivations, and asa “fallback” career. Initial research on the FIT-Choice scale, with1653 first-year preservice teachers in Australia (Richardson &Watt,2006), indicated that the highest rated teaching motivations uponentry to teacher education were intrinsic value, perceived teachingabilities, positive prior teaching and learning experiences, and“altruistic-type” social utility values (i.e., shape the future of chil-dren/adolescents, enhance social equity, make social contribution,work with children/adolescents).
Key differences in terms of demand and reward structuresbetween the countries in our sample led us to speculate aboutdifferences between prospective teachers. For example, in line withthere being already a strongly egalitarian schooling system inNorway, we expected that social utility values may be less influ-ential in motivating participants from that context to chooseteaching as a career. We expected that perceptions about theteaching profession, rather than motivations for choosing teaching,may be the components most shaped by contextual conditionsacross settings; the German sample was anticipated to perceiveteaching status as low, in light of the “PISA-shock” (Baumert et al.,2003). We also thought that personal utility motivations may differthe most across samples among the motivation constructs.
2. Method
2.1. Samples and settings
Samples were primary/elementary and secondary teachereducation students from Australia (N ¼ 1438, 54% secondary), theU.S. (N ¼ 511, 47% secondary), Germany (N ¼ 210, 55% secondary,11% grades 1 to 10, 34% primary), and Norway (N ¼ 131, allsecondary). In Australia and the U.S., participants were allcommencing teacher education candidates (2002/3 and 2004,respectively); whereas in each of Germany and Norway, partici-pants included candidates at varying stages of their teachereducation in 2005. Response rates were high in the Australian(>80% at each university) and U.S. settings (>73% at each univer-sity). In the Norwegian sample, all students present in lectures onthe day of administration were invited and agreed to participate;only the motivations section of the scale, not the perceptionssection, was administered there due to time constraints. In theGerman setting a representative sample was not attempted andresponse rates could therefore not be calculated; students wereinvited to participate in the study after their regular classes.
At each of the three Australian and two U.S. universities,candidates undertook either the undergraduate Bachelor qualifi-cation, or the one- to two-year postgraduate certification in caseswhere they already held a relevant prior undergraduate
qualification (49% undergraduate in the Australian sample, 78% inthe U.S.). In Norway, teacher education candidates undertook eithera combined degree in which they studied teacher educationalongside their Master studies, or a one-year postgraduate teachereducation program (our Norwegian sample contained 48% in thecombined degree mode). The German system of teacher educationdoes not provide for this flexibility of entry into teaching andteacher education through alternative pathways, and it is struc-turally very difficult for those who might contemplate changingtheir career into teaching to do so. At the German university whendatawere collected in 2005, many candidates were undertaking theintegrated degree (the Staatsexamen), replaced in 2004 with theBachelor/Master model, which split the undergraduate Bachelorand postgraduate Master components, whereby candidatesundertake the undergraduate degree followed by the postgraduatequalification. Our sample contained 58% Staatsexamen and 42%Bachelor candidates.
In countries from which the samples came, teacher educationcan be undertaken in undergraduate or graduate modes. Typicallyat the graduate level these countries offer a one-year full-timepreparation program (or an equivalent two years part-time), andsometimes two years of postgraduate study (Lyng & Blichfeldt,2003; OECD, 2004a,b; Skilbeck & Connell, 2003) for people whohave already obtained qualifications in relevant disciplines.Australia and the U.S. provide for flexible delivery in teachereducation programs, including part-time study and distanceeducation programs (Richardson & Watt, 2005), as does Norway(Lyng & Blichfeldt, 2003). Masters level graduate teaching qualifi-cations are available in some institutions in Australia and the U.S.,and also in Germany and Norway, reflecting pressures for betterteacher professional quality and teacher education programs. Thisreform agenda was being developed and put in place during thetime our data were collected and will continue for some time yet.
As is reflective of the highly feminised composition of theteaching profession at large, samples were predominantly female.Secondary teacher education candidates studied a range ofacademic disciplines within each of the samples. Sample charac-teristics are summarised in Table 1A (Australian and U.S.) andTable 1B (German and Norwegian).
2.2. Materials
The FIT-Choice scale was translated into German using a processof translation and back-translation by a team of bilingualresearchers; the scale was administered in English in the Austra-lian, U.S., and Norwegian samples (English is a common language ofinstruction in the Norwegian universities).
2.2.1. Motivations for teachingWithin the FIT-Choice instrument, each motivational factor is
measured by multiple item indicators with response optionsranging from 1 (not at all important) through 7 (extremelyimportant). A preface to all motivation items in the scale is “I choseto become a teacher because.”, typed in large bold-faced font atthe top of each page.
2.2.2. Perceptions about teachingParticipants also rated the extent of their agreement with
a number of propositions about the teaching profession, withresponse options ranging from 1 (not at all) through 7 (extremely).Multiple propositions together comprised factors relating to theextent to which respondents perceived teaching as high in taskdemand (expert career, high demand), and high in task return(social status, salary). Career choice satisfaction was measured bytwo items with response options from 1 (not at all) through 7

Table 1ASample characteristics: Australian and United States.
University of Sydney,Australia (N ¼ 416)
Monash University,Australia (N ¼ 461)
University ofWestern Sydney,Australia (N ¼ 561)
University ofMichigan, U.S.(N ¼ 242)
Eastern MichiganUniversity, U.S.(N ¼ 269)
Primary N 171 (103 UG,68 grad) 187 (119 UG,68 grad) 309 (218 UG,91 grad) 113 (68 UG,45 grad) 159 (150 UG,8 grad)Secondary N 245 (123 UG,122 grad) 274 (70 UG,204 grad) 252 (68 UG,184 grad) 129 (88 UG,41 grad) 110 (90 UG,20 grad)Female N 318 ¼ 76% (85%
prim, 71% sec)325 ¼ 71% (78%prim, 66% sec)
415 ¼ 74% (87%prim, 58% sec)
170 ¼ 70% (86%prim, 57% sec)
200 ¼ 74% (83%prim, 62% sec)
Age M ¼ 23.24, SD ¼ 6.51Range 17e53
M ¼ 27.80, SD ¼ 8.81Range 18e58
M ¼ 26.47, SD ¼ 8.82Range 17e69
M ¼ 25.11, SD ¼ 8.36Range 19e57
M ¼ 23.51, SD ¼ 5.65Range 19e48
Secondary Strands %’sa
Humanities 38 27 34 57 40Visual/
performing arts20 17 17 1 5
Foreign languages 16 17 5 9 3TESOLþ 10 11 8 n/a n/aSocial studies 16 31 16 16 31Maths/science 22 32 30 29 26Computing 2 10 8 n/a 2Vocational Ed 9 n/a 15 n/a 2Religious Ed n/a 1 n/a n/a n/aLibrarianship n/a 1 n/a n/a n/aPsychology n/a 7 n/a n/a n/a
þTESOL: ‘Teaching English as a Second Language’ to non-English speakers in Australia.a %’s do not add as some students span more than one strand.
H.M.G. Watt et al. / Teaching and Teacher Education 28 (2012) 791e805796
(extremely). Participants also rated the extent to which they hadexperienced social dissuasion from teaching as a career choice. Thefinal item set that was analysed is presented in Table 2 for theoriginal English version (also see Richardson & Watt, 2006; Watt &Richardson, 2007), and the German translated version.
2.3. Analyses
Analyses were conducted within the multiple-group mean andcovariance structures (MACS) framework using M-Plus 3.11. Thisframework is an extension of traditional structural equationmodelling, in which mean-level information is analysed as well asthe covariance matrix. Strong factorial invariance (Little, 1997;Meredith,1993) implies that constructs are fundamentally the same
Table 1BSample characteristics: German and Norwegian.
Free University,Germanya
TrondhUnivers
Primary N 66 n/aSecondary N 127 131Female N 147 ¼ 70% (91%
prim, 61% sec)87 ¼ 41(all sec
Age M ¼ 23.70,SD ¼ 4.14 Range 19e46
M ¼ 24SD ¼ 4.
Secondarystrands
First subject N(%) Secondsubject N(%)
First su(N ¼ 12
German 19 (15.0%) 11 (8.7%) n/aHumanities 29 (22.8%) 24 (18.9%) 19 (15.Visual/
performing arts3 (2.4%) n/a 2 (1.6%
Foreign languages 17 (13.4%) 26 (20.5%) 28 (22.Social studies 13 (10.2%) 14 (11.0%) 9 (7.2%Maths/science 45 (35.4%) 45 (35.4%) 58 (46.Computing n/a n/a 3 (2.4)Vocational Ed n/a n/a 2 (1.6%Sport n/a 4 (3.1%) 4 (3.2%Religious Ed n/a n/a n/aSpecial pedagogic n/a n/a n/a
a 17 participants had missing primary/secondary degree information.
across settings, and are consequently comparable. It is necessary toestablish scale invariance in cross-cultural comparisons, especiallywhen using self-report data (Vijver & Tanzer,1998). Only in this casecanwe meaningfully undertake quantitative comparisons betweenthemeasured constructs. Strong factorial invariance is tenablewhenequality constraints for the factors’ loading and intercept parame-ters hold, andwhen the sequential introduction of those constraintsdoes not produce substantial change in model fit indices. Little(1997) argued that strong factorial invariance is less biasing thanstrict factorial invariance which further equates residual variances,because if these are not exactly equal, the non-equal portions ofrandomerror become forced intoothermodelparameters (p. 55).Hesuggested a “modeling rationale” to evaluate the change inmodelfitusing practical fit indices. This is distinct from what he terms the
eimity, Norway
%ondary).2150 Range 19e41
bject N(%)5, missing ¼ 6)
Second subject N(%)(N ¼ 110, missing ¼ 21)
Third subject N(%)(N ¼ 21, missing ¼ 110)
n/a n/a2%) 19 (17.3%) 3 (14.3%)) 2 (1.8%) n/a
4%) 9 (8.2%) 4 (19.0%)) 11 (10.0%) 4 (19.0%)4%) 51 (46.4%) 6 (28.6%)
6 (5.5%) 1 (4.8%)) 2 (1.8%) n/a) 4 (3.6%) 1 (4.8%)
3 (2.7%) 1 (4.8%)2 (1.8%) 1 (4.8%)

Table 2FIT-Choice subscales and items involved in the study.
Factor Item# Original English German translation
MOTIVATIONS“I chose to become ateacher because.” 1(not at all important)e7 (extremelyimportant)
“Ich möchteLehrer werden,denn.” 1(überhauptnicht wichtig)e 7 (äußerstwichtig)
Perceivedteachingabilities
B5 I have the qualities of agood teacher
ich habe die Qualitäteneines/einer gutenLehrers/Lehrerin
B19 I have good teachingskills
ich kanngut unterrichten
B43 Teaching is a careersuited to my abilities
der Lehrerberufpasst gut zu meinenFähigkeiten
Intrinsicvalue
B1 I am interested inteaching
mich interessiertder Lehrerberuf
B12 I like teaching ich unterrichte gern
Personal utilityvalue
Job security B14 Teaching will offer asteady career path
der Lehrerberuferöffnet eine sichereBerufslaufbahn
B27 Teaching will providea reliable income
als Lehrer/in hatman ein gesichertesEinkommen
B38 Teaching will be asecure job
als Lehrer/in hatman eine sichere Stelle
Time for family B2 Part-time teachingcould allow morefamily time
als Lehrer mitreduzierterStundenzahl hätteman mehr Zeit fürdie Familie
B16 Teaching hours willfit with theresponsibilitiesof having a family
die Arbeitszeiteneines Lehrers/einerLehrerin lassen sichgut mit der
B29 School holidayswill fit inwith familycommitments
Verantwortung füreine Familie vereinbarendie Schulferien lassensich gut mitFamilienverpflichtungenvereinbaren
Social utility valueShape future of
children/adolescents
B9 Teaching willallow meto shape child/adolescent values
als Lehrer/in kannich Kindern undJugendlichenbestimmte Wertevermitteln
B23 Teaching will allowme to influencethe next generation
als Lehrer/in kannich die nächsteGenerationbeeinflussen
Enhancesocial equity
B36 Teaching will allowme to raise theambitions of under-privileged youth
als Lehrer/in kannich benachteiligtenJugendlichen Mutmachen, mehr zuerreichen
B49 Teaching will allowme to benefit thesociallydisadvantaged
als Lehrer/in kannich etwas für diesozial Benachteiligtentun
Make socialcontribution
B6 Teaching allowsme to provide aservice to society
als Lehrer/in kann ichetwas Nützliches fürdie Gesellschaft tun
B20 Teachers make aworthwhile socialcontribution
Lehrer/innen leisteneinen wertvollensozialen Beitrag
B31 Teaching enablesme to ‘give back’to society
als Lehrer/in kannich der Gesellschaftetwas zurückgeben
Table 2 (continued)
Factor Item# Original English German translation
Work withchildren/adolescents
B13 I want a job thatinvolves workingwith children/adolescents
ich möchte einenBeruf haben, beidem ich mit Kindern/Jugendlichen zu tun habe
B26 I want to work in achild/adolescent-centred environment
ich möchte einen Berufhaben, bei dem dieArbeit mit Kindern/Jugendlichen imMittelpunkt steht
B37 I like workingwith children/adolescents
ich arbeite gernemit Kindern/Jugendlichen
Prior teachingand learningexperiences
B17 I have hadinspirational teachers
ich selbst hatteinspirierendeLehrer/innen
B30 I have had goodteachers asrole-models
ich selbst hattegute Lehrer als Vorbild
B39 I have had positivelearning experiences
ich selbst hatte positiveLernerfahrungen
Socialinfluences
B3 My friends think Ishould become ateacher
meine Freundefinden, dass ichLehrer/in werden sollte
B24 My family think Ishould become ateacher
meine Familiefindet, ich sollteLehrer/in werden
B40 People I’ve workedwith think I shouldbecome a teacher
Leute, mit denen ichzusammengearbeitethabe, finden, ichsollte Lehrer/in warden
PERCEPTIONS
For each questionbelow, please ratethe extent towhich YOU agreeit is true aboutteaching. 1(not at all) e 7(extremely)
Zu Ihren Vorstellungenüber den Lehrerberuf.Bitte beurteilen Sie wiesehr Sie folgendenAussagen zustimmen.Glauben Sie, . 1(überhaupt nicht) e 7(äußerst)
Task demandExpert career C10 Do you think
teaching requireshigh levels ofexpert knowledge?
dass der Lehrerberufein hohes Mab anExpertenwissenvoraussetzt?
C14 Do you thinkteachers needhigh levels oftechnicalknowledge?
dass Lehrer/innenhohes Fachwissenbrauchen?
High demand C2 Do you think teachershave a heavy workload?
dass Lehrer/innen sehrviel arbeiten müssen?
C7 Do you think teachingis emotionallydemanding?
dass Unterrichtenemotional beanspruchendist?
C11 Do you think teachingis hard work?
dass der Lehrerberufharte Arbeit ist?
Task returnSocial status C4 Do you believe teachers
are perceived asprofessionals?
man schreibt LehrernProfessionalität zu?
C8 Do you believe teachingis perceived as ahigh-statusoccupation?
dass man demLehrerberuf einenhohen sozialen Statuszuschreibt?
C12 Do you believe teachingis a well-respected career?
dass Lehrer/in sein einangesehener Beruf ist?
C9 Do you think teachersfeel valued by society?
Lehrer fühlen sichvon der Gesellschaftwertgeschätzt?
C13 Do you think teachersfeel their occupationhas high social status?
dass die Lehrer/innen dasGefühl haben, dass ihrBeruf einen hohensozialen Status hat?
(continued on next page)
H.M.G. Watt et al. / Teaching and Teacher Education 28 (2012) 791e805 797
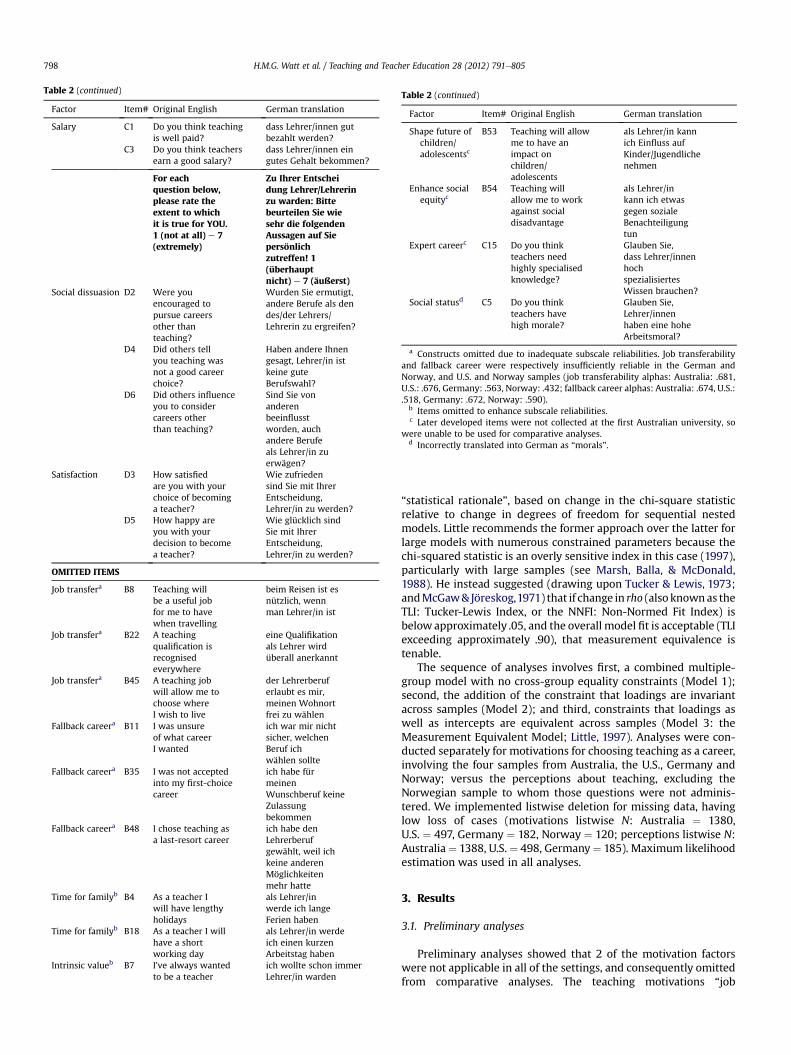
Table 2 (continued)
Factor Item# Original English German translation
Salary C1 Do you think teachingis well paid?
dass Lehrer/innen gutbezahlt werden?
C3 Do you think teachersearn a good salary?
dass Lehrer/innen eingutes Gehalt bekommen?
For eachquestion below,please rate theextent to whichit is true for YOU.1 (not at all) e 7(extremely)
Zu Ihrer Entscheidung Lehrer/Lehrerinzu warden: Bittebeurteilen Sie wiesehr die folgendenAussagen auf Siepersönlichzutreffen! 1(überhauptnicht) e 7 (äußerst)
Social dissuasion D2 Were youencouraged topursue careersother thanteaching?
Wurden Sie ermutigt,andere Berufe als dendes/der Lehrers/Lehrerin zu ergreifen?
D4 Did others tellyou teaching wasnot a good careerchoice?
Haben andere Ihnengesagt, Lehrer/in istkeine guteBerufswahl?
D6 Did others influenceyou to considercareers otherthan teaching?
Sind Sie vonanderenbeeinflusstworden, auchandere Berufeals Lehrer/in zuerwägen?
Satisfaction D3 How satisfiedare you with yourchoice of becominga teacher?
Wie zufriedensind Sie mit IhrerEntscheidung,Lehrer/in zu werden?
D5 How happy areyou with yourdecision to becomea teacher?
Wie glücklich sindSie mit IhrerEntscheidung,Lehrer/in zu werden?
OMITTED ITEMS
Job transfera B8 Teaching willbe a useful jobfor me to havewhen travelling
beim Reisen ist esnützlich, wennman Lehrer/in ist
Job transfera B22 A teachingqualification isrecognisedeverywhere
eine Qualifikationals Lehrer wirdüberall anerkannt
Job transfera B45 A teaching jobwill allow me tochoose whereI wish to live
der Lehrerberuferlaubt es mir,meinen Wohnortfrei zu wählen
Fallback careera B11 I was unsureof what careerI wanted
ich war mir nichtsicher, welchenBeruf ichwählen sollte
Fallback careera B35 I was not acceptedinto my first-choicecareer
ich habe fürmeinenWunschberuf keineZulassungbekommen
Fallback careera B48 I chose teaching asa last-resort career
ich habe denLehrerberufgewählt, weil ichkeine anderenMöglichkeitenmehr hatte
Time for familyb B4 As a teacher Iwill have lengthyholidays
als Lehrer/inwerde ich langeFerien haben
Time for familyb B18 As a teacher I willhave a shortworking day
als Lehrer/in werdeich einen kurzenArbeitstag haben
Intrinsic valueb B7 I’ve always wantedto be a teacher
ich wollte schon immerLehrer/in warden
Table 2 (continued)
Factor Item# Original English German translation
Shape future ofchildren/adolescentsc
B53 Teaching will allowme to have animpact onchildren/adolescents
als Lehrer/in kannich Einfluss aufKinder/Jugendlichenehmen
Enhance socialequityc
B54 Teaching willallow me to workagainst socialdisadvantage
als Lehrer/inkann ich etwasgegen sozialeBenachteiligungtun
Expert careerc C15 Do you thinkteachers needhighly specialisedknowledge?
Glauben Sie,dass Lehrer/innenhochspezialisiertesWissen brauchen?
Social statusd C5 Do you thinkteachers havehigh morale?
Glauben Sie,Lehrer/innenhaben eine hoheArbeitsmoral?
a Constructs omitted due to inadequate subscale reliabilities. Job transferabilityand fallback career were respectively insufficiently reliable in the German andNorway, and U.S. and Norway samples (job transferability alphas: Australia: .681,U.S.: .676, Germany: .563, Norway: .432; fallback career alphas: Australia: .674, U.S.:.518, Germany: .672, Norway: .590).
b Items omitted to enhance subscale reliabilities.c Later developed items were not collected at the first Australian university, so
were unable to be used for comparative analyses.d Incorrectly translated into German as “morals”.
H.M.G. Watt et al. / Teaching and Teacher Education 28 (2012) 791e805798
“statistical rationale”, based on change in the chi-square statisticrelative to change in degrees of freedom for sequential nestedmodels. Little recommends the former approach over the latter forlarge models with numerous constrained parameters because thechi-squared statistic is an overly sensitive index in this case (1997),particularly with large samples (see Marsh, Balla, & McDonald,1988). He instead suggested (drawing upon Tucker & Lewis, 1973;andMcGaw& Jöreskog,1971) that if change in rho (also knownas theTLI: Tucker-Lewis Index, or the NNFI: Non-Normed Fit Index) isbelow approximately .05, and the overall model fit is acceptable (TLIexceeding approximately .90), that measurement equivalence istenable.
The sequence of analyses involves first, a combined multiple-group model with no cross-group equality constraints (Model 1);second, the addition of the constraint that loadings are invariantacross samples (Model 2); and third, constraints that loadings aswell as intercepts are equivalent across samples (Model 3: theMeasurement Equivalent Model; Little, 1997). Analyses were con-ducted separately for motivations for choosing teaching as a career,involving the four samples from Australia, the U.S., Germany andNorway; versus the perceptions about teaching, excluding theNorwegian sample to whom those questions were not adminis-tered. We implemented listwise deletion for missing data, havinglow loss of cases (motivations listwise N: Australia ¼ 1380,U.S. ¼ 497, Germany ¼ 182, Norway ¼ 120; perceptions listwise N:Australia¼ 1388, U.S.¼ 498, Germany¼ 185). Maximum likelihoodestimation was used in all analyses.
3. Results
3.1. Preliminary analyses
Preliminary analyses showed that 2 of the motivation factorswere not applicable in all of the settings, and consequently omittedfrom comparative analyses. The teaching motivations “job

H.M.G. Watt et al. / Teaching and Teacher Education 28 (2012) 791e805 799
transferability” in the German and Norwegian samples, and “fall-back career” in the U.S. and Norwegian samples had unacceptableCronbach alpha measures of internal consistency (see Table 2 Notea). In addition, 3 items were omitted (B4, B18, B7) to enhancesubscale reliabilities; item C5 had to be excluded because ofmistranslation of “morale” as “morals” in German. Three furtheritems were excluded because they had not yet been developed andtherefore were not measured at the time of the first Australianuniversity sample (B53, B54, C15).
The combined multiple-group model was then specified;Model 1, which imposed no cross-group equality constraints,yielded an improper solution in the German sample, despite goodmodel fits for the Australian, U.S., and Norway samples.2 We tracedthe problem to high latent correlations among “shape future ofchildren/adolescents” and “make social contribution” (.962), and“shape future of children/adolescents” and “enhance social equity”(.915). In the German sample, “shape future of children/adoles-cents”was therefore insufficiently empirically distinguishable fromthose other constructs, possibly due to subtle translation differ-ences.3 In order to includeGermandata in the comparative analyses,“shape future of children/adolescents” was therefore excluded.
3.2. Reliability and validity of the scales across settings
Following the preliminary modifications, the condition ofstrong factorial invariance was subsequently met, indicating thatquantitative comparisons of factor scores could be meaningfullyundertaken across these different samples. Model fits wereacceptable in each instance, and, the differences for the TLI acrosssequentially constrained models for each of motivations (D ¼ .007between models 1a and 3a) and perceptions (D ¼ .020 betweenmodels 1b and 3b) were well below the .05 margin referred to byLittle (1997). Model fits for sequential constrained models 1through 3, for each of the motivations and perceptions sections ofthe scale, are shown in Table 3. Table 4 presents parameterestimates for the motivations measurement equivalent model(Model 3a) including measures of Cronbach alpha reliability, andlatent correlations are summarised in Table 5. Details for theperceptions measurement equivalent model (Model 3b) are shownin Table 6 and latent correlations in Table 7.
3.3. Different motivations for teaching across samples and settings?
There was a number of statistically significant differencesbetween motivations for teaching across samples listed below;mean ratings in the U.S. sample were typically highest.
� Perceived teaching ability: all paired comparisons weresignificantly different, with the U.S. sample highest, thenAustralian, German, and Norwegian the lowest.
� Intrinsic value: the U.S. sample had significantly the highestvalues, followed by the Australian, who had significantly higher
2 All original FIT-Choice motivations for teaching were discriminable in each ofthe Australian, U.S. and Norwegian samples, with good model fit statistics (d.f.¼ 1072, Normal Theory Weighted Least Squares Chi-Square ¼ 3311.842, RMSEA ¼ .056, NFI ¼ .944, NNFI ¼ .956, CFI ¼ .961). The U.S. sample was statistically signif-icantly higher than the Australian and Norwegian, and the Australian sample wasalso significantly higher than the Norwegian, on the motivations to shape the futureof children/adolescents.
3 On inspection of the German questionnaire, it appears that the items for thesethree factors share a very “active” form (doing, achieving, making, etc.) that is lessevident in the English version, which may be contributing to the much highercorrelations among factors in the German sample, contributing for example to anunderlying latent “social activism”.
values than the German and Norwegian samples, who them-selves were similar.
� Job security: the Australian sample had significantly the high-est values. U.S., German and Norwegian samples were similar.
� Time for family: the U.S. sample was significantly higher thanthe Australian and Norwegian, who were similar. The Germansample fell in between and did not differ significantly fromother groups.
� Enhance social equity: the U.S. sample was significantly thehighest, followed by the German, then Australian (which wassignificantly different from the U.S. but not from the Germansample), with the Norwegian sample significantly lowest.
� Social contribution, and prior teaching and learning experi-ences: the U.S. sample was significantly highest, followed bythe Australian and Germanwhowere similar to each other, andthe Norwegian sample had significantly the lowest values.
� Work with children/adolescents: the U.S. and German sampleshad similarly high values, which were significantly higher thanthose for the Australian and Norwegian samples. The Austra-lian sample also had significantly higher values than theNorwegian.
� Social influences: the U.S. and German samples had similarlyhigh values, which were significantly higher than the Austra-lian and Norwegian samples, who had similar values to eachother.
However, within each sample, the relativity of mean ratingsappeared similar. That is, the same five motivations were ratedhighest: intrinsic value and perceived teaching ability, emphasisedwithin the Eccles et al. expectancy-value model; the desire to makea social contribution and to work with children/adolescents, as hasbeen found in earlier research; and having had positive priorexperiences of teaching and learning. In contrast, the personalutility values of job security and time for family, and the desire toenhance social equity, were rated lower; social influences offriends, family, and coworkers were rated the least influential. Allmotivations were rated above the scale midpoint, with the excep-tion of “social influences” (see Fig. 2), implying that choice ofteaching as a career was more the result of an individual decisionthan others’ social persuasion.
3.4. Different perceptions about teaching across samples andsettings?
There was consensus that teaching is a career high in taskdemand. In each of the Australian, U.S., and German samples thehighest rating was given for perceiving teaching to be highlydemanding, followed by teaching as an expert career. Samplemeans for each perceptions construct are summarised in Table 6and depicted in Fig. 3. All paired comparisons differed statisticallysignificantly (p < .05).
� The U.S. sample had higher perceptions of task demand (expertcareer, high demand) than the Australian, followed by theGerman sample.
� For task return (social status, salary) the picturewasmixed. TheU.S. perceived the status of teaching highest, and the Germansample lowest. The reverse was true for salary, which the U.S.sample rated lowest, and the German sample highest. There-fore, recognition of higher teaching salaries in the Germansetting did not translate into perceiving teaching as high instatus.
� Social dissuasion appeared fairly similar across the samples,although it was statistically significantly highest in theAustralian, next in the U.S., and least in the German sample.

Table 3Fit statistics for sequential constrained models.
c2 d.f. RMSEA SRMR CFI TLI DTLI
Motivations Model 1a: freely estimated 2530.838 956 .055 .044 .947 .933Model 2a: loadings invariant 2626.590 1004 .054 .046 .945 .934 .001Model 3a: loadings & intercepts invariant 2963.624 1052 .058 .048 .935 .926 .008
Perceptions Model 1b: freely estimated 659.407 321 .039 .033 .979 .974Model 2b: loadings invariant 701.585 336 .040 .036 .978 .973 .001Model 3b: loadings & intercepts invariant 1015.921 358 .052 .043 .960 .954 .019
H.M.G. Watt et al. / Teaching and Teacher Education 28 (2012) 791e805800
� Participants from all three settings rated their satisfaction withthe choice of a teaching career very high; significantly highestin the U.S., then Australian, and finally the German sample.
None of participants’ perceptions about teaching related espe-cially strongly to their degree of satisfaction with their choice ofteaching as a career. In particular, the higher perceptions of salaryin the German sample had a negligible correlationwith satisfaction.Experiences of social dissuasion, highest in the Australian sample,had negligible relationships with satisfaction in each of theAustralian and U.S. samples, and no significant correlation in theGerman sample, where social dissuasion had been lowest.Perceptions of teaching as an expert career and a high demandcareer exhibited positive, albeit weak, relationships with satisfac-tion. In the Australian and U.S. samples where salary was ratedrelatively low, perceived social status and salary were substantiallycorrelated; in the German sample where salary was rated quitehigh, there was a weak relationship between salary and perceivedsocial status. Dissuasion appeared to relate to social status across allthree samples, additional to salary in the Australian, and difficultyin the German sample. Latent correlations among perceptionsconstructs are shown in Table 7 for each sample.
Table 4Factor solution for motivations measurement equivalent Model: Item intercepts (TX), fac
Alpha Aust/U.S./Germ./Norway
KA UNorw
Perceived teaching abilities .831/.778/.805/.753 .313/
Intrinsic value .721/.701/.717/.786 .342/
Job security .839/.818/.893/.823 �.23
Time for family .836/.791/.881/.765 .169/
Enhance social equity .843/.873/.767/.780 .335/
Make social contribution .823/.796/.806/.752 .452/
Work with children/adolescents .895/.895/.912/.909 .581/
Prior teaching and learning experiences .874/.860/.875/.836 .844/
Social influences .815/.883/.854/.854 .452/
All parameter estimates are presented in unstandardized form. Not presented are the unmetric.Latent means (KA) are relative to the Australian reference group in the original metric.
a a denotes U.S. significantly different from Australia, b denotes U.S. significantly diffAustralia significantly different from Germany, e denotes Australia significantly differen
4. Discussion
We had two major aims within this investigation: the first, toexamine the utility and validity of the FIT-Choice scale (Watt &Richardson, 2007) for measuring teaching motivations within andacross samples and settings; the second, to explore differences inmotivations and perceptions related to the teaching professionacross the different samples, as first indications of differencesamong Australian, U.S., German, and Norwegian samples. Under-standing influential motivations for individuals who chooseteaching as a career has important implications to enhance theeffectiveness of recruitment and retention efforts, which can thentarget those motivations that are most relevant, rather than relyingon traditional messages such as the desire to help children andmake a social difference. Further, such understandings are criticalfor teacher education and early career induction. We do not suggestthat faculties of teacher education screen or select candidates on thebasis of theirmotivations to teach, whichwould be amisapplicationof our findings. The point is rather, that if teacher educators do nottake beginning teachers’motivations into account in instruction andactivities, preservice teachers may suffer interest losses andreconsider their career choice. Subsequently, teachers who find
tor loadings (LX), latent means (KA) and Cronbach alpha reliabilities.
.S./Germ./ay
Item TX LX Sig. (p < .05)a
�.178/�.542 B5 5.775 1.000 abcdefB19 5.532 1.162B43 5.623 1.066
�.329/�.292 B1 6.118 1.000 abcdeB12 5.883 1.165
8/�.391/�.467 B14 5.227 1.000 adeB27 4.712 1.024B38 5.027 1.163
.065/�.119 B2 3.834 1.000 acB16 4.598 1.401B29 4.222 1.363
.167/�.983 B36 5.000 1.000 abcefB49 4.709 .988
�.126/�.702 B6 5.592 1.000 abcefB20 5.753 .864B31 5.024 1.183
.472/�.300 B13 5.503 1.000 acdefB26 5.052 1.091B37 5.656 .871
�.017/�.473 B17 4.953 1.000 abcefB30 4.899 1.032B39 5.268 .641
.302/�.140 B3 3.023 1.000 acdfB24 3.335 .991B40 3.536 .984
iquenesses. The first indicator of each construct was fixed to 1 to establish the factor
erent from Germany, c denotes U.S. significantly different from Norway, d denotest from Norway, f denotes Germany significantly different from Norway.

Table 5Latent correlations among motivations for teaching.
1. 2. 3. 4. 5. 6. 7. 8. 9.
Australia1. Perceived teaching abilities 12. Intrinsic value .677 13. Job security .218 .048 14. Time for family .168 .065 .523 15. Enhance social equity .335 .372 .126 .084 16. Make social contribution .449 .451 .187 .136 .679 17. Work with children/adolescents .416 .634 .133 .168 .423 .441 18. Prior teaching and learning experiences .216 .253 .161 .156 .266 .365 .250 19. Social influences .230 .146 .274 .273 .159 .213 .191 .229 1U.S.1. Perceived teaching abilities 12. Intrinsic value .672 13. Job security .294 .134 14. Time for family .297 .057 .562 15. Enhance social equity .431 .313 .139 .109 16. Make social contribution .459 .351 .160 .071 .695 17. Work with children/adolescents .462 .485 .235 .243 .534 .476 18. Prior teaching and learning experiences .298 .321 .124 .086 .259 .329 .262 19. Social influences .336 .170 .287 .251 .209 .278 .232 .292 1Germany1. Perceived teaching abilities 12. Intrinsic value .890 13. Job security �.106 L.220 14. Time for family �.014 L.199 .651 15. Enhance social equity .553 .660 L.214 �.050 16. Make social contribution .515 .584 �.103 �.073 .806 17. Work with children/adolescents .601 .649 �.114 �.018 .670 .560 18. Prior teaching and learning experiences .257 .289 .037 �.098 .156 .333 .113 19. Social influences .273 .197 .262 .218 .164 .331 .218 .225 1Norway1. Perceived teaching abilities 12. Intrinsic value .801 13. Job security .040 .022 14. Time for family .202 .240 .547 15. Enhance social equity .371 .392 .088 .195 16. Make social contribution .444 .303 .067 .203 .559 17. Work with children/adolescents .405 .542 .153 .281 .689 .476 18. Prior teaching and learning experiences .279 .310 .538 .349 .434 .306 .402 19. Social influences .429 .291 .362 .449 .267 .393 .299 .362 1
Bolded numbers denote statistical significance (p < .05).
H.M.G. Watt et al. / Teaching and Teacher Education 28 (2012) 791e805 801
themselves in settings which do not allow them to realise theirmotivations are likely to feel less efficacious, less satisfiedwith theircareer choice, and to experience burnout or leave the profession.
4.1. The FIT-Choice scale e utility and validity in cross-culturalresearch on teaching motivations
Strong factorial invariance implied that scale constructs weregeneraliseable within each of the settings from which we hadobtained samples, that sources of bias and error were minimal, andthat cross-sample differences did not affect the constructs’ under-lying measurement characteristics. With the omission of twosubscales (job transferability, fallback career; respectively insuffi-ciently reliable in the German and Norwegian, and U.S. andNorwegian samples), strong factorial invariance of the FIT-Choicescale was established. In post hoc interpretation, it made sense tous that job transferability would hold less meaning in the Germanand Norwegian contexts, because of distinct State-based require-ments in Germany, and the smaller population in Norway; and, thatfallback career would be less meaningful in Norway where entry touniversity studies is highly competitive.
The validity of the German translation of the instrument wasexamined within the study. The translated form demonstratedstrong factorial invariance with data yielded in the comparisonsamples, with the exception of the factor “shape future of children/adolescents” mentioned earlier (and Footnotes 1 and 2). The
German translation of the social utility factors may have sharedamore active form of verbs than in the original English version (e.g.,doing, achieving, making), contributing to their higher intercorre-lations and an underlying “social activism”. Researchers interestedin using the German translation could further examine these ideasfor the social utility factors of the FIT-Choice scale.
4.2. Perceptions about teaching as a career
In our review at the beginning of the paper, we documented thedifferential demand and reward structures for teachers in each ofour sample settings. In Australia, the U.S., and Norway, teachingsalaries are low relative to the OECD mean, whereas in Germanythey are quite high. Across each of Australia, the U.S., Norway, andGermany, the status or prestige of teachers in the community andpopular press has taken a downward turn, however this has beenmost particularly the case in Germany following the “PISA-shock”(Baumert et al., 2003). Intriguingly, both task demand factorscorrelated positively with individuals’ reported satisfaction withthe choice of a teaching career, indicating the demand features ofteaching do not deter, and may in fact act as incentives to choosingteaching as a career for individuals who seek to develop expertisein challenging environments (Richardson & Watt, 2006).
Prospective teachers’ perceptions of teaching salaries across thethree settings reflected the differences in salary rewards. The samewas true in relation to perceptions of the social status of teachers

Table 6Factor solution for perceptions measurement equivalent Model: Item intercepts(TX), factor loadings (LX), latent means (KA) and Cronbach alpha reliabilities.
Alpha Aust/U.S./Germany
KA U.S./Germany
Item TX LX
Expert career .732/.696/.802 .193/�.792 C10 5.589 1.000C14 5.048 .694
High demand .730/.655/.740 .158/�.274 C2 5.798 1.000C7 6.305 .774C11 6.187 1.124
Social status .904/.875/.870 .213/�.316 C4 4.393 1.000C8 3.474 1.088C9 3.776 1.113C12 4.338 1.146C13 3.696 1.048
Salary .929/.898/.941 �.281/.993 C1 3.252 1.000C3 3.393 .997
Social dissuasion .680/.691/.745 �.258/�.528 D2 4.674 1.000D4 3.636 1.000D6 3.945 1.000
Satisfaction .923/.943/.933 .342/�.414 D3 5.869 1.000D5 5.943 .964
All parameter estimates are presented in unstandardised form. Not presented arethe uniquenesses. The first indicator of each construct was fixed to 1 to establish thefactor metric, and in the case of “social dissuasion” gammas were constrained toequally contribute.Latent means (KA) are relative to the Australian reference group in the originalmetric.All paired comparisons statistically significant (p < .05).
H.M.G. Watt et al. / Teaching and Teacher Education 28 (2012) 791e805802
and the teaching profession. These task return perceptionsexhibited positive relationships with participants’ satisfaction withthe choice of a teaching career in the Australian and U.S. samples,but interestingly showed no significant relationships in the Germansample. We should not therefore discount salary raises as a methodby which to improve the social standing of the teaching professionon the basis of the particularities of the German case, in which “thecurrent composition of the compensation package concentratesalso solely on salaries” (Halász et al., 2004, p. 36). Probably salaryalone is insufficient inducement with which to adjust social andparticularly teachers’ perceptions, and needs to be considered inrelation to a range of other reward structures. Particularly inter-esting is the disparity between perceived salary and status in theGerman sample, who rated salary the highest and status the lowest.
Table 7Latent correlations among perceptions about teaching.
Expertcareer
Highdemand
Socialstatus
Salary Socialdissuasion
Satisfaction
AustraliaExpert career 1High demand .473 1Social status .160 �.037 1Salary �.003 L.110 .498 1Social dissuasion .043 .002 L.229 L.172 1Satisfaction .188 .131 .195 .130 L.088 1U.S.Expert career 1High demand .494 1Social status .167 .029 1Salary .091 �.056 .458 1Social dissuasion .004 �.018 L.159 �.068 1Satisfaction .230 .194 .168 .170 �.052 1GermanyExpert career 1High demand .421 1Social status .158 �.126 1Salary .163 �.040 .247 1Social dissuasion �.074 �.151 �.127 �.050 1Satisfaction .239 .284 .160 �.085 �.153 1
Bolded numbers denote statistical significance (p < .05).
Demonstrably, higher salaries did not translate into improvedperceptions regarding the social standing of teachers and theteaching profession. It would seem that popular views of usingsalary increases as a single lever with which to adjust the supplyprofile of teachers may only have an impact in the short term.
Participants from the different settings reported moderatelevels of social dissuasion from their choice of a teaching career,which did not relate to their perceptions of teaching as being eitherhigh in demand or low in reward. Yet, satisfactionwith the choice ofteaching as a career was rated very high. This speaks to teaching asa career of personal choice, despite perceived low salary and socialstatus. The relatively weak ratings for social influences may not besurprising given the current low status of the teaching profession inAustralia (Ramsay, 2000) and elsewhere (Crow, Levine, & Nager,1990; Liu et al., 2000; OECD, 2004a,b), particularly Germany (seeBaumert et al., 2003).
4.3. Motivations for choosing teaching as a career
We had expected that between-sample differences in motiva-tions might be most evident for the personal utility FIT-Choicefactors (job security, time for family), which tap benefits the indi-vidual may experience as a teacher, distinct from external rewardstructures such as salary and social status. There was someevidence for this, with the Australian sample scoring significantlyhigher than the other three samples on job security; and the U.S.sample scoring highest on time for family.
Unlike in Australia,4 in the U.S., Germany, and Norway,prospective teachers are required to obtain an additional teachingcertification through external examination procedures, subsequentto their attainment of a teaching qualification. Job security there-fore may tap an additional aspect in these samples, related towhether individuals expect to be successful in fulfilling all assessedaspects of the layered qualification and certification system as wellas actually obtaining a teaching position in the first place. Thiscould partly explain the higher ratings in the Australian sample forjob security as a motivation for choosing a teaching career. Inaddition, at the time our U.S. Michigan data were collected, a quicksuccession of school closures in Detroit, the largest city in the Stateof Michigan, may have impacted on these U.S. participants’perceptions of teaching as a secure job. Similarly, in Norway,beginning teachers post-1989 no longer have the status of publicofficials who are not subject to dismissal, teacher employment hasrecently been decentralised and certification procedures have beenintroduced, all of which are likely to impact on Norwegian partic-ipants’ motivations to teach for reasons of job security.
Higher time for family motivations among the U.S. sample mayoccur as the result of teaching providing for greater flexibility ofemployment (e.g., part-time and casual) and shorter working hours(e.g., school vacation periods as compared with the two weeksprovided for other professionals). Although flexible workingarrangements and shorter working hours are also characteristic ofteaching in our other samples, the greater flexibility for teachersrelative to other professionals in the U.S. setting in particular, mayexplain the higher importance of time for family in attractingindividuals into the teaching profession in that sample.
The other factors for which we had anticipated systematicdifferences were the social utility values: “enhance social equity”,“make social contribution”, and “work with children/adolescents”.
4 Since the time our data were collected in the Australian States of New SouthWales and Victoria, a process of teacher certification has begun, although this doesnot involve examinations and evaluations of the type in our other samples, but isinstead a matter of registration and membership.
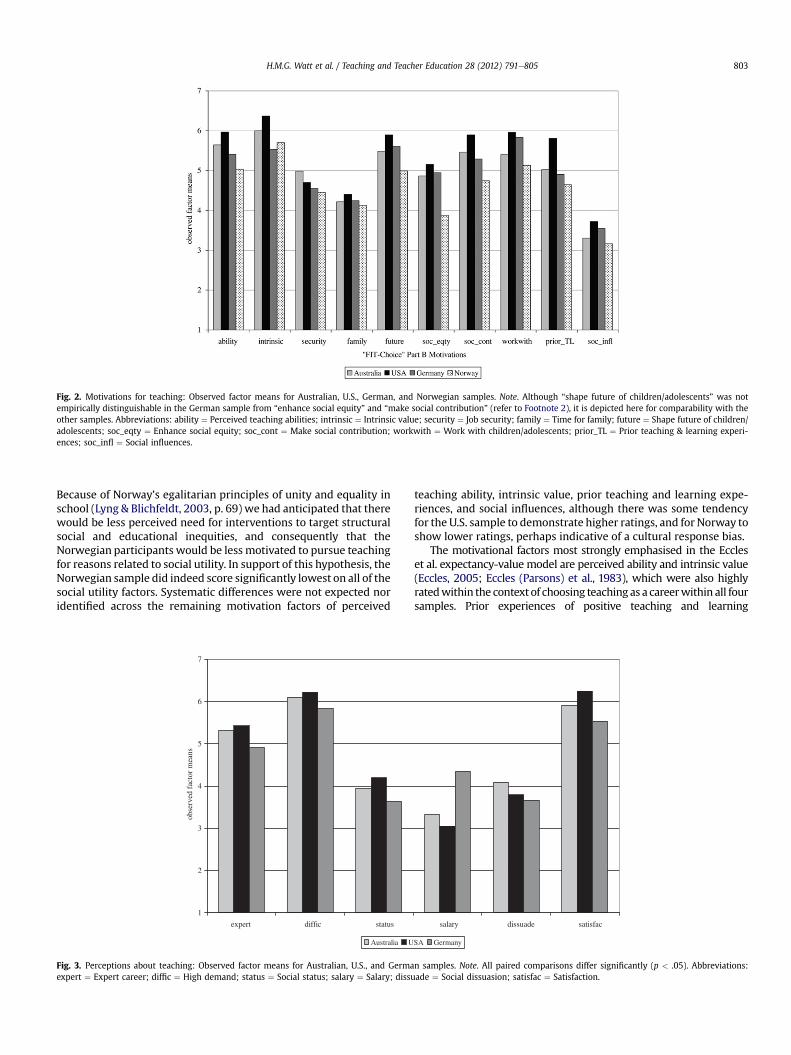
Fig. 2. Motivations for teaching: Observed factor means for Australian, U.S., German, and Norwegian samples. Note. Although “shape future of children/adolescents” was notempirically distinguishable in the German sample from “enhance social equity” and “make social contribution” (refer to Footnote 2), it is depicted here for comparability with theother samples. Abbreviations: ability ¼ Perceived teaching abilities; intrinsic ¼ Intrinsic value; security ¼ Job security; family ¼ Time for family; future ¼ Shape future of children/adolescents; soc_eqty ¼ Enhance social equity; soc_cont ¼ Make social contribution; workwith ¼ Work with children/adolescents; prior_TL ¼ Prior teaching & learning experi-ences; soc_infl ¼ Social influences.
H.M.G. Watt et al. / Teaching and Teacher Education 28 (2012) 791e805 803
Because of Norway’s egalitarian principles of unity and equality inschool (Lyng & Blichfeldt, 2003, p. 69) we had anticipated that therewould be less perceived need for interventions to target structuralsocial and educational inequities, and consequently that theNorwegian participants would be less motivated to pursue teachingfor reasons related to social utility. In support of this hypothesis, theNorwegian sample did indeed score significantly lowest on all of thesocial utility factors. Systematic differences were not expected noridentified across the remaining motivation factors of perceived
1
2
3
4
5
6
7
expert diffic status
obse
rved
fac
tor
mea
ns
Australia U
Fig. 3. Perceptions about teaching: Observed factor means for Australian, U.S., and Germaexpert ¼ Expert career; diffic ¼ High demand; status ¼ Social status; salary ¼ Salary; dissu
teaching ability, intrinsic value, prior teaching and learning expe-riences, and social influences, although there was some tendencyfor the U.S. sample to demonstrate higher ratings, and for Norway toshow lower ratings, perhaps indicative of a cultural response bias.
The motivational factors most strongly emphasised in the Eccleset al. expectancy-value model are perceived ability and intrinsic value(Eccles, 2005; Eccles (Parsons) et al., 1983), which were also highlyratedwithin the contextof choosing teaching as a careerwithin all foursamples. Prior experiences of positive teaching and learning
salary dissuade satisfac
SA Germany
n samples. Note. All paired comparisons differ significantly (p < .05). Abbreviations:ade ¼ Social dissuasion; satisfac ¼ Satisfaction.

H.M.G. Watt et al. / Teaching and Teacher Education 28 (2012) 791e805804
experienceswere rated quite high (particularly in the U.S.), whichmaybeparticular to the choice of teaching as a career. Because almost everyindividual has been a student, effective (and ineffective) teachers canprovide powerful role models, as well as the opportunity for vicariouspersonal judgements concerning one’s own teaching-related abilities.Other professionsmay not be so readily visible to the public, whomaynot feel that they have a good idea of what it is that other professionsinvolve; consequently we would not expect the influence of thismotivational factor to apply in the sameway to individuals’ choices ofother professions.
4.4. Conclusions and limitations
The FIT-Choice scale (Watt & Richardson, 2007) displayed goodconstruct validity and reliability across diverse samples. Somefactors, job transferability and teaching as a fallback career, werenot relevant in all settings, pointing to cultural and professionalparticularities. The FIT-Choice scale provides a psychometric andtheoretical framework which could prove useful to guide investi-gations in the area, providing a systematic and integrated approachto facilitate comparisons across samples and settings, to yieldfindings rich in implications for both recruitment and retention ofteachers. Because our samples were opportune rather than repre-sentative, and rather small in Germany and Norway, sampledifferences could provide only first indications of socioculturaldifferences across settings. Within settings, further differences arelikely such as between primary/elementary and secondaryteachers, secondary subject specialisms, or teaching locale. Acommon scale provides a platform for many different kinds ofcomparisons across subsamples and settings.
Highly interesting was our finding that motivations appearedmore similar than different across the four samples. The highestrated motivations for the choice of a teaching career were consis-tently intrinsic value, perceived teaching ability, the desire to makea social contribution, toworkwith children/adolescents, and havinghad positive prior teaching and learning experiences. The fact thatcontextual country features did not produce greatly differentpatterns ofmotivations raises interesting questions such aswhetherthere are “core” motivations shared by those who are attracted toa teaching career, or whether certain personality types are morelikely to choose teaching. In future research, involving larger andmore representative samples, it would be useful to examineprospective teachers from contexts which are more different still.
The desire for job security, to enhance social equity, and forchoosing teaching because of its provision for family time wererated consistently lower across the four settings. Of particularinterest to us is the fact that time for family was rated relatively low,although it has frequently been cited as one of the most influentialfactors to attract people into teaching. When contextualised withina framework of competing motivations in which individuals rate(rather than rank or nominate) each motivation, we can see that itis less important than other motivations.
Our study is timely as governments and employing authoritiesaround the world simultaneously attend to improving teacherrecruitment and retention, restructuring teachers’ work andcareers, reforming initial teacher education and professionaldevelopment, and finding ways to enhance teaching effectiveness.Recruitment and retention efforts have tended to focus on a limitedsubset of motivations, predominantly relating to the opportunity tomake a social contribution and the prospect of working with chil-dren, likely limiting their audience and effectiveness. Futureresearch could productively additionally sample individuals whohave decided against teaching as a career, or have not thought toconsider teaching as a career choice, to gain insights about whycertain groups are generally missing from the profession, such as
minority ethnic groups. Our findings concern why people dochoose teaching, an equally important next question is why othersdo not.
Limitations of the study include the opportune samples whichwere involved, the omission of the perceptions section to theNorwegian sample, and some German translation difficulties. Thatthe FIT-Choice scale demonstrated strong factorial invarianceacross these different opportune samples strengthens the conclu-sion that it can be utilised across a range of contexts. Being boththeoretically comprehensive and psychometrically valid, the FIT-Choice instrument shows promise as a measure upon whichfuture research into the question of what motivates individuals tochoose teaching careers could fruitfully draw.
Acknowledgements
Substantial portions of this work were undertaken while Wattand Richardson were visiting at the Center for EducationalResearch, Max Planck Institute for Human Development, Berlin,whose support is gratefully acknowledged. In particular we thankGabriel Nagy and Martin Brunner for their helpful methodologicaladvice. The research was also supported by ARC Discovery grantsawarded to Richardson, Watt, and Eccles (DP0666253), and toWattand Richardson (DP0987614). We would like to thank Ray Debusfrom the University of Sydney and Jacquelynne Eccles from theUniversity of Michigan for valuable discussions about our ideas.
References
Abangma, M. A. (1981). A study of primary teachers’ attitudes towards rualisation ofschool curriculum in English speaking Cameroon. Unpublished Ph.D., University ofLondon, London.
Alexander, D., Chant, D., & Cox, B. (1994). What motivates people to becometeachers. Australian Journal of Teacher Education, 19(2), 40e49.
Bastick, T. (1999). A motivation model describing the career choice of teachertrainees in Jamaica. In Paper presented at the biannual conference of the inter-national study association in teachers and teaching, Dublin, Ireland.
Baumert, J., Klieme, E., Oelkers, J., & Scheerens, J. (2003,17e20 September). Comparison ofeducation systems: understanding the international variation of student achieve-ment. In Paper presented at the ECER annual conference, Hamburg.
Book, C. L., & Freeman, D. J. (1986). Differences in entry characteristics of elementaryand secondary teacher candidates. Journal of Teacher Education, 37(2), 47e51.
Book, C., Freeman, D., & Brousseau, B. (1985). Comparing academic backgrounds andcareer aspirations of education and non-education majors. Journal of TeacherEducation, 36, 27e30.
Brookhart, S. M., & Freeman, D. J. (1992). Characteristics of entering teachercandidates. Review of Educational Research, 62(1), 37e60.
Brown, M. M. (1992). Caribbean first-year teachers’ reasons for choosing teaching asa career. Journal of Education for Teaching, 18(2), 185e195.
Chivore, B. S. R. (1988). A review of factors that determine the attractiveness of teachingprofession in Zimbabwe. International Review of Education, 34(1), 59e77.
Crow, G. M., Levine, L., & Nager, N. (1990). No more business as usual: careerchangers who become teachers. American Journal of Education, 98, 197e223.
DEST. (2003). Australia’s teachers: Australia’s future. Advancing innovation, science,technology and mathematics. Canberra: Committee for the Review of Teachingand Teacher Education, Department of Education, Science and Training.
Eccles (Parsons), J., Adler, T. F., Futterman, R., Goff, S. B., Kaczala, C. M., Meece, J. L., et al.(1983). Expectancies, values, and academic behaviors. In J. T. Spence (Ed.), Achieve-ment and achievement motivation (pp. 75e146). San Francisco, CA: W.H. Freeman.
Eccles, J. S. (2005). Studying gender and ethnic differences in participation in math,physical science, and information technology. New Directions in Child andAdolescent Development, 110(Winter), 7e14.
Eccles, J. S., & Wigfield, A. (1995). In the mind of the actor: the structure ofadolescents’ achievement task values and expectancy-related beliefs. Person-ality and Social Psychology Bulletin, 21, 215e225.
Fielstra, C. (1955). An analysis of factors influencing the decision to becomea teacher. Journal of Educational Research, 48, 659e667.
Fox, R. B. (1961). Factors influencing the career choice of prospective teachers.Journal of Teacher Education, 7(4), 427e432.
Fresko, B., Kfir, D., & Nasser, F. (1997). Predicting teacher commitment. Teaching andTeacher Education, 13(4), 429e438.
Fredricks, J. A., & Eccles, J. S. (2002). (2002).Children’s competence and value beliefsfrom childhood through adolescence: growth trajectories in two male-sex-typed domains. Developmental Psychology, 38, 519e533.
Halász, G., Santiago, P., Ekholm, M., Matthews, P., & McKenzie, P. (2004). Attracting,developing and retaining effective teachers. Country note: Germany. Paris: OECD.

H.M.G. Watt et al. / Teaching and Teacher Education 28 (2012) 791e805 805
http://www.oecd.org/document/31/0,2340,en_2649_34521_1839647_1_1_1_1,00.html Accessed 25.01.06.
Hanushek, E. A., & Pace, R. R. (1995). Who chooses to teach (and why)? Economics ofEducation Review, 14(2), 101e117.
Haubrich, V. F. (1960). The motives of prospective teachers. Journal of TeacherEducation, 11(3), 381e386.
Jacobs, J. E., Lanza, S., Osgood, D. W., Eccles, J. S., & Wigfield, A. (2002). Changes inchildren's self-competence and values: Gender and domain differences acrossgrades one through twelve. Child Development, 73, 50e527.
Jantzen, J. M. (1981). Why college students choose to teach: a longitudinal study.Journal of Teacher Education, 32(2), 45e59.
Johnson, S. M., & Birkeland, S. E. (2003). Pursuing a “Sense of Success”: new teachersexplain their career decisions. American Educational Research Journal, 40(3),581e617.
Jones, D. L., & Sandridge, R. E. (1997). Recruiting and retaining teachers in urban schools:implications for policy and the law. Education and Urban Society, 29(2), 192e204.
Joseph, P. B., & Green, N. (1986). Perspectives on reasons for becoming teachers.Journal of Teacher Education, 37(6), 28e33.
Kyriacou, C., & Coulthard, M. (2000). Undergraduates’ views of teaching as a careerchoice. Journal of Education for Teaching, 26(2), 117e126.
Lent, R. W., Lopez, F. G., & Bieschke, K. J. (1993). Predicting mathematics-relatedchoice and success behaviors: test of an expanded social cognitive model.Journal of Vocational Behavior, 42, 223e236.
Little, T. D. (1997). Mean and covariance structures (MACS) analyses of cross-cultural data: practical and theoretical issues. Multivariate Behavioral Research,32(1), 53e76.
Liu, E., Kardos, S. M., Kauffman, D., Preske, H. G., & Johnson, S. M. (2000). Barelybreaking even: Incentives, rewards, and the high costs of choosing to teach. Har-vard Graduate School of Education. http://www.gse.harvard.edu/wngt/Barely%20Breaking%20Even%200700.PDF.
Lortie, D. C. (1975). School-teacher: A sociological study. Chicago: University ofChicago Press.
Lyng, S. T., & Blichfeldt, J. F. (2003). Attracting, developing and retaining effectiveteachers: Country background report Norway. Work Research Institute.
Marsh, H. W., Balla, J. R., & McDonald, R. P. (1988). Goodness-of-fit indexes inconfirmatory factor analysis: the effect of sample size. Psychological Bulletin,103, 391e410.
MCEETYA. (2002). Demand and supply of primary and secondary school teachers inAustralia. Part F complementary data. Melbourne: Ministerial Council onEducation, Employment, Training and Youth Affairs.
McGaw, B., & Jöreskog, K. G. (1971). Factorial invariance of ability measures ingroups differing in intelligence and socioeconomic status. British Journal ofMathematical and Statistical Psychology, 24, 154e168.
Meredith, W. (1993). Measurement invariance, factor analysis and factorial invari-ance. Psychometrika, 58(4), 525e543.
Moran, A., Kilpatrick, R., Abbott, L., Dallatt, J., & McClune, B. (2001). Training toteach: motivating factors and implications for recruitment. Evaluation &Research in Education, 15(1), 17e32.
Murnane, R. J. (1995). Supply of teachers. In L. W. Anderson (Ed.), Internationalencyclopedia of teaching and teacher education (2nd ed.). (pp. 72e76) New York:Elsevier Science.
Naess, T. (2002). Realfagloerere i skolen - rekruttering, beholdning og avgang, (No.NIFU-rapport 5/2002). Oslo: Norsk institutt for studier av forskning ogutdanning.
OECD. (2004a). Attracting, developing and retaining effective teachers. Paris: Organisationfor Economic Co-operation and Development. http://www.oecd.org/document/9/0,2340,en_2649_34521_11969545_1_1_1_1,00.html Accessed. 25.03.05.
OECD. (2004b). Attracting, developing, and retaining effective teachers. U.S. depart-ment of education, international affairs office. Country background report for theUnited States. http://www.oecd.org/dataoecd/18/52/33947533.pdf Accessed26.01.06. Washington, D.C.: 73.
OECD. (2005). Teachers matter: Attracting, developing and retaining effective teachers.Paris: OECD Publishing.
OECD. (2011). Building a high-quality teaching profession: Lessons from around theworld. Background report for the international summit on the teaching profession.Paris: OECD Publishing. http://asiasociety.org/files/lwtw-teachersummit.pdfAccessed 05.12.11.
Ofsted. (2001). The annual report of her majesty’s chief inspector of schools: Standardsand quality in education 2000/01. London: Office of Standards in Education.
Preston, B. (2000). Teacher supply and demand to 2005-projections and context.Canberra: Australian Council of Deans: ACDE.
Ramsay, G. (2000). Quality matters. Revitalising teaching: Critical times, criticalchoices. Report of the review of teacher education. Sydney: NSW Department ofEducation and Training.
Richards, R. (1960). Prospective students’ attitudes toward teaching. Journal ofTeacher Education, 11, 37e380.
Richardson, P. W., & Watt, H. M. G. (2005). “I’ve decided to become a teacher”:influences on career change. Teaching and Teacher Education, 21(5), 475e489.
Richardson, P. W., & Watt, H. M. G. (2006). Who chooses teaching and why?Profiling characteristics and motivations across three Australian universities.Asia-Pacific Journal of Teacher Education, 34, 27e56.
Robertson, S., Keith, T., & Page, E. (1983). Now who aspires to teach? EducationalResearcher, 12(6), 13e21.
Serow, R. C., Eaker, D., & Ciechalski, J. (1992). Calling service and legitimacy:professional orientation and career commitment among perspective teachers.Journal of Research and Development, 25(3), 136e141.
Serow, R. C., & Forrest, K. D. (1994). Motives and circumstances: occupational-change experiences of prospective late-entry teachers. Teaching and TeacherEducation, 10(5), 555e563.
Skilbeck, M., & Connell, H. (2003). Attracting, developing and retaining effectiveteachers: Australian country background report for OECD. Canberra, ACT:Department of Education, Science and Training.
Sparkes, A. (1988). Strands of commitment within the process of teacher initiatedinnovation. Educational Review, 40, 30e317.
Tucker, L. R., & Lewis, C. (1973). A reliability coefficient for maximum likelihoodfactor analysis. Psychometrika, 38, 1e10.
Tudhope, W. B. (1944). Motives for choice of the teaching profession by trainingcollege students. British Journal of Educational Psychology, 14, 129e141.
Valentine, C. W. (1934). An enquiry as to reasons for the choice of the teachingprofession by university students. British Journal of Educational Psychology, 4,237e259.
Vijver, F. V. D., & Tanzer, N. K. (1998). Bias and equivalence in cross-cultural assess-ment: an overview. European Review of Applied Psychology, 47(4), 263e279.
Watt, H. M. G. (2002). Gendered achievement-related choices and behaviours inmathematics and English: The nature and influence of self-, task- and valueperceptions. Unpublished Ph.D., University of Sydney.
Watt, H. M. G. (2004). Development of adolescents’ self perceptions, values and taskperceptions according to gender and domain in 7th through 11th gradeAustralian students. Child Development, 75, 155e1574.
Watt, H. M. G. (2006). The role of motivation in gendered educational and occu-pational trajectories related to math. In H. M. G. Watt, & J. S. Eccles (Eds.),Understanding women’s choice of mathematics and science related careers:Longitudinal studies from four countries. Educational Research and Evaluation,12(4), 305e322.
Watt, H. M. G. (2008). What motivates females and males to pursue sex-stereotypedcareers? In H. M. G. Watt, & J. S. Eccles (Eds.), Gender and occupational outcomes:Longitudinal assessments of individual, social, and cultural influences (pp. 87e113)Washington, D.C.: American Psychological Association.
Watt, H. M. G., & Richardson, P. W. (2007). Motivational factors influencing teachingas a career choice: development and validation of the FIT-Choice scale. Journalof Experimental Education, 75, 167e202.
Watt, H. M. G., & Richardson, P. W. (2008). Motivations, perceptions, and aspirationsconcerning teaching as a career for different types of beginning teachers.Learning and Instruction, 18, 408e428.
Watt, H. M. G., Shapka, J. D., Morris, Z. A., Durik, A. M., Keating, D. P., & Eccles, J. S.Gendered motivational processes affecting high school mathematics partici-pation, educational aspirations and career plans: a comparison of samples fromAustralia, Canada and the United States. Developmental Psychology, in press.
Wigfield, A., & Eccles, J. S. (2000). Expectancy-value theory of achievement moti-vation. Contemporary Educational Psychology, 25, 68e81.
Woods, P. (1981). Strategies, commitment and identity: making and breaking theteacher. In L. Barton, & S. Walker (Eds.). Teachers and Teaching Lewes: FalmerPress.: Schools.
Yong, B. C. S. (1995). Teacher trainees’ motives for entering into a teaching career inBrunei Darussalam. Teaching and Teacher Education, 11(3), 275e280.
Wright, B. D. (1977). Our reason for teaching. Theory into Practice, 16, 225e230.Young, B. J. (1995). Career plans and work perceptions of preservice teachers.
Teaching and Teacher Education, 11(3), 281e292.