Embed Size (px)
Citation preview

W O R K I N G P A P E R 1 6 9 • O c t o b e r 2 0 1 6
Teaching Assistants and Nonteaching Staff: Do They Improve
Student Outcomes?
C h a r l e s T . C l o t f e l t e rS t e v e n W . H e m e l t
H e l e n F . L a d d
NATIONAL CENTER for ANALYSIS of LONGITUDINAL DATA in EDUCATION RESEARCH
A program of research by the American Institutes for Research with Duke University, Northwestern University, Stanford University, University of Missouri-Columbia, University of Texas at Dallas, and University of Washington
TRACKING EVERY STUDENT’S LEARNING EVERY YEAR

Teaching Assistants and Nonteaching Staff: Do They Improve Student Outcomes?
Charles T. Clotfelter Duke University
Steven W. Hemelt
University of North Carolina, Chapel Hill
Helen F. Ladd Duke University

Contents Acknowledgements…………………………………………………………………………..ii Abstracts……………………………………………………………………………………..iii 1. Introduction……………………………………………………………………………....1
2. Relevant Literature on the Key Staffing Categories……….…………………………….2
3. Teachers………………….. ……………………………………………………………..3
4. Teaching Assistants (TAs)……………………………………………………………….5
5. Other Staffing Categories: Health Care Providers…….…………………………………7
6. Miscellaneous Other Staffing Categories………………………………………………..9
7. Background and Data on School Staffing in North Carolina…………………………...10
8. Statistical Model…...…………………………………………………………………....13
9. Data and Results………………………………………………………………………...17
10. Basic Test Score Models………………………………………………………………..18
11. Subgroup and Subsample Patterns……………………………………………………...20
12. Academic Proficiency Results………………………………………………………….21
13. Impact on Student Behavioral Outcomes………………………………………………22
14. Summary of Findings…………………………………………………………………..24
15. Falsification and Robustness Checks…………………………………………………..25
16. Conclusion……………………………………………………………………………...27
References……………………………………………………………………………….....31 Figures……………………………………………………………………………………...34 Tables……………………………………………………………………………………....37

Appendix A…………………………………………………………………………………44

ii
Acknowledgements The authors gratefully acknowledge financial support from the National Center for Analysis of Longitudinal Data in Education Research (CALDER) funded through grant #R305C120008 to American Institutes for Research from the Institute of Education Sciences, U.S. Department of Education. The views expressed are those of the authors and should not be attributed to the American Institutes for Research, its trustees, or any of the funders or supporting organizations mentioned herein. Any errors are attributable to the authors.
The authors want to thank research assistance from Adrienne Jones, Winnie Biwott, and Ying Shi who provided excellent research assistance for this project.
CALDER working papers have not undergone final formal review and should not be cited or distributed without permission from the authors. They are intended to encourage discussion and suggestions for revision before final publication.
CALDER • American Institutes for Research 1000 Thomas Jefferson Street N.W., Washington, D.C. 20007 202-403-5796 • www.caldercenter.org

iii
Teaching Assistants and Nonteaching Staff: Do They Improve Student Outcomes? Charles T. Clotfelter, Steven W. Hemelt, Helen F. Ladd CALDER Working Paper No. 169 October 2016
Abstract
This paper examines the role of teaching assistants and other personnel on student outcomes in elementary schools during a period of recession-induced cutbacks in teachers and teaching assistants. Using panel data from North Carolina, we exploit the state’s unique system of financing its local public schools to identify the causal effects of teaching assistants and other staff on student test scores in math and reading and other outcomes. We find remarkably strong and consistent evidence of positive contributions of teaching assistants, an understudied staffing category, with larger effects on outcomes for minority students than for white students. Keywords: Teaching assistants, school finance, class size JEL Categories: I2 (Education and Research Institutions); I 22 (Educational finance); J45 (Public sector labor markets)

1. Introduction
This paper takes a new look at a perennial question in education: Do resources matter and, if so,
which ones? Our perspective differs from that of most other studies in that we focus directly on staffing
levels rather than on funding levels or teacher quality. We do so in the context of elementary schools in
North Carolina. The peculiarities of that state’s approach to funding schools makes it possible for us to
estimate plausibly causal estimates of the effects of teachers and teaching assistants and possibly health
care workers on student test scores and behaviors. The most compelling results emerge for the category
of teaching assistants.
The study builds directly on two literatures related to school finance and policy. One is the
extensive literature on whether money matters. In the context of much of that literature, especially the
many early studies summarized by Hanushek (1986, 1997), researchers explore whether spending on
teachers – in the form of higher salaries for years of experience, master’s degrees or National Board
Certification, or on larger numbers of teachers in the form of smaller class sizes – pays off in the form of
higher student outcomes, typically as measured by test scores. Based on Hanushek’s conclusion of no
clear and consistent effects of spending, for many policymakers, the standard mantra has been “money
doesn’t matter.” That view has justified decisions either not to increase education spending or to
implement accountability efforts designed to make schools use whatever resources they have, especially
teachers, more productively. More recent work that makes use of funding changes induced by state
school finance court cases challenges the Hanushek conclusion and indicates a more positive role for
additional funding (Jackson et al., forthcoming). Moreover, other recent studies confirm positive effects
of school funding, especially in the lower grades and often for pupils in disadvantaged communities
(e.g., Guryan 2001; Chadhary 2009; & Papke 2005).

2
A second smaller, but growing, body of literature focuses attention on expenditures for specific
programs within schools, such as health centers or social workers, and often looks at a broader set of
outcome measures, including graduation rates, teen pregnancy, and grade retention (Carrell & Carrell
2006; Reback 2010a; & Lovenheim et al., 2014).
A major challenge facing any study of school resources is reverse causation, which would occur
if the amount of resources available to any specific school is driven by unmeasurable characteristics of
the school. If schools with more able or motivated students have access to greater resources than
schools with less able or motivated students, for example, estimates of the impact of resources are likely
to be upward biased. Conversely, if resources are allocated in a compensatory way, their estimated
impacts may be downward biased. As we describe below, the North Carolina policy context allows us to
address such endogeneity issues by using state-level staffing assignments to districts to carve out
plausibly exogenous variation in school-level staffing movements over time.
Motivating our research is the significant reduction in state-funded staffing levels for teachers
and teaching assistants in North Carolina that took place during the Great Recession and that have
continued to the present. The variation in staffing levels over the period 2001-2012 in those two
categories is sufficiently large, especially for teaching assistants, for us to estimate causal effects on
student outcomes at the elementary level. We conclude that cutbacks in teaching assistants have had
clear adverse consequences for students.
2. Relevant literature on the key staffing categories
We highlight here the literature related to our two main categories of primary interest: teachers
and teaching assistants. In addition, we refer briefly to health and to other categories that we include in
the various models. We start with teachers because it is the category for which there is the most prior
interest, but our main interest is in the role of teaching assistants.

3
3. Teachers
As we explain further below, our measure of teachers is the number of regular teachers divided
by the total number of students in each school. Although not specifically a measure of class size,
because we do not link teachers and students to particular classes, changes in this measure within a
school over time should be closely related to changes in class size. Hence the relevant literature for
predicting the effects of such a change is the extensive literature on the association between class size
and educational outcomes.
At a theoretical level, class size often matters because of interactions among peers in the
classroom. As spelled out in a well-known article by Edward Lazear (1999), instruction in the classroom
is like a public good, but one in which negative externalities arise when the behavior of one or more
students impede the learning of their classmates. This perspective predicts that lower class sizes may be
most desirable in the lower grade levels and in schools serving disadvantaged children. The logic is that
because younger children have shorter attention spans than older children the likelihood of disruption
for any given class size is greater in the lower grades. An analogous argument applies for disadvantaged
students who, because of their home situations, may come to class less ready to learn than their more
advantaged counterparts.
The best-known and most credible evidence on class size comes from the Tennessee STAR class
size reduction experiment in the 1980s. In this experiment, students in grades K-3 who were randomly
assigned to small classes (13-17 students) were compared to those in regular classes (22-25 pupils ) and
also to those in regular classes with a teacher’s assistant for children. Krueger’s 1999 analysis of the
experimental data, in which he corrects for non-random attrition, finds significant and sizable test score
gains in the first year that pupils are in smaller classes and smaller but still positive gains in subsequent
years as they progress through school. Notably the effects are larger for more disadvantaged students.

4
More recent studies that follow the treatment and control pupils into their 20s (Chetty et al., 2011;
Dynarski et al., 2013) find that the pupils in the small classes were more likely to attend college and to
have other positive outcomes.
Other evidence from quasi-experimental studies that use a variety of strategies to isolate the
effects of class size generate more mixed results. One strategy pioneered by Hoxby (2000) relies on
variation in class size driven by demographic changes that lead to differences in the size of student
cohorts. Applying this method to elementary school pupils in Connecticut, she finds no effects of class
size on student achievement. Using data for Texas, Rivkin et al. (2005) find small, but inconsistent, class
size effects and Cho et al. (2012) find quite small effects for students in grades 3 and 5 in Minnesota. In
contrast, some of the non-U.S. studies find relatively large effects of class size reductions. A study using
Israeli data by Angrist and Lavy (1999) makes use of rules relating to maximum class sizes and finds large
effects of class size reductions on students in grades 4 and 5. Piketty (2004) and Bressoux et al. (2009)
also find large class size effects in France, with larger effects for low-achieving students (see summary of
evidence in Gibbons and McNally (2013)).
Emerging from this discussion is the prediction that reductions in the number of teachers per
student – which in turn imply larger class sizes – are likely to have negative effects on student outcomes
at the elementary level. We do not explore effects at the middle school level for two reasons. One is
that the predicted effects are far less clear. On the one hand middle schools students may have longer
attention spans because they are older, and therefore be less likely to be disruptive, making larger class
sizes more manageable. On the other hand, their vulnerability and hormonal changes may cause them
to be more disruptive, which would call for smaller classes. A second, and more important, reason is
that the link between the measure of the total number of regular teachers in a school per student, and
class size is far weaker in middle schools. Changes in that measure at the middle school level need not

5
lead to changes in the sizes of classes in math and English, which are the subjects in which students are
tested. Instead they may show up in the form of changes in the number and variety of other course
offerings in the school.
4. Teaching assistants (TAs)
Nationally, teaching assistants account for close to 12 percent of the total elementary and
secondary school labor force (Occupational Employment Statistics, 2014). Most districts in the nation
historically required that TAs have at least a high school diploma, but the educational requirements to
serve as a teaching assistant differ across states, and often, as is the case in North Carolina, also across
districts and schools. The 2002 federal No Child Left Behind Act (NCLB) raised the standard for TAs
working in a Title I school (a school with more than 35 percent of its students qualifying for federal Title I
funding), requiring them to have either two years of higher education or an associate’s degree and to
work with a “highly qualified teacher.” About 70 percent of North Carolina’s districts have adopted this
higher standard for all its TAs, with the other 30 percent implementing it just for their Title 1 schools.
North Carolina does not require TAs to have any form of state professional license.
TAs perform a variety of roles in classrooms. These include preparing classroom activities,
working on instruction with individuals and small groups, performing clerical tasks, managing student
behavior, and helping to evaluate student work (Kerry, 2005, NCATA). Using teaching assistants in any of
these roles has the potential to free up time for teachers to focus on their main task of teaching and to
make it easier to differentiate instruction within classrooms. The precise mix of activities that teaching
assistants engage in differs from classroom to classroom, of course, depending on differences in
teachers’ ability to make good use of their assistants and in the skills of the teaching assistants
themselves. The test-based accountability provisions of NCLB appear to have placed more pressure on
teaching assistants to participate directly in instruction, for which they may or may not be qualified.

6
The research on teaching assistants is far more limited than that on teachers. One 2001 study
has garnered attention because it uses data from the highly touted Tennessee STAR experiment referred
to above. This study (Gerber et al., 2001) addressed three questions: 1) Does the presence of a full-time
teacher aide in the classroom in grades K through 3 advance students’ academic achievement? 2) If so,
does the effect depend on how long the student attends class with an aide? 3) Do some functions of
aides have greater impacts on student achievement than others? The findings were not positive. The
authors found that teacher aides had little, if any, positive effects on students’ academic achievement,
with the one exception being students who were in classrooms with an aide for 2-3 years. Nor did the
authors find that any specific type of TA activity had an effect on student achievement.
A thorough review of the literature as of 2009 provides a more mixed and nuanced picture
(Alborz et al., 2009a and 2009b). This review was based on 35 high-quality studies, mainly from the U.S.,
England and Wales, most of which examined teaching assistant support in primary schools. Of the eight
studies that examined actual or perceived impacts of TAs on literacy and language, seven “suggested
that trained and supported teaching assistants working on a one-to-one basis or in a small group can
help primary aged children with literacy and language problems to make significant gains in learning.”
(Alborz et al., p. 1). Only two studies looked at numeracy, yielding mixed results. Nine of the studies
looked at the impact on teaching practices, such as the approaches that teachers took to organizing the
classroom and facilitating learning. The impacts varied greatly. In some cases the presence of aides did
not have much effect on teaching practices, but in others it actively facilitated student learning. Also
there is some evidence that the presence of motivated support staff increases satisfaction, and reduced
stress levels of teachers in mainstream classrooms (Alborz et al., technical report, p. 16). Overall, the
authors conclude that teaching assistants can have a positive impact on pupil progress provided they are
properly trained and supported.

7
None of this literature provides a particularly strong case for the efficacy of teaching assistants.
The absence of recent studies and, in particular, studies that are grounded in the U.S. context of strong
pressure on teachers to meet test-based accountability standards, represents a significant gap in
knowledge. A primary aim of this paper is to start filling that gap by examining the relationship between
exogenous changes in the number of teaching assistants at the school level and changes in student
achievement. The limited evidence we have suggests that the effects are likely to be larger in schools
with higher proportions of disadvantaged students.
5. Other staffing categories: health care providers
Ideally we would have a clear and consistent measure of school-level health providers over time,
but, unfortunately we do not. In practice, we define health providers as staff at the school level who are
providing mental and allied health services, plus speech pathologists and audiologists. This group
includes social workers (all of whom must have a degree in social work and be licensed by the NC
Department of Public Instruction) but it does not include guidance counselors, a group that is deemed
by the state to be providing school support services rather than health services. We do not include
nurses because our data cover only about half of all school nurses in the state, those who are employed
by local education agencies rather than other public agencies. Nor do we include psychologists, because
the school-level information on psychologists is not consistent over time.
The state provides clear guidelines for what services are supposed to be provided by each health
care category. The main task for all of them is to reduce the health-related barriers to learning that
individual children bring to the classroom, by attending to their mental and physical health needs. In
addition, these professionals are charged with addressing broader health issues such as the control of
communicable disease, and the creation of positive classroom and school environments. Social workers,
in particular, are expected to assess and evaluate students to inform the design of appropriate

8
interventions; provide crisis intervention services related to family violence, substance abuse, and
behavioral disorders; and engage in advocacy that seeks to ensure all students have equal access to
education and services to enhance their local academic progress (See NC School Social Workers’
Association).
Although the link between the health of children and student achievement is widely recognized,
little research exists on how health professionals in schools might affect student achievement. A major
challenge for researchers is the difficulty of ruling out the reverse causation that would arise, for
example, if such personnel were assigned to schools judged to be most in need. Carrell and Carrell
(2007) deal with this problem by using cross-semester variation in the counselor-student ratios in
schools across a large Florida school district in which the exogenous variation arises because of the
relatively random availability of graduate students from the University of Florida’s counseling program
for internships and practicums. Reback (2010a) deals with it by using Alabama’s discrete cutoff for
funding additional half-time appointments. Both studies find positive effects of school counselors on
student behaviors such as reduced disciplinary or weapons-related incidents, but neither finds any
effects on student achievement, perhaps because of the temporary nature of the changes.
In a far more ambitious study, Reback (2010b) uses national data from various state sources
along with national survey data on students to explore the effects of school-site mental health services
for children in third grade. His cross-state descriptive analysis provides evidence that students in states
with more aggressive mental health counseling policies perform better both in terms of higher
achievement and fewer behavioral problems than students in other states with weaker policies, even
after controlling for many student background characteristics, including their test scores in kindergarten.
A second, more causal difference-in-differences approach based on a different national data set on
school staffing (the SASS) finds that the availability of counseling services generates positive effects in

9
that it reduces the fraction of teachers who report that students are misbehaving or that their
instruction suffers due to student misbehavior. This study has nothing to say directly about student
achievement.
Other researchers have examined the extent to which school-based health centers affect a
variety of student outcomes, but these studies typically focus on high schools, not the elementary level
of interest in the current study. One recent working paper (Lovenheim et al., 2015), for example, uses
national district-level data to analyze the effects of opening school health centers and finds reductions
in teen births but no effects on graduation rates. Once again the existing evidence is limited, but it is
consistent with the compelling logic that children who are experiencing mental health problems or who
are dealing with stress that arises from parental job loss or their home environment will find it hard to
learn.
6. Miscellaneous other staffing categories
Data are also available on other categories of staff that could potentially generate higher levels
of achievement or improvements in other student outcomes. These categories include guidance
counselors, principals and other school leaders, and noncertified academic staff.1 In North Carolina,
guidance counselors are trained to incorporate the state’s Guidance Standard Course of Study through
large and small group activities, focusing on students’ growth and development. With the rise in student
assessment required by federal and state laws, many guidance counselors in North Carolina appeared to
be spending significant amounts of time simply coordinating standardized testing within the school. But
new guidelines from the state in 2014 decreed that they should be spending at least 80 percent of their
time providing direct services to students, not counting any time they spend in test coordination.
1 We excluded from all the analysis an additional category of non-regular teachers on the ground that they were working with special populations.
10
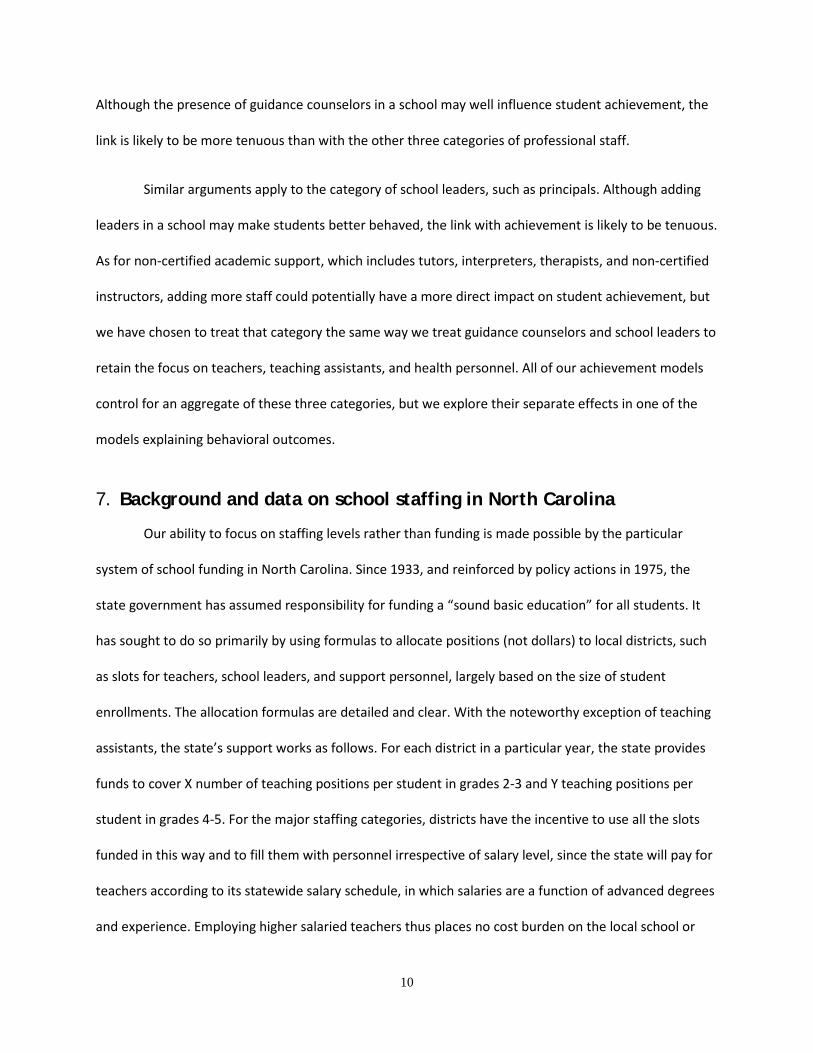
Although the presence of guidance counselors in a school may well influence student achievement, the
link is likely to be more tenuous than with the other three categories of professional staff.
Similar arguments apply to the category of school leaders, such as principals. Although adding
leaders in a school may make students better behaved, the link with achievement is likely to be tenuous.
As for non-certified academic support, which includes tutors, interpreters, therapists, and non-certified
instructors, adding more staff could potentially have a more direct impact on student achievement, but
we have chosen to treat that category the same way we treat guidance counselors and school leaders to
retain the focus on teachers, teaching assistants, and health personnel. All of our achievement models
control for an aggregate of these three categories, but we explore their separate effects in one of the
models explaining behavioral outcomes.
7. Background and data on school staffing in North Carolina
Our ability to focus on staffing levels rather than funding is made possible by the particular
system of school funding in North Carolina. Since 1933, and reinforced by policy actions in 1975, the
state government has assumed responsibility for funding a “sound basic education” for all students. It
has sought to do so primarily by using formulas to allocate positions (not dollars) to local districts, such
as slots for teachers, school leaders, and support personnel, largely based on the size of student
enrollments. The allocation formulas are detailed and clear. With the noteworthy exception of teaching
assistants, the state’s support works as follows. For each district in a particular year, the state provides
funds to cover X number of teaching positions per student in grades 2-3 and Y teaching positions per
student in grades 4-5. For the major staffing categories, districts have the incentive to use all the slots
funded in this way and to fill them with personnel irrespective of salary level, since the state will pay for
teachers according to its statewide salary schedule, in which salaries are a function of advanced degrees
and experience. Employing higher salaried teachers thus places no cost burden on the local school or

11
district. The one exception to this funding approach is teaching assistants (TAs). For them, the state
provides only a certain dollar amount of funding per student to each district, thus limiting the number of
FTE TA positions a district can hire using state appropriations.
Although the state is by statute responsible for funding a sound basic education, over time the
local districts have shouldered a growing share of school funding, a share reaching 24 percent in 2012
(North Carolina Public School Forum, 2012). The local funds are raised through taxes at the county level,
because in North Carolina elected county commissioners have the authority to levy taxes for education,
not the elected school board members. In most cases, the counties are coterminous with the school
districts but, largely as a historical anomaly, a few counties contain more than one school district.2
Districts use most of the local taxes for education for two main purposes – salary supplements to add to
the amounts set by the state salary schedule for teachers, and funding for facilities. Small amounts are
also used to hire additional staff and to pay for supplies. Any variation in the number of locally funded
positions across counties is likely due to local preferences for education and their ability to pay. In
recent years, some districts have used leftover funds that the county accumulated from federal
American Recovery and Reinvestment Act (ARRA) funds after the 2008 recession to offset cuts in
positions funded by the state.
We focus on three main categories of staffing positions: regular teachers, teaching assistants,
and health providers. For the reasons explained above, each of these types of staff has the potential to
affect student outcomes. The outcome variables (measured and analyzed at the school level) include
normalized math and reading scores for all students in grades 3-5 in elementary schools, percentages of
2 There are 100 counties in North Carolina and 115 school districts.

12
students meeting state-defined proficiency levels in math and reading, and behavioral outcomes such as
absence rates and suspensions.
We use school-level data from 2001 to 2012 for 1,094 elementary schools with a total sample
size of 10,400 schools for our test score analysis.3 The lack of data limits our analysis of behavioral
outcomes to the shorter 2006 to 2012 period. We exclude schools with atypical grade configurations,
such as grades 4-8 or grades K-8, which might require unusual staffing patterns. For each category of
staffing we have information the number of slots broken down by whether the slots are paid for by
state, local, or federal funds. Figures 1, 2, and 3 depict the number of positions in each of the three main
categories per 100 students across our full sample of elementary schools.
Without exception, the state government funds the largest share of the positions in each
category. The changes over time in state-funded staffing levels in the categories of teachers and
teaching assistants are central to our analytical strategy. The recent declines in those categories largely
reflect a combination of recession-related pressures on the state budget and subsequent policy
decisions by a Republican legislature after 2010 committed to reducing the size of government. In
contrast, health care workers (as we measured them) have generally risen during the period.
The state allocates slots (or in the case of teaching assistants a pot of money) to districts and not
to schools. Districts may respond to changes in state-funded slots by changing levels of locally funded
positions or by reallocating slots among schools.4 Based on our discussions with district officials, it
appears that districts use various district-specific formulas or policies for allocating positions across
schools. For example they might allocate slots on a straight per-pupil basis, or they might use various
3 The samples are somewhat smaller for the models in which we used lagged staffing variables because we lose the 2001 year. 4 While districts are not allowed to transfer teaching slots to other categories, they do have some flexibility to shift funding allocated for teaching assistants to teachers.

13
allocation schemes that target slots across schools to give disadvantaged schools more resources. We do
not know much about the methods they use, but we do have evidence that at least in some cases their
allocations have changed significantly over time. To illustrate, we show in Figure 4 the allocations across
elementary schools for one district, Durham County, for the years 2004 and 2012. The graph shows that
with the decline in teacher slots, the county flattened the distribution of teaching slots relative to the
shares of disadvantaged students in each school (as measured by the percent eligible for free or
reduced-price lunch on the horizontal axis). In addition, the district appeared to have also modified
somewhat the allocation of teaching assistant positions.
These district-level allocation decisions are relevant to our modeling challenge to the extent that
changes in a school’s slots over time are associated with changes in characteristics of a school correlated
with student outcomes. As we explain below, we eliminate this correlation by using state-funded (and
also federally funded) slots at the district level as instruments for school-level changes.
8. Statistical model
Our goal is to leverage changes over time in staff positions to determine how staffing patterns
affect student outcomes at the school level. Letting s denote the school and t denote the year, we write
the basic model as:
(1) st s st x st z st s t stY Staff X Zα β β β δ ϕ ε= + + + + + +
Here, stY is the outcome of interest for school s in year t. stStaff is a vector of staffing categories in
school s and year t. stX and stZ are vectors of teacher-quality characteristics (e.g., average licensure
test scores of the teachers) and time-varying school-level characteristics (e.g., percent on FRPL or special
needs) for school s and year t. School ( sδ ) and year ( tϕ ) fixed effects absorb across-school variation and
trends over time in our key outcomes; and stε is a randomly distributed error term.
14
Our key variables – the staffing measures – are all expressed as full time equivalent (FTE)
positions at the school level. We have explicitly excluded variables that would control for differences
across districts or schools in average teacher salaries. Such salary differences would reflect both the mix
of teachers within a school – with more experienced teachers paid more – and the willingness of the
local county to supplement the pay of teachers over and above the statewide salary schedule. While, to
some extent, higher teacher salaries may reflect quality differences in teachers, they may also reflect
cost-of-living differences, or differences in the salaries needed to attract a given quality teacher to a
particular part of the state. Hence, instead of controlling for teacher salaries, we estimate models that
include more direct measures of teacher quality at the school level, including their average licensure test
scores, the proportion of teachers with more than three years of experience, and the share who are
National Board Certified ( stX ). Research studies based on North Carolina data confirm that each of
these measures of teacher quality are predictive of higher test scores (Clotfelter et al., 2006, 2007). We
have no similar measures for the quality of other school personnel; we simply assume that the quality of
teachers also serves as a proxy for the quality of other staff in the school.
The standard statistical challenge in models of this type is the potential endogeneity that arises
if staffing variables are correlated with the error term in the models. For example, districts may allocate
fewer staff positions to schools with high test scores. Alternatively, schools with high test scores may
receive more staffing because they are located in wealthy counties that are willing to raise local tax
dollars to provide them with higher amounts of staffing. In the first case, simple cross-sectional
estimates of how staffing affects student outcomes would be downward biased and in the second they
would be upward biased. We address this challenge in three ways.
Our first strategy for identifying the effects of staffing is to include school fixed effects in all
models, which is feasible because we have a panel data set. This strategy means that we are estimating
15
models that control statistically not just for measurable characteristics of each school but also
unobservable characteristics that are time-invariant and that might be correlated with staffing levels. In
effect, we are estimating the effects of within-school changes in staffing on within-school changes in
outcomes. The staffing changes refer to all changes in a staffing category regardless of the funding
source.
Although the use of school fixed effects helps because it breaks the link between the average
characteristics of the schools and their staffing levels, it does not rule out any time-varying correlation
between school characteristics that could affect both achievement and the school’s staffing levels.
Because school fixed effects control only for additive time-invariant characteristics of schools, we also
need to account for the possibility that staffing in particular schools may be affected by time-varying
characteristics of the schools, such as their proportions of low-income or minority students. That
correlation would be present if district policymakers use school characteristics to allocate slots among
the schools each year and those characteristics change differentially over time in individual schools. The
most straightforward way to address this possibility is to include as explanatory variables a vector of
school-level, time-varying characteristics such as the percent of low-income or African American
students, both of which are likely to affect outcomes such as test scores and potentially to be correlated
with staffing. Thus in all our models, we include a vector of time-varying school-level demographic
variables ( stZ ).
While the combination of school fixed effects and time-varying covariates address many of the
statistical problems related to identification, they do not completely rule out the potential for district-
level decisions to bias the estimated effects on school staffing. This problem arises because of the power
that district administrators possess to influence the staffing positions at each school. One way they can
do so is by getting their local counties to appropriate funding for positions over and above the slots

16
funded by the state or federal governments. They also have the authority to alter how they distribute
the state-funded slots among schools, and in some cases to shift some slots among categories. Consider
the possibility that local officials respond to a cutback in state funding for support staff either by
redistributing the existing staff among schools or by changing or expanding their own funding but with a
different allocation among the schools. To the extent that they pay attention to changes in student
outcomes in making their allocation decisions (e.g., by providing more support staff to schools
experiencing increases in absentee rates or declines in test scores), it would not be appropriate to view
the change in staffing as exogenous to the individual schools. To counteract the bias that would occur if
our explanatory variables (changes in staffing) were endogenous at the school level, we need to identify
the effects of staffing by estimating models in which the variation in staffing reflect changes only at the
state or federal level, which are exogenous to the district.
To that end we estimate 2SLS models in which we substitute predicted values for actual values
of each of the staffing measures. This approach requires that we estimate first-stage regressions to
predict levels of each of the staffing categories at the school level. Each first-stage equation includes as
exogenous variables the state and federal allocations for all of the specific categories, aggregated to the
district level (and normalized by the number of pupils), along with the other independent variables,
including the school and year fixed effects. In this way, the variation in the staffing variables in the
second-stage model reflects only district-level variation not affected by local discretionary decisions.
We weight observations by the number of test takers in each school so that our estimated
effects of staffing can be interpreted as average effects on students, not on schools. In addition, we
cluster standard errors in our models at the school level to address the potential for student outcomes
in a school to be correlated over time.

17
9. Data and Results
Table 1 provides descriptive statistics for all the variables in our test score analyses. The test
scores of the students (normalized by grade and year) refer only to students in grades 3, 4, and 5
because those are the only students who are tested. All the staffing variables, however, apply to the
whole school.5
Consider first the data for the full sample of elementary schools in Table 1. The mean teacher-
to-student ratio is 0.052, that is, 5.2 teachers per 100 students. If each regular teacher had her own
class, that would translate into an average class size of about 19 students, albeit most likely with smaller
class sizes in the early grades and larger ones in the upper grades. The mean for teaching assistants is
slightly more than half that, at 2.9 per 100 students. Health providers are much less numerous, with only
about 0.2 per 100 students, or about 1 provider per 500 students. The “other” combined category of
guidance counselors, school leaders, and non-certified academic staff is somewhat larger, with 0.7 per
100 students or about 1 per 140 students.
The student characteristics indicate that slightly less than half the students are eligible for free
or reduced-price lunch (FRPL), 27 percent are black, 9 percent are Hispanic, and 10 percent have special
needs. The teacher characteristics indicate that teachers have slightly above average licensure scores
(i.e., Praxis scores), about 10 percent are national board (NBPTS) certified, and about 78 percent have
more than three years of experience. The next two columns of Table 1 show comparable information for
subsamples of students – minority students (defined as black, Hispanic, and students classified in other
non-white categories) and white students. The staffing variables are almost identical across these two
groups of students and are similar to those for the full sample.
5 The average test scores for the full samples are not precisely zero in part because both samples exclude tested students in schools that offer non-standard sets of grades.
18
The final two columns of Table 1 provide comparable information for schools with above
average proportions of low-income students (indicated by high-FRPL) and those with below average
proportions (indicated by low-FRPL).6 The staffing variables are generally comparable to the full sample,
although the high FRPL schools have slightly higher ratios of teachers and teaching assistants, but lower
quality teachers as measured by their lower average Praxis scores and lower percentages of Board
Certified and experienced teachers.
10. Basic test score models
In Table 2, we present results for two versions of the basic model separately for student test
scores in reading and math. We report results for models both with and without the health staffing
variable because we are less confident about that variable than for the other staffing variables.
Importantly, its inclusion or exclusion from the model has little effect on the two variables of central
interest: regular teachers and teaching assistants. All the estimates are based on the 2SLS models that
we described above, all include the full set of control variables for time-varying school characteristics
and teacher quality as well as school and year fixed effects, and all are weighted by the number of
students in a school. In addition, errors are clustered at the school level.7
The full results for the preferred model are in the Appendix. As can be seen there, the various
time-varying control variables describing student characteristics enter with expected signs. For example,
higher proportions of students eligible for free and reduced-price lunch or of minority students predict
lower average test scores, and higher proportions of girls predict higher test scores. Among the teacher
6 We group schools into these categories based on the average proportion of FRPL students in a school over the time period of our panel. High-FRPL schools have more than 52 percent of their students eligible for FRPL and low-FRPL schools less than 52 percent. 7 The first-stage results for all the endogenous variables, namely, the four staffing variables in each equation are very strong. Each first-stage equation includes eight staffing variables, namely both the state and federally funded staffing amounts for each of the four staffing categories variables. These exogenous variables enter the first-stage equations with high F statistics that range from 22.8 for the “other staff category” to 342 for the teaching assistant category.

19
qualifications variables, teacher experience plays the largest and more consistent role: an increase in the
proportion of teachers with more than 3 years of experience predicts higher test scores.
As expected, the teacher variables enter with positive coefficients, although we cannot rule out
the hypothesis that more teachers per student (and hence smaller class sizes) have no impact on
student reading scores. Even in math, the larger positive coefficient is only marginally significant. The
larger magnitude of the estimated effect for math than for reading is consistent with findings from other
studies that suggest that teachers exert larger impacts on test scores in math than in reading in part
because of the larger out-of-school factors that affect student reading. The results for teaching
assistants are much clearer. The models show that teaching assistants contribute in positive ways to
student test scores in reading but not in math, with the reading coefficient about two-thirds that of the
coefficient for regular teachers.
The health workers enter with positive and statistically significant coefficients for both subjects,
and the coefficients for the “other staff” variables are positive but not distinguishable from zero. By
controlling for this other staffing category we avoid any bias that might arise from correlations between
that category and any of our other staffing categories of major interest.8
To determine the effect of one additional staff member in each category per 100 students we
need to multiply the reported coefficients by 0.01. For teachers an increase of that magnitude would
mean going from 5.2 teachers per 100 students to 6.2 teachers per 100 students, which would be
equivalent to a reduction in average class size from 19 to 16 students (bearing in mind, however, that
some classrooms may initially be larger than others). Taking our estimates for regular teachers at face
8 We estimated some models in which we split the “other” category into its components of guidance counselors, school leaders, and non-certified academic support but find some implausibly large negative coefficients that we believe reflect some unusual correlations in the data. Later in the paper, we present some disaggregated results for the non-test score outcomes based on a shorter sample.

20
value, the estimates suggest that such a change would have an impact of about 0.01 standard deviations
in reading and 0.023 standard deviations in math. For teaching assistants, the estimates indicate that
one additional teaching assistant per 100 students would increase reading scores by about 0.009
standard deviations with essentially no impact on math. In the concluding section of this paper we
compare these magnitudes to those reported elsewhere in the literature and to the relative costs of
hiring teachers and teaching assistants.
Although the much larger coefficients for health providers (8.4 in reading and 25.4 in math may
appear to suggest that the health personnel are the most productive, with one additional staff member
per 100 students leading to a 0.08 to 0.25 standard deviation predicted change in student achievement,
that conclusion would be misleading. The reason is that such a change would be far outside the range of
our data, and would only make sense if the relationship remained linear throughout. Hence, it may be
useful to consider the relative effects of a common percentage change, say 10 percent, in each of the
categories, starting from the average. That would require us to multiply coefficients by 0.005, 0.003, and
0.0002 for teachers, teaching assistants and health personnel, respectively. The results of doing so are
shown in square brackets under the standard errors for each estimate. For example, based on the
preferred model and taking the coefficients at face value, the effect (in standard deviation units) of a 10
percent increase in teachers would be 0.006 in reading and 0.012 in math, of a 10 percent increase in
teaching assistants 0.002 in reading and 0.000 in math, and for health personnel, about 0.002 in both
subjects. We note that a 10 percent increase in teachers from the average would reduce the class size
from about 19 to about 17 students.
11. Subgroup and subsample patterns
The literature we reviewed earlier suggested that smaller class sizes and more teaching
assistants may be more effective for disadvantaged students than for other students. We look for

21
differences by disadvantage first by comparing effects for minority students (i.e., black, Hispanic, and all
other non-white students) to white students, based on the presumption that minority students are likely
to be less advantaged than their white counterparts. The first four columns of Table 3 most clearly
support the conclusion that teaching assistants are more effective for minority students than for white
students in both reading and math. We note that the coefficients for minority students are large and
statistically significant both for reading (coefficient of 2.13) and math (coefficient of 1.73) and that these
effects are far larger than the estimated effects for white students in reading (coefficient of 0.99) and
the insignificant effect in math. Tests indicate that these differences by student race are statistically
significant for both subjects. Similar patterns emerge for regular teachers in that the estimated
coefficients for minority students are larger (and more statistically significant) than the corresponding
estimates for white students, implying that smaller class are more productive for minority than for white
students. In this case, however, the differences across the subgroups are not statistically significant.
Ideally, we would have liked to repeat the analysis for subgroups divided by the free and
reduced-price lunch status of the student, but we are missing the necessary data for many students.
Instead, we use school-level data on the mix of students to divide the sample of schools into those with
above average or below average proportions based on their percentages of such students averaged over
the full period. The final four columns report the results for the staffing variables. In this case, few
differences emerge. Although there is some suggestive evidence that the health workers have larger
effects in the more affluent schools (the ones with low FRPL) that difference is not statistically
significant.
12. Academic proficiency results
We report one final set of test score results (see Table 4). In this case, the outcome measure is
the proportion of tested students in each school who score at or above subject- and grade-specific

22
proficiency levels. The averages for these composite proficiency rates are 74.2 percent in reading and
79.2 percent in math. In contrast to the other test score measures that incorporate all student test
scores, this one focuses attention on students at the margin of success.
Throughout the period of this study, North Carolina schools, like schools in all other states, were
subject to the federal accountability provisions of No Child Left Behind. This federal law put pressure on
individual schools to raise the proportions of their students who tested at proficient levels or above. The
focus on proficiency rates encouraged schools to pay close attention to the students who were on the
borderline of passing the tests, perhaps to the detriment of students who are likely to score way below
or well above the proficiency cut point (Ladd & Lauen, 2010). Additional teaching assistants could
potentially play a key role in helping students close to passing to perform well enough on the test to
reach the proficiency level. The reason is that teaching assistants – assuming they have sufficient
training – can work with small groups of students who need additional help to get over the hurdle as the
teacher continues to work with the bulk of the class or they can free up time for the teacher to work
more intensively with such students.
The positive and statistically significant estimated coefficients for the teaching assistants in both
math and reading and in both forms of the model provide strong confirming evidence that teaching
assistants play this role.
13. Impacts on student behavioral outcomes
In addition to affecting test scores, staffing levels may affect other student outcomes of policy
interest. We are able to examine effects on three behavioral outcomes – absences, tardies, and within-
school suspensions – but only for the shorter period of 2006 to 2012.9 Prior research has shown that
9 We also have data on out-of-school suspensions but find that they are generally not affected by the levels of staffing so we do not discuss them here.

23
such measures may serve as reasonable proxies for what some people refer to as socio-emotional or
“non-cognitive” skills that contribute to student flourishing. For example, a low absence or tardy rate
may signify that a student is motivated to show up when expected. Moreover, attendance as early as
grade six has been shown to predict the likelihood that a student will persevere and graduate from high
school (Allensworth et al., 2007; Balfanz et al., 2007). Finally, student suspensions are often indicative of
student misbehaviors that may interfere with the learning of not only the misbehaving student but also
the learning of others through peer effects.
One potential limitation of the data available for all three outcomes is that it is reported by the
schools. That raises the possibility that different schools may have somewhat different reporting policies
which could, potentially, bias estimates of the effects of staffing levels. The inclusion of school fixed
effects in our models helps somewhat. Nonetheless it could still be that the more staff there are in a
school over time, the more likely they are to report higher levels of one or more of these outcomes
regardless of the true levels. Given our prediction that higher staffing would reduce the true incidence
of all three of these behaviors, this reporting bias would work against detecting effects of these staffing
categories on our set of behavioral outcomes.
We estimate models that include the same set of explanatory variables as the models we used
to explain variation in test scores with one exception. For these models we have divided the “other staff
category” into two parts, with one part including school leaders and the other the residual of guidance
counselors and non-certified academic staff. We separate out the school leader category, which includes
school principals and assistant principals, because a standard role for assistant principals is to address
issues related to student behavior.
The absence rate is measured as the total number of absences divided by the total number of
students in the school. The average rate across our sample is 4.75 days. Because of the non-normal
24
distributions of the tardy rate and the in-school suspension rate, we treat the dependent variable in
each case as a zero-one variable which takes on the value one if the school’s rate is above the 75th
percentile rate for the schools in the sample (with the sample for the tardy rate being far smaller than
that for the other two variables because of missing data).10 Thus, we can show how changes in staffing
levels of different types affect the probability of a high tardy or of a high suspension rate.
Relatively clear findings emerge for the teacher and teaching assistant staffing variables as well
as for school leaders. A 10 percent increase in teachers (and hence smaller classes) reduces the average
absentee rate by about 0.15 days per year (see estimate in square brackets), which represents about a 3
percent decline in the average absentee rate. Consistent with this finding, more teachers also lead to a
statistically significant reduced probability of a high rate of in-school suspensions. We have no good
explanation, however, for the positive sign for teachers in the tardy rate equation. Once again teaching
assistants make a statistically significant contribution, although in this case the effects are relatively
small, in the form of a lower absentee rate and a lower probability of a high tardy rate. In contrast to
teachers, more teaching assistants have no apparent impact on the in-school suspension rate. Finally,
more school leaders – typically in the form of assistant principals, but measured in terms of full-time
equivalents – also reduce the absentee rate and the tardy rate. The effect of a 10 percent increase in
school leaders on the absentee rate is the same order of magnitude as a 10 percent increase in teachers.
14. Summary of findings
In terms of filling gaps in the existing literature, the most important findings to emerge from this
analysis relate to teaching assistants. We find clear evidence that teaching assistants have positive
10 The 75th percentile cutoffs at the elementary level are 2.7 times for tardies and 0.32 days for suspensions. We have experimented with different cut points but they do not affect the basic patterns shown in Table 5.

25
effects on student test scores in reading, although in the case of math only for the test scores of
minority students; that the effects of teaching assistants on the test scores of minority students in both
reading and math are larger than their effects on the test scores of white students; that teaching
assistants help to boost proficiency rates in both math and reading, and that teaching assistants reduce
absentee rates and tardy rates. Thus we have a strong and quite consistent story about the importance
of teaching assistants.
More teachers (and hence smaller class sizes) also have a number of positive effects, although
some of the effects are not statistically significant. The largest and most robust effects on test scores are
for minority students. For these groups, smaller class sizes at the school level are associated with higher
scores in both reading and math. More teachers also lead to lower student absentee rates and a lower
probability of high rates of in-school suspension.
An increase in health workers also leads to higher test scores, although, somewhat
unexpectedly, possibly more so for students in the more affluent (low FRPL) schools than in the serving
more disadvantaged students. Evidence suggests that an increase in health care workers may also
increase proficiency rates in math. Although these results are interesting and clearly worthy of further
study, we do not want to oversell them because, as we show in the next section, the health care variable
does not pass a falsification test, which suggests that the estimated effects may not be fully causal.
Finally, school leaders matter in that an increase in school leaders leads to lower absentee rates and
lower probability of high tardy rates.
15. Falsification and robustness checks
Our goal throughout has been to estimate causal relationships between school staffing and
student outcomes in elementary schools. The combination of school fixed effects and time-varying
demographic characteristics of schools, supplemented by a two-stage least squares (2SLS) strategy that

26
relies on variation in state and federal staffing at the district level, should rule out most, if not all,
confounding effects at the school level. Nonetheless it is worthwhile to do some follow-up checks of our
analysis.
The first check is a falsification test for our test score models in which we substitute for each of
the staffing variables in the current year (t), the value of the variable in the following year (t+1). If our
models are reasonable, we would not expect to find the same positive and statistically significant
relationships between the future staffing variables and student test scores in the current year (t) that we
find for the current staffing period variables. Table 6 reports the results of this test for both the
preferred model and the model with no health worker variable. Both the teacher and the teaching
assistant variables pass the test. None of the estimated coefficients of either variable is positive and
statistically significant in either form of the model. The health worker variable is more problematic,
however, in that it enters the preferred model with a large positive and statistically significant
coefficient. Our interpretation of this finding is that the correlation over time in the health care staffing
variable means that we should not interpret the estimates of health staffing that we reported in Tables
2 and 3 as causal effects. Fortunately, whether or not we control statistically for health care staffing has
little effect on the coefficients of the teacher and teaching assistant variables of primary interest.
Second, we re-estimate the models with a smaller balanced sample of schools. The criterion for
inclusion in this case is that a school must be operating and testing students in every year from 2001 to
2012. Given that North Carolina is a rapidly growing state with the need for many new schools, this
sample adjustment reduces the set of schools from more than 1,090 in the main sample to about 690 or
by about 37 percent. Moreover, the balanced sample is not representative of the full set of elementary
schools in the state since it would most likely underrepresent schools in growing areas. The results for
the balanced sample are reported in Table 7. Although the coefficients of the teacher variables are small

27
and not significant, the pattern and magnitudes of the coefficients for the teacher assistant variables are
similar to those for the full sample.
16. Conclusion
It is difficult to determine how staffing levels within schools affect student outcomes such as
test scores or rates of absenteeism given that school staffing levels are typically not exogenous to the
school. The resulting challenge for empirical research is to rule out the possibility of reverse causation,
wherein student outcomes affect staffing levels, which in turn would lead to biased estimates of staffing
effects. The estimates would be upward biased if staffing levels were typically higher in schools serving
more advantaged and higher-performing students and downward biased if staffing levels were higher in
schools serving more disadvantaged and lower-performing students.
One of the contributions of this study is our use of a new strategy for addressing such bias-
inducing reverse causation. In particular, the specific manner in which the state of North Carolina funds
its schools allows us to instrument for changes in staffing at the school level with state-determined
changes in slot allocations to districts. This two-stage approach combined with school fixed effects and
time-varying demographic and teacher quality variables at the school level provides plausibly causal
estimates of staffing levels, such as teachers and teaching assistants on student outcomes.
In terms of substantive findings, the most important finding is the remarkably strong and
consistent evidence on the role of teaching assistants, a staffing category that has been growing over
time, but that has been woefully understudied. Positive effects of teaching assistants emerge for most
of the outcome measures and across most of the specifications that we present. Moreover, the
evidence is consistent with the hypothesis that teaching assistants are more productive in terms of
academic achievement for minority students than for white students.

28
Further, findings regarding our teacher variable provide new support for the conclusion that
class size matters in elementary school, at least over the implied range of class sizes observed, but more
so for math scores than for reading, and more so for minority students than for white students. Due to
data limitations, our positive findings that relate health staff to measures of academic achievement and
behavior should be interpreted as a first step and one that highlights the need for additional research on
the effects of a broader range of health care workers, including nurses, in schools.
We can put our estimated effects for the teacher variables into perspective by comparing the
implied class size effects to other estimates of class size in the literature (see Gibbons and McNally
(2013)). As we noted earlier, the most well-known study of class size is the Tennessee class size
experiment, which reduced class sizes from about 22-25 students down to 13-17 students in grades K-3.
A 2006 review by Diane Schanzenbach of the many studies of that experiment concluded that the test
score impact was about 0.15 standard deviations. Given the average reduction was 8 students (from
about 23 students per teacher down to about 15 students per teacher), the teacher-to-student ratio
would have risen from 0.043 to about 0.066, or about 0.023 units in our metric. Applying a change of
this magnitude to the coefficients for math and reading from our preferred model in Table 2 and for
minority students in Table 3 we find the following effects:
Coefficients Estimated impact (in SDs) of a 0.023 change
in teacher-to-student ratio
Math: 2.32 0.053
Reading: 1.24 (N.S.) 0.029
Math, minority students: 4.17 0.096
Reading, minority students: 2.85 0.066

29
Although some of these effects may appear quite small, a few points are worth noting. First, in
comparing our estimates to the effects of the STAR class reductions, one should bear in mind that those
reductions applied only to the early grades for which one might expect larger effects. Second, other
studies using different methods such as Hoxby (2000) found no effects at all and another study using the
same method she used (Cho et al., 2012) from Minnesota found effects that are comparable in size to
our estimates (i.e., effects of 0.04 and 0.05 standard deviations for class size reductions of 10 students).
Using the California class size reduction, Jepson and Rivkin (2009) find effects of 0.06 in reading and 0.10
in math which are comparable to our estimates for minority students. In light of this literature, we
conclude that our estimates appear to be reasonable, albeit substantially smaller than effects that
emerged from the Tennessee STAR context.
There are essentially no studies with which we can compare the magnitudes of our estimated
achievement effects of teaching assistants. The best we can do is to compare the productivity of
teaching assistants to that of teachers. If we compare our preferred estimate of 0.854 from Table 2 for
teaching assistants in reading to the (statistically insignificant) estimate of the teacher effect for reading
of 1.24 we would conclude that teaching assistants are about 70 percent as effective as regular teachers
in reading. With reference to the coefficients in Table 3 for minority students, we would conclude that
teaching assistants are about 75 percent as effective as regular teachers in reading and 41 percent as
effective in math with minority students. That would imply that teachers and teaching assistants would
be equally good investments if the salary of a typical TA were somewhere between 40 and 71 percent of
the salary of a regular teachers, provided that the only purpose for both is to raise student achievement.
We use these comparisons primarily to indicate that our preferred estimates of the effects of
staffing categories are reasonable and to emphasize our conclusion that staffing levels matter. We
remind the reader, however, that student achievement as measured by test scores in math and reading

30
is not the only goal of schooling, and that teachers, teaching assistants, and health providers may also
contribute to student outcomes in ways that we have not measured here. We have provided some hints
of these other outcomes in our analysis of behavioral outcomes, but more research is needed to present
a full picture of how school staff contribute to valued outcomes for students.

31
REFERENCES
Alborz, A., Pearson, D. Farrell, P. and Howes, A. (2009a). “The Impact of Adults Support Staff on Pupils and Mainstream Schools, A Systematic Review of the Evidence” A research brief from the EPPI-Center, Social Science Research Unit, Institute of Education. University of London. DCSF-EPPI—09-01.
Alborz, A., Pearson, D. Farrell, P. and Howes, A. (2009b). The Impact of Adults Support Staff on Pupils and Mainstream Schools. Technical Report . Research Evidence in Education Library. London: EPPI-Center, Social Science Research Unite, Institute of Education, University of London. Report no. 1702T. http://eppi.ioe.ac.uk/cms/LinkClick.aspx?fileticket=w423SGddbGM%3d&tabid=2438&mid=4540
Allensworth, E.M. and. J.Q. Easton. (2007).What matters for staying on tract and graduating in Chicago Public Schools. Chicago, IL: Consortium on Chicago School Research at the University of Chicago.
Angrist, J., & Lavy, V. (1999). Using Maimonides’ Rule to Estimate the Effect of Class Size on Scholastic Achievement. Quarterly Journal of Economics, 114(2), 533-75. Balfanz, Robert, Lisa Herzog, and Douglas J. Mac Iver. (2007). Preventing student disengagement and keeping students on the graduation path in urban middle-grades schools: Early identification and effective interventions. Educational Psychologist, 42 (4): 223-235.
Bressoux, P., F. Kramarz and C. Prost. (2009). Teachers’ Training, Class Size and Students’ Outcomes: Learning from Administrative Forecasting Mistakes. Economic Journal, 119: 540-61.
Carrell, S. & Carrell, S. (2006). “Do lower student to counselor ratios reduce school disciplinary problems?” Contributions to Economic Analysis & Policy, 5(1),Article 11.
Chaudhary, L. (2009). Education Inputs, Student Performance and School Finance Reform in Michigan. Economics of Education Review, 28, 90-98.
Chetty, R., Friedman, J. N., Hilger, N., Saez, E., Schanzenbach, D. W., Yagan, D. (2011). How Does Your Kindergarten Classroom Affect Your Earnings? Evidence from Project STAR. Quarterly Journal of Economics, 126(4), 1593-660. Cho, H., P. Glewwe, and M. Whitler. (2012). Do Reductions in Class Size Raise Student’s Test Scores? Evidence from Population Variation in Minnesota’s Elementary Schools. Economics of Education Review, 31, 77-95.
Clotfelter, C. T., Ladd, H. F., & Vigdor, J. L. (2007). “Teacher credentials and student achievement: Longitudinal analysis with student fixed effects.” Economics of Education Review, 26(6), 673-682. Clotfelter, C. T., Ladd, H.F., & Vigdor, J. L. (2006). Teacher-student matching and the assessment of teacher effectiveness. Journal of Human Resources, 41(4), 778-820. Dynarski, S., Hyman, J., & Schanzenbach, D. W. (2013). Experimental evidence on the effect of childhood investments on postsecondary attainment and degree completion. Journal of Policy Analysis and Management, 32(4), 392-717.

32
Gerber, S. B., Finn, J. D., Achilles, C. M., & Boyd-Zaharias, J. (2001). Teacher aides and students’ academic achievement, Educational Evaluation and Policy Analysis, 23(2), 123-143. Gibbons, S. G., & McNally, S. (2013). The effects of resources across school phases: a summary of recent evidence. Center for Economic Performance. DEP Discussion Paper No. 1226. Guryan, J. (2001). Does Money Matter? Regression Discontinuity Estimates from Education Finance Reform in Massachusetts, NBER Working Paper 8269, May. Hanushek, E. A. (1986). The Economics of Schooling: Production and Efficiency in Public Schools. Journal of Economic Literature, 24(3), 1141-77. Hoxby, C. (2000). The Effects of Class Size on Student Achievement: New Evidence from Population Variation. Quarterly Journal of Economics, 115(4), 1239-85. Jackson,C.K., R.C. Johnson, and C. Persico (forthcoming). The effects of school spending on educational and economic outcomes: Evidence from school finance reforms. Quarterly Journal of Economics. Jepsen, C. and S. Rivkin (2009). Class Size Reductions and Student Achievement: The Potential Tradeoff between Teacher Quality and Class Size, Journal of Human Resources, 44(1), 223-50. Krueger, A. (1999), Experimental Estimates of Education Production Functions. Quarterly Journal of Economics, 114(2), 497-532 Kerry, T. (2005). Towards a typology for conceptualizing the roles of teaching. Educational Review, 57(3), 20-30. Krueger, A., (1999) ‘’Experimental Estimates of Education Production Functions.’ Quarterly Journal of Economics, vol. 114 , pp. 497–532.
Ladd, H.F. and D.L. Lauen (2010). Status versus growth: The distributional effects of school accountability policies. Journal of Policy Analysis and Management, Vol 29(3), pp. 426-450. Lazear, E.P. (2001). Educational Production. Quarterly Journal of Economics, 116 (3): 777-803. Papke, L. E. (2005), The Effects of Spending on Test Pass Rates: Evidence from Michigan, Journal of Public Economics, 8: 821-39. Lovenheim, M. F., Reback, R. &Wedenoja, L. (2014). “How does access to Health Care Affect Health and Education? Evidence from school-based health center openings?” Working paper, Cornell University, Ithaca, NY. North Carolina School Social Workers’ Association (no date). (www.ncsswa.org) Piketty, T. and M. Valdenaire. (2006). L’impact de la taille des classes sur la reussite scolaire dans les ecoles, collμeges et lycees francais: Estimations μa partir du panel primaire 1997 et du panel secondaire 1995, Ministμere de l’Education Nationale, Les Dossiers n173.

33
Public School Forum of North Carolina, 2012. Local School Finance Study. Reback. R. (2010). Schools’ Mental Health Services and Young Children’s Emotions, Behaviors and Learning. Journal of Policy Analysis and Management, 29(4), 698-725. Reback, R. (2010). Noninstructional spending improves noncognitive outcomes: Discontinuity evidence from a unique school counselor financing system. Education Finance and Policy 5(2), 105-137. Rivkin, S., E. Hanushek and J. Kain (2005), Teachers, Schools, and Academic Achievement, Econometrica, 73(2), 417–58. Schanzenbach, D. (2006) What have Researchers Learned from Project STAR? Bookings Paper on Education Policy: 205-28.

34
Figures
Figure 1. Regular Teachers Per 100 Pupils, 2001-2012
Source: Authors’ calculations for all elementary schools in sample.
Figure 2. Teaching Assistants Per 100 Pupils, 2001-2012
Source: Authors’ calculations for all elementary schools in sample.
0.00
1.00
2.00
3.00
4.00
5.00
6.00
2000 2002 2004 2006 2008 2010 2012
Reg
ular
Tea
cher
s / 1
00 P
upils
Year
Total Local State Federal
0.00
0.50
1.00
1.50
2.00
2.50
3.00
3.50
2000 2002 2004 2006 2008 2010 2012
Teac
hing
Ass
ista
nts /
100
Pup
ils
Year
Total Local State Federal

35
Figure 3. Health Providers Per 100 Pupils, 2001-2012
Source: Authors’ calculations for all elementary schools in sample.
Figure 4. Example of Within-District Distribution of Staffing Positions
0.00
0.05
0.10
0.15
0.20
0.25
0.30
2000 2002 2004 2006 2008 2010 2012
Hea
lth P
rovi
ders
/ 10
0 Pu
pils
Year
Total Local State Federal
05
10
0 .5 1 0 .5 1
2004 2012
Teachers Fitted valuesTeaching assistants Fitted valuesHealth providers Fitted values
Num
ber o
f FTE
Pos
ition
s / 1
00 P
upils
FRPL (%)
Durham County Schools

36
Notes: Graph only includes elementary schools; FRPL = eligible for free or reduced-price lunch.

Table 1. Summary Statistics: Elementary Schools, 2001-2012
Full Sample Minority Students White Students High FRPL Low FRPLVariable Mean (SD) Mean (SD) Mean (SD) Mean (SD) Mean (SD)No. of schools 1,094 1,094 1,079 551 543No. of observations 10,400 10,362 10,060 5,184 5,216
Test ScoresReading (SD) 0.027(0.355) -0.258(0.302) 0.259(0.349) -0.250(0.266) 0.234(0.260)Math (SD) 0.032(0.380) -0.249(0.326) 0.262(0.375) -0.245(0.283) 0.240(0.303)
Staffing CategoriesRegular teachers/student 0.052(0.007) 0.052(0.007) 0.052(0.007) 0.053(0.008) 0.052(0.005)Teaching assistants/student 0.029(0.014) 0.029(0.014) 0.029(0.014) 0.031(0.016) 0.027(0.013)Health providers/student 0.002(0.002) 0.002(0.002) 0.002(0.002) 0.002(0.002) 0.002(0.001)Other staff/student 0.007(0.004) 0.007(0.004) 0.007(0.004) 0.008(0.005) 0.006(0.003)
Student CharacteristicsFRPL (%) 0.465(0.228) 0.465(0.228) 0.463(0.224) 0.661(0.162) 0.318(0.143)Black (%) 0.271(0.239) 0.272(0.239) 0.274(0.232) 0.412(0.264) 0.166(0.148)Hispanic (%) 0.091(0.095) 0.091(0.095) 0.089(0.094) 0.128(0.122) 0.063(0.053)White (%) 0.551(0.284) 0.552(0.283) 0.569(0.269) 0.380(0.271) 0.678(0.219)Other (%) 0.064(0.064) 0.064(0.064) 0.066(0.064) 0.065(0.080) 0.063(0.050)Female (%) 0.491(0.043) 0.492(0.035) 0.492(0.034) 0.491(0.043) 0.491(0.042)Special needs (%) 0.097(0.056) 0.097(0.056) 0.097(0.057) 0.099(0.057) 0.095(0.055)
Teacher CharacteristicsAverage Praxis score 0.087(0.363) 0.088(0.363) 0.089(0.359) -0.046(0.388) 0.187(0.308)NBPTS certified (%) 0.091(0.122) 0.091(0.122) 0.089(0.121) 0.068(0.111) 0.107(0.128)>3 years of experience (%) 0.766(0.183) 0.766(0.182) 0.766(0.183) 0.737(0.195) 0.788(0.170)
Number of StudentsGrades 3-5 292(105) 292(105) 291(104) 250(90) 323(104)Whole school 606(208) 606(208) 605(207) 531(183) 662(209)
Notes: SD = Standard deviation, FRPL = Free or reduced-price lunch.

Table 2. Basic Results for Staffing Variables in Elementary Schools, 2001-2012
Reading Math Reading MathIndependent variables (1) (2) (3) (4)
Regular teachers 1.236 2.315+ 1.107 2.341+(1.034) (1.388) (1.036) (1.398)[0.006] [0.012] [0.006] [0.012]
Teaching assistants 0.854** -0.068 0.938** 0.151(0.294) (0.426) (0.287) (0.412)[0.002] [0.000] [0.003] [0.000]
Health 8.393+ 25.436**(4.599) (5.736)[0.002] [0.005]
Other staff 1.095 2.029 0.888 1.380(0.984) (1.422) (0.953) (1.351)[0.001] [0.001] [0.001] [0.001]
Number of observations 10,361 10,361 10,361 10,361Number of unique schools 1,094 1,094 1,094 1,094
Elementary Preferred Model No Health
Notes: Each column comes from a separate regression that includes all the control variables listed in Table 1, plus year and school fixed effects. The staffing variables are expressed per student. Each school-level observation is weighted by the number of test-taking students in the school, and standard errors are clustered at the school level. The full equations for columns 1 and 2 are in the Appendix. **p<0.01, *p<0.05, +p<0.1

Table 3. Results for Subgroups and Subsamples
Reading Math Reading Math Reading Math Reading MathIndependent variables (1) (2) (3) (4) (5) (6) (7) (8)
Regular teachers 2.848* 4.170** 2.552+ 3.386+ 0.352 1.119 2.699 3.890(1.165) (1.488) (1.305) (1.771) (1.270) (1.639) (1.885) (2.642)[0.015] [0.022] [0.013] [0.018] [0.001] [0.006] [0.014] [0.020]
Teaching assistants 2.129** 1.729** 0.995** -0.095 0.946* 0.646 0.997** -0.485(0.489) (0.621) (0.306) (0.457) (0.477) (0.679) (0.367) (0.580)[0.006] [0.005] [0.003] [0.000] [0.003] [0.002] [0.003] [-0.001]
Health 1.737 17.141* 2.502 13.374* 2.516 15.651+ 14.017* 34.588**(7.151) (8.067) (4.280) (5.690) (7.363) (8.556) (5.495) (7.492)[0.000] [0.003] [0.001] [0.003] [0.0002] [0.003] [0.003] [0.007]
Other staff 0.229 -0.368 -0.240 2.301 1.553 1.728 -2.382 1.838(0.979) (1.464) (1.304) (1.712) (1.035) (1.474) (3.266) (4.931)[0.000] [0.000] [[0.000] [0.002] [0.0008] [0.001] [0.001] [0.001]
Number of observations 10,326 10,326 10,009 10,009 5,167 5,167 5,194 5,194Number of unique schools 1,094 1,094 1,079 1,079 551 551 543 543
High FRPL Low FRPL
Notes: Each column comes from a separate regression that includes all the control variables listed in Table 1, plus year and school fixed effects. The staffing variables are expressed per student. Each school-level observation is weighted by the number of test-taking students in the school, and standard errors are clustered at the school level. **p<0.01, *p<0.05, +p<0.1
Minority Students White Students
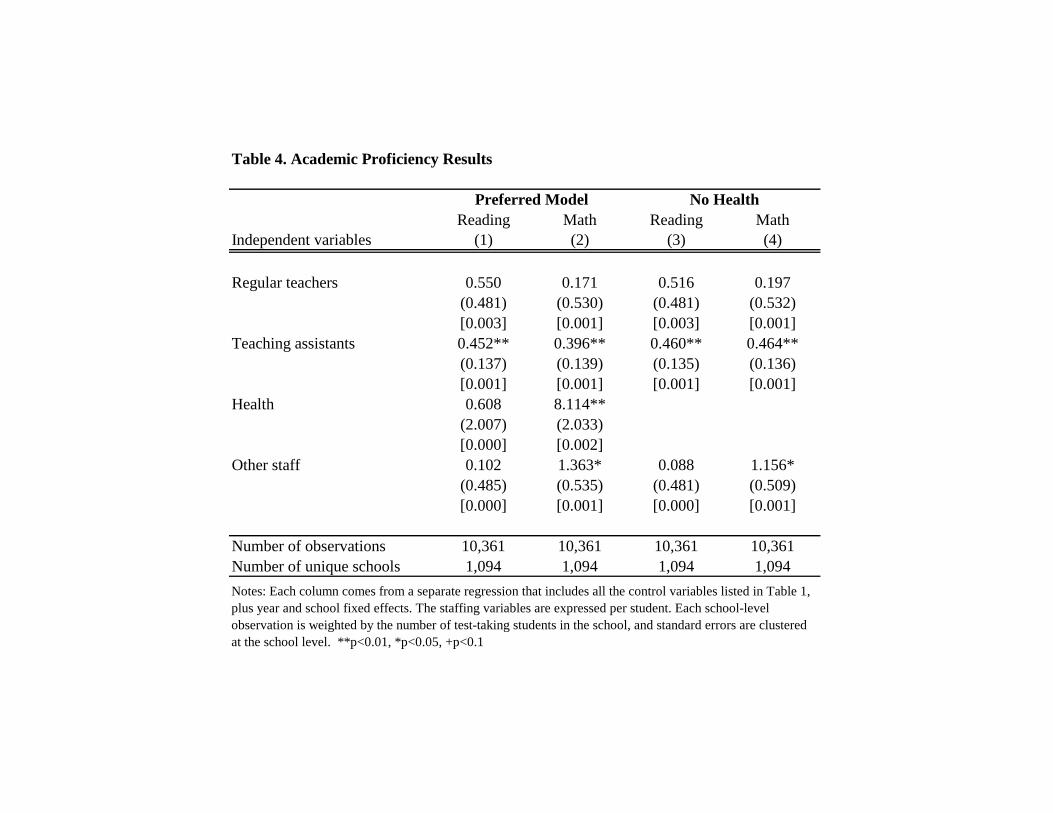
Table 4. Academic Proficiency Results
Reading Math Reading MathIndependent variables (1) (2) (3) (4)
Regular teachers 0.550 0.171 0.516 0.197(0.481) (0.530) (0.481) (0.532)[0.003] [0.001] [0.003] [0.001]
Teaching assistants 0.452** 0.396** 0.460** 0.464**(0.137) (0.139) (0.135) (0.136)[0.001] [0.001] [0.001] [0.001]
Health 0.608 8.114**(2.007) (2.033)[0.000] [0.002]
Other staff 0.102 1.363* 0.088 1.156*(0.485) (0.535) (0.481) (0.509)[0.000] [0.001] [0.000] [0.001]
Number of observations 10,361 10,361 10,361 10,361Number of unique schools 1,094 1,094 1,094 1,094Notes: Each column comes from a separate regression that includes all the control variables listed in Table 1, plus year and school fixed effects. The staffing variables are expressed per student. Each school-level observation is weighted by the number of test-taking students in the school, and standard errors are clustered at the school level. **p<0.01, *p<0.05, +p<0.1
Preferred Model No Health

Average days absent
High Tardy Rate
High In-School Suspension
RateIndependent variables (1) (2) (3)
Regular teachers -29.610** 11.711* -15.887**(10.481) (5.913) (4.187)[-0.154] [0.061] [0.083]
Teaching assistants -10.436** -5.604** -0.102(3.242) (1.879) (1.309)[-0.030] [-0.016] [0.000]
Health 58.185 2.651 -9.929(48.586) (19.849) (17.858)[0.012] [0.001] [-0.002]
School leaders -354.206** -69.052* 49.633(80.051) (31.657) (32.862)[-0.142] [-0.028] [0.020]
Staff (counselors and 57.812** -33.344** -17.620*non-certified acad. Support) (21.650) (11.738) (7.066)
[0.017] [-0.010] [-0.005]
Number of observations 5,738 3,539 5,738Number of unique schools 1,062 998 1,062
Table 5. Behavioral Outcomes
Elementary Schools
Notes: Each column comes from a separate regression that includes all the control variables listed in Table 1, plus year and school fixed effects. The staffing variables are expressed per student. Each school-level observation is weighted by the number of test-taking students in the school, and standard errors are clustered at the school level. **p<0.01, *p<0.05, +p<0.1
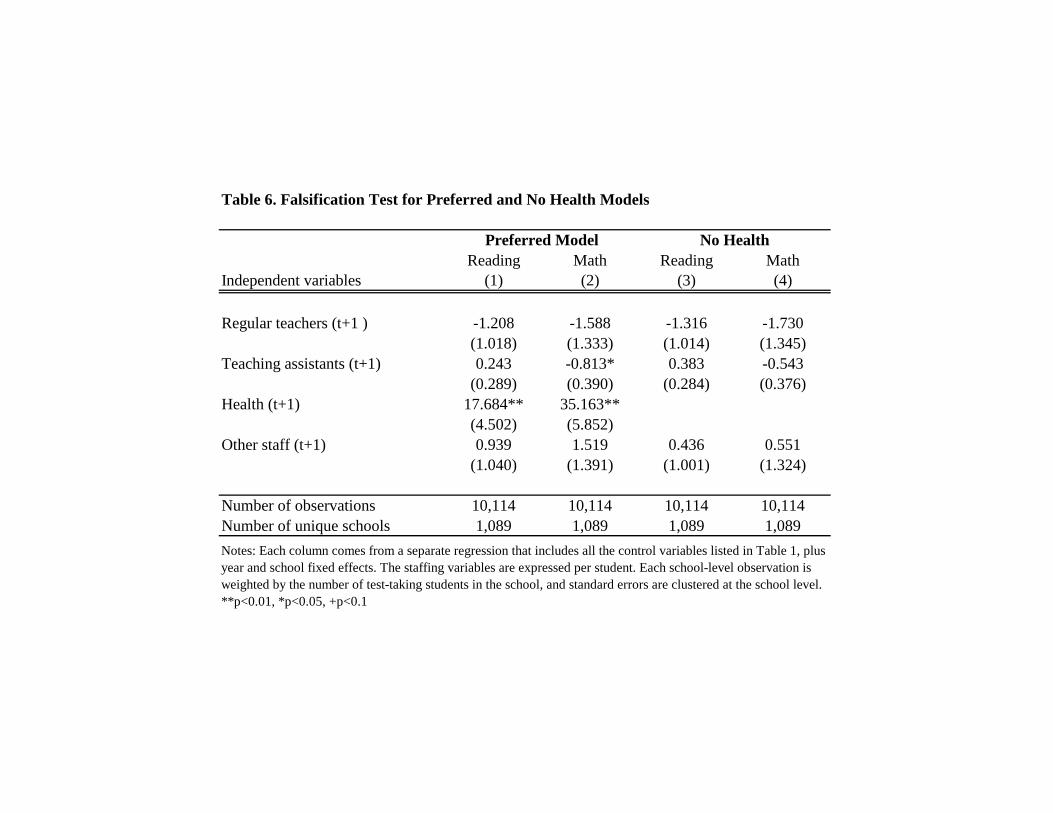
Reading Math Reading MathIndependent variables (1) (2) (3) (4)
Regular teachers (t+1 ) -1.208 -1.588 -1.316 -1.730(1.018) (1.333) (1.014) (1.345)
Teaching assistants (t+1) 0.243 -0.813* 0.383 -0.543(0.289) (0.390) (0.284) (0.376)
Health (t+1) 17.684** 35.163**(4.502) (5.852)
Other staff (t+1) 0.939 1.519 0.436 0.551(1.040) (1.391) (1.001) (1.324)
Number of observations 10,114 10,114 10,114 10,114Number of unique schools 1,089 1,089 1,089 1,089Notes: Each column comes from a separate regression that includes all the control variables listed in Table 1, plus year and school fixed effects. The staffing variables are expressed per student. Each school-level observation is weighted by the number of test-taking students in the school, and standard errors are clustered at the school level. **p<0.01, *p<0.05, +p<0.1
Table 6. Falsification Test for Preferred and No Health Models
Preferred Model No Health

Table 7. Basic Results: Balanced Samples
Reading Math Reading MathIndependent variables (1) (2) (3) (4)
Regular teachers 0.316 1.294 0.563 2.044(1.194) (1.642) (1.182) (1.630)[0.002] [0.007] [0.003] [0.011]
Teaching assistants 1.052* 0.778 1.199** 1.053+(0.419) (0.649) (0.413) (0.636)[0.003] [0.002] [0.003] [0.003]
Health 16.216** 33.521**(5.250) (6.424)[0.003] [0.007]
Other staff 3.077* 4.185* 2.651* 3.312*(1.207) (1.693) (1.131) (1.542)[0.002] [0.003] [0.002] [0.002]
Number of observations 7,479 7,479 7,479 7,479Number of unique schools 687 687 687 687Notes: Each column comes from a separate regression that includes all the control variables listed in Table 1, plus year and school fixed effects. The staffing variables are expressed per student. Each school-level observation is weighted by the number of test-taking students in the school, and standard errors are clustered at the school level. **p<0.01, *p<0.05, +p<0.1
Preferred Model No Health

Appendix Table A1. Full Results for the Preferred Model
Reading MathIndependent variables (1) (2)
Regular teachers 1.236 2.315+(1.034) (1.388)
Teaching assistants 0.854** -0.068(0.294) (0.426)
Health 8.393+ 25.436**(4.599) (5.736)
Other staff 1.095 2.029(0.984) (1.422)
% FRPL -0.317** -0.299**(0.035) (0.037)
% Black -0.368** -0.444**(0.035) (0.042)
% Hispanic -0.544** -0.234**(0.055) (0.070)
% Other 0.341** 0.533**(0.073) (0.097)
% Female 0.311** 0.223**(0.041) (0.050)
% Special Needs -0.393** -0.371**(0.049) (0.062)
Average Praxis score 0.013 0.017+(0.008) (0.010)
% NBPTS certified 0.015 0.038(0.021) (0.024)
% with years of expr>3 0.094** 0.091**(0.012) (0.015)
No. of observations 10,361 10,361No. of unique schools 1,094 1,094
Elementary
Notes: Each column comes from a separate regression that includes all the control variables listed in Table 1, plus year and school fixed effects. The staffing variables are expressed per student. Each school-level observation is weighted by the number of test-taking students in the school, and standard errors are clustered at the school level. . **p<0.01, *p<0.05, +p<0.1