Embed Size (px)
Citation preview
Articles
Teaching Molecular 3-D Literacy
Received for publication, October 5, 2001
David C. Richardson and Jane S. Richardson‡
From the Department of Biochemistry, Duke University, Durham, North Carolina 27710
An understanding of three-dimensional structure/func-tion relationships is increasingly important to modern bio-chemistry and molecular biology. Not only are the overall“folds” that illuminate evolutionary relationships uncom-promisingly three-dimensional but so, too, are the criticaldetails at active sites. Fortunately, most protein and nu-cleic acid structures are now readily available on the In-ternet from the Protein Data Bank [1, 2], as are good toolsfor displaying them on small computers such as Mage [3,4], Rasmol [5, 6], Chime [7], and SwissPDBViewer [8, 9].However, teaching these skills and concepts effectively isnevertheless a challenge, because the prior education ofstudents has concentrated entirely on one-dimensional(verbal) and two-dimensional (static pictures) information;many students feel unfamiliar and uncomfortable with 3-D1
materials.Many biochemistry textbooks now come with supple-
ments using molecular graphics, such as Voet et al. [10],Branden and Tooze [11], and Horton et al. [12]. There areweb sites with teaching materials on protein structure,such as Eric Martz’s Chime and Protein Explorer site [7],the Protein Society’s ProTeach site [30], Robert Bateman’sundergraduate kinemage site [31], our own KinemageHomepage [4], and a site planned for this journal. Therehave also been papers reporting on teaching use of thesemolecular graphics tools in a variety of settings and ap-proaches [13–16]. So far, however, there is little experi-mental data on either the absolute or the relative effective-ness of these materials for teaching 3-D literacy and onlyminimal guidance about the best ways to use them in theclassroom. We do not yet have hard quantitative data oneffectiveness, although we are now working on that prob-lem under a joint National Science Foundation grant withRobert Bateman. However, for many years we have beenusing molecular graphics in our classes and striving toimprove the 3-D literacy of our students and colleagues.We have learned a number of things that don’t work andsome that do, and we would like to share those lessonswith other biochemical educators.
In the 1970s we learned to make “worm” drawings ofprotein backbones on the blackboard, but we taught
mainly from hard copy handouts of text and 2-D figures.Our first experience developing systematic teaching ma-terials to illustrate molecular structure was over 20 yearsago, when J.S.R. worked out conventions for hand-drawnribbon schematics such as Fig. 1, aiming to do as well aspossible at translating the 3-D organization of protein“folds” into a static 2-D form on paper [17, 18]. Descen-dents of those representations, now rotatable in threedimensions, are a standard feature of current moleculargraphics. We still give our classes a set of full-page linedrawings as a “coloring book” and have them hand back afew pages colored in some way that makes sense in threedimensions. Except for an occasional M.D./Ph.D. studentwho feels insulted by this assignment, everyone else en-joys it very much; their results are often very inventiveand/or esthetic. The active involvement in decoding the2-D picture helps them connect printed figures with theircomputer exercises and also helps them recognize thehandedness of structural features.
Soon after the ribbon schematics, our research labora-tory obtained an Evans & Sutherland PS300 graphics ma-chine, and D.C.R. wrote a display program (Chaos) for it.We then developed an extensive series of laboratory ex-ercises with that system for the graduate students in ouradvanced seminar course. This was very effective but onlyworkable for a dozen students at a time. In the 1980s wealso made several movies and a large number of slides foruse in introductory classes. Movies can communicate verywell for a specific example, but we never had very many,because making good ones was very difficult, they couldnot be modified to suit new needs, and they inherentlylacked the ability of interactive graphics to zoom in andshow the answer to a student question. The use of actualphysical models is also an effective learning tool, but theyare more expensive and require more teacher interactionthan computer graphics, and they work well only for smallscale pieces of structure. We still use both brass Kendrewstick models and plastic “CPK” space-filling models in ourseminar class to build initial familiarity with the geometryand motions of small atomic groupings up to a fewresidues.
In 1989, with the help of a North Carolina Biotechnologygrant, we first got a computer projector that could showinteractive molecular graphics to a large group in theclassroom. It was a big, expensive machine, with a specialfast phosphor to allow stereo; it required a fussy alignmentand convergence procedure, and we had to wheel an
‡ To whom correspondence should be addressed. Tel.: 919-684-6010; Fax: 919-684-8885; E-mail: [email protected].
1 The abbreviations used are: 3-D, three dimensional; 2-D, twodimensional.
© 2002 by The International Union of Biochemistry and Molecular Biology BIOCHEMISTRY AND MOLECULAR BIOLOGY EDUCATIONPrinted in U.S.A. Vol. 30, No. 1, pp. 21–26, 2002
This paper is available on line at http://www.bambed.org 21
entire Evans & Sutherland work station (by then an ESV) inon a cart. We were very excited about the possibilities,however, because it let us manipulate in real time for theclass either stick-figures or multistrand ribbons (e.g. seeFig. 2) of the molecular structure so that the students couldsee the same movable images that gave us so manyinsights in our research. We gradually mastered the differ-ent rhetoric needed for this new medium: continual slowrotation back and forth, gradual zooms, markers at thepoints of interest, etc. We almost never used the stereocapability, because it turned out that motion providedbetter 3-D perception than stereo with much less hassleand could be seen by everyone.2 The projection systemhad clearly taken us far beyond the static 2-D images ofslides or textbook illustrations, and we got enthusiasticfeedback from a number of the students; however, thiswas still mostly an enrichment activity that made no obvi-ous difference to any learning that was tested on ourexams. More importantly, by querying a wider range ofstudents, we realized that the enthusiastic commentscame from the ones who had already been familiar with3-D structure and graphics, whereas the students whoneeded 3-D literacy training the most were as much con-fused as illuminated by these classroom presentations.
The answer to this problem was having students workwith interactive graphics themselves, at their own pace,which for sizable classes required capable moleculargraphics on small personal computers. In 1991, both forthe needs of the new Protein Science journal and for use inteaching, we developed the concept of the kinemage (fromkinetic image), and D.C.R. wrote the Mage display pro-gram [3], originally for the Mac but soon ported to Win-dows and later to Unix, Linux, and Java [19, 20]. Thekinemage is a different way of organizing computer graph-ics that is aimed explicitly at the communication of specificideas in 3-D. It is a two-step process with the kinemagefile authored from the atomic coordinates by one person
(usually using the companion program Prekin) and thekinemage then displayed in Mage to be explored open-endedly by that same person or by someone else (e.g. thestudent); thus, it is like a textbook illustration brought tolife. As for any illustration medium, the critical aspect ofauthoring a kinemage is guiding the viewer to successfullyperceive the key relationships by use of viewpoint, color,emphasis, and especially by leaving other things out. Inaddition to the graphics window, there is a scrollable textwindow with whatever explanations and instructions thekinemage author thought appropriate.
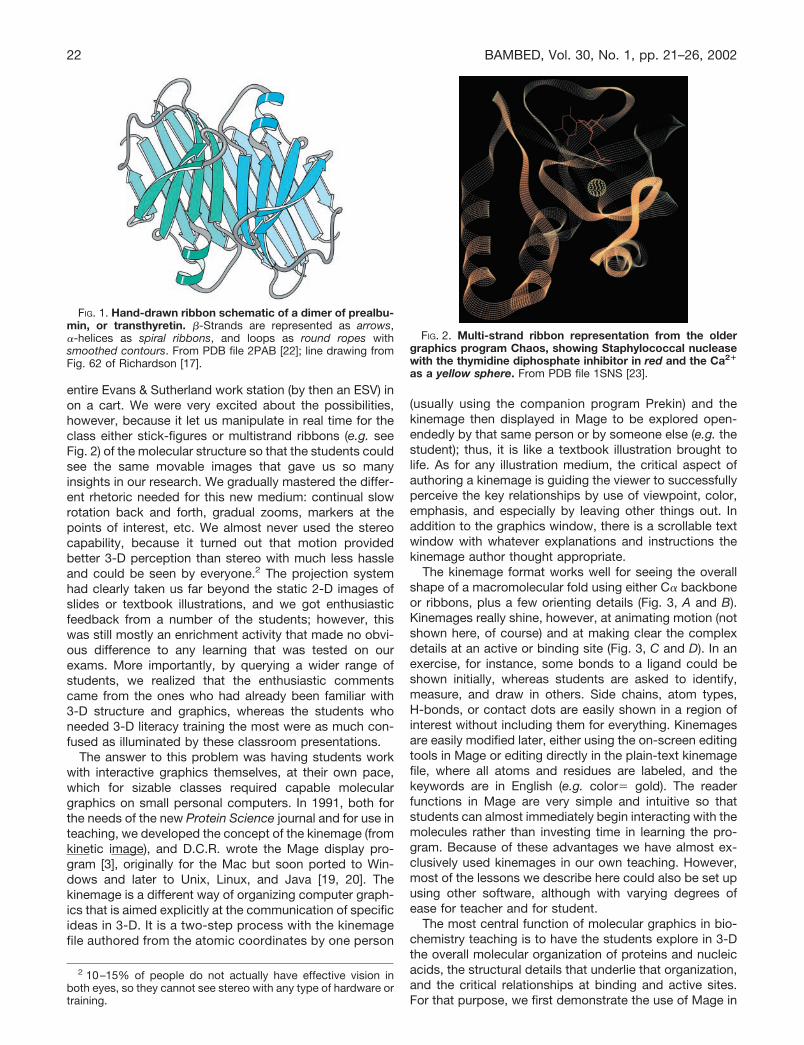
The kinemage format works well for seeing the overallshape of a macromolecular fold using either C� backboneor ribbons, plus a few orienting details (Fig. 3, A and B).Kinemages really shine, however, at animating motion (notshown here, of course) and at making clear the complexdetails at an active or binding site (Fig. 3, C and D). In anexercise, for instance, some bonds to a ligand could beshown initially, whereas students are asked to identify,measure, and draw in others. Side chains, atom types,H-bonds, or contact dots are easily shown in a region ofinterest without including them for everything. Kinemagesare easily modified later, either using the on-screen editingtools in Mage or editing directly in the plain-text kinemagefile, where all atoms and residues are labeled, and thekeywords are in English (e.g. color� gold). The readerfunctions in Mage are very simple and intuitive so thatstudents can almost immediately begin interacting with themolecules rather than investing time in learning the pro-gram. Because of these advantages we have almost ex-clusively used kinemages in our own teaching. However,most of the lessons we describe here could also be set upusing other software, although with varying degrees ofease for teacher and for student.
The most central function of molecular graphics in bio-chemistry teaching is to have the students explore in 3-Dthe overall molecular organization of proteins and nucleicacids, the structural details that underlie that organization,and the critical relationships at binding and active sites.For that purpose, we first demonstrate the use of Mage in
2 10–15% of people do not actually have effective vision inboth eyes, so they cannot see stereo with any type of hardware ortraining.
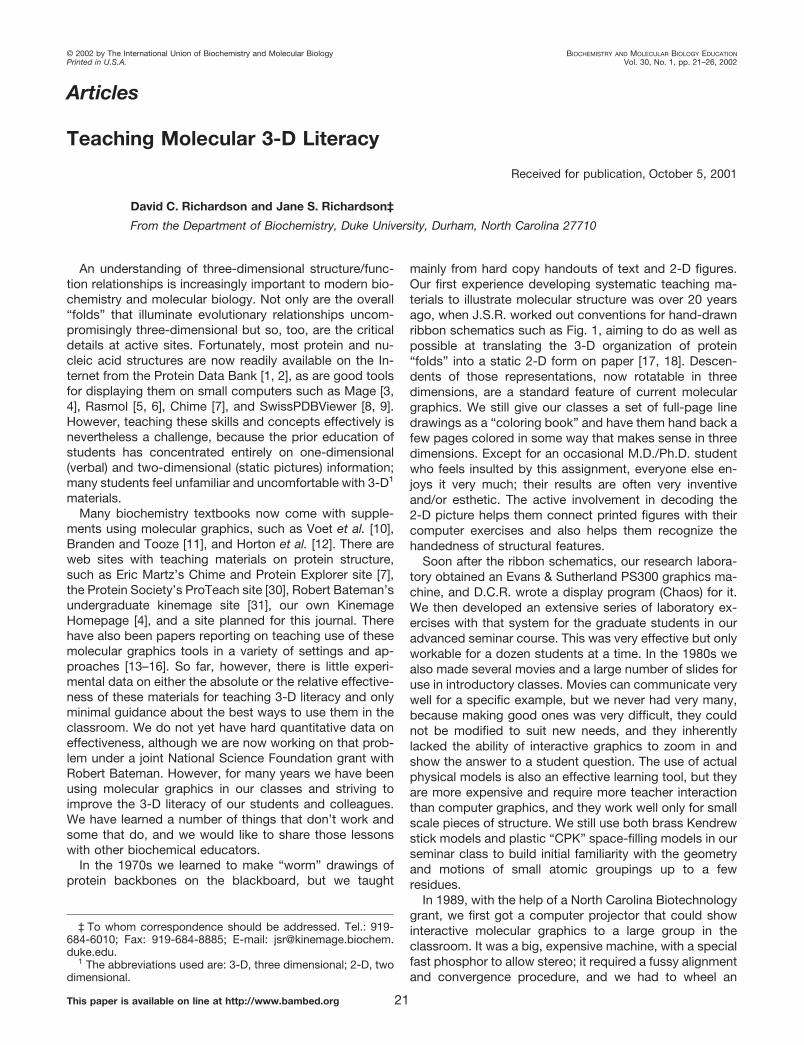
FIG. 1. Hand-drawn ribbon schematic of a dimer of prealbu-min, or transthyretin. �-Strands are represented as arrows,�-helices as spiral ribbons, and loops as round ropes withsmoothed contours. From PDB file 2PAB [22]; line drawing fromFig. 62 of Richardson [17].
FIG. 2. Multi-strand ribbon representation from the oldergraphics program Chaos, showing Staphylococcal nucleasewith the thymidine diphosphate inhibitor in red and the Ca2�
as a yellow sphere. From PDB file 1SNS [23].
22 BAMBED, Vol. 30, No. 1, pp. 21–26, 2002
class (as part of an introductory and motivational presen-tation of some especially elegant, intriguing, and/or timelystructures) and then assign a set of kinemage exercises tobe done as homework. In these exercises, each programfunction is thoroughly explained in the kinemage text win-dow the first time it is needed, from the simplest opera-tions such as rotating by dragging or identifying a point byclicking on it, to more advanced features such as how tomeasure dihedral angles or how to construct a hypothet-ical C� onto a glycine. In addition, the students are ad-vised to consult the explanatory Demo5_4a.kin file if theyare having any trouble with the mechanics. We have used
this format most extensively in first-year graduate Bio-chemistry and interdepartmental courses at Duke Univer-sity but also in a shorter version for undergraduatecourses, workshops at meetings, and guest lectures atother institutions. We use a longer and somewhat differentformat for an advanced seminar-laboratory course; in ad-dition to graduate students in biochemistry and relatedfields, this course often attracts undergraduates, post-docs, or faculty, as well as graduate students from com-puter science, chemistry, and now bioinformatics.
Our initial teaching kinemages for proteins show thepolypeptide backbone and sidechains (with rotatable an-
FIG. 3. Screen-image snapshots from kinemages displayed in Mage. A, helix 7 region of the ribosomal 23 S RNA from PDB file1FFK [24], with backbone ribbon colored in the double-helical sections, bases colored by type, and pale green lenses of contact dotsshowing the base pair hydrogen bonds (output from Mage as PostScript). B, ribbon schematic of transforming growth factor �, withdisulfide bonds in yellow (from PDB file 2TGI [25]; output rendered in Raster3D). C, interactions between the central zinc finger ofZif268 (PDB file 1AAY [26]) and DNA, with H-bonds shown as pale green lenses of contact dots and van der Waals contacts in greenand blue; at the top is a typical Arg-G double H-bond, and at the center the His ring H-bonds to a G base and stacks with an T base.Hydrogens were added by Reduce [27], and all-atom contacts were by Probe [28]. D, selected details at the active site of subtilisinfile 1CSE [29], with H-bonds and non-carbon atom balls for the catalytic triad, the oxyanion hole, and some substrate bindinginteractions. Parts C and D are from the Kinemage Supplement to Branden and Tooze [11], output as screen-image bitmaps. Ofcourse, these snapshots convey much less information than the moving image, which is the whole point of using interactive graphics.
23
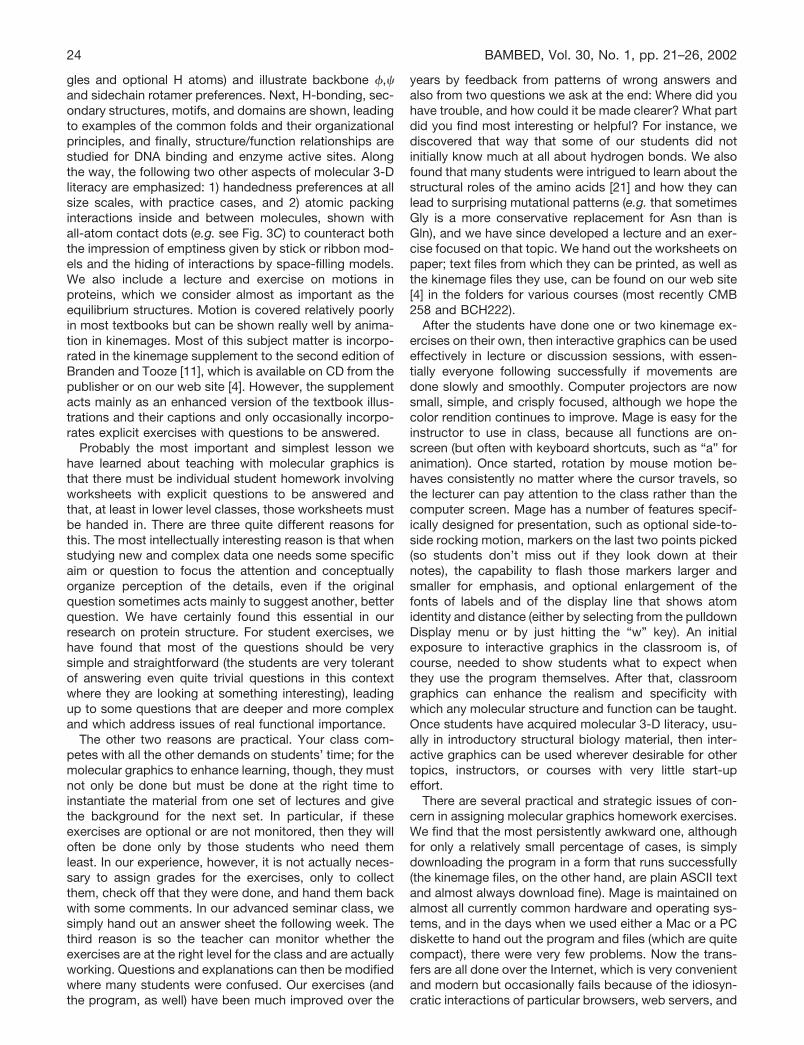
gles and optional H atoms) and illustrate backbone �,�and sidechain rotamer preferences. Next, H-bonding, sec-ondary structures, motifs, and domains are shown, leadingto examples of the common folds and their organizationalprinciples, and finally, structure/function relationships arestudied for DNA binding and enzyme active sites. Alongthe way, the following two other aspects of molecular 3-Dliteracy are emphasized: 1) handedness preferences at allsize scales, with practice cases, and 2) atomic packinginteractions inside and between molecules, shown withall-atom contact dots (e.g. see Fig. 3C) to counteract boththe impression of emptiness given by stick or ribbon mod-els and the hiding of interactions by space-filling models.We also include a lecture and exercise on motions inproteins, which we consider almost as important as theequilibrium structures. Motion is covered relatively poorlyin most textbooks but can be shown really well by anima-tion in kinemages. Most of this subject matter is incorpo-rated in the kinemage supplement to the second edition ofBranden and Tooze [11], which is available on CD from thepublisher or on our web site [4]. However, the supplementacts mainly as an enhanced version of the textbook illus-trations and their captions and only occasionally incorpo-rates explicit exercises with questions to be answered.
Probably the most important and simplest lesson wehave learned about teaching with molecular graphics isthat there must be individual student homework involvingworksheets with explicit questions to be answered andthat, at least in lower level classes, those worksheets mustbe handed in. There are three quite different reasons forthis. The most intellectually interesting reason is that whenstudying new and complex data one needs some specificaim or question to focus the attention and conceptuallyorganize perception of the details, even if the originalquestion sometimes acts mainly to suggest another, betterquestion. We have certainly found this essential in ourresearch on protein structure. For student exercises, wehave found that most of the questions should be verysimple and straightforward (the students are very tolerantof answering even quite trivial questions in this contextwhere they are looking at something interesting), leadingup to some questions that are deeper and more complexand which address issues of real functional importance.
The other two reasons are practical. Your class com-petes with all the other demands on students’ time; for themolecular graphics to enhance learning, though, they mustnot only be done but must be done at the right time toinstantiate the material from one set of lectures and givethe background for the next set. In particular, if theseexercises are optional or are not monitored, then they willoften be done only by those students who need themleast. In our experience, however, it is not actually neces-sary to assign grades for the exercises, only to collectthem, check off that they were done, and hand them backwith some comments. In our advanced seminar class, wesimply hand out an answer sheet the following week. Thethird reason is so the teacher can monitor whether theexercises are at the right level for the class and are actuallyworking. Questions and explanations can then be modifiedwhere many students were confused. Our exercises (andthe program, as well) have been much improved over the
years by feedback from patterns of wrong answers andalso from two questions we ask at the end: Where did youhave trouble, and how could it be made clearer? What partdid you find most interesting or helpful? For instance, wediscovered that way that some of our students did notinitially know much at all about hydrogen bonds. We alsofound that many students were intrigued to learn about thestructural roles of the amino acids [21] and how they canlead to surprising mutational patterns (e.g. that sometimesGly is a more conservative replacement for Asn than isGln), and we have since developed a lecture and an exer-cise focused on that topic. We hand out the worksheets onpaper; text files from which they can be printed, as well asthe kinemage files they use, can be found on our web site[4] in the folders for various courses (most recently CMB258 and BCH222).
After the students have done one or two kinemage ex-ercises on their own, then interactive graphics can be usedeffectively in lecture or discussion sessions, with essen-tially everyone following successfully if movements aredone slowly and smoothly. Computer projectors are nowsmall, simple, and crisply focused, although we hope thecolor rendition continues to improve. Mage is easy for theinstructor to use in class, because all functions are on-screen (but often with keyboard shortcuts, such as “a” foranimation). Once started, rotation by mouse motion be-haves consistently no matter where the cursor travels, sothe lecturer can pay attention to the class rather than thecomputer screen. Mage has a number of features specif-ically designed for presentation, such as optional side-to-side rocking motion, markers on the last two points picked(so students don’t miss out if they look down at theirnotes), the capability to flash those markers larger andsmaller for emphasis, and optional enlargement of thefonts of labels and of the display line that shows atomidentity and distance (either by selecting from the pulldownDisplay menu or by just hitting the “w” key). An initialexposure to interactive graphics in the classroom is, ofcourse, needed to show students what to expect whenthey use the program themselves. After that, classroomgraphics can enhance the realism and specificity withwhich any molecular structure and function can be taught.Once students have acquired molecular 3-D literacy, usu-ally in introductory structural biology material, then inter-active graphics can be used wherever desirable for othertopics, instructors, or courses with very little start-upeffort.
There are several practical and strategic issues of con-cern in assigning molecular graphics homework exercises.We find that the most persistently awkward one, althoughfor only a relatively small percentage of cases, is simplydownloading the program in a form that runs successfully(the kinemage files, on the other hand, are plain ASCII textand almost always download fine). Mage is maintained onalmost all currently common hardware and operating sys-tems, and in the days when we used either a Mac or a PCdiskette to hand out the program and files (which are quitecompact), there were very few problems. Now the trans-fers are all done over the Internet, which is very convenientand modern but occasionally fails because of the idiosyn-cratic interactions of particular browsers, web servers, and
24 BAMBED, Vol. 30, No. 1, pp. 21–26, 2002
operating system setups. Therefore, as the assignment forthe first day, we ask the students to download Mage andthe demo file, check that they can open the kinemage, andreport back. For the few with a problem, there is then timefor troubleshooting or alternative provisions. These diffi-culties are gradually lessening as browsers and serversimprove and as we learn more tricks for improving ourwebsite, but the process is certainly not as foolproof asone would like it to be. Fortunately, once Mage is up andrunning, the students have very few difficulties and usuallyrequire no other extra help from us.
One way of avoiding the download problem is to havethe students work together in a computer laboratory orcluster with the software and files already installed. Thatsystem has other advantages, as well; it ensures timelywork on the exercises and makes it easy for the instructorto be there to answer questions. We have usually usedsuch a setup when visiting other institutions. However,there are also disadvantages, which we feel on the wholeoutweigh the assets. No matter what the level of care, wehave essentially never had all the machines set up equiv-alently, so that troubleshooting is still needed. Notably, itseems to cause problems if the program is run from acentral server rather than installed on each machine. Aftersuch a lab session, the student has not been effectivelyempowered to use the graphics easily on their own com-puters for other purposes. Most importantly, when theclass works as a group, their very different levels of priorfamiliarity and aptitude are glaringly obvious, so that bothtiming and psychology make it difficult for those studentswho can benefit the most to spend the time they need andto feel good about what they have learned. These can besome of the best students in other ways, with a verythorough understanding of the verbal and even mathemat-ical aspects of biochemistry; if they successfully workthrough the three-dimensional material at their own pace,they often integrate it into a very powerful overall knowl-edge. We feel these are the people for whom 3-D literacymakes the most difference, and therefore we try to tailorour teaching methods for them as well as we are able.
For further empowerment, we want students to learnhow they can use molecular graphics for their own inter-ests in the future. Therefore, we now always include somelevel of exercise in which they locate relevant coordinatefiles and make their own kinemages (always done afterthey have become familiar with pre-made kinemages). Inan introductory course where structure is a minor part, thismay be a brief exercise where they go to the Protein DataBank web site [2], use the search tools to find, for instance,a file for �-hemolysin that includes all seven subunits,download it, use Prekin to make one kinemage of thebackbone or a ribbon of the whole molecule and anotherkinemage using the “lots” script on a single subunit, andthen answer a few questions about the structure. If otherbioinformatics skills, such as sequence matching, are alsobeing taught, then integrating those with molecular graph-ics enhances both. At the other extreme, in our advancedseminar course, the students spend half of the semesterworking on an individual project studied and reported inkinemage form, with a progress report shown in classevery other week and a final presentation at the end. A
report done in kinemage format (which can be muchshorter and simpler than the one described above for theadvanced seminar and can be handed in electronicallyrather than presented in class) makes a very effective wayto focus the individual learning of a student about a spe-cific biological structure issue of interest to them, and it isa much more revealing medium than either a written reportor a standard oral presentation for allowing the teacher toevaluate the depth of their understanding and their level oforiginal insight. Our most important overall criterion forjudging the reports is whether the student has explicitlyshown in the kinemage enough of the right details toindependently judge the correctness of what is said in thepapers, with appropriate explanations in the kinemage textwindow and/or in their presentation. If they find somethingto criticize or something new to show, then all the better.
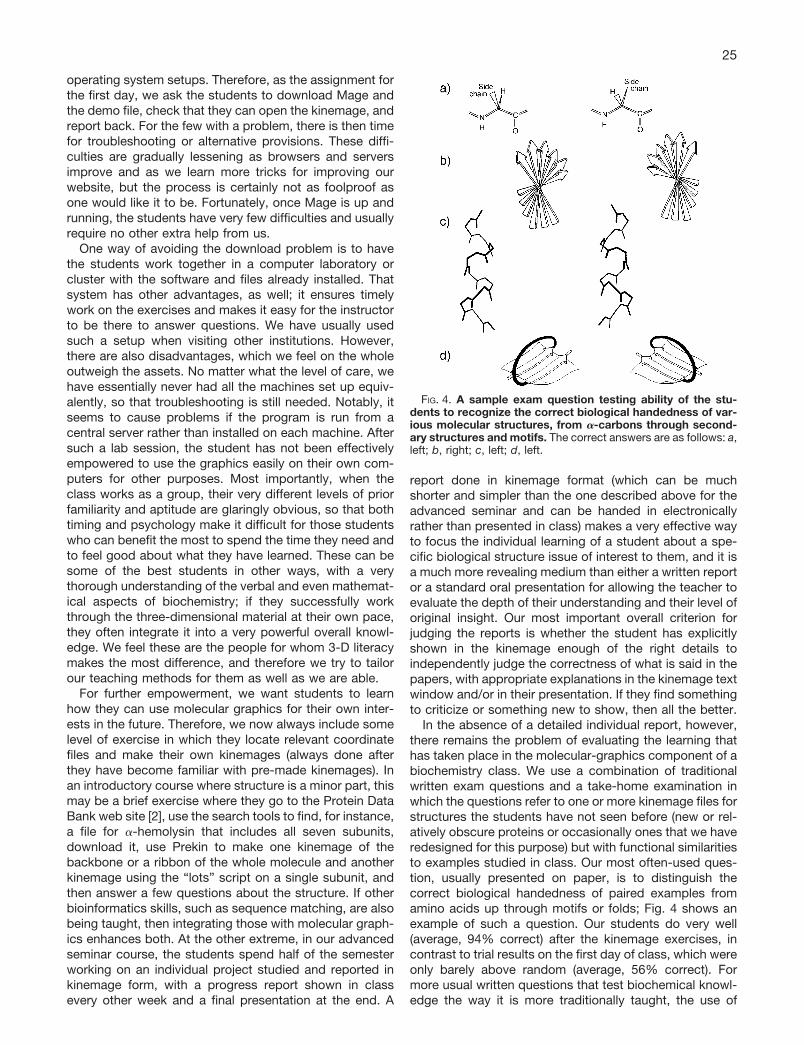
In the absence of a detailed individual report, however,there remains the problem of evaluating the learning thathas taken place in the molecular-graphics component of abiochemistry class. We use a combination of traditionalwritten exam questions and a take-home examination inwhich the questions refer to one or more kinemage files forstructures the students have not seen before (new or rel-atively obscure proteins or occasionally ones that we haveredesigned for this purpose) but with functional similaritiesto examples studied in class. Our most often-used ques-tion, usually presented on paper, is to distinguish thecorrect biological handedness of paired examples fromamino acids up through motifs or folds; Fig. 4 shows anexample of such a question. Our students do very well(average, 94% correct) after the kinemage exercises, incontrast to trial results on the first day of class, which wereonly barely above random (average, 56% correct). Formore usual written questions that test biochemical knowl-edge the way it is more traditionally taught, the use of
FIG. 4. A sample exam question testing ability of the stu-dents to recognize the correct biological handedness of var-ious molecular structures, from �-carbons through second-ary structures and motifs. The correct answers are as follows: a,left; b, right; c, left; d, left.
25
molecular graphics in the course can make some contri-bution but not a major one. On the other hand, examsdone in the graphics medium can never fairly comparelearning with versus without the use of molecular graphics,because the control group is unfamiliar with the medium.However, it is the individual student’s acquisition of aworking 3-D literacy for macromolecules that is our mainconcern, and those skills and concepts can themselves betested readily in the graphics medium. Any teacher wishingexamples of our exam materials in the kinemage formatshould send E-mail to [email protected].
A questionnaire asking students whether they thoughtthe graphics component was worthwhile and interestingalways gets a positive response, because the moleculesare elegant and the exercises are fun to do. Of moresignificance is the fact that many students, especiallythose previously unfamiliar with molecular graphics, tell usthat these exercises help them greatly in understandingpapers or seminars with a structural-biology component.
In summary, we do believe that the use of interactivemolecular graphics makes a unique and important contri-bution to student learning of biochemistry and molecularbiology at any level. For best effectiveness, however, thegraphics should primarily be worked through by individualstudents at their own pace, answering questions whosetimely completion is monitored although not necessarilygraded. Molecular graphics use in biochemistry teachinghas two complementary goals: to enhance learning of thesubject matter and to develop analytical skills of a newsort. The relative emphasis between those two goals shiftsdepending on the level and timing of a course, but bothshould always be present. With the variety and quality ofgraphics-based teaching materials, software, and web-sites available now, it is not hard to put together presen-tations and exercises suitably tailored to the needs andsubject matter of a particular class.
REFERENCES
[1] H. M. Berman, J. Westbrook, Z. Feng, G. Gilliland, T. N. Bhat, H.Weissig, I. N. Shindyalov, P. E. Bourne (2000) The Protein Data Bank,Nucleic Acids Res. 28, 235–242.
[2] Research Collaboratory for Structural Bioinformatics Protein DataBank: www.rcsb.org/pdb.
[3] D. C. Richardson, J. S. Richardson (1992) The kinemage: a tool forscientific communication, Protein Sci. 1, 3–9.
[4] Richardson Laboratory: kinemage.biochem.duke.edu.[5] R. Sayle (1992) Proceedings of the 10th Eurographics UK 1992 Con-
ference, Abingdon Press, York.[6] H. J. Bernstein: www.bernstein-plus-sons.com/software/rasmol.[7] E. Martz: www.umass.edu/microbio/chime.[8] N. Guex, M. C. Peitsch (1997) SWISS-MODEL and the Swiss-Pdb
Viewer: an environment for comparative protein modeling, Electro-
phoresis 18, 2714–2723.[9] N. Guex, A. Diemand, M. C. Peitsch, T. Schwede: www.expasy.
ch/spdbv.[10] D. Voet, J. G. Voet, C. W. Pratt. (1999) Fundamentals of Biochemistry,
John Wiley & Sons, Inc., New York.[11] C. I. Branden, J. Tooze. (1999) Introduction to Protein Structure, 2nd
ed., Garland Publishing, Inc., New York.[12] H. R. Horton, L. A. Moran, R. S. Ochs, J. D. Rawn, K. G. Scrimgeour.
(1996) Principles of Biochemistry, Prentice Hall, Inc./Simon & Schus-ter, Upper Saddle River, New Jersey.
[13] S. L. Weldon, M. A. Jones (1995) Kinemages as a visualization tool forbiochemistry classes, Biochem. Educ. 23, 208–212.
[14] C. E. Sansom, D. A. Waller, A. J. Geddes (1996) Use of graphicsworkstations to illustrate protein and nucleic acid structure: a de-scription of three modelling experiments carried out by second-yearundergraduates, Biochem. Educ. 24, 32–35.
[15] S. W. Weiner, P. F. Cerpovicz, D. W. Dixon, D. B. Harden, D. S.Hobbs, D. L. Gosnell (2000) RasMol and Mage in the undergraduatebiochemistry curriculum, J. Chem. Educ. 77, 401–406.
[16] C. S. Tsai J. (2000) Microcomputer applications in biochemistry,Chem. Educ. 77, 219–221.
[17] J. S. Richardson (1981) Anatomy and taxonomy of protein structures,Adv. Prot. Chem. 34, 167–339.
[18] J. S. Richardson (2000) Early ribbon drawings of proteins, Nat. Struct.Biol. 7, 624–625.
[19] D. C. Richardson, J. S. Richardson (1994) Kinemages-simple macro-molecular graphics for interactive teaching and publication, TrendsBiochem. Sci. 19, 135–138.
[20] J. S. Richardson, D. C. Richardson, in M. G. Rossmann, E. Arnold,Eds. (2001) International Tables for Crystallography, Vol. F, KluwerAcademic Publishers, Dordrecht, The Netherlands, pp. 727–730.
[21] D. C. Richardson, J. S. Richardson (1989) in G. D. Fasman, Ed.,Prediction of Protein Structure and the Principles of Protein Confor-mation, Plenum Press, New York, pp. 1–98.
[22] C. C. Blake, M. J. Geisow, S. J. Oatley, B. Rerat, C. Rerat (1978)Structure of prealbumin: secondary, tertiary and quaternary interac-tion determined by fourier refinement at 1.8 A, J. Mol. Biol. 121,339–356.
[23] A. A. Arnone, C. J. Bier, F. A. Cotton, V. W. Day, E. E. Hazen, Jr., D. C.Richardson, J. S. Richardson, A. Yonath (1971) A high resolutionstructure of an inhibitor complex of the extracellular nuclease ofStaphylococcus aureus, J. Biol. Chem. 246, 2302–2316.
[24] N. Ban, P. Nissen, J. Hansen, P. B. Moore, T. A. Steitz (2000) Thecomplete atomic structure of the large ribosomal subunit at 2.4 Aresolution, Science 289, 905–920.
[25] S. Daopin, K. A. Piez, Y. Ogawa, D. R. Davies (1992) Crystal structureof transforming growth factor-�2: an unusual fold for the superfamily,Science 257, 369–373.
[26] M. Elrod-Erickson, M. A. Rould, L. Nekludova, C. O. Pabo (1996)Zif268 protein-DNA complex refined at 1.6 A: a model system forunderstanding zinc finger-DNA interactions, Structure 4, 1171–1180.
[27] J. M. Word, S. C. Lovell, J. S. Richardson, D. C. Richardson (1999)Asparagine and glutamine: using hydrogen atom contacts in thechoice of side-chain amide orientation, J. Mol. Biol. 285, 1735–1747.
[28] J. M. Word, S. C. Lovell, T. H. LaBean, H. C. Taylor, M. E. Zalis, B. K.Presley, J. S. Richardson, D. C. Richardson (1999) Visualizing andquantifying molecular goodness-of-fit: small-probe contacts dotswith explicit hydrogen atoms, J. Mol. Biol. 285, 1711–1733.
[29] W. Bode, E. Papamokos, D. Musil (1987) The high-resolution X-raycrystal structure of the complex formed between subtilisin Carlsbergand eglin c, and elastase inhibitor from the leech Hirudo medicinalis.Structure analysis, subtilisin structure and interface geometry, Eur.J. Biochem. 166, 673–692.
[30] Protein Society: www.faseb.org/protein/ProTeach.[31] R. Bateman: orca.st.usm.edu/�rbateman/kinemage.
26 BAMBED, Vol. 30, No. 1, pp. 21–26, 2002